


Languages
Pages
Legal


1 4/18/09
Forthcoming in Economic Development and Cultural Change
When Does Community Conservatism Constrain Village Organizations?
by
Tanguy Bernard*, Alain de Janvry**, and Elisabeth Sadoulet**
January 2009
Abstract
Formal village organizations (VO) can be classified into market-oriented (MO) and community-oriented (CO) organizations, with the former aimed at raising members’ incomes and the latter at the provision of local public goods. This paper investigates the role of community conservatism in opposing economic differentiation and, thereby, constraining the emergence, configuration, and activities of MOs in West Africa. To do this, we develop a model where we show that, if these conservative forces are important, MOs need to be larger than would otherwise be optimal in order to gain acceptability and emerge. This, in turn, has an impact on their governance structure, as the needed extra members demand a more participatory decision-making process in order to secure the delivery of club goods, constraining the exercise of leadership. With very high resistance to economic differentiation, no MO can emerge. Using a dataset of 646 VOs in Burkina Faso, we identify a sharp contrast in initial size and governance structure between the first MO to emerge in a village and subsequent MOs. This is consistent with the results of the model assuming that first MOs encounter strong opposition to their emergence, while the social environment is more tolerant for subsequent MOs..
* International Food Policy Research Institute; [email protected].
** University of California at Berkeley; [email protected]; [email protected].
The authors are grateful to Marie-Hélène Collion, Pierre Rondot, and Adama Touré from the World Bank and to Jean-Louis Arcand and Maguelonne Chanron from CERDI for their collaboration on this project, as well as to Gershon Feder and the Norwegian Trust Fund at the World Bank for financial support. We also thank Jean-Philippe Platteau, Marcel Fafchamps, John Gibson, Nancy Mc Carthy, Jordan Chamberlain, and Maribel Elias for valuable comments.

2 4/18/09
I. Introduction
In West African countries, village-level organizations1 (VOs) have the potential of being
an important instrument to deliver local public goods and to support market-oriented income-
generating activities. Yet, despite the rapid development of these organizations over the past two
decades and the growing interest of development agencies in working with them (see Uphoff
(1993); Collion and Rondot (1998)), their contributions to village-level poverty reduction seems
to have been modest. This is evident in Burkina Faso, where 91% of the rural households have
access to at least one village-level organization and 57% are actual members of such VOs, but
only 32% have received individual benefits from one organization and, when they do, these
benefits are usually quite small (Bernard et al. (2007)).
Several factors may explain the apparently limited role of VOs in improving rural
incomes. The generally low level of financial resources available to these organizations, as well
as the lack of complementary public goods and institutions, are certainly major constraints to
their success.2 However, the role of social pressures in the rural communities where VOs operate
also needs to be considered. In many African rural communities, economic differentiation is
perceived as a threat to the traditional social structure and to the solidarity system. Consequently,
these communities tend to enforce strict redistributive practices, whereby enriched individuals are
socially compelled to share with the rest of the community not only their good fortunes but also
the differentiated product of their hard work (see Platteau (2000); Platteau and Abraham (2002);
and Fiske (1991) and Englebert (1996) for Burkina Faso in particular). In this paper, we show that
community conservatism may have two consequences on VOs: (i) it may prevent organizations
with direct income-generating potential from emerging because of the expected economic
differentiation of their members from the rest of the community, and (ii) even when they manage
to emerge, these organizations may still be constrained in selecting members, choosing a
governance structure, and having to engage in the provision of club goods for their members in
order to secure social acceptability.
The governance structure of VOs can range from situations where all decisions are taken
by the leaders, to situations where they are made via an extensively participatory process. In what
1We define village organizations (VOs) as village-level groups of individuals that are formally organized with legal status. This distinguishes them from the multiplicity of traditional village institutions that do not have legal status. 2In Burkina Faso, the PNGT (Programme National de Gestion des Terroirs) aims at relaxing these types of constraints by providing funding for public goods in rural areas using a Community Driven Development approach in which VOs are important partners.

3 4/18/09
follows, we refer to the former as leadership-based governance and to the latter as participation-
based governance. The literature on VOs recognizes the role of governance structure in affecting
the performance of the organizations. Some authors contend that leadership leads to better
economic outcomes (e.g. Tendler (1983), Bianchi (2002)). The argument is that leaders provide
technical expertise, drive, and continuity, while too much direct participation by inexperienced
members may impair the organization’s capacity to pursue high-income strategies. Other authors,
by contrast, argue that participative governance is a means of enhancing the sustainability and
effectiveness of the organization as it helps better adjust decisions to local conditions and customs
(Atwood and Baviskar (1987)). In the case of public goods, it leads to the provision of goods that
are more desirable to a larger share of members (Foster and Rosenzweig (2001)). In addition,
many development agencies consider participative governance as valuable in itself to empower
members.3
One way of reconciling these divergent views on the best governance structure is to
recognize the existence of two kinds of village organizations: (i) community-oriented
organizations (COs) which are aimed at the provision of public goods, and (ii) market-oriented
organizations (MOs) which are aimed at income generation for their members (see Uphoff
(1993), Diagne and Pesche (1995), and Collion and Rondot (1998) for similar distinctions). In
accordance with this dichotomy, one would expect to find more leadership-based governance in
MOs and more participation-based governance in COs.
We argue, however, that leadership-based governance may be strongly constrained in
MOs that face community resistance to economic differentiation. To show this, we build a simple
model where we assume that emerging MOs, because they are expected to induce economic
differentiation between their members and the rest of the community, are perceived as threats to
reproduction of the traditional social structure and the solidarity system. As a result, the size of
the emerging MO is partly determined by the necessity of counteracting resistance to its existence
from the rest of the community: by incorporating a sufficient critical mass of villagers, even if not
entrepreneurial, who will share in the benefits created by the organization. This, in turn,
influences the MOs’ governance structure, as the included non-entrepreneurial members require a
more participative type of governance.4 The model predicts that, in an environment with high
resistance to economic differentiation, one should initially find relatively larger MOs, governed in
3 See Mansuri and Rao (2004) for a comprehensive survey of Community Driven Development approaches in which empowerment through member participation is seen as central. 4See Acemoglu and Robinson (2001) for an in depth explanation of this argument applied to country-level democratization processes.

4 4/18/09
a more participative mode, and delivering club goods in addition to supporting entrepreneurial
initiatives. If community conservatism is too strong, no MO will be able to emerge in the village.
Where community conservatism is weak, economic differentiation is less of a problem, and
emerging MOs can be smaller and the leadership mode of governance can dominate.
Our empirical specification follows directly from the model. Using a survey of 646 VOs
in Burkina Faso that we collected in 2002-2003, we find predicted relationships between strength
of social homogeneity (which we take as a proxy for social pressure), membership size, form of
governance, and type of activities in the emerging MOs consistent with regime I for the first MOs
and consistent with regime D for the subsequent MOs. The results are robust to several
econometric specifications. This is consistent with the idea that community conservatism is
particularly strong against differentiation when the issue comes about for the first time in a
community, but more tolerant when other members want to create subsequent MOs.
II. The defense of the solidarity system in African villages
In this section, we give evidence on the prevalence of a solidarity system in African rural
communities and on community conservatism in resisting economic differentiation that could
undermine solidarity. Mutual insurance mechanisms in traditional societies have long been
studied by economists (Scott (1976)). The main finding is that, in environments characterized by
high risk and insurance market failures, community institutions often provide members with ways
of allocating risk efficiently. These mechanisms can take various forms such as gift exchange,
reciprocal credit, land loans, and labor assistance (Fafchamps (1992)). Empirical studies have
shown that risk-sharing does exist, even though it falls far short from achieving Pareto efficiency
(see in particular Townsend (1994), Udry (1994) and Ravallion and Chaudhuri (1997)).
Studies of African village communities, however, show that sharing tends to go beyond
the exercise of mutual insurance and that anti-differentiation redistributive practices can happen
at the cost of an ex-post aggregate welfare loss for the community (Platteau (1996)). The most
common example of such practices is found in the “extended family” solidarity network in
Africa. Hoff and Sen (2005) develop a model showing how redistribution within such networks is
often imposed on the better-off members, and may have adverse effects on the efficiency of
market interactions. In this case, a kin group takes collective action to block exit by some
members, even though the group as a whole would gain from their migration if they would
continue to contribute to the solidarity system. Because there is no guarantee that they will,
community conservatism opposes their taking advantage of such new opportunities in order to
prevent the solidarity system from being weakened by their departure. In contexts where anti-

5 4/18/09
differentiation pressures are very strong, redistribution can even aim at achieving relative equality
across members of a community. For Fiske (1991), analyzing Mossi communities in Burkina
Faso5, the goal of “even matching” supports the continuous exchange of wealth. This is also
observed by Englebert (1996) who reports that “Mossi society bans individual accumulation that
could differentiate one Mossi from another. This is also supported by the absence of much visible
stratification in Mossi villages.”
Platteau (2000) gives a comprehensive explanation of community conservatism in
opposing economic differentiation in traditional African communities. His argument relies on
three characteristics of these communities. First, traditional rural communities are characterized
by severe exposure to income risks due to a high degree of dependence on nature in their
productive activities. With low levels of accumulation of liquid assets, this implies the need for
mutual insurance to secure subsistence at all times. Second, historically traditional communities
have typically lacked scientific knowledge about the determinants of successful outcomes.
Individual success was attributed to luck rather than to hard work, and luck should naturally be
shared among community members. Moreover, the one who was repeatedly more successful
when the others were less so could be blamed of manipulating supernatural forces. Facing this
risk, only sharing could be used to appease jealous feelings. Although the relationship between
effort and output is likely better understood in these communities today, sharing practices are
reproduced over time and often assisted by beliefs in magic and potential calls on witchcraft.
Finally, even though rural African communities are usually small and characterized by highly
personalized relationships, where all members constantly observe each others’ behavior, the
enforcement of sharing remains problematic. In this context, successful accumulation by a few
generates fear among the others that, if left free to choose, those with high realized incomes will
defect on their solidarity obligations, leaving the rest of the group worse-off. Because the
economic differentiation of a few individuals may undermine the community's overall social
cohesiveness and threaten the reproduction of the solidarity network, such accumulative behavior
is repressed within the community. Economic differentiation is also resisted as it may challenge
the social hierarchy of the community.
These redistributive practices can generate strong disincentives to effort and investment,
and thereby constrain income generation by entrepreneurs and lower average income in the
community. This can result in what Bowles (2006) has called “institutional poverty traps” and
Kuran (1988) “collective conservatism”. This practice is similar to the resistance to trade
5 In Burkina Faso, the Mossi represent more than 45% of the population.

6 4/18/09
liberalization analyzed by Fernandez and Rodrik (1991) when there is uncertainty about the
identity of losers and winners and no credible commitment that compensations will be paid, in
spite of net social gains. The daily practice of community conservatism is embedded in cultural
beliefs (Greif (1994)) and in identity mechanisms (Akerlof and Kranton (2000)) that only allow
for a slow and often discontinuous evolution of norms. In this context, only a coalition of a
sufficient critical mass may have the bargaining power to undertake the change (Akerlof (1976),
Platteau (2000), Barrett (2005)).
Extensive fieldwork undertaken for this project supports the proposition that MOs
provoke resistance from villagers. We often observed negative feelings of non-members towards
MOs with exclusive benefits, whose members are considered as “non-team players” by the rest of
the community. Communities use ostracization and even threat of witchcraft against these
individuals. We observed a case where the emergence of a first organization led to such clashes
among community members that the community split into two neighborhoods. One leader that
attempted and failed to start an organization complained that he could not assemble enough
participants as village elders put pressure on potential younger members not to participate. We
also encountered a number of MO-type organizations with a two-tier type of membership, where
only a subset of members were effectively active in the organization, whereas the remaining
members, although participating in meetings, did not invest in the organization. Based on the
literature and on our own village case studies done for this project, we are quite confident that
community resistance to economic differentiation is an important factor in constraining individual
and group entrepreneurship in many African villages.
III. Data and Measures
3.1. The data
The information used in this paper comes from a survey of 260 villages conducted in
Burkina Faso in 2002-2003. It includes basic characteristics of the villages and a census of all
organizations that have existed at some point during the previous 20-year period. Information on
each village organization, whether active or inactive, was collected from a group interview with
the organization bureau and rank and file members. It includes the history, activities, governance
structure, and external links of each organization. The sample design included six geographical
strata to be representative of the agro-ecological conditions of Burkina Faso. In each stratum, four

7 4/18/09
departments6 were randomly selected, within which villages were also randomly chosen. All
descriptive statistics and estimations presented in this paper take into account sampling weights.
All standard errors are corrected for cluster (department) and strata effects.
We obtained rainfall data from the Directorate of Meteorology in Burkina Faso, covering
160 stations over the years 1961-1995.7 Although certain stations were missing a number of data
points, we were able to retrieve monthly rainfall values for over 20 consecutive years of
observations for 96 stations. These time series of rainfall observations were used to construct an
indicator of rainfall predictability, as described in paragraph 3.4. The stations were then
geographically matched to our sample villages. Note, however, that geographic coordinates are
missing for 34 (13%) of the villages in our sample, with the result that the sample is reduced for
all estimations that include rainfall data.
3.2. Community-oriented and market-oriented organizations: a typology
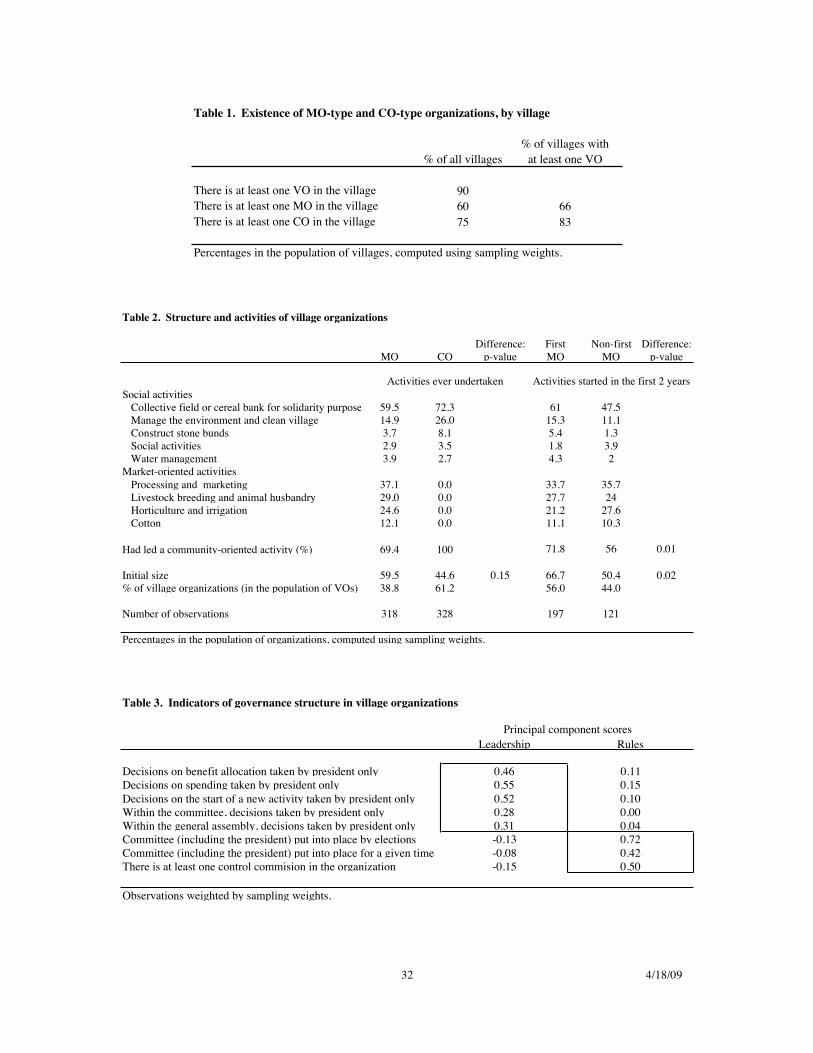
The survey encountered 646 VOs in the regions surveyed. As shown in Table 1, presence
of village organizations is widespread as an estimated 90% of Burkina Faso villages have at least
one VO. From the history of their activities, organizations were classified as COs if they had
never engaged in market-oriented activities and as MOs if they had. COs are more evenly
distributed across villages as there is one in 75% of the villages while there is an MO in only 60%
of the villages. In the total population of VOs, an estimated 61% are COs and 39% MOs (Table
2).
The social activities undertaken by COs include cultivation of a collective field or
management of a cereal bank for solidarity purposes, management of the environment and
cleaning of the village, construction of stone bunds for rainwater infiltration, sports and social
activities, and potable water management. The main activities undertaken by MOs include
support to processing and marketing, to livestock breeding and animal husbandry, to horticulture
and irrigated agriculture, and to cotton production. Notable is that 69% of the MOs have also
undertaken social activities of public good or club good type.
3.3. Indicators of governance structure
We use a principal component approach to construct synthetic measures of governance
6In Burkina Faso, the department is the smallest administrative unit above the village. On average in the surveyed zones, each department is composed of about 30 villages. 7 These data were organized into a large geo-referenced database compiling seven different sources of information. We are grateful to Stephan Dercon and David Bigman for the use of these data.

8 4/18/09
structure across organizations. We use eight organizational features that correspond to the
organizations’ by-laws and are thus taken to remain unchanged over time. Table 3 reports the
loadings on the first two principal component vectors. The first five variables, which are closely
related to the role of leadership in the decision-making process, have high loadings on the first
principal component. The second component is mainly representing the last three variables, and is
more closely related to the formal governance rules within the organization. Overall, these two
vectors have clear interpretations. The first component measures the role of leadership in the
decision-making process, while the second mostly refers to the existence of formal rules in the
organization.
3.4. Indicators of community pressure
We use two separate classes of indicators to characterize community resistance to social
differentiation: social homogeneity and exposure to environmental risk.
Both the literature review and field work done for village case studies suggest that
community conservatism is associated with social homogeneity, while community liberalism is
associated with what the Burkinabe call “social mixing” when a village is composed of several
competing social groups. Following the work of McCarthy, Dutilly-Diané, and Drabo (2002) and
of Englebert (1996) for Burkina Faso, we measure social homogeneity using a spatial
concentration indicator in the [0,1] interval, defined as:
1!number of neighborhoods in the village
population of the village .
The use of neighborhoods is justified by the fact that large villages with multiple ethnic
or clan/kinship groups tend to split in neighborhoods along these lines.8 The direct use of an
ethnic fragmentation index, on the other hand, would be difficult, because there is a very large
number of ethno-linguistic groups in Burkina Faso, but many are sub-groups, often inclusive of
others, and the social distance among different ethnic groups varies considerably.9 By using the
spatial concentration indicators, we let the villagers themselves tell us about social divisions.
8 Neighborhoods are defined as either “quartier” or “hameau”. They regroup a number of households that are not necessarily linked by family bondage (although they may share a common great-great grandfather) but often belong to the same caste or clan. 9 Ethnic fragmentation captures the probability that two randomly drawn individual within a given population belong to the same ethnic group. These measures usually rely on a Herfindhal type indicator. It is estimated that up to 60 different languages exist in Burkina Faso. But, certain ethnic groups may consider particular groups as “cousins” in contrast to others seen as “non-related.”

9 4/18/09
We use rainfall indicators to capture the community’s exposure to environmental risk and
hence its need for sharing norms.10 Such indicators are extensively used in the development
literature, essentially as a source of exogenous variation to identify parameters in household
models (e.g., Duflo and Udry (2001) in Cote d’Ivoire and Fafchamps (1993) in Burkina Faso) as
well as in cross-country estimations (Miguel et al. (2004)). In most of these studies, rainfall data
are used to identify short-term exogenous income shocks in poor environments dominated by
rain-fed agriculture. Here we take a different approach in that we seek to capture not so much the
variation in rainfall patterns, but the extent to which farmers can effectively predict the coming
rainfall patterns.
Farmers in Burkina Faso use a wide variety of instruments to forecast the upcoming rainy
season, ranging from observing the timing of natural phenomena (blooming of certain trees, wind
force and direction, temperature, etc.), to the appearance of certain star constellations, and to
mystic knowledge (see Roncoli and Kirshen (2001) for an in-depth description). Among the
various aspects of the rainfall pattern, forecasting the effective start of the season is among the
most important as farmers may waste seeds if planting time is not appropriate.
For each rainfall station and for each year,11 the variable start designates the first month
when rainfall was greater than 50mm per square meter, while the variable end identifies the last
month of the rainy season. For each station, we then calculate the R2 corresponding to the
following regression, where t indicates the year and ! is an error term:
startt= !
istart
t"i
i=1
3
# + $iend
t"i
i=1
3
# + %t + &t.
The obtained R2 is therefore a measure of the predictability of the start of the rainy season
based on previous years patterns. We then generate a village-level value as a weighted average of
the station values, with weights inversely proportional to the distance between the village and the
stations.12
IV. Four regularities in search of an interpretation
Descriptive statistics display four regularities that will help us construct an interpretation
of the emergence, configuration, and activities of MOs.
10A similar argument is found in Thompson and Wilson (1994) who show that common property regimes are often associated with rainfall variability at the local level. 11 Only stations with more than 20 consecutive years of complete information were considered. 12 This interpolation method, called Inverse Distance Weighting, is often used to simulate weather data for crop modeling and risk assessment (e.g., Jones and Thornton (1993)).

10 4/18/09
Initial membership size is larger in first MOs. We distinguish in Table 2 the first MO to
emerge in a village from the subsequent ones. The information covers all the organizations in
existence at some point between 1982 and 2002, including those that no longer undertake any
activity. We observe that, on average, first MOs are, at their inception, 32% larger than non-first
ones.
Leadership is associated with performance of MOs and rules with performance of COs.
Table 4 reports on the association between a performance indicator and the two indicators of
governance structure constructed above: leadership and rules. The performance indicator is a
dummy variable indicating if the organization is active (in the sense of having a project) at the
time of the survey. We perform logit regressions, controlling for age of the organization, an
important determinant of the level of activity. Reported results show that rules are positively
associated with activity in COs, but not leadership (col.1); that for MOs in general, neither rules
nor leadership are associated with performance (col. 2); but that, for the non-first MOs (col. 4),
both rules and leadership are associated with performance. The size of the marginal effects
indicates a stronger relationship between rules and performance in COs than in MOs, and a
stronger link between leadership and performance than between rules and performance for non-
first MOs.
Leadership decreases with size in first MOs. Data on the governance structure of
organizations show an important level of participation in most decisions. For example, decisions
on the allocation of benefits are taken by members (as opposed to the president) in more than
86% of the organizations; there is an elected executive committee in 58% of the organizations
and a control commission in 59%. However, the importance of leadership vs. participation in
governance varies both with the type of VO and with the size of the organization. To illustrate
this, we report in Figure 1 the non-parametric estimations of the relationship between initial size
of the organization and leadership measured by the first principal component index in Table 3.
Standard theory tells us that leadership should increase with the size of the organization to
facilitate decision-making (e.g., Staatz, 1987). This is indeed what we observe in non-first MOs.
However, we observe the remarkable regularity that this relationship is, to the contrary, negative
for first MOs. Leadership is unrelated to size in COs.
At the beginning of their existence, first MOs are more engaged in social activities than
are non-first MOs. Table 2 shows that the first MOs engage in more social activities and in less
market-oriented activities compared to non-first MOs during their first two years of existence.
This difference can be made conditional on the social context: high versus low social

11 4/18/09
homogeneity, or “social mixing”, with a split at the median. We see in Table 5 that, where there
is high social homogeneity, first MOs engage significantly more in the delivery of public goods,
using cultivation of a collective field as an indicator of public good.13 When contrasting who
captures the benefits of this activity, we see that first MOs have a greater number of collective
fields with benefits restricted to members (32%) compared to non-first MOs (12%). This public
good is hence in the nature of a club good. These club goods are not being delivered by MOs in
contexts where there is low social homogeneity. In the interpretation that follows, high social
homogeneity is used as an indicator of strong community pressures to defend sharing practices.
These regularities, together with field observations noted above, suggest the following
interpretation on the emergence of MOs in a context of social conservatism.
First, where resistance to economic differentiation is strong, first MOs are forced to
incorporate additional members (“non-differentiators”) and make them share into benefits. As a
consequence, they tend to be larger than subsequent MOs that are less subjected to these
pressures.
Second, leadership matters in that it is being associated with better performance in non-
first MOs.
Third, the pressure to incorporate additional members in order to defeat community
conservatism affects the existence and leadership structure of first MOs. MOs that emerge with
incorporation of non-differentiators have a governance structure tilted toward participation as
opposed to leadership.
Fourth, first MOs are more engaged in club goods delivery than non-first MOs in order to
satisfy the demands of their constituency of non-differentiators.
V. An endogenous governance model
In this section, we present a model of endogenous governance in market-oriented,
village-level organizations. Central to the model is the community’s resistance to economic
differentiation described above. As a result, any group of individuals intended on
“differentiating” must face the costs associated with the rest of the community’s discontent
(sharing of benefits, witchcraft, etc.). Following Platteau (2000), we assume that these costs
decrease with the number of individuals wanting to differentiate. In the absence of coordination, 13 Cultivation of a collective field is a convenient indicator of public or club good provision given the relatively large number of organizations engaged in this practice.

12 4/18/09
it is likely that no potential “differentiator” will risk the consequences of private accumulation.
As put by Platteau (2000, p.216), “to break through, he (here the differentiator) needs the
protection afforded by the deviant actions of a sufficient number of other innovators in his
locality. Rising economic opportunities will not suffice to generate dynamic entrepreneurs in the
absence of a critical mass of cultural energies harnessed towards countering social resistance to
self-seeking accumulation behavior.”14
In this context, MOs can provide the necessary coordination device. However, the
number of differentiators in an MO may not be sufficient to overcome the community's
resistance. In this case, the organization needs to include a number of “non-differentiators” to
enlarge its ranks and overcome community resistance. These extra members will use their
bargaining power to impose a more participative form of governance on the organization. In fact,
we make the important assumption that, although participation helps reveal the preferences of all
members, non-differentiators derive more benefits from a participative decision-making process
than differentiators do. This comes from the different objectives of the two groups.
Differentiators are usually entrepreneurs in a same sector of economic activity who organize to
improve their business operations (e.g., producers of a specific product like cotton who cooperate
to buy inputs or to market their products). By contrast, non-differentiators who participate in the
MO are community members who agree to support the differentiators provided some resources
from the group are also spent on a variety of club goods for the members of the organization or
even public goods for the whole village. It follows that the former are more homogenous in their
demands on the organization than the latter, who may request provision of an heterogeneous club
good that can only be properly defined and obtained through their participation in decision-
making.15
We formalize a normative model of the optimal size, composition, and governance of an
MO. This is done from the point of view of the organization itself as an entity. The model
disregards heterogeneity among differentiators that would explain which potential differentiators
would join the group and which would be excluded. It also neglects the issue of the emergence of
several organizations in the village when the number of potential differentiators exceeds the
optimal group size, and the ensuing issue of finding a stable equilibrium of sub-coalitions.
14 A similar argument can be found in Barrett (2005) 15 This does not imply that differentiators are either more or less heterogeneous than non-differentiators along other dimensions. In this model, we ignore this potential within group heterogeneity to focus on the contrast between differentiators and non-differentiators in terms of their objectives for the MO.

13 4/18/09
5.1. The set up
Let nd be the total number of potential differentiators in a community of population n
and nd nd! n
d( ) the number of differentiators that are actually members of the MO in its
optimal composition and size. These differentiators are the core of the organization and, for the
purpose of our model, decide on whether to incorporate non-differentiators or not in the
organization. Denote by np 0 ! n
p! n " n
d( ) the number of non-differentiators that are
incorporated in the MO. The size of the organization is thus n = nd + np .
We describe the aggregate welfare generated by the organization with four terms: two benefit
terms -- the economic surplus and a general utility derived from the organization’s activities --,
and two costs terms -- the internal management cost and the social resistance imposed by the
community. Differentiators and non-differentiators contribute asymmetrically to the organization
and perceive differently the benefits provided by the organization.
• Economic surplus B: Differentiators alone contribute to the generation of the aggregate
economic surplus B nd, X
B( ) which is an increasing function of nd and where XB are
positive shifters of opportunity for economic activity (e.g., good access to market).
• Management cost C: For management costs, we keep with standard assumptions in making
them increasing in the size of the group and decreasing in the strength of leadership in the
organization. Let L ![0,1] be a leadership indicator that characterizes the governance
structure of the organization. When L = 1 , all decisions are taken by the leader; when L = 0 ,
all decisions are taken by the members and governance is most participative. Management
costs are C n, L, XC( ) , where XC are positive shifters of management cost such as social
heterogeneity.16
• Welfare from group activities U: A third element is the welfare derived from the activities
undertaken by the group. As mentioned above, there are benefits from participative
governance with respect to the choice of these activities, and non-differentiators attribute
more value to participative governance than differentiators. Without going into the specificity
of the mechanisms of choice, we characterize the resulting welfare with a utility function
U L, XU( )g n
pn( ) that is directly defined in terms of the governance structure and the group
16 Adding the heterogeneity variable np
n would enrich the specification without changing any of the qualitative results and the expression that we will be taking to the data.

14 4/18/09
composition. U L, XU( ) is the benefits from participative governance, as perceived by the
differentiators; it is a decreasing function in leadership L . XU are positive shifters of the
utility for participative governance. The multiplicative term g npn( ) , increasing in its
argument, represents the weight of non-differentiators in increasing the organization’s
preference for participative governance, with g 0( ) = 1 for normalization.
• Social cost on differentiating group S: The fourth term is the social cost imposed by the
community on the group that attempts to differentiate by forming an organization. Let
S n, XS( ) represent this cost which is a decreasing function of the size of the group, where XS
are positive shifters of social resistance to differentiation. They include factors that reflect the
need for solidarity (e.g., riskiness of the environment) as well as ability of the community to
exercise pressure (e.g., social homogeneity of its population).17
Using all four components, aggregate welfare from the point of view of the organization is:
W = B nd, X
B( ) +U L, XU( )g n
pn( ) ! C n, L, X
C( ) ! S n, XS( ) .
However, aggregate welfare perceived by the differentiators who value less the
participative process in decision-making is:
Wd= B n
d, X
B( ) +U L, XU( ) ! C n, L, X
C( ) ! S n, XS( ) .
The differentiators choose whether to incorporate or not non-differentiators, knowing
that, if they do, the latter will participate in the decision regarding the organization’s size,
composition, and governance. This is formalized as:
maxIpW
d= B n
d, X
B( ) +U L, XU( ) ! C n, L, X
C( ) ! S n, XS( )
where Ip= 1 n
p> 0( )
s.t. nd,n
p, L( ) = arg maxW = B n
d, X
B( ) +U L, XU( )g n
pn( ) ! C n, L, X
C( ) ! S n, XS( ).
Comparing the welfare of differentiators according to the I p decision rule shows the
contribution of non-differentiators and why differentiators may or may not want to incorporate
17Miguel and Gugerty (2004) show how social heterogeneity reduces the capacity of Kenyan communities to exert social pressures on peers who do not contribute to local public goods.

15 4/18/09
any of them. By their sheer number, non-differentiators contribute to ease the social pressure of
the community that cannot easily oppose the formation of an organization that incorporates a
large number of its population. On the other hand, increasing the size of the organization makes
more difficult and costly to coordinate and manage it. In addition, as non-differentiators are
incorporated in the organization, they increase the organization’s preference for a participative
form of governance relative to the differentiators’ own preference.
5.2. Solution
The solution to this model is found by backward induction, solving first for the optimal
group size, composition, and governance in each of two possible regimes, with and without
incorporation of non-differentiators, and then choosing the regime that gives the maximum
welfare to the differentiators.
Regime D: Differentiators only
In this regime, non-differentiators are not invited to join the MO. The differentiators
choose the size of the group and the leadership level that maximize the welfare of the
organization:
maxn, L
Wd= B n, X
B( ) +U L, XU( ) ! S n, X
S( ) ! C n, L, XC( )
s.t. n ! nd .
Under standard assumptions for the second order conditions,18 and assuming for now
interior solutions, the optimal levels n! and L! are solutions to the first order conditions:
!Wd
!L=!U L, X
U( )!L
"!C n, L, X
C( )!L
= 0 (1a)
!Wd
!n=!B n, X
B( )!n
"!S n, X
S( )!n
"!C n, L, X
C( )!n
= 0 (1b)
which can be written as a system of equations:
L!= L n
!, X
C, X
U( ) (2a)
18 W is quasi-concave in n and L , U
LL! C
LL< 0 , B
nn! C
nn! S
nn< 0 , and C
nL not too large so that
ULL
! CLL( ) Bnn ! Cnn ! Snn( ) ! CnL
2" 0 .

16 4/18/09
n!= n L
!, X
B, X
S, X
C( ) . (2b)
Substituting (2a) for L! in (2b) gives the reduced form expression for the optimal group
size:
n!= f X
U, X
B, X
S, X
C( ) . (3)
The system of equations (2a and 3) gives the theoretical support for two stage estimation
of the relationship (2a) between optimal governance and group size, with XB and X
S as
instruments for group size.
Comparative static results for the relationship (2a) are obtained by total differentiation of
(1a) with respect to L! and n! :
!2U L, XU( )
!L2"!2C n, L, X
C( )!L2
#
$%%
&
'((dL =
!2C n, L, XC( )
!L!ndn
evaluated at L = L! and n = n! . With the left hand side expression negative, from the second order
conditions, and the right hand side negative by assumption, this expression shows an expected
positive relationship between the optimal leadership level and size of the group.
Similarly, total differentiation of (1a) with respect to L! and either XC or XU gives:
!2U L, XU( )
!L2"!2C n, L, X
C( )!L2
#
$%%
&
'((dL =
!2C n, L, XC( )
!L!XCdX
C
!2U L, XU( )
!L2"!2C n, L, X
C( )!L2
#
$%%
&
'((dL =
!2U L, XU( )
!L!XUdX
U
evaluated at L = L! and n = n! . This indicates that if XC contributes not only to increase
management costs, but also to increase (decrease) the beneficial effect of leadership, the optimal
level of leadership L! will be increasing (decreasing) in XC . Similarly, if XU contributes to
reduce (increase) the negative effect of leadership on the public goods activities, then the optimal
level of leadership L! will be increasing (decreasing) in XU .
Finally, differentiation of (1b) with respect to XB , XS , or XC shows that !W d!n
increases with XB if XB contributes positively to the marginal contribution of differentiators

17 4/18/09
(i.e., !2B n, X
B( ) !n!XB> 0 which is likely), increases with XS if group size decreases the
responsiveness of social pressure to non-differentiating pressure XS (i.e., !2S n, XS( ) !n!X
S< 0 ),
but decreases with XC if X
C increases the sensitivity of management cost to group size
( !2C n, XC( ) !n!X
C> 0 ). This suggests that corner solutions, obtained if !W d
!nn=n
d > 0 , are
more likely to occur in contexts that are favorable to economic activities ( XB large), experience
resistance from the community ( XS high), and when management costs are low ( XC low).
Regime I: Incorporation of non-differentiators
In this regime, an optimal number of non-differentiators is incorporated. The size of the
group, its composition, and its level of participation in the governance structure are determined by
the group itself according to the following maximization program:
maxW =nd, n, L
B nd, X
B( ) +U L, XU( )g n
pn( ) ! S n, X
S( ) ! C n, L, XC( )
with n = np+ n
d
s.t. nd! n
d
nd! n ! n
.
Assuming an interior solution for the leadership level and that availability of non-
differentiators is not binding, the optimal levels n!! and L!! are solution to:
!W!L
=!U L, X
U( )!L
gnp
n
"
#$%
&'(!C n, L, X
C( )!L
= 0
!W
!nd=!B n
d, X
B( )!n
d+U L, X
U( ) "g#1
n$ 0
!W
!ndnd# n
d( ) = 0, nd % nd
(4)
!W
!n=U L, X
U( ) "gnd
n2#!S n, X
S( )!n
#!C n, L, X
C( )!n
$ 0
!W
!nn # n
d( ) = 0, n # nd % 0.
If we assume that !B nd, X
B( ) !nd>U L, X
U( ) "g 1 n( ) (i.e., that the marginal differentiator

18 4/18/09
makes a greater welfare contribution than the marginal non-differentiator), then nd = nd .19 In
other words, in this regime I, all potential differentiators are members of the group and non-
differentiators are only included if the optimal group size is greater than the number of potential
differentiators in the community.
Under these conditions and standard assumptions for the second order conditions,20 the
system can be simplified and re-written to determine the optimal total group size and the optimal
leadership level as:
!W!L
=!U L, X
U( )!L
gn " nd
n
#
$%&
'("!C n, L, X
C( )!L
= 0 (5a)
!W
!n=U L, X
U( ) "gnd
n2#!S n, X
S( )!n
#!C n, L, X
C( )!n
= 0 . (5b)
This leads to a system of equations:
L!!
= L n!!, X
C, X
U,n
d( ) (6a)
n!!
= n L!!, X
U, X
S, X
C,n
d( ) . (6b)
Substituting (6a) for L!! in (6b) gives the reduced form expression for the optimal group
size:
n!!
= f XU, X
C, X
S,n
d( ) . (7)
The system of equations (6a) and (7) gives the theoretical support for two stage
estimation of the relationship between governance and the optimal group size, with XS as
instruments for group size.
Comparative static results on the relationship between optimal size and governance are
obtained by total differentiation of (5a) with respect to L!! and n!! :
!2U L, XU( )
!L2g "
!2C n, L, XC( )
!L2
#
$%%
&
'((dL = "
!U L, XU( )
!L)gnd
n2+!2C n, L, X
C( )!L!n
#
$%%
&
'((dn
19 It means that the group has not been high-jacked by the non-differentiators. This will happen when the economic contribution of the differentiators is large and/or non-differentiators and differentiators don't differ too much in the preference for participative governance. 20 W is quasi-concave in n and L.

19 4/18/09
evaluated at L = L!! and n = n!! .
The left hand side is negative from the second order conditions. The right hand side has
two components, a positive term related to the greater value given to participative governance as
the number of non-differentiators incorporated in the group increases, and a negative term related
to the increasing management cost resulting from increased group size. If this expression is
dominated by the management cost component, the relationship between leadership and size, at
the equilibrium, is positive, as in regime D. However, if non-differentiators attach much more
value to participation than differentiators do (i.e., !g is large), then the equilibrium relationship
between group size and leadership is negative.
Total differentiation of (5a) w.r.t. L!! and either nd , XU , or XC shows that L** will
increase with the number of differentiators while its relationship to XU and XC is the same as in
the other regime.
Choice of regime
Differentiators choose the regime that gives them the highest welfare, provided it is positive,
of course. Four cases need to be distinguished:
• If the optimal size of the group in regime D, n! , is not feasible (i.e., W dn!, L
!( ) < 0 ),
differentiators have no choice but to consider including some non-differentiators in the
organization.
• If the optimal size of the group in regime D is lower than nd and feasible, the welfare of
differentiators will be higher without including any non-differentiators in their organization.
• If the optimal size of the group in regime D is given by the corner solution n! = nd ,
differentiators need to compare their welfare under the two regimes.
The optimal size and participation under the two regimes provide the following welfare to
differentiators:
Regime D: W d= B n
d , XB( ) +U L!, XU( ) " S n
d , XS( ) " C nd , L!, XC( )
Regime I: W d= B n
d , XB( ) +U L!!, XU( ) " S n
d+ n
p!!, XS( ) " C nd+ n
p!!, L!!, XC( )with np!! = n!! " nd and L! > L!!.
In regime I, differentiators have to bear with less leadership than they would optimally want
and are burdened with greater management costs. The gain to them is the reduction of the costs

20 4/18/09
linked to social pressures. Therefore, the differentiators will only choose regime I if the social
pressures are sufficiently important ( XS large) and management cost are not too high.
• Finally, if the optimal solution under regime I is not feasible (i.e., W n!!, L
!!( ) < 0 ), there
cannot exist any differentiating organization in the community. This case is more likely to
happen when community pressures are important ( XS large) and the level of local economic
opportunities is relatively low ( XB low)
VI. Econometric model
6.1. Alternative regime: contrasting first MOs to non-first MOs
We concluded from the model that incorporation of non-differentiators would be optimal
in a context of strong social resistance to differentiation. Heterogeneity in the intensity of
community conservatism exists across communities due to differences in the need for risk sharing
and ability of the community to impose social pressure designated by XS in the model. A
probably even sharper contrast exists over time within a community, whereby social pressure is
very strong to resist the first case of differentiation, i.e., attempt at emergence of a first MO, but
weaker for any subsequent attempt. The argument is that emergence of the first MO represents a
major institutional change in a community as it implies that non-differentiating norms will no
longer be credibly enforced.21 We use this idea to identify regime: we hypothesize that the first
MO encounters strong resistance in emerging and therefore optimally chooses to incorporate
some non-differentiators, thus belonging to regime I; while subsequent MOs are less constrained
by the community and can be organized among differentiators only, thus belonging to regime D.22
If this hypothesis is correct, we expect to find a positive relationship between size and leadership
in non-first MOs, but a negative relationship in the sample of first MOs.
21 To see this, let n1 be the number of individuals participating in the first MO and N the total size of the community. The first set of differentiators face pressures XS1
= f N ! n1( ) , with !f > 0 . The second MO
to emerge, however, will face a weaker level of pressures: XS2= f N ! n
1! n
2( ) . 22 Because the membership coverage of organizations is still very low, and nothing prevents anyone from belonging to several organizations, we ignore the possibility that MOs could enter into competition for members, and hence assume that the subsequent MOs can choose their optimal size, composition, and governance. One step into the direction of endogenizing the formation of groups is taken by Arcand and Fafchamps (2007), but they do not address the decision on size and governance which is the main concern of our paper.
21 4/18/09
Another interesting counterfactual that we will exploit to check the validity of the
previous hypothesis is the contrasted structure of first COs, organizations whose main object is
the provision of public goods. Since they do not result in economic differentiation, they are not
constrained by community conservatism. Because of the diversity of public goods that these
organizations deliver, participative governance is predominant and should remain important at
any size. We thus expect to observe a weak, although potentially positive, relationship between
group size (at the time of formation of the organization) and leadership.
6.2. The empirical relationship between group size and governance
The empirical relationships that we estimate derive from equations (2a) and (6a) above
for the non-first and first MOs, respectively. Specification of indicators that characterize the
different shifters and the total number of differentiators nd is as follows:
nd : The main determinant of the potential number of differentiators in a community is
the economic opportunity for market-oriented activities, i.e., the XB indicators.
XB : We characterize opportunities for market-oriented activities by market access,
measured as the travel time from the village to the closest city of 5000 inhabitants or more
(remoteness variable). This variable was constructed from a road map, accounting for differential
road quality.23
XU : Utility derived from participative governance varies with ethnic characteristics as
some ethnic groups traditionally value consensus building more than others. For this reason,
dummies for the main ethnicities of the village are introduced in estimations involving XU .
XS : We assume that social resistance to differentiation is more important when the need
for solidarity is greater -- i.e., in more risky environments characterized by lower rainfall
predictability-- and when the capacity of the community to enforce the non-differentiation norm
is stronger -- i.e., when characterized by greater social homogeneity (as defined in section 3.4).
XC : Beyond group size and leadership, management costs are usually associated with
heterogeneity of the members of a group. This, however, is largely endogenous, and thus cannot
be used in an empirical analysis, unless one would explicitly deal with the endogeneity problem.
Moreover, while we observe the current composition of the group, we do not have information on
the members of the group at the time of its formation. This element will therefore remain omitted
23 Standard speeds used in similar GIS work for Africa are 50 km/h for primary roads, 35 km/h for secondary roads, and 25 km/h for tertiary roads.

22 4/18/09
in the empirical analysis.
!c
: Finally, we use department fixed effects to control for general agro-ecological and
developmental conditions, which may have direct influence on the type of governance in the
organization.
A linear approximation of the structural relationship (2a) and (6a) between leadership and
group size in first and non-first MOs from village v in department c is written as follows:
First MO: Lvc
1= !1 + "1n
vc+ X
vc
B# 1 + Xvc
U$1 + %c
1+ &
vc
1 (8)
Non-first MO: Lvc
2= ! 2 + "2n
vc+ X
vc
U#2 + $c
2+ %
vc
2 (9)
where Lvc
is the leadership indicator, nvc
the initial group size (at formation), and !vc
unobserved
heterogeneity. The superscripts 1 and 2 stand for first and non-first MOs, respectively. If our
classification of MOs into first and non-first does reflect the intensity of social pressure, our
theory predicts !1 to be negative and !2 to be positive.
The first stage estimation for the endogenous group size nvc
is derived from the reduced
form expression (equations (3) and (7)) for the two categories of MOs:
nvc= ! n
+ Xvc
S " n + Xvc
B# n + Xvc
U$n + %c
n+ &
vc
n , (10)
where Xvc
S represents the two social resistance indicators, i.e., rainfall predictability and social
homogeneity in the village. The market opportunity variable XB stands for itself in the regime D
equation (3) and as determinant of nd in the regime I equation (7). Our hypothesis that first MOs
are constrained by social pressures while it is less so for subsequent MOs can be verified from
this equation, in which we expect ! n to be positive for first MOs and smaller or equal to zero for
non-first MOs.
According to the model, if community pressures are very important, no organization of
size smaller than or equal to the whole village will be able to emerge in the community. To test
this, we estimate the following Tobit model, where the size of the first organization in villages
without any organization is censored to the village size:
nvc
!= " n
+ Xvc
S # n + Xvc
B$ n + Xvc
U%n + &c
n+ '
vc
n
nvc= n
vc
! if n
vc
!< n, 0 otherwise.
(11)

23 4/18/09
where XB stands as determinant of nd .
Similar estimations can be performed on the sub-samples of first COs. In these cases, we
do not expect to find any significant relationship between the social pressure variables and group
size.
VII. Empirical analysis: Social pressures, membership size, and governance structure
In this section, we verify that the implications of the model developed in Section V under
regime I apply to first MOs and under regime D to non-first MOs. We first identify the negative
correlation between size and leadership in the first MOs and contrast it with the results obtained
in first COs and non-first MOs. We then estimate the demand for a first MO to deliver social
services by contrast to demands on non-first MOs.
In the odd columns of Table 6, we report the OLS estimates of the relationship between
initial size and leadership. In Panel A, column 1 corresponds to equation (8) for first MOs and
column 3 to equation (9) for non-first MOs. Results show a negative partial correlation between
size and leadership among the first MOs, and a positive relationship among non-first MOs.
Robustness checks consist in verifying that the obtained coefficients on size are not due to the
imposed theoretical structure of equations (8) and (9) for first and non-first MOs, respectively.
This is verified by using equation (9) for the first MOs and (8) for the non-first MOs in Panel B.
As a further robustness check, we find in Panel C that the initial size is not correlated with
leadership in first COs, using either equation (8) or (9).
Although these results are consistent with the theory outlined in the previous sections,
alternative explanations may be devised for the observed phenomenon. In particular, one may
argue that external agents (government, NGOs, donors etc) favor inclusive organizations
governed on a participatory basis. Under the assumption that such partners tend to support MO-
type rather than CO-type organizations, and first MOs rather than subsequent ones, the observed
relationship could be driven by external partners rather than community pressures per se. We
therefore use the theoretical model developed above to justify a two-stage least squares
estimation where the size of the organization is instrumented by social homogeneity and rainfall
predictability and by remoteness. The validity of the instruments is based on the argument that it
is unlikely that rainfall predictability and social homogeneity would have a differentiated
influence on the governance structure of first MOs, non-first MOs, and first COs through other
mechanisms than the size of the organization.

24 4/18/09
In Table 7, we present the estimated coefficients of the reduced form estimation of the
initial size of the organization described in equation (7) for first MOs and (3) for non-first MOs,
with the empirical specification in equation (10). Results show that more social homogeneity is
associated with larger initial size in first MOs (col. 1). The size of this effect is important: a one
standard deviation increase in the level of social homogeneity is associated with a 20% increase
in the size of the first MO. By contrast, for non-first MOs, the coefficient on social homogeneity
is small and not statistically significant (col. 3). Again, we use the sub-sample of first COs as a
robustness check, showing that neither social homogeneity nor rainfall predictability is correlated
with their initial size (col. 5). Overall, R2 statistics as well as partial F-tests on the XS (in col. 1)
and on XS and XB (in col. 3) variables show them as reasonably strong potential instruments for
the IV estimations presented in Table 6. We interpret the contrasted effects of social homogeneity
as consistent with the role of social pressure described in the theory. Another channel of
transmission from riskiness of the environment and remoteness to group size could be the nature
of their activities. Controlling for activities, in columns 2 and 4 of Table 7, improves the fit of the
estimations without affecting the relationship of interest between social homogeneity and group
size. Since the choice of activity is truly an endogenous decision of the group, we use the reduced
form estimations of columns 1 and 3 as first stage for the IV estimations of Table 6. Similarly for
the interpretation of the role of social homogeneity, one could argue that it can reduce the
transactions costs involved in setting up an organization, thus allowing it to be larger. This effect,
however, would have no reason to be different for MOs and COs, or across MOs.
In even columns of Table 6, we use the results of Table 7 as the first stage in a two-stage
least squares estimation of the relationship between size and leadership. In Panel A, column 2
corresponds to equation (8) using XS as instruments for the size of the organization, and column
4 to equation (9), using XS and XB for instruments. The estimated coefficients give strong
support to our hypothesis, in that initial size has significant negative impact on leadership in first
MOs, whereas the opposite is true for non-first MOs. We note that, as compared to the OLS
results, the point estimates are larger in absolute value. In the last row of Panel A, we report p-
values for a Hausman (1978) overidentification test, according to which we cannot reject joint
exogeneity of our instruments. Again, we present in Panels B and C robustness checks for these
results. In particular, we show in Panel C that size is still not a significant correlate of governance

25 4/18/09
structure in first COs.24. Estimations of reduced form models for leadership (not reported in
tables) show a strong and significant negative correlation of social homogeneity with leadership
for the first MO (coefficient of -8.1 [st. error 3.6]), but a small and non-significant effect for non-
first MOs and first COs (-2.2[4.3] and 3.2[3.7], respectively).
These estimations are all done with cross-section data and hence may suffer biases from
unobserved village characteristics. However, the main point here is to contrast first and non-first
MOs from the same villages. And for an omitted variable bias to produce a negative correlation
between group size and leadership among first MOs and a positive correlation among non-first
MOs, it would have to be the case that this variable has an opposite correlation with the size or
the governance in the two groups of MOs. This seems a remote risk.
According to model predictions, when community pressures are too important, only
organizations greater than the village size can form. In this case, one will observe no
organization. In keeping close to the theory, we estimate in Table 8 a village-level Tobit
relationship between initial membership size of an organization and community pressures.
Absence of any organization corresponds to a right-censored observation where the optimal size
of the organization is larger than the village. The 71 right-censored observations correspond to
villages without any MO-type organization by 2002. Column (1) reports the estimated marginal
effects of social heterogeneity and rainfall predictability on the size of the first MO in the village
corresponding to equation (11). Results show that social homogeneity is positively associated
with the initial size of a first MO. This is not the case for first COs.
Finally, we look at the impact that social pressures may have on the activities of a first
MO. Incorporation of additional members in response to these pressures would induce not only a
move away from leadership as a form of governance, but also to the delivery of club goods to
reward the non-entrepreneurial members. The club good of relevance is maintenance of a
collective field by the MO to the benefit of all members. In Table 9, we see that first MOs tend to
engage in the management of a collective field for the specific benefit of their members more
than their non-first counterparts (column 1), but that this prevails only in villages with a high
level of social homogeneity (column 2). No such relationship is found when we consider
collective fields for all community members. This supports the proposition that the social
activities of first MOs are of a club good nature.
24 Identical estimations were also performed on all COs, with similar results. Estimations on a reduced sample not including the exceptionally large organizations show that outliers are not the driving force of these results.
26 4/18/09
In conclusion, the empirical results show that social homogeneity constrains the size,
governance structure, and activities of MOs. More specifically, higher social homogeneity
induces a larger size, a more participative type of governance, and more provision of public
goods in first MOs but not in subsequent MOs, nor in COs. We interpret this as coming from
strong social resistance to differentiation pushing the first emerging MO to incorporate non-
differentiators for benefit sharing. Once a first MO has emerged, social resistance to
differentiation decreases. Subsequent MOs can have a smaller size, can choose a leadership-type
governance in response to membership size, and can devote themselves to supporting the
entrepreneurial activities of their members, doing away with a role in the provision of club goods.
VIII. Conclusion
In this paper, we analyzed the emergence, size, governance structure, and activities of
village organizations, contrasting market-oriented organizations (MOs) and community-oriented
organizations (COs), in a context where MOs are perceived as threatening the reproduction of the
community’s traditional social structure and solidarity system by inducing economic
differentiation between their members and the rest of the community.
We built a model that shows that, in an environment where there are strong pressures
against economic differentiation, the size of an MO to emerge is partly determined by the
necessity to incorporate a sufficiently large number of participants to counteract the resistance to
differentiation from the rest of the village. This, in turn, influences the MO's governance
structure, as the organization is pressured to include less entrepreneurial members for whom
participation is conditional on intra-organizational redistribution under the form of club goods
and, hence, on a more participative form of governance. Where these pressures are weak, the
emerging organizations can be smaller, the leadership mode can dominate, and the organization
can concentrate on the delivery of income-generating services for its members.
Based on our field experience, we hypothesize that the first MO to emerge in a village
encounters strong resistance, while subsequent MOs are not subject to these conservative
pressures. We verify the corresponding model predictions using data from 646 village-level
organizations in Burkina Faso. We find support for the important role of social homogeneity in
constraining first MOs, but not subsequent MOs.
References
Acemoglu, Daron and Jim Robinson. 2001. “A Theory of Political Transition.” American

27 4/18/09
Economic Review 91, no. 4: 938-963.
Akerlof, Georges. 1976. “The Economics of Caste and of the Rat Race and Other Woeful Tales.”
Quarterly Journal of Economics 90, no. 4: 599-617.
Akerlof, Georges and Susan Kranton. 2000. “Economics and Identity.” Quarterly Journal of
Economics 115, no. 3: 715-753.
Arcand, Jean-Louis and Marcel Fafchamps. 2007. “Matching in Community-Based
Organizations”, CERDI, University d’Auvergne
Attwood, Donald W. and B. S. Baviskar. 1987. “Why Do Some Co-operatives Work But Not
Others? A Comparative Analysis of Sugar Co-operatives in India.” Economic and Political
Weekly 22, no. 26: A38-45.
Barrett, Christopher B. 2005. “Smallholder Identities and Social Networks: The Challenge of
Improving Productivity and Welfare.” In Christopher B. Barrett (ed). 2005. The Social
Economics of Poverty: On Identities, Groups, Communities, and Networks. London:
Routledge.
Bernard, Tanguy, Marie-Hélène Collion, Alain de Janvry, Pierre Rondot , and Elisabeth Sadoulet.
2007. “Do Village Organizations Make a Difference in African Rural Development? A Study
for Senegal and Burkina Faso.” World Development 36, no. 11: 2188-2204.
Bianchi, Tito. 2002. “Leaders and Intermediaries as Economic Development Agents in
Producers’ Associations.” In Heyer, J., F. Stewart, and R. Thorp. 2002. Group Behavior and
Development. Chapter 5, Oxford University Press.
Bowles, Samuel. 2006. “Institutional Poverty Traps.” In S. Bowles, S. Durlauf, and K. Hoff, eds.,
Poverty Traps. Princeton University Press.
Collion, Marie-Hélène and Pierre Rondot. 1998. “Background, Discussions, and
Recommendations.” Agricultural Producer Organizations, Their Contribution to Rural
Capacity Building and Poverty Reduction, Pierre Rondot and Marie-Hélène Collion, eds.,
The World Bank.
Diagne, Daouda and Denis Pesche. 1995. Les organisations paysannes et rurales des acteurs du
développement en Afrique subsaharienne. Ministère Français de la Coopération, Réseau
Groupements, Associations Villageoises et Organisations Paysannes.
Duflo, Esther and Chistopher Udry. 2004. “Intrahousehold Resource Allocation in Cote d'Ivoire:

28 4/18/09
Social Norms, Separate Accounts, and Consumption Choices”, NBER working paper no
10498.
Englebert, Pierre. 1996. Burkina Faso: Unsteady Statehood in West Africa. Boulder, Colorado:
Westview Press.
Fafchamps, Marcel. 1992. “Solidarity Networks in Pre-industrial Societies: Rational Peasants
with a Moral Economy.” Economic Development and Cultural Change 41, no. 1: 147-174.
Fafchamps, Marcel. 1993. “Sequential Labor Decisions under Uncertainty: an Estimable
Household Model of West-African Farmers.” Econometrica 61, no. 5: 1173-1197.
Fernandez, Raquel and Dani Rodrik. 1991. “Resistance to Reform: Status Quo Bias in the
Presence of Individual-specific Uncertainty.” American Economic Review 81, no. 5: 1146-55.
Fiske, Alan. 1991. Structures of Social Life: The Four Elementary Forms of Human Relations.
New York: The Free Press.
Foster, Andrew and Mark Rosenzweig. 2001. “Democratization, Decentralization, and the
Distribution of Local Public Goods in a Poor Rural Economy.” Working Paper, Department
of Economics, Brown University.
Greif, Avner. 1994. “Cultural Beliefs and the Organization of Society: A Historical and
Theoretical Reflection on Collectivist and Individualist Societies.” Journal of Political
Economy 102, no. 5: 912-950.
Hausman, Jerrry. 1978. “Specification Tests in Econometrics.” Econometrica 46, no. 6: 1251-
1271.
Hoff, Karla and Arijit Sen. 2006. “The Kin System as a Poverty Trap?” In S. Bowles, S. Durlauf,
and K. Hoff, eds., Poverty Traps. Princeton University Press.
Jones Peter G., and Philip K. Thornton. 1993. “A Rainfall Generator for Agricultural
Applications in the Tropics.” Agricultural and Forest Meteorology 63: 1-19.
Kuran, Timur. 1988. “The Tenacious Past: Theories of Personal and Collective Conservatism.”
Journal of Economic Behavior and Organization 10, no. 2: 143-171.
Mansuri, Ghazala and Vijayendra Rao. 2004. “Community-Based (and Driven) Development: A
Critical Review.” World Bank Research Observer 19, no. 1: 1-39.
McCarthy, Nancy, Céline Dutilly-Diané, and Boureima Drabo. 2002. “Cooperation, Collective
Action and Natural Resources Management in Burkina Faso: A Methodological Note.”

29 4/18/09
IFPRI: CAPRi Working Paper No 27.
Miguel, Edward and Mary Kay Gugerty. 2005. “Ethnic Diversity, Social Sanctions, and Public
Goods in Kenya.” Journal of Public Economics 89, no. 11-12: 2325-2368.
Miguel, Edward, Shanker Satyanath, and Ernest Sergenti. 2004. “Economic Shocks and Civil
Conflict: An Instrumental Variables Approach.” Journal of Political Economy 112, no. 4:
725-753
Platteau, Jean-Philippe. 2000. Institutions, Social Norms, and Economic Development. Hardwood
Academic Publisher.
Platteau, Jean-Philippe and Anita Abraham. 2002. “Participatory Development in the Presence of
Endogenous Community Imperfections.” The Journal of Development Studies 39, no. 2: 104-
136.
Platteau, Jean-Philippe. 1996. Traditional Sharing Norms as an Obstacle to Economic Growth in
Tribal Societies. Namur, Belgium: Notre Dame de la Paix Publications
Ravallion, Martin and Shubham Chaudhuri. 1997. “Risk and Insurance in Village India:
Comment.” Econometrica 65, no. 1: 171-184.
Roncoli, Carla and Paul H. Kirshen. 2002. “Reading the Rains: Local Knowledge and Rainfall
Forecasting in Burkina Faso.” Society and Natural Resources 15: 409-427.
Scott, James C. 1976. The Moral Economy of Peasants: Rebellion and Subsistence in South-East
Asia. New Haven: Yale University Press.
Staatz, John M. 1987. “Farmers’ incentives to take collective action via cooperatives: a
transaction costs approach” in Cooperative Theory: New Approaches, ACS Service Report
Tendler, Judith. 1983. What to think about Cooperatives? A Guide from Bolivia. Washington
D.C.: The Inter-American Foundation.
Townsend, Robert M. 1994. “Risk and Insurance in India.” Econometrica 62, no. 3: 539-591.
Udry, Christopher. 1994. “Risk and Insurance in a Rural Credit Market: An Empirical
Investigation in Northern Nigeria.” Review of Economic Studies 61, no. 3: 495-526.
Uphoff, Norman. 1993. “Grassroots Organizations and NGOs in Rural Development:
Opportunities With Diminishing States and Expanding Markets.” World Development 21, no.
4: 607-22.
Thompson, Gary D. and Paul N. Wilson. 1994. “Common Property as an Institutional Response

30 4/18/09
to Environmental Variability.” Contemporary Economic Policy 12 (July).

31 4/18/09
Figure 1. Leadership and size of the organization
32 4/18/09
Table 1. Existence of MO-type and CO-type organizations, by village
% of villages with
% of all villages at least one VO
There is at least one VO in the village 90
There is at least one MO in the village 60 66
There is at least one CO in the village 75 83
Percentages in the population of villages, computed using sampling weights.
Table 2. Structure and activities of village organizations
Difference: First Non-first Difference:
MO CO p-value MO MO p-value
Social activities
Collective field or cereal bank for solidarity purpose 59.5 72.3 61 47.5
Manage the environment and clean village 14.9 26.0 15.3 11.1
Construct stone bunds 3.7 8.1 5.4 1.3
Social activities 2.9 3.5 1.8 3.9
Water management 3.9 2.7 4.3 2
Market-oriented activities
Processing and marketing 37.1 0.0 33.7 35.7
Livestock breeding and animal husbandry 29.0 0.0 27.7 24
Horticulture and irrigation 24.6 0.0 21.2 27.6
Cotton 12.1 0.0 11.1 10.3
69.4 100 71.8 56 0.01
59.5 44.6 0.15 66.7 50.4 0.02
38.8 61.2 56.0 44.0
318 328 197 121
Percentages in the population of organizations, computed using sampling weights.
Activities ever undertaken
% of village organizations (in the population of VOs)
Number of observations
Activities started in the first 2 years
Had led a community-oriented activity (%)
Initial size
Table 3. Indicators of governance structure in village organizations
Leadership Rules
Decisions on benefit allocation taken by president only 0.46 0.11
Decisions on spending taken by president only 0.55 0.15
Decisions on the start of a new activity taken by president only 0.52 0.10
Within the committee, decisions taken by president only 0.28 0.00
Within the general assembly, decisions taken by president only 0.31 0.04
Committee (including the president) put into place by elections -0.13 0.72
Committee (including the president) put into place for a given time -0.08 0.42
There is at least one control commision in the organization -0.15 0.50
Observations weighted by sampling weights.
Principal component scores

33 4/18/09
Table 4. Governance structure and performance, logit estimation
Dependent variable: Mean CO MO First MO Non-first MO
Active at time of survey (st. dev.) (1) (2) (3) (4)
Leadership 0.16 -0.008 0.067 0.104 0.025
(0.23) (-0.08) (1.04) (0.96) (4.71)**
Rules 0.58 0.152 0.030 0.041 0.007
(0.27) (3.58)** (1.55) (1.09) (4.46)**
Age of organization in 2002 yes yes yes yes
Number of observations 298 318 197 121
Reported: marginal effects at the mean of the independent variables. t-statistics for the underlying parameter in
parentheses. * significant at 5%; ** significant at 1%
Observations weighted by sampling weights. Standard errors corrected for cluster and strata effects.
Table 5. MOs and local public goods:
Percent of MOs that have had a collective field within the first two years
High social homogeneity Low social homogeneity
First MO Non-first Difference: First MO Non-first Difference:
MO p-value MO p-value
Collective field:
General 62.7 44.8 0.10 57.6 49.6 0.48
With benefits for the community 22.5 21.8 0.95 28.2 38.6 0.38
With benefits for the members 32.0 12.4 0.00 8.3 9.9 0.78
Observations weighted by sampling weights.

34 4/18/09
Dependent variable: leadership
Panel A. Structural model
OLS IV OLS IV
(1) (2) (3) (4)
Initial size (log) (n) -0.044 -0.114 0.101 0.149
[0.012]** [0.049]* [0.028]** [0.065]*
Remoteness (XB) yes yes
Village size yes yes yes yes
Main ethnicity dummies (XU) yes yes yes yes
Department fixed effects yes yes yes yes
Number of observations 175 175 121 107
R-squared 0.23 0.17 0.41 0.39
OID test (Hausman 1978): p-value 0.77 0.50
Panel B. Robustness checks
OLS IV OLS IV
(1) (2) (3) (4)
Initial size (log) (n) -0.028 -0.147 0.098 0.036
[0.007]** [0.063]* [0.025]** [0.059]
Remoteness (XB) yes yes
Village size yes yes yes yes
Main ethnicity dummies (XU) yes yes yes yes
Department fixed effects yes yes yes yes
Number of observations 197 175 107 107
R-squared 0.16 0.08 0.41 0.38
Panel C. Counterfactual: first COs OLS IV OLS IV
(1) (2) (3) (4)
Initial size (log) (n) 0.04 -0.02 0.02 0.03
[0.026] [0.063] [0.014] [0.155]
Remoteness (XB) yes yes
Village size yes yes yes yes
Main ethnicity dummies (XU) yes yes yes yes
Department fixed effects yes yes yes yes
Number of observations 205 168 168 168
R-squared 0.21 0.31 0.34 0.34
First MOs Non-first MOs
Table 6. Initial size and leadership: Structural model estimations and robustness checks
First MOs Non-first MOs
Equation (8) Equation (9)
Equation (9) Equation (8)
Equation (9) Equation (8)
Leadership: mean = 0.156, std. dev. = 0.235. Log initial size: mean = 3.55, std. dev. = 0.80.
Remoteness is measured as the traveling time to the closest city of 5,000 or more inhabitants.
Standard errors in brackets. * signif at 5%, ** signif at 1%.
Observations weighted by sampling weights, std. errors corrected for cluster and strata effects.
Instruments: in equation (8) = social homogeneity and rainfall predictability; in equation (9) = social homogeneity,
rainfall predictability and remoteness.

35 4/18/09
Table 7. Community pressures and initial size of the organizations (first stage)
Dependent variable: Mean First COs
Initial size (log) (st. dev.) (1) (2) (3) (4) (5)
Social homogeneity (XS) 0.995 68.3 59.7 7.6 22.4 20.5
(0.003) [14.6]** [11.2]** [15.5] [8.61]* [26.3]
Rainfall predictability (XS) 0.312 -3.1 0.9 12.0 8.2 -2.9
(0.078) [2.5] [1.73] [5.6] [4.0] [4.5]
Remoteness (XB) 1.796 0.15 0.23 1.00 0.60 -0.37
(1.363) [0.10] [0.12] [0.38]* [0.26]* [0.14]*
(Remoteness)2 (XB) -0.02 -0.02 -0.13 -0.07 0.04
[0.01]* [0.01] [0.05]* [0.03]* [0.01]**
Activities undertaken by
organization in first two years yes yes
Village size yes yes yes yes yes
Main ethnicity dummies (XU) yes yes yes yes yes
Department fixed effects yes yes yes yes yes
Number of observations 175 175 107 107 168
R-squared 0.25 0.50 0.37 0.51 0.26
Partial F-test on XS variables: p-value 0.001 0.71
0.006 0.07
First MOs Non-first MOs
Standard errors in brackets. * signif at 5%, ** signif at 1%.
Observations weighted by sampling weights. Standard errors corrected for cluster and strata effects.
Log initial size: mean = 3.6, std. dev. = 0.86
Remoteness is measured as the traveling time to the closest city of 5,000 or more inhabitants.
Partial F-test on XS and XB variables: p-value

36 4/18/09
Table 8. Initial size of the organization: Reduced form Tobit estimations
First MOs First COs
Dependent variable: Initial size (log) (1) (2)
Social homogeneity (XS) 65.6 6.12
[12.0]*** [23.2]
Rainfall predictability (XS) -3.28 -0.87
[2.24] [3.47]
Remoteness (XB) -0.02 -0.34
[0.128] [0.224]
(Remoteness)2 (XB) -0.01 0.036
[0.015] [0.019]*
Village size yes yes
Main ethnicity dummies yes yes
Department fixed effects yes yes
Number of observations 224 224
Right-censored observations 71 74
Standard errors in brackets. * signif at 5%, ** signif at 1%.
Observations weighted by sampling weights. Standard errors corrected for cluster and strata
effects.
Remoteness is measured as the traveling time to the closest city of 5,000 or more inhabitants.
Table 9. Provision of club goods by MOs, OLS estimation
Dependent variable:
(1) (2)
First MO 0.129 -0.029
[0.041]** [0.080]
Social homogeneity high1 0.221 0.038
[0.127] [0.191]
Social homogeneity high x First MO 0.299
[0.120]*
Rainfall predictability yes yes
Remoteness yes yes
Village size yes yes
yes yes
Department fixed effects yes yes
Number of observations 282 282
R-squared 0.17 0.20
1High homogeneity is for homogeneity above the median value in the sample.
Standard errors in brackets. * signif at 5%, ** signif at 1%.
Observations weighted by sampling weights. Std. errors corrected for cluster and strata
MO has undertaken a collective field activity
for its members in the first two years
Main ethnicity dummies (XU)
Top Related