


Languages
Pages
Legal

What works for Payment by Results Mechanisms in DFID
Programmes
DFID COVER NOTE
What: the enclosed report draws lessons from 20 innovative PbR programmes within DFID’s portfolio. Who: this research was undertaken by Professor Paul Clist from the University of East Anglia (UEA). The findings of this independent research are the researchers own, and do not necessarily reflect the views of DFID. In this cover note, the commissioning DFID team highlight key findings, limitations and recommendations. Why: DFID’s 2014 PbR Strategyi and 2015 Evaluation Framework for PbRii commit DFID to build the evidence base of what works, and build capability to deliver PbR programmes well. This is the second of two reports commissioned by DFID to draw lessons from the currently available evidence. DFID hopes these studies will prove useful for development practitioners across the wider donor community who have an interest in PbR. How: Professor Clist reviewed evaluation reports (where available), annual reviews, informal and internal lessons-learned products, notes, and interviews with programme teams. Findings: The primary finding also serves as a caveat: the current evidence base from the 20 DFID programmes considered remains thin, in part because some are still mid-delivery. However, it is predicted that in coming years this will increase significantly, with the number of high-quality independent evaluations more than doubling. Challenges around design and implementation: the first generation of DFID PbR programmes reveal some common challenges: ➢ the difficulty of identifying good measures to pay against is a near universal theme; ➢ high management costs is again a recurrent issue; ➢ verification tends to be burdensome in terms of time, cost and complexity with few additional obvious
benefits. Whether practice confirms key hypotheses for good PbR programming: The author posits four important characteristics which theory suggest may drive successful PbR programming. According to the evidence surveyed the findings are as follows: Financial incentive: the emerging evidence confirms the logic that offering financial reward to incentivise performance around particular measures leads to greater effort in achieving these targets (p14). Greater attention: the researcher finds fairly convincing evidence that PbR leads to the implementing partner focusing more attention and energy around the specific PbR measures being incentivised. In some cases, the financial incentives do not need to be particularly high to drive this effort (pp14-15). Accountability: amongst the programmes surveyed, there is not yet compelling evidence to suggest that PbR programmes help drive greater accountability of partner governments or of implementing organisations to beneficiaries in developing countries (pp14-15). Autonomy and innovation: the researcher finds that as currently designed, the 20 PbR programmes considered do not seem to lead to greater space for autonomous decision making amongst implementing partners. The researchers found little evidence that PbR engendered greater innovation in these 20 programmes (pp10-11) Limitations – as many of the reviewed programmes are still live, the researcher did not have access to robust evaluations for all the 20 programmes. Thus, inferences and judgements had to be made on the basis of partial and early findings in many cases. Primary value: Professor Clist has drawn out indicative factors which the available hard and soft evidence suggests influences the success of current PbR programming. In addition, the annex which assesses the strength of evidence for each of the programmes is an excellent resource. It enables readers to easily access the key documents for the programmes and to gage the overall strength of their evidence.

How we will use these findings: DFID will incorporate these insights and, where appropriate, recommendations into our institutional PbR learning, training, guidance and support to programme design teams, as part of DFID’s institutional learning strategy. We thank Professor Clist for his hard work, insights and collaborative approach, and for the consultation with DFID. The views and conclusions set out in the report are those of the authors alone.
i https://www.gov.uk/government/publications/dfids-strategy-for-payment-by-results-sharpening-incentives-to-perform. ii https://www.gov.uk/government/publications/dfids-evaluation-framework-for-payment-by-results

1
FULL REPORT: Review Of Payment By Results In DFID: Establishing
The Evidence Base
Objective 2: What works for Payment
by Results Mechanisms in DFID
Programs Dr Paul Clist, July 2017, University of East Anglia, https://paulclist.github.io/
This document seeks to ‘synthesise lessons learned about what works for implementation
and impact of PBR mechanisms in DFID programmes, and create recommendations for
policy/programming,’ as laid out in the terms of reference. I use the most robust written
evidence available, attempting to answer the question of which factors affect the likelihood
of PbR success. An overview of the evidence reviewed is given in appendix 1, listed by
project in the same order as table 1. These include a wide variety of documents, including
high-quality independent evaluation reports, annual reviews and informal learning notes.
Some non-public documents were made available, but wherever possible points are
substantiated by quotes from publically available documents (even if the underlying
viewpoints are informed by non-public documents). The research also benefited from
having access to a number of interviews that were conducted in conjunction with objective 3.
The main message of the document is simple: the evidence base is still very thin. In the
coming years the quantity of evidence will substantially increase, more than doubling the
number of rigorous evaluations. With this in mind, a simple structure is used which should
enable future evaluations to be incorporated into this snapshot.1
Section 1 provides a brief overview of the DFID evidence (see appendix 1 for a longer
overview of available documents), sections 2-4 will investigate the evidence base using the
MAP framework which gives the following categories: Measure, Agent (i.e. recipient), and
Principal (i.e. Donor). This framework states:
“… the most important prerequisites for PbR success can be summarized in three
points: (a) a good and verifiable measure of something continuous that we really care
about; (b) a recipient that may undervalue the related improvement, has a reasonable
chance of affecting it, and is not excessively worried by the proposed payment
structure; and (c) a donor that is able to design and enforce the contract in a
reasonable timeframe.” Clist (2016, p.309)
Some issues could be discussed under more than one heading, and the terms ‘agent’ and
‘principal’ may not be ideal terms2. However, this simple framework allows a PbR
1 The evaluation document provides three overarching questions, but a large number of smaller questions. Given it has not
really been adopted (objective 3) we propose using Clist’s (2016) MAP framework. This, or its predecessors, has been used in
Clist and Verschoor (2014), Holden and Patch (2017) and a large number of internal documents. 2 In economics these have clear and technical meanings, but some feel they imply an unhelpful mental model.

2
agreement to be thought of according to a simple and memorable acronym (measure, agent
and principle: MAP). This framework helps organise the evidence, as well as testing which
elements of this theoretical framework stand up to empirical reality and allows any areas
that weren’t previously covered to be highlighted.
The important details of the implementation are dealt with in section 5, with a reflection on
different Theories of Change (how PbR actually works) in section 6. Value for Money
considerations are dealt with in section 7. Throughout the document evidence gaps are
highlighted in boxes where they are identified. Section 8 finishes with conclusions and
recommendations. Within each section headings are kept to a minimum, with keywords in
bold helping readers locate specific topics.
1. DFID Projects Table 1 gives an overview of the programmes which comprise the DFID-
generated/supported evidence base for PbR, upon which this synthesis is based. Eleven PbR
projects have been directly managed and contracted by DFID, evenly spread between
Results-Based Aid (RBA, contracting a government) and Results-Based Financing (RBF,
contracting an NGO). A further 8 are larger funds with multiple projects, mainly contracting
NGOs. The funds thus provide more evidence as they each represent multiple projects, and
are also more easily compared.
Unsurprisingly, there is a range of PbR experience within DFID projects: headline results
range from very positive to quite negative. Here I give a sense of the different broad
conclusions of different projects, before examining individual factors.
The most positive completed evaluations come from the Nepal employment fund and the
RBF part of the Post-Conflict Development project in Northern Uganda. In Nepal, the
project aimed to increase employment by providing skills training to young people, and part
of the project was a PbR outcome-based payment to organisations who find their trainees
work. The World Bank evaluation (Chakravarty, Lundberg, Nikolov & Zenker 2016) was of
the entire project (not just the PbR element) versus a control of no intervention, and found a
15-16 percentage point increase in non-farm employment. Average monthly income
increased by 921 NRs (c.12 USD) against a baseline of 1272 NRs (c.17 USD): about a 72
percent increase for the combined 2010-2012 cohorts. The effects were larger for women than
for men, with no obvious evidence of cherry picking. Here, large effects seem to have been
achieved with few apparent problems.

3
Table 1: The DFID evidence base
Who
contracts?
Who gets
paid?
Short Programme Name,
with dates and total programme costs
DFID Supplier
(NGO)
End Child Marriage, Ethiopia (2011-17, £11m)
Family Planning in Kenya (2015-18, £31m)
The Employment Fund in Nepal (2010-15, £13.5m)
Reproductive Health in Pakistan (2012-17, £38.5m)
Results Based Financing in Health, Uganda (2009-16, £100.5m)
The Tanzanian Malaria Voucher scheme (2011-15, £26m)
DFID Government Results Based Aid in Ethiopia Education (2012-15, £27.4m)
Results Based Aid in Rwandan Education (2011-15, £97.5m)
Ghana Health Sector Support Programme (2013-18, £67m)
Tanzania Rural WASH (2014-19, £150m)
Big Results Now!, Tanzania Education (2014-18, £60m)
Budget Support Sierra Leone (2013-15, £43.5m)
A Fund Supplier
(NGO)
Health Results Innovation Trust Fund (2010-22, £114.25)
Girls Education Challenge Fund stage I (2011-17, £355m)
Low Carbon Energy Access Facility (2015-19, £40m)
WASH Results (2013-18, £81m)
Global Partnership on Output Based Aid (2008-2017, £37m)
A Fund Supplier
(Private Sector)
AgResults (2012-24, £25m)
Ideas to Impact (2014-2019, £11m)
A Fund Government GAVI (2010-16, £874m) Note: The table lists the main projects that are at least part funded by DFID. There are several edge cases, where an element
of the project has something that could be classified as PbR, or has at some point been intended to have a PbR element.
Where possible relevant insights have been incorporated.
The evaluation of the Uganda RBF project in health (Valadez et al, 2015) was even more
positive, as the evaluation was able to compare RBF against other projects. While typical
evaluations of RBF confound the effects of additional funding and the contracting
mechanism, the evaluation attempts to separate these by calculating a difference-in-
difference estimate to compare the RBF project to an input-based alternative (essentially
comparing improvements in each case). There was not random assignment but the approach
at least attempts to deal with evaluating the mechanism itself. While the quality of care is a
concern across the board, the evaluation finds the RBF region achieved 50% of the available
performance points, with the more traditionally financed control regions achieving only
20%. In other words the PbR mechanism is associated with performance 2.5 times that of the
more traditional mechanism.
By contrast, a number of evaluations find that PbR had no significant effect. The evaluation
of a project on reproductive health in Pakistan (Witter et al, 2016, p.79) found that “on most
indicators, performance (change since baseline) was either comparable to or worse than in
the control areas.” A similar story can be found with the RBA education projects where
performance was not “reasonably attributable to the RBA pilot” in Ethiopia (Cambridge
Education, 2015, p.iii), and in Rwanda “[t]he quantitative evidence is unanimous in finding

4
that RBA had no consistent effect on completion results” (Upper Quartile, 2015 p.viii). The
Project Completion Report from Sierra Leone’s Budget Support program pointed to the low-
powered incentives as a possible reason why the PbR contract didn’t incentivise governance
reforms (DFID, 2016e, p.5).
While these evaluations provide rigorous insights, it is clear that the majority of DFID PbR
projects are yet to generate the robust evidence of impact that will be most useful in
answering the key questions surrounding the use of PbR mechanisms. Some of the projects
are not expected to generate this kind of evidence (Ghana Health sector and Tanzania’s
Malaria Voucher Scheme). Others are expected to produce evidence (e.g. the Low Carbon
Energy Access Facility, Family planning Kenya, AgResults, Big Results Now! Education in
Tanzania, Tanzania Rural WASH and Ideas to Impact), but this synthesis is simply too early
to use most of those insights.
For a final category, this research is too early to incorporate the final research, but late
enough to benefit from early evidence of effects. The Health Results Innovation Trust Fund
(HRITF) is expected to produce 29 impact evaluations, but seven that are currently available
include many useful attempts to evaluate not just PbR projects but the PbR mechanism itself.
A current summary of the evidence is that while outcome indicators have shown steady
improvements, the impact evaluations so far have shown mixed results (DFID, 2016h).
Likewise the Girls Education Challenge fund has produced a number of impact evaluations
(currently private), but more learning products are expected in the future. Positive results
have been reported in each of the GAVI, WASH Results and End Child Marriage, Ethiopia
projects/programmes, with more robust evaluations expected soon.
2. Measure Clist and Dercon (2014, p.1) argue “[t]he principle factor that should determine whether PbR
is used, and the strength of incentives, is the quality of the performance measure.” The
quality of the measure is in turn judged according to how well it captures something we
really care about, even after it is incentivised. In some cases, measures have been well
chosen and appear to have focused minds on achieving the goal in a beneficial fashion. In
the Zambian HRITF RBF project one health worker explained: their “attitude has really
changed, people used to come late for work, now everyone is on time. We were doing
shortcuts, but now we are doing full procedures.” (Evans, 2016) With the GEC, Holden &
Patch (2017, p.6) argue “[t]he overall focus on learning outcomes and their rigorous
measurement was broadly seen as very positive, a ‘step change’ for some organisations.”
With most evaluations there has been an attempt to assess any cherry picking or gaming,
with the vast majority of cases finding no evidence of any problems. HRITF’s Zimbabwe
(Kandpal, 2016, p.12) state “none of the non-incentivized services investigated showed a
decline in the number of cases treated, as would be expected if task shifting affected these
services.” This is a particularly strong piece of evidence, given good measurement of other
tasks that could have been neglected. (However, the results on the actual indicators aren’t
particularly positively affected, and so it remains unclear how changing the size of the
incentives would have affected both the PbR measures and other activities.) Evidence from
5
the Employment Fund in Nepal (Chakravarty et al, 2016, p.6) suggested the measure itself
discouraged cherry picking as it included greater payments for disadvantaged groups.
There are negative experiences. Across the entire DFID-funded PbR programmes, I have
identified one contract that was terminated “following suspicion of fraud.” (DFID, 2015d,
p.2). This incident does appear to have led to a greater awareness of possible fraud in PbR
cases. However, the more prevalent risk with PbR measures is much more subtle: the
widespread risks of poor quality of measure, i.e. a low alignment between the measure and
what we really care about, especially after the measure has been incentivised. The problems
with the initial GAVI measures have been robustly demonstrated in the academic literature
(see Glassman and Sandefur, 2015 and the references therein). GAVI initially used reliable
self-reported administrative data from each country, but once that data was incentivised
recipient countries had an incentive to over-report vaccination rates3. A more accurate
picture of vaccination rates can be recovered by triangulating vaccination rates from a non-
incentivised source (DHS), here showing the PbR measure was simply disbursing too much
money for the progress achieved. In an important sense the problem isn’t just a weakness in
verification, but is partly inherent to the measure itself4.
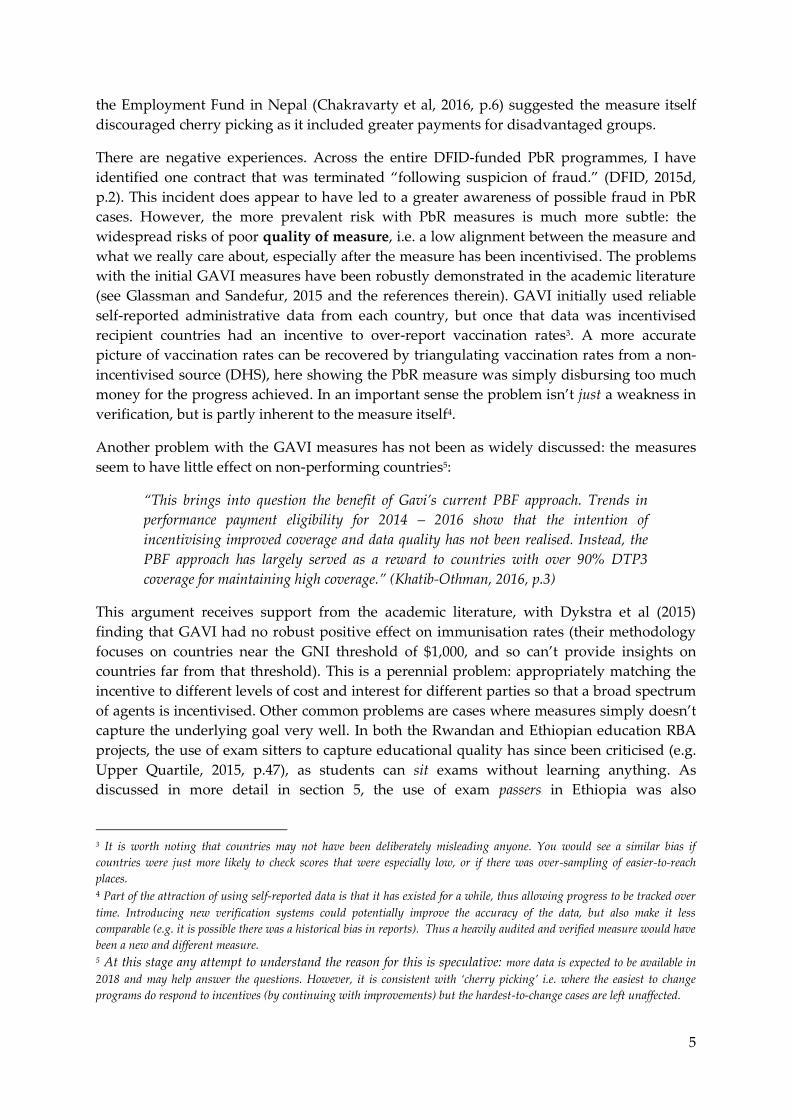
Another problem with the GAVI measures has not been as widely discussed: the measures
seem to have little effect on non-performing countries5:
“This brings into question the benefit of Gavi’s current PBF approach. Trends in
performance payment eligibility for 2014 – 2016 show that the intention of
incentivising improved coverage and data quality has not been realised. Instead, the
PBF approach has largely served as a reward to countries with over 90% DTP3
coverage for maintaining high coverage.” (Khatib-Othman, 2016, p.3)
This argument receives support from the academic literature, with Dykstra et al (2015)
finding that GAVI had no robust positive effect on immunisation rates (their methodology
focuses on countries near the GNI threshold of $1,000, and so can’t provide insights on
countries far from that threshold). This is a perennial problem: appropriately matching the
incentive to different levels of cost and interest for different parties so that a broad spectrum
of agents is incentivised. Other common problems are cases where measures simply doesn’t
capture the underlying goal very well. In both the Rwandan and Ethiopian education RBA
projects, the use of exam sitters to capture educational quality has since been criticised (e.g.
Upper Quartile, 2015, p.47), as students can sit exams without learning anything. As
discussed in more detail in section 5, the use of exam passers in Ethiopia was also
3 It is worth noting that countries may not have been deliberately misleading anyone. You would see a similar bias if
countries were just more likely to check scores that were especially low, or if there was over-sampling of easier-to-reach
places. 4 Part of the attraction of using self-reported data is that it has existed for a while, thus allowing progress to be tracked over
time. Introducing new verification systems could potentially improve the accuracy of the data, but also make it less
comparable (e.g. it is possible there was a historical bias in reports). Thus a heavily audited and verified measure would have
been a new and different measure. 5 At this stage any attempt to understand the reason for this is speculative: more data is expected to be available in
2018 and may help answer the questions. However, it is consistent with ‘cherry picking’ i.e. where the easiest to change
programs do respond to incentives (by continuing with improvements) but the hardest-to-change cases are left unaffected.

6
problematic as it has a norm-referenced system. The Big Results Now! Tanzanian case also
discusses the problems of measures in education:
“The pass rate may not be a good measure of efficiency in this context. The pass rate
has fluctuated markedly over the preceding 5 years due in part to changes in test
procedures. In addition, the pass rate is potentially a game-able indicator, where
schools could, for example, prevent weaker students from progressing to graduation
years, and/or sitting the tests, to artificially improve pass rates without improving
aggregate education performance.”(DFID, 2015a, p.17)
For those on the recipient side of the contract in the Girls Education Challenge Fund, Holden
and Patch (2017, p.36) provide a useful insight: “Respondents perceived there were perverse
incentives from PbR, particularly to prioritise the short-term over the long-term. They
claimed their projects did not respond to these incentives, although sometimes felt
headquarters pressure to do so.”
An issue that was not well foreseen in the theoretical literature but is now clear is the extent
to which measures will fail to incentivise recipients simply because they are too complex
relative to the incentive size. This is clear from agreements with individuals (see the HRITF
agreements in Afghanistan and Cameroon discussed in Kandpal, 2016, p.7), NGOs (Holden
and Patch, 2017, p.6) and Governments (see the education RBA agreements with Ethiopia
and Rwanda discussed respectively in Cambridge Education, 2015 and Upper Quartile,
2015). Even apparently simple measures are not considered worth the investment to really
understand if the attached payment is sufficiently small.
The question of the size of the incentives on offer is a delicate balance. It is clear from the
theory that only a good measure can bear large incentives without problems (Clist &
Dercon, 2014, p.1). Beyond that there is a balance between having incentives that are large
enough to incentivise a recipient and small enough to be both value for money and not
encourage gaming, fraud or ultimately unproductive activities (Clist & Verschoor, 2014,
p.22-27). A common theme for projects with poor performance (as listed in section 1) is low-
powered incentives (e.g. both RBA education projects). In line with theoretical predictions, it
appears that NGOs perceive incentives to be higher-powered than governments, as they
themselves are smaller and more risk averse. As such, the 10% PbR element was felt to be
sufficiently large for NGOs in the GEC (see Holden & Patch, 2017), but the 100% PbR
element of multimillion pound agreements were too small for some recipient governments
(e.g. on GAVI, see Khatib-Othman, 2016, p.3). An interesting case comes from the HRITF:
“Indeed, the strongest evidence for sustained impacts from RBF comes from the
Misiones province, where the increase in incentives was substantial—threefold. It
may also be the case that the signaling effect of an incentive introduced by a health
system in an environment that previously did not incentivize individual services may
be somewhat more effective at changing behavior than the income effect of the
relatively small incentive amount offered.” (Khandpal, 2016, pp.14-15)

7
The last aspect of the measure is that the verification process needs to be reasonably
straightforward and cost effective6. In the current evidence available, verification is often felt
to be expensive. The annual review from the WASH Results Programme (DFID, 2016b, p.5)
argues that “a solely [i.e. 100%] PBR model may generate verification inefficiencies”, having
found traditional verification cycles to be expensive without providing improvements in
data quality. They are now moving towards an approach that may be characterised as a
lighter touch verification of data systems (using site visits) as opposed to verification of data
points. They also suggest that using PbR for only a proportion of the project would ease the
costs of verification. There are similar concerns with respect to the HRITF project:
“Verification in many LMIC RBF cases often extremely heavy, costly, intensive…raising
questions of sustainability” (Kutzin, 2016, p.12), but the considered possible response is
different (a risk-based verification process – for more, see Cashin et al, 2015, p.32). The
practicality of verification in the contexts in which DFID seeks to work are often questioned;
Holden and Patch (2017, p. 6) concur “[t]here were also concerns around the complexity of
assessment and the capacity of evaluators to enumerate them properly.”
The experience is in contrast to how verification was envisaged. Birdsall & Savedoff (2011,
p.59) argued that “reporting and verification also provide incentives to improve education
data” (emphasis added). More recently, Barder et al. (2014) argued that verification should
be cheaper than alternative systems (input tracking) and will lead to benefits of better
information: “The focus on results need not be more expensive in terms of staff or money
than the detailed tracking of inputs which it replaces, and because it focuses on outcomes it
may provide much more useful information.” The optimism that verification costs are lower
and offset by benefits in information appears naïve in the face of current reality. There is no
evidence so far that verification strengthens standard data gathering procedures7: they are
typically standalone efforts in order to have the necessary confidence to pay out upon a
contract. Where standard data has been used (e.g. GAVI, Ethiopia RBA, Rwanda RBA) there
is evidence that the quality of the data reduced (respectively Sandefur & Glassman, 2015;
Cambridge Education, 2015; Upper Quartile, 2015), as would be expected (Clist, 2016 and
references therein). It is of course possible that in time some of the verification costs can be
reduced (as better measures are identified) or that those costs will be offset by standard data
sources improving in quality, but at the moment verification is often felt to be a substantial
cost with few redeeming benefits.
Of course, it may be that verification is much like insurance: the benefit of which is not felt
by implementing teams unless there is a problem. The Tanzania Malaria voucher scheme is a
good counter example, as it is possible that greater investment into early verification would
have uncovered problems in the project earlier.
One consistent and positive aspect of the evidence is the realisation of the importance of the
measure itself. Lessons from the HRITF include that “[u]nderstanding of which are the most
appropriate indicators to incentivise still an issue.” (DFID, 2016h, p.9) Furthermore, notes
from a recent WHO (2016, p.5) meeting records that “[i]t was highlighted that fee-for-service
6 Of course, these are not the same as easy and cheap. 7 One possible future exception to this comes from the Rural WASH programme, which is attempting to strengthen existing
data systems. However, it is too early to say whether this will be successful.
8
arrangements needed to be revisited and ways to better measure and incentivize service
quality were identified as important.” As the PbR evidence base is relatively young, the
increased focus on the measure itself is welcomed.
3. Agent The agent (recipient government or implementing organisation) is the area with the least
amount of evidence from current PbR projects, mainly as it has the smallest amount of
variation. On risk aversion, there is some evidence that the NGO’s dealing with the Girls
Education Challenge fund took fewer risks (i.e. become more risk averse) because of the PbR
contract (Holden and Patch, 2017, p.7). On recipient control8, there is some evidence of cases
where PbR failed because the recipient had limited ability to affect the outcome (e.g. the
Afghanistan project in the HRITF discussed in Kandpal, 2016). On alignment9, this ‘first
generation’ of PbR contracts has tended to select recipients which were felt to be more
aligned, and so there is little variation that could generate evidence of the effect of different
levels of alignment. For example, Holden and Patch (2017, p.36) state that in GEC, “[p]roject
staff are generally very motivated to achieve outcomes, and this is not linked to the payment
incentive for those on PbR projects.” Likewise in Rwanda, the government was felt to
already be focused on increasing enrolment (Upper Quartile, 2015). By contrast, the evidence
base provides no ready examples of cases where DFID was trying to incentivise recipients
that had fundamentally different objectives. On the time horizon of recipients, there is an
indication that some recipients were overly focused on the short term. For example in the
WASH Results project, some suppliers only considered outcome phases after output
delivery, meaning that an incidental design decision to include different phases resulted in
suppliers neglecting the most important longer-term elements (DFID, 2016b, p.4). On each of
these aspects, theory predicts that these will influence the effectiveness of PbR projects, but
there simply isn’t sufficient variation to examine their effect in practice.
8 This means the degree to which the recipient has the ability to affect the targeted outcome, which is thought to be positively
correlated with suitability for PbR – see Clist & Verschoor, 2014, p.7 for details. 9 This means the degree to which the aid donor and recipient share commons goals, which is thought to be negatively
correlated with suitability for PbR – see Clist & Verschoor, 2014, p.5-6 for details.
Evidence gap: measures that work well in different sectors.
Report 3 discusses how the sector-specificity of PbR knowledge is over emphasised, and
that point has been reflected in this report. However, the exact nature of the measure is
one area where knowledge is inevitably sector-specific. As discussed at length in the
objective 1 report, the health sector evidence is much more developed than those in
other sectors. As such, when designing a new PbR health project there is a range of
experience to draw on.
Outside of health, the number of measures used is small, and clearly some measures are
not found to work well. At present, there is a small number of established measures that
can be used to inspire other projects: a gap which needs to be filled.

9
One characteristic of an agent that has generated evidence is around the effect of PbR on
motivation (in the theoretical literature, these discussions centre around the concepts of
intrinsic and extrinsic motivation). This is more of an issue where those incentivised are
individual staff, and so most of the evidence comes from the HRITF which mainly used
supply side incentives in the health sector. The most negative effect was found in the DRC,
as design problems and poor decision making caused an average 34% drop in take home
pay (Kandpal, 2016, p.9). In Zimbabwe motivation seems to have been negatively affected,
with staff reporting a greater likelihood of burnout in RBF areas. A more positive effect was
found in Afghanistan, where there was a perceived boost in motivation. An evaluation in
Zambia “found large gains in health worker satisfaction and staff motivation” (Kandpal,
2016, p.12). Evans (2016) argues (with a specific focus on Zambia) that this works not
through pecuniary interest but rather in simply being recognised in a context where workers
feel undervalued. A last example of positive motivation comes from the final year PCR of
the Ethiopia RBA, where incentives were passed on to the school level in some regions:
“there appeared to be broad support for this ‘reward for performance’. It was cited as being
a positive motivating factor for teachers and school administrations, and in some cases
regional bureaus” (DFID, 2016c, p.13) The current evidence on motivation is thus suggestive:
there are some instances where PbR schemes have seen increases in motivation. The
forthcoming HRITF evidence should be able to further investigate this effect.
4. Principal The principal10 (i.e. the donor) will clearly affect the effectiveness of any aid program, but
there are a number of specific ways that they may do so in a PbR project. One important
aspect will be whether they are able to withhold aid from non-performing recipients, as if
they are not then there is little incentive for recipients to expend extra resources in order to
meet these targets. Amongst others, Svensson (2003) showed that aid donors typically found
it difficult to withhold aid in ex ante conditional aid agreements, and so it is possible that
assumptions they will be able to do so in PbR contracts are misplaced.
The current evidence is mixed. From the Girls Education Challenge Fund we see that NGOs
didn’t doubt the ability to withhold aid:
“Project staff generally understood the PbR risk, and saw the threat as credible that
DFID would be willing to hold back PbR lost on the downside. Head offices were
10 With fund-managed programmes, it is possible to see the fund manager as the principal, or even to analyse the relationship
as what in economics would be a called a principal-supervisor-agent problem. We don’t focus on this issue here given the
lack of good evidence to discuss the issues at hand.
Evidence gap: the effects of an agent’s risk aversion, control, alignment and time horizon.
The theoretical evidence (Clist & Dercon, 2014; Clist & Verschoor, 2014) suggests that
each of these factors help determine whether PbR is better than alternative options.
However, the current DFID evidence base does not contain enough variation in these
dimensions to robustly test whether these theoretical insights are empirically valid.

10
more concerned about the PbR downside risk than local offices, and in some cases this
put significant pressure on organisations, as one stated it was a ‘sword hanging over
our heads’.”
Likewise, in the Global Partnership for Output Based Aid (2016, p.13), a report into the
energy sector states that early OBA pilots had lower percentages of disbursement, which
sent clear messages to non-delivering implementing partners, in effect demonstrating the
ability to withhold. These positive experiences seem more typical with Fund-managed
programmes, with the final destination of non-disbursed funds often somewhat unclear
when the agreement involves DFID field offices, who naturally don’t wish to lose control of
unspent funds. For example, with RBA in Rwanda “it is not clear how the unspent funds are
used.” (Upper Quartile, 2015, p. 44) and in the Family Planning project in Kenya
“Spending flexibility tends to get suppressed with OB contracts and as a result they
are not ideal in a context such as DFID’s where spending pressures tend to be the
norm, e.g., when there are requirements to spend more or less such as those associated
with ODA or quarter 4 spend.” DFID (n.d.)
One of the claimed benefits of PbR (Birdsall and Savedoff, 2010, pp.21-22) is that it enables
recipients greater flexibility and autonomy to achieve the targets in different ways.
Previous evidence has questioned whether this link genuinely exists, e.g. Honig (2014)
found autonomy was not linked to PbR contracts in World Bank projects. The emerging
evidence from the HRITF is useful here: “[a] common theme in the results from Argentina,
Afghanistan, Cameroon, Zambia and Zimbabwe is that RBF schemes effectively improve
autonomy at the facility level” (Kandpal, 2016, p.13) and “[e]xamples of institutionalizing
RBF in the context of Burundi or Rwanda provide strong evidence on the need for facility
autonomy. They also show the importance of PFM reforms in ensuring that RBF moves
beyond the program stage.” (WHO, 2016, p.4) The Burundi example is perhaps particularly
interesting as it demonstrates the ability of RBF to empower frontline providers in fragile
contexts.
Outside of the experience with the HRITF, there is scant evidence that PbR has allowed for
greater autonomy. The main limiting factor here appears to be DFID’s own systems. In the
Family Planning project in Kenya, the difficulty is reported by DFID (n.d.) “… as a result of
[the] tension between the desired flexibility/adaptability and compliance, e.g., attempts to
revise ToRs in line with changes in the programme can contravene procurement policy.”
Holden & Patch (2016, p.7) report a similar experience with the Fund-managed Girls
Education Challenge Fund “…the process for making changes on the GEC, in terms of
milestones, outputs and budget amendments, was felt by some to be too time-consuming
and cumbersome and a barrier to adaptation.” This appears to be a major factor in why there
was not a higher level of changes and adaption amongst GEC projects that had PbR
compared to those that didn’t.
A common theme across the projects is that current PbR projects have been subject to both
the expectations of PbR projects to be innovative and the standard procedures of more
traditional aid modalities. Occasionally, these are augmented by new financial procedures,
due to the contractual nature of PbR agreements (e.g. the GPOBA has seen “slow
disbursement patterns following the issue of legally binding contracts”, DFID, 2017, p.13).

11
These dual requirements have tended to undermine possible gains in autonomy and
innovation. To rehearse the arguments, one hope for PbR is that it enables recipients of aid
monies to innovate and discover through trial and error the most successful way of
delivering the contracted results. Current evidence shows that autonomy (e.g. in the HRITF)
is the exception rather than the rule. Holden & Patch (2017, p.7) are somewhat typical in the
discussion of the Girls Education Challenge Fund: “a consistent view emerging from the
study is that PbR did not incentivise innovation, and more likely had the opposite effect,
leading organisations to be more risk-averse”
Closely related to incentivising innovation is the length of the contract – a donor that is able
to contract over a longer time horizon is predicted by the theory to see greater innovation
(as the rewards for successful innovation are captured for longer, and the feedback loop
works a greater number of times allowing successful adaption). Here too, current evidence
on PbR is not positive in terms of the design of projects. The main reasons given for non-
impact in Ethiopia’s education RBA were the relatively small incentive of the project,
especially in comparison to its complexity and duration (Cambridge Education, 2015, p.v). A
similar story is found in the Rwandan RBA: “While RBA was perceived to be a small
amount of money, it is possible that the reason it did not receive a greater response was
more due to the short length of the agreement” (Upper Quartile, 2015 p.46) The Big Results
Now! Education project in Tanzania echoes this, where there was felt to be a mismatch
between the timeframe agreed and the necessary timeframe needed to really affect change.
Also in the education sector, Holden and Patch (2017, p.7) found in the Girls Education
Challenge Fund that “[p]roject staff perceived potential perverse incentives from PbR,
particularly to prioritise the short-term over the long-term.” Presumably, a longer agreement
would ease this pressure. In the discussion, it is worth noting findings in the broader
literature where incentives worked in the short run but not the long run (Muralidharan and
Sundararaman, 2011; Olken, et al. 2014). Unfortunately, the current DFID evidence is only
able to offer examples where non-impact has been related to short time horizons, but there
simply aren’t robust examples of longer term agreements to see whether this is related to
more successful PbR outcomes. It is possible this will change in coming years with various
prizes (e.g. AgResults and Ideas to Impact) and the GAVI agreement amongst a handful of
others, but often these aren’t longer term agreements of a single measure (i.e. with multiple
pay out rounds).
One consequence of the difficulty of enabling adaption is that the quality of the original
plans have a greater weight in determining the effectiveness of a PbR project. This relates to
a discussion by Clist (2016, p.309), who argues donors may need more information when
designing a successful PbR project than for a more traditional project. While in theory PbR
Evidence gap: longer term contracts with one tariff in place.
This is discussed in more detail in section 6, but the basic insight is that part of the
rationale of the original Cash-on-Delivery Aid idea (Birdsall and Savedoff, 2010) is that
an agreement would allow for multiple feedback loops as payments were made against
a single measure multiple times. This allows a recipient to try different strategies,
receive feedback on their performance and adapt accordingly. At the moment, the
current DFID evidence does not contain evidence that enables a robust test of this idea.
12
means a greater ability to innovate (see the discussion of the fourth theory of change in
section 6), in practice current PbR often has time horizons that are too short (see section 4)
and incentives of the wrong level (see section 2; they need to be not so low that achieving the
goal is not worth the investment, but not so high that risk aversion precludes innovation).
The evidence emerging from HRITF is also worth examining a little further here, as it
emphasises the need of PbR to successfully identify (and incentivise) bottle necks in order to
really achieve underlying goals. Kandpal (2016, p.13) discusses the case of Afghanistan,
where insufficient attention to demand side factors explain the failure of supply side
incentives to work as planned. Here, it appears PbR successfully incentivised the recipient,
but the wrong constraint was targeted, and so the recipient was unable to achieve the
desired goals. Even with a PbR contract that was able to provide a degree of autonomy, the
recipient was hamstrung by a project design that didn’t target the binding constraint. This is
not a criticism of the original design work – it is not obvious where such constraints are. The
sheer time-cost of this design work was recognised with respect to the family planning
project in Kenya: “[d]etermining desired outputs can be time consuming and
administrative-heavy given inputs required from DFID programme teams, PCD and
suppliers.” (DFID, n.d.)
5. Implementation The MAP framework is focused on the theoretical and conceptual elements of a PbR project,
but there are a variety of issues of implementation that will also affect the success of PbR
projects. The difficulty of implementation is consistently found in the PbR evidence, with
general design problems a common feature11. The HRITF (Kandpal, 2016, p.15) evidence is
generally positive, but “[t]he early evidence also highlights that RBF mechanisms are not
always easy to implement and have been associated with implementation failures that result
in less effective programs.” As an example, in the DRC (Kandpal, 2016, p.9) “… the
implementation of the program deviated significantly from the intended design of the
program” Effectively, the PbR group reduced their prices but didn’t increase demand and so
lost money compared to the control group: with lower earnings of 42% for treatment
facilities and 34% for health workers. These large drops in income damaged motivation for
staff and reduced the ability of facilities to operate effectively. In the WASH Results
programme (DFID, 2016b), the design of the projects seemed to miscommunicate priorities:
“The programme did not envisage suppliers only considering outcomes after output
delivery… DFID staff will review how the structure of the programme was communicated
to the suppliers and how this could have been made clearer to avoid a perception that
outcomes should not be considered from the outset.”
Implementing the pre-agreed measure is a consistent challenge. Holden and Patch (2016,
p.6) state that “… learning and attendance had an equal focus on the programme, but due to
measurement issues, projects in 2014 were given the choice to remove attendance as a PbR
outcome.” In Rwanda’s education RBA the test of teacher’s English used for part of the
payment was not comparable across years (a different test was taken in different conditions),
11 While difficult to quantify, my judgement is that these are currently more prominent than in DFID’s non-PbR projects.

13
and so while it was paid out upon it had no robust ability to measure improvements (Upper
Quartile, 2015, p.25). In other cases problems of implementation were baked into the design
of the program. For example, in Ethiopia’s RBA, DFID (2016c) states that “[i]nvestigation by
the Project Completion Review (PCR) team and DFID Ethiopia advisers suggests that the
pass rate for 2014/15 was due to a change by the National Exam Agency (NEA) in the
statistical process for calculating pass rates.” (The RBA contract agreed payment for
improvements in the quality of the education.) However, the larger issue was that exams in
Ethiopia are effectively ‘graded on a curve’, and so pass rates should (theoretically) be
consistent regardless of the quality of each cohort. In essence a measure that should not be
able to change was selected in order to incentivise improvements. The above quote
illustrates that this measure then did improve markedly, but this cannot be related to a large
improvement in actual quality.
It is important to understand the degree to which these design flaws were avoidable (or
greater than usual). If they were mistakes that are related to inexperience with PbR
mechanisms, these problems are likely to reduce. Alternatively, they could be an inherent
feature of PbR contracts. Current evidence implies that PbR contracts are currently more
difficult to design, and need a greater investment of time to design than traditional forms of
aid (DFID, 2014, p.3). However, it is unable to answer the question of whether these skills
will be acquired, as only time will reveal any design flaws of PbR’s ‘second generation’.
Related to the difficulty of PbR design is the amount of staff time required to manage these
projects. A quote related to the Delivering Increased Family Planning Across Rural Kenya
project illustrates the tension between the promise of PbR and current reality:
“With the right amount of thinking around the deliverables at the outset they can be
administratively easier to manage thereby reducing the pressure associated with
contract management. This is mostly just a perception however since experience so
far shows that such contracts tend to increase pressure.” (DFID, n.d.)
In the Results Based Financing for Low Carbon Energy Access project, there were difficulties
in finding the required partners:
“… it had been challenging sourcing financial institutions who are sufficiently
skilled and interested in participating in the RBF schemes, and in sourcing external
Evidence gap: whether design and implementation flaws reduce over time, and how important
these flaws are relative to other programmes.
The current evidence base provides several examples (discussed above) of design and
implementation problems, with the impression that these are more problematic than in
other projects. However, given the novelty of these kinds of PbR, such problems are not
particularly surprising, as they had few projects to learn from.
Only in time (once robust evaluations are available from the newer round of PbR
projects) will it be clear whether these design and implementation problems are just
because PbR is a new modality, or whether they are an inherent feature of PbR.

14
verifiers across the three case studies, demonstrates that markets cannot be expected
to provide the skills base required for RBF delivery.” DFID (2015b, p.6)
While some of these difficulties can be targeted by altering the PbR approach (as has
happened with the Results Based Financing for Low Carbon Energy Access project), the
above quote highlights the difficulties encountered as PbR requires non-standard partners.
More generally, the Results Based Financing for Low Carbon Energy Access project seems to
have been subject to an optimism bias, where the implementation had consistently been
more challenging and time consuming than anticipated: “there has been a greater
requirement for management input at country office level due to the higher-than-anticipated
complexity of design and mobilisation, and the on-going inputs required to facilitate
delivery.”(DFID, 2016d) Similar findings related to the GPOBA and several others.
6. Four Theories of Change: How
PbR works in Practice The preceding discussion separately analyses different aspects of a PbR design and its
implementation. Here I bring together these different elements, and consider the evidence as
a whole. The theoretical framework of Perakis and Savedoff (2015) is a useful vehicle for this
as it summarises four different theories of change as to why PbR might work: pecuniary
interest, increased attention, accountability (towards constituents) and greater recipient
discretion.
First, pecuniary interest refers to the idea that recipients will respond to the financial
incentives, switching their efforts in order to achieve the targets of the donor in order to
achieve the extra payment. This idea comes from a standard principal-agent model (for
more, see section 1 of Clist and Verschoor, 2014 and Savedoff, 2010), where the two parties
are not aligned, the ‘performance contract’ is an effective way for the donor to influence the
activities of the recipient. The evidence does provide ready examples that chime with this
analysis:
• The HRITF’s largest incentives (in the Misiones province) provide their strongest
evidence of success.
• The Employment Fund in Nepal where organisations responded to the incentive to
increase employment, not just training.
• The Uganda RBF Health project, where the incentivised quality of care increased
against a control.
There are of course many cases where PbR incentives didn’t lead to success, but even some
of these point to the pecuniary interest being a sensible description of how recent DFID PbR
projects have and haven’t worked. In many cases where PbR contracts were found not to
work, the incentives were too low, the agreement too short term, or the recipient simply
wasn’t able to affect the outcome despite effort. In short, the pecuniary interest theory of
change receives support from the current evidence base.
Second, the idea of increased attention is that PbR measures gain importance for the
recipient simply by being incentivised. It could be that the size of the incentive is small, but

15
the signal that is sent is valued by all involved and so it receives greater attention. Evidence
here is also fairly supportive: the Girls Education Challenge Fund saw many NGO’s focus
on measures that were ultimately of relatively little financial importance. Likewise, health
workers in the HRITF appear to be exerting a disproportionate amount of effort for a
relatively small financial bonus. From a purely pecuniary perspective, it would often be
more rationale to forgo the payment and maintain a low level of effort, given the costs and
benefits involved. However, the evidence does support the idea (Clist & Verschoor 2014,
p.7-8; Clist, 2016, p.294) that organisations and individuals can be motivated by even very
low-powered incentives. In short, low-powered incentives can still provide feedback on
their performance with can become a focus in lieu of other information. Furthermore, for
small risk-averse NGOs a small difference between success and failure can appear much
more important.
Third, the idea of accountability is that recipient organisations or governments will be
influenced by beneficiaries and constituents, who respond to greater available information
and improve delivery by influencing the recipients. The current evidence base doesn’t
contain any projects that are directly motivated by this theory of change, but even then the
evidence does not suggest much store should be put by it. One policy maker in Rwanda
described the situation aptly with regards the RBA Education program:
“It is ok for the media to know [the results]. But what will they use it for? One of the
careers that lags behind in this country is journalism… I’m not sure the journalists
would use them [the statistics] properly” (Author’s own notes)
On current evidence it appears naïve to expect PbR projects to strengthen the hand of civil
society and journalists that are working towards greater accountability to citizens and good
governance in general12. Of course, it may be that future PbR projects will be designed
differently and ultimately disprove this view.
Fourth, the idea of greater recipient discretion is motivated by ideas of innovation and
reducing tracking of financial inputs. The current evidence base states that where PbR has
been found to be successful, autonomy has often been given as a key reason. Too often
however (see the discussion of flexibility and autonomy in section 4), contracts appear to be
too restrictive and short term to lead to autonomy, let alone innovation.
PbR: Big and Small
The evidence can be arranged in different ways, but I suggest that two different approaches
to PbR are beginning to emerge from the literature. These ‘sweet spots’ can be thought of as
big and small versions of PbR, and are described below.
12 That is not to say that media and civil society have no role in good governance or increasing accountability (indeed, see
Myers, 2012 for a summary of relevant evidence), merely that PbR projects have not been part of this experience so far.

16
Table 2: Two Types of PbR
‘Big’ PbR ‘Small’ PbR
Measure
High powered incentives
Excellent quality measure
Complexity allowed
Costly Verification allowed
Low powered incentives
Fair quality measure
Very simple measure
Requires cheap verification
Agent Mostly Governments or Private Sector
Needs reduced input tracking
Needs low cost to change to plans
Mostly NGOs or Private Sector
Standard procedures less harmful
Donor Longer term agreement required,
with multiple pay-outs on one measure
Requires good design of measure
Requires strong ability to withhold
Shorter time horizon allowed,
changes less damaging
Requires good design of intervention
Ability to withhold less crucial
Theories
of Change
Pecuniary interest
Recipient discretion
(Accountability)
Attention
(Accountability)
Table 2 is obviously a simplification of the evidence, and many of the implementation
details discussed earlier are crucial. However, it provides two sensible combinations of
different factors that are both logically coherent and have emerging empirical reasons for
considering. ‘Big’ PbR most closely resembles what has been discussed as ‘Cash on Delivery
Aid’ (Birdsall and Savedof, 2010). Some of the elements are necessary to ensure there is a
possibility for success of this kind of PbR, whereas others are secondary issues that may
affect the level of success but do not preclude it. Required elements include an excellent
measure of something we really care about, which is incentivised for a long enough period
of time13 and at a sufficient level, with enough administrative space to search for the right
approach. Secondary issues here include a measure that is difficult to explain or a costly
verification process. A measure that is very complex does not undermine PbR here as the
incentive to truly understand the process is there, and enough time is available to respond to
feedback. Likewise, a costly or difficult verification process doesn’t necessarily undermine
this type of PbR as the cost if offset by less tracking of inputs and/or the lower cost of
changing approaches.
The evidence base so far does not provide ready examples of big PbR projects, with a
question hanging over whether DFID (and other donors) are really able to design and
13 A longer time horizon means a greater degree of reward once an agent (aid recipient/implementer) discovers a successful
approach, and so incentivises investment in discovering that approach (Clist & Verschoor, 2014, p.20). Furthermore,
multiple payments are needed in a ‘big PbR’ project to act as feedback to the agent so they can refine their approach (see
Birdsall & Savedoff, 2010). This second reason (multiple payments on the single measure) is why the prizes in the
AgResults and Ideas to Impact programmes cannot be considered prototypical ‘big PbR’ approaches.

17
implement this kind of PbR in the real world, given real constraints. Most projects that are
close to this kind of PbR fall down on elements like the time horizon or the permitted
autonomy for the recipient, with evidence often pointing to the ways in which these projects
don’t fit the model as a reason for a lack of success. In this way, much of the evidence for
this kind of PbR remains negative, meaning projects that lack these characteristics are found
not to work, and the absence of these characteristics are often pointed to as crucial.
By contrast ‘Small PbR’ has several examples, including the Health Results Innovation Trust
Fund, the Girls Education Challenge Fund, WASH Results, Low Carbon Energy Access
Facility, End Child Marriage Programme (Ethiopia) and so on. These kinds of projects
essentially see PbR as a small element of their overall project, and mostly use measures that
capture something indicative of success rather than measuring success itself. The evidence
for these projects is often difficult to assess as they are bound up in the programme as a
whole. Where PbR is well designed and a genuine bottle neck has been identified, PbR
appears to bring greater attention and focus on the results and adds value to the project.
There is also some, limited, evidence of an increase in motivation, but in general the
mechanism appears to be one of higher attention. Where the programme is poorly designed,
PbR is unable to overcome that difficulty. In essence, with ‘small PbR’ its success or failure
is bound up in the overall project, and relatively poor measures are less problematic than
they would be in ‘big PbR’ as they use low-powered incentives. Therefore, requirements for
‘small PbR’ are that the project is well designed, the PbR element is well targeted and that the
additional costs of PbR (including the verification, difficulty of explaining to the recipient,
risks of gaming, and management) are small.
To restate the above caveats, this characterisation of the evidence into two ‘sweet spots’ is
clearly a simplification, and this is not meant to exclude other kinds of PbR (e.g. the use of
prizes as discussed by Clist & Dercon, 2014, p.2, for which there will be more DFID-funded
evidence in the near future). However, the evidence base is suggestive that this is a
reasonable characterisation: either in a positive sense (i.e. where PbR is found to be
successful, it resembles ‘small PbR’) or negative sense (i.e. when PbR isn’t successful, often
the missing elements of either big or small PbR are cited in independent evaluations). One
way of thinking about these two approaches is that one tries to maximise the benefits of PbR
based on a good measure (big), while the other seeks to minimise its costs based on a
measure that is imperfect (small).
Evidence gap: I cannot identify any prototypical ‘Big PbR’ projects amongst current DFID
projects.
There is an impressive range in the type of PbR project funded in the current DFID
evidence base, with variety in the agent (government, NGO, individual), measure, sector
and time horizon. However, I cannot identify any individual DFID project that adheres
to the definition of ‘big PbR’ set out above. It may be that such projects are simply hard
to agree, with longer term agreements a clear difficulty. This finding in itself is
illustrative of that difficulty. However, whether ‘big PbR’ projects can be successful
cannot be answered using the current DFID evidence base.

18
7. Value for Money Originally, it was envisaged this report would be able to compare the value for money of
different PbR projects, highlighting types of PbR project that are associated with better or
worse VfM (What is the value for money of different types of PBR instruments?). Currently, the
evidence base is simply not developed enough for such statements. Instead, this section
serves to collate some of the insights gained from exploring VfM in different contexts. These
mainly deal with the fragility of conducting a VfM assessment of a PbR project.
Of course, assessing value for money is a complicated and contested exercise with any
development project (DFID, 2011, provides DFID’s guidance). Of the DFID projects and
programmes that do report VfM analysis there are generally positive findings. For example,
in the HRITF’s Zimbabwe project “the cost-effectiveness analysis finds the intervention to be
highly cost effective; indeed, it is as cost-effective as a single-purpose MCH intervention,
even without accounting for broader health system benefits.”(Kandpal, 2016, p.12, emphasis
added) Ethiopia’s End Child Marriage project had an estimated discounted benefit to cost
ratio of 2.6. The Employment Fund in Nepal saw a (non-discounted) return on investment of
an incredible 73% (Chakravarty et al., 2016) GAVI gave an even stronger cost-benefit ratio of
between 18:1-44:1, depending on whether all or only direct benefits were included (DFID,
2016i, pp.2-3). There were also signs in the GAVI project of strong economy, with a 43%
reduction in cost of some vaccines (DFID, 2016i, pp.2).
However, many of the above evaluations deal with entire projects and so don’t give PbR-
specific VfM calculations. Where the VfM evidence is positive, PbR can provide compelling,
even incredible, VfM claims. A good example of this type of VfM calculation comes from
outside of DFID’s own projects, and is provided by Muralidharan and Sundararaman (2011)
who calculate a cost/benefit ratio of between 1:16 and 1:185. In other words, Muralidharan
and Sundararaman (2011) claim that for every pound spent on the project, benefits could be
as high as £185. This kind of VfM answer comes from the very specific way in which PBR
concepts map onto VfM calculations. Within a DFID project this can be seen most clearly in
the Ethiopia (DFID, 2016c) example:
“… the independent evaluation team nonetheless were able to construct a break-even
analysis. This looked at the additional costs of the RBA intervention over and above
costs that would have been accrued under traditional sector budget support
programming. It then calculated what the RBA incentive effect would need to deliver,
in terms of additional sitters and passers, for the benefits to those students to justify
the additional costs. They found that if around 300 extra students each year passed
the exam as a result of the RBA incentive, the programme’s benefits would outweigh
its costs. This is an extremely small increase – equivalent to around 0.03% of total
students sitting the exam each year.”
While all VfM exercises build on a series of assumptions, with PbR different assumptions
can lead to wildly different conclusions. The independent evaluation report from the same
project just discussed above argued (Cambridge Education, 2015, p.51) that it was not
possible to conclude RBA was value for money as there was no evidence of any additional
19
performance: a stark contrast. The other education RBA, in Rwanda, had a more developed
VfM framework:
“The value-for-money exercise was ground-breaking, in that it applied standard VfM
tools to the innovative RBA instrument. The naive interpretation shows that RBA
was excellent value for money. However, the assumptions underpinning this result
were found to be problematic: for example that RBA caused increases in completion
and that these extra exam sitters were no different from other exam sitters. Both of
these assumptions may undermine the value for money case for RBA in this
particular setting. In terms of the disbursements, we are confident that the
performance at P6 and S6 would have happened anyway. Furthermore, funds were
disbursed for English improvements which may not have occurred.” Upper Quartile
(2015, p.ix)
In Rwanda a naïve case could be made for excellent VfM (as in the Ethiopian case above),
but the scepticism of the underlying assumptions led to DFID (2015e, p.26) concluding
“[g]iven additional costs of managing RBA with limited additional benefits, RBA was not as
good VFM as either straightforward sector budget support or non-budget support financial
aid.” Other costs mentioned in the final assessment, which are not present in the naïve VfM
calculation are the costs of volatile aid inflows that lead to worse planning for the recipient
government, the verification, and the opportunity costs of significant advisory inputs to
negotiate and manage the pilot. The additional administrative costs incurred are stated to
be £900,000, while other costs aren’t estimated.
The theme of high management costs is consistent (and touched upon in section 5), even
with fund-managed PbR programmes. For the Low Carbon Energy Access Facility there has
been a challenge in keeping management costs to 20%, with initial and on-going inputs
required to facilitate delivery (DFID, 2016d, p.2). The GEC annual review raises some
questions over whether the fund managers cost of 10% of the project (a total cost of around
£6.2m) really delivers value for money (DFID 2016j, p. xxix). In the case of the GPOBA, the
staff cost is given as the main rationale for stopping funding of the program (DFID 2016 p.1).
From a VfM perspective it is particularly difficult to capture the cost of unanticipated staff
time, meaning the cost side of PbR programmes is sometimes understated. As it stands,
there simply isn’t enough evidence to have clear conclusions on whether high management
costs for PbR are good value for money (through delivering greater benefits) or not, but the
emerging evidence contains several examples where management costs are higher than
envisaged.
Returning to the question of additionally, another inconsistency in different VfM
calculations is how results in a PbR project are handled. In short, there are often times when
results have been achieved, but this seems to have little to do with PbR. The Reproductive
Health in Pakistan project was seen as good VfM and well rated, but the evaluation found
no significant effects of the program.
“For most of the indicators, the intervention groups were either comparable to, and in
some cases, worse than the control areas. This finding was surprising given that
programme data had indicated that the programme was improving access and
utilisation to reproductive health services, particularly for those living in rural areas.

20
Furthermore, the programme had scored well at annual reviews for achievements
against its logframe targets, including a mid-term review led by a team of
independent consultants in 2015.” DFID (2016g, p.1)
With HRITF it is too early to say for sure, but there isn’t an entirely consistent picture
coming from headline results and evaluations. An internal DFID (2016h, p.8) summary of
the current evidence stated that “[o]utcome indicators have shown steady improvements but
the impact evaluations so far have shown mixed results.” Echoes of this are found with
GAVI, as reported by Khatib-Othman (2016, p.3): “…countries that received a performance
payment in the past year(s) are more likely to receive subsequent performance payments
(Burundi, Laos, Nicaragua, Rwanda, Sudan and Tanzania). Countries unable to improve
consistency between administrative data and WUENIC estimates continue to be ineligible
for performance payments (Burkina Faso and Ethiopia).” In other words, PbR is rewarding
successful countries but not creating them. The specific GAVI VfM calculations quoted above
(finding benefit-cost ratios of 18:1-44:1) don’t rest on assumptions of additionally (or take
into account general equilibrium effects).
On sustainability there is more evidence, but a similarly mixed picture. Very positive
results come from the HRITF project in Argentina which paid very large incentives for a
short period, but found 12 months after the incentives finished the positive results
persisted (Kandpal, 2016, p.8). This is interpreted as temporary incentives working to
counteract a fixed cost of changing clinical practice routines. More generally, the
emerging HRITF evidence suggests PbR “works best when the health system has
already attained minimum basic standards” (DFID, 2016h, p.9) and “RBF [is] not always
integrated into the health system and [is instead] running as parallel programme” (DFID,
2016h, p.9). The combination of these two insights, if established, would raise challenges for
the broader VfM case for PbR projects, as VfM calculations typically find it difficult to
incorporate system-wide effects (e.g. the general equilibrium effects of creating parallel
structures are difficult to capture)14. From the WASH Results programme comes concerns
over PbR’s effects on equity, alignment and sustainability. While these concerns are common,
the current robust evidence of negative effects in these areas are quite rare.
A brief summary of how to think about VfM in the PbR context is that there are multiple
approaches, which typically differ in the things they do or don’t include in any assessment.
To illustrate this, Table 3 presents three hypothetical projects, with a range of information
that could go into a VfM calculation. The basic insight I wish to convey (explained below) is
simple: it is very possible that there are greater differences in final calculations between different
VfM calculations of the same project then there are between different projects. The insight that VfM
calculations are fragile and depend on assumptions is not new, but PbR projects seem to
amplify this variation.
14 To examine this further, imagine an intervention is found to be good VfM, with benefits that are associated with
improvements from average to good standards. The benefits of these projects may ‘piggyback’ on the basic health care
standards, but the costs of obtaining those standards may not be incorporated. In other words, the system-wide effects and
the project-specific VfM case may point in opposite directions if parallel systems are created by PbR projects. However, at the
moment these concerns are far from established, with only slight concerns raised.

21
Table 3: Three Hypothetical Projects, Multiple VfM Options
Element Project A Project B Project C
Benefit 1 Results paid out on 100 90 80
Benefit 2 Net present value of B1 500 405 320
Benefit 3 Additional results 20 40 80
Benefit 4 Net present value of B3 100 180 320
Benefit 5 Npv of how PbR payment is used 300 800 400
Cost 1 Cost – amount disbursed 100 90 80
Cost 2 Opportunity cost of funds 110 110 110
Cost 3 Staff time/priorities cost/verification 20 100 20
Cost 4 Discount for volatility/time 20 100 40
Calculation 1 B2/C1 5 4.5 4
Calculation 2 B4/C1 1 2 4
Calculation 3 B4/(C2+C3+C4) 0.7 0.6 1.8
Calculation 4 B5/(C2+C3+C4) 2 2.6 2.4 Note: The four calculations provide benefit/cost ratios, so 5 means benefits are 5 times the cost. In each row the best project is
in bold. See text for other details.
The different calculations compare different things, each with a different ordering of the
value of the different projects.
1. The first calculation simply compares the net present value of the results achieved
with the amount of money disbursed under PbR.
2. The second calculation only compares results that are additional.
3. The third calculation compares the additional results to all costs, including estimates
(not normally counted) of the harder to measure costs of PbR programmes, such as
additional staff time managing them, the opportunity cost of funds and the discount
for time/volatility.
4. The fourth calculation moves away from considering the benefits of the results
achieved to considering the value of the actions that the PbR disbursement allowed
to happen.
These calculations are obviously all hypothetical, but they resemble genuine approaches taken by
different projects. On the theme of additionality it is worth considering a point made by
Perakis and Savedoff (2015, p12):

22
“… the justification for an RBA agreement under this line of reasoning is that it
solves a problem for funders – it gives them a way to pay for progress (which they can
demonstrate to their own constituents through credible outcome measures) without
imposing conditions or rigid plans for the use of resources.”
To be fair to Perakis and Savedoff, this argument is not made within the context of a VfM
discussion, but this relates to the first calculation above. According to this view of PbR, it
does not logically need to cause additional results, it merely needs to be associated with
results in order to demonstrate impact. This chimes with the judgement in GAVI (Khatib-
Othman, 2016, p.3), which essentially appears to be rewarding successful countries without
creating any, but the VfM calculations see PbR as a success because the benefits associated
with PbR outweigh its direct costs.
A reductio ad absurdum argument can be made to show the apparent problem with this
position in a VfM context. Imagine that with project A above the assumed tariff was half as
generous to recipients: imagine the same results (worth 500) were achieved, with the same
number of additional results (worth 100) but only 50 was disbursed. In a standard aid
project, if the per unit cost doubles, the cost/benefit ratio responds in a predictable way.
However, in the PbR case the tariff determines the cost side of the equation, but the benefits
can be claimed regardless of any causal effects. Here the cost/benefit ratio in calculation 1
increases from 1:5 to 1:10, even while the successful recipient has half the resources and has
achieved the same results.
The problem with the above proposition is that donors are then essentially purchasing an
ability to be associated with successful outcomes, with no responsibility to actually support
them. If these are decoupled, aid projects could be much more about looking good than
doing good. A counter argument may be that recipients here would have the power to ‘sell’
An even more extreme VfM example
To push this reductio ad absurdum argument another step (and make the logic clear),
imagine that a project that agrees to pay a recipient country 1p for every child
completing primary school, and that previous VfM work has estimated the discounted
net benefits of each additional child completing school to be £100. Further, imagine the
agreement was made with a rogue civil servant in the recipient country, who never
communicated this agreement to anyone else in their country. In other words, the
agreement had no effect whatsoever on the recipient country.
A naïve VfM approach here (in the spirit of calculation 1 above) would find a
cost/benefit ratio of 1:10,000.
What can we learn from this, admittedly extreme, thought experiment? When the
cost/benefit of PbR can be claimed solely on the basis of the tariff, without needing causal claims,
it can lead to implausible VfM claims. To be clear: this argument is genuinely not meant
either as a criticism of PbR or a criticism of VfM methodology, but rather to illustrate the
rather odd way the two can combine.
23
their results on an open market. However, with many more recipients than donors, power
here would lie with donors.
These brief reflections on VfM in PbR are by no means exhaustive. The major take away
message is that the assumptions in VfM calculations mean there is very possibly wider variation
between approaches as there will be between projects.
8. Conclusions and
Recommendations Conclusions:
• The current evidence base remains thin, with expectations for independent
evaluations to more than double (from a low base) in the next few years. The current
(DFID-supported) evidence includes a handful of successful projects, and a larger
number of cases where it had no effect (see section 1 for an overview of evidence
categorised by final outcome). The emerging evidence appears slightly more
positive, but in several previous cases promising results have not stood up to
scrutiny (see the discussion of additionally in section 7).
• The difficulty of identifying good measures is a near universal theme. PbR has a
longer history in health because as an area it appears amenable to (output level)
indicators. Verification in low and middle income countries has often been found to
be much harder than envisaged, with most multi-year programmes seeking to alter
their approach (see the discussion of verification in section 2).
• There is very little evidence on which agent (recipient/implementation agency)
characteristics are the most important, with theoretical insights mainly untested as
there is little variation in agent type. The one exception is the area of motivation,
where there is a variety of findings on individual health workers. Here too, the
details of the measure, project design and implementation are crucial.
• The current evidence base suggests the ability of the donor to withhold aid
(especially in agreements with NGOs) is mainly believed and demonstrated, which
theory suggests is important to ensure PbR success. Other areas are less positive: the
time span of projects is often found to be too short, the space to innovate not given
and the sheer difficulty of designing and managing PbR projects often weighs
heavily.
• There is a consistent picture that implementing PbR projects is more challenging than
envisaged. It is not yet clear whether these are merely ‘teething problems’ as the next
round of PbR projects have not yet generated settled evidence.
• A summary, tentatively proposed in section 6, suggests there are two ‘sweet spots’
for PbR emerging in the evidence base: big and small.

24
o There are essentially no examples of Big PbR: many payments over a long
time agreement for a single, high-quality measure. This is essentially about
trying to maximise the benefits of PbR by reducing tracking of input costs,
while allowing innovation and autonomy.
o By contrast much of ‘small PbR’ is about minimising the costs of PbR. If the
existing measures are poor, the ability to contract over a longer time horizon
limited, the need to track inputs and register changes in approach non-
negotiable, then there is limited upside for a PbR project. In this case it is still
possible that PbR could be better than alternative approaches if the level of
incentivisation is small (limiting damage of incentivising the wrong thing). If
small incentives allow greater attention on genuine donor-identified
constraints, and this creates benefits large enough to offset the increased costs
(volatility, opportunity, verification, management and so on) ‘small PbR’ can
be viable. The current evidence base is able to provide several successful
examples, as well as others where the caveats have not been met.
There are several recommendations, building on these observations.
1. Learn lessons from the number of unsuccessful PbR projects, by not using PbR where
key requirements (first and foremost a good measure) are missing.
2. Introduce a distinction into DFIDs thinking about PbR between ‘big’ and ‘small’
programs. Only use PbR at the level appropriate given the real constraints and
difficulties in design, implementation and management.
3. Use the incoming evidence, where possible, to address the evidence gaps identified.
Specifically, seek to:
a. Identify good measures in different sectors.
b. Examine how agent characteristics (risk aversion, control, alignment and time
horizon) affect the success of PbR projects.
c. See whether longer agreements are more successful, especially in terms of
innovation.
d. See whether PbR design and implementation flaws (discussed in sections 2-5)
reduce over time, and how important these flaws are relative to other
programmes.
e. Identify or commission prototypical ‘big PbR’ projects with a focus on
appropriate learning lessons.
4. For there to continue to be a credible ability to withhold, DFID would be better
served by a clear statement of what will happen to unspent funds. I repeat the
recommendation made elsewhere that a central ‘results fund’ would be a sensible
step.
5. Either downplay VfM discussions as a way of comparing different PbR projects, or
release detailed guidance on the comparisons of interest.

25
Bibliography All websites last checked in July 2017.
Barder, O; Perakis, R; Savedoff, W and Talbot, T (2014) 12 Principles for Payment by Results
(PbR) in the Real World, Mimeo available at https://www.cgdev.org/blog/12-principles-
payment-results-pbr-real-world-0
Birdsall, N and Savedoff, W (2010) Cash on Delivery: A New Approach to Foreign Aid, available
at https://www.cgdev.org/publication/9781933286600-cash-delivery-new-approach-foreign-
aid
Cambridge Education (2015) Evaluation of the Pilot Project of Results-Based Aid in the Education
Sector in Ethiopia, available at: http://iati.dfid.gov.uk/iati_documents/5608531.pdf
Cashin, C; Fleisher, L and Hashemi, T (2015) Verification Of Performance In Results-Based
Financing (Rbf): The Case Of Afghanistan, Health, Nutrition and Population (HNP)
discussion paper, Washington, D.C. : World Bank Group, available at:
http://documents.worldbank.org/curated/en/561511468187139014/Verification-of-
performance-in-Results-Based-Financing-RBF-the-case-of-Afghanistan
Chakravarty, S; Lundberg, M; Nikolov, P and Zenker, J (2016) The Role of Training
Programs for Youth Employment in Nepal: Impact Evaluation Report on the Employment
Fund, World Bank Policy Research Working Paper 7656.
Clist, P and Dercon, S (2014) 12 Principles for Payment By Results (PbR) In International
Development, DFID Mimeo available at
https://assets.publishing.service.gov.uk/media/57a089d2e5274a27b20002a5/clist-dercon-
PbR.pdf
Clist, P and Verschoor, A (2014) The Conceptual Basis of Payment by Results, DFID Mimeo
available at
https://assets.publishing.service.gov.uk/media/57a089bb40f0b64974000230/61214-
The_Conceptual_Basis_of_Payment_by_Results_FinalReport_P1.pdf
Clist, P (2016) Payment by Results in Development Aid: All That Glitters Is Not Gold, The
World Bank Research Observer, 31(2): 290-313.
DFID (n.d.) Record of an internal DFID Kenya 'reflections' meeting, Internal mimeo.
DFID (2011) DFID’s Approach to Value for Money (VfM), available at:
https://www.gov.uk/government/uploads/system/uploads/attachment_data/file/67479/DFID
-approach-value-money.pdf
DFID (2014) Designing and Delivering Payment by Results Programmes: A DFID Smart
Guide, available at:
https://www.gov.uk/government/uploads/system/uploads/attachment_data/file/352519/Desi
gning-Delivering-PbR-Programmes.pdf

26
DFID (2015a) Annual Review of Big Results Now! Education, Results Based Programme,
available at: http://iati.dfid.gov.uk/iati_documents/5559919.odt
DFID (2015b) Annual Review of Results-Based Financing for Low Carbon Energy Access,
available at: http://iati.dfid.gov.uk/iati_documents/5237898.odt
DFID (2015c) DFID Evaluation Framework for Payment by Results, available at
https://www.gov.uk/government/uploads/system/uploads/attachment_data/file/436051/Eval
uation-Framework-Payment-by-Results3.pdf
DFID (2015d) Annual Review of Support for Malaria Control Programmes, available at:
http://iati.dfid.gov.uk/iati_documents/5167673.odt
DFID (2015e) Project Completion Report for Title: Rwanda Education Sector Support
Programme 2011-2015, available at: http://iati.dfid.gov.uk/iati_documents/5293905.odt
DFID (2016a) Annual Review of Big Results Now delivery programme Phase II, available at:
http://iati.dfid.gov.uk/iati_documents/5433350.odt
DFID (2016b) Annual Review of WASH Results Programme 2016 Annual Review, available
at: http://iati.dfid.gov.uk/iati_documents/5498968.odt
DFID (2016c) Project Completion Report of Pilot Project of Results Based Aid in the
Education Sector in Ethiopia, available at: http://iati.dfid.gov.uk/iati_documents/5419380.odt
DFID (2016d) Annual Review of Results Based Financing for Low Carbon Energy Access,
available at: http://iati.dfid.gov.uk/iati_documents/5642639.odt
DFID (2016e) Project Completion Report of Poverty Reduction Budget Support to the
Government of Sierra Leone 2013-2015, available at:
http://iati.dfid.gov.uk/iati_documents/5386495.odt
DFID (2016f) Annual Review of Global Program on Output-Based Aid - Phase 2, available at:
http://iati.dfid.gov.uk/iati_documents/5235433.odt
DFID (2016g) DFID Management Response: Delivering Reproductive Health Results
(DRHR) through non-state providers in Pakistan, available at:
https://www.gov.uk/government/uploads/system/uploads/attachment_data/file/563590/Man
-resp-delivering-reproductive-health-results-pakistan.pdf
DFID (2016h) Update on the latest evidence emerging from Results based financing in
health, HDD team meeting presentation.
DFID (2016i) Project Completion Report of Gavi Alliance, available at:
http://iati.dfid.gov.uk/iati_documents/5620905.odt
DFID (2016j) Annual Review of the Girls Education Challenge Fund, available at:
http://iati.dfid.gov.uk/iati_documents/5682897.odt
DFID (2017) Annual Review of GPOBA Phase 2 - Window 3 Capital Grant and Windows 1 &
2 Technical Assistance, available at: http://iati.dfid.gov.uk/iati_documents/5683482.odt

27
Dykstra, S; Glassman, A; Kenny, C and Sandefur, J (2015) The Impact of GAVI on
Vaccination Rates: Regression Discontinuity Evidence, Center for Global Development Working
Paper, 394, http://dx.doi.org/10.2139/ssrn.2623084
Engineer, CY; Dale, E; Agarwal, A; Agarwal, A; Alonge, O; Edward, A; Gupta, S; Schuh, H;
Burnham, G and Peters, DH (2016) Effectiveness of a pay-for-performance intervention to
improve maternal and child health services in Afghanistan: a cluster-randomized trial,
International Journal of Epidemiology, 45(2), 451-459.
Evans, A (2016) Results based financing in Zambia – an informal, unpublished annex, mimeo,
available at: https://www.researchgate.net/publication/308985858
Gertler, P; Giovagnoli, P and Martinez, S (2014) Rewarding provider performance to enable
a healthy start to life: evidence from Argentina's Plan Nacer, World Bank Policy Research
Paper, 6884.
Global Partnership on Output Based Aid (2016) Annual Report 2016, available at:
https://www.gpoba.org/sites/gpoba/files/GPOBA_AnnualReportFY2016_0.pdf
Holden, J and Patch, J (2017) The experience of Payment by Results (PbR) on the Girls’ Education
Challenge (GEC) programme Does skin in the game improve the level of play?, Mimeo, available at:
http://foresight.associates/wp-content/uploads/2017/01/2017.01.19-Skin-in-the-game-PbR-on-
the-GEC.-Final.pdf
Honig, D (2014) Navigation by Judgment: Organizational Autonomy and Country Context
in the Delivery of Foreign Aid, mimeo.
Kandpal, E (2016) Completed Impact Evaluations and Emerging Lessons from the Health Results
Innovation Trust Fund Learning Portfolio, available at:
https://www.rbfhealth.org/sites/rbf/files/IE%20and%20emerging%20lessons_Eeshani%20Ka
ndpal.pdf
Khatib-Othman, H (2016) Country Programmes: Strategic Issues, Report to the [GAVI]
Board 7-8 December 2016, Appendix B, available at
http://www.gavi.org/about/governance/gavi-board/minutes/2016/7-dec/minutes/07a---
country-programmes---strategic-issues/
Kutzin, J (2016) RBF: from program to entry point for strategic purchasing, Presentation at the
Health Financing Technical Network Meeting, slides available at
http://www.who.int/health_financing/events/session3-results-based-financing-and-strategic-
purchasing.pdf
Mumssen, Y; Johannes, L and Kumar, G (2010) Output-based aid: lessons learned and best
practices. Directions in development; finance. Washington, DC: World Bank. Available at:
http://documents.worldbank.org/curated/en/206041468337170198/Output-based-aid-lessons-
learned-and-best-practices
Muralidharan, K and Sundararaman, V (2011) Performance Pay: Experimental Evidence
from India, Journal of Political Economy, 119(1): pp. 39-77.

28
Myers, M (2012) A Report to the Center for International Media Assistance, Is There a Link
Between Media and Good Governance? What the Academics Say, available at:
https://pdfs.semanticscholar.org/022b/f2bb2be1189d79a18e9306aed45560459aec.pdf
Olken, BA; Onishi, J and Wong, S (2014) Should Aid Reward Performance? Evidence from a
field experiment on health and education in Indonesia, American Economic Journal: Applied
Economics, 6(4): 1-34.
Perakis, R and Savedoff, W (2015) Does Results-Based Aid Change Anything? Pecuniary
Interests, Attention, Accountability and Discretion in Four Case Studies, CGD Policy Paper,
052.
Sandefur, J and Glassman, A (2015) The political economy of bad data: evidence from
African survey and administrative statistics, The Journal of Development Studies, 51(2), 116-
132.
Savedoff, WD (2010) Basic Economics of Results-Based Financing in Health, Mimeo, available at
http://www.focusintl.com/RBM082-RBF%20Economics.pdf
Svensson, J (2003) Why conditional aid does not work and what can be done about it?,
Journal of Development Economics, 70(2), 381-402.
Upper Quartile (2015) Evaluation of Results Based Aid in Rwandan Education, available at:
http://iati.dfid.gov.uk/iati_documents/5549076.pdf
Valadez, J; Jeffery, C; Brant, T; Vargas, W and Pagano, M (2015) Final Impact Assessment
of the Results-Based Financing Programme for Northern Uganda, available at
https://www.gov.uk/government/uploads/system/uploads/attachment_data/file/607579/Eval
uation-of-Results-Based-Financing-Programme-for-Northern-Uganda.pdf
WHO (2016) Sharing and debating country experiences on health financing: Fiscal
sustainability and transition, public finance management, and results-based financing,
Meeting Brief, available at http://www.who.int/entity/health_financing/events/sharing-and-
debating-health-financing-challenges-meeting-summary-13022017.pdf?ua=1
Witter, S; Zaman, R; Scott, M and Mistry, R (2016) Evaluation of Delivering Reproductive Health
Results (DRHR) through non state providers, MSI/PSI Impact Evaluation Report, Available at:
https://www.gov.uk/government/uploads/system/uploads/attachment_data/file/533669/Deli
vering-Reproductive-Health-Results-Non-State-Providers-Pakistan1.pdf

29
Appendix 1: Evidence Reviewed Here, I give an overview of most of the documents reviewed in writing this report. Where
academic work is cited, the full reference is given in the bibliography. Where DFID
documents are public, a link or reference is provided (with all links checked in July 2017).
Where internal (i.e. non-public) documents are made available, they are mentioned but not
(generally) referenced.
A common theme below is the extent to which the different pieces of evidence help answer
the 3 priority evaluation questions outlined in DFID’s evaluation framework for PBR (DFID,
2015c, p. 13):
1. What PBR instruments work best in different circumstances?
2. When and how do PBR incentives work in practice?
3. What is the value for money of different types of PBR instruments?
In addition to the documents below, I had access to all of the documents collected and
interviews conducted for the objective 3 report, which accompanies this. Further details are
found in that report, but the ‘deep dives’ concerned AgResults, the Girls Education
Challenge Fund and the Rural WASH programme. Lighter touch reviews concerned Ghana
Health Sector Support Programme, the Health Results Innovation Trust Fund, Big Results
Now!, Tanzania Education, Reproductive Health in Pakistan, and the Low Carbon Energy
Access Facility. These were used mainly in cases where a specific point was unclear, and
needed further elaboration.
I also contacted a handful of individuals, mainly to check my understanding of their written
arguments or evidence.
The projects are listed in the same order as given in Table 1.
End Child Marriage, Ethiopia (2011-17, £11m)
The annual review and mid-term evaluation are available at
https://devtracker.dfid.gov.uk/projects/GB-1-202347/documents. The final evaluation is not
yet available, but is expected to have a sensible counterfactual (albeit a no aid scenario,
rather than a preferable ‘aid, but not PbR’ comparison). The VfM section of the evaluation
document is relatively well developed, and provides useful (if provisional) evidence on the
VfM of the project as a whole. The annual review is useful in discussing implementation,
and the discussion of piloting of different approaches is useful, but the final evaluation
products are needed for the project to really address the three priority evaluation questions.
Family Planning in Kenya (2015-18, £31m)
The annual reviews are available at: https://devtracker.dfid.gov.uk/projects/GB-1-
202547/documents. In addition, an internal ‘lessons learned’ document was made available.
While both the annual reviews and ‘lessons learned’ document provide helpful insights for
the second priority evaluation question, but there isn’t yet a robust independent evaluation
document that can speak to the other questions.

30
The Employment Fund in Nepal (2010-15, £13.5m)
The annual reviews and project completion report are available here:
https://devtracker.dfid.gov.uk/projects/GB-1-201489/documents. Furthermore, the impact
evaluation by Chakravarty et al (2016) is available as a working paper. The DFID documents
do provide some details that are helpful, but the Impact evaluation is the more important
document with regards priority evaluation question 1. It is a high-quality, careful impact
evaluation of the project as a whole, with good quality data used to address many of DFID’s
own questions. The one weakness of this evidence is that it is very much an evaluation of the
whole project against a counterfactual of no project, and so isn’t directly focused on the PbR
modality itself. As such, there is a limit to which the evaluation can answer PbR-specific
questions.
Reproductive Health in Pakistan (2012-17, £38.5m)
The annual reviews, evaluation report and management response are all available at:
https://devtracker.dfid.gov.uk/projects/GB-1-202413/documents. The evaluation reports no
significant effect, whereas the annual reviews (informed by an independent-consultant-led
mid-term review) were expecting a much more positive finding. Responding to the
evaluation report’s recommendation, the management response explains that more
qualitative research has been commissioned, in order to uncover why this happened. Thus
while the evaluation report is a useful and robust source of information for priority
evaluation question 1, the future qualitative research is needed for more insights for priority
evaluation question 2.
Results Based Financing in Health, part of the 'Post-conflict Development in Northern
Uganda' programme (2009-16, £100.5m)
This is a larger programme, for which the various annual reviews, evaluations and
corresponding management responses are available at
https://devtracker.dfid.gov.uk/projects/GB-1-200250/documents. There are two general
evaluation products which provide some useful background. With regards the priority
evaluation questions, the Valadez et al (2015) impact evaluation is most useful as it focuses
specifically on the Results Based Financing part of the larger programme. The evaluation
uses the quasi-experimental difference-in-difference methodology, comparing
improvements in a region with the PbR incentive to another with more traditional input-
based funding. The weaknesses of the approach are well known – while able to control (to
some extent) for observable differences, where there are unobservable differences between
the treatment and control regions, the effect estimates may be biased. There are known
observable differences between the two regions, most obviously in the types of health
centre. However, the evaluation remains a useful report (with known problems), especially
for the first evaluation question.
The Tanzanian Malaria Voucher scheme (2011-15, £26m)
The PbR element was part of the larger Support for Malaria Control Programme, with
annual reviews for the whole programme available at
https://devtracker.dfid.gov.uk/projects/GB-1-202481/documents. The latest annual review
(http://iati.dfid.gov.uk/iati_documents/5167673.odt, p.2) explains, regarding the PbR

31
element, that “[the] contract with MEDA was terminated in July 2014, following suspicion of
fraud.” In relation to the project, I also had access to an internal briefing note on lessons
learnt authored by DFID’s Internal Audit Department. As the PbR element was cancelled,
the current evidence applicable to the priority evaluation questions is mainly around
implementation, verification and the design of the measure.
RBA Ethiopia Education (2012-15, £27.4m)
The five annual reviews, independent evaluation report, corresponding management
response and project completion report are all available at
https://devtracker.dfid.gov.uk/projects/GB-1-202989/documents. The independent
evaluation report does not cover the final year of the evaluation, and is very different in tone
from the in-house project completion report.
The evaluation was felt by DFID to be “very difficult”, and “was not continued after year
three due to an inability to agree a robust methodology” (Project Completion Report, 2016,
p.4, available at: http://iati.dfid.gov.uk/iati_documents/5419380.odt). To a large extent, the
evaluation difficulties were inevitable: the PbR scheme was rolled out nationwide, and
attempts to construct a counterfactual were hampered by poor data quality and quantity.
There are large standard errors in the model but not so large that significant results are not
found, however the only significant results (at the 5% level) are negative. Table 2.2 of the
evaluation report (available at: http://iati.dfid.gov.uk/iati_documents/5608531.pdf) gives
twelve estimates of the effect of RBA on the pass rate, reporting twelve negative point
estimates, eight of which are significant at the 5% level. These are not interpreted as a
genuine negative result (appealing to the difficulty of interpreting this theoretically), but this
illustrates that the data is not of such poor quality that significant results are not found.
Overall, the evaluation report attempts to address all of the priority evaluation questions,
but is hampered by poor data quality that requires rather strong assumptions in order to
construct counterfactual scenarios.
The project completion report [which, in the interests of full disclosure, I supported with a
small number of days] was not independent, and mainly relied on interviews (essentially
addressing priority evaluation question 2) with little attempt to construct a counter factual.
There are useful stories and impressions, but the lack of objectivity and good quality data
raise questions over the reliability of the insights. To its credit, the lack of evidence is freely
acknowledged: “the pilot now appears to be a success although its impact cannot be
proved” (Project Completion Report, 2016, p.11, available at:
http://iati.dfid.gov.uk/iati_documents/5419380.odt). On top of the lack of data allowing a
clear identification, another problem raised in the reports is that the norm-referenced exam
system should mean the scheme was unable to affect pass rates (it did, however) – a matter
that was not fully dealt with. These two problems limit the usefulness of the available
evidence.
Results Based Aid in Rwandan Education (2011-15, £97.5m)
Part of the larger Rwanda Education Sector Program, relevant annual reviews, project
completion report, evaluation reports and corresponding management response are
available at: https://devtracker.dfid.gov.uk/projects/GB-1-202377/documents. In addition, I

32
had access to the EVD (the evaluation department) summary of the final evaluation. In the
interests of full disclosure, I was the quantitative lead on this evaluation and the author of
report 3 (the companion to this report 2) became the qualitative lead. With these caveats in
mind, it remains my opinion that the evaluation report (Upper Quartile, 2015) provides
some of the best evidence for each of the priority evaluation questions, especially for
bilateral agreements between governments.
While the project resembled the Ethiopia RBA in several key ways, the impact evaluation
was less troubled by poor data. This was partly because data was available at the district
level (of which there are 30), with detailed (if likely poor quality) information on enrolment
at each grade. The evaluation was then able to use the logical progression of students
through an education system to model demographic effects, and construct a plausible
counterfactual for a no-RBA case. Out-of-sample predictions were used to test the accuracy
of the model: by excluding five regions from the model, estimating the appropriate
parameters and then predicting results in the excluded regions. These predictions could then
be compared with actual known results. In summary, “the model performs well with errors
of 1.4-7.8%” (Upper Quartile, 2015, p.101) Errors here means the difference between
predicted (point estimate) and actual levels of students completing exams, as a percentage of
those that did complete those exams. Clearly there will be some random fluctuation in these
numbers, and so a ‘zero error’ is implausible even in the best imaginable model. This is also
the upper bound on inaccuracy as the test is stringent: it removes one sixth of the relatively
small amount of data from the model. The impact evaluation is thus one of the best pieces of
evidence in answering the first evaluation
The process evaluation elements of the evaluation contain a high level of detail on how
different actors responded to the incentives, and was informed by the impact evaluation. It
was afforded good access to key informants at various levels (national government, district
and school), and was well-resourced. The process evaluation is particularly useful because it
built year-on-year, and was thus able to plan and adapt to the changing realities in the
education sector. The value-for-money section (see appendix 9 for greater details, Upper
Quartile, 2014, pp.104-131) was included at a relatively late stage, but is an extensive attempt
to capture the benefits and costs of the PbR mechanism using a range of assumptions and
leading quantitative techniques.
Ghana Health Sector Support Programme (2013-18, £67m)
A number of annual reviews are available at: https://devtracker.dfid.gov.uk/projects/GB-1-
203536/documents. The project has undergone a number of changes, with instruments
redesigned in part in response to a complex local picture. The 2016 annual review, available
at: http://iati.dfid.gov.uk/iati_documents/5487480.odt, reports a rather pessimistic view on
the use of VfM in PbR: “.. not possible to monetise the benefits of the performance based FA
aid for HFS-IP, but a better financed and efficient sector will produce better outputs” (p.14).
With no evaluation product, there doesn’t appear to be an attempt to use the Ghana Health
Sector Support Programme to address any of the priority evaluation questions.
Tanzania Rural WASH (2014-19, £150m)

33
At the time of drafting this report, two annual reviews (the most recent from November
2015) are available at: https://devtracker.dfid.gov.uk/projects/GB-1-204033/documents. In
addition, a number of internal documents were made available; the scoping report, the 2016
annual review, and an internal DFID learning document (“Testing What Works for rural
water subsector in Tanzania: Combining adaptive programming with Payment by Results”).
However, as these were made available after the initial end date of the contract, this limited
the extent to which they are fully incorporated into this document. The only independent
document made available was a note on ‘doing development differently’ which briefly
mentions the project.
The documents available give useful details of the PbR design phase and background for the
project. For example, it is heartening to see eight different indicators considered, given the
importance of the measure. However, the current evidence generated by this project is not
yet able to robustly address to the priority evaluation questions. This is especially the case
given the large number of changes that have happened in the life of the programme, in part
because of an attempt to use adaptive programme management.
Big Results Now!, Tanzania Education (2014-18, £60m)
Two annual reviews are available at https://devtracker.dfid.gov.uk/projects/GB-1-
204288/documents. As stated in the annual review (DFID, 2015a, p. 21 available at
http://iati.dfid.gov.uk/iati_documents/5559919.odt): “there are at least four separate ongoing
evaluation exercises for BRNEd and there will likely be more evaluation exercises in the
future. However, there is currently a lack of clarity around how each of these separate
evaluation exercises is being coordinated in a way to increase overall leaning and assess the
impact of the programme.” As such, the evaluation products are not yet available.
In addition, a large number of internal documents were made available, including emails
and presentations. Furthermore, the website of some of the evaluations
(http://www.riseprogramme.org/content/rise-tanzania-research-overview-technical) gives
details of the rigorous evaluations that are planned. While the current evidence is able to
provide some details that address implementation and design concerns, for the most part
the existing evidence is not able to robustly address the priority evaluation questions.
Budget Support Sierra Leone (2013-15, £43.5m)
Various annual reviews, evaluation reports and the project completion report are available
at: https://devtracker.dfid.gov.uk/projects/GB-1-203585/documents. This Budget Support
programme is included in the list of DFID PbR programs because of its use of the ‘Progress
Assessment Framework’, which linked disbursements to a clear set of indicators in the PbR
methodology. The evaluation documents themselves are much more focused on budget
support, with several implementation difficulties noted in the evaluation report (see
http://iati.dfid.gov.uk/iati_documents/5519177.pdf, p.6) meaning that in a sense the model of
a more PbR-like type of budget support was not really implemented, and therefore cannot
be properly evaluated. Thus these documents only partially address the priority evaluation
questions.
Health Results Innovation Trust Fund (2010-22, £114.25)

34
The DFID-specific documents are available at https://devtracker.dfid.gov.uk/projects/GB-1-
200763/documents, but the most useful resources for the three priority evaluation questions
are found elsewhere. Kandpal (2016) is an excellent document that concisely summarises
most of the important insights from the eight impact evaluations currently available. Further
details of the underlying evaluations themselves (Afghanistan, Argentina, Cameroon, DRC,
Rwanda, Zambia and Zimbabwe) are mostly available and can be found at
http://www.rbfhealth.org/impact. Some are now published in academic journals or working
paper series (see Engineer et al, 2016 on the Afghanistan project, and Gertler, Giovagnoli &
Martinez 2014 on the Argentina project) whereas others (e.g. Zimbabwe) have only limited
details online and no standalone document. Evans (2016) is useful in providing more detail
on the Zambia initiative. This set of impact evaluations are some of the best DFID-generated
evidence with regards evaluation priority question 1, and to a lesser extent priority question
2. As discussed where appropriate in the text, many of these evaluations explicitly test the
PbR modality itself, rather than just a project against a ‘no intervention’ comparison.
Another reason for the usefulness of this group of evaluation documents is that while
similar in many ways, the different projects have enough variation to highlight and test
different theories.
Various meeting summaries (e.g. http://www.who.int/health_financing/events/sharing-and-
debating-health-financing-challenges-meeting-summary-13022017.pdf?ua=1) and meeting
documents (e.g. http://www.who.int/health_financing/events/session3-results-based-
financing-and-strategic-purchasing.pdf?ua=1) are useful additions to provide a better
understanding of project details, and emerging lessons. A small number of internal
documents were especially helpful in considering emerging lessons.
Girls Education Challenge Fund stage I (2011-17, £355m)
The annual review documents can be found at https://devtracker.dfid.gov.uk/projects/GB-1-
202372/documents. The learning document provided by Holden and Patch (2017) uses a
questionnaire of NGOs (the implementers) to supplement lessons learnt during the
managing of the GEC fund. The limitations of the questionnaire and the subjective
viewpoint of the responders (implementing agencies) and authors (involved in managing
the fund and projects’ evaluations) should be noted, but the document is a brief summary
that gives great theory-led insights into the first and second priority evaluation questions.
By early-2016, only 15 of GEC’s 37 projects had PbR payments linked to outcomes. The
midline evaluation reports (available at https://www.gov.uk/guidance/girls-education-
challenge#midline-evaluation-reports) are attempts to synthesise evaluations of the
individual projects, with no apparent focus on PbR. After a two-month delay, I gained
access to the impact evaluations of the individual projects, which are currently internal.
These evaluations were managed/commissioned by the individual projects, and vary in
quality, rigour and approach quite substantially. The payments in many cases were linked to
those reported in the evaluations, and so these evaluations may not have been entirely
objective (as they were managed by the NGOs who may have foregone payment if the
evaluation didn’t find positive results). Furthermore, comparing these to non-PbR projects is
not a valid exercise, as PbR and non-PbR projects were fundamentally different. Combining
these two factors (evaluations of limited quality, with no comparable non-PbR projects)

35
limits the extent to which these Impact Evaluations can be used to address priority
evaluation question 1.
Low Carbon Energy Access Facility (2015-19, £40m)
Two (internal) process reviews were made available, which mainly provide useful insights
into the initial implementation experience. The (internal) two-volume baseline evaluation
outlines some interesting approaches, including a desire to test the difference between high-
and low-powered incentives, but it is too early to provide useful direct evidence for the
three priority evaluation questions. Likewise, the four annual reviews available at the time
of writing (available at https://devtracker.dfid.gov.uk/projects/GB-1-202957/documents)
can’t currently address the priority evaluation questions, but do give insights into
implementation and value for money considerations.
WASH Results (2013-18, £81m)
The annual reviews for this project are available here:
https://devtracker.dfid.gov.uk/projects/GB-1-203572/documents. The programme covers
three different contracts: the Sustainable Sanitation and Hygiene for All Results Programme
(with SNV, a Dutch organisation), the SWIFT consortium (with Oxfam, Tearfund, ODI) and
the South Asia WASH Results Programme (with Plan, Unilever and Water Aid). Various
lessons learnt resources are available online: from the verification team
(https://washresultsmve.wordpress.com/) and from the SWIFT consortium
(http://swiftconsortium.org/resources/). These give some insights into the implementation
part of evaluation question 2, but no documents were able to address evaluation priority
question 1. Specifically, while requested, access was never given to an independent
evaluation document that apparently exists. In due course, I would expect this to speak
directly into all priority evaluation questions.
Global Partnership on Output Based Aid (2008-2017, £37m)
There is a simply huge amount written on the Global Partnership for Output Based Aid
(GPOBA), with the evidence receiving a book-length treatment by Mumssen et al (2010).
DFID documents, including annual reviews are available at
https://devtracker.dfid.gov.uk/projects/GB-1-200155/documents, with a further 144
publications listed on the programme’s own website (https://www.gpoba.org/publications).
The vast majority of these documents are focused on lessons learned rather than results,
with DFID’s 2016 annual report (http://iati.dfid.gov.uk/iati_documents/5663444.odt, p. 3)
stating “GPOBA must improve how it measures and attributes the results of its activities.”
While there are a large number of documents which could potentially contribute to the
second priority evaluation question, there is a distinct lack of focus on what has actually
been achieved through PbR mechanisms. This severely restricts the usefulness of these
documents for the priority evaluation questions.
AgResults (2012-24, £25m)

36
The annual reviews for AgResults are available at:
https://devtracker.dfid.gov.uk/projects/GB-1-203052/documents, but I had access to a large
number of additional documents, including various emails, presentations, toolkits, draft
baseline reports and so on. Many of these can already be found online
(http://agresults.org/en/326/Products). These documents were made available at very
different stages of the report: the most recent being weeks after the initial deadline for this
report. A number of documents discuss emerging results, but all evaluations are on-going.
There is currently little settled robust evidence that can directly address the evaluation
questions. A number of documents provide useful indirect insights, such as on the difficulty
of evaluation, but more time is needed before results can be truly useful in addressing the
evaluation questions.
Ideas to Impact (2014-2019, £11m)
At the time of drafting, the most recent annual review available at
https://devtracker.dfid.gov.uk/projects/GB-1-201879/documents was from May 2015, just a
year into the programme. The programme website (http://www.ideastoimpact.net/) also
hosts thirteen documents, mainly focused on topics such as ‘lessons learnt’ or setting out the
rationale for prizes. While these contain useful insights into the design of a new programme,
there is not yet robust evidence that can directly address the priority evaluation questions.
GAVI (2010-16, £874m)
As one might expect with such a large programme, there is an extensive literature around
GAVI. The project completion report is available at
https://devtracker.dfid.gov.uk/projects/GB-1-200764/documents (titled annual review 6)
with other relevant DFID documents available at https://devtracker.dfid.gov.uk/projects/GB-
1-204240/documents (this covers 2016-20, with the previous link the 2010-2016 documents).
These provide concise summaries of the standard GAVI work on value for money, and the
effectiveness of the program.
Several useful documents come from the academic literature. Pertinent to the first priority
evaluation question, Dykstra et al (2015) use the quasi-experimental regressions
discontinuity design to see the effect of GAVI of vaccination rates for countries near the
$1,000 GNI threshold. Effectively, countries just above or below the threshold do not differ
substantially in other ways other than in their eligibility for GAVI help, thus allowing
identification of any effects on vaccination rates. They find GAVI mainly displaced other
immunisation efforts, and the few positive results found are not robust. This study (and the
references therein) is a useful check on GAVI’s own results, and chimes with the work done
by Khatib-Othman (2016). Regarding the second priority evaluation question, Sandefur and
Glassman (2015) provide a useful example of the difficulty of using existing data in a PbR
tariff. Neither of these insights are incorporated into the value for money discussions.
Top Related