


Languages
Pages
Legal


Global Market UpdateFebruary 16, 2015
Global Clients…Global Portfolios
disclosure: The opinions expressed in this Charts to Watch report are those of the author. The materials and commentary are strictly informational and should be used for research use only. This bulletin is not intended to provide investing or other advice or guidance with respect to the matters addressed in the bulletin. All relevant facts, including individual circumstances, need to be considered by the reader to arrive at investment conclusions that comply with matters addressed in this bulletin. Charts and information used in this report are sourced from Bloomberg.

Financial Conditions
5
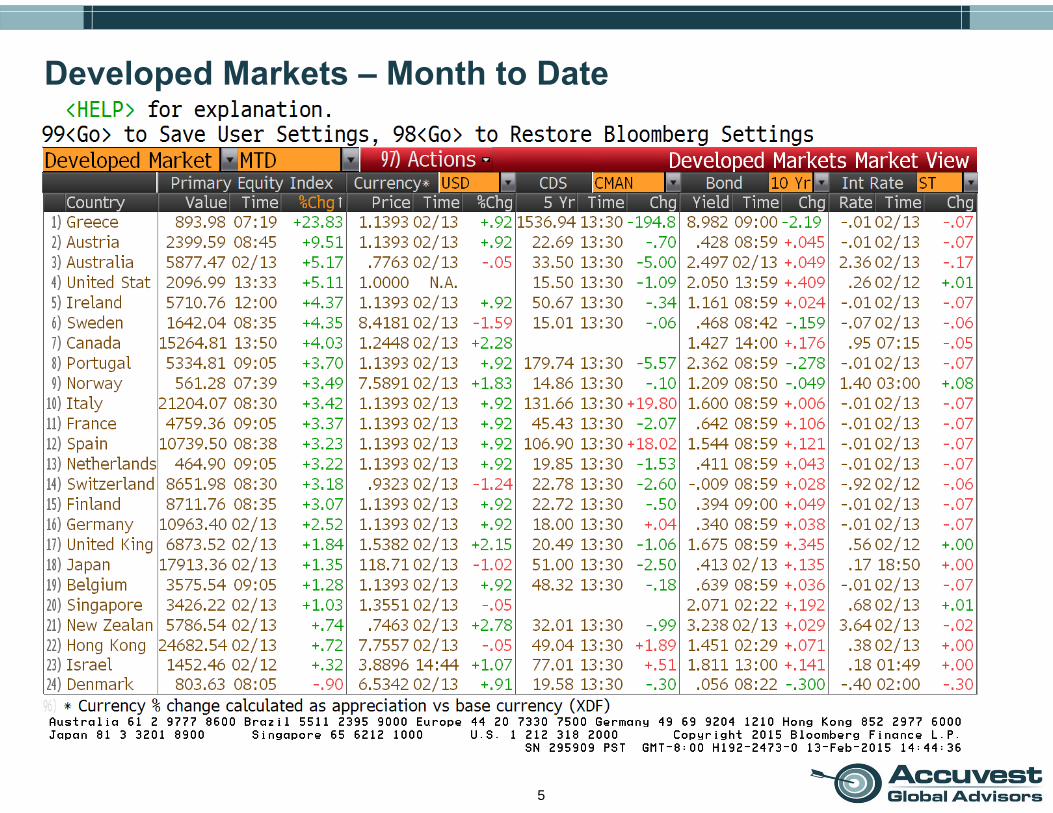
Developed Markets – Month to Date

6
Emerging Markets – Month to Date

7
Global Financial Stress Index – 1 Year

8
Macro Risk Index – 1 Year

9
VIX Index – 1 Year

Fixed Income & Credit

11
U.S. Treasury 10 Year Yield

12
Investment Grade Credit Spreads

13
High Yield Credit Spreads

14
UST Yield Curve vs. US BBB Curve vs. US B Curve

15
20+ Year Treasuries (TLT)
16
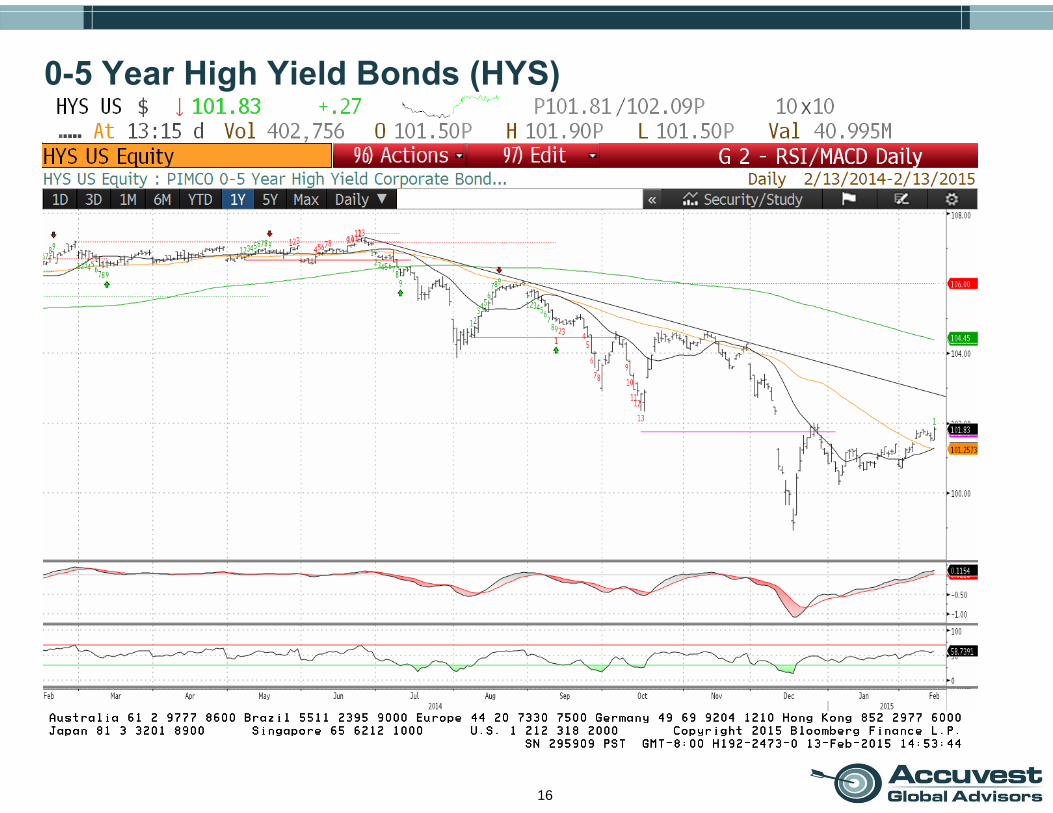
0-5 Year High Yield Bonds (HYS)

17
Fed’s Five-year Forward Breakeven Inflation Rate
18
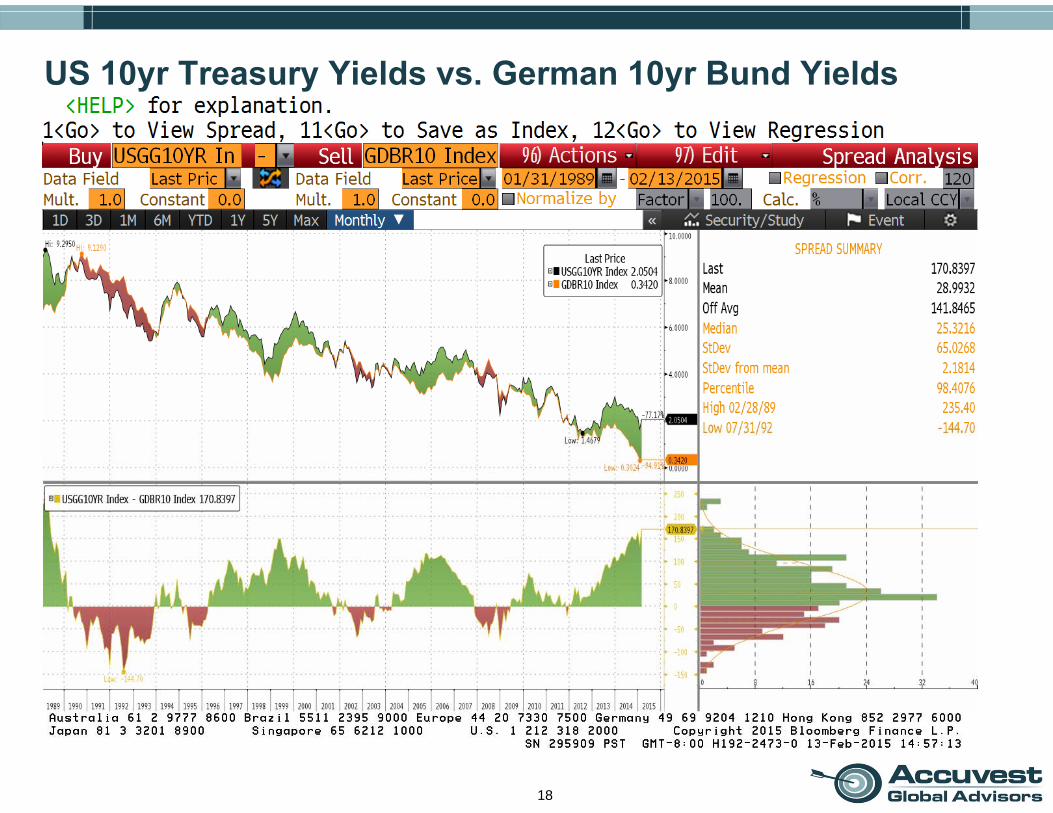
US 10yr Treasury Yields vs. German 10yr Bund Yields

Global Equities

20
MSCI ACWI Index
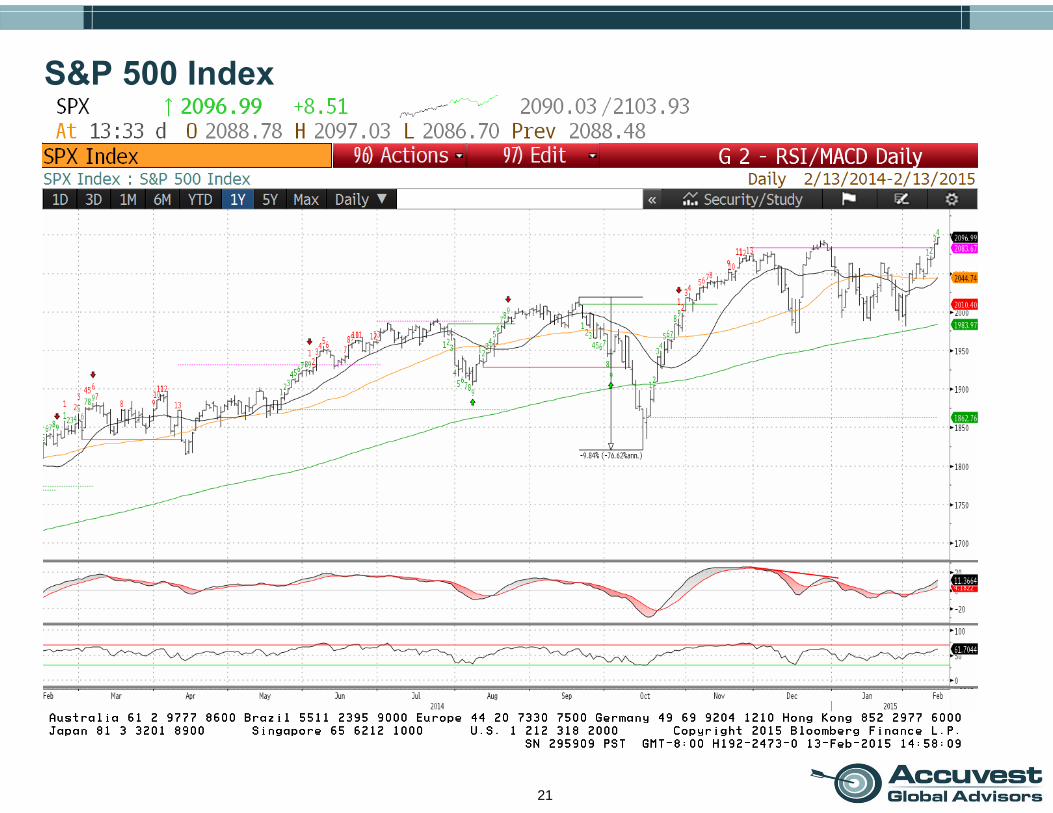
21
S&P 500 Index
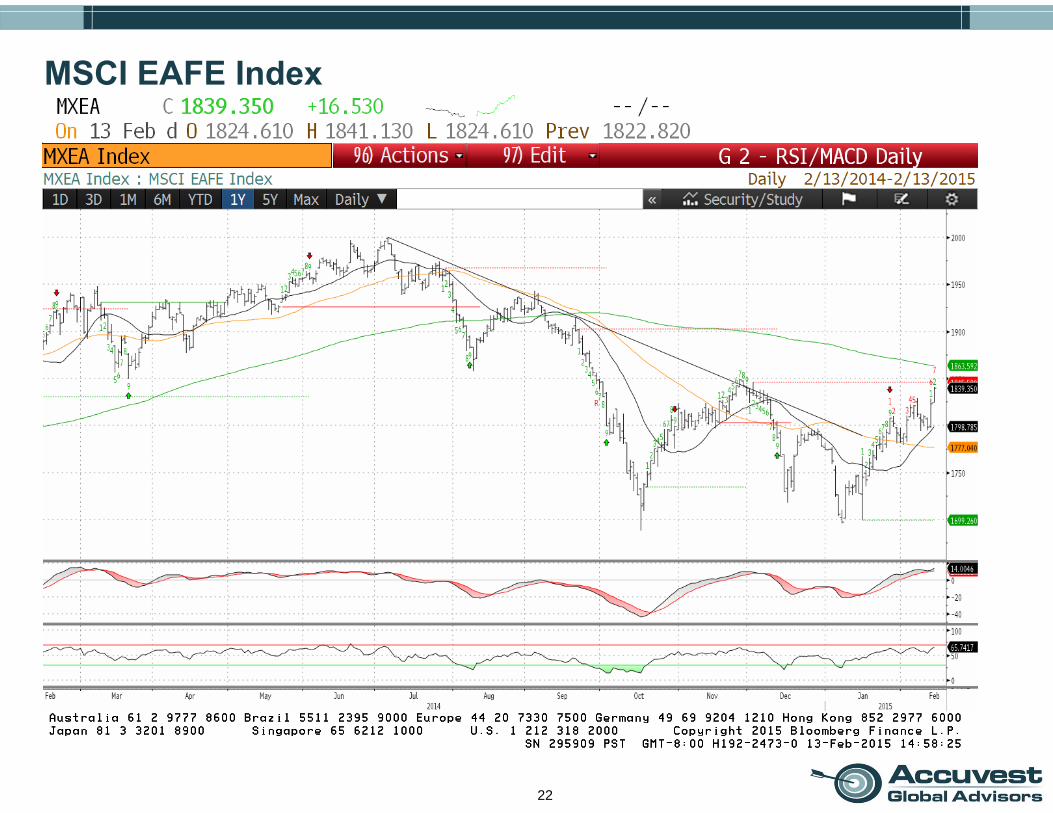
22
MSCI EAFE Index

23
MSCI Emerging Market Index

24
Japan (FX Hedged)
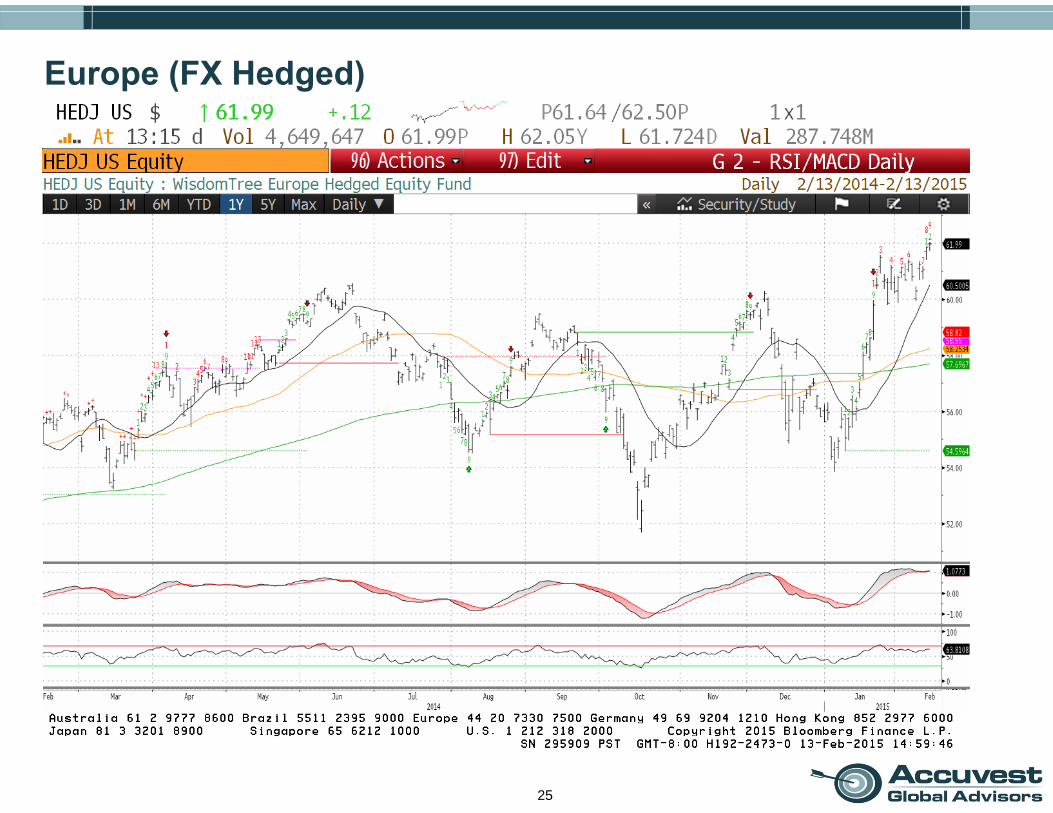
25
Europe (FX Hedged)
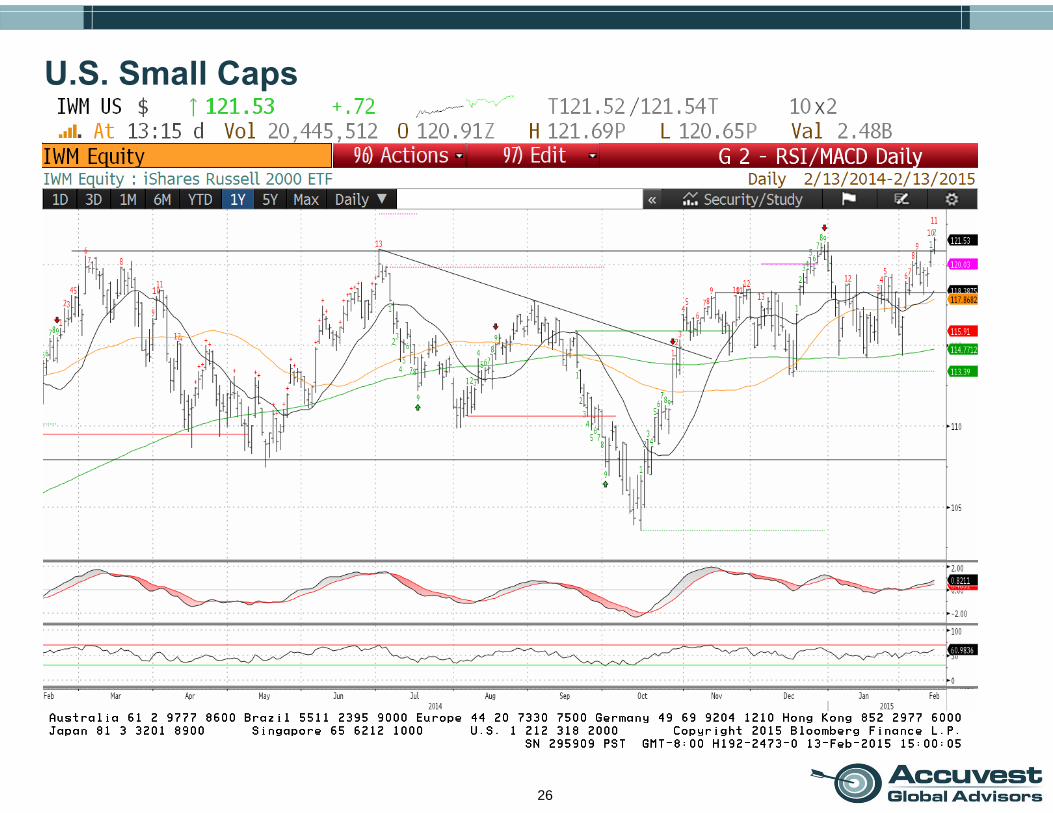
26
U.S. Small Caps
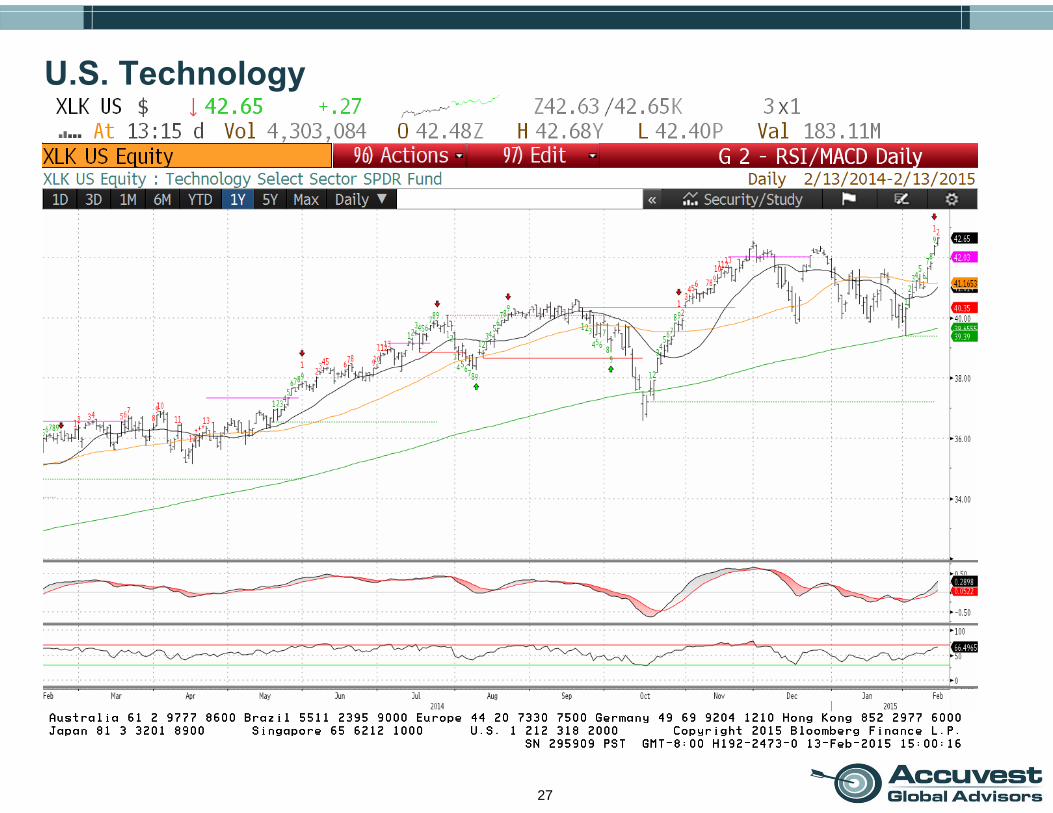
27
U.S. Technology

28
China (MCHI)

29
India (INDY)

30
Germany (EWG)

31
S&P500 Q4 Earnings – Surprise

32
S&P500 Q4 Earnings – Growth
Currencies & Commodities

34
U.S. Dollar Index

35
Japanese Yen

36
Euro

37
Mexican Peso
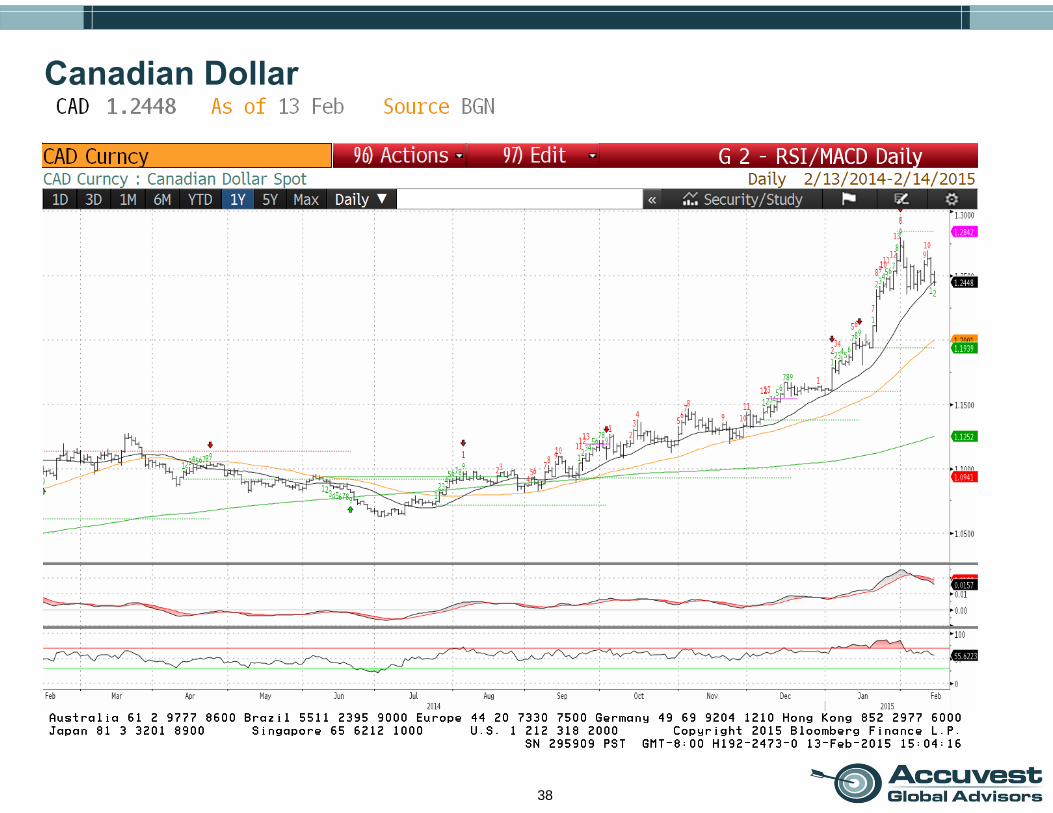
38
Canadian Dollar

39
Gold

40
Crude Oil
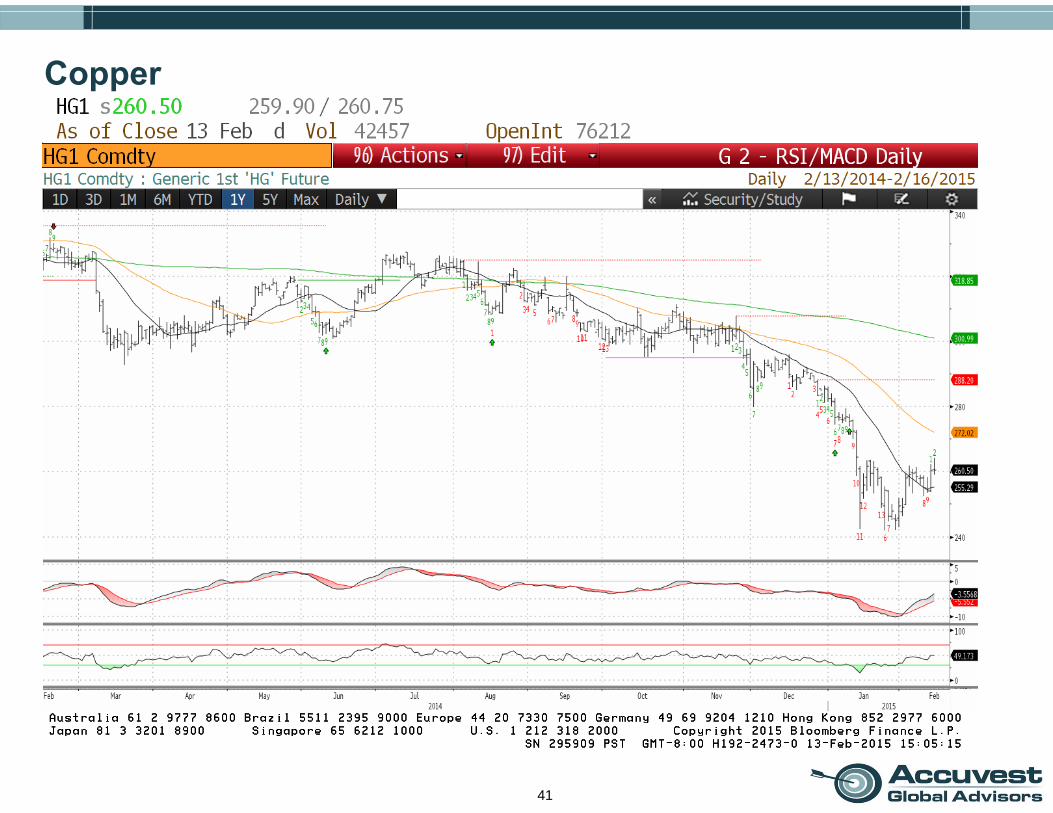
41
Copper

The Economy
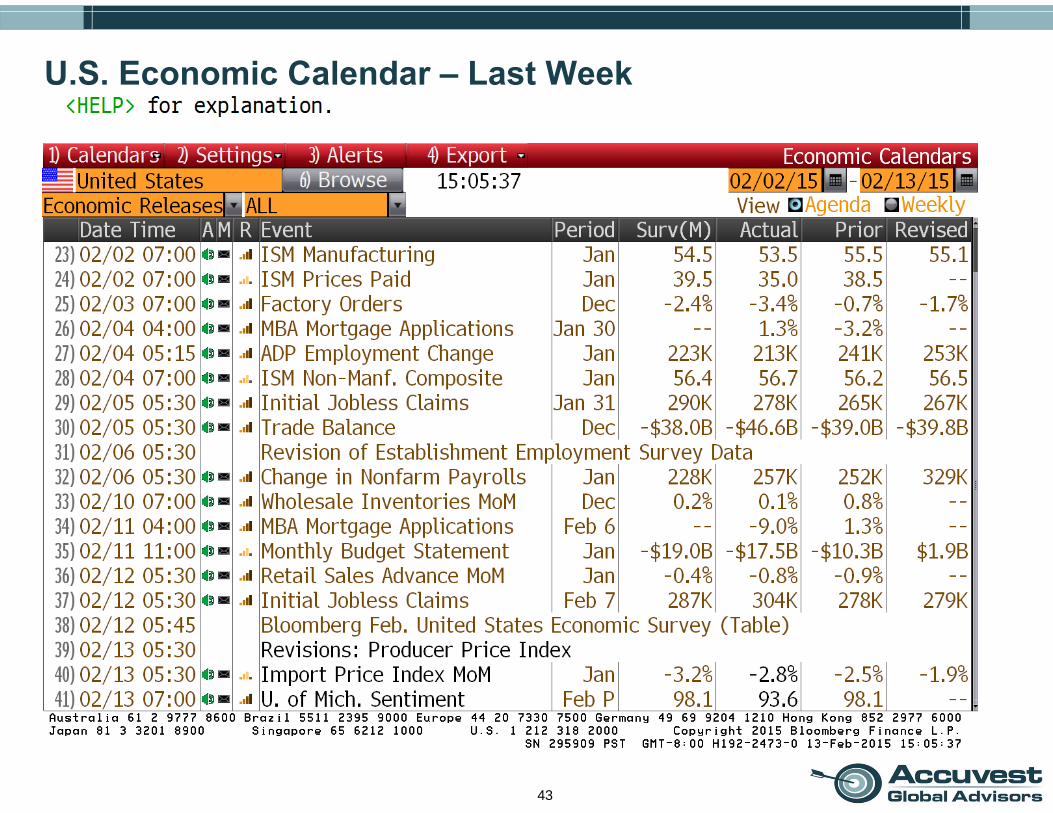
43
U.S. Economic Calendar – Last Week
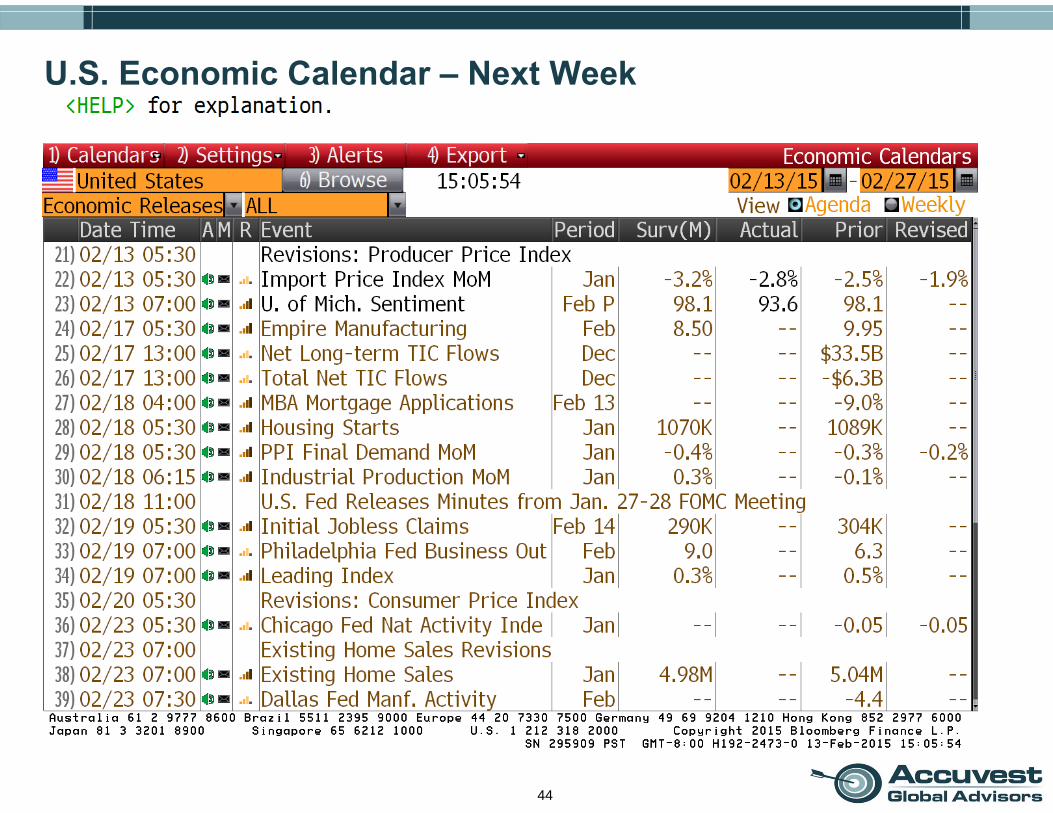
44
U.S. Economic Calendar – Next Week

Russia & Greece

46
Greece 5 Year CDS

47
Russia 5 Year CDS
Top Related