


Languages
Pages
Legal


8/20/2019 WellFlo® Well-Analysis Software
http://slidepdf.com/reader/full/wellflo-well-analysis-software 1/12
mpletion
oduction
ervention
Drilling
aluation
Production optimization
Articial lift
Control systems
Flow measurement
Reservoir monitoring
Software
– Analysis Workbench articial-lift analysis
– DataMart™ analytical data
– DTSPlus™ temperature proling
– DynaLift™ dynamic gas-lift optimization
– i-DO® real-time optimization solution – LOWIS™ life-of-well information software
– MatBal® reservoir analysis and production
forecasting
– PanMesh™ numerical well-test analysis
– PanSystem® well-test analysis
– PetroAtlas™ petroleum engineering
knowledgebase
– PVTex™ uid property analysis
– ReO® network management optimization
– ReO Forecast™ production forecasting and
eld planning
– RigPlan™ resource scheduling
– RMS reservoir monitoring system
– Verge™ production surveillance
– WellFlo® well analysis
– WellScribe™ mobile data collection
– WSM well-service manager
Subsea production
WellFlo®
Well-Analysis Software
Production optimization software tools
Field Office™
8/20/2019 WellFlo® Well-Analysis Software
http://slidepdf.com/reader/full/wellflo-well-analysis-software 2/12
© 2008–2011 Weatherford. All rights reserved.2
Design, model, optimize and troubleshoot naturally owing
or articially lifted individual oil and gas wells.
Weatherford’s production optimization
division provides solutions to increase
production and lower lifting costs in
greenelds and brownelds. We deliver
agile, well-supported products and
services that foster innovative optimizing
approaches for owing wells and all
forms of articial lift. The software,
hardware and completion solutions help
you work better, smarter and faster.
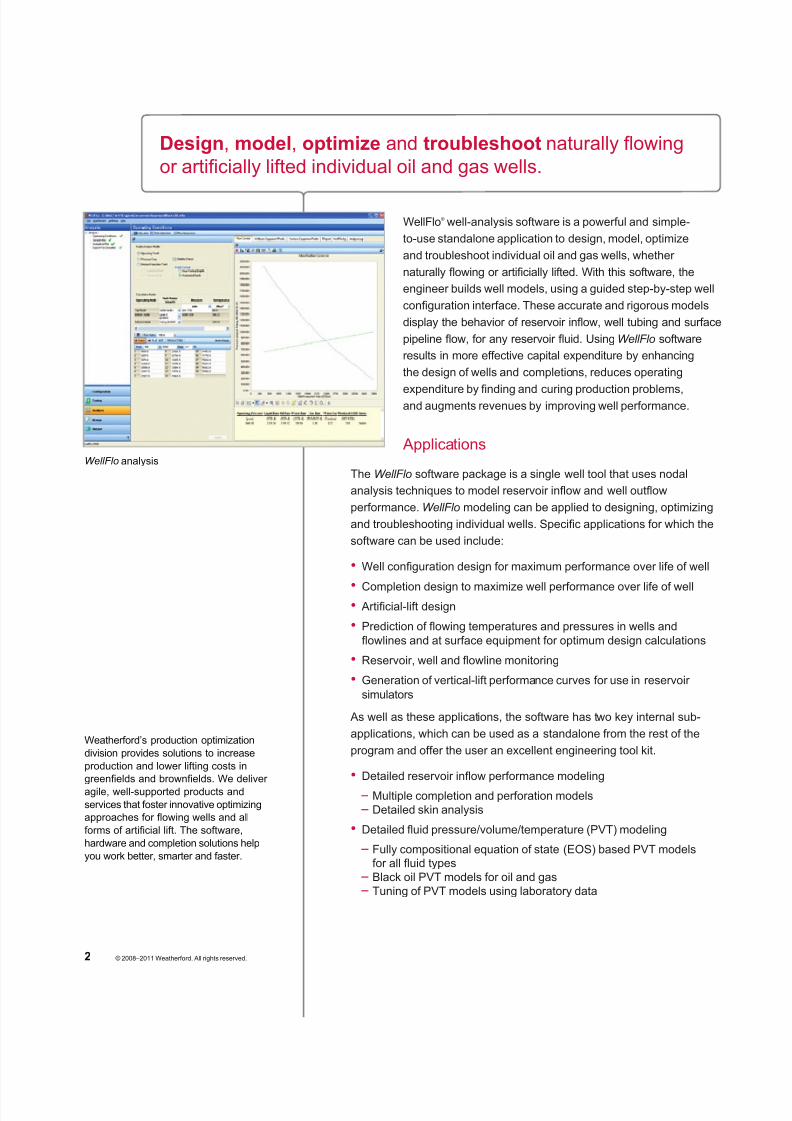
WellFlo analysis
WellFlo® well-analysis software is a powerful and simple-
to-use standalone application to design, model, optimize
and troubleshoot individual oil and gas wells, whether
naturally owing or articially lifted. With this software, the
engineer builds well models, using a guided step-by-step well
conguration interface. These accurate and rigorous models
display the behavior of reservoir inow, well tubing and surface
pipeline ow, for any reservoir uid. Using WellFlo software
results in more effective capital expenditure by enhancing
the design of wells and completions, reduces operating
expenditure by nding and curing production problems,and augments revenues by improving well performance.
Applications
The WellFlo software package is a single well tool that uses nodal
analysis techniques to model reservoir inow and well outow
performance. WellFlo modeling can be applied to designing, optimizing
and troubleshooting individual wells. Specic applications for which the
software can be used include:
• Well conguration design for maximum performance over life of well
• Completion design to maximize well performance over life of well• Articial-lift design
• Prediction of owing temperatures and pressures in wells and
owlines and at surface equipment for optimum design calculations
• Reservoir, well and owline monitoring
• Generation of vertical-lift performance curves for use in reservoir
simulators
As well as these applications, the software has two key internal sub-
applications, which can be used as a standalone from the rest of the
program and offer the user an excellent engineering tool kit.
• Detailed reservoir inow performance modeling
– Multiple completion and perforation models
– Detailed skin analysis
• Detailed uid pressure/volume/temperature (PVT) modeling
– Fully compositional equation of state (EOS) based PVT models
for all uid types
– Black oil PVT models for oil and gas
– Tuning of PVT models using laboratory data

8/20/2019 WellFlo® Well-Analysis Software
http://slidepdf.com/reader/full/wellflo-well-analysis-software 3/12
© 2008–2011 Weatherford. All rights reserved.
WellFlo® Well-Analysis Software
3
Inow and completion modeling
Well inow is an important factor in a
well’s performance. If your information
is limited, the WellFlo interface enables
you to enter a productivity index (PI),
reservoir pressure and inow model
such as Vogel. Alternatively, detailed
completion data—including damaged
zone, well deviation, partial penetration,
perforating specication, gravel-pack
information and fracture geometry—can
be entered to predict the effect on well
deliverability for vertical and horizontal wells.
A multilayer model is included for composite systems,
with each layer having its own uid, completion and inow
model. This model benets petroleum engineers who
are designing new completions or diagnosing problems
in performance. A sophisticated constant mass ow-rate
inow model can be used to include relative permeability
effects. These can be entered through tables or Corey
coefcients. This provides an extremely accurate technique
for performance forecasting in condensate and gas-cap
drive reservoirs, and is especially useful in predicting
performance as reservoir conditions and phase fractions
change in these elds.
PVT modeling
All pressure and ow modeling in hydrocarbon systems relies
on accurate modeling of uid properties as they vary with
pressure and temperature. The WellFlo PVT package includes
the important standard black oil correlations as well as fully
compositional EOS-based PVT. Both PVT models could
be tuned to laboratory data, such as constant composition
expansion (CCE), differential vaporization (DV), and constant
volume depletion (CVD). The application offers a wide choice
of industry standard black oil PVT correlations as well as
EOS, namely Peng Robinson and Soave Redlick Kwong
(SRK). The tuned correlation/EOS is then used throughoutthe program to calculate uid properties. As a result, you can
rely on the accuracy of the software’s performance predictions
and optimization operations, which often depend on accurate
calculations of uid properties. The application handles the
mixing uids from different layers very accurately and thus
enables users to specify different gas-oil ratios (GORs) for
different layers or gas composition for lift gas.
Inow
performance
plot comparing
multiple inow
performance
relationship
(IPR) methods
Relative permeability interface
Reservoir layers data

8/20/2019 WellFlo® Well-Analysis Software
http://slidepdf.com/reader/full/wellflo-well-analysis-software 4/12
© 2008–2011 Weatherford. All rights reserved.4
Flow assurance
The ow-assurance functionality enables users to perform
hydrate, wax and asphaltene analysis at any point in the well.
The application computes the solid formation curves using
in-situ uid composition dynamically and then displaying them
along with the calculated pressure and temperature prole for
fast and efcient analysis. The hydrate section also offers a
choice of industry standard inhibitors to mitigate the hydrate
formation risk proactively.
Tuning of well models
To be certain that analysis results can be trusted to match
reality, users need a way to tune their well model to measured
data. With many software packages, this task can prove to
be labor-intensive and challenging. In WellFlo®
software, thistask has been greatly simplied through the development of
an all new tuning mode. In this mode, users can use owing
pressure-gradient surveys to tune their outow performance
model and they can use multiple production well-test data sets
to tune their inow performance model.
The user can also perform tuning exercises for many ow
correlations simultaneously. The application displays the
results of all of them together for easy selection of the best
t correlation. For IPR tuning, WellFlo software can act as a
production well-test repository (for one year) and all the well
tests can be employed simultaneously for a tuning task.
Pressure traverse and temperature calculations
The pressure drop and temperature change between the bottom of the
well and the surface is normally the largest drop in the system. WellFlo
pressure-drop analysis incorporates all the important correlations for
this calculation. The temperature modeling options include manual
denition of temperature at each node, calculated and calibrated heat-
loss models, and a coupled temperature-pressure model. These options
enable you to dene heat-loss factors, either through the system’s
calculation or by direct input.
Plots of measured data and predictions can be shown simultaneously
on-screen enabling rapid matching. When performing pressure
traverse calculations, you have the option to capture other data instead
of pressure and temperature, such as in-situ phase densities and
velocities, ow regime and hold-up, plus the gravitational, frictional
and acceleration terms of the pressure drop. This data can be useful in
determining, for example, if erosional velocity limits are being exceeded.
Gas hydrates–inhibitors
Pressure and temperature versus depth
analysis for a gas-lift well
Tuning inow performance relationship
to measured data

8/20/2019 WellFlo® Well-Analysis Software
http://slidepdf.com/reader/full/wellflo-well-analysis-software 5/12
© 2008–2011 Weatherford. All rights reserved.
WellFlo® Well-Analysis Software
5
Data export and import
WellFlo data export tools generate vertical ow table data
in DOS or UNIX format for use in Eclipse™, VIP® and other
reservoir simulators. These les are simply pasted into
the control decks for the simulator. Therefore, it becomes
practical to generate a vertical ow prole table for every well
in a eld appropriate to that particular well. Without this direct
link to simulators, a typical table is used for all wells because
of the shear impracticality of generating one table per well.
Report les can be generated in tab-separated form
to enable easy export of data to word processing and
spreadsheet packages. The ability to cut-and-paste in
the Windows® environment enables efcient generation
of reports, including graphs and other screen captures. A
graphics export option also enables plots to be saved directly
to le in a number of formats.
• UNIX and DOS owing-pressure-le generation for Eclipse,
VIP, CHEARS™, SimBest™ I and II, IMEX™, MoReS™,
GCOMP, COM4, sensor reservoir simulators and a multiwell
batch mode is available for some outputs.
• Key-worded le output is available for data transfer to other applications.
• Graphics export facility saves plots directly to le (BMP, GIF, JPG and
TIF formats).
• Reports can be opened directly in programs such as Word and Excel®.
Measured pressure depth or pressure and rate data can be imported
into theWellFlo
data repository and plotted on the same graphs as themodel’s prediction. This capability signicantly reduces the time taken
to produce a matched data model. An auto-regression option estimates
the optimum ow correlation tuning factor by a least-squares t to the
measured data.
Eclipse, VIP, CHEARS, MoReS, IMEX SimBest, Excel and Windows are registered trademarks of their
respective companies.
Data export interface
8/20/2019 WellFlo® Well-Analysis Software
http://slidepdf.com/reader/full/wellflo-well-analysis-software 6/12
© 2008–2011 Weatherford. All rights reserved.6
Gas-lift design and analysis
Using the program’s specialized capabilities for gas lift,
engineers can design and model gas-lift installations and
determine the optimum number and position of the gas-lift
valves, as well as the injection rate taking into account the
available injection pressure.
Gas-lift design and diagnosis is a strength of the software,
making it a uniquely powerful gas-lift system—with its link
to the only commercially available dynamic gas-lift simulator,
Weatherford’s DynaLift™ program. This feature is critical in
a tool used for full gas-lift-system modeling and optimization.
This program enables you to incorporate gas-injection rate or
gas-liquid ratio terms as preferred. Together with the casing
head pressure, these factors are input as sensitivity variables. For every
rate specied, the program determines which valve is being used forgas injection so that the system’s predictions are always accurate.
WellFlo®
features include the following modes of operation for analyzing
and designing gas-lift systems:
• Continuous gas-lift design–deepest point of injection
• Gas-lift design–valve spacing for continuous and intermittent gas-
lift installations
• Gas-lift design–valve sizing
• Gas-lift performance analysis–for continuous gas lift
• Advanced gas-lift valve modeling (AGVM)–for continuous gas lift,
true-valve performance
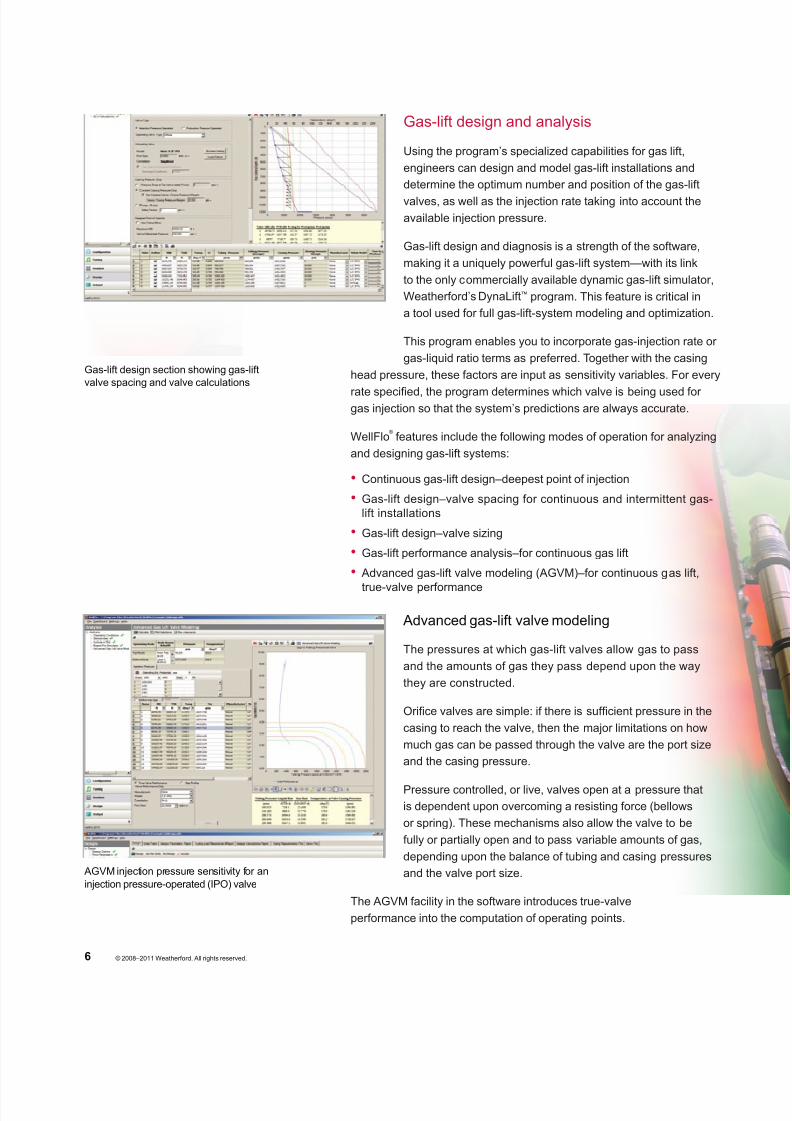
Advanced gas-lift valve modeling
The pressures at which gas-lift valves allow gas to pass
and the amounts of gas they pass depend upon the way
they are constructed.
Orice valves are simple: if there is sufcient pressure in the
casing to reach the valve, then the major limitations on how
much gas can be passed through the valve are the port size
and the casing pressure.
Pressure controlled, or live, valves open at a pressure that
is dependent upon overcoming a resisting force (bellows
or spring). These mechanisms also allow the valve to be
fully or partially open and to pass variable amounts of gas,
depending upon the balance of tubing and casing pressures
and the valve port size.
The AGVM facility in the software introduces true-valve
performance into the computation of operating points.
Gas-lift design section showing gas-lift
valve spacing and valve calculations
AGVM injection pressure sensitivity for an
injection pressure-operated (IPO) valve

8/20/2019 WellFlo® Well-Analysis Software
http://slidepdf.com/reader/full/wellflo-well-analysis-software 7/12
© 2008–2011 Weatherford. All rights reserved.
WellFlo® Well-Analysis Software
7
Electric submersible pumping (ESP) systems
WellFlo ESP module enables you to size new ESPs and
analyze performance of already installed ESPs. By using the
what-if scenarios feature of the software, you can virtually try
components of the system before deploying.
WellFlo software features extensive pump and motor catalogs
of world-leading ESP manufacturers. This benet enables
the best pump and motor selection for given well conditions.
WellFlo’s unique design approach automatically sizes a
complete ESP system consisting of a pump, motor and
cable, taking into consideration PI of the well, total dynamic
head (TDH) requirements, maximum allowable number of
stages for each pump model, motor efciency and maximum
recommended voltage drop in cable. After you have picked
one of the assemblies, it can be manually modied by
changing a motor or the number of pump stages to meet
the requirements of the available inventory in the eld.
WellFlo software provides a robust set of tools to size ESPs for
challenging well conditions such as emulsion or high free gas. An
application engineer can model emulsion in the PVT module of the
software. This way software predicts correct TDH and HP requirements.
Dunbar correlation is available to size and model ESP performance
in gassy wells. Dunbar correlation denes the minimum pump intake
pressure at which the well is still considered pumpable. Dropping intake
pressure below that leads to gas lock.
WellFlo software enables you to input measured intake and discharge
pressures and enables you to analyze performance of the existing ESP
and validate well-test data.
Multiple sensitivities on well conditions, changing frequency or wear
can be run to simulate future operational conditions and analyze uplift
potentials for production optimization.
ESP design mode

8/20/2019 WellFlo® Well-Analysis Software
http://slidepdf.com/reader/full/wellflo-well-analysis-software 8/12
Progressing cavity pump (PCP) analysis
WellFlo®
software helps engineers analyze, optimize and
troubleshoot the performance of PCP systems. The module
uses nodal analysis techniques to model reservoir inow
and PCP well outow performance and denes the operating
range based on the conguration of the equipment.
The downhole equipment and the well performance can be
analyzed and optimized efciently by using nodal analysis.
This capability ensures that the equipment is correctly sized
based on the limits of the conguration of the equipment and
the application.
The module provides a catalog in the form of an equipment
database that enables the user to congure surface and
downhole equipment. The surface equipment includes
driveheads, electric motors and variable speed drives. The downholeequipment consists of casing and tubing, pumps, sucker rod string,
couplings and centralizers.
WellFlo analysis uses pump performance curves to determine the
operating parameters. It also has a special feature that enables the user
to calibrate the performance curve (ow and torque) based on actual
measured data and uses the new pump performance in the well model.
The PCP features include:
• Modeling of single and multiphase ow
• Viscosity modeling option for constant viscosity, viscosity based on
temperature effects and emulsion viscosity
• Extensive online downhole and surface equipment catalog
• Custom equipment option so user can add catalogs to the database
• Pump performance curves with measured data calibration feature
• Sucker rod design function for standard, continuous and hollow rods
along with couplings and centralizers
• Wellbore deviation conguration
• IPR and PVT tuning
• Operating point analysis with options to analyze based on
rate or speed
WellFlo PCP analysis
© 2008-2011 Weatherford. All rights reserved.8

8/20/2019 WellFlo® Well-Analysis Software
http://slidepdf.com/reader/full/wellflo-well-analysis-software 9/12
WellFlo® Well-Analysis Software
Jet Pump
The WellFlo jet pump module enables new jet pump design
and analyzes performance of already installed jet pumps.
The software lists suitable pump combinations enabling thebest pump/nozzle selection for given well conditions. During
pump conguration, the combination choice displays the
performance curve along with the cavitation regions for both
power uid and production uid, providing the user a quick
guide to keep the operating point outside the cavitation regions.
WellFlo software’s unique design approach automatically
shows all suitable combinations available for a pump
and nozzle, taking into consideration well and operating
conditions. The list provides the operating range for the
minimum and maximum injection pressures that the facility
can handle and displays the rate of power uid neededalong with the required horsepower for the target production
rate. Optimizing the pump provides the required operating
pressure for expected production.
© 2008-2011 Weatherford. All rights reserved. 9
WellFlo’s jet pump design section with the list
of suitable pump combinations

8/20/2019 WellFlo® Well-Analysis Software
http://slidepdf.com/reader/full/wellflo-well-analysis-software 10/12
© 2008–2011 Weatherford. All rights reserved.10
Pseudo-pressure le generator (PPFG)
The multiphase PPFG (link with third-party PVT packages) is an additional
application that creates a table of multiphase pseudo-pressures from the
client’s own PVT. This application enables the clients to use their own PVT
modeling package. The multiphase pseudo-pressures generated by PPFG
can then be imported into WellFlo®
software for use in IPR calculations.
The PVT data are generated by the user’s preferred PVT package and
supplied to the software in the form of an ASCII le containing a table of
phase properties versus pressure at a specied (reservoir) temperature.
Properties required are viscosity, density and, for oil and condensate
systems, gas-mass fraction.
PPFG interfaces with WellFlo software via an external API link to extract
the relative permeability data which is part of the well and reservoir
model contained in the well le.
The generator then creates a multiphase pseudo-pressure le. This le
can be imported into the software and used as the basis for layer IPR
calculations. The use of external PVT data is an alternative to the use of
the software’s own internal PVT models, such as four-component EOS and
black oil correlations.
Each layer in the WellFlo model can be assigned its own pseudo-
pressure le, and each pseudo-pressure le can be generated from a
different set of PVT data so the accurate modeling of variations in uid
properties with depth and their effect on IPR becomes possible.
Document management
The latest software version addresses one of the most
important, yet often-overlooked, tasks facing users of the
program, through the development of a unique document
management system. Upon completion of an analysis or
design, users generally want to display and then save their
work in the form of a chart or report. Unfortunately, most
software packages do not provide an easy way of doing this.
In most cases, the chart or report is only available for viewing
for as long as it is displayed on the screen. The creators of
the WellFlo systems analysis platform have developed a new
feature called Output, which addresses this need. Users cannow save and organize any chart or report that is generated in
the software. Once the item is saved, it is available for viewing
in the Output section, where it can easily be recalled using
the document management feature that is provided. This feature means
that users can easily display, print or e-mail any analysis results from any
well model, regardless of which model is active at the time. This benet
can save the user hours of frustration and wasted effort while providing a
seamless way of viewing the results of prior analysis runs.
Output mode

8/20/2019 WellFlo® Well-Analysis Software
http://slidepdf.com/reader/full/wellflo-well-analysis-software 11/12
WellFlo® Well-Analysis Software
© 2008-2011 Weatherford. All rights reserved. 11
Conclusion
The WellFlo well-analysis package is a sophisticated well-modeling tool
with a wide application for all producing or injecting oil wells. With more
than a decade of use in applications in all major hydrocarbon-producing
regions, it has beneted from the wide range of technical environments
in which it has been used. WellFlo software builds on this pedigree,
providing a new level of sophistication, exibility and ease-of-use. As
the product matures and future enhancements are made, this robust
analysis tool will continue to provide unsurpassed capabilities for well
modeling and optimization.
The WellFlo program is part of Weatherford’s Field Office™ software
tools that include:
• Analysis Workbench articial-lift analysis
• DataMart™ analytical data
• DTSPlus™ temperature proling
• DynaLift™ dynamic gas-lift optimization
• i-DO® real-time optimization solution
• LOWIS™ life-of-well information software
• MatBal® reservoir analysis and production forecasting
• PanMesh™ numerical well-test analysis
• PanSystem® well-test analysis
• PetroAtlas™ petroleum engineering knowledgebase
• PVTex™ uid property analysis
• ReO® network management optimization
• ReO Forecast™ production forecasting and eld planning
• RigPlan™ resource scheduling
• RMS reservoir monitoring system
• Verge™ production surveillance
• WellScribe™ mobile data collection
• WSM well service manager

8/20/2019 WellFlo® Well-Analysis Software
http://slidepdf.com/reader/full/wellflo-well-analysis-software 12/12
weatherford.com
Weatherford products and services are subject to the Company’s standard terms and conditions, available on request or at weatherford.com. For more information contact an authorized Weatherford representative. Unless noted
otherwise, trademarks and service marks herein are the property of Weatherford and may be registered in the United States and/or other countries. Weatherford products named herein may be protected by one or more U.S.
and/or foreign patents. For more information, contact [email protected]. Specications are subject to change without notice. Weatherford sells its products and services in accordance with the terms and conditions set
forth in the applicable contract between Weatherford and the client.
© 2008–2011 Weatherford. All rights reserved. 5943.01
Weatherford provides worldwide service and support from more than 900 locations in
approximately 100 countries. To nd out more about our production optimization software tools,
contact an authorized Weatherford representative or visit weatherford.com.
Production optimization software tools
WellFlo® Well-Analysis Software
Top Related