


Languages
Pages
Legal

Changing Economic
World
AQA GCSE Geography 9 to 1 - Cool Geography Homework BookChanging Economic World Homework Booklet
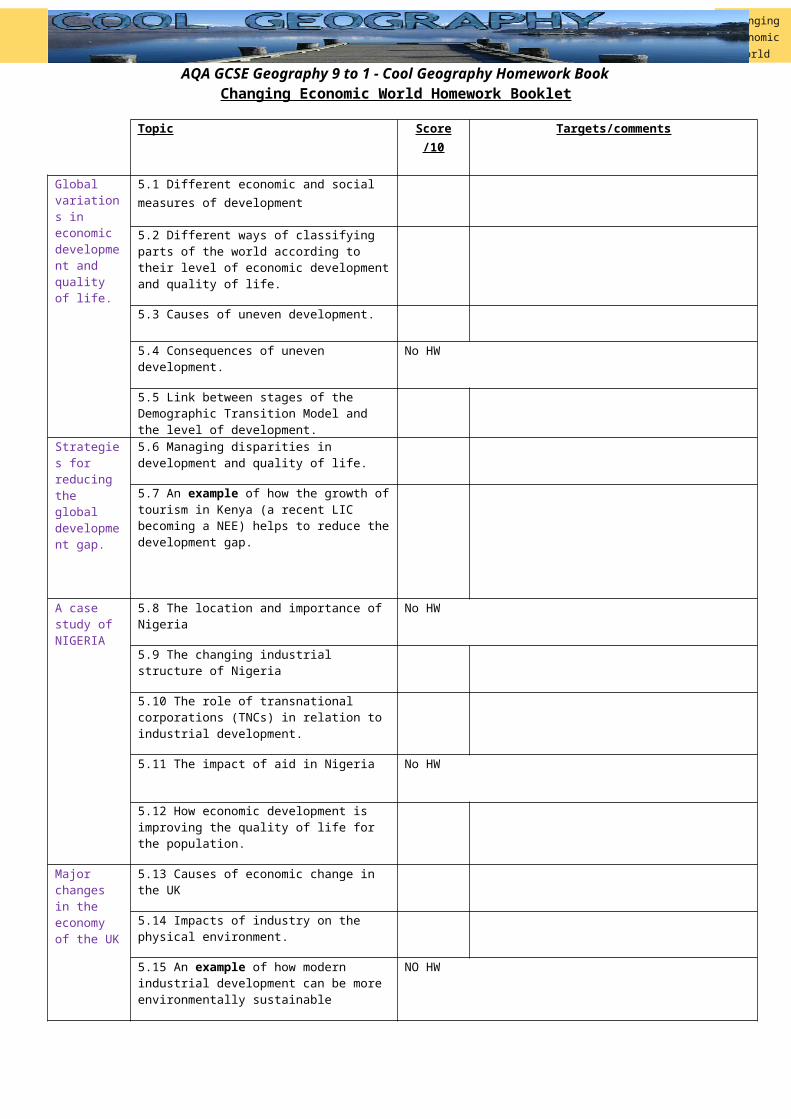
Topic Score /10 Targets/comments
Global variations in economic development and quality of life.
5.1 Different economic and social measures of development
5.2 Different ways of classifying parts of the world according to their level of economic development and quality of life.
5.3 Causes of uneven development.
5.4 Consequences of uneven development. No HW
5.5 Link between stages of the Demographic Transition Model and the level of development.
Strategies for reducing the global development gap.
5.6 Managing disparities in development and quality of life.
5.7 An example of how the growth of tourism in Kenya (a recent LIC becoming a NEE) helps to reduce the development gap.
A case study of NIGERIA
5.8 The location and importance of Nigeria No HW
5.9 The changing industrial structure of Nigeria
5.10 The role of transnational corporations (TNCs) in relation to industrial development.
5.11 The impact of aid in Nigeria No HW
5.12 How economic development is improving the quality of life for the population.
Major changes in the economy of the UK
5.13 Causes of economic change in the UK
5.14 Impacts of industry on the physical environment.
5.15 An example of how modern industrial development can be more environmentally sustainable
NO HW
5.16 The rural economy of the UK
5.17 improvements and new developments in road and rail infrastructure, port and airport capacity
5.18 The North–South divide.
5.19 The place of the UK in the wider world. Revise for test

Changing Economic
World
AQA GCSE Geography 9 to 1 - Cool Geography Homework Book
HOMEWORK 5.1
Read pages 2 & 3
1. Annotate the map below to describe the patterns of HDI
2. Pick your top 3 measures for showing the development of a place (e.g. Life expectancy, GNI, HDI, Infant mortality, education, Literacy rate, Happy planet index etc.)
1. 2. 3. 3. Justify your ranking – why are these the best indicators?
SCORE123456789
10

Changing Economic
World
AQA GCSE Geography 9 to 1 - Cool Geography Homework Book
HOMEWORK 5.2
Read pages 4 to 5
1. Using an Atlas and the GNI map below complete the
table below;
2. According to the data in the table above, which countries are correctly classified as North or South?
3. According to the data in the table above, which countries are INcorrectly classified as North or South?
4. What does this information reveal about the VALIDITY (how accurate it is) of the North South Divide line from 1971?
5. Which method of classifying countries do you prefer (First, second and third world method; North-South divide; HIC-LIC; or 5 fold division of wealth) and WHY?
SCORE123456789
10
Country GNI on map North or South of the Brandt
Line?
UK
South Africa
Madagascar
Brazil
USA
Ukraine

Changing Economic
World
AQA GCSE Geography 9 to 1 - Cool Geography Homework Book
HOMEWORK 5.2b
Hypothesis: As GDP Increases the % GDP from Agriculture Decreases
CountryGDP US$ per
Capita% GDP from agriculture
Japan 34,000 3.9
USA 47,200 1.2
Italy 30,500 1.8
UK 34,800 0.9
Kuwait 48,900 0.3
Mexico 13,900 4.2
Malaysia 14,700 9.1
Brazil 10,800 6.1
Egypt 6,200 13.5
India 3,500 16.1
Kenya 1,600 22
Bangladesh 1,700 18.4
Burkina Faso 1,200 30.1
1. Plot the points above as a scatter graph on the paper provided. Remember to add a line of best fit.
2. Is the relationship positive, negative or No relationship?
3. Is the Hypothesis “As GDP Increases the % of GDP from Agriculture Decreases” true or false.
Give reasons for your answer.
0
10,0
00
20,0
00
30,0
00
40,0
00
50,0
00
05
101520253035
Graph comparing GDP amounts with % GDP from agriculture
GDP
% o
f GDP
from
agr
icul
ture
SCORE123456789
10

Changing Economic
World
AQA GCSE Geography 9 to 1 - Cool Geography Homework Book
HOMEWORK 5.3
Read pages 9 and 10
1. Add to the diagram above at least 4 ways that you could break the cycle of poverty.2. How do PHYSICAL factors affect the level of development of your country?
3. Explain how world trade is UNFAIR on LICs, the world’s poorest countries
SCORE123456789
10

Changing Economic
World
AQA GCSE Geography 9 to 1 - Cool Geography Homework Book
HOMEWORK 5.5
Read pages 12 to 14
1. Describe the patterns on the map of
inequality opposite. The higher the
figure shown, the greater the
inequality between rich and poor in
the country.
2. Use the graphs opposite to answer the questions below;a) What stage of the demographic transition model was INDIA
in in 1950-55?
b) What stage of the demographic transition model was CHINA in in 1960-65?
c) What stage of the demographic transition model was INDIA in in 2010-2015?
3. Draw an annotated population pyramid to show the stage of the demographic transition model China had reached by 2010.
SCORE123456789
10

Changing Economic
World
AQA GCSE Geography 9 to 1 - Cool Geography Homework Book
HOMEWORK 5.6
Read pages 16 to 18
Complete the table below to assess the impacts of the various ways to help countries out of poverty. Remember that impacts can be positive and negative.
Socially Economically
Environmentally
Trade
Fair Trade
Investment
Loans
SCORE123456789
10

Changing Economic
World
AQA GCSE Geography 9 to 1 - Cool Geography Homework Book
HOMEWORK 5.7
Read pages 20 and 21
1. Describe the changes in the number of tourists arriving in Kenya over time. Use data in your response.
2. Is tourism a good industry for Kenya to use to bridge the development gap? Use the table on page 21 Evaluate the impact of tourism on Kenya.
SCORE123456789
10

Changing Economic
World
AQA GCSE Geography 9 to 1 - Cool Geography Homework Book
HOMEWORK 5.9
Read pages 24 to 25
% Share of GDP 1975 % Share of GDP 2014 % Workforce 19990%
10%20%30%40%50%60%70%80%90%
100%
68.9
20.6
10.4
25.6
20.7
53.8
The changing Economic structure of Nigeria Tertiary SecondaryPrimary
% o
f GDP
from
sect
or O
R %
peo
ple
empl
oyed
in se
ctor
3. COMPLETE the graph above by making a stacked column for % workforce in 1999 using the data below;
4. Using the graph what has happened to primary, secondary and tertiary % share of GDP OVER TIME?
Primary:
Secondary:
Tertiary:
5. CONTRAST the % share of GDP with the % workforce in each sector in 1999.
6. Should Nigeria be more developed than it currently is?
SCORE123456789
10
Primary 70
Secondary 10
Tertiary 20

Changing Economic
World
AQA GCSE Geography 9 to 1 - Cool Geography Homework Book
HOMEWORK 5.10
Read pages 27 and 28
Is Shell a positive force In Nigeria? Discuss this with reference to both
sides of the argument
Suggested structure
Introduction – basic facts about Shell in Nigeria
Paragraph 1- positives of Shell’s work in Nigeria
Paragraph 2– negatives of Shell’s work in Nigeria
Conclusion –Your opinion and why you hold that view
SCORE123456789
10

Changing Economic
World
AQA GCSE Geography 9 to 1 - Cool Geography Homework Book
HOMEWORK 5.12
Read page 31
Look at the graph below. Describe the patterns in GDP and population over time
Look at the infographic; has quality of
life for Nigerians improved? Use data to
support your response
1995
1997
1999
2001
2003
2005
2007
2009
2011
2013
0
20,000,000
40,000,000
60,000,000
80,000,000
100,000,000
120,000,000
140,000,000
160,000,000
180,000,000
200,000,000
0
500
1000
1500
2000
2500
3000
3500
A graph showing the population and GDP of NIGERIA over time
Population
GDP per capita
Popu
latio
n
GDP
in U
S $
per p
erso
n
SCORE123456789
10

Changing Economic
World
AQA GCSE Geography 9 to 1 - Cool Geography Homework Book
HOMEWORK 5.13
Read pages 33 and 34
1750 1800 1850 1900 1950 2000 20500
10
20
30
40
50
60
70
80
0
5 1016
20 2124
42
6873.5
29
42
56
61
50
24
15.2
Changes in employment structure in the UK over time
PrimarySecondaryTertiaryQuaternary
% o
f wor
kers
em
ploy
ed in
the
sect
or
1. Use the data below to complete the graph above by adding a line showing the change in the % of people
working in Primary industries
1750 1800 1850 1900 1950 2000 2014Primary 55 38 23 15 8 3 1.3
2. Describe the change in UK employment structure over time
3. Which employment area (P,S,T or Q) would you and your friends like to work in? What is your/their
dream job? Why? What does this mean for the UK?
SCORE1234567

Changing Economic
World
AQA GCSE Geography 9 to 1 - Cool Geography Homework Book
HOMEWORK 5.14
Read pages 35 and 36
Produce a revision mind map on how Industry can affect the environment, consider the land, air and water on your
mind map.
Read through the information about Teesside on pages 35 and 36. Look also at page 38. What is the future for heavy
industry areas like Teesside in the UK? How can they adapt to the new economy of the UK?
SCORE1234567
SCORE123456

Changing Economic
World
AQA GCSE Geography 9 to 1 - Cool Geography Homework Book
HOMEWORK 5.16
Read pages 39 to 41
Look at the maps below, where do Milfield and Alnwick fit in terms of the Rural-Urban classification and Sparsity?
Rural-Urban classification Sparsity
Alnwick
Milfield
What problems does Milfield face in the long term?
How would you manage those problems?
SCORE123456
SCORE1234567
Changing Economic
World
AQA GCSE Geography 9 to 1 - Cool Geography Homework Book
HOMEWORK 5.17
Read pages 42 to 43
1. Define the term “Infrastructure”
2. List some major Infrastructure links in your local area
3. Complete the Venn diagram about the HS2 project
4. In your view should HS2 be going ahead? JUSTIFY (give reasons for) your view
ECONOMIC
ENVIRONMENTAL SOCIAL
SCORE1234567
SCORE1234567

Changing Economic
World
AQA GCSE Geography 9 to 1 - Cool Geography Homework Book
HOMEWORK 5.18
Look at the graphic below. Is enough being done to make the Northern Powerhouse a reality? You might want to
research this on the internet to get extra ideas for your response.
SCORE1234567
SCORE12345678

Changing Economic
World
AQA GCSE Geography 9 to 1 - Cool Geography Homework Book
COPYRIGHT NOTICE
This document is the copyrighted property of Robert Gamesby and http://www.coolgeography.co.uk
This document can be copied, revised, customised and used for the use of a PAID SUBSCRIBING SCHOOL ONLY under the
conditions of the School Subscribers Agreement found at http://www.coolgeography.co.uk
PROHIBITED USES
The School shall not and shall procure that each and every Authorised User within their school does not:
Copy, print out or otherwise reproduce any Resources (in whole or part) for any commercial use or any of purpose
except as permitted under the School Subscribers Agreement or authorised in advance by
Http://www.coolgeography.co.uk in writing;
Mount or distribute any part of the Resources on any electronic network, including TES resources, Nings, file sharing
sites etc.
Remove or alter any copyright notices or means of identification or disclaimers as they appear in the Resources. This
includes the BACKGROUNDS of PowerPoints which have a copyright notice on them.
NOTE
I have spent hundreds of hours putting the resources together, please respect my work!
Slash and burn photograph - By mattmangum (Slash and Burn) [CC BY 2.0 (http://creativecommons.org/licenses/by/2.0)], via Wikimedia Commons
SCORE12345678
Top Related