


Languages
Pages
Legal


Waterfront Residential Market Statistics
Lake of the Ozarks, Missouri
October 2011
0
25
50
75
100
Jan Feb Mar Apr May Jun Jul Aug Sep Oct Nov Dec
16
24
41
30
62
5153
60
41
65
43
39
24 25
37
42 42
46
42
69
60 59
34 33
2528 29
59
46
5254
83
56
201120102009
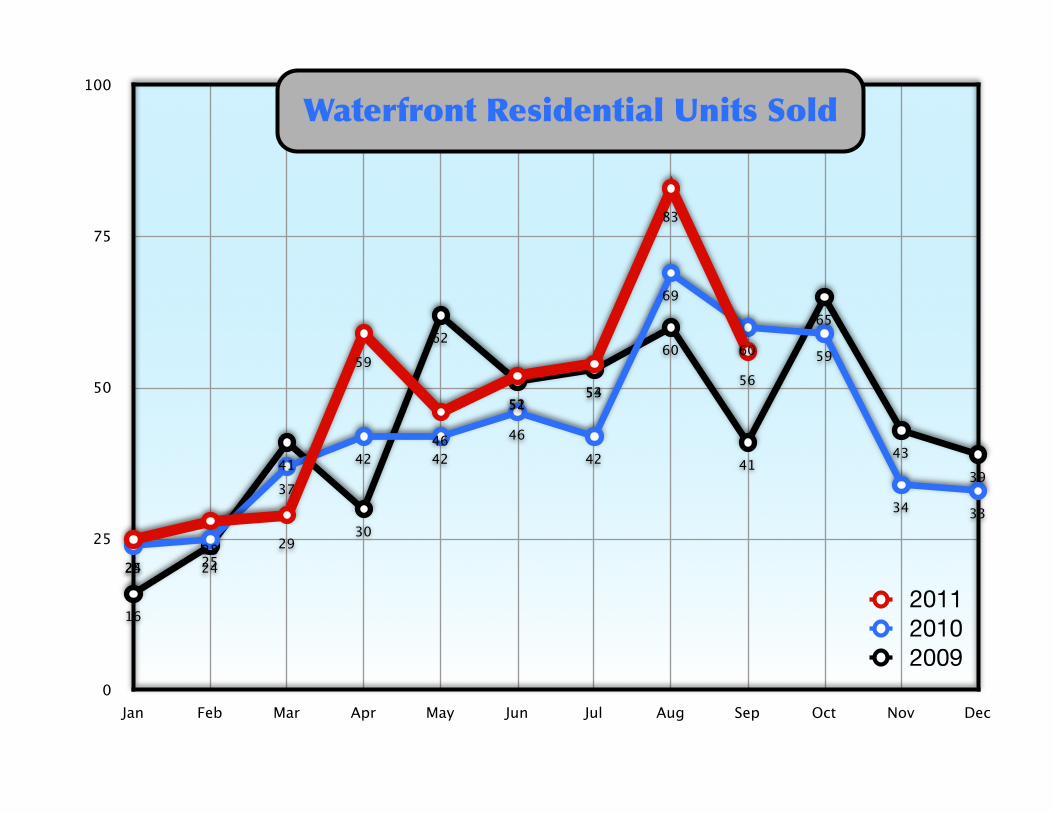
Waterfront Residential Units Sold

WF Sold
Jan Feb Mar Apr May Jun Jul Aug Sep Oct Nov Dec
201120102009
25 28 29 59 46 52 54 83 5624 25 37 42 42 46 42 69 60 59 34 3316 24 41 30 62 51 53 60 41 65 43 39
Waterfront Residential Units Sold
Note: The second page of data is the same information as the graphed page, just in a different format for different people :)
<200
200-300
300-400
400-500
500-600
600-700
700-800
800-900
900-1M
1M-1.5M
1.5M-2M
2M +
0 12.5 25.0 37.5 50.0
252.0
38.4
28.6
36.0
29.3
45.0
26.4
24.7
20.5
23.6
27.0
15.9
Chart 2
Months of Inventory
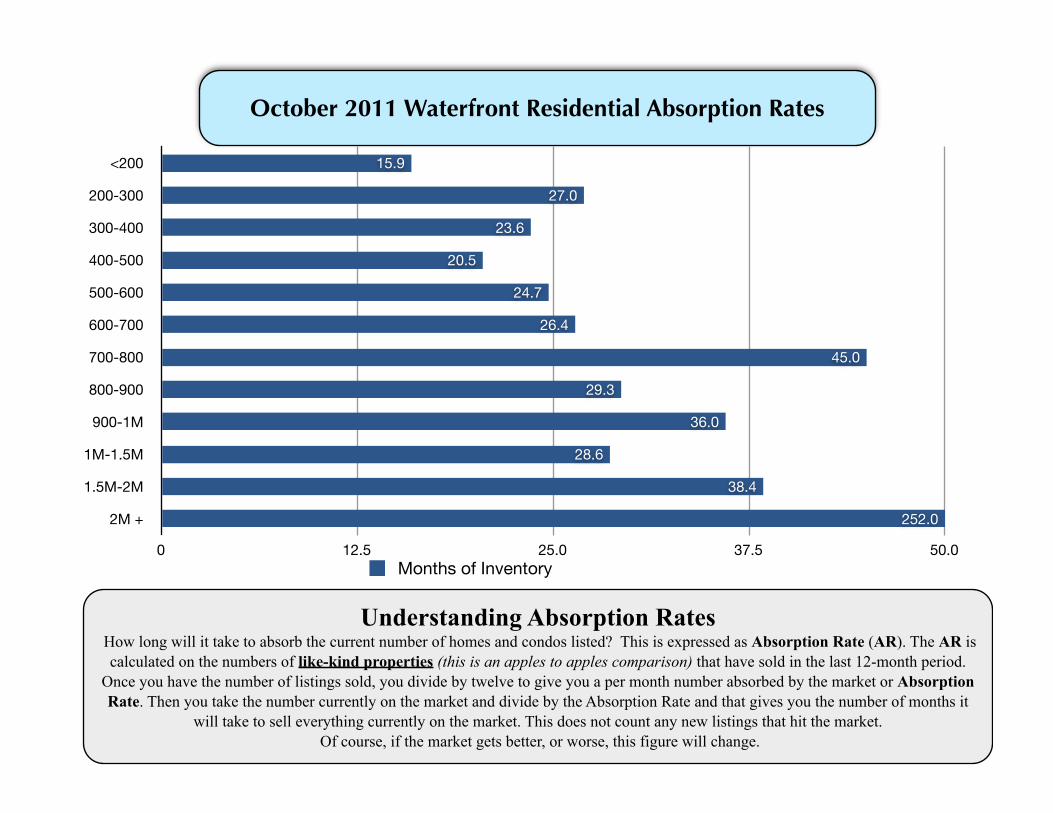
October 2011 Waterfront Residential Absorption Rates
Understanding Absorption Rates How long will it take to absorb the current number of homes and condos listed? This is expressed as Absorption Rate (AR). The AR is
calculated on the numbers of like-kind properties (this is an apples to apples comparison) that have sold in the last 12-month period. Once you have the number of listings sold, you divide by twelve to give you a per month number absorbed by the market or Absorption Rate. Then you take the number currently on the market and divide by the Absorption Rate and that gives you the number of months it
will take to sell everything currently on the market. This does not count any new listings that hit the market. Of course, if the market gets better, or worse, this figure will change.

WF AR Months of Inventory
<200200-300300-400400-500500-600600-700700-800800-900900-1M1M-1.5M1.5M-2M2M +
15.927.0
2421
24.72645
29.336
28.638
252
October 2011 Waterfront Residential Absorption Rates

$150,000
$187,500
$225,000
$262,500
$300,000
Jan Feb Mar Apr May Jun Jul Aug Sep Oct Nov Dec
$243,500
$220,250
$256,500
$216,000
$288,000
$230,000
$264,500$269,000
$233,000
$259,000$255,000
$280,000
$228,500
$280,000
$243,000 $245,000
$218,250$222,500
$216,250
$198,900
$217,250
$260,000
$240,000$244,500
$292,000
$175,000
$269,000
$252,500
$242,500 $242,500
$197,500 $197,600
$225,500
Chart 1
201120102009
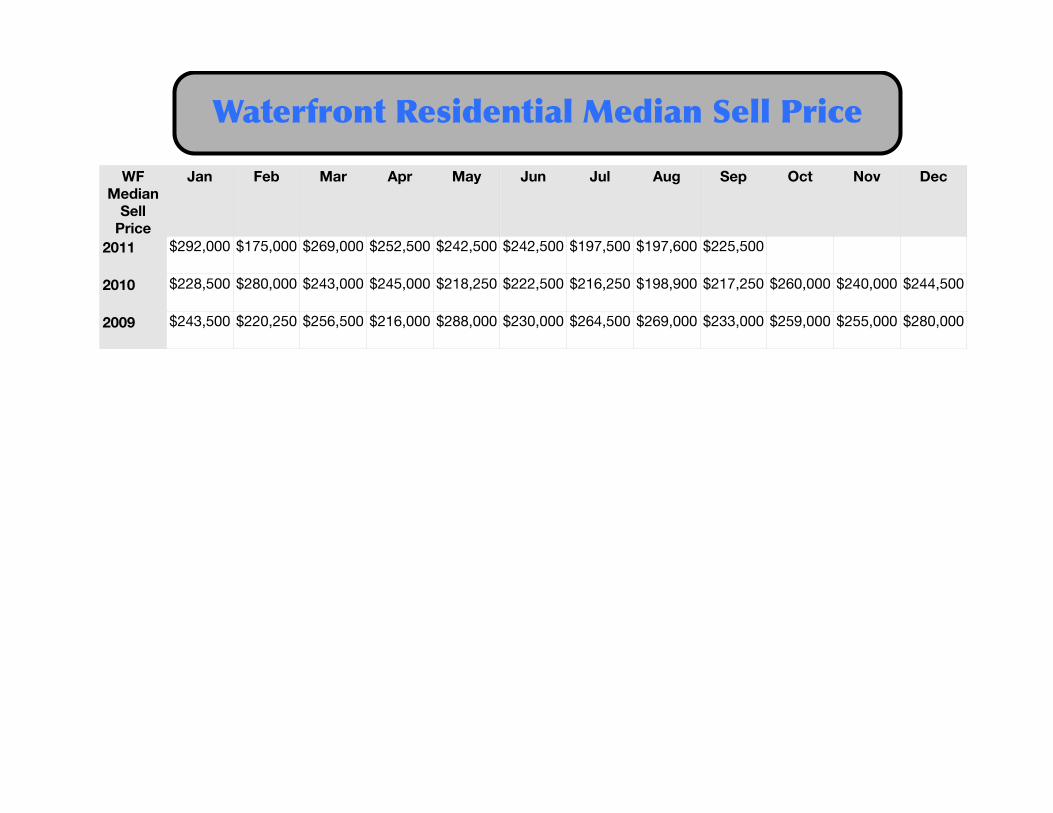
Waterfront Residential Median Sell Price
WF Median
Sell Price
Jan Feb Mar Apr May Jun Jul Aug Sep Oct Nov Dec
2011
2010
2009
$292,000 $175,000 $269,000 $252,500 $242,500 $242,500 $197,500 $197,600 $225,500
$228,500 $280,000 $243,000 $245,000 $218,250 $222,500 $216,250 $198,900 $217,250 $260,000 $240,000 $244,500
$243,500 $220,250 $256,500 $216,000 $288,000 $230,000 $264,500 $269,000 $233,000 $259,000 $255,000 $280,000
Waterfront Residential Median Sell Price

0
75
150
225
300
Jan Feb Mar Apr May Jun Jul Aug Sep Oct Nov Dec
125
112
127
147138
129
112
149
124
141
114
165
142
189
155 156 154
173
143152
137
179
214
191
152
254
213
135
156
171162
140
193
Chart 1
201120102009
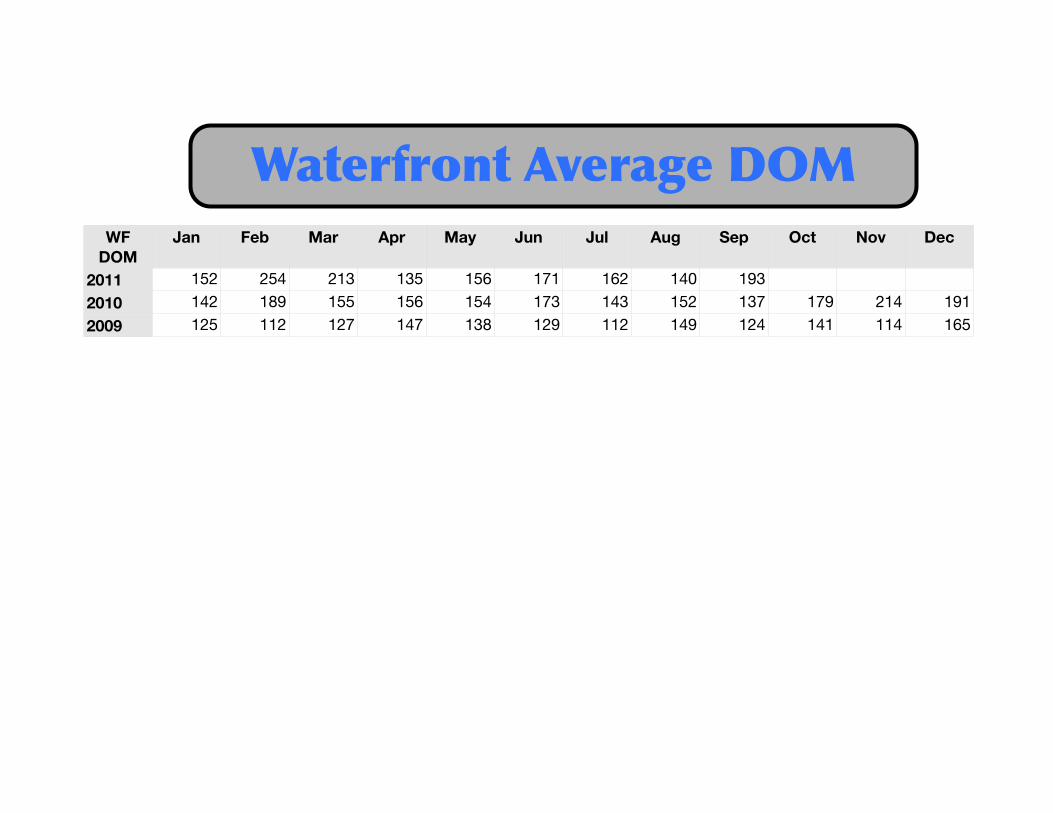
Waterfront Average DOM
WF DOM
Jan Feb Mar Apr May Jun Jul Aug Sep Oct Nov Dec
201120102009
152 254 213 135 156 171 162 140 193142 189 155 156 154 173 143 152 137 179 214 191125 112 127 147 138 129 112 149 124 141 114 165
Waterfront Average DOM
85.00%
87.75%
90.50%
93.25%
96.00%
Jan Feb Mar Apr May Jun Jul Aug Sep Oct Nov Dec
94.43%
93.92%
94.65% 94.68%
91.98%
90.74%
87.67%
92.18%
94.01% 94.06%
88.65%
92.20%
95.67%
90.59%90.81%
86.77%
90.54%
91.70%
95.02%
92.96%
91.76%
89.49%
92.26%91.90%
89.33%
92.13%
94.11%
93.28%
89.58%
90.76%
93.05%
89.82%
90.83%
Chart 1
201120102009
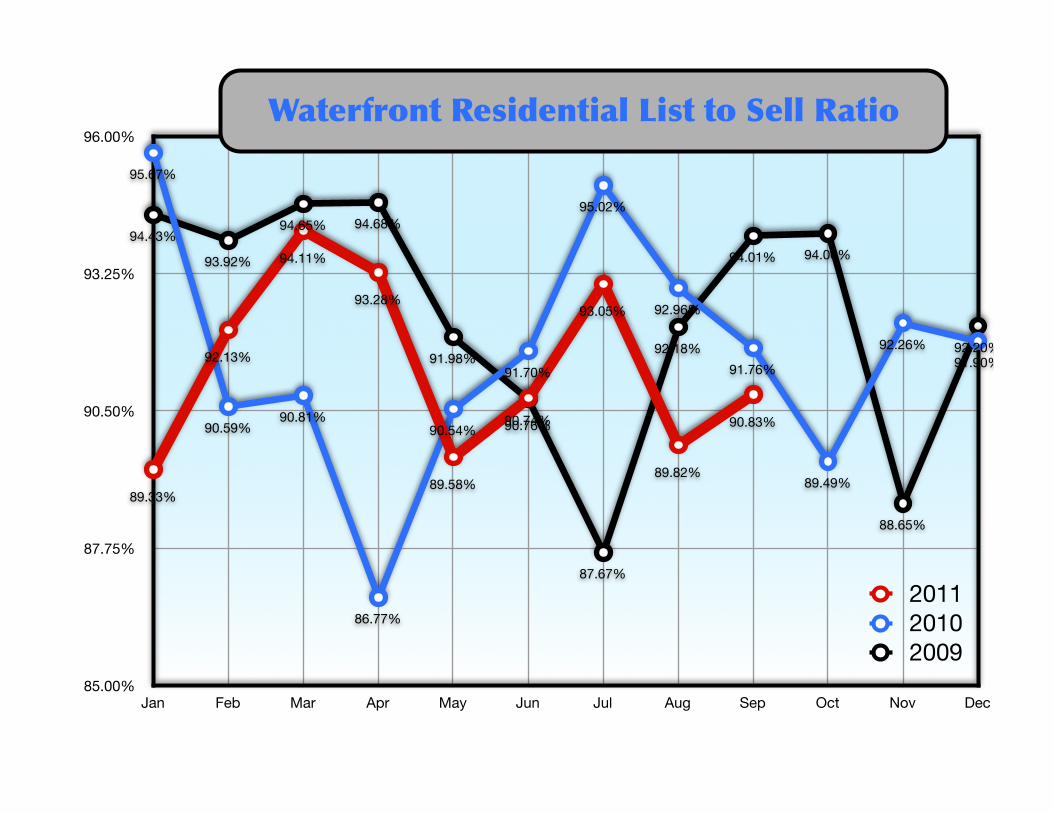
Waterfront Residential List to Sell Ratio

WF Res List-Sell
Ratio
Jan Feb Mar Apr May Jun Jul Aug Sep Oct Nov Dec
201120102009
89.33% 92.13% 94.11% 93.28% 89.58% 90.76% 93.05% 89.82% 90.83%
95.67% 90.59% 90.81% 86.77% 90.54% 91.70% 95.02% 92.96% 91.76% 89.49% 92.26% 91.90%
94.43% 93.92% 94.65% 94.68% 91.98% 90.74% 87.67% 92.18% 94.01% 94.06% 88.65% 92.20%
Waterfront Residential List to Sell Ratio
© 2011 Prudential Financial, Inc. and its related entities. An independently owned and operated broker member of Prudential Real Estate A!liates, Inc., a Prudential Financial company. Prudential, the Prudential logo and the Rock symbol are service marks of Prudential Financial, Inc. and its related entities, registered in many jurisdictions worldwide. Used under license. Equal Housing Opportunity.
All Information Deemed Reliable but Not Guaranteed
Top Related