


Languages
Pages
Legal


Water Quality
Predictors for Key
Indiana Reservoir
s
Indiana Watershed Leadership Academy Final Project Presentation
Garrison InnFt. Harrison State ParkIndianapolis, IN20 May 2015
By
Morgan BennettCarol NewhouseKelsey Owens
Motivation for this Project Climate changes are affecting water supplies
across the nation and globally
Growth and well-being of society is dependent on readily available water supply
Current efforts and/or future needs to build water supply reservoir(s) in Indiana
Wondering if history had anything to teach us

Discovery Steps
List of Impoundments/Reservoirs in Indiana
Mapping of Impoundments and their Watersheds
Data Gathering from On- and Off-line Sources

First Step List of Impoundments/Reservoirs in
Indiana
Over 600 lakes/reservoirs in state
Easily 150+ impoundments 21 major river impoundments 16 large water supply impoundments 35 local/state/federally owned 11 other working impoundments 75+ privately owned impoundments
Narrowed list to most similar waterbodies
Basic Literature Search (online)
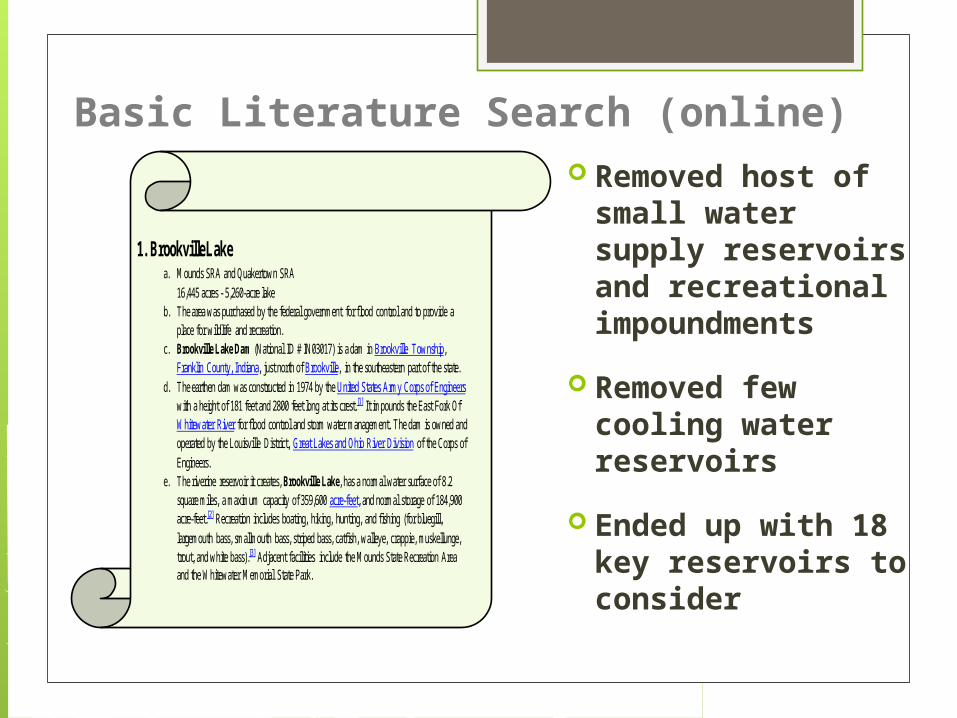
1. Brookville Lake a. Mounds SRA and Quakertown SRA
16,445 acres - 5,260-acre lake b. The area was purchased by the federal government for flood control and to provide a
place for wildlife and recreation. c. Brookville Lake Dam (National ID # IN03017) is a dam in Brookville Township,
Franklin County, Indiana, just north of Brookville, in the southeastern part of the state. d. The earthen dam was constructed in 1974 by the United States Army Corps of Engineers
with a height of 181 feet and 2800 feet long at its crest.[1] It impounds the East Fork Of Whitewater River for flood control and storm water management. The dam is owned and operated by the Louisville District, Great Lakes and Ohio River Division of the Corps of Engineers.
e. The riverine reservoir it creates, Brookville Lake, has a normal water surface of 8.2 square miles, a maximum capacity of 359,600 acre-feet, and normal storage of 184,900 acre-feet.[2] Recreation includes boating, hiking, hunting, and fishing (for bluegill, largemouth bass, smallmouth bass, striped bass, catfish, walleye, crappie, muskellunge, trout, and white bass).[3] Adjacent facilities include the Mounds State Recreation Area and the Whitewater Memorial State Park.
Removed host of small water supply reservoirs and recreational impoundments
Removed few cooling water reservoirs
Ended up with 18 key reservoirs to consider
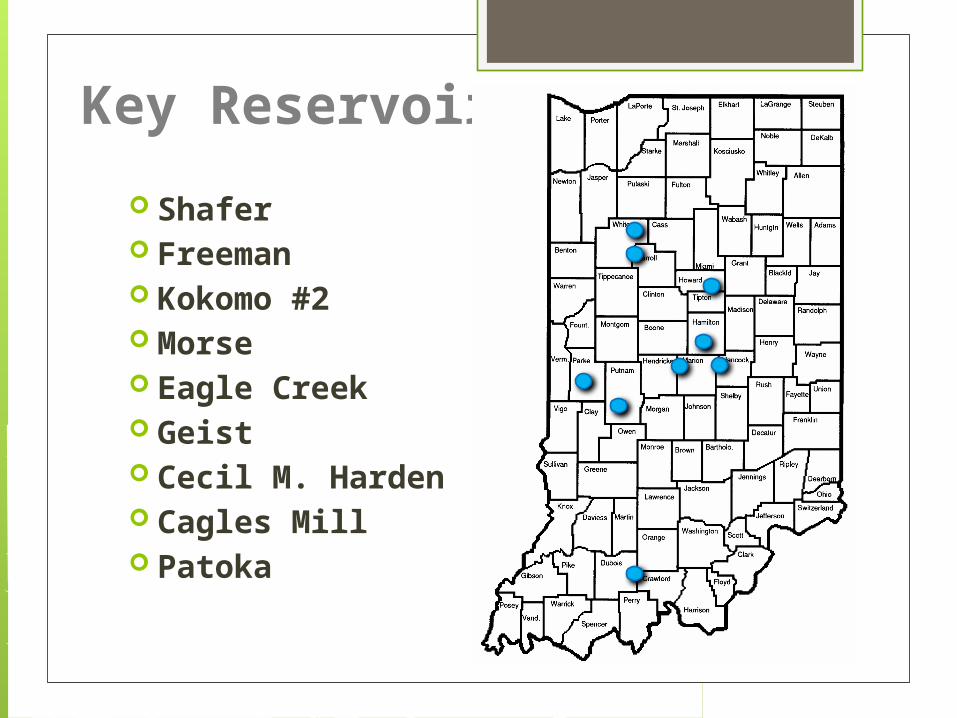
Key Reservoirs
Shafer Freeman Kokomo #2 Morse Eagle Creek Geist Cecil M. Harden Cagles Mill Patoka
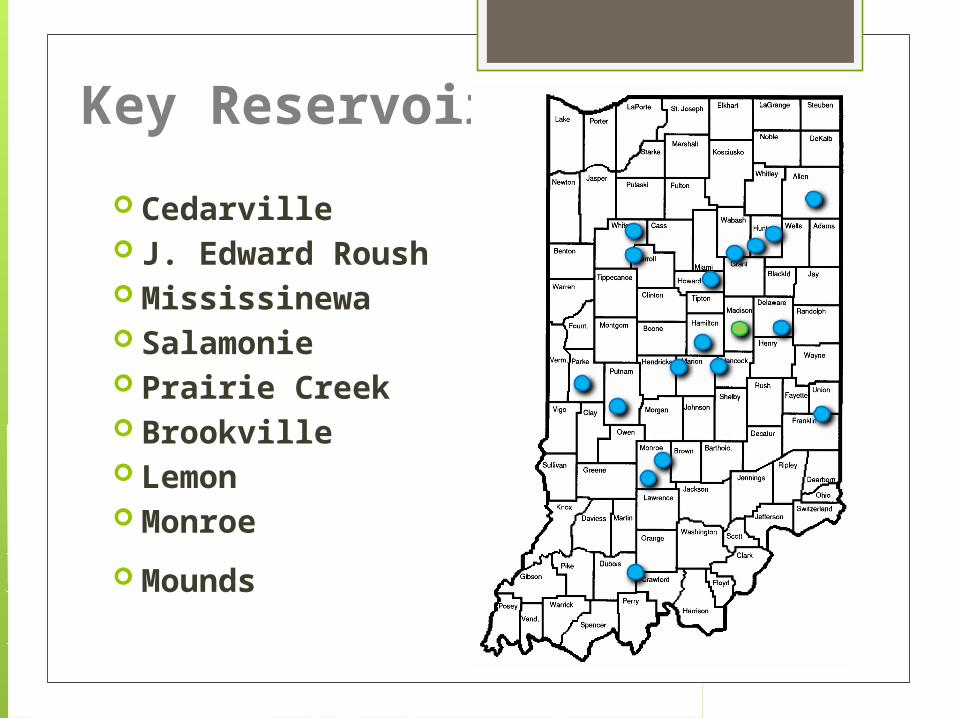
Key Reservoirs
Cedarville J. Edward Roush Mississinewa Salamonie Prairie Creek Brookville Lemon Monroe
Mounds
Second Step Mapping of impoundments and their
watersheds
Online toolsGoogle MapsIndiana Maps
Defining data layers
Scale

Some with rather small watersheds (Group 1)
Size relation = 11.3%
1 acre of water drains <9 acres of land
Best example
Prairie Creek
1:6400

Geist Reservoir
1:250,000
Most have moderately sized watersheds (Group 2)

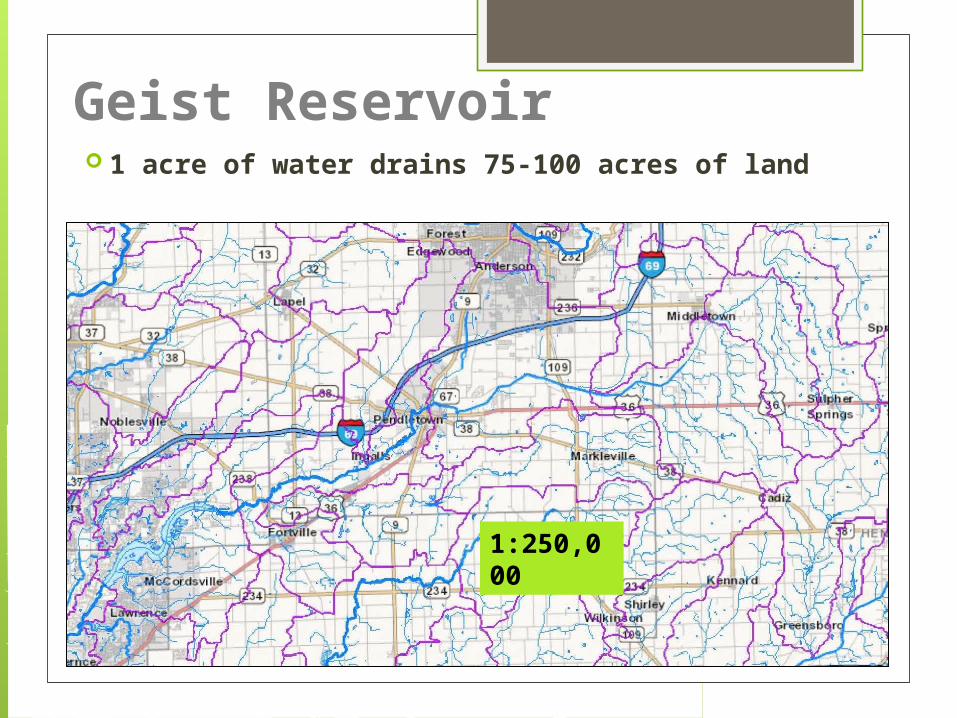
Geist Reservoir
1:250,000
Size relationship 1.0-2.0% (Geist = 1.3%)
Geist Reservoir
1:250,000
1 acre of water drains 75-100 acres of land

Kokomo #2
1:250,000

Kokomo #2 Few have rather large to ‘humongous’
watersheds draining into them (Group 3)
Size relationship = 0.5% or less 0.42% Kokomo
1 acre of water drains 238 acres of land (Kokomo) Cedarville – 1 acre of water drains 2,000
acres Shafer & Freeman – 1 acre drains 10,000
acres
These are the hardest working bodies of water in Indiana
“Hard working”?How well do they fulfill the
purpose(s) for which they were built?
Parameters might be ‘okay’ for hydroelectric use
Or problematic for water storage use (storm or drinking), due to decreased storage volumes
Or challenging for those with drinking water intakes

Map View
Group 1 (ratio >3.0%)
Group 2 (ratio 1.0-2.0%)
Group 3 (ratio < 0.5%)

Prairie Creek
Row crops (brown) and pasture/hay (yellow)
Forested near lake (green)
Small amount development along county roads
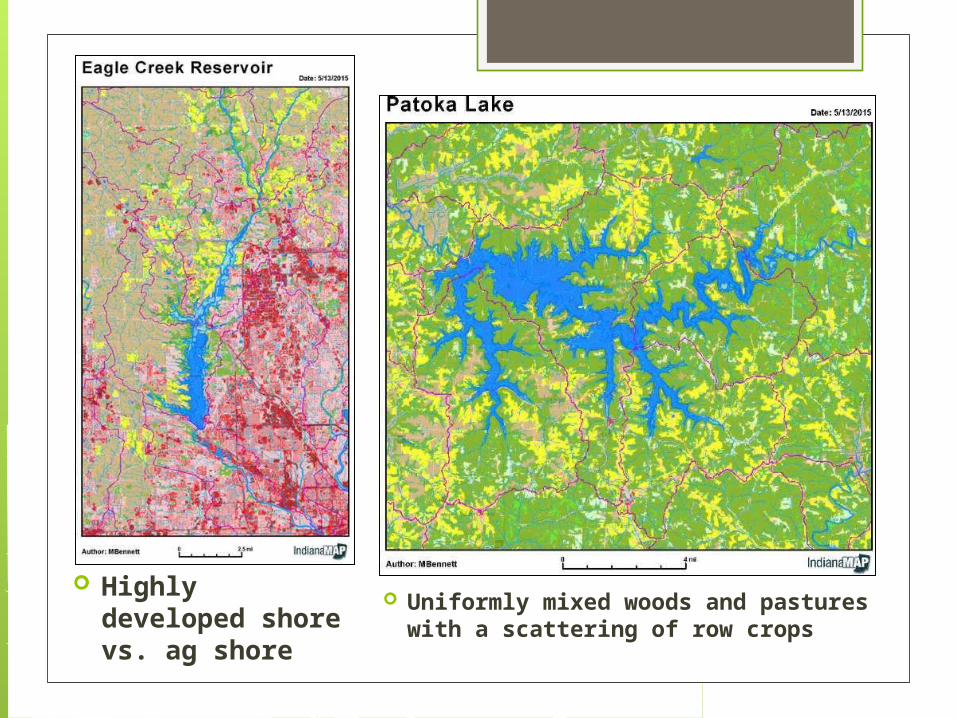
Highly developed shore vs. ag shore
Uniformly mixed woods and pastures with a scattering of row crops

Proposed
Mounds Reservo
ir in Madiso
n County
Size =2,100 acres
Drains259,840
acres
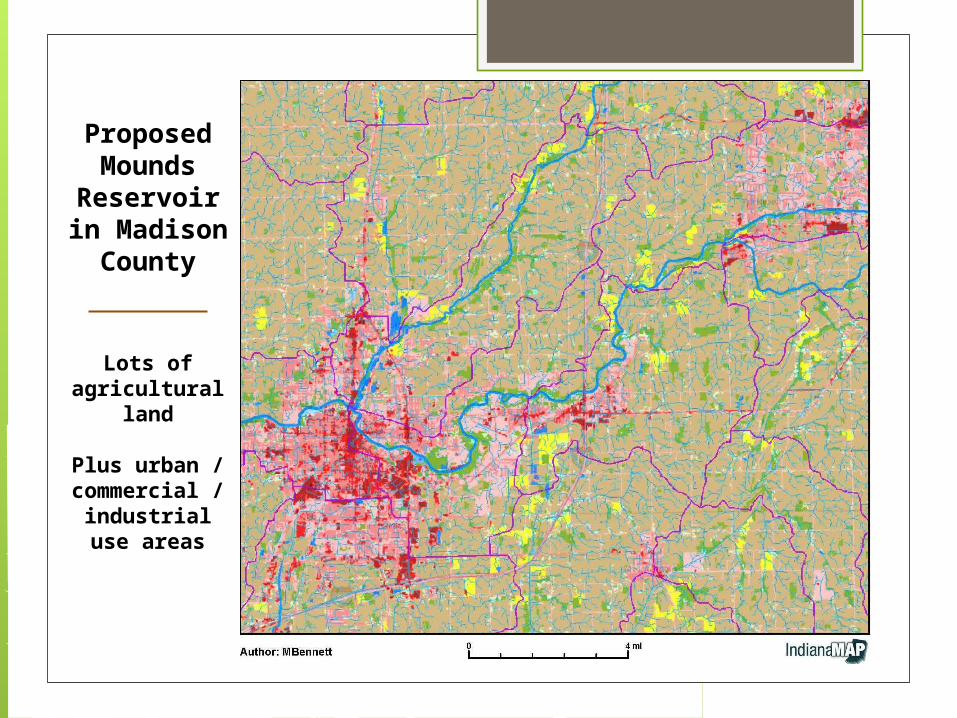
Proposed Mounds
Reservoir in Madison
County
Lots of agricultural
land
Plus urban / commercial / industrial use
areas
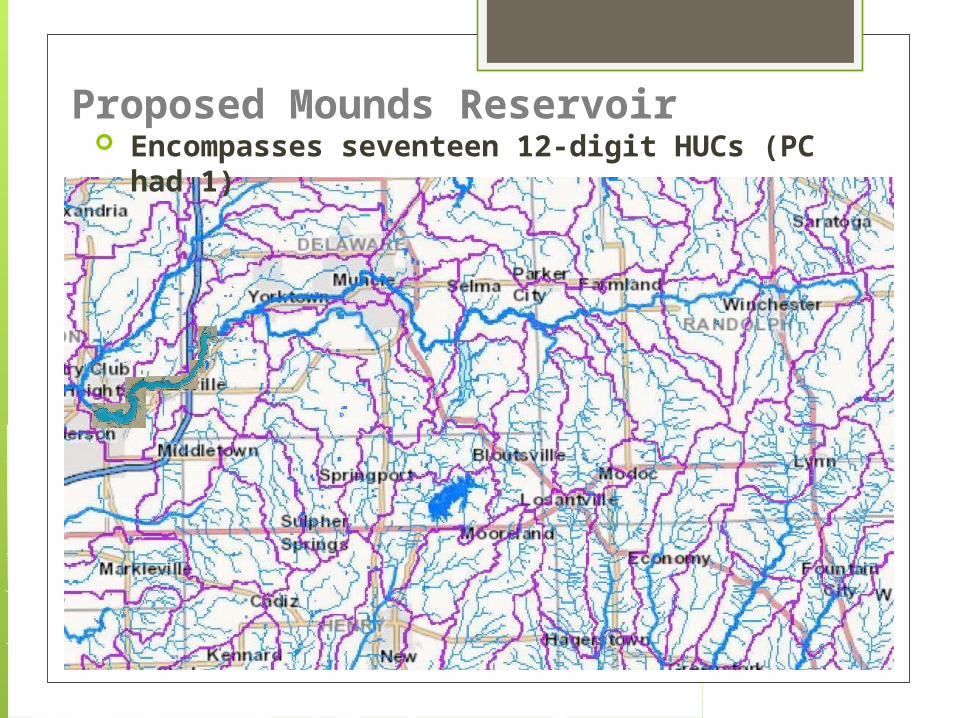
Proposed Mounds Reservoir Encompasses seventeen 12-digit HUCs (PC
had 1)

Third Step Data gathering from off- and online
sources
IU/SPEA website (1988-2014)
2014 List of Waterbody Impairments
Historic files from IDEM Lake sediment and fish tissue sampling National Eutrophication Survey (EPA) Pertinent correspondence USGS and other reports Volunteer data

Trophic Information and Designated Use Support
Water Quality Indicators for Lake Lemon
Indicator Value Data Source Last Updated
Area (Acres) 1650 * 2008
Trophic Status Eutrophic * 2008
Trophic Trend Fluctuating * 2008
Support for Designated Uses
Recreational Use Not Assessed ** 2008
Fishable Use Impaired: 5B ** 2008
Aquatic Life Use Not Assessed ** 2008
Total Number of Impairments 1 ** 2008
Cause of Impairment(s), If Any Mercury in Fish Tissue *** 2008

Data Crunching
Comparing individual water quality parameters (collected to calculate Indiana Trophic State Index scores)
PO4Secchi
Plankton DO
Nitrogen

At First, Data Gaps
Lake Name Year Indiana TSI Secchi (m) Lt at 3' pH Epi pH Hypo SRP Epi SRP Hypo TP Epi TP Hypo Chl-a (ug/L)NO3 EpiNO3 HypoNH3 EpiNH3 HypoTKN epi TKN hypo OrgN # Plankton % BG AlgaeLake Monroe 2011 (June) 1.5 4.9 7.85 8.9 0.01 0.111 0.019 0.116 10.31 0.013 0.013 0.038 0.734 0.948 1.081 19,566,224 94.1Geist Reservoir 2009 32 0.6 3.16 8.6 7.9 0.01 0.01 0.064 0.075 32.15 0.194 0.312 0.018 0.269 1.226 1.019 22,957 80.9Eagle Creek Reservoir 2010 65 0.8 5.5 8.8 7.5 0.01 0.412 0.037 0.553 6.46 0.256 0.013 0.034 2.301 0.82 2.828 18,338,731 97.9Patoka Lake 2.7 30.98 8.48 8.47 0.01 0.01 0.01 0.009 0.91 0.013 0.013 0.018 0.21 0.308 0.628 114,687 Lake Lemon 38 0.4 7 8.25 7.3 0.01 0.409 0.055 0.43 4.9 0.013 0.013 0.018 2.109 0.971 3.537 9,910 97Prairie Creek Reservoir 2010 50 0.9 13.8 8.3 7.5 0.01 0.035 0.026 0.056 10.47 0.013 0.013 0.078 0.495 0.911 1.243 96.6Morse 2011 0.6 5.3 9.1 7.4 0.01 0.08 0.048 0.156 55.92 1.26 1.48 0.018 1.41 1.158 2.09 99.7Salamonie 2009 44 0.8 3.94 8.95 7.6 0.01 0.075 0.036 0.15 22.43 3.002 2.388 0.018 0.692 1.335 1.479 81.8Brookville 2012 2.1 65.65 8.5 8.1 0.01 0.01 0.016 0.016 4.3 0.818 1.674 0.018 0.018 0.641 0.466 68.8Kokomo 22 0.4 4 8.3 0.018 0.076 22 2.231 0.163 0.717 1Freeman 2005 29 1.2 11 8.8 7.8 0.014 0.069 0.082 0.131 13.75 0.332 0.395 0.053 0.919 1.32 1.604 20.3Huntington/Roush 2013 0.55 0.05 8.7 7.8 0.005 0.077 0.124 0.252 41.94 3.859 3.581 0.053 0.62 1.754 2.152 97.2Mississinewa 2004 26 0.9 40 8.8 7.8 0.01 0.053 0.073 0.15 25.3 1.31 0.96 0.018 0.317 1.08 1.059 2.6Shafer 2013 0.8 2.2 8.3 8 0.039 0.056 0.115 0.146 41.33 2.431 2.836 0.018 0.036 1.094 1.049 90.6Cecil M. Harden 2005 36 0.7 9 8.8 8.1 0.01 0.014 0.043 0.076 33.52 2.218 0.735 0.053 2.027 0.662 2.272 86.3Cedarville 2012 0.5 3.78 8.3 7.6 0.094 0.458 0.181 0.724 14.3 0.023 0.022 0.018 0.27 0.972 1.11 1.5Cagles Mill (Cataract) 2002 23 0.8 12 8.25 7.4 0.01 0.243 0.041 0.255 12.48 0.013 0.013 0.018 1.311 0.662 1.834 38
Epilimnion and hypolimnion data unwieldy
Water column averages easier and in keeping with other state lake assessments
Historical data consulted for outliers and representativeness
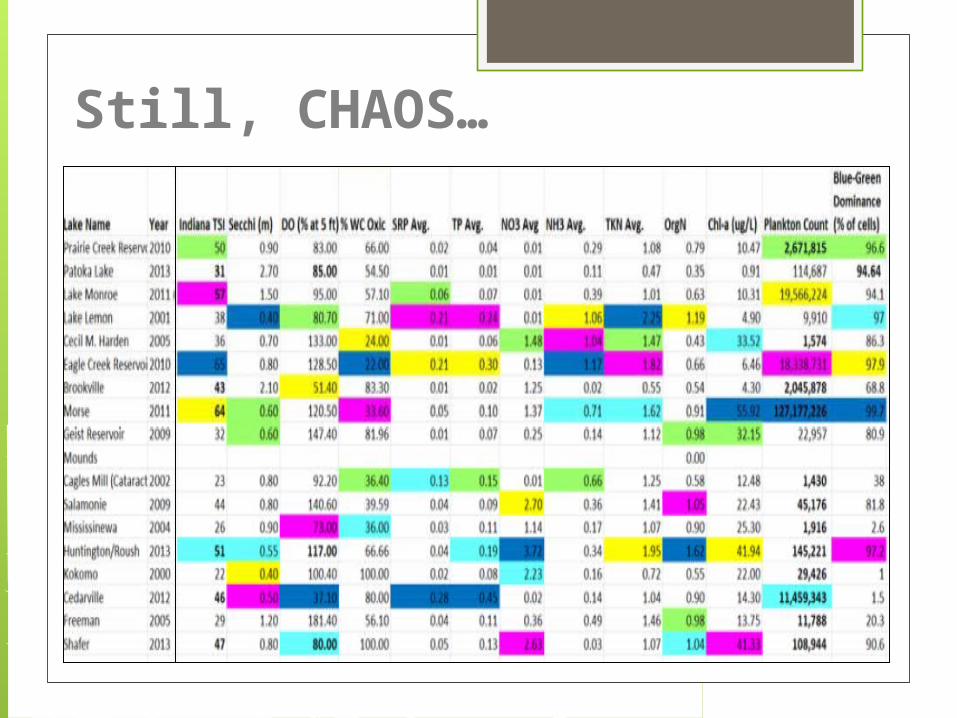
Still, CHAOS…
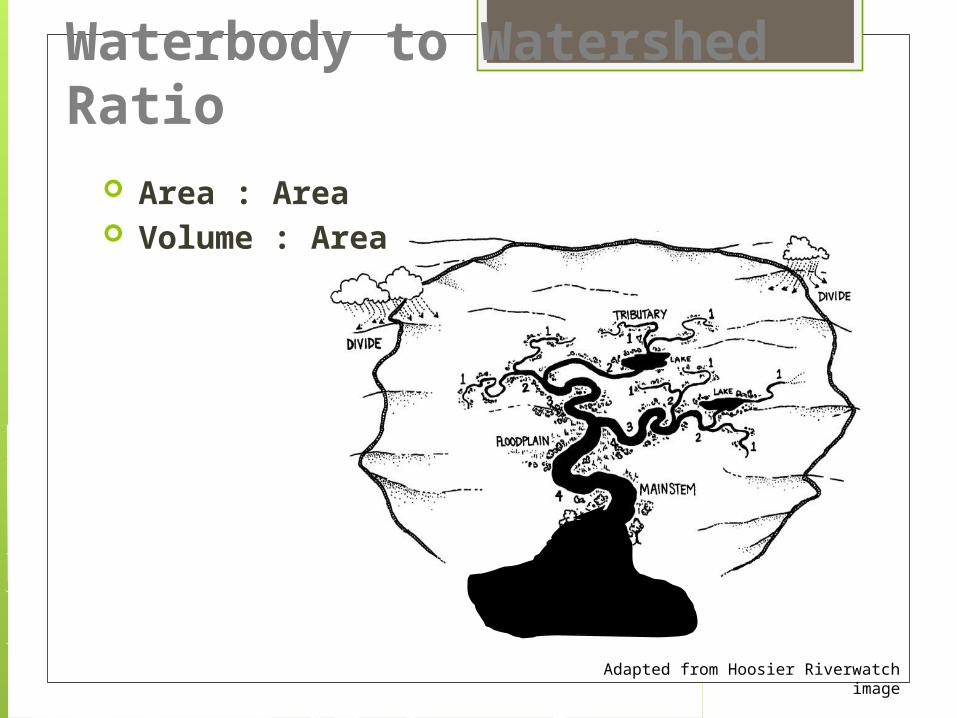
Waterbody to Watershed Ratio
Area : Area Volume : Area
Adapted from Hoosier Riverwatch image

Reservoir Area : Watershed Area Resulted in multiple groups
Lake Name Creek/River ImpoundedSurface Area
(acres)Drainage
Area (acres)Ratio of Lake Area:
W'shed AreaPrairie Creek Reservoir Prairie Creek 1,216 10,752 11.31%Patoka Lake Patoka River 8,880 107,520 8.26%Lake Monroe North Fork of Salt Creek 10,750 276,480 3.89%Lake Lemon Beanblossom Creek 1,650 45,376 3.64%Brookville East Fork Whitewater River 5,260 242,560 2.17%Cecil M. Harden Big Racoon Creek 2,110 138,240 1.53%Eagle Creek Reservoir Eagle Creek 1,510 103,680 1.46%Geist Reservoir Fall Creek 1,800 140,160 1.28%Morse Cicero Creek 1,800 144,343 1.25%Mounds White River 2,100 259,840 0.81%Cagles Mill Lake Mill Creek 1,400 187,520 0.75%Salamonie Salamonie River 2,655 355,840 0.75%Mississinewa Mississinewa River 3,210 516,480 0.62%Kokomo Wildcat Creek 484 114,560 0.42%J.E. Roush Wabash River 900 458,880 0.20%Cedarville St. Joseph River 245 488,320 0.05%Freeman Tippecanoe River 1,535 10,938,880 0.01%Shafer Tippecanoe River 1,291 10,900,480 0.01%
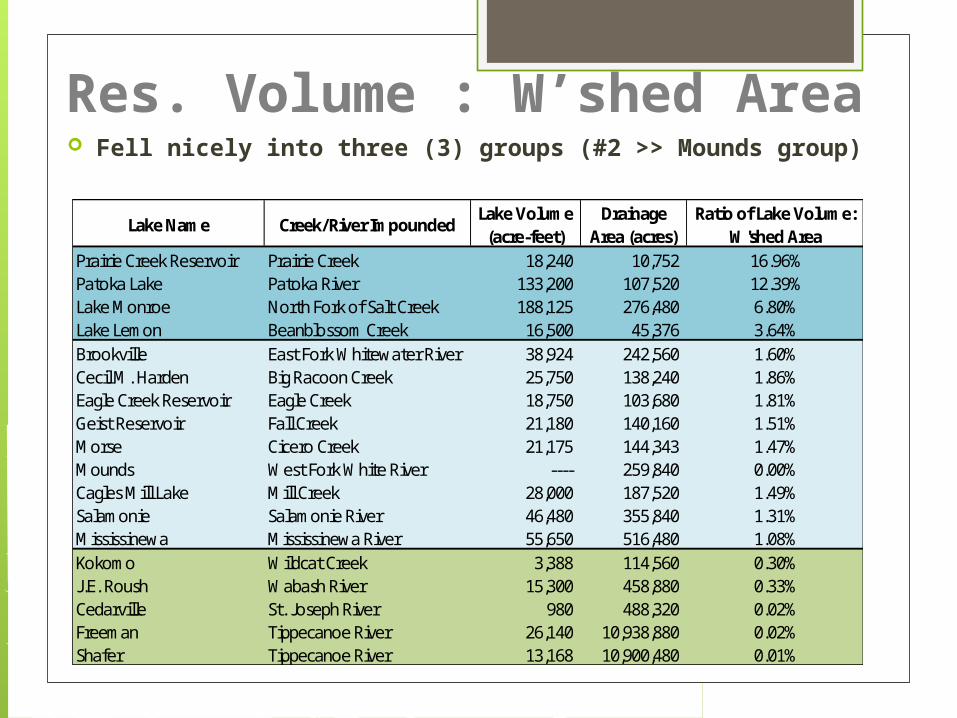
Res. Volume : W’shed Area Fell nicely into three (3) groups (#2 >> Mounds group)
Lake Name Creek/River ImpoundedLake Volume
(acre-feet)Drainage
Area (acres)Ratio of Lake Volume:
W'shed AreaPrairie Creek Reservoir Prairie Creek 18,240 10,752 16.96%Patoka Lake Patoka River 133,200 107,520 12.39%Lake Monroe North Fork of Salt Creek 188,125 276,480 6.80%Lake Lemon Beanblossom Creek 16,500 45,376 3.64%Brookville East Fork Whitewater River 38,924 242,560 1.60%Cecil M. Harden Big Racoon Creek 25,750 138,240 1.86%Eagle Creek Reservoir Eagle Creek 18,750 103,680 1.81%Geist Reservoir Fall Creek 21,180 140,160 1.51%Morse Cicero Creek 21,175 144,343 1.47%Mounds West Fork White River ---- 259,840 0.00%Cagles Mill Lake Mill Creek 28,000 187,520 1.49%Salamonie Salamonie River 46,480 355,840 1.31%Mississinewa Mississinewa River 55,650 516,480 1.08%Kokomo Wildcat Creek 3,388 114,560 0.30%J.E. Roush Wabash River 15,300 458,880 0.33%Cedarville St. Joseph River 980 488,320 0.02%Freeman Tippecanoe River 26,140 10,938,880 0.02%Shafer Tippecanoe River 13,168 10,900,480 0.01%
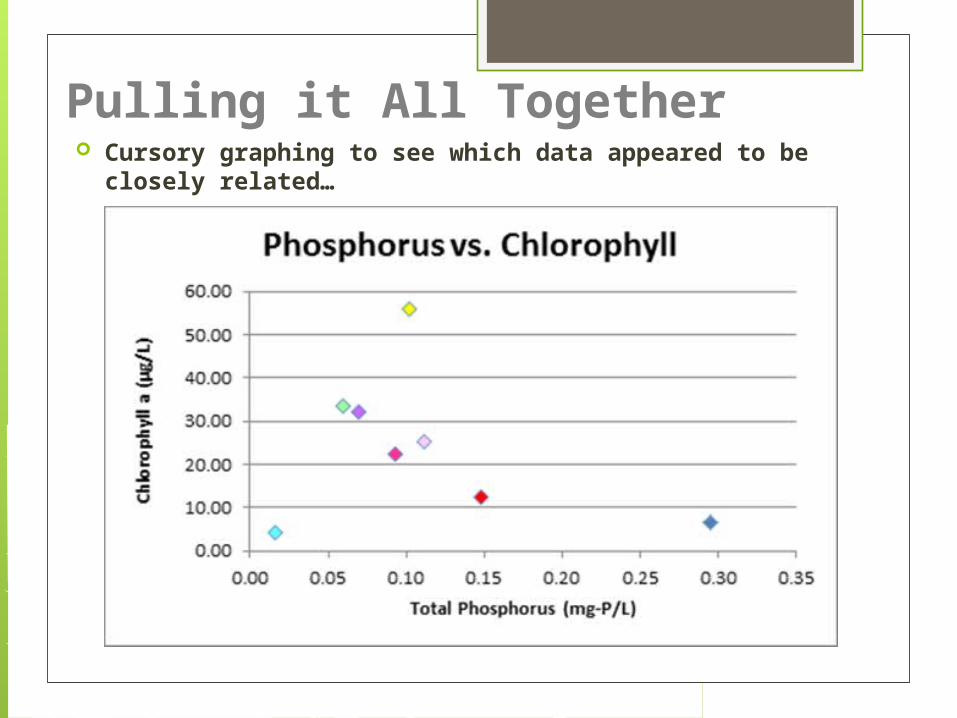
Cursory graphing to see which data appeared to be closely related…
Pulling it All Together
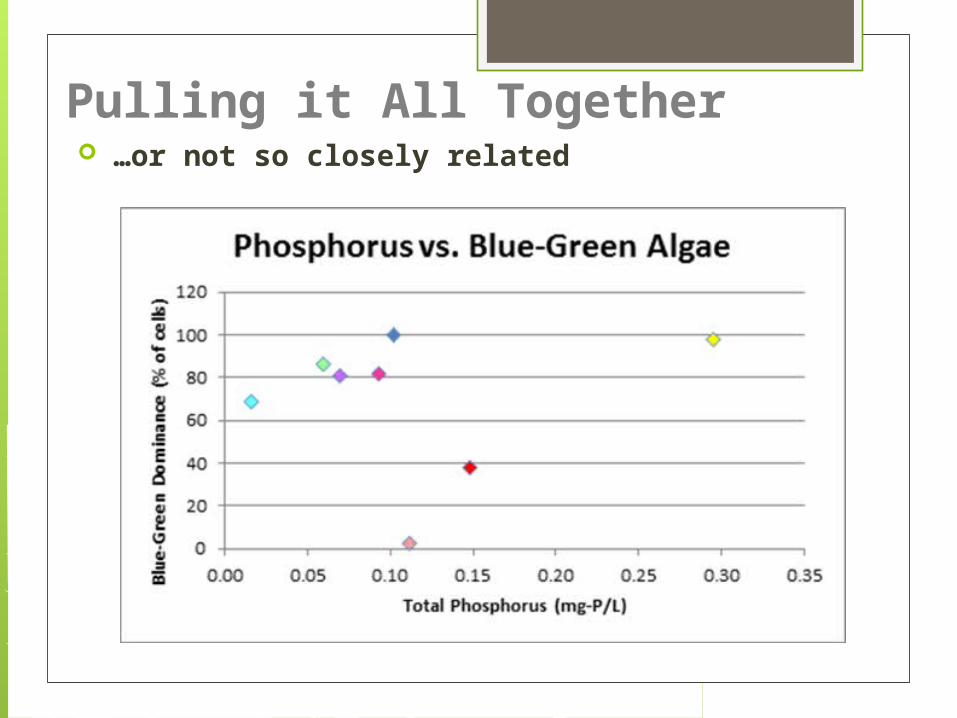
…or not so closely related
Pulling it All Together
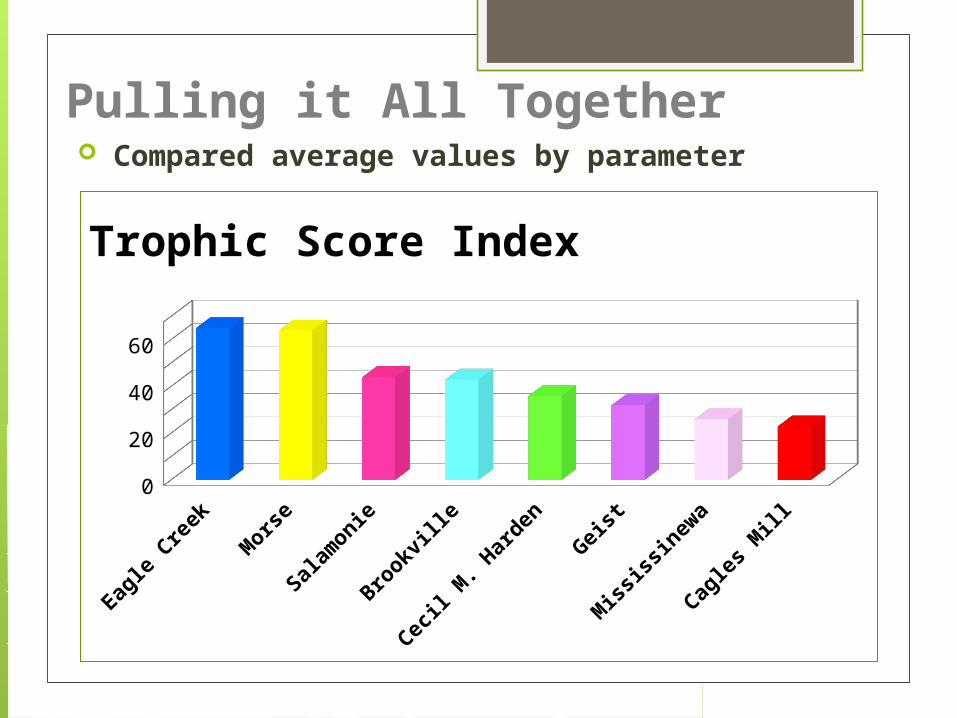
Compared average values by parameter
Pulling it All Together
Eagl
e Cr
eek
Mor
se
Sala
mon
ie
Brook
ville
Cecil M
. Har
den
Geist
Mississ
inew
a
Cagl
es M
ill0
10203040506070
Trophic Score Index

Brookville appears as outlier here, due to lake not being stratified. Apparently lower gate was open causing mixed water column throughout.
Brook
ville
Mississ
inew
a
Eagl
e Cr
eek
Cagl
es M
ill
Sala
mon
ie
Cecil M
. Har
den
Geist
Mor
se0
0.5
1
1.5
2
2.5
Secchi DiskM
ete
rs

Brook
ville
Geist
Sala
mon
ie
Cagl
es M
ill
Mississ
inew
a
Mor
se
Cecil M
. Har
den
Eagl
e Cr
eek
0
10
20
30
40
50
60
70
80
90
% Water Column with DO of 0.1 or greater

Geist
Sala
mon
ie
Cecil M
. Har
den
Eagl
e Cr
eek
Mor
se
Cagl
es M
ill
Mississ
inew
a
Brook
ville
0
20
40
60
80
100
120
140
160
% Sat. of DO at 5’ Depth%
at
5 F
eet
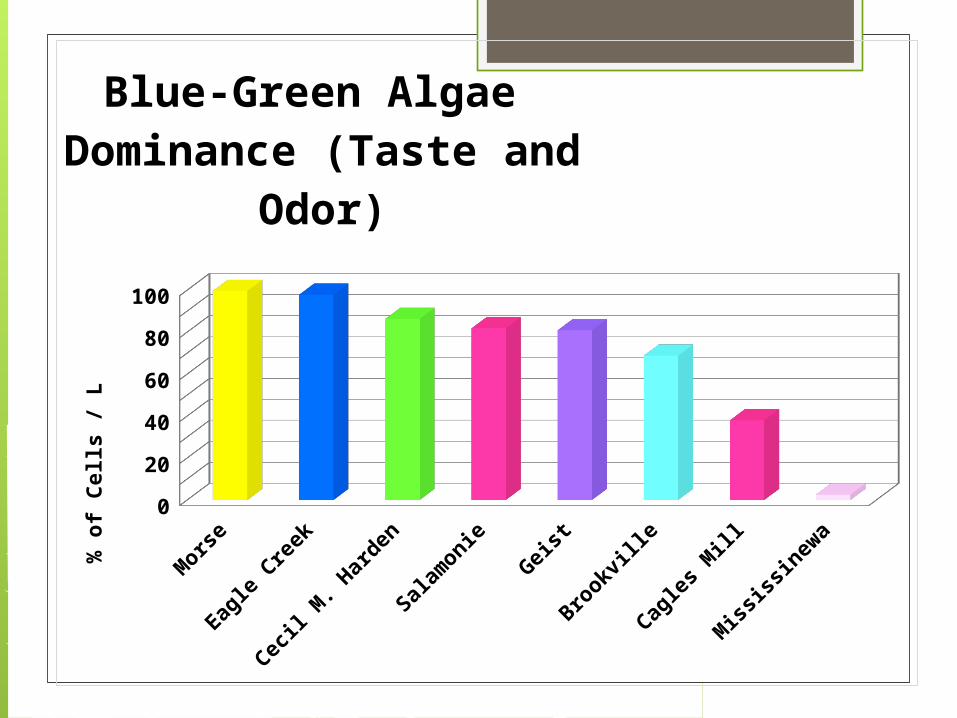
Mor
se
Eagl
e Cr
eek
Cecil M
. Har
den
Sala
mon
ie
Geist
Brook
ville
Cagl
es M
ill
Mississ
inew
a0
102030405060708090
100
Blue-Green Algae Dominance (Taste and
Odor)
% o
f C
ells
/ L
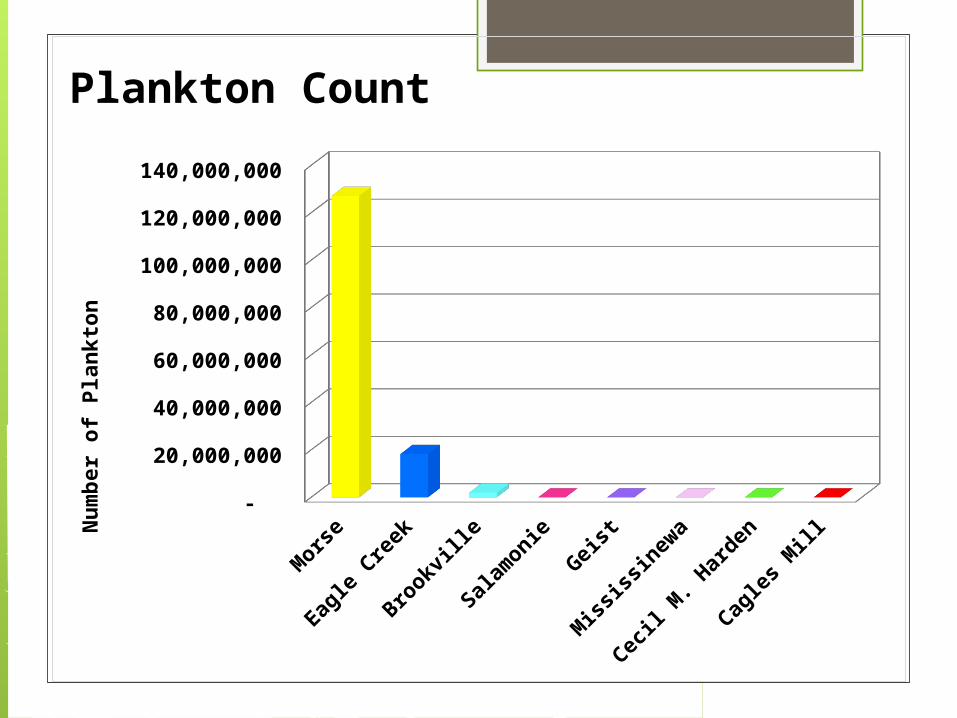
Mor
se
Eagl
e Cr
eek
Brook
ville
Sala
mon
ie
Geist
Mississ
inew
a
Cecil M
. Har
den
Cagl
es M
ill -
20,000,000
40,000,000
60,000,000
80,000,000
100,000,000
120,000,000
140,000,000
Plankton CountN
um
ber
of
Pla
nkto
n
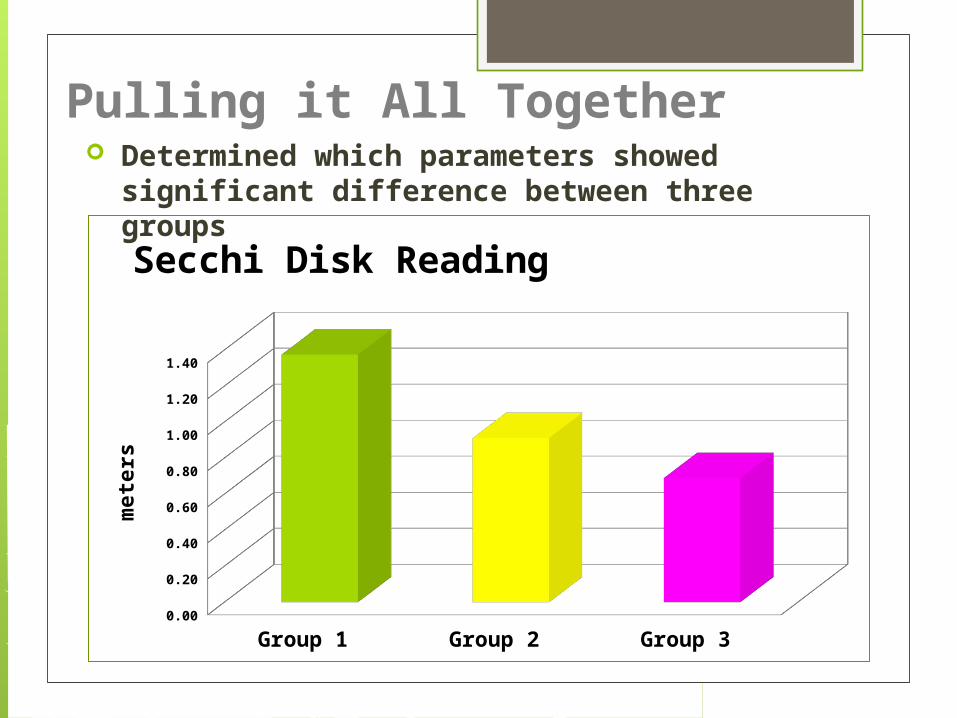
Determined which parameters showed significant difference between three groups
Pulling it All Together
Group 1 Group 2 Group 30.00
0.20
0.40
0.60
0.80
1.00
1.20
1.40
Secchi Disk Reading
mete
rs

Determined which ones correlated to water quality
Pulling it All Together
Group 1 Group 2 Group30.00
0.02
0.04
0.06
0.08
0.10
0.12
0.14
0.16
0.18
0.20
Total Phosphorus
mg
-P/L

Group 1 Group 2 Group 30.00
0.20
0.40
0.60
0.80
1.00
1.20
1.40
1.60
1.80
Nitrate + Nitrite as Nm
g-N
/L
Group 1 Group 2 Group 30.00
0.20
0.40
0.60
0.80
1.00
1.20
1.40
1.60
Organic Nitrogen
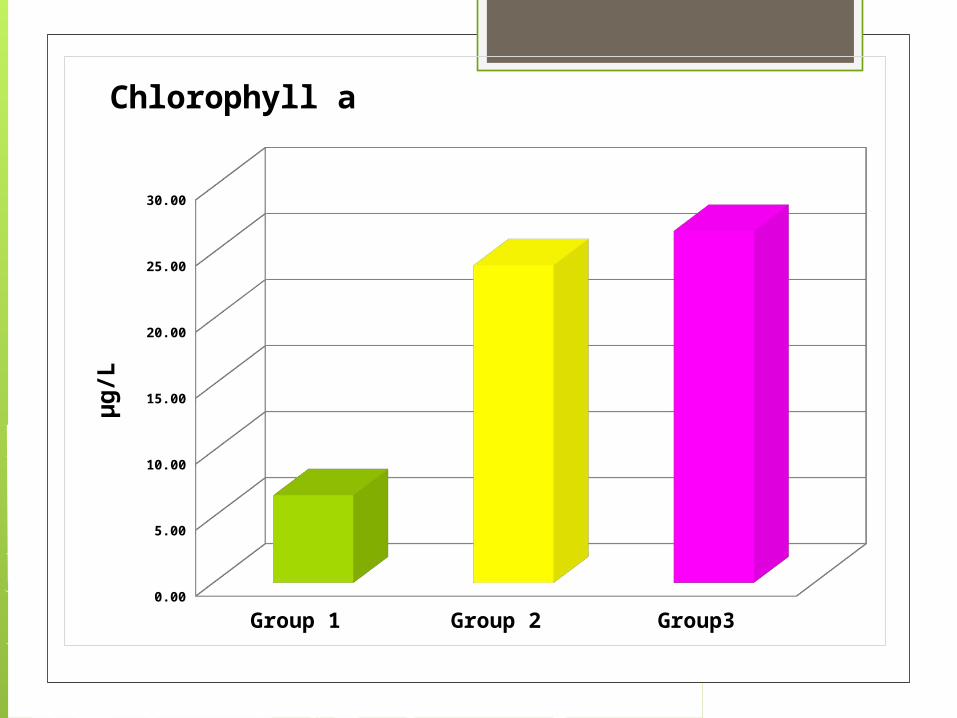
Group 1 Group 2 Group30.00
5.00
10.00
15.00
20.00
25.00
30.00
Chlorophyll aμ
g/L
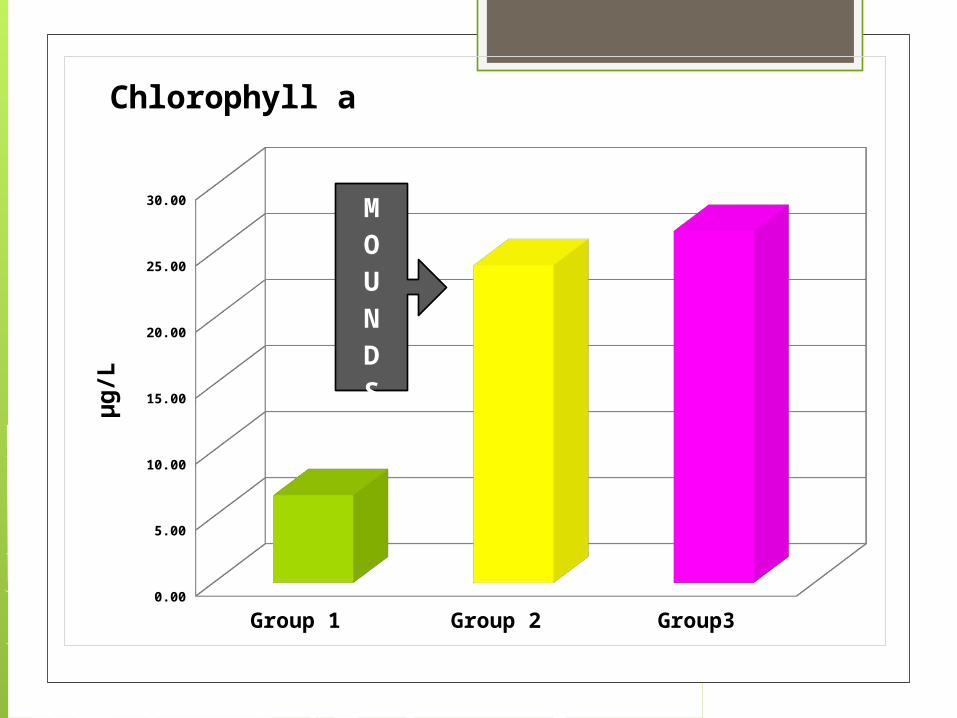
Group 1 Group 2 Group30.00
5.00
10.00
15.00
20.00
25.00
30.00
Chlorophyll aμ
g/L
MOUNDS

Lessons Learned Working with water data as a whole
There is a lot of data available, but it is scattered and not all is available online
Improvements in lake trophic scores following Indiana’s ban on phosphates have maintained themselves
Drawing water from different lake depths effects DO and stratification
Watershed size : waterbody volume ratio’s effect on water quality was supported by Indiana’s reservoir data despite the significant differences in land use and topography across Indiana’s reservoirs

Importance of erosion control
Need for nutrient
Sewers are better than septic tanks
Use of various forms of technology (hard and soft)
Murphy says “the greater your need for particular software package is, the more likely it will be taken offline for maintenance or upgrades”
Working as a team!!!
More Lessons Learned

What’s Next? Comparing additional impoundments
which have similar size ratios to see if they respond the same
More complete assessment of land use types and impervious surfaces (running various models)
Running better statistics on groups and parameters to verify significant differences
Further data analysis to determine anomalies vs. general variability
Create online guidance document for public use

Thank You!
Top Related