


Languages
Pages
Legal

1
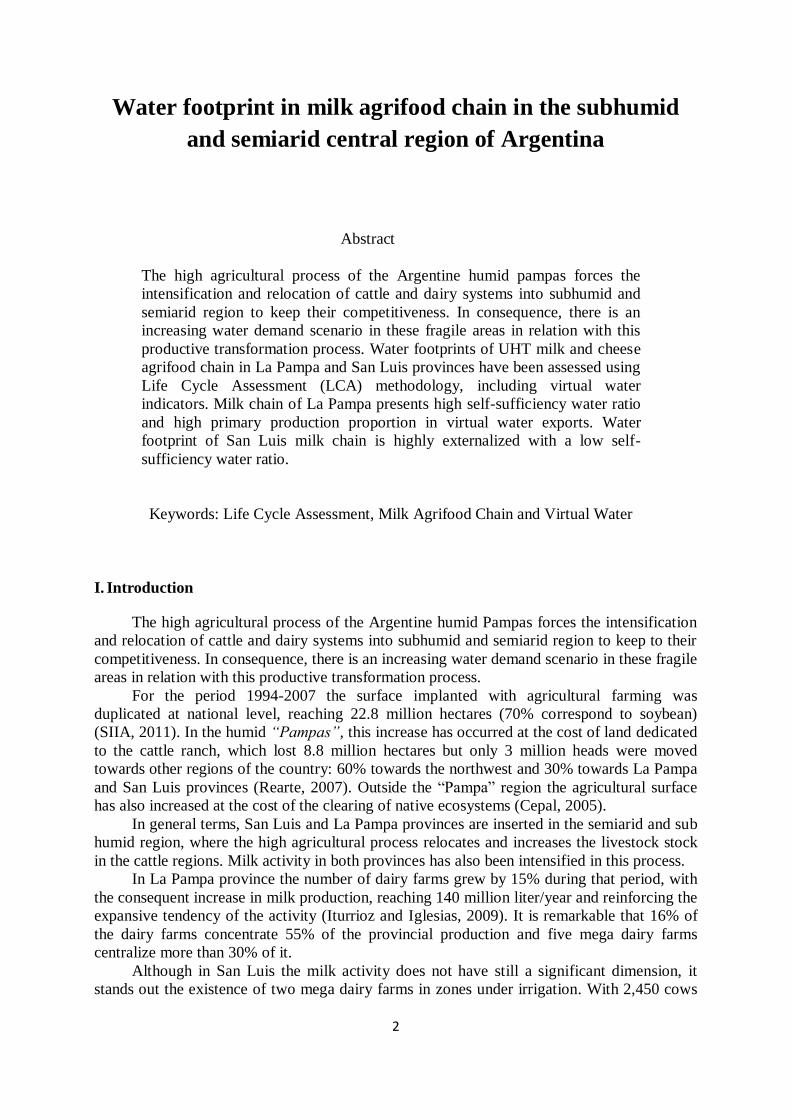
Water footprint in milk agrifood chain in the subhumid and semiarid
central region of Argentina
MANAZZA¹, Jorge F. and IGLESIAS², Daniel H.
¹Instituto Nacional de Tecnología Agropecuaria (INTA), Agrifood Economics, Villa Mercedes, Argentina. [email protected]
²Instituto Nacional de Tecnología Agropecuaria (INTA), Agrifood Economics, Gral. Acha, Argentina. [email protected]
Selected Paper prepared for presentation at the International Association of Agricultural
Economists (IAAE) Triennial Conference, Foz do Iguaçu, Brazil, 18-24 August, 2012.
Copyright 2012 by [Manazza&Iglesias]. All rights reserved. Readers may make verbatim
copies of this document for non-commercial purposes by any means, provided that this
copyright notice appears on all such copies.
2
Water footprint in milk agrifood chain in the subhumid
and semiarid central region of Argentina
Abstract
The high agricultural process of the Argentine humid pampas forces the
intensification and relocation of cattle and dairy systems into subhumid and
semiarid region to keep their competitiveness. In consequence, there is an
increasing water demand scenario in these fragile areas in relation with this
productive transformation process. Water footprints of UHT milk and cheese
agrifood chain in La Pampa and San Luis provinces have been assessed using
Life Cycle Assessment (LCA) methodology, including virtual water
indicators. Milk chain of La Pampa presents high self-sufficiency water ratio
and high primary production proportion in virtual water exports. Water
footprint of San Luis milk chain is highly externalized with a low self-
sufficiency water ratio.
Keywords: Life Cycle Assessment, Milk Agrifood Chain and Virtual Water
I. Introduction
The high agricultural process of the Argentine humid Pampas forces the intensification
and relocation of cattle and dairy systems into subhumid and semiarid region to keep to their
competitiveness. In consequence, there is an increasing water demand scenario in these fragile
areas in relation with this productive transformation process.
For the period 1994-2007 the surface implanted with agricultural farming was
duplicated at national level, reaching 22.8 million hectares (70% correspond to soybean)
(SIIA, 2011). In the humid “Pampas”, this increase has occurred at the cost of land dedicated
to the cattle ranch, which lost 8.8 million hectares but only 3 million heads were moved
towards other regions of the country: 60% towards the northwest and 30% towards La Pampa
and San Luis provinces (Rearte, 2007). Outside the “Pampa” region the agricultural surface
has also increased at the cost of the clearing of native ecosystems (Cepal, 2005).
In general terms, San Luis and La Pampa provinces are inserted in the semiarid and sub
humid region, where the high agricultural process relocates and increases the livestock stock
in the cattle regions. Milk activity in both provinces has also been intensified in this process.
In La Pampa province the number of dairy farms grew by 15% during that period, with
the consequent increase in milk production, reaching 140 million liter/year and reinforcing the
expansive tendency of the activity (Iturrioz and Iglesias, 2009). It is remarkable that 16% of
the dairy farms concentrate 55% of the provincial production and five mega dairy farms
centralize more than 30% of it.
Although in San Luis the milk activity does not have still a significant dimension, it
stands out the existence of two mega dairy farms in zones under irrigation. With 2,450 cows
3
and a daily production of 43 thousand liters; both concentrate the 50% of the provincial
production and reveal the potentialities that present those zones with underground water
reserves for the development of highly intensified production systems (Manazza, 2009).
Particularly in semiarid zones the intensification processes are developed on the basis of
water resources, being significant the incorporation of new surfaces with irrigation from
superficial and underground sources. Only in San Luis province, the surface under irrigation
by center pivot go from 14,940 has in 2002 to 33,216 has at the present time (Saenz et al.,
2011).
Sustainability indicators of farming production in this region have been developed by
Viglizzo et al. (2006). Different ecological footprints related to the sustainability of the
agriculture expansion in the Pampas region were studied by Viglizzo et al. (2010). The use of
water in milking processes of dairies in La Pampa province has been evaluated by Felice
(2009). Nevertheless, the interactions between the productive activities related to the use of
water resource throughout the entire life cycle of farming products (agrifood chain approach)
have not been studied in this region.
The perspective of a developing new milk area in the semiarid zone with intensive use
of water resource, and the greater pressures that exert the processes of intensification of the
milk systems on this resource, motivate the election of this agrifood chain as a case of study.
A vision of supply chain is necessary for the assessment of environmental impacts of a
product and the criteria of eco-efficiency must contemplate all the productive linkages that
constitute the different phases of the products, from the primary production to the final
consumption. Between the methodologies of environmental impact assessment, the Life Cycle
Assessment (LCA) is the most commonly used (Mattsson and Sonesson, 2003). It is explicitly
contemplated by the ISO 14040:2006, that provide international homologation (ISO, 2006),
and it is a consistent tool to determine the eco-efficiency of systems (Van der Werf and Petit,
2002).
There are several LCA studies on dairy chains that focus on the assessment of the
potential improvement of their environmental performance, analyzing the sensitivity of
impact indicators such as: energy use, emissions of greenhouse gases, acidification,
eutrophication, photo-oxidants and ecotoxicity. Eide (2002) compare different plant sizes,
degree of automation and transport distances; Basset-Mens et al. (2009) assess different
intensification scenarios of dairy systems and Hospido et al. (2003) alternative processes of
milk production. Overall, the primary production of milk, specifically the agricultural phase,
followed by the packaging, is identified as critical in the environmental impact of life cycle of
milk1.
Recently, the LCA methodology was used by FAO (2010) to develop estimates of
Green House Gases emissions associated with milk production and processing of most
regions and production systems in the world.
There is a vast inventory of water footprints of crops and animal products for many
countries, including milk products of Argentina (Chapagain and Hoekstra, 2003; Mekonnen
and Hoekstra, 2010). The first inventories were built with the aim of determine the volumes of
virtual water flows from international trade in agricultural products (Hoekstra and Hung,
2002), animals (Chapagain and Hoekstra, 2003), and the analysis of water footprints of
nations (Chapagain and Hoekstra, 2004).
Several papers of water footprint literature are focused on sustainable consumption of
agrifood products in Europe in relation to trade policies of these countries, such as water
1 cf. Cederberg, C. (2003). Life Cycle Assessment of animal products. 19-34. En: Mattsson, B., Sonesson, U. (Ed). Environmentally-friendly food processing. England: CRC Press. 94 p.

4
footprint of Spanish agriculture (Rodriguez et al., 2008), or the consumption of pasta and
pizza in Italy (Aldaya and Hoekstra, 2010).
The scope of this paper is to compare water use efficiency of different intensification
dairy systems, valuate their eco-efficience heterogeneities, and monitor the water flow
structure of milk chains in water scarcity regions. For that purpose, Water Footprints of UHT
milk and cheese agrifood chain in La Pampa and San Luis provinces have been assessed using
Life Cycle Assessment (LCA) methodology, including virtual water indicators.
II. Materials and methods
A simplified LCA of consumptive water use in bovine milk agrifood chain of La Pampa
and San Luis provinces of Argentina has been developed, contrasting the efficiency of green
and blue water for different scenarios of intensification of dairy farm systems, adapting the
methodological criteria outlined in Hoekstra et al. (2009). The study focus on freshwater use
in relation with resource depletion, analysis of other environmental impacts, such us
eutrophication and acidification were not included.
Most common dairy systems of both provinces were selected from INTA dairy regional
projects database (Ashworth, 2008; Felice, 2009). Three dairy systems with different degrees
of intensification, scale and use of water resource were contrasted. The degree of
intensification was determined based on animal density, and percentage of dry matter (DM)
provided by supplements in relation to the total feed chain.
Water use in animal feeding corresponds to the sum of the evaporative demands of
pastures and crops grown in farm and imported, considering both blue and green water
origins. As a first approximation, losses that may occur in water distribution systems were not
accounted, assuming that a high percentage can be reused. Only efficiency parameters of the
irrigation system of the farm were considered.
For each system, the water consumption of the feed chain and production of grain for
animal supplementation was determined according to the methodology developed by Allen et
al. (1998), using AGROECOINDEX® model. The virtual water content of supplements was
obtained from AGROECOINDEX® database, as well as the determination of the
consumption of animal drinking water. The volume of water used in the process of application
and pulverization of agricultural chemicals to crops was estimated by labels of products and
average technical specifications used by local contractors (speed, flow, etc.), according to the
technical report by Bogliani et al. (2005).
The water footprint of a product is defined as the total volume of freshwater used
(directly or indirectly) to produce it; it is estimated taking into account consumption and
pollution of water in all phases of the production chain. The accounting procedure is similar
for all types of products derived from agriculture, industrial or service (Hoekstra et al., 2009).
(1)
Where is the water footprint (or virtual water content) (m3/mass) of the
product-output, is the water footprint of the product-input (i) and the
water footprint (consumption of water) of the processing steps that transforms ( ) imputs (raw
material) in the final products (outputs), expressed in water use per unit of processed product (m3/mass). In the case studies of this work, the use of water from the milking routine
process for primary production of milk and total water consumption (not recovered) of all
production processes of the two plants studied were determined, discriminating water
5
consumption used in the transport phase of the raw material. The processes are specified in
their respective inventories.
The parameter is called product fraction (or conversion factor) and is defined as
the amount of output ( , mass) obtained per unit of input ( , mass):
(2)
The value fraction of an output product, is defined as the ratio between the market
value of the product (monetary units/monetary units) in relation to the aggregate market
value of all outputs (p = 1 to z) obtained from the input products (raw material):
(3)
In this paper, for dairy systems the value fraction was estimated considering only two
products of the cow: milk and meat, taking the total annual market value of both products.
Specifically, the water footprint of dairy milk can be expressed by equation (1), where
;
; : water consumption in
milking processing routine (m3/year); : dairy milk production (L/year). is
given by the total virtual water consumption of animal feeding, :
(4)
For industrial milk products, water footprint is given by equation (1) where:
Where is the water footprint of industrial milk products (for i = UHT
milk, cheese, cream, ricotta); is the virtual water content of a unit of raw
material (raw milk); (
) is the industrial product (i), expressed as the amount of raw
material per unit industrial product. is the volume of water use in the industrial
processing stages, expressed in m3 per unit of raw milk processed (m3/L milk). Processes are
specified on their respective inventories (III.1.2.4).
The next step in determining the water footprint of a supply chain, is to calculate the
virtual water flows entering and leaving the provincial limits, resulting from the import and
export of primary products (raw milk) and industrial applications. This is done by adding
virtual water content of each product in the chain: ,
identifying those that are exported, consumed or processed locally and those imported for
final consumption. For La Pampa province, the flow of virtual water and water footprint of
the dairy chain were estimated for 2005, based on the dairy chain 2005 flowchart by Iturrioz
and Iglesias (2009). In the case of San Luis province, estimates of water footprints and virtual
water flows for the year 2008 were made based on Manazza (2009). We determined the flow
6
of virtual water imported by the consumption of milk products from the national consumption
patterns by type of dairy product (kg / capita / year) using MAGyP (2011) database.
Thus, the total water footprint of the chain is given by :
For i = (primary production (PP), industry)
Where, is the total production volume of (j) product, of (i) sector;
is the water
footprint of the dairy (j) product of (i) sector; is the volume of provincial primary
product (raw milk) delivered to local industry of local.
is the water footprint of
raw milk and the virtual water imports by external dairy products consumed in the
local market. Among the alternative economic criteria used in this study, the adequacy of Life Cycle
Cost Analysis methodology was assessed. This approach is the methodological framework
proposed by LCA for the integration of economic aspects of eco-efficiency and the
assessment of cost-effectiveness of alternative production processes and products (Norris,
2000).
Inventories were built of effective water costs ( ) based on the cost of extraction of
it: direct costs (consumption of electricity or diesel fuel, maintenance and repairs), indirect
costs (depreciation of equipment and well). Subsequently, the cost-effectiveness analysis was
added with assessment criteria of economic aspects of water footprint, as the economic impact
of a water footprint is related to water use inefficiency (Hoekstra, 2009).
In accordance with economic criteria proposed by Hoekstra (2009), for the analysis and
discussion of results in the framework of a deductive theoretical model according to Young
(2005), the Global Water Productivity index ( ) was built as the inverse function of the
water footprint of the system:
(7)
(8)
Returning to the equation (7), some global determinants of the value of WF indicator
and their relationships can be identified.
The numerator of the fraction, the intensity of water use will depend, among other
variables, on the consumption of water in the feed chain (production of DM within the
system) and import of virtual water from external supplementation, which depends on the
chain composition (type and acreage), effective precipitation, use of irrigation, feed chain
balance (adjusted stocking efficiently, avoiding excess supply of MS).
Regarding the denominator, milk productivity will depend on DM production per mm
of water per unit area (water productivity feed chain (kgMS / ha / mm), which allow systems
with higher stocking rates, and thus, higher milk production per ha in a water efficient
manner.

7
Finally, economic issues associated with eco-efficiency comparison between systems
were approached by estimating the negative impact on the producers' economic surplus
derived from not using the most efficient available technology, i.e., that increased global
water productivity of the system:
(9)
Where is the water cost-effectiveness or economic loss per unit of water; the
commodity price (milk); the global potential productivity of water in the system (Liter
of milk / Liter of water); the current global water productivity in the system (L milk / L
water). Simplifying assumptions: (a) global potential productivity of the system is equivalent
to the current productivity of the best system under study, (b) potential water productivity can
be achieved at the same cost as current productivity, (c) the price of the product is
homogeneous.
The Total Economic Cost ( ) as a criteria for determining the cost relative water
efficiency of dairy production systems, is given by the sum of the Cost Effectiveness of
extraction , and water efficiency cost ( ), according to equation (10):
(10)
III. Results
III.1 Inventory
III.1.1 Physical Inventory of Primary Production: feed phase and milking process
The results of calculations of total water consumption by the system, using
AGROECOINDEX® model for animal feed, animal drink and farming pulverizations, are
tabulated below (Table 1).
Inventory data for milking routine process was built based on data collected by
measurements in situ. In all the cases studied there are water reuse systems, mainly resulting
from the process of cooling (plate cooler) where water is stored and managed to animal drink.
These reused volumes are not counted as consumption, avoiding duplication.
8
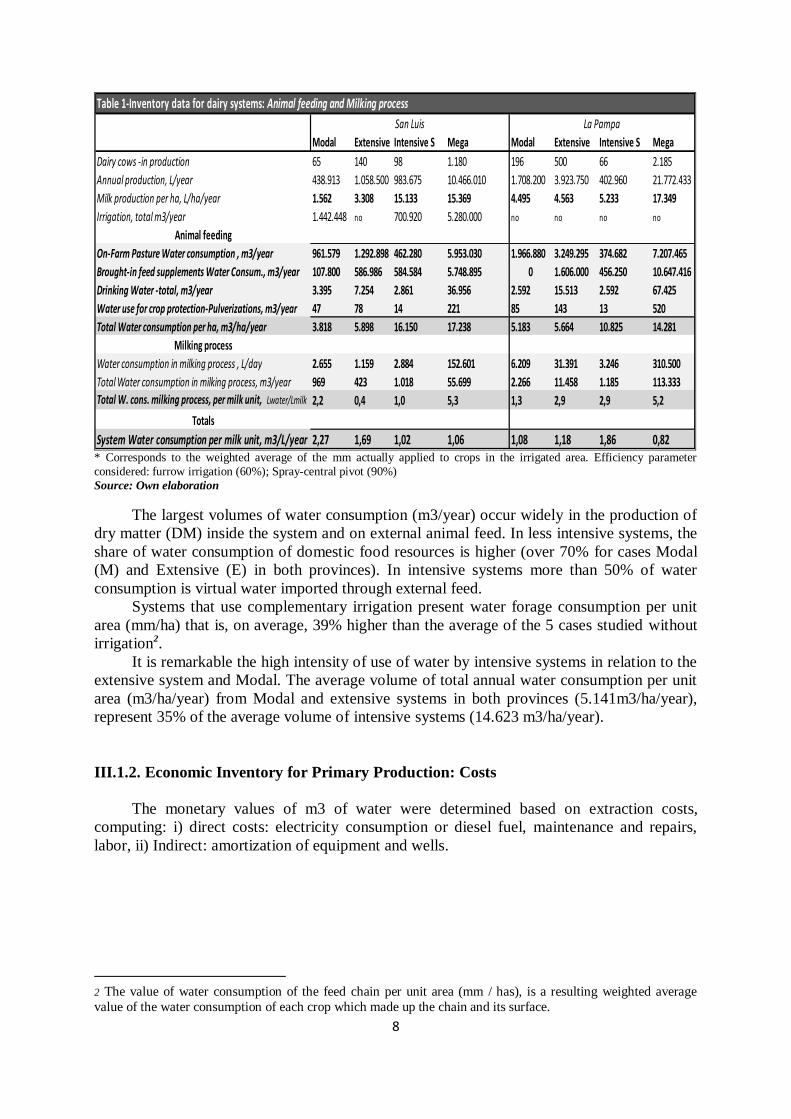
Table 1-Inventory data for dairy systems: Animal feeding and Milking process
Modal Extensive Intensive S Mega Modal Extensive Intensive S Mega
Dairy cows -in production 65 140 98 1.180 196 500 66 2.185
Annual production, L/year 438.913 1.058.500 983.675 10.466.010 1.708.200 3.923.750 402.960 21.772.433
Milk production per ha, L/ha/year 1.562 3.308 15.133 15.369 4.495 4.563 5.233 17.349
Irrigation, total m3/year 1.442.448 no 700.920 5.280.000 no no no no
Animal feeding
On-Farm Pasture Water consumption , m3/year 961.579 1.292.898 462.280 5.953.030 1.966.880 3.249.295 374.682 7.207.465
Brought-in feed supplements Water Consum., m3/year 107.800 586.986 584.584 5.748.895 0 1.606.000 456.250 10.647.416
Drinking Water -total, m3/year 3.395 7.254 2.861 36.956 2.592 15.513 2.592 67.425
Water use for crop protection-Pulverizations, m3/year 47 78 14 221 85 143 13 520
Total Water consumption per ha, m3/ha/year 3.818 5.898 16.150 17.238 5.183 5.664 10.825 14.281
Milking process
Water consumption in milking process , L/day 2.655 1.159 2.884 152.601 6.209 31.391 3.246 310.500
Total Water consumption in milking process, m3/year 969 423 1.018 55.699 2.266 11.458 1.185 113.333
Total W. cons. milking process, per milk unit, Lwater/Lmilk 2,2 0,4 1,0 5,3 1,3 2,9 2,9 5,2
Totals
System Water consumption per milk unit, m3/L/year 2,27 1,69 1,02 1,06 1,08 1,18 1,86 0,82
San Luis La Pampa
* Corresponds to the weighted average of the mm actually applied to crops in the irrigated area. Efficiency parameter
considered: furrow irrigation (60%); Spray-central pivot (90%)
Source: Own elaboration
The largest volumes of water consumption (m3/year) occur widely in the production of
dry matter (DM) inside the system and on external animal feed. In less intensive systems, the
share of water consumption of domestic food resources is higher (over 70% for cases Modal
(M) and Extensive (E) in both provinces). In intensive systems more than 50% of water
consumption is virtual water imported through external feed.
Systems that use complementary irrigation present water forage consumption per unit
area (mm/ha) that is, on average, 39% higher than the average of the 5 cases studied without
irrigation2.
It is remarkable the high intensity of use of water by intensive systems in relation to the
extensive system and Modal. The average volume of total annual water consumption per unit
area (m3/ha/year) from Modal and extensive systems in both provinces (5.141m3/ha/year),
represent 35% of the average volume of intensive systems (14.623 m3/ha/year).
III.1.2. Economic Inventory for Primary Production: Costs
The monetary values of m3 of water were determined based on extraction costs,
computing: i) direct costs: electricity consumption or diesel fuel, maintenance and repairs,
labor, ii) Indirect: amortization of equipment and wells.
2 The value of water consumption of the feed chain per unit area (mm / has), is a resulting weighted average
value of the water consumption of each crop which made up the chain and its surface.
9
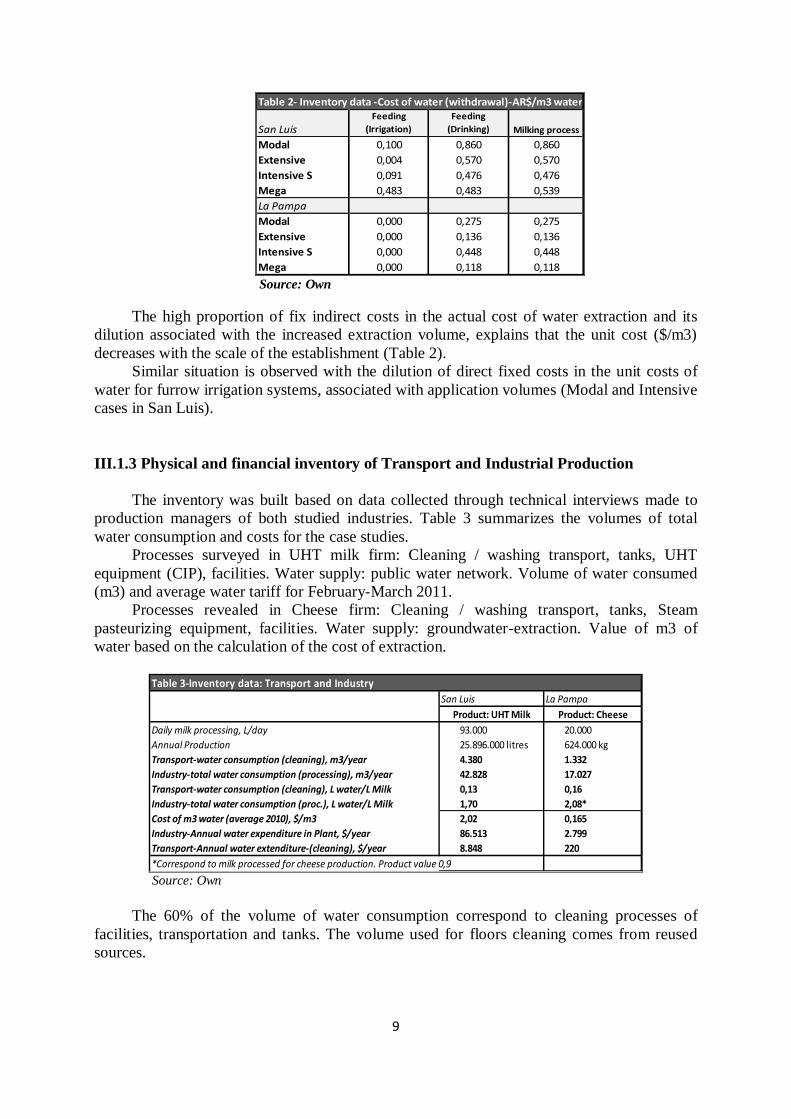
Table 2- Inventory data -Cost of water (withdrawal)-AR$/m3 water
San LuisFeeding
(Irrigation)
Feeding
(Drinking) Milking process
Modal 0,100 0,860 0,860
Extensive 0,004 0,570 0,570
Intensive S 0,091 0,476 0,476
Mega 0,483 0,483 0,539
La Pampa
Modal 0,000 0,275 0,275
Extensive 0,000 0,136 0,136
Intensive S 0,000 0,448 0,448
Mega 0,000 0,118 0,118 Source: Own
The high proportion of fix indirect costs in the actual cost of water extraction and its
dilution associated with the increased extraction volume, explains that the unit cost ($/m3)
decreases with the scale of the establishment (Table 2).
Similar situation is observed with the dilution of direct fixed costs in the unit costs of
water for furrow irrigation systems, associated with application volumes (Modal and Intensive
cases in San Luis).
III.1.3 Physical and financial inventory of Transport and Industrial Production
The inventory was built based on data collected through technical interviews made to
production managers of both studied industries. Table 3 summarizes the volumes of total
water consumption and costs for the case studies.
Processes surveyed in UHT milk firm: Cleaning / washing transport, tanks, UHT
equipment (CIP), facilities. Water supply: public water network. Volume of water consumed
(m3) and average water tariff for February-March 2011.
Processes revealed in Cheese firm: Cleaning / washing transport, tanks, Steam
pasteurizing equipment, facilities. Water supply: groundwater-extraction. Value of m3 of
water based on the calculation of the cost of extraction.
Table 3-Inventory data: Transport and Industry
San Luis La Pampa
Daily milk processing, L/day
Annual Production
Transport-water consumption (cleaning), m3/year
Industry-total water consumption (processing), m3/year
Transport-water consumption (cleaning), L water/L Milk 0,13 0,16
Industry-total water consumption (proc.), L water/L Milk 1,70 2,08*
Cost of m3 water (average 2010), $/m3
Industry-Annual water expenditure in Plant, $/year
Transport-Annual water extenditure-(cleaning), $/year
*Correspond to milk processed for cheese production. Product value 0,9
17.027
0,165
2.799
220
20.000
624.000 kg
1.332
Product: UHT Milk Product: Cheese
93.000
25.896.000 litres
4.380
42.828
2,02
86.513
8.848
Source: Own
The 60% of the volume of water consumption correspond to cleaning processes of
facilities, transportation and tanks. The volume used for floors cleaning comes from reused
sources.

10
III.2 Virtual Water from primary production: comparison between systems
In the study cases from San Luis, Intensive S and Mega dairy systems had the lowest
value of Virtual Water (VW) per liter of raw milk: 1,025 Lwater/Lmilk and 1,065 Lwater/Lmilk,
respectively. The biggest indicator corresponded to Modal dairy: 2,275 Lwater/Lmilk.
In La Pampa, the Mega dairy system had the lowest indicator of virtual water: 828
Lwater/Lmilk; the greatest value corresponded to the Intensive S system: 1,867 Lwater/Lmilk
(Table 4).
In terms of averages, there is a greater indicator of virtual water and higher relative
dispersion for dairy farms of San Luis (1,515 Lwater/Lmilk, CV = 39%); La Pampa: 1,241
Lwater/Lmilk, CV = 35.7%).
Table 4-Virtual Water of Dairy systems: case studies
Modal Extensive Intensive S Mega Modal Extensive Intensive S Mega
Feeding, L water/L milk/year 2.273 1.694 1.024 1.060 1.084 1.184 1.862 823
Milking process, L water/L milk/year 2,21 0,40 1,02 5,32 1,33 2,92 2,94 5,21
Total Virtual Water -Dairy, L water/L milk/year 2.275 1.694 1.025 1.065 1.085 1.187 1.865 828
San Luis La Pampa
Source: Own
In relation with the intensity of resource use and productivity of the system per unit
area, Modal and Extensive systems produced the lowest levels in both provinces (Figure 1). For the intensive systems studied in San Luis, it is observed that productivity
compensate their intensity of resource use, like what happens in the case of Mega dairy in La
Pampa. This result is relevant, since the intensive systems studied in San Luis use
complementary irrigation and present virtual water indicators below the average indicator of
both provinces (Figure 1).
Figure 1 - Productivity of milk and intensity of water use by the system under study
Separating Virtual Water indicator between green water and blue water, we observe that
the Intensive S and Mega dairy systems present values and proportions of blue water
relatively similar: 194 Lwater/Lmilk and 290 Lwater/Lmilk, respectively. In the case of the most
intensified system (Mega dairy), blue water consumption is higher than on-farm green water,
an aspect that reveals the reality of the need for complementary irrigation systems for dairy
farming in the semiarid region (Figure 2).
3.842 5.898
16.150 17.238
10.782
5.183 5.664
10.825
14.281
8.988
1.5623.308
15.133 15.369
8.843
4.495 4.563 5.233
17.349
7.910
2.275 1.694 1.025 1.065 1.515 1.085 1.187 1.865 827 1.241
Modal Extensive Intensive S Mega Average Modal Extensive Intensive S Mega Average
San Luis La Pampa
Milk productivity and water use intensity Total water consumption, m3/ha/yearProduction per ha, milk L/ha/yearTotal Virtual Water Dairy, water L/milk L

11
(a) (b)
Figure 2 - Virtual blue and green water primary production by component: study cases from San Luis.
(a) volume, (b) percentage share.
However, it is noteworthy that in the cases studied in both provinces, it is observed that
further intensification of the system corresponds to a higher proportion of external virtual
water incorporated into the basis of animal nutrition through supplementation (external DM).
This source is the main contributing factor in the VW indicator for intensive systems, more
than 50% in all cases3 (Figures 2 and 3).
(a) (b)
Figure 3 - Virtual blue and green water in primary production component: study cases from La Pampa.
(A) volume, (b) percentage share.
External feed involves green water, therefore, added to the green virtual water from
internal DM production, determine its prevalence in the virtual water indicator for the systems
under study (Figures 2 and 3).
III.3 Virtual Water determination for industrial production and supply relationships:
UHT Milk and Cheese cases.
Primary production, in particular animal feeding, is largely the main determinant of
Virtual Water indicator for both dairy products under study. Explains over 99% of its value
(Table 5), and reveals the importance of consideration of the variants of dairy systems.
According to equation (5) (section II) virtual water content of the functional units of a
liter of UHT milk and a Kg of cheese, packaged and ready for distribution, were determined.
3 Modal case of La Pampa produces on-farm all the supplements used for feeding.
1.273
1.160
257
248
765
194
290
228
527
571
519
- 500 1.000 1.500 2.000 2.500
Modal
Extensive
Intensive S
Mega
Virtual Water Dairy-San Luiswater Litres / milk litre
Green water on-farm DM intake Blue water on-farm DM intake
water Supplements (external DM)
1.273
1.160
257
248
765
194
290
228
527
571
519
0% 20% 40% 60% 80% 100%
Modal
Extensive
Intensive S
Mega
Virtual Water Dairy-proportions- San Luis-water litres / milk litre
Green water on-farm DM intake Blue water on-farm DM intake
water Supplements (external DM)
1.082
790
837
330
0
390
1019
489
- 500 1.000 1.500 2.000
Modal
Extensive
Intensive S
Mega
Virtual Water Dairy-La Pampa
water litres / milk litre
Green water on-farm DM intake water Supplements (external DM)
1.082
790
837
330
0
390
1019
489
0% 20% 40% 60% 80% 100%
Modal
Extensive
Intensive S
Mega
Virtual Water Dairy-proportions- La Pampawater litres / milk litre
Green water on-farm DM intake water Supplements (external DM)

12
In both industrial dairy products analyzed, the lowest value indicator was introduced in
Virtual Water supply variants of intensive systems. In the case of the dairy industry in San
Luis, 990 liters of water per liter of UHT packaged milk under Intensive S System, and in the
case of La Pampa, 7,476 liters of water per Kg. of cheese from the Mega dairy System (Table 5).
Table 5-Virtual Water of Industrial Products: UHT Milk and Cheese, by dairy system
Modal Extensive Intensive S Mega Modal Extensive Intensive S Mega
Feeding, L water/L milk/year 2.273 1.694 1.024 1.060 1.084 1.184 1.862 823
Milking process, L water/L milk/year 2,21 0,40 0,19 5,32 1,33 2,92 2,94 5,21
Transport, L water/L milk /year
Industry, L water/L milk
Value product fraction
Virtual Water per raw material unit processed, L water/L milk 2.186 1.628 985 1.024 979 1.071 1.680 748
UHT Milk -Product Factor*, raw milk L/UHT milk
UHT Milk-Virtual Water, water L/UHT milk L. 2.197 1.636 990 1.030Cheese - Product Factor*, milk L/Kg. Cheese
Cheese-Virtual Water, L water/kg. Cheese 9.786 10.705 16.802 7.476
San Luis La Pampa
0,13 0,18
1,70 2,32
0,96 0,9
10
1,005
* Corresponds to the inverse of the product fraction (1/fp) to express the virtual water indicator in units of final product (functional unit defined). The product fraction 1L UHT milk is 0.995. In the case of cheese, a product fraction of 0.1 is considered, average value for the three types of cheeses produced in the plant (soft cheeses, hard and semihard).
Source: Own
From the analysis of the value of virtual water per liter of raw milk processed, it is
remarkable the low VW values in the large-scale intensive dairy farms in both provinces:
1,024 liters of water per liter of processed milk in San Luis and 748 liters of water per liter of
processed milk in La Pampa (Table 5).
The greatest VW indicator per liter of processed milk corresponds to Modal dairy farm
of San Luis (2,186 Lwater/Lmilk), followed by Intensive S dairy farm of La Pampa (1,680
Lwater/Lmilk) (Table 5).
The heterogeneity between systems magnifies the differences in the Virtual Water
indicator for Cheese in La Pampa, by the fact of the conversion factor of raw material in the
final product (liters of milk / kg. Cheese). The lowest VW indicator for cheese Kg. was the
Mega dairy farm with 7,476 liters of water per kg. of cheese, while the Intensive S system
showed the highest water indicator with 16,802 L water/kg. cheese (Table 5).
Alternatively, virtual water content of two additional dairy byproducts for both
industries were calculated, such us the case of Cream (42.8% fat) in San Luis, and “Ricotta”,
resulting from the cheese processing in La Pampa.
The lowest value of virtual water per liter of Cream corresponds to the case of the
Intensive S System in San Luis: 1,983 liters of water per liter of Cream. VW for Ricotta, by
Mega dairy farm supply, reach 1,628 liters of water per kg. of product (Table 9).
Table 6-Virtual Water Industrial sby-products: Cream y Ricotta, per dairy system
San Luis La Pampa
Modal Extensive Intensive S Mega Modal Extensive Intensive S Mega
Feeding, L water/L milk/ year 2.273 1.694 1.024 1.060 1.084 1.184 1.862 823
Milking process, L water/L milk/ year 2,21 0,40 0,19 5,32 1,33 2,92 2,94 5,21
Transport, L water/L milk/ year
Industry, L water/L milk
Value product fraction
Product factor*, raw milk proc. (L)/product unit (L)
Cream -Virtual Water, L water/ L Cream 4.400 3.277 1.983 2.062
Ricotta-Virtual Water, L water/kg. Ricotta 2.131 2.331 3.659 1.628
0,13 0,18
1,70 2,32
0,04 0,1
48,3 19,6
* Corresponds to the inverse of the fraction product (1/fp) to express the virtual water indicator in units of final
product (functional unit defined). The product fraction is 0.02 for 1L of Cream and 0.05 for 1kg of Ricotta. Source: Own
13
IV. Discussion
IV.1 Virtual Water and comparison of system water eco-efficiency
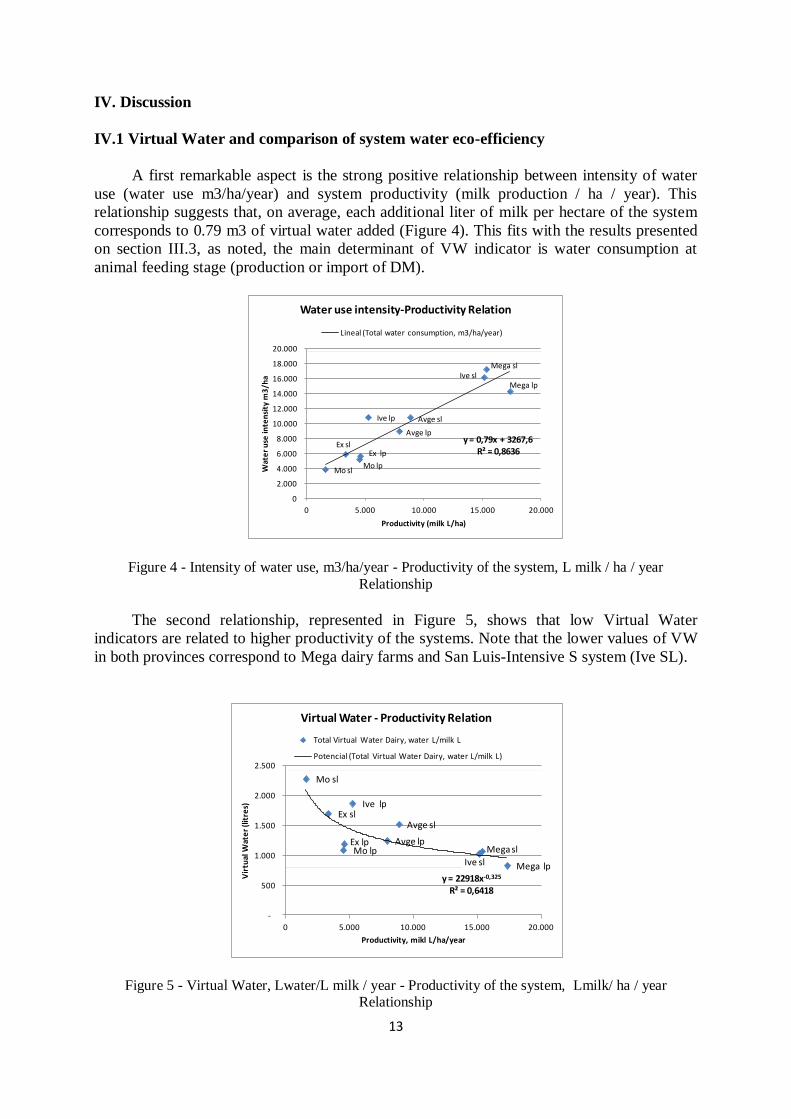
A first remarkable aspect is the strong positive relationship between intensity of water
use (water use m3/ha/year) and system productivity (milk production / ha / year). This
relationship suggests that, on average, each additional liter of milk per hectare of the system
corresponds to 0.79 m3 of virtual water added (Figure 4). This fits with the results presented
on section III.3, as noted, the main determinant of VW indicator is water consumption at
animal feeding stage (production or import of DM).
Figure 4 - Intensity of water use, m3/ha/year - Productivity of the system, L milk / ha / year
Relationship
The second relationship, represented in Figure 5, shows that low Virtual Water
indicators are related to higher productivity of the systems. Note that the lower values of VW
in both provinces correspond to Mega dairy farms and San Luis-Intensive S system (Ive SL).
Figure 5 - Virtual Water, Lwater/L milk / year - Productivity of the system, Lmilk/ ha / year Relationship
Mo sl
Ex sl
Ive sl Mega sl
Avge sl
Mo lp
Ex lp
Ive lp
Mega lp
Avge lpy = 0,79x + 3267,6
R² = 0,8636
0
2.000
4.000
6.000
8.000
10.000
12.000
14.000
16.000
18.000
20.000
0 5.000 10.000 15.000 20.000
Wat
er
use
inte
nsi
ty m
3/h
a
Productivity (milk L/ha)
Water use intensity-Productivity Relation
Lineal (Total water consumption, m3/ha/year)
Mo sl
Ex sl
Ive sl
Mega sl
Avge sl
Mo lpEx lp
Ive lp
Mega lp
Avge lp
y = 22918x-0,325
R² = 0,6418
-
500
1.000
1.500
2.000
2.500
0 5.000 10.000 15.000 20.000
Vir
tual
Wat
er
(lit
res)
Productivity, mikl L/ha/year
Virtual Water - Productivity Relation
Total Virtual Water Dairy, water L/milk L
Potencial (Total Virtual Water Dairy, water L/milk L)

14
The most water efficient dairy systems are those in which their productivity compensate
the intensity of resource use. This brings to the conceptualization of the inverse function of
Virtual Water, expressed in liters of milk per mm4, as a proxy of the Global Water
Productivity of the dairy system -equation (8) of Section II5-; driving to the approach of the
analysis of its determinants for the considered systems, to explain aspects of the heterogeneity
of eco-efficiency of such water use.
As noted in Results III.3and in consistency with Mekonnen and Hoekstra (2010) results:
i. intensive systems with high productivity (Mega and Intensive S dairy farms)
had the lowest indicators of total VW.
ii. main contributing factor to total VW was the green water from external feed.
These results suggest that:
a) While virtual water productivity of external feeds is less than the observed for
other sources of feed within the system, its existence in the animal feed ration
contributes significantly to the global water productivity of the system as a
whole -Table 7-.
b) However, if it is technically possible (nutritional equivalence) the replacement
of external feed by internal feed sources with more water productivity (higher
kg DM/mm), maintaining the same conversion efficiency, it would be possible
to reach further reductions on VW value, increasing water eco-efficiency of the
system.
These two points are visible, examining the productivity of complementary irrigation
from San Luis study cases.
Table 7- Water Productivity of feeding: on farm DM intake and supplements-San Luis study cases.
ValueMetabolization
average ValueMetabolization
average ValueMetabolization
average ValueMetabolization
average
On-farm water productivity Kg MS/mm 12,73 0,474 11,72 0,481 12,21 0,455 9,80 0,454
Brought supplements w productivity Kg MS/mm 4,94 0,682 6,09 0,682 4,55 0,682 4,54 0,682
On-farm DM average production kgMS/ha 11.201 5.695 8.130 4104
External DM average import kgMS/ha 3.259 1.118 4.088 174,4
Total DM per ha kgMS/ha 14.460 6.813 12.218 4.278
Irrigation
Mega Extensive Intensive S Modal
yes No yes yes
Source: Own
The average productivity of internal water (green and blue) of -On farm DM
production- in Mega dairy is 12.73 kgDM/mm, and the average productivity of external water
(green) of External feed is 4.94 kg. DM/mm. Extensive system has similar values of internal
productivity per mm (11.7 kg DM / mm).
Hence, in terms of dairy system productivity, the use of complementary irrigation in
Mega dairy allow to maximize DM production per unit area, making two annual crops of
grass silage. This increase of dry matter production per unit area allows for greater stocking
rate that results in an increase in milk production per hectare, ceteris paribus the rest of the
variables that determine the system milk productivity. This explains most of the greater global
4 Cfr similar conceptualizations of water productivity in agriculture in Hoekstra (2009) and particular argentine
crops in Caviglia and Andrade (2010).
5
; Section II.

15
water productivity in efficient intensive systems (such as Mega or IveS in San Luis-Figure 5-),
that is, a lower water footprint of the system and its enhanced eco-efficiency of water use.
IV.2. Economic evaluation and comparison between systems
As presented in the results section, the explicit cost inventory of water (accountant) was
built from the extracting cost and tariff value (in the case of San Luis Milk Industry). Table 8
presents the actual cost of water (in AR $) per unit of raw material (liter of milk).
Table 8- Effective cost of water (withdrawal)- AR $ per liter of processed milk
San Luis Feeding Milk Processing Total Dairy Transport Milk Ind. Total VW Cost
Modal 0,23541 0,00190 0,2373 0,2410
Extensive 0,00169 0,00023 0,0019 0,0056
Intensive S 0,03861 0,00009 0,0387 0,0424
Mega 0,24501 0,00287 0,2479 0,2516
La Pampa Cheese Ind.
Modal 0,00069 0,00037 0,0011 0,0014
Extensive 0,00038 0,00040 0,0008 0,0011
Intensive S 0,00162 0,00132 0,0029 0,0033
Mega 0,00026 0,00058 0,0008 0,0012
0,00026 0,00344
0,00003 0,00034
Source: Own
It highlights the high cost of water in systems with irrigation, and among these, the
higher cost of center pivot irrigation system (4.8$/mm), transferred to the explicit economic
cost of Virtual Water (0,25 $/ L milk)-Table 8- which represents 17.5% of the raw material
price, and 12% of the final product6. However, among the case studies of San Luis, despite the
difference in the cost of mm applied, the cost of Virtual Water are similar for Modal and
Mega dairy systems, precisely because of the higher global system productivity of Mega dairy
farm (less VW)-Table 8-.
According to the methodological development (section II), approximating the economic
cost of environmental water inefficiency (cost water efficiency -), valuing indirectly the
green water by the difference in the value of the global water productivity of system -Table 9-
, we obtain:
Tabla 9- Economic value of Water estimates, systems comparison.
Modal Extensive Intensive S Mega Average Modal Extensive Intensive S Mega Average
Global Water Productivity (average), L water/L milk 0,0003 0,0006 0,0008 0,0008 0,0006 0,0009 0,0008 0,0005 0,0012 0,0008
Value of water productivity*, $/water liter 0,0005 0,0008 0,0012 0,0012 0,0008 0,0012 0,0011 0,0007 0,0017 0,0011
Enviromental cost of Water** $/water liter (1) 0,0007 0,0004 - 0,00003 0,0004 0,0005 0,0006 0,0010 - 0,0006
Liters of Virtual Water exceeded (2) 1.250 669 - 40 490 258 360 1.038 - 414 Econ. Cost of hydric inefficiency (CeH) $/L milk (1)x(2) 0,88 0,26 0,000 0,001 0,19 0,13 0,21 1,08 0,00 0,27
Effective Cost of water $/milk liter 0,241 0,006 0,042 0,252 0,135 0,001 0,001 0,003 0,001 0,002
Total Económic Cost of Water $/milk (Liter) 1,12 0,26 0,042 0,25 0,33 0,13 0,21 1,08 0,00 0,27
*Average water productivity multipy by the value of one liter of raw milk (AR$ 1,45 )
**Differencial of average global productivity value from the most efficient system (unitary Cost of hydric inefficiency-CeH-).
San Luis La Pampa
Source: Own
6 Average prices november-march 2010: $AR 1,45 per liter of raw milk on dairy; $AR 2,10 average price 2010 UHT milk liter on plant.
16
i. In San Luis, the total economic cost of the VW under a Mega dairy system (0.25 $ / L
milk), is almost equivalent to the Extensive system (0.26 $ / L milk).
ii. In San Luis, it highlights the low cost of water inefficiency of small-scale intensive
system (Ive S) with irrigation, it has the lowest total economic cost (0.042 $ / L milk),
followed by the Mega system of La Pampa.
iii. Among the study cases of La Pampa, it is remarkable the high negative impact of lack
of productive efficiency in the small scale intensive system, involving the high cost of
water inefficiency.
In relation to the expansion of present results at local or regional level, there are some
necessary aspects to be considered.
The potential economic productivity of water in a region will exceed the current
situation, if the water can be redistributed among sites or productive activities with greater
value added (Hoekstra, 2009).
Hoekstra (2009) notes that high-value crops such as intensive, provide greater economic
productivity of water, so it would seem attractive the relocation of water to its favor,
especially in areas where water is relatively more scarce. However, the redistribution of water
over large scales need to recognize that there are other factors to be considered in addition to
those that are purely economical, for example, factors related to a desirable degree of food
self-sufficiency (cereals) or availability of local raw materials in certain regions.
Therefore, the aspects related to the analysis of the allocation of water between
productive activities should be complete and not partial. It must involve not only the
economic aspects derived from the value and productivity of water, but also all those other
economic issues that are not involved in productivity, as well as social and environmental
(Hoekstra, 2009).
IV.3. Determining the flow of virtual water and water footprint of La Pampa and San
Luis Dairy chain and its main products.
The purpose of this discussion is to deploy conceptually the water footprint indicator in
milk agrifood Chain of a province and its main links –equation (6) Section II-, identifying the
virtual water flows between them. An approximation of the possible implications of
considering water eco-efficiency heterogeneities on systems, for determining the water
footprint of primary production is made.
La Pampa Province
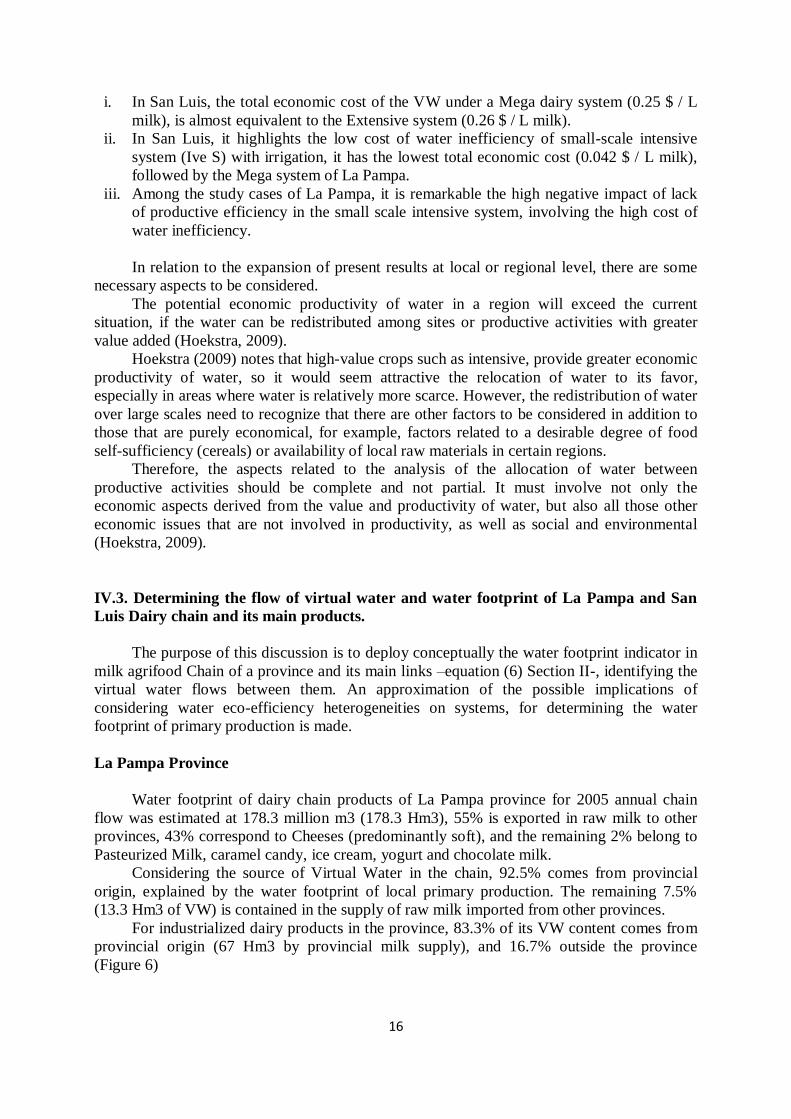
Water footprint of dairy chain products of La Pampa province for 2005 annual chain
flow was estimated at 178.3 million m3 (178.3 Hm3), 55% is exported in raw milk to other
provinces, 43% correspond to Cheeses (predominantly soft), and the remaining 2% belong to
Pasteurized Milk, caramel candy, ice cream, yogurt and chocolate milk.
Considering the source of Virtual Water in the chain, 92.5% comes from provincial
origin, explained by the water footprint of local primary production. The remaining 7.5%
(13.3 Hm3 of VW) is contained in the supply of raw milk imported from other provinces.
For industrialized dairy products in the province, 83.3% of its VW content comes from
provincial origin (67 Hm3 by provincial milk supply), and 16.7% outside the province
(Figure 6)
17
Figure 6-Water Footprint of the dairy chain products of La Pampa, by component. Year 2005
Virtual Water Flow of La Pampa milk chain (2005) was determined according to the
developed methodology -equation (6), Section II-. The total water footprint of the chain was
estimated at 224.4 Hm3, finding that the local consumption of dairy products added 46.1 Hm3
of water to the Virtual Water Footprint of Chain Products (178,3 Hm3), through the
importation of dairy products from other provinces (Figure 7).
Primary Production
Water Footprint
165H m3172 dairy farms
20.540 Cows 133M litres milk
Raw Milk
Exports: 98Hm3
Raw Milk
Local Industry supplies 67H m3
Industry
Virtual Water
Imported-Industry suppy
13,1H m3 10,7M litres milk
Raw milk imported: 13,1H m3
Industry
Virtual Water Added
Industrial use: 0,14H m320 Factories Process:
0,134 H m3
Transport: 0,0104 H m3
Industry
Water Footprint
-composition-
80,2H m3
Process: 0,134 H m3
Transport: 0,0104 H m3
Raw milk Imported:
13,1H m3
Raw milk Local
Industry: 67H m3
ProductsMilk Chain
Water Footprint
La Pampa (2005):
178H m3
Raw milk Exports 98H m3
Cheese soft46H m3
Cheese half 25H m3
Cheese hard 5H m3
Dulce de leche 0,6H m3
Pasteurized Milk 2,6H m3
Yogurt 0,4H m3
Icecream 0,5H m3
Chocolate Milk 0,01M m3
18
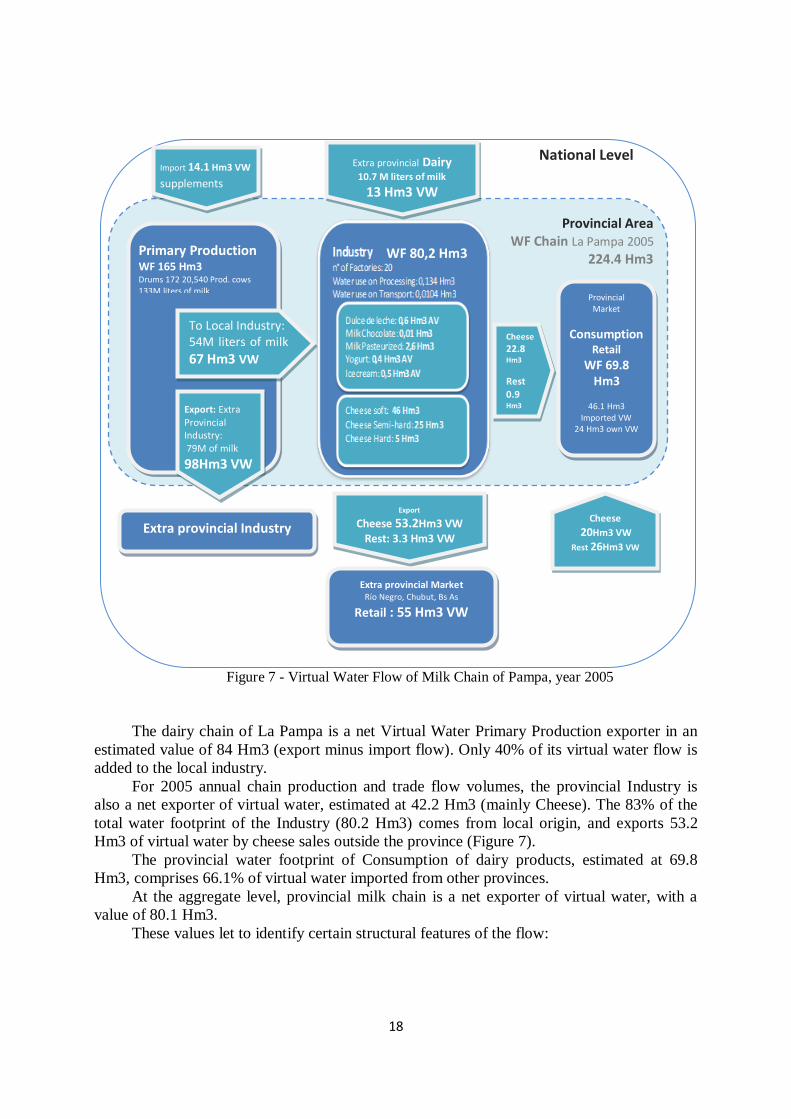
Figure 7 - Virtual Water Flow of Milk Chain of Pampa, year 2005
The dairy chain of La Pampa is a net Virtual Water Primary Production exporter in an
estimated value of 84 Hm3 (export minus import flow). Only 40% of its virtual water flow is
added to the local industry.
For 2005 annual chain production and trade flow volumes, the provincial Industry is
also a net exporter of virtual water, estimated at 42.2 Hm3 (mainly Cheese). The 83% of the
total water footprint of the Industry (80.2 Hm3) comes from local origin, and exports 53.2
Hm3 of virtual water by cheese sales outside the province (Figure 7).
The provincial water footprint of Consumption of dairy products, estimated at 69.8
Hm3, comprises 66.1% of virtual water imported from other provinces.
At the aggregate level, provincial milk chain is a net exporter of virtual water, with a
value of 80.1 Hm3.
These values let to identify certain structural features of the flow:
National Level
To Local Industry: 54M liters of milk
67 Hm3 VW
Export: Extra Provincial Industry: 79M of milk
98Hm3 VW
Export
Cheese 53.2Hm3 VW Rest: 3.3 Hm3 VW
Provincial Market
Consumption Retail
WF 69.8 Hm3
46.1 Hm3
Imported VW 24 Hm3 own VW
Extra provincial Market Río Negro, Chubut, Bs As
Retail : 55 Hm3 VW
Extra provincial Industry
Extra provincial Dairy
10.7 M liters of milk
13 Hm3 VW
Primary Production WF 165 Hm3 Drums 172 20,540 Prod. cows 133M liters of milk
Provincial Area WF Chain La Pampa 2005
224.4 Hm3
Cheese
22.8 Hm3
Rest 0.9
Hm3
Cheese
20Hm3 VW
Rest 26Hm3 VW
Import 14.1 Hm3 VW
supplements
Industry WF 80.2 Hm3n° of Factories: 20Water use on Processing: 0,134 Hm3Water use on Transport: 0,0104 Hm3
Dulce de Leche: 0,6 Hm3
Milk Chocolate : 0,01 Hm3 Pasteurized Milk: 2,6 Hm3Yogurt: 0,4 Hm3Icecream: 0,5 Hm3
Cheese soft: 46 Hm3Cheese semi-hard: 25 Hm3Cheese Hard: 5 Hm3
WF 80,2 Hm3

19
1. Primary production:
The high primary production share on total milk chain water footprint (74%) and its
prevalence of VW content in the supply of local industry (83.5%), highlights the
importance of optimizing productivity levels of dairy farmers, increasing water
productivity in these systems.
2. Industry
The water footprint is determined almost entirely by the VW content of the raw
material incorporated into their products.
3. Consumption:
The pattern of consumption estimates for the province of La Pampa and the
particularities of the dairy market, show a high dependency ratio of external water
for consumption of 66.1%, defined as the ratio between the virtual water content of
imports for consumption and the total water footprint of provincial consumption.
4. General
a. The pattern of supply of the dairy industry and the nature of provincial net
exporter of virtual water, revels the high total water self-sufficiency ratio for the
milk Chain: 67.2%, defined as the ratio between internal virtual water and the
total Chain water footprint.
b. On the supply side: Economic valuation of net exports flow, where a high
proportion of its total VW has less economic value (raw material), provides an
additional reason for the importance of adding value to primary production
source (i.e. adding value to water), apart from the reduction of idle capacity in
industry on average 33% as is noted by Iturrioz and Iglesias (2009).
c. The maximization of the value of water productivity also implies minimizing the
economic cost of water use inefficiency in a milk chain.
d. On the demand side / consumption: as an environmental objective would focus
on minimize their water footprint, it would be relevant for the dynamic of
consumption to address the substitution of imported virtual water only if the
water footprints of imported goods are lower than local ones.
San Luis Virtual Water Flow
Virtual Water Flow Chain of San Luis for the year 2008 was determined according to
equation (6), Section II. The total water footprint of the chain was estimated at 151 Hm3,
noting that local consumption of dairy products add 84.9 Hm3 of water through imports of
dairy products from other provinces to the 66.2 Hm3 content of Virtual Water Footprint of
local chain products (Figure 8).

20
Figure 8 – Virtual Water Flow of San Luis Milk Chain, year 2008
San Luis milk chain is slightly net exporter of Virtual Water in its Primary Production
with an estimated value of 7.4 Hm3. From the total Water footprint of primary production of
25Hm3, only 37% is added to the local industry.
For the volumes of production and trade flows of specific products in the considered
period, the provincial Industry is net export of virtual water, with an estimated value of 42.2
Hm3, explained almost entirely by the exports of UHT milk.
Virtual water imports of raw material supply equate this value, so the resulting balance
of net exports is only 2.2 Hm3. Only 18% of the total water footprint of the industry,
estimated at 50.7 Hm3, is rooted in local VW, revealing a high dependency ratio of external
water supply.
The provincial water footprint of Consumption of dairy products, estimated at 93.4
Hm3, is 90% externalized, this is, consist on virtual water imported from other provinces.
At the aggregate level, the provincial milk chain is a net importer of virtual water of
75.3 Hm3.
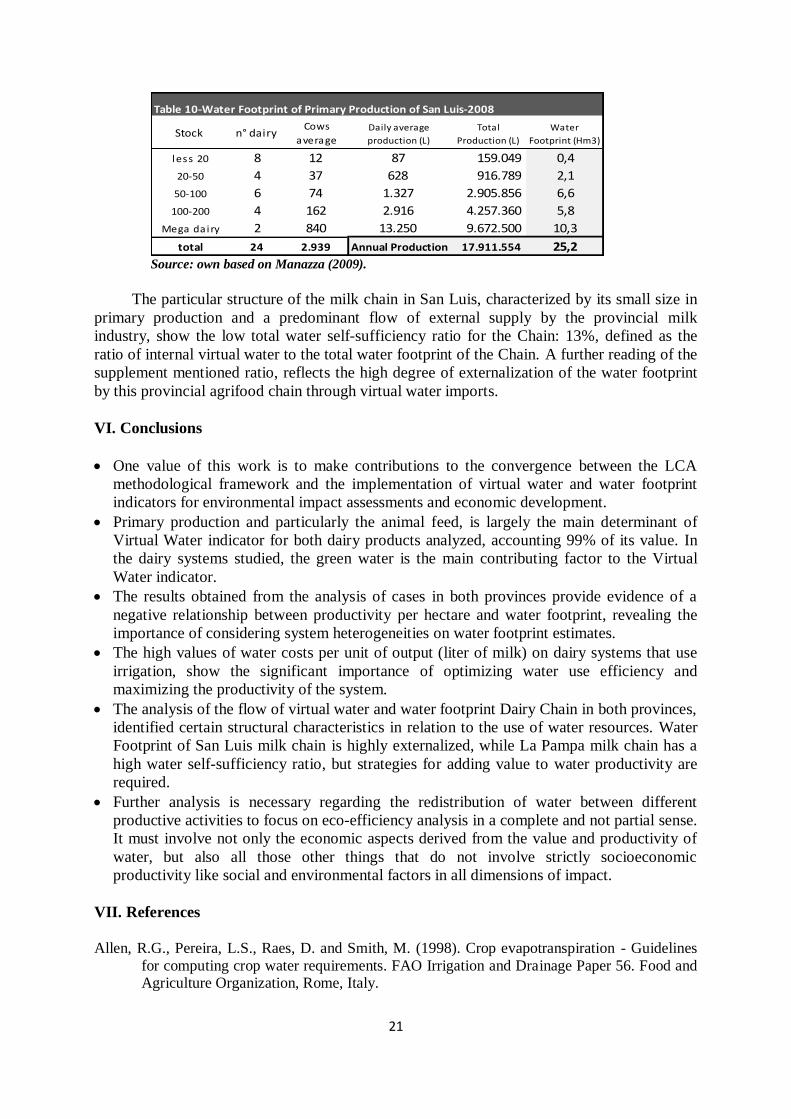
It highlights that 54% of primary milk production is concentrated in the two Mega dairy
farms, their relative more eco-efficiency water use is reflected by their lower participation in
the water footprint of primary production: 37.5% (Table 10).
To Local Industry: 6.2 M liters of milk
7.7 Hm3 VW Cheese and direct row:
2.2 M liters ; 3Hm3 VW
Export: Extra Industry Prov: 9.5 M Liters milk
14, 4 Hm3 VW
Export
VW UHT milk 40.1 Hm3 VW Cream: 2.1 Hm3
Provincial Market
WF Consumption
Retail 93.4 Hm3
84.9 Hm3 Imported
8.5 Hm3 own
Extra provincial Market (35% Cuyo)
Retail: VW 42.2 Hm3
Extra provincial Industry (Córdoba)
/
Extra provincial Dairy
26.2 M liters of milk
39.7 Hm3 VW
Primary Production WF 25 Hm3 24 Dairies ; 2939 Prod. Cows
17.9 million liters of milk
Provincial Area WF Chain San Luis 2008
151Hm3
VW UHTmilk
7Hm3
VW
Cheese 1.5Hm3
VW Cheese
55Hmᶾ
Rest
30Hmᶾ
30
Hmᶾ
57.8 HH
Hm3
National Level
Industryn° of Factories: 1Water use on Processing: 0,057 Hm3Water use on Transport: 0,0042 Hm3
UHT Milk: 47,1 Hm3 VWCream: 2,1 Hm3 VW
Daiiry : Cheese semihard
1,5 Hm3 VW
50.7 Hm3 WF
21
Source: own based on Manazza (2009).
The particular structure of the milk chain in San Luis, characterized by its small size in
primary production and a predominant flow of external supply by the provincial milk
industry, show the low total water self-sufficiency ratio for the Chain: 13%, defined as the
ratio of internal virtual water to the total water footprint of the Chain. A further reading of the
supplement mentioned ratio, reflects the high degree of externalization of the water footprint
by this provincial agrifood chain through virtual water imports.
VI. Conclusions
One value of this work is to make contributions to the convergence between the LCA
methodological framework and the implementation of virtual water and water footprint
indicators for environmental impact assessments and economic development.
Primary production and particularly the animal feed, is largely the main determinant of
Virtual Water indicator for both dairy products analyzed, accounting 99% of its value. In
the dairy systems studied, the green water is the main contributing factor to the Virtual
Water indicator.
The results obtained from the analysis of cases in both provinces provide evidence of a
negative relationship between productivity per hectare and water footprint, revealing the
importance of considering system heterogeneities on water footprint estimates.
The high values of water costs per unit of output (liter of milk) on dairy systems that use
irrigation, show the significant importance of optimizing water use efficiency and
maximizing the productivity of the system.
The analysis of the flow of virtual water and water footprint Dairy Chain in both provinces,
identified certain structural characteristics in relation to the use of water resources. Water
Footprint of San Luis milk chain is highly externalized, while La Pampa milk chain has a
high water self-sufficiency ratio, but strategies for adding value to water productivity are
required.
Further analysis is necessary regarding the redistribution of water between different
productive activities to focus on eco-efficiency analysis in a complete and not partial sense.
It must involve not only the economic aspects derived from the value and productivity of
water, but also all those other things that do not involve strictly socioeconomic
productivity like social and environmental factors in all dimensions of impact.
VII. References
Allen, R.G., Pereira, L.S., Raes, D. and Smith, M. (1998). Crop evapotranspiration - Guidelines
for computing crop water requirements. FAO Irrigation and Drainage Paper 56. Food and Agriculture Organization, Rome, Italy.
Table 10-Water Footprint of Primary Production of San Luis-2008
Stock n° dairyCows
averageDaily average
production (L)
Total
Production (L)
Water
Footprint (Hm3)
less 20 8 12 87 159.049 0,4
20-50 4 37 628 916.789 2,1
50-100 6 74 1.327 2.905.856 6,6
100-200 4 162 2.916 4.257.360 5,8
Mega dairy 2 840 13.250 9.672.500 10,3
total 24 2.939 Annual Production 17.911.554 25,2
22
Aldaya M.M., Hoekstra, A.Y. (2010). The water needed for Italians to eat pasta and pizza.
Agricultural Systems 103 (6), 351-360.
Ashworth, J. (2008). Encuestas a establecimientos tamberos de la Provincia de San Luis.
Proyecto de Lechería extra-pampeana. No publicado.
Basset, C.-Mens, Ledgard S., Boyes, M.. (2009). Eco-efficiency of intensification scenarios for milk production in New Zealand. Ecological Economics 68 (6), 1615-1625.
Bogliani, M., Masiá, G., Onorato, A. (2005). Pulverizaciones agrícolas terrestres. Instituto de
Ingeniería Rural INTA Castelar. Disponible en: http://www.inta.gov.ar/iir/info /indices/tematico/dirpulverizacion.htm
Caviglia O.P., Andrade F.H. (2010). Sustainable Intensification of Agriculture in the Argentinean
Pampas: Capture and Use Efficiency of Environmental Resources. En: Di Benedetto, A.
(Ed) Plant science and biotechnology in South America: Focus on Argentina I. The Americas Journal of Plant Science and Biotechnology 3 (1), 1-8.
Cederberg, C. (2003). Life Cycle Assessment of animal products. 19-34. En: Mattsson, B., Sonesson, U. (Ed). Environmentally-friendly food processing. England: CRC Press.
Chapagain, A.K., Hoekstra, A.Y. (2003). Virtual water flows between nations in relation to trade
in livestock and livestock products. Value of Water Research Report Series nº13. Delft,
the Netherlands: UNESCO-IHE. Disponible en: http://www.waterfootprint.org /?page=files/Publications
Chapagain, A.K., Hoekstra, A.Y. (2004). Water footprints of nations. Value of Water Research
Report Series nº 16. Delft, the Netherlands: UNESCO-IHE. Disponible en: http://www.waterfootprint.org/?page=files /Publications
Dirección general de estadística y censo de La Pampa (DGEyC). (2010). Anuario general 2010.
La Pampa: DGEyC. Disponible en: http://www.estadisticalapampa.gov.ar /index.php?option=com_content&task=view&id= 299&Itemid=102
Eide, M.H. (2002). Life Cycle Assessmentof Industrial Milk Production.Int J LCA 7 (2), 115-126.
FAO (2010). Greenhouse Gas Emissions from the Dairy Sector. A Life Cycle Assessment. Rome,
Italy: Food and Agriculture Organization. Disponible en: http://www.fao.org/
docrep/012/k7930e/k7930e00.pdf
Felice, G. (2009). Estimación del consumo de agua en tambos de la cuenca Norte de la Provincia
de La Pampa durante la rutina de ordeñe. Proyecto PROFEDER. INTA. Análisis de las
articulaciones inter empresariales en la dinámica local y territorial de la cadena Láctea:
el desafío de implementar buenas prácticas productivas y ambientales en cuencas lecheras de La Pampa. No publicado.
Frank, F. (2007). Impacto agroecológico del uso de la tierra a diferentes escalas en la región
pampeana de Argentina. Tesis Mag.Sc. Manejo y Conservación de Recursos Naturales para la Agricultura. Balcarce. Univ. Nac. de Mar del Plata, Fac. de Cs.Agr.
Hoekstra, A.Y., Hung, P.Q. (2002). Virtual water trade: A quantification of virtual water flows
between nations in relation to international crop trade. Value of Water Research Report
Series n° 11. Delft, the Netherlands: UNESCO-IHE. Disponible en: http://www.waterfootprint.org /?page=files/Publications
Hoekstra, A.Y. (2003). Virtual Water. An Introduction. Virtual Water Trade. En:Proceedings of
the International Expert Meeting on Virtual Water Trade. Values of Water Research
Report Series nº 12. Delft, the Netherlands: UNESCO-IHE. Disponible en: http://www.waterfootprint.org/?page=files/ Publications
Hoekstra, A.Y., Chapagain, A.K., Aldaya, M.M. and Mekonnen, M.M. (2009). Water footprint
manual: State of the art 2009. Enschede, the Netherlands: Water Footprint Network. Disponible en: http://www.waterfootprint.org/?page=files/Publications

23
Hospido A., Moreira M.T, Feijoo G. (2003). Simplified life cycle assessment of galician milk
production. International Dairy Journal 13, 783–796.
Iglesias, D. (2004). Relevamiento exploratorio del análisis del ciclo de vida de productos y su aplicación en el sistema agroalimentario. Buenos Aires: Ediciones INTA.
INTA (2007). Sistema de Extensión Rural y Transferencia de Tecnología con énfasis en el desarrollo de los territorios, Centro Regional La Pampa - San Luis. Policopiado.
ISO (2006). ISO 14040:2006. Disponible en: http://www.iso.org/iso/catalogue_detail?
csnumber=37456
Iturrioz, G., Iglesias, D.H. (2009). La cadena de la leche en la Provincia de La Pampa. 87-100p.
En: Iglesias, Ghezan (ed.). Análisis de la Cadena de la Leche en Argentina, Estudios
socioeconómicos de los sistemas Agroalimentarios y Agroindustriales n°4. Buenos Aires: Ediciones INTA.
Manazza, J.F. (2009). La Cadena de la Leche Bovina en la Provincia de San Luis. Documento de Trabajo PE2742-INTA. No Publicado.
Mattsson, B., Sonesson, U. (Eds.) (2003). Environmentally-friendly food processing. England: CRC Press.
Ministerio de Agricultura Ganadería y Pesca de la Nación (MAGyP). (2011). Dirección Nacional
de Transformación y Comercialización de productos agrícolas y forestales. Base de datos
[en linea] <http://www.alimentosargentinos.gob.ar/lacteos/docs/06 Consumo/ Consumo03.htm>
Mekonnen, M.M.,Hoekstra, A.Y. (2010). The green, blue and grey water footprint of farm
animals and animal products, Value of Water Research Report Series n° 48. UNESCO-IHE. Disponible en: http://www.waterfootprint.org/?page=files/Publications
Mekonnen, M.M., Hoekstra, A.Y. (2011). The green, blue and grey water footprint of crops and derived crop products. Hydrology and Earth System Sciences 15(5), 1577-1600.
Norris, G. (2003). Integrating Economic Analysis into LCA. Environmental Quality Management
10(3), 59-64.
Rearte, D. (2007). Informe de situación de la producción de carne vacuna argentina. Programa de producción de carne. Disponible en: http://www.inta.gov.ar/actual/informes.asp
Saenz, C. A., Colazo, J., Montiel E.O. (2011). Disponibilidad de Recursos Hídricos y potencial de
riego de la provincia de San Luis. XXIII Congreso Nacional de Agua 2011, Resistencia, Chaco, Argentina. 06/2011.
Sistema integrado de información agropecuaria (SIIA). 2011. Agricultura. Disponible en: http://www.siia.gov.ar/index.php/series-por-tema/agricultura.
Van der Werf, H.M.G., Petit, J., (2002). Evaluation of the environmental impact of agriculture at
the farm level: a comparison and analysis of 12 indicator-based methods. Agriculture Ecosystems and Environment 93, 131-145.
Viglizzo, E., Frank, F., Bernardos, J., Buschiazzo, D., Cabo, S. (2006). A rapid method for
assessing the environmental performance of commercial farms in the pampas of Argentina. Environ Monit Assess 117, 109–134.
Viglizzo EF, Frank FC, Carreño LV, Jobbágy EG, Pereyra H, Clatt J, Pincén D, Riccard MF.
(2010). Ecological and environmental footprint of 50 years of agricultural expansion in Argentina. Global Change Biology 17 (2), 959-973.
Young, R. A. (2005). Determining the Economic Value of Water: Concepts and Methods. Washington: RFF Press.
Top Related