


![Nuclear Waster Management, 9/11/79 [Briefing Book] [1]](https://static.fdocuments.in/doc/165x107/61cc8b1d1b94d7642b37ad24/nuclear-waster-management-91179-briefing-book-1.jpg)


Languages
Pages
Legal


Waster & Wastewater Rate Analysis and Proposed Increase - Page 1 of 18

Water & Wastewater Rate Increase April 17, 2017
2 | P a g e
Phase II (planned) o Replacement – Lift Station A o Replacement – Force Main A o WTP – Filter backwash handling
Phase III (planned)
o Bio-solids handling SCHEDULE/TIME IMPLICATIONS Phases III and IV are scheduled in the following years:
Phase III – 2019 Phase IV – 2026
BUDGET IMPLICATIONS See attachment – Water and Wastewater Rate Study RECOMMENDATION Staff recommends the rate increases to provide necessary funding for the City’s water and wastewater utilities. Recommended Scenario:
Cumulative Increase FY 17-22: 29% FY17-27: 53%
Bond Issuances (2) Total: $57.8M
Average Monthly Bill FY 2021: 5 kGal: $60.58 15 kGal: $115.05
STAFF REFERENCE David H. Willett, MBA, PE – Director of Public Works [email protected] 303.450.8783 Jason Loveland – Director of Finance [email protected] 303.450.8817 Raymond Reling – Utilities Manager [email protected] 303.450.4049 ATTACHMENTS Water and Wastewater Rate Study
Waster & Wastewater Rate Analysis and Proposed Increase - Page 2 of 18
The City of Northglenn, Colorado
April 17, 2017
Utility Rate Study
Waster & Wastewater Rate Analysis and Proposed Increase - Page 3 of 18

Operating Cost
+/- ∆ in Fund Balance
Debt Service
Cash Funded Projects“Revenue Requirement”
=
Rate Study Balances Cost and Revenues
(less) Other revenue
Waster & Wastewater Rate Analysis and Proposed Increase - Page 4 of 18

What Makes up Your Revenue Requirement?
The Revenue Requirement increases during the study period are primarily due to projected capital costs
Combined Water and Wastewater Enterprise
$8.9 $9.3 $9.6 $9.9 $10.2 $10.5 $10.8 $11.1 $11.5 $11.8 $12.2
$2.8 $3.1 $3.4 $3.7 $4.0 $4.4 $4.5 $4.6 $4.7 $4.9 $5.0
$0.0
$2.0
$4.0
$6.0
$8.0
$10.0
$12.0
$14.0
$16.0
$18.0
2017 2018 2019 2020 2021 2022 2023 2024 2025 2026 2027
Milli
ons
Operating & Maintenance Capital & Related Debt Costs
Waster & Wastewater Rate Analysis and Proposed Increase - Page 5 of 18

Relying on Existing Rates Will Not WorkRevenue Required vs. Revenue at Existing Rates
We are unable to meet the projected costs without making adjustments to the water and sewer rates
$11.4
$12.4$13.0
$13.6$14.2
$14.9$15.3
$15.7$16.2
$16.7$17.2
$6.0
$8.0
$10.0
$12.0
$14.0
$16.0
$18.0
2017 2018 2019 2020 2021 2022 2023 2024 2025 2026 2027
Milli
ons
Revenue Requirement Current Revenues
Waster & Wastewater Rate Analysis and Proposed Increase - Page 6 of 18
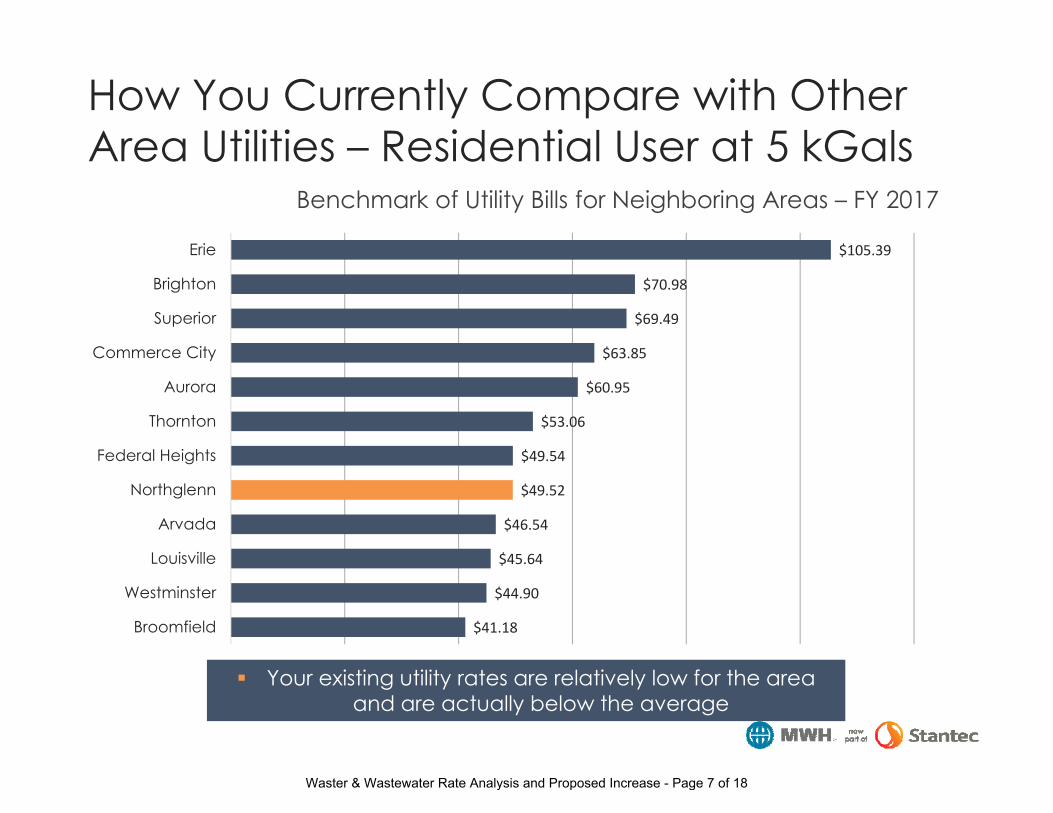
$41.18
$44.90
$45.64
$46.54
$49.52
$49.54
$53.06
$60.95
$63.85
$69.49
$70.98
$105.39
Broomfield
Westminster
Louisville
Arvada
Northglenn
Federal Heights
Thornton
Aurora
Commerce City
Superior
Brighton
Erie
How You Currently Compare with Other Area Utilities – Residential User at 5 kGals
Your existing utility rates are relatively low for the area and are actually below the average
Benchmark of Utility Bills for Neighboring Areas – FY 2017
Waster & Wastewater Rate Analysis and Proposed Increase - Page 7 of 18
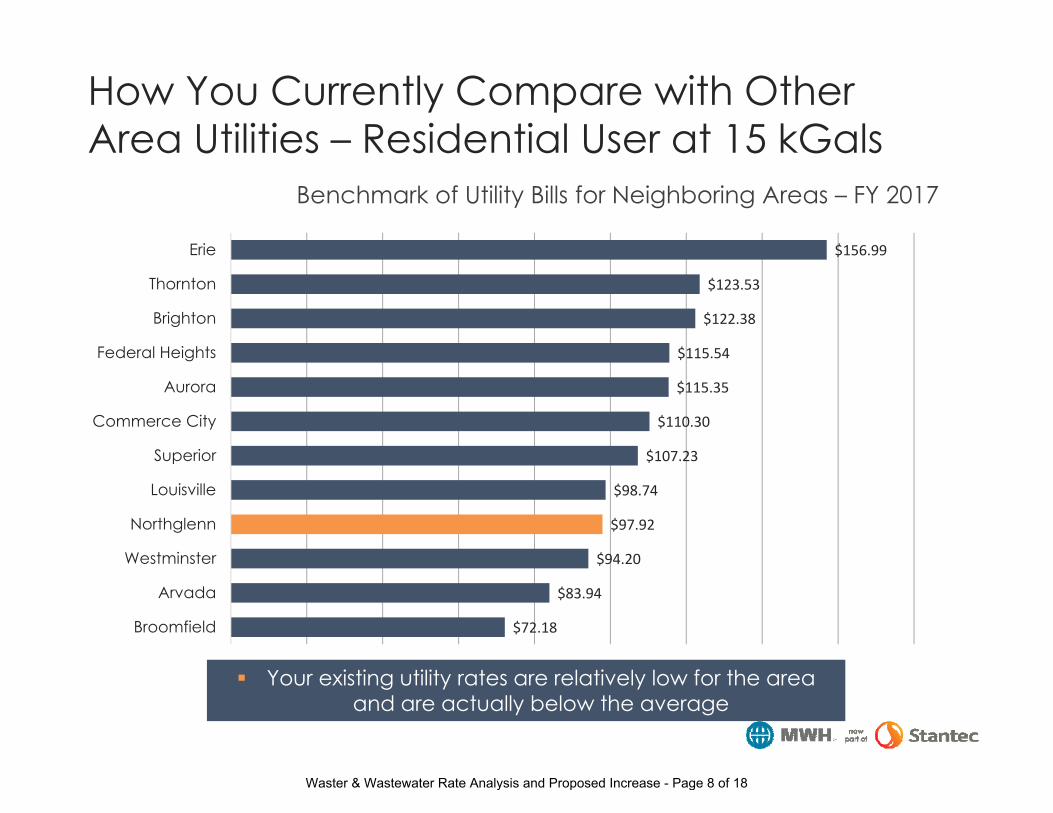
$72.18
$83.94
$94.20
$97.92
$98.74
$107.23
$110.30
$115.35
$115.54
$122.38
$123.53
$156.99
Broomfield
Arvada
Westminster
Northglenn
Louisville
Superior
Commerce City
Aurora
Federal Heights
Brighton
Thornton
Erie
How You Currently Compare with Other Area Utilities – Residential User at 15 kGals
Your existing utility rates are relatively low for the area and are actually below the average
Benchmark of Utility Bills for Neighboring Areas – FY 2017
Waster & Wastewater Rate Analysis and Proposed Increase - Page 8 of 18

Major Capital Investment is Driving the Need for Revenue
Total Project Needs2017-2027
Water($9.9M)
Wastewater($73.7M)
$83.6M
WASTEWATERHeadworks & Clarifier ($7.4M)Decommission S. Lagoon ($1.4M)Lift Station A & Forcemain ($29M)Bio-solids Handling ($29M)
WATERFilter Backwash Handling ($3.0M)
Major Projects Include…
Waster & Wastewater Rate Analysis and Proposed Increase - Page 9 of 18
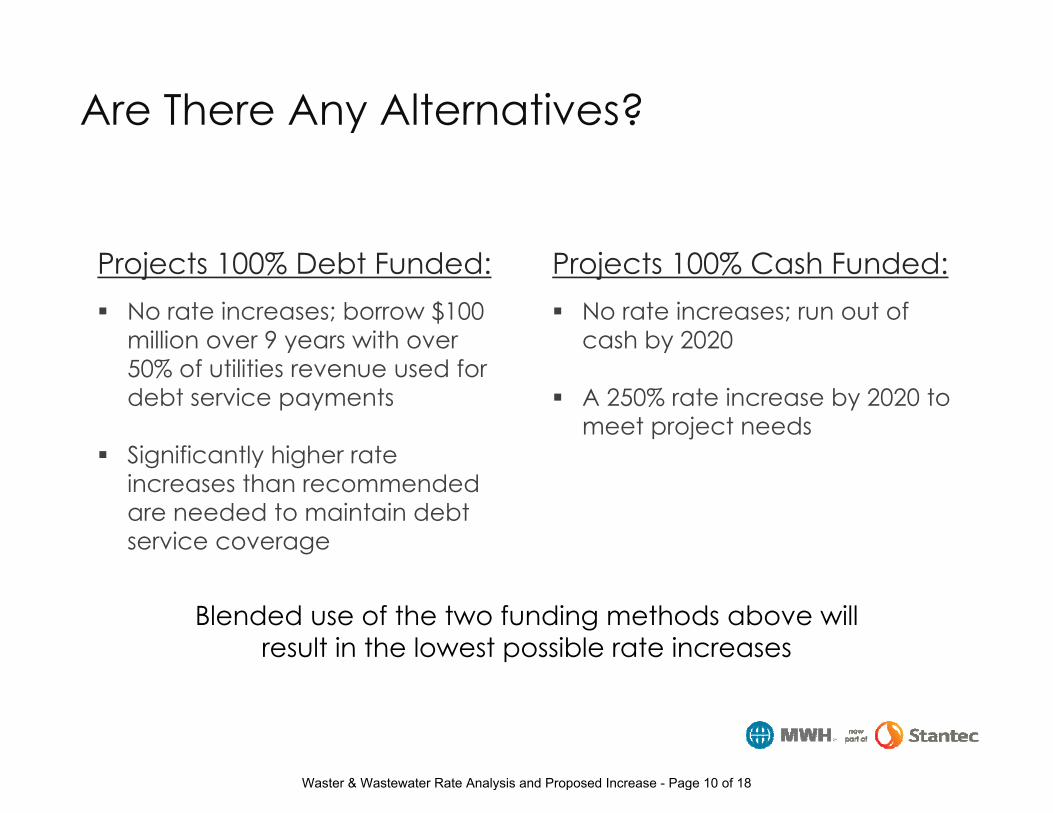
Are There Any Alternatives?
Projects 100% Cash Funded: No rate increases; run out of
cash by 2020
A 250% rate increase by 2020 to meet project needs
Projects 100% Debt Funded: No rate increases; borrow $100
million over 9 years with over 50% of utilities revenue used for debt service payments
Significantly higher rate increases than recommended are needed to maintain debt service coverage
Blended use of the two funding methods above will result in the lowest possible rate increases
Waster & Wastewater Rate Analysis and Proposed Increase - Page 10 of 18

These Projects Deliver Key Benefits
The City of Northglenn strives to provide quality, uninterrupted service to its customers
Decommission Southern Lagoon
Lift Station A Forcemain Replacement Bio-Solids Handling
Filter Backwash Handling
*If these projects are not completed, the City risks higher fees and project costs in a smaller time frame
Regulatory / Operating Efficiencies
Waster & Wastewater Rate Analysis and Proposed Increase - Page 11 of 18
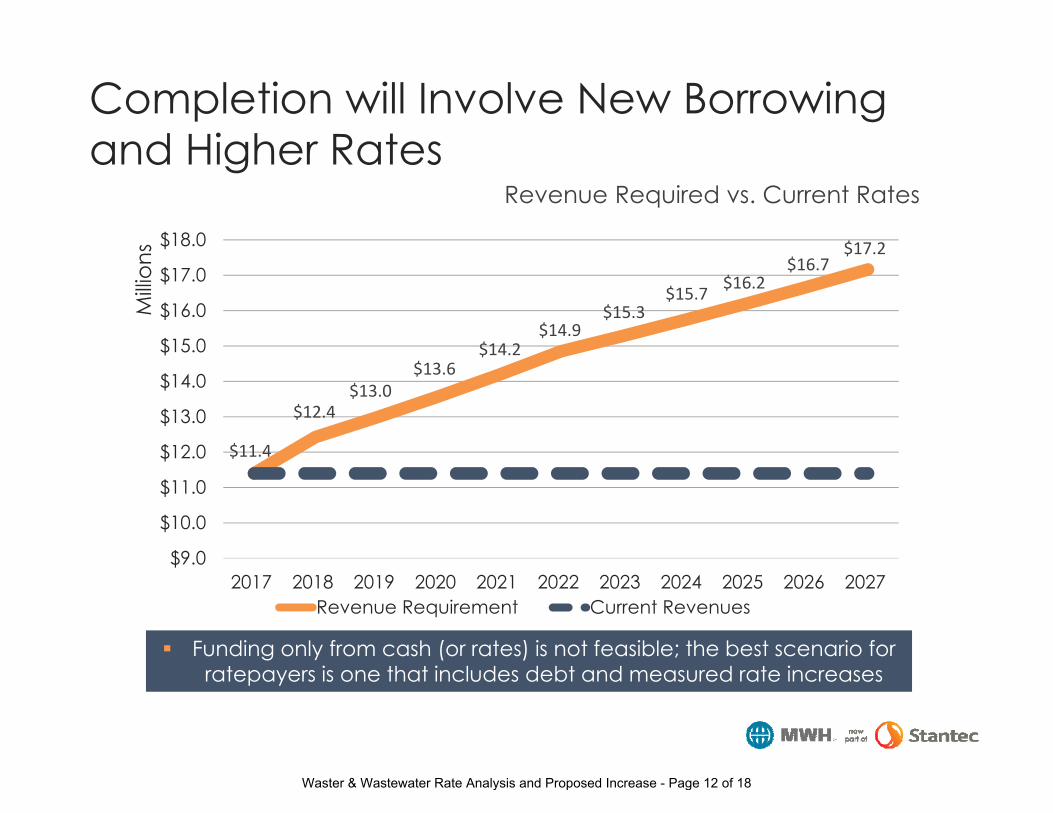
Completion will Involve New Borrowing and Higher Rates
Revenue Required vs. Current Rates
Funding only from cash (or rates) is not feasible; the best scenario for ratepayers is one that includes debt and measured rate increases
$11.4
$12.4$13.0
$13.6$14.2
$14.9$15.3
$15.7 $16.2$16.7
$17.2
$9.0
$10.0
$11.0
$12.0
$13.0
$14.0
$15.0
$16.0
$17.0
$18.0
2017 2018 2019 2020 2021 2022 2023 2024 2025 2026 2027
Milli
ons
Revenue Requirement Current Revenues
Waster & Wastewater Rate Analysis and Proposed Increase - Page 12 of 18

Borrowing Levels to Fund the Plan*
2019 2026
$32.7M $25.0M $57.7MTotal
The majority of borrowing is for wastewater projects; it represents 58% of the capital funds for the 10-year CIP – the rest of the funds come from cash reserves
*all debt is assumed at 30-yr term at 4-5% interest
Waster & Wastewater Rate Analysis and Proposed Increase - Page 13 of 18

Recommended Rate Adjustments
3.1%
5.2% 5.2% 5.3% 5.4% 5.3%
3.3% 3.4% 3.4% 3.4% 3.4%
6.6% 6.7% 6.8%
5.3% 5.3%
3.5% 3.6% 3.6% 3.6% 3.6%
0.0%
1.0%
2.0%
3.0%
4.0%
5.0%
6.0%
7.0%
8.0%
2017 2018 2019 2020 2021 2022 2023 2024 2025 2026 2027
Perc
enta
ge In
crea
se
Recommended Scenario Scenario 2
Overall Rate Increases
For the Recommended Scenario, which includes a mid-year increase in FY 2017, the average increase to customers’
combined bill is about 4.2%, per year through 2027
Waster & Wastewater Rate Analysis and Proposed Increase - Page 14 of 18
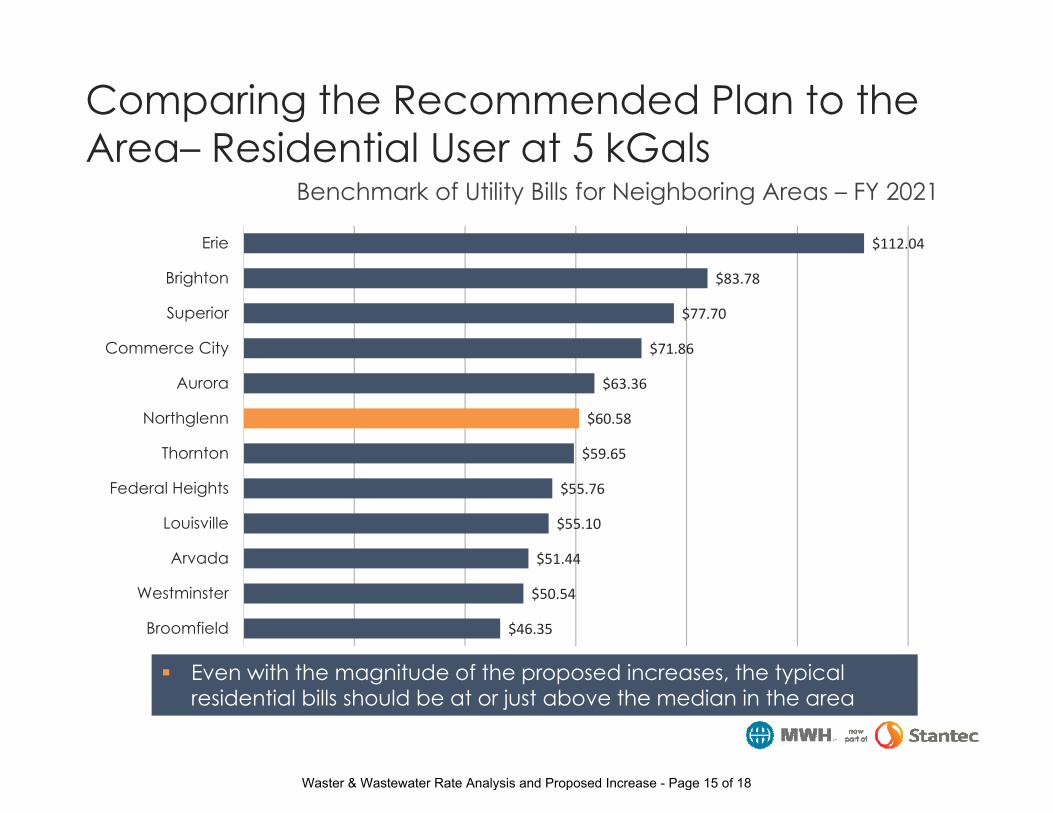
Comparing the Recommended Plan to the Area– Residential User at 5 kGals
Even with the magnitude of the proposed increases, the typical residential bills should be at or just above the median in the area
Benchmark of Utility Bills for Neighboring Areas – FY 2021
$46.35
$50.54
$51.44
$55.10
$55.76
$59.65
$60.58
$63.36
$71.86
$77.70
$83.78
$112.04
Broomfield
Westminster
Arvada
Louisville
Federal Heights
Thornton
Northglenn
Aurora
Commerce City
Superior
Brighton
Erie
Waster & Wastewater Rate Analysis and Proposed Increase - Page 15 of 18

Comparing the Recommended Plan to the Area– Residential User at 15 kGals
A high user, in this scenario, still is projected to pay 13-20% less as compared to Federal Heights and Thornton
Benchmark of Utility Bills for Neighboring Areas – FY 2021
$81.24
$91.93
$106.02
$114.86
$115.05
$116.39
$121.08
$124.14
$130.04
$138.83
$146.21
$170.68
Broomfield
Arvada
Westminster
Louisville
Northglenn
Superior
Aurora
Commerce City
Federal Heights
Thornton
Brighton
Erie
Waster & Wastewater Rate Analysis and Proposed Increase - Page 16 of 18

Scenario Key Indicators
Recommended Scenario: Cumulative Increase:
FY 17-22: 29% FY17-27: 53%
Bond Issuances: 2 Total: $57.8M
Average Monthly Bill FY 2021: 5 kGal: $60.58 15 kGal: $115.05
Scenario 2: Cumulative Increase:
FY 17-22: 35% FY17-27: 61%
Bond Issuances: 2 Total: $59.3M
Average Monthly Bill FY 2021: 5 kGal: $63.40 15 kGal: $120.29
Waster & Wastewater Rate Analysis and Proposed Increase - Page 17 of 18
Thank You
Waster & Wastewater Rate Analysis and Proposed Increase - Page 18 of 18
Top Related