


Languages
Pages
Legal


WASHINGTON STATE
ECONOMIC AND REVENUE FORECAST COUNCIL
Washington State Economic and Revenue Forecast
Presented to
PUBM 5700 Economic Analysis Seattle University
Steve Lerch Chief Economist & Executive Director
March 10, 2016
Seattle, Washington
March 10, 2016 Washington State Economic and Revenue Forecast Council
Forecast Oversight
ERFC
Council hires Executive Director for three year term
Director hires staff
Total staff of five
Economic and Revenue
Forecast Council
Office of the
Forecast Council Governor's Council
of
Economic Advisors
Forecast
Work Group

March 10, 2016 Washington State Economic and Revenue Forecast Council
ERFC Forecast Process
National Economic Forecast
Preliminary Washington State Economic Forecast
Review by Work Group
Review by Governor’s Council of Economic Advisors &
Economic and Revenue Forecast Council
Final National and Washington Economic Forecast
Review by Forecast Council
Final Washington General Fund Revenue Forecast
ERFC and Revenue-Generating Agencies Create Revenue Forecasts
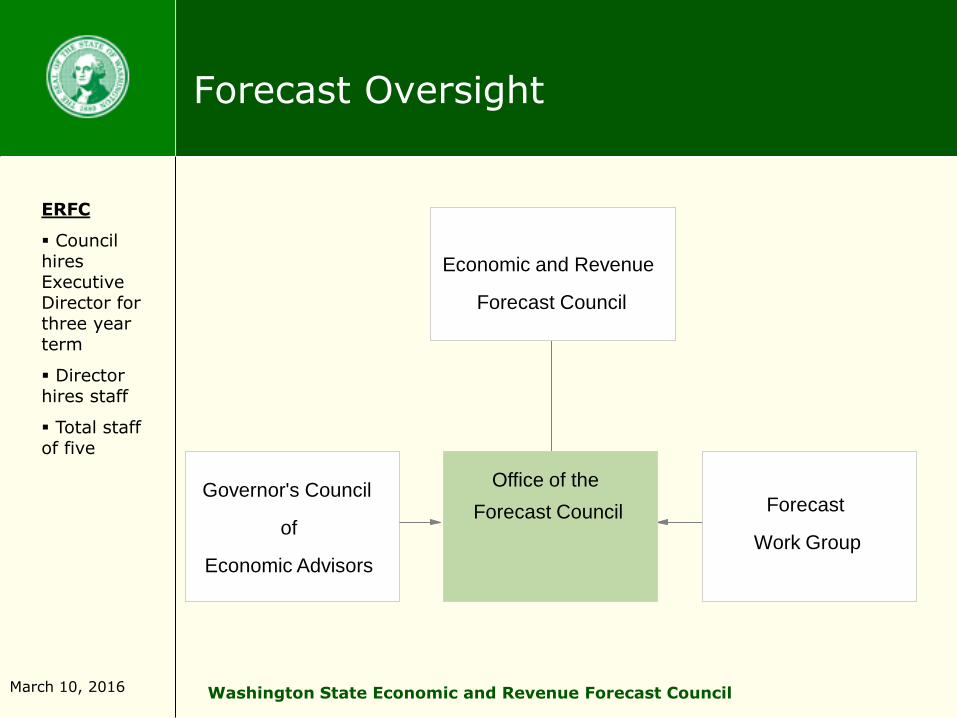
The national economic forecast is provided by Global Insight
March 10, 2016 Washington State Economic and Revenue Forecast Council
U.S. Macro Model Overview
Model captures full simultaneity of U.S. economy
Output, employment, incomes, prices, interest rates, international trade, industrial detail, etc.

March 10, 2016 Washington State Economic and Revenue Forecast Council
ERFC’s US economic model
ERFC U.S.
Forecast
Blue chip consensus
GDP
Global Insight model
Brent & WTI
futures prices

March 10, 2016 Washington State Economic and Revenue Forecast Council
ERFC’s Washington economic model
U.S. Economic Forecast
Other Exogenous
Employment Wage Rates Nonwage
Income
Wage & Salary
Disbursements
Population & Housing
Personal Income

March 10, 2016 Washington State Economic and Revenue Forecast Council
Revenue Act model overview
QBR data on taxable
activity (5 month lag)
DOR data on credits, refunds, remittances (1
month lag)
State and National Economic
Models
Quarterly forecast of
activity
Bimonthly forecast of
credits, refunds remittances
Bimonthly forecast of
receipts (1st through
10th, 11th through EOM)
B&O, RST, Use and Public Utility are broken into 40 components (some small sources like semiconduct-ors and nuclear waste disposal are forecasted exogenously)

March 10, 2016 Washington State Economic and Revenue Forecast Council
Washington Economic Overview
2014 State GDP (current dollars): $422.9 billion
• 5.1% growth over 2013; 10th fastest in U.S.
• 2.5% of 2014 U.S. GDP
Dec. 2015 State Nonfarm Employment: 3.2 million
• 2.8% growth over Dec. 2014; 6th fastest in U.S.
• 2.2% of U.S. nonfarm employment
2015 State population: 7.2 million; 13th largest state
• 1.5% growth over 2014 (U.S. = 0.8%)
• 2.2% of U.S. population
Sources: U.S. Bureau of Labor Statistics, U.S. Census Bureau
March 10, 2016 Washington State Economic and Revenue Forecast Council
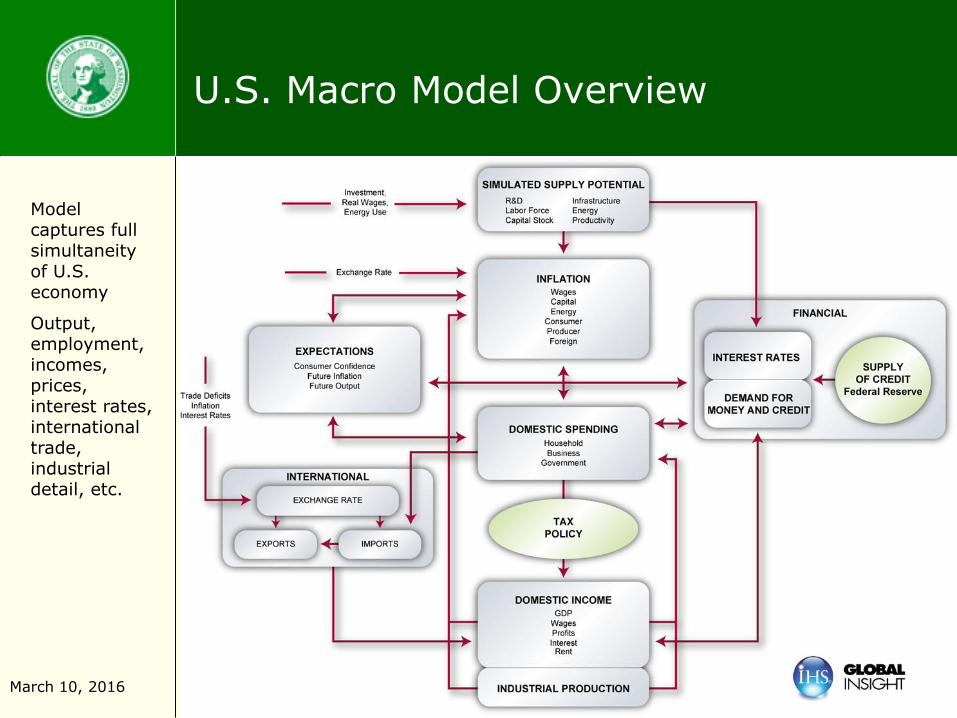
Distribution of state population by county, 2015
Source: Office of Financial Management, April 1, 2015
< 1%
1% - 3%
3.1 -7
7.1 – 12
> 12

March 10, 2016 Washington State Economic and Revenue Forecast Council
Seasonally adjusted unemployment rates by metro area, December 2015
Tri-Cities 6.6%
Spokane
6.3%
Yakima
7.9%
Tacoma
6.1%
Seattle
4.6%
Olympia
5.8%
Longview
7.3%
Bremerton-Silverdale 5.5%
Bellingham
5.8%
Mt. Vernon-Anacortes
6.6%
Wenatchee 5.6%
Statewide rate: 5.5%
Source: WA State Employment Security Dept.

March 10, 2016 Washington State Economic and Revenue Forecast Council
Major Industries by Employment
0%
2%
4%
6%
8%
10%
12%
14%
16%
18%
20%
Dec. 2015 Employment Shares by Industry
WA U.S.
Source: U.S. Dept. of Labor, BLS
March 10, 2016 Washington State Economic and Revenue Forecast Council
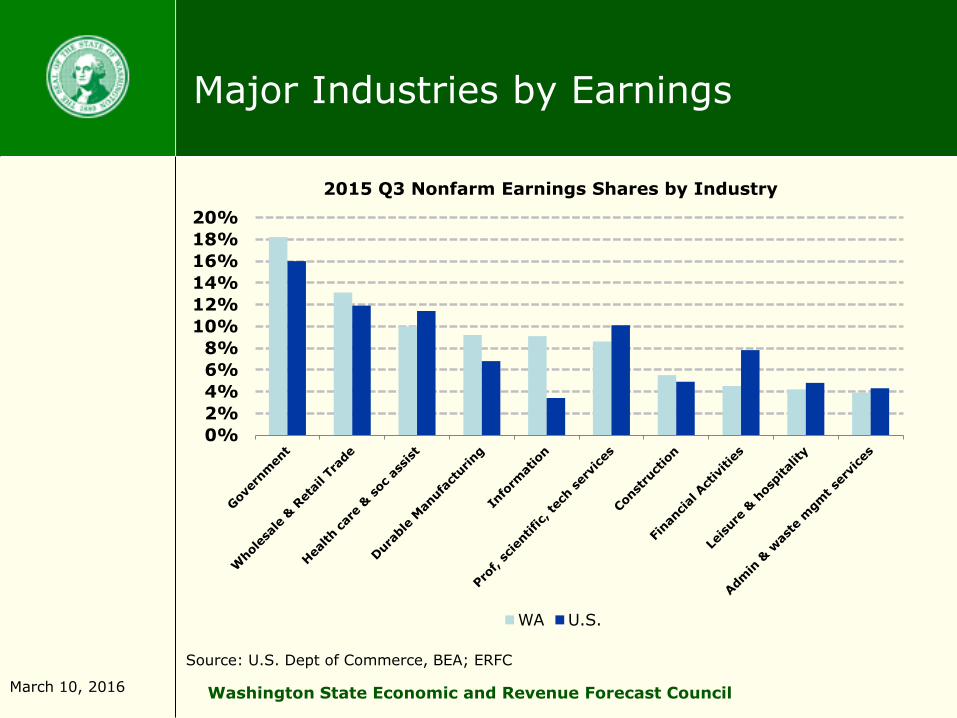
Major Industries by Earnings
0%
2%
4%
6%
8%
10%
12%
14%
16%
18%
20%
2015 Q3 Nonfarm Earnings Shares by Industry
WA U.S.
Source: U.S. Dept of Commerce, BEA; ERFC

March 10, 2016 Washington State Economic and Revenue Forecast Council
Washington Employment Trends
0 10 20 30 40 50 60
All Other
Aerospace Manufacturing
Information
Wholesale Trade
Financial Activities
State, Local Govt Educ
Manuf ex Aerospace
Health Care
Admin & Support Services
Prof, Scientific, Tech Services
Construction
Leisure & Hospitality
Retail Trade
Employment Change since Trough (thousands) Washington has gained 378,000 nonfarm jobs since February 2010
Source: U.S. Dept. of Labor, BLS; ESD; ERFC; data through Jan. 2016

March 10, 2016 Washington State Economic and Revenue Forecast Council
Economic news continues to suggest risks to forecast
Upside:
– Declining unemployment rates
– Rising wage growth
– Stronger housing starts and home sales (new and existing)
– Lower oil prices
Downside:
– Slower U.S. GDP growth
– Slowing global economy
– Negative impact of stronger dollar on exports
– Stock market volatility

March 10, 2016 Washington State Economic and Revenue Forecast Council
U.S., WA unemployment rates trending down
2
3
4
5
6
7
8
9
10
11
2000 2001 2003 2004 2006 2007 2009 2010 2012 2013 2015
Percen
t
U.S. WA
Source: Bureau of Labor Statistics; U.S. data through Jan. 2016; WA data through Dec. 2015

March 10, 2016 Washington State Economic and Revenue Forecast Council
Number of long-term unemployed workers remains above pre-recession levels
0
1,000
2,000
3,000
4,000
5,000
6,000
7,000
8,000
1990 1994 1998 2002 2006 2010 2014
Th
ou
san
ds
Workers Unemployed 27+ Weeks Long-term unemployed as share of all unemployed: Apr. 2010: 45% Feb. 2016: 28%
Source: Bureau of Labor Statistics; data through February 2016
March 10, 2016 Washington State Economic and Revenue Forecast Council
0
2
4
6
8
10
12
0
50
100
150
200
250
300
350
400
2010 2011 2012 2013 2014 2015 2016
YTD
Th
ou
san
ds
Th
ou
san
ds
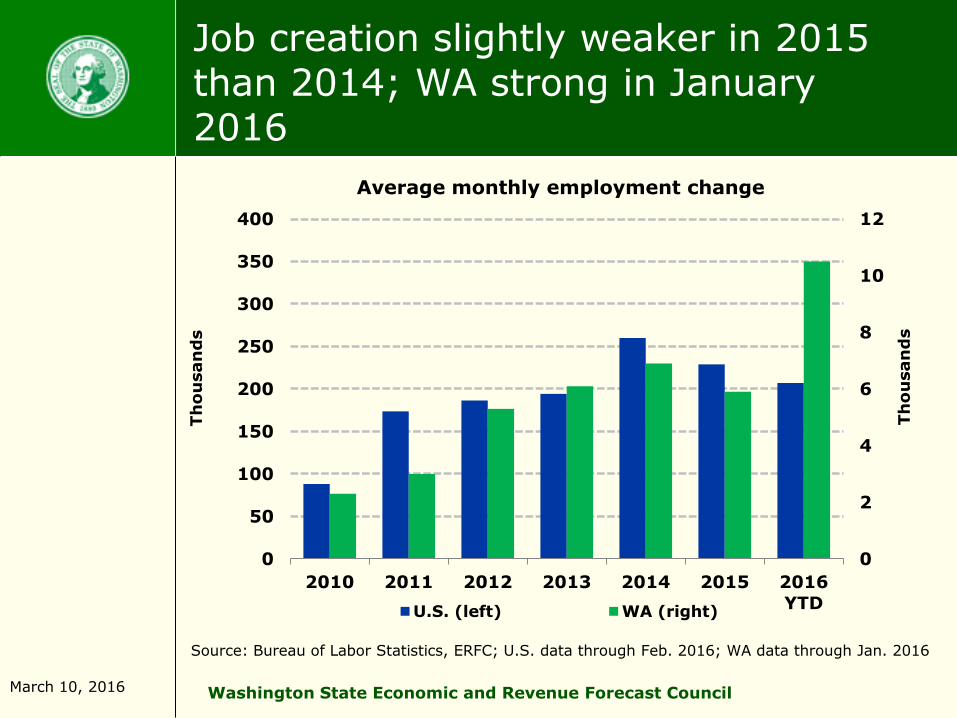
Average monthly employment change
U.S. (left) WA (right)
Job creation slightly weaker in 2015 than 2014; WA strong in January 2016
Source: Bureau of Labor Statistics, ERFC; U.S. data through Feb. 2016; WA data through Jan. 2016

March 10, 2016 Washington State Economic and Revenue Forecast Council
Average U.S. wage growth has turned positive but slowed in January
-3.0
-2.0
-1.0
0.0
1.0
2.0
3.0
4.0
5.0
6.0
2007 2008 2009 2010 2011 2012 2013 2014 2015
Year-over-year Growth in U.S. Real Hourly Wages
Source: U.S. Bureau of Labor Statistics, data through Jan. 2016

March 10, 2016 Washington State Economic and Revenue Forecast Council
Both U.S. and WA housing permits trending up since 2011
0
10
20
30
40
50
60
70
0
500
1,000
1,500
2,000
2,500
3,000
3,500
1990 1993 1996 1999 2002 2005 2008 2011 2014
Th
ou
san
ds
Housing permits, (SAAR)
U.S. (left scale) WA (right scale)
Source: U.S. Census Bureau, data through 2015 Q4
March 10, 2016 Washington State Economic and Revenue Forecast Council
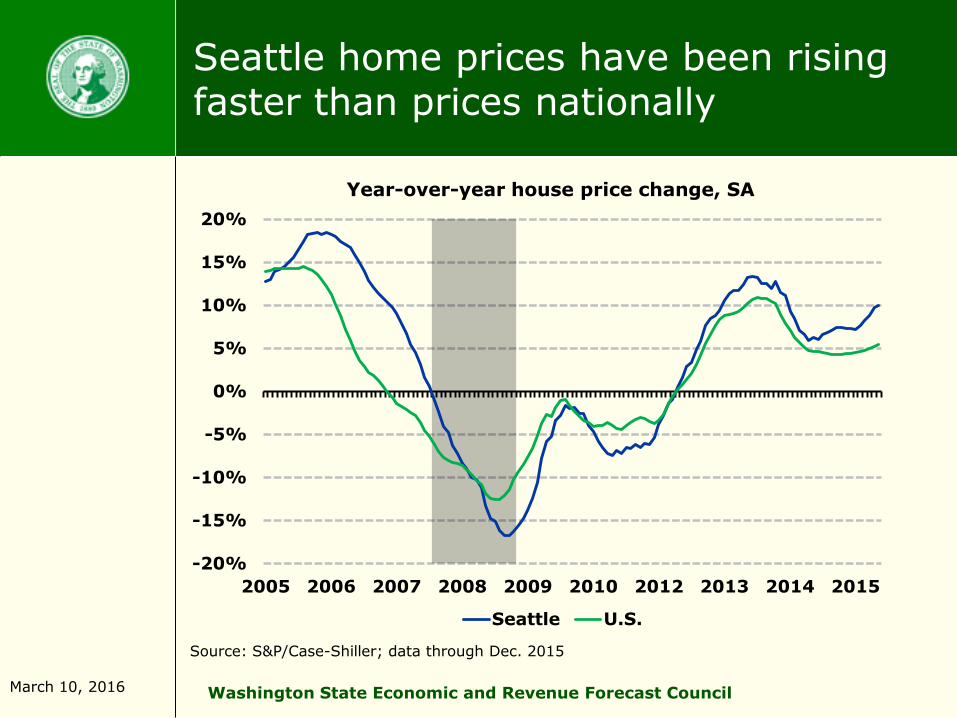
Seattle home prices have been rising faster than prices nationally
-20%
-15%
-10%
-5%
0%
5%
10%
15%
20%
2005 2006 2007 2008 2009 2010 2012 2013 2014 2015
Year-over-year house price change, SA
Seattle U.S.
Source: S&P/Case-Shiller; data through Dec. 2015

March 10, 2016 Washington State Economic and Revenue Forecast Council
Nonresidential construction activity appears to be slowing
0
10,000
20,000
30,000
40,000
50,000
60,000
70,000
2000 2001 2003 2005 2006 2008 2010 2011 2013 2015
Th
ou
san
ds
Square feet under contract, WA nonresidential projects (SAAR)
Source: Dodge Data & Analytics; data through Jan. 2016

March 10, 2016 Washington State Economic and Revenue Forecast Council
U.S. economic growth weakened in the third and fourth quarters
-2.0
-1.0
0.0
1.0
2.0
3.0
4.0
5.0
2013Q1 2013Q3 2014Q1 2014Q3 2015Q1 2015Q3
Percen
t U.S. Real GDP Growth
History Average, 1990-2015Q4
Source: U.S. Dept. of Commerce, BEA, data through 2015Q4

March 10, 2016 Washington State Economic and Revenue Forecast Council
Global GDP forecasts have been consistently revised down
2.5
3
3.5
4
4.5
5
5.5
2010 2013 2016 2019
IMF real annual global GDP growth forecast (%)
Source: International Monetary Fund, World Economic Outlook; historic data through 2015
Oct. 2011 forecast
Jan. 2016 forecast
Actual growth

March 10, 2016 Washington State Economic and Revenue Forecast Council
The dollar has increased in value relative to currencies of U.S. trading partners
80
85
90
95
100
105
2010 2011 2012 2013 2014 2015 2016
Trade-weighted Dollar
Source: Federal Reserve; data through February 2016

March 10, 2016 Washington State Economic and Revenue Forecast Council
WA exports in 2015 declined for the first time since 2009
-25
-20
-15
-10
-5
0
5
10
15
20
25
China Canada Japan All other
Y-O
-Y p
ercen
t ch
an
ge
Year-over-year growth in export value
2013 2014 2015
Source: WISERTrade; data through December 2015

March 10, 2016 Washington State Economic and Revenue Forecast Council
Manufacturing: slowing nationally, improving in Washington
25
30
35
40
45
50
55
60
65
70
75
2007 2008 2009 2010 2011 2012 2013 2014 2015 2016
In
dex,
50
+ =
gro
wth
Institute of Supply Management Index
Washington United States
Source: ISM; data through Feb. 2016
March 10, 2016 Washington State Economic and Revenue Forecast Council
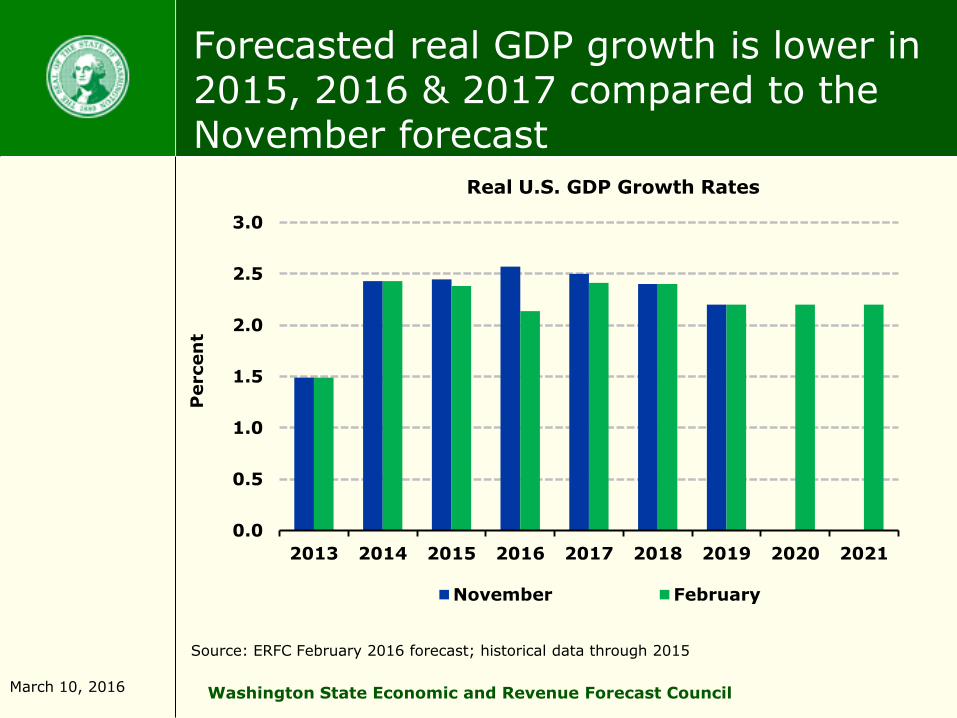
Forecasted real GDP growth is lower in 2015, 2016 & 2017 compared to the November forecast
0.0
0.5
1.0
1.5
2.0
2.5
3.0
2013 2014 2015 2016 2017 2018 2019 2020 2021
Percen
t Real U.S. GDP Growth Rates
November February
Source: ERFC February 2016 forecast; historical data through 2015

March 10, 2016 Washington State Economic and Revenue Forecast Council
Oil prices have fallen since the November forecast
20
30
40
50
60
70
80
90
100
110
120
2007 2009 2011 2013 2015 2017 2019
Do
llars P
er B
arrel
Average Price of Crude Oil
February November
Source: DOE, ERFC February 2016 forecast; historical data through 2015Q4
Forecast
March 10, 2016 Washington State Economic and Revenue Forecast Council
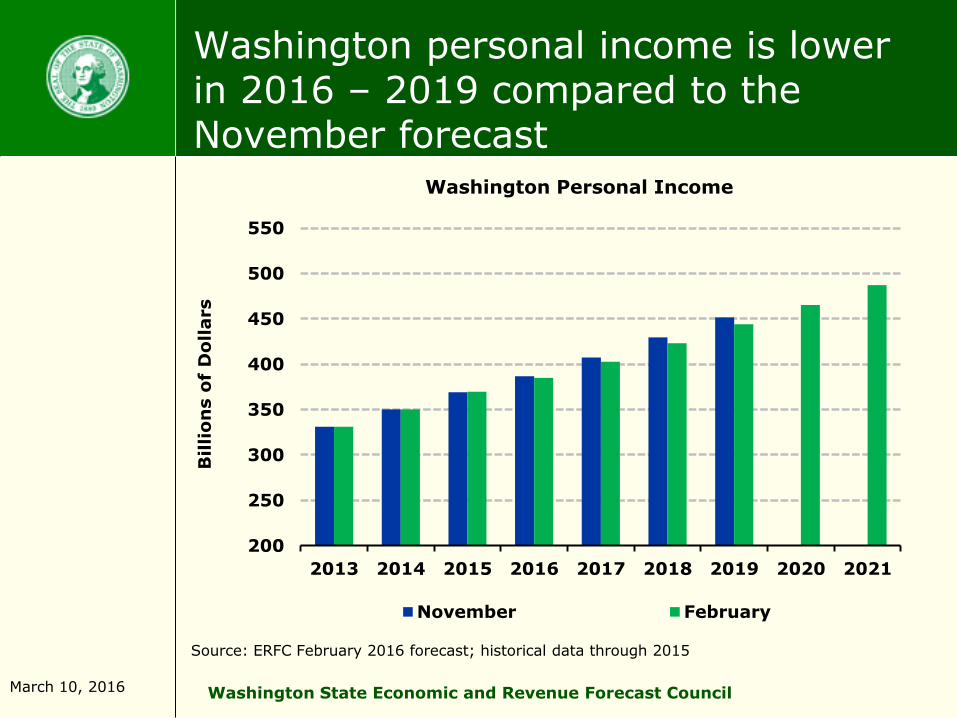
Washington personal income is lower in 2016 – 2019 compared to the November forecast
200
250
300
350
400
450
500
550
2013 2014 2015 2016 2017 2018 2019 2020 2021
Billio
ns o
f D
ollars Washington Personal Income
November February
Source: ERFC February 2016 forecast; historical data through 2015
March 10, 2016 Washington State Economic and Revenue Forecast Council
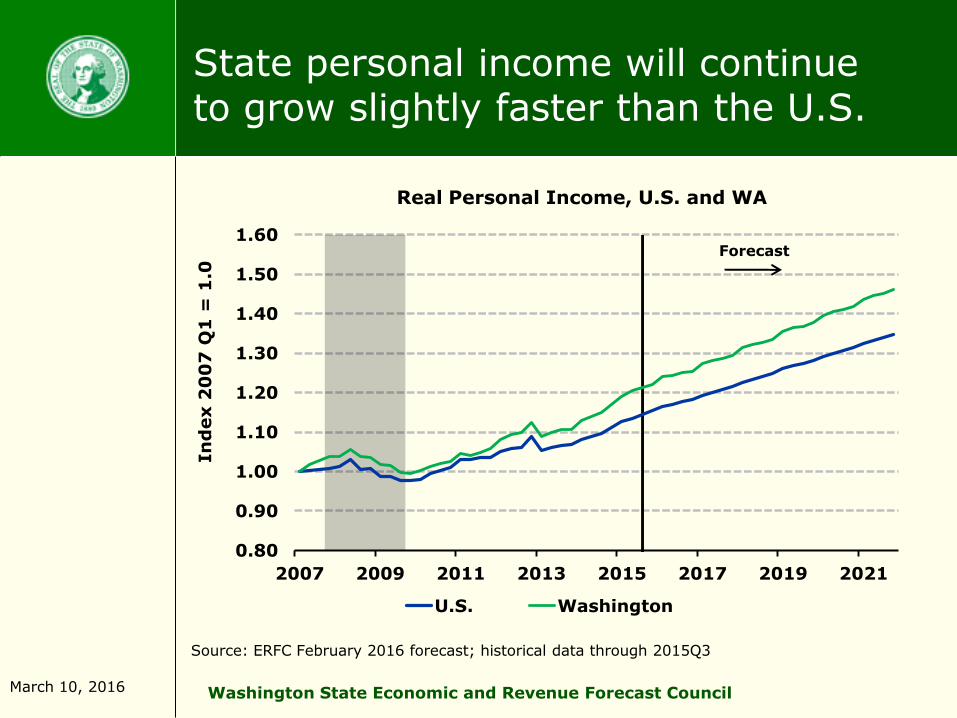
State personal income will continue to grow slightly faster than the U.S.
0.80
0.90
1.00
1.10
1.20
1.30
1.40
1.50
1.60
2007 2009 2011 2013 2015 2017 2019 2021
In
dex 2
00
7 Q
1 =
1.0
Real Personal Income, U.S. and WA
U.S. Washington
Source: ERFC February 2016 forecast; historical data through 2015Q3
Forecast

March 10, 2016 Washington State Economic and Revenue Forecast Council
Washington employment forecast revised down slightly in 2017 - 2019
2,700
2,800
2,900
3,000
3,100
3,200
3,300
3,400
3,500
2013 2014 2015 2016 2017 2018 2019 2020 2021
Th
ou
san
ds
Washington Nonfarm Payroll Employment
February November
Source: ERFC February 2016 forecast; historical data through 2015

March 10, 2016 Washington State Economic and Revenue Forecast Council
Seattle area employment continues to outpace the rest of the state
94
96
98
100
102
104
106
108
110
112
114
2007 2008 2009 2010 2011 2012 2013 2014 2015
In
dex,
Jan
20
07
= 1
00
Total Nonfarm Employment
Seattle Metro Rest of State
Source: Employment Security Department, ERFC; data through December 2015

March 10, 2016 Washington State Economic and Revenue Forecast Council
Washington employment will continue to grow slightly faster than the U.S.
0.90
0.95
1.00
1.05
1.10
1.15
1.20
2007 2009 2011 2013 2015 2017 2019 2021
In
dex 2
00
7 Q
1 =
1.0
0
Nonfarm Employment, U.S. and WA
U.S. Washington
Forecast
Source: ERFC February 2016 forecast; historical data through 2015Q4

March 10, 2016 Washington State Economic and Revenue Forecast Council
Washington housing permits forecast is slightly lower than in November
20
25
30
35
40
45
50
2013 2014 2015 2016 2017 2018 2019 2020 2021
Th
ou
san
ds
Washington Housing Permits
February November
Source: ERFC February 2016 forecast; historical data through 2014

March 10, 2016 Washington State Economic and Revenue Forecast Council
U.S. Economic Expansions since 1945
120
12
58
150
0 25 50 75 100 125 150 175
Economic Expansions, months
This Forecast Average 1980 1990
Sources: NBER, ERFC February 2016 Preliminary forecast

March 10, 2016 Washington State Economic and Revenue Forecast Council
Wall Street Journal survey shows low but rising probability of recession
0%
20%
40%
60%
80%
100%
Probability of recession in next 12 months
Source: Wall Street Journal Economic Forecasting Survey
Feb. 2012 WSJ survey places probability at 21%
27%

March 10, 2016 Washington State Economic and Revenue Forecast Council
Initial slow recovery points to extended expansion
0
20
40
60
80
100
120
Months of Recovery After Reaching Previous Peak in
Employment
Actual Forecast
Sources: NBER, ERFC February 2016 forecast

March 10, 2016 Washington State Economic and Revenue Forecast Council
Retail sales taxes account for over 47% of collections
47%
20%
12%
4%
17%
FY 2015 collections
Retail sales
B&O
State property tax
Real estate excise tax
All other
Source: Dept. of Revenue, ERFC

March 10, 2016 Washington State Economic and Revenue Forecast Council
Large commercial property sales have had major impact on REET collections
-
5
10
15
20
25
1990 1993 1996 1999 2002 2005 2008 2011 2014
$ B
illio
ns
Taxable real estate sales, SA
WA total Excl. Comm'l. Sales >$10M
Source: ERFC, data through 2015 Q4
Residential taxable activity and smaller commercial sales grew rapidly for the first 3 quarters of 2015 but declined in the 4th quarter. Large commercial property sales are expected to decrease from the elevated levels of the past few years.

March 10, 2016 Washington State Economic and Revenue Forecast Council
Oregon legalization may have affected Clark County but statewide sales continued to grow
0
50
100
150
200
250
300
350
400
450
0.0
0.5
1.0
1.5
2.0
2.5
3.0
3.5
4.0
4.5
Jul-14 Oct-14 Jan-15 Apr-15 Jul-15 Oct-15 Jan-16
Th
ou
san
ds
Mil
lio
ns
Grams of Usable Cannabis
Washington (left) Clark County (right)
Source: WA LCB; data through January 2016
Prior to legal retail sales in Oregon, Clark County accounted for 12% of total sales by quantity. In January, Clark County accounted for 7% of total sales by quantity.
Top Related