


Languages
Pages
Legal


CAIT-UTC-018
Warehouse Location and Freight Attraction in the Greater
El Paso Region
FINAL REPORT
December 2013
Submitted by:
Ruey Long Cheu
Associate Professor
Salvador Hernandez
Assistant Professor
Jessica Miramontes
Undergraduate Research Assistant
Yvonne Colmenero
Undergraduate Research Assistant
Esmaeil Balal
PhD Research Associate
Center for Transportation Infrastructure Systems
The University of Texas at El Paso
500 W University Ave, El Paso, TX 79968-0516
Submitted to:
External Project Manager
Michael Medina
In cooperation with
Rutgers, The State University of New Jersey
And
El Paso Metropolitan Planning Organization
And
U.S. Department of Transportation
Federal Highway Administration
Disclaimer Statement
The contents of this report reflect the views of the authors,
who are responsible for the facts and the accuracy of the
information presented herein. This document is disseminated
under the sponsorship of the Department of Transportation,
University Transportation Centers Program, in the interest of
information exchange. The U.S. Government assumes no liability for the contents or use thereof.
The Center for Advanced Infrastructure and Transportation (CAIT) is a Tier I UTC Consortium led by
Rutgers, The State University. Members of the consortium are the University of Delaware, Utah State
University, Columbia University, New Jersey Institute of Technology, Princeton University, University of
Texas at El Paso, University of Virginia and Virginia Polytechnic Institute. The Center is funded by the U.S.
Department of Transportation.
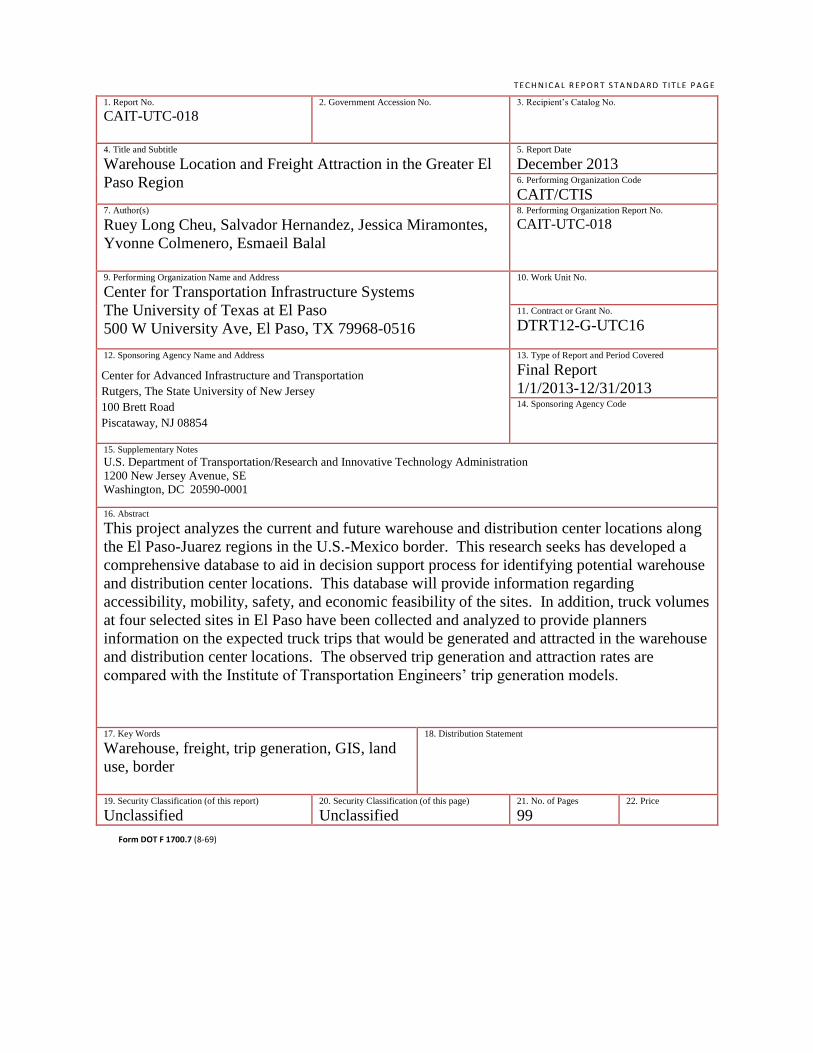
1. Report No.
CAIT-UTC-018
2. Government Accession No. 3. Recipient’s Catalog No.
4. Title and Subtitle
Warehouse Location and Freight Attraction in the Greater El
Paso Region
5. Report Date
December 2013 6. Performing Organization Code
CAIT/CTIS 7. Author(s)
Ruey Long Cheu, Salvador Hernandez, Jessica Miramontes,
Yvonne Colmenero, Esmaeil Balal
8. Performing Organization Report No.
CAIT-UTC-018
9. Performing Organization Name and Address
Center for Transportation Infrastructure Systems
The University of Texas at El Paso
500 W University Ave, El Paso, TX 79968-0516
10. Work Unit No.
11. Contract or Grant No.
DTRT12-G-UTC16
12. Sponsoring Agency Name and Address 13. Type of Report and Period Covered
Final Report
1/1/2013-12/31/2013
14. Sponsoring Agency Code
15. Supplementary Notes
U.S. Department of Transportation/Research and Innovative Technology Administration
1200 New Jersey Avenue, SE
Washington, DC 20590-0001
16. Abstract
This project analyzes the current and future warehouse and distribution center locations along
the El Paso-Juarez regions in the U.S.-Mexico border. This research seeks has developed a
comprehensive database to aid in decision support process for identifying potential warehouse
and distribution center locations. This database will provide information regarding
accessibility, mobility, safety, and economic feasibility of the sites. In addition, truck volumes
at four selected sites in El Paso have been collected and analyzed to provide planners
information on the expected truck trips that would be generated and attracted in the warehouse
and distribution center locations. The observed trip generation and attraction rates are
compared with the Institute of Transportation Engineers’ trip generation models.
17. Key Words
Warehouse, freight, trip generation, GIS, land
use, border
18. Distribution Statement
19. Security Classification (of this report)
Unclassified 20. Security Classification (of this page)
Unclassified 21. No. of Pages
99 22. Price
Center for Advanced Infrastructure and Transportation
Rutgers, The State University of New Jersey
100 Brett Road
Piscataway, NJ 08854
Form DOT F 1700.7 (8-69)
T E C H NI C A L R E P OR T S T A NDA RD TI TLE P A G E

i
Acknowledgments
The authors would like to acknowledge the invaluable insights and guidance of public and private
entities that collaborated in this project. Thanks to Dr. Salvador Gonzalez and Efren Meza from
El Paso Metropolitan Planning Organization for their assistance in developing this project idea.
Special thanks for the meaningful information that Denisse Rodarte, CNU-A, Program
Administrator at the City of El Paso provided. The authors are grateful for the data and help
provided by the UTEP Geospatial Information Service Center. The participations from Alma
DeAnda from the Land Administration Department at El Paso Water Utilities, Manual Ochoa,
Carey Westin and Bob Cook from Borderplex Alliance are greatly appreciated. The authors
sincerely appreciate the collaboration of Mr. David Reyes-Arteaga, Operations Manager at Kuehne
and Nagel El Paso Office. Finally, the authors would like to recognize the significant inputs that
Miguel A. Miramontes in representation of TCC Soft Inteligente.
ii
Abstract
This report describes the recent information regarding freight activities and centers of freight
distribution in the El Paso-Juarez border region. Data collection was obtained from public and
private entities. Using Geographic Information System (GIS), maps were created to illustrate
current status of land use, facility location, traffic data and crash occurrence. Economic market
for industrial activity and processes involving freight logistics in this border region are also
described in this report. Through interviewing stakeholders, it was possible to describe the current
and project the future development of industrial activities, which are closely related to freight
generation and attraction. Truck volume surveys have been performed for four sites in El Paso
that have predominantly freight activities. The freight generation and attraction rates were
compiled, analyzed and compared with the models provided in the Institute of Transportation
Engineers’ Trip Generation Handbook. This research has compiled a comprehensive pool of
information that can help a decision support process that seeks to account for accessibility,
mobility and safety of freight transportation in the El Paso-Juarez border region.
iii
Table of Contents
Acknowledgments .......................................................................................................................................... i
Abstract ......................................................................................................................................................... ii
List of Figures .............................................................................................................................................. iv
List of Tables ............................................................................................................................................... vi
1 Introduction ............................................................................................................................................... 1
1.1 Motivation .......................................................................................................................................... 1
1.2 Objectives .......................................................................................................................................... 1
1.3 Relevance to USDOT Strategic Goals ............................................................................................... 1
2 Literature Review ...................................................................................................................................... 2
2.1 Freight Activity Planning ................................................................................................................... 2
2.1.1 Land Use ..................................................................................................................................... 2
2.1.2 Conflicts Related to Freight Activity .......................................................................................... 5
2.2 Data Source for Freight Activity ........................................................................................................ 6
2.2.1 Neighborhood Freight Data ........................................................................................................ 7
2.3 Freight Data Protocols ..................................................................................................................... 10
2.4 Freight Activity in US-Mexico Border ............................................................................................ 11
3 Stakeholder Interviews ............................................................................................................................ 17
3.1 El Paso ............................................................................................................................................. 17
3.1.1 Kuehne and Nagel ..................................................................................................................... 17
3.1.2 Borderplex Alliance .................................................................................................................. 19
3.1.3 Future Growth for Warehouse and Distribution Center ............................................................ 20
3.2 Ciudad Juarez ................................................................................................................................... 21
3.2.1 Borderplex Alliance .................................................................................................................. 21
3.2.2 TCC Soft Inteligente ................................................................................................................. 21
4 Freight Industry Outlook and Survey ...................................................................................................... 24
4.1 El Paso ............................................................................................................................................. 24
4.1.1 Regional Border Complex ........................................................................................................ 24
4.1.2 El Paso Industrial Market .......................................................................................................... 25
4.2 Ciudad Juarez .................................................................................................................................... 28
4.2.1 Ciudad Juarez Industrial Market ............................................................................................... 28
4.2.2 Northbound Truck Crossings .................................................................................................... 30
4.2.3 Freight Transportation Challenges ............................................................................................ 31

iv
4.2.4 Broker and Maquiladora Survey ............................................................................................... 32
5 Data Collection and Analysis .................................................................................................................. 39
5.1 El Paso ............................................................................................................................................. 39
5.1.1 Land Development .................................................................................................................... 39
5.1.2 Industrial Zoning ....................................................................................................................... 40
5.1.3 Trucking and Warehousing Facilities ....................................................................................... 44
5.1.4 Vehicle Classification Count .................................................................................................... 48
5.1.5 Crashes Involving Commercial Vehicles .................................................................................. 52
5.1.6 Available Land .......................................................................................................................... 54
5.2 Ciudad Juarez ................................................................................................................................... 56
5.2.1 Industrial Parks ......................................................................................................................... 56
5.2.2 Available Land .......................................................................................................................... 60
5.3 Truck Origin-Destination in the El Paso-Juarez Region .................................................................. 62
6 Trip Generation Analysis ........................................................................................................................ 64
6.1 Data Collection Sites ........................................................................................................................ 64
6.2 Data Collection Process ................................................................................................................... 69
6.3 Trip Generation Modeling ............................................................................................................... 72
6.3.1 Land Use Attributes .................................................................................................................. 72
6.3.2 Trip Generation Rates ............................................................................................................... 77
6.3.3 Comparison with ITE Trip Generation Models ........................................................................ 82
6.4 Summary .......................................................................................................................................... 87
7 Conclusions ............................................................................................................................................. 88
References ................................................................................................................................................... 89
List of Figures
Figure 2.1 Land use authority in the United States ...................................................................................... 3
Figure 2.2 Typical local government land use system ................................................................................. 4
Figure 2.3 State enabling acts often do not account for freight ................................................................... 5
Figure 2.4 Land uses and conflicts adjacent to freight activity .................................................................... 6
Figure 2.5 How to address freight data to neighborhood issues .................................................................. 7
Figure 2.6 Freight data issues affecting neighborhoods............................................................................... 8
Figure 2.7 Freight node data-tonnage production by facility ....................................................................... 8
Figure 2.8 Integrating node data for travel demand modeling and other planning issues ........................... 9

v
Figure 2.9 Freight network data ................................................................................................................. 10
Figure 2.10 Integrating data sources for customizing freight flow data .................................................... 11
Figure 2.11 Northbound border crossing process for trucks ...................................................................... 12
Figure 3.1 Order sample (Pedimento) ........................................................................................................ 18
Figure 3.2 Process for imports at Kuehne and Nagel................................................................................. 19
Figure 3.3 FastGIS interactive map ........................................................................................................... 20
Figure 4.1 El Paso regional border crossings ............................................................................................. 25
Figure 4.2 Unemployment rates for El Paso .............................................................................................. 26
Figure 4.3 Annual average asking rates for El Paso .................................................................................. 27
Figure 4.4 Construction in square feet in El Paso ...................................................................................... 27
Figure 4.5 Maquiladora employment in Ciudad Juarez ............................................................................. 29
Figure 4.6 Annual average asking rates per square foot in Ciudad Juarez ................................................ 29
Figure 4.7 Construction per square feet in Ciudad Juarez ......................................................................... 30
Figure 4.8 Monthly northbound truck crossings ........................................................................................ 31
Figure 5.1 Parcels and industrial zones ...................................................................................................... 40
Figure 5.2 Industrial and manufacturing districts ...................................................................................... 42
Figure 5.3 Area for industrial and manufacturing zones ............................................................................ 43
Figure 5.4 Number of facilities per manufacturing zone ........................................................................... 44
Figure 5.5 Warehousing and trucking GIS map ........................................................................................ 46
Figure 5.6 Warehousing facilities size (square feet) .................................................................................. 47
Figure 5.7 Trucking facilities size (square feet)......................................................................................... 48
Figure 5.8 TxDOT’s vehicle counting stations in El Paso ......................................................................... 49
Figure 5.9 Ciudad Juarez maquiladora industry locations ......................................................................... 58
Figure 5.10 Number of employees in maquiladoras .................................................................................. 60

vi
List of Tables
Table 2.1 Principal Stakeholders in the Mexico-US Border Crossing Process ......................................... 12
Table 2.2 Coordination and Related Issues ................................................................................................ 15
Table 2.3 Port of Entry Coordination Problems ........................................................................................ 16
Table 4.1 Market statistics for El Paso in 2013 ......................................................................................... 26
Table 4.2 Market Statistics for Ciudad Juarez ........................................................................................... 28
Table 4.3 Northbound Truck Crossings in 2012 ........................................................................................ 30
Table 5.1 Industrial Zoning Districts ......................................................................................................... 41
Table 5.2 Trucking Companies .................................................................................................................. 49
Table 5.3 Warehousing Facilities ............................................................................................................... 49
Table 5.4 Summary of truck traffic count provided by TxDOT ................................................................ 55
Table 5.5 Available Properties for Sale in El Paso .................................................................................... 59
Table 5.6 Available Properties for Lease in El Paso .................................................................................. 59
Table 5.7 Industrial Park Size .................................................................................................................... 59
Table 5.8 Available Properties for Sale in Ciudad Juarez .......................................................................... 60
Table 5.9 Available Properties for Lease in Ciudad Juarez ....................................................................... 61
Table 6.1 Data Collection Dates and Times .............................................................................................. 74
Table 6.2 Summary of Truck Volume in the Morning Period ................................................................... 75
Table 6.3 Summary of Truck Volume in the Afternoon Period ................................................................ 75
Table 6.4 Land Area and Building Area .................................................................................................... 76
Table 6.5 ITE Trip Generation Models Used ............................................................................................ 87
Table 6.6 Root-Mean-Square Errors in Model Evaluation ........................................................................ 89

1
1 Introduction
1.1 Motivation
As the national economy continues to recover, the volume of freight shipments present on the
nation’s highway system will also experience slow but consistent growth. This is also true for bi-
national freight flows. Thus, from a planning perspective, identifying the points of origin and
points of destination of current and future freight flows can provide planners with valuable data to
update current demand forecasting models along the border regions. Of special interest are the
warehouse and distribution centers that attract these freight flows—this is because the location of
these facilities can greatly influence the surrounding traffic behavior and truck routes. Currently,
warehouses and distribution centers that surround border towns (such as the Greater El Paso
region) tend to be located close to airports and/or off transportation facilities (interstates, state
highways) that are in the general proximity of the international ports of entry. However, these
locations may not always be optimal, for example, in terms of capacity utilization, operational
efficiency (for both the facilities and the transportation companies), competition, and safety.
Hence, this study seeks to collect information on current and future warehouse and distribution
center locations along border regions, understand the factors that influence the choice of their
locations, and also analyze truck trip generation and attraction rates.
1.2 Objectives
The objectives of this project are to analyze current and future warehouse and distribution center
locations along the El Paso-Juarez border region that can provide greater accessibility and mobility
for increasing bi-national freight flows and that are economically feasible. To accomplish these
objectives we propose the following set of work aims:
• Identify current and planned locations of warehouse and distribution centers.
• Identify potential locations that meet the criteria of warehouse and distribution center and that
promote increased accessibility, mobility and safety.
• Assess the monetary feasibility (costs) of the potential location.
This research seeks to develop a comprehensive database to aid in decision support process for
identifying potential warehouse and distribution center locations. This database will provide
information regarding accessibility, mobility, safety, and economic feasibility of the sites. To
accomplish this, data will first be gathered from various sources—for example, through
interviewing stakeholders via a stated preference survey, ArcGIS Business Analyst, Texas Crash
Information System (CRIS), land use code data, and traffic data.
In addition, truck volume at four selected sites in El Paso will be collected and analyzed to provide
planners information on the expected truck trips that would be generated and attracted in potential
warehouse and distribution center locations. The observed trip generation and attraction rates will
be compared with the Institute of Transportation Engineers’ trip generation models.
1.3 Relevance to USDOT Strategic Goals
2
This work is directly aligned with the stated goals and research priorities of "Safety" and
"Economic Competitiveness." In addition, this proposal supports the Center for Advanced
Infrastructure for Transportation (CAIT)’s theme of "State of Good Repair." For example, by
identifying current (e.g., to update or improve service quality) and potential warehouse and
distribution center locations that promote increased accessibility, mobility and safety, the
stakeholders will be able to assess the economic feasibility of the sites.
2 Literature Review
This chapter reviews the issues related to freight-land use planning. It also reviews data sources
of freight activities as indicated in the published reports. Towards the end of this chapter, past
studies of freight transportation in the El Paso-Juarez region are also reviewed.
2.1 Freight Activity Planning
2.1.1 Land Use
Land use is one of the most important topics in freight as the latter can cause conflicts among
stakeholders, especially residents, private vehicle and transit users. Land use planning is the first
and most important step in creating effective processes and opportunities to achieve freight-
compatible development, reduce community-freight conflicts, and preserve critical freight
corridors and facilities (Rhodes et al. 2012). The report by Rhodes et al. (2012) gives advice to
stakeholders on how to successfully achieve advanced planning by providing specific tools such
as:
3
• State enabling acts;
• Local comprehensive plans;
• State and regional plans;
• Regional collaboration; and
• Mapping.
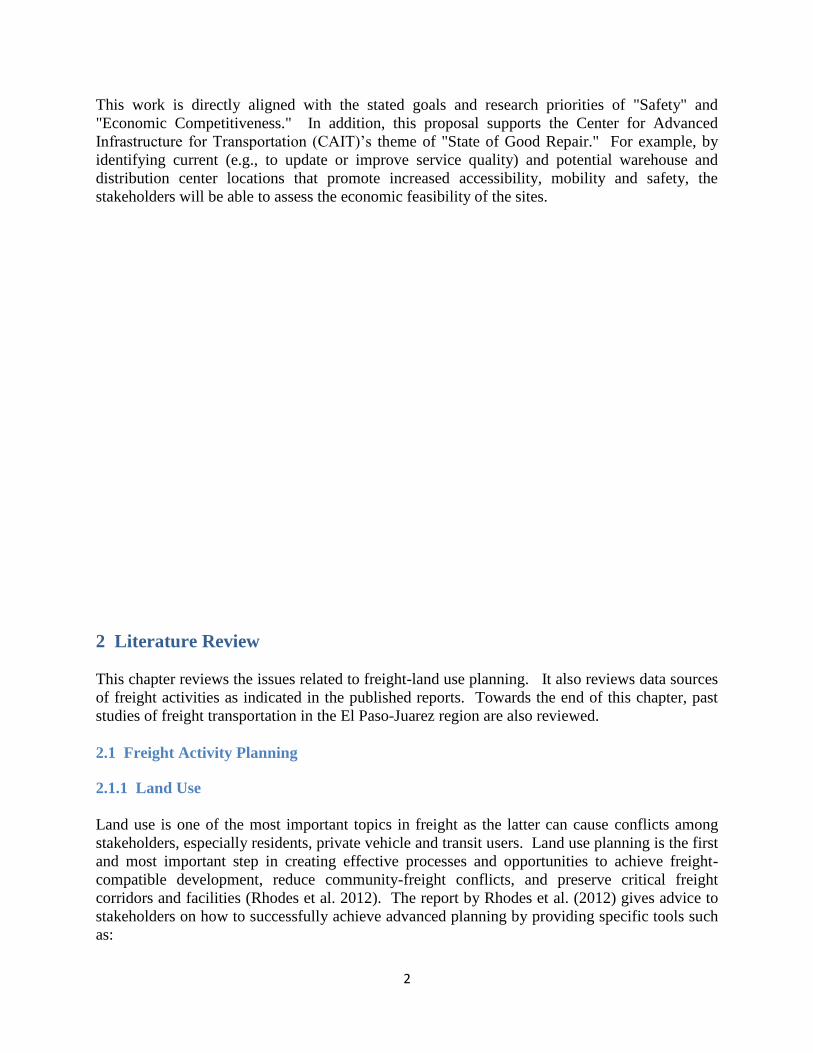
The state does not play a big role in deciding land use. The state is divided into cities and counties
and these local municipals are the ones that make the decisions on land use. Figure 2.1 shows a
schematic of how land use authorities are divided. Figures 2.1 and 2.2 show land use decisions
within local counties and cities. It can be observed from these figures that cities and counties are
in charge of decisions on the land use and zoning.
Source: Rhodes et al. (2012)
Figure 2.1 Land use authority in the United States

4
Source: Rhodes et al. (2012)
Figure 2.2 Typical local government land use system
Figures 2.1 and 2.2 describe how state government is divided regarding land use decision making.
However, the state does not take into account freight within their comprehensive plans and this is
what creates the main problem for freight land owners. As mention in Rhodes et al. (2012) “If the
state enabling laws required or suggested that plans to protect all modes of freight should be
included in a general plan, significant new protections would likely evolve naturally in the land
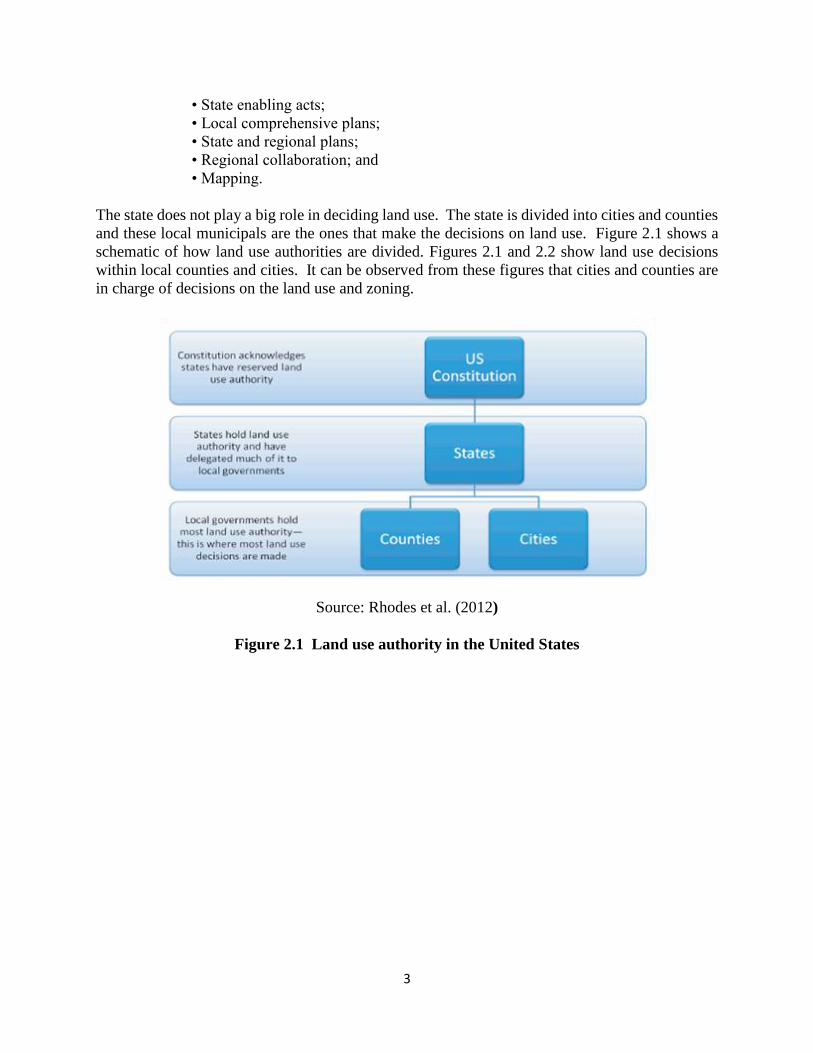
use system nationwide in the next decade or so.” Figure 2.3 shows how state enabling acts do not
take into account freight systems.
5
Source: Rhodes et al. (2012)
Figure 2.3 State enabling acts often do not account for freight
2.1.2 Conflicts Related to Freight Activity
The National Cooperative Freight Research Program (NCFRP) has developed a report (Rhodes et
al. 2012) regarding freight and land use conflict. Residential, medical, and educational areas are
the three land uses that are least compatible with freight due to pollutions created by freight
movements. Air pollution, noise pollution, light pollution and vibration pollution are among the
main conflicts related to these areas. Figure 2.4 displays the main conflicts that arise with respect
to freight activity.

6
Source: Rhodes et al. (2012)
Figure 2.4 Land uses and conflicts adjacent to freight activity
2.2 Data Source for Freight Activity
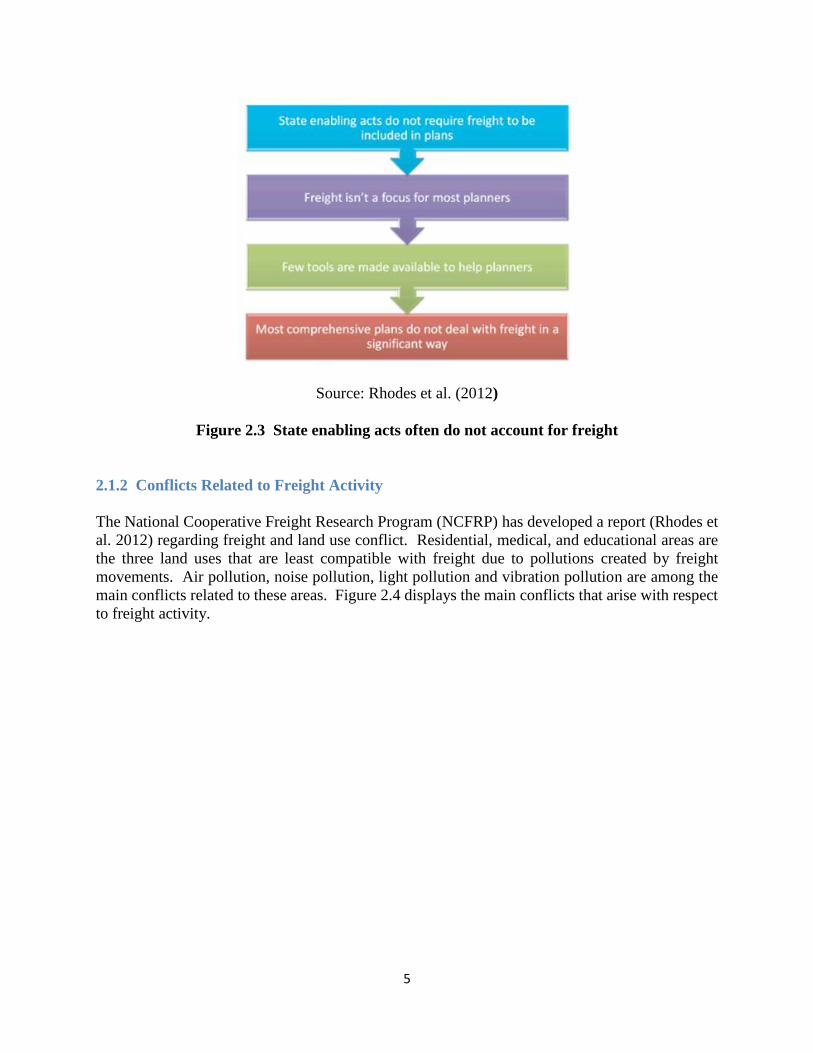
According to Christensen Associates et al. (2012), freight data should always be considered in the
planning process for the equilibrium between (freight and personal) transportation demands and
community objectives, for examples, sustainable land use, economic development, environmental
protection and livable neighborhoods. To provide better freight planning, the report uses primary
and secondary data sources (see Figure 2.5). Primary sources are truck counts or surveys that can
provide details needed for urban planning but they can also require huge effort in data collection.
Secondary freight data collected from public and private sources do not capture detail information
that can directly be used for urban freight planning. In this report, freight activity data are collected
from both primary and secondary sources.
7
Source: Christensen Associates et al. (2012)
Figure 2.5 How to address freight data to neighborhood issues
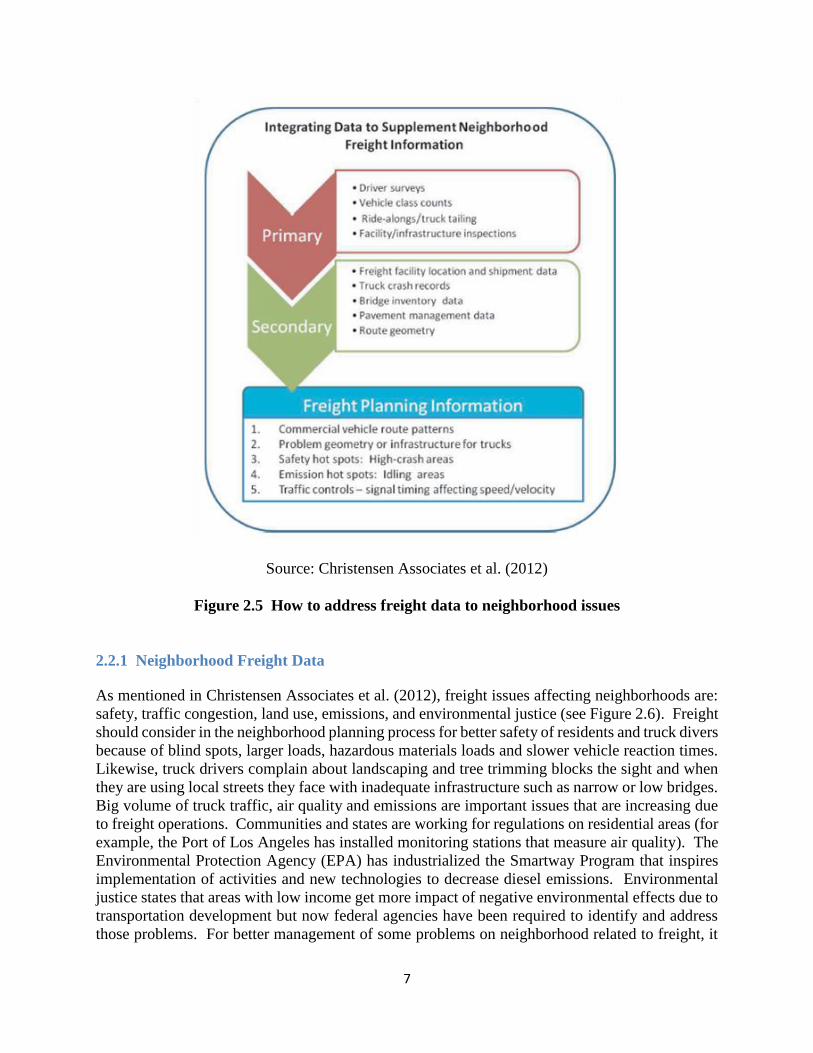
2.2.1 Neighborhood Freight Data
As mentioned in Christensen Associates et al. (2012), freight issues affecting neighborhoods are:
safety, traffic congestion, land use, emissions, and environmental justice (see Figure 2.6). Freight
should consider in the neighborhood planning process for better safety of residents and truck divers
because of blind spots, larger loads, hazardous materials loads and slower vehicle reaction times.
Likewise, truck drivers complain about landscaping and tree trimming blocks the sight and when
they are using local streets they face with inadequate infrastructure such as narrow or low bridges.
Big volume of truck traffic, air quality and emissions are important issues that are increasing due
to freight operations. Communities and states are working for regulations on residential areas (for
example, the Port of Los Angeles has installed monitoring stations that measure air quality). The
Environmental Protection Agency (EPA) has industrialized the Smartway Program that inspires
implementation of activities and new technologies to decrease diesel emissions. Environmental
justice states that areas with low income get more impact of negative environmental effects due to
transportation development but now federal agencies have been required to identify and address
those problems. For better management of some problems on neighborhood related to freight, it

8
is necessary to collect traffic data, land use compliance information, travel demand modeling data,
freight facility location and shipment data and truck crash records (Christensen Associates et al.
2012).
Source: Christensen Associates et al. (2012)
Figure 2.6 Freight data issues affecting neighborhoods
Freight nodes are terminals, rail yards, ports, distribution centers, manufacturing plants, and etc.
Freight nodes characterize the end points that generate or attract freight flows. They are also the
main points of production, consumption or handling of goods. For better understanding of trip
generation, it is necessary to conduct surveys of vehicles generated by freight and also apply
generation rates based on industry employment nodes in a given Traffic Analysis Zone (TAZ).
Source: Christensen Associates et al. (2012)
Figure 2.7 Freight node data-tonnage production by facility

9
Freight node data can be used in travel demand modeling, environmental analysis and land use
planning. It can be useful in designating truck routes (Christensen Associates et al. 2012).
Source: Christensen Associates et al. (2012)
Figure 2.8 Integrating node data for travel demand modeling and other planning issues
As described by Christensen Associates et al. (2012), freight network data helps analysts to know
the routes and critical infrastructure being used by freight. Network data include roads, rail lines,
waterways capacity, port; posted speeds on roads, weight and height limitations on bridges and
pavements (see Figure 2.9). Freight networks (capacities) should be capable of sustaining truck
traffic volumes efficiently. Therefore they should be protected by building permits, proper zoning
and law enforcement. Likewise, freight should be considered when planning road geometry,
pavement structures and bridge design with adequate turning radii, passing points and height
clearance. Global Positioning Systems (GPS) is used by many trucking companies and private
carriers to keep track of driver and equipment movements. Merchants that use GPS-based fleet
management software are collecting the data for examining the network choices that truck drivers
are making. Network data is useful in identifying route usage, current and future level of service,
and potential alternatives that facilitate a faster trip.

10
Source: Christensen Associates et al. (2012)
Figure 2.9 Freight network data
Commodity flow information is used to calculate trip estimates and helps to understand the
economic and trade environment of a region. Commodity flow data also helps to tie goods
movement to economic development, providing information such as imports and exports.
Similarly, it can help to recognize industries that are greatly dependent on transportation, for
example, those that produce high volume of products. According to Christensen Associates et al.
(2012), there are different sources that this data can be obtained. The most often cited sources are
the Commodity Flow Survey conducted by Bureau of Transportation Statistics, Freight Analysis
Framework Version 3 by Federal Highway Administration, and Railroad Waybill by Surface
Transportation Board and TRANSEARCH by HIS Global Insight.
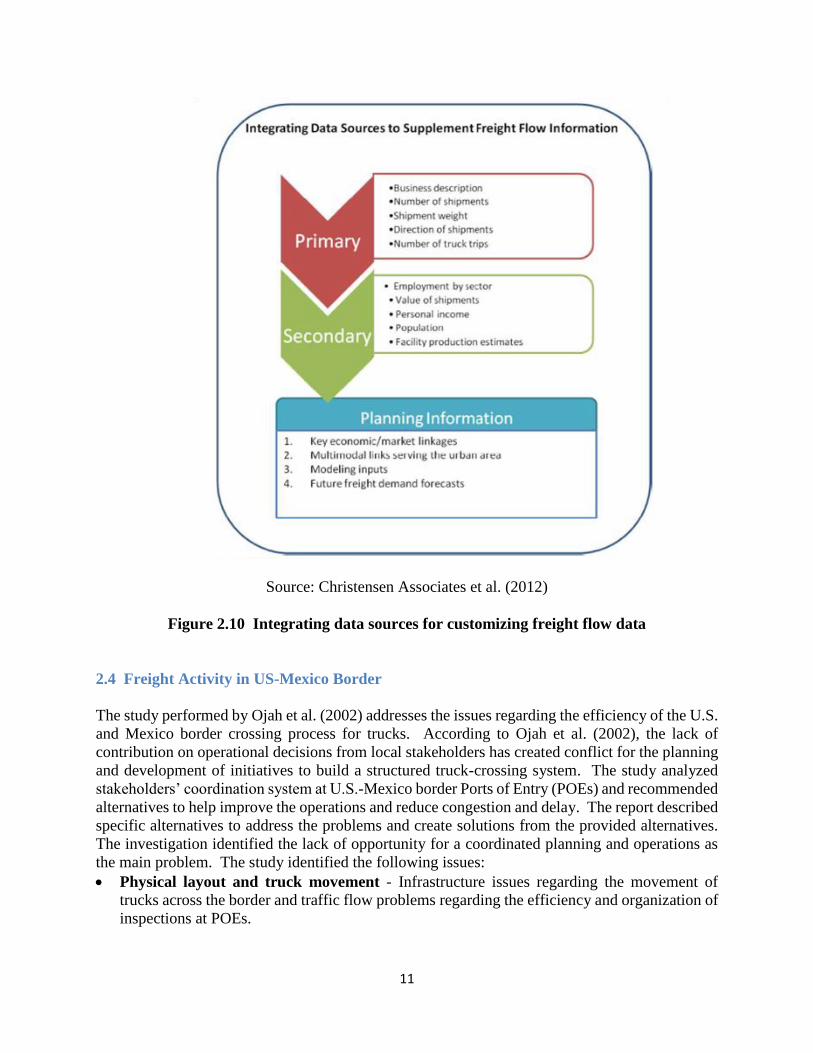
2.3 Freight Data Protocols
Due to the complexity of freight data, some protocols for freight data in planning process are:
identify the data needs and define the issues to be addressed (Christensen Associates et al. 2012).
Business groups, trade associations or economic development agencies may provide freight data,
information/freight volume on nodes (port of entry, terminals, distribution centers, and
manufacturing plants).
11
Source: Christensen Associates et al. (2012)
Figure 2.10 Integrating data sources for customizing freight flow data
2.4 Freight Activity in US-Mexico Border
The study performed by Ojah et al. (2002) addresses the issues regarding the efficiency of the U.S.
and Mexico border crossing process for trucks. According to Ojah et al. (2002), the lack of
contribution on operational decisions from local stakeholders has created conflict for the planning
and development of initiatives to build a structured truck-crossing system. The study analyzed
stakeholders’ coordination system at U.S.-Mexico border Ports of Entry (POEs) and recommended
alternatives to help improve the operations and reduce congestion and delay. The report described
specific alternatives to address the problems and create solutions from the provided alternatives.
The investigation identified the lack of opportunity for a coordinated planning and operations as
the main problem. The study identified the following issues:
Physical layout and truck movement - Infrastructure issues regarding the movement of
trucks across the border and traffic flow problems regarding the efficiency and organization of
inspections at POEs.

12
Demand management – Conflict with traffic congestion at the border area and the lack of
effective methods to manage it.
Standards – Lack of regulations to improve security and reduce delay for trucks.
Information management: Weaknesses in information collection impairs efficient border
coordination.
Stakeholder coordination: Stakeholder schedules and coordination structures.
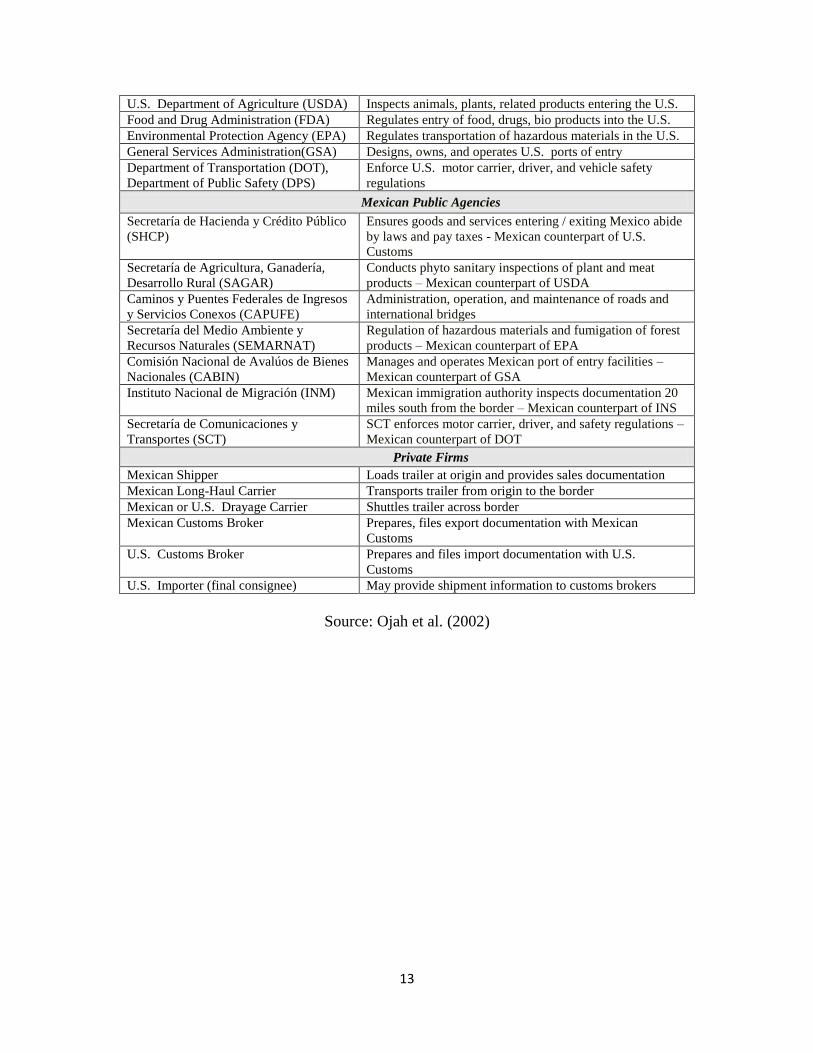
The process of the northbound border crossing is described in Figure 2.11. Table 2.1 discusses
the stakeholder activities. Figure 2.11 and Table 2.1 explain the complexity of the border truck
crossing process.
Source: Ojah et al. (2002)
Figure 2.11 Northbound border crossing process for trucks
Table 2.1 Principal Stakeholders in the Mexico-U.S. Border Crossing Process
Stakeholder Function
U.S. Public Agencies
U.S. Customs Service(USCS) Ensures goods and services entering / exiting the U.S.
abide by laws and pay applicable duties and taxes
Immigration and Naturalization Service
(INS)
Regulates entry of visitors and immigrants into the U.S.
and prevents unlawful employment
13
U.S. Department of Agriculture (USDA) Inspects animals, plants, related products entering the U.S.
Food and Drug Administration (FDA) Regulates entry of food, drugs, bio products into the U.S.
Environmental Protection Agency (EPA) Regulates transportation of hazardous materials in the U.S.
General Services Administration(GSA) Designs, owns, and operates U.S. ports of entry
Department of Transportation (DOT),
Department of Public Safety (DPS)
Enforce U.S. motor carrier, driver, and vehicle safety
regulations
Mexican Public Agencies
Secretaría de Hacienda y Crédito Público
(SHCP)
Ensures goods and services entering / exiting Mexico abide
by laws and pay taxes - Mexican counterpart of U.S.
Customs
Secretaría de Agricultura, Ganadería,
Desarrollo Rural (SAGAR)
Conducts phyto sanitary inspections of plant and meat
products – Mexican counterpart of USDA
Caminos y Puentes Federales de Ingresos
y Servicios Conexos (CAPUFE)
Administration, operation, and maintenance of roads and
international bridges
Secretaría del Medio Ambiente y
Recursos Naturales (SEMARNAT)
Regulation of hazardous materials and fumigation of forest
products – Mexican counterpart of EPA
Comisión Nacional de Avalúos de Bienes
Nacionales (CABIN)
Manages and operates Mexican port of entry facilities –
Mexican counterpart of GSA
Instituto Nacional de Migración (INM) Mexican immigration authority inspects documentation 20
miles south from the border – Mexican counterpart of INS
Secretaría de Comunicaciones y
Transportes (SCT)
SCT enforces motor carrier, driver, and safety regulations –
Mexican counterpart of DOT
Private Firms
Mexican Shipper Loads trailer at origin and provides sales documentation
Mexican Long-Haul Carrier Transports trailer from origin to the border
Mexican or U.S. Drayage Carrier Shuttles trailer across border
Mexican Customs Broker Prepares, files export documentation with Mexican
Customs
U.S. Customs Broker Prepares and files import documentation with U.S.
Customs
U.S. Importer (final consignee) May provide shipment information to customs brokers
Source: Ojah et al. (2002)
14
As mentioned in Ojah et al. (2002), majority of the coordination issues are related to inadequate
interaction among the stakeholders in either the planning or operations phases. For this reason,
Ojah et al. (2002) recommended to focus on the broad range of stakeholders instead of trying to
improve specific coordination issues, since these issues will vary between each POE. Once the
involvement among local stakeholders is improved and the issues can be addressed, the
coordination effectiveness can be increased.
The El Paso-Juarez region can be a potential example to implement such alternatives. According
to Ojah et al. (2002), this gateway could be chosen for the following attributes:
Address coordination in a high-volume border system in which a variety of factors contribute
to congestion and delay.
Three commercial POEs within the system (Santa Teresa-San Jerónimo, Bridge of the
Americas, and Ysleta-Zaragoza).
Local maquiladora and trade associations that facilitate the organization of stakeholder
meetings.
The interest from the port authorities, and trade communities in exploring new alternatives to
improve border operations.
Diverse size and the imbalance of truck volumes among crossings.
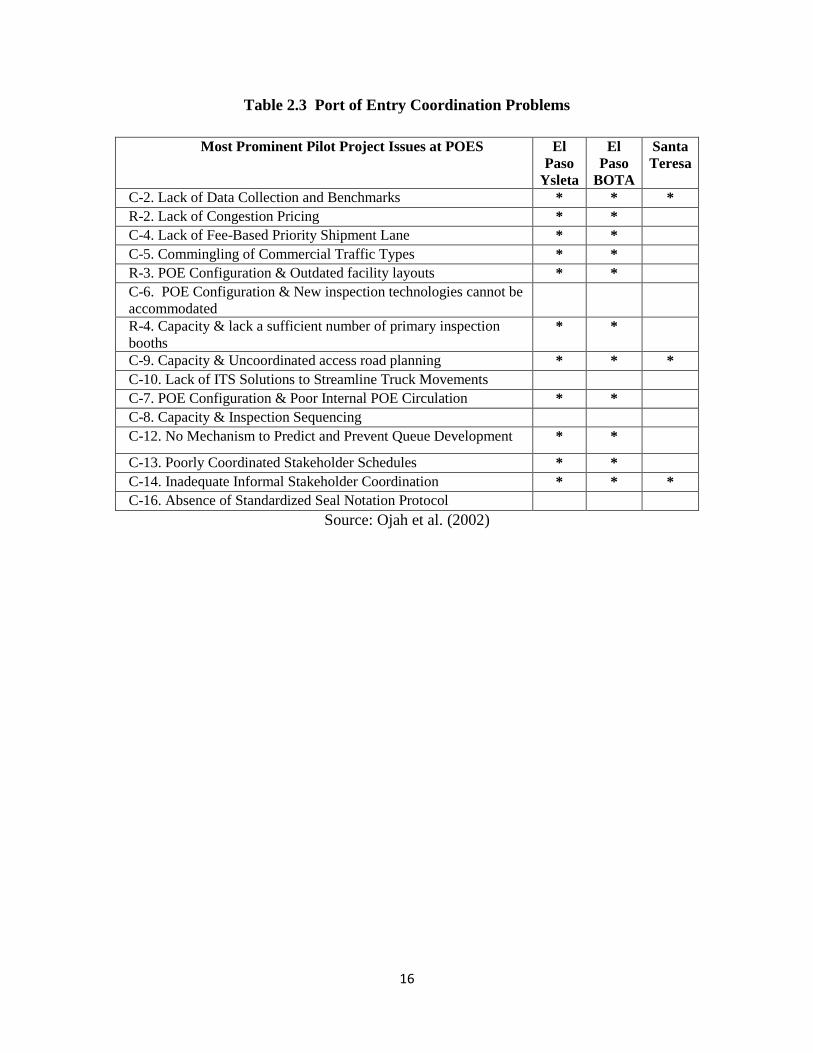
Some examples of alternatives that could be combined for implementation in the El Paso-Juarez
region as shown in Tables 2.2 and 2.3 include:
Data collection and benchmarking (C-2).
Retrofitting and traffic circulation (R-4).
Stakeholder schedules (C-13).
Opportunities to improve inspection sequencing (C-8).
Trailer seal notation protocol (C-16).
Commercial traffic segregation and pricing instruments (C-4).

15
Table 2.2 Coordination and Related Issues
Coordination Issues Coordination-Related Issues
Planning
C-1. Inadequate Long-Term Planning Strategy for Border
Crossings
C-2. Lack of Data Collection and Benchmarks
C-3. Inconsistent Planning for Truck Safety Inspection Facilities
R-1. Inadequate Incentives for Participation in Pre-Clearance
Programs
Demand Management
C-4. Lack of Fee-Based Priority Shipment Lane
C-5. Commingling of Commercial Traffic Types
R-2. Lack of Congestion Pricing
Physical Layout and Truck Movement
C-6. POE Configuration – New inspection technologies cannot be
accommodated
C-7. POE Configuration - Poor Internal POE Circulation
C-8. Capacity - Inspection Sequencing
C-9. Capacity - Uncoordinated access road design and a limited
number of lanes
C-10. Lack of ITS Solutions to Streamline Truck Movements
R-3. POE Configuration –Outdated facility layouts
R-4. Capacity –Some POEs lack a sufficient number of primary
inspection booths
Staff Management
C-11. Personnel Turnover - USCS inspector attrition rates are
high
C-12. No Mechanism to Predict and Prevent Queue Development
R-5. Insufficient Customs Personnel
R-6. Personnel Turnover - Mexican Customs’ rotation of port
directors
Stakeholder Coordination
C-13. Poorly Coordinated Stakeholder Schedules
C-14. Inadequate Informal Stakeholder Coordination
C-15. Untapped Opportunities to Enhance Broker Process
No Identified Stakeholder Issues
Standards
C-16. Absence of Standardized Seal Notation Protocol
C-17. Lack of Harmonized Truck Safety Standards No Identified Standards Issues
Information Management
C-18. Information Systems –Excessive Paperwork Preparation
and Handling
C-19. Information Systems –Antiquated Technology
C-20. No Advanced Threat Detection
No Identified Information Management Issues
Source: Ojah et al. (2002)
16
Table 2.3 Port of Entry Coordination Problems
Source: Ojah et al. (2002)
Most Prominent Pilot Project Issues at POES El
Paso
Ysleta
El
Paso
BOTA
Santa
Teresa
C-2. Lack of Data Collection and Benchmarks * * *
R-2. Lack of Congestion Pricing * *
C-4. Lack of Fee-Based Priority Shipment Lane * *
C-5. Commingling of Commercial Traffic Types * *
R-3. POE Configuration & Outdated facility layouts * *
C-6. POE Configuration & New inspection technologies cannot be
accommodated
R-4. Capacity & lack a sufficient number of primary inspection
booths * *
C-9. Capacity & Uncoordinated access road planning * * *
C-10. Lack of ITS Solutions to Streamline Truck Movements
C-7. POE Configuration & Poor Internal POE Circulation * *
C-8. Capacity & Inspection Sequencing
C-12. No Mechanism to Predict and Prevent Queue Development * *
C-13. Poorly Coordinated Stakeholder Schedules * *
C-14. Inadequate Informal Stakeholder Coordination * * *
C-16. Absence of Standardized Seal Notation Protocol
17
3 Stakeholder Interviews
This chapter reports the outcomes of interviews conducted with stakeholders involved in freight
transportation business in El Paso-Juarez region. The interviews were conducted with
representatives of Kuehne and Nagel (an international transportation firm), Borderplex Alliance
(an El Paso-Juarez bi-national economic interest group with memberships from local businesses)
and TCC Soft Inteligente (a business consultant in Ciudad Juarez). The interviews focused on the
transportation/import/export processes, current and future development of industrial parks and
warehouses.
3.1 El Paso
3.1.1 Kuehne and Nagel
Kuehne and Nagel, a global transportation and logistics company, has offices in El Paso and
provide services for the importation, exportation and warehousing of raw materials and produced
goods between the maquiladoras in Mexico, the distribution centers and consumers markets in the
U.S. As a company with U.S. and Mexico custom brokerage capabilities, the study team
interviewed Mr. David Reyes-Arteaga, a trans-border manager for Kuehne and Nagel (El Paso
branch) for a better understanding of the system, and the process for the importation and
exportation of goods between the two countries in the El Paso-Juarez region.
The process for the importation of goods into the U.S. coming from Mexico is explained in the
next few steps (Kuehne and Nagel 2013):
1. Document is received by the Kuehne and Nagel Mexican broker team.
2. Verification/receipt is approved and cleared from the client’s Harmonized Tariff Schedule of
the United States (HTSUS) assigned to Customs and Border Protection (CBP) for the filing
and export process. The goods are transported in a U.S. trailer with a Mexican tractor.
3. The Kuehne and Nagel Mexican broker revisers are dispatched to the carrier’s site for previous
process (make of truck, model of the truck, serial number, photos, etc.).
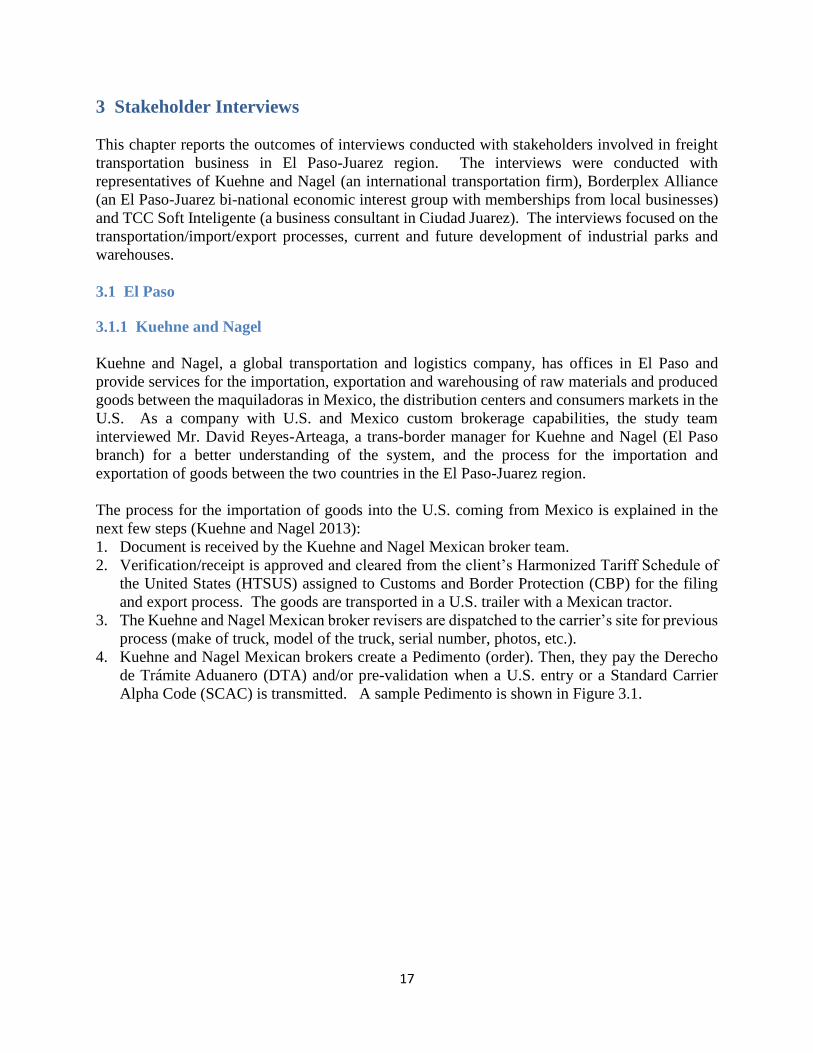
4. Kuehne and Nagel Mexican brokers create a Pedimento (order). Then, they pay the Derecho
de Trámite Aduanero (DTA) and/or pre-validation when a U.S. entry or a Standard Carrier
Alpha Code (SCAC) is transmitted. A sample Pedimento is shown in Figure 3.1.
18
Source: Kuehne and Nagel (2013)
Figure 3.1 Order sample (Pedimento)
5. Kuehne and Nagel releases pre-filed entry to Mexican brokers and the border drayman with
EManifest format for elaboration (HAZMAT requires 24 hours).
6. The border draymen file an EManifest transmission through CBP portal with all the required
information, such as the driver’s name, plates, and etc.
7. Kuehne and Nagel provide an electronic email notification to the client when shipment
cleared, or is assigned to a Centralized Examination Station (CES) exam.
8. The drayage carrier transfers the Less than Truck Load (LTL)/trailer through Mexican
customs with transfer power unit/drayage.
9. When the trailer reaches the Mexican custom, it will receive a signal:
Green: OK;
Yellow: documentation is wrong;
Red: physical inspection must be performed to the truck.
10. The trailer is transferred through U.S. Customs with a Transfer Power Unit /drayage.
11. At U.S. CBP, the trailer receives another signal:
Green: OK;
Yellow: documentation is wrong;
Red: physical inspection must be performed to the truck.
12. The shipment is received at Kuehne and Nagel warehouse in El Paso.

19
13. Kuehne and Nagel coordinate the pick-up and delivery of the shipment to the final destination,
based on routing guide provided by the client.
14. Kuehne and Nagel provide the client with all pertinent shipping documents like the Bill of
Landing (B/L) and the Pedimento.
The abovementioned process is graphically illustrated in Figure 3.2.
Source: Kuehne and Nagel (2013)
Figure 3.2 Process for imports at Kuehne and Nagel
3.1.2 Borderplex Alliance
A visit to Borderplex Alliance (formerly Regional Economic Development Corporation, REDCo)
took place in order to gain an insight of industrial development in the border region. The topics
discussed during this meeting were: past and current status of maquiladora industry in Ciudad
Juarez and future development for industrial zones in El Paso.
Borderplex Alliance provides services and resources to entrepreneurs looking for a business
investment opportunity in El Paso-Juarez region. Current data archived by Borderplex Alliance
serves as a tool to analyze viability and risks involved in business decisions.
20
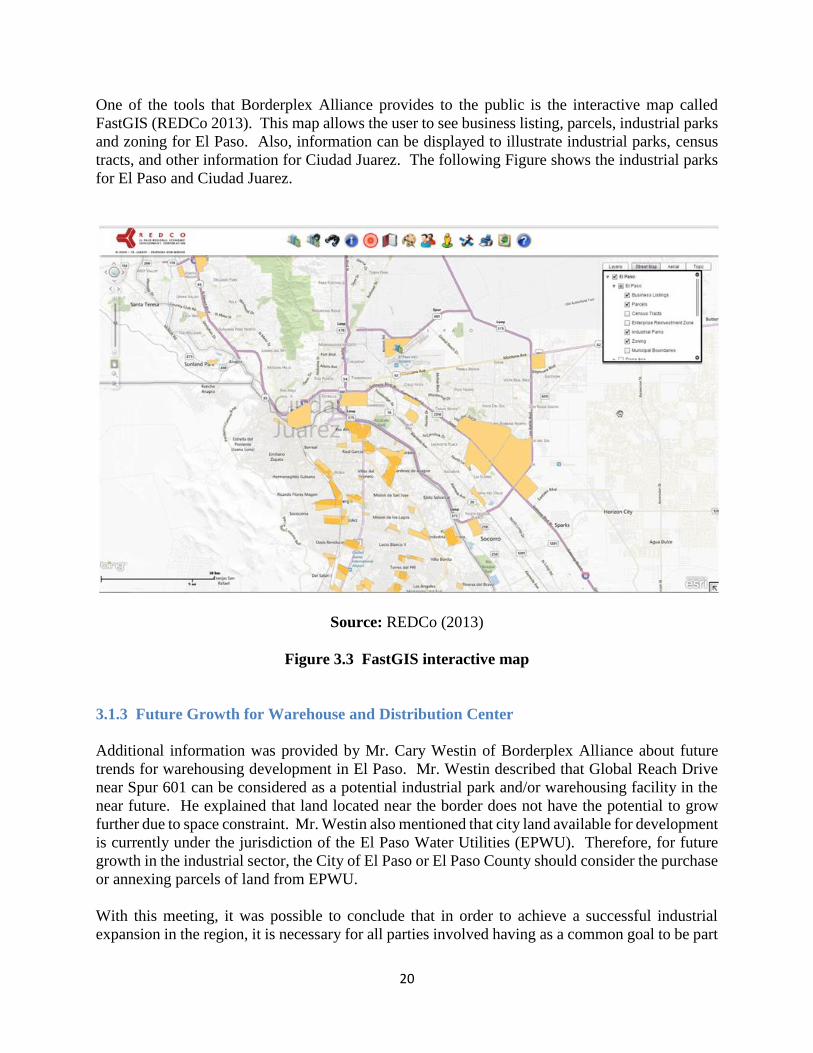
One of the tools that Borderplex Alliance provides to the public is the interactive map called
FastGIS (REDCo 2013). This map allows the user to see business listing, parcels, industrial parks
and zoning for El Paso. Also, information can be displayed to illustrate industrial parks, census
tracts, and other information for Ciudad Juarez. The following Figure shows the industrial parks
for El Paso and Ciudad Juarez.
Source: REDCo (2013)
Figure 3.3 FastGIS interactive map
3.1.3 Future Growth for Warehouse and Distribution Center
Additional information was provided by Mr. Cary Westin of Borderplex Alliance about future
trends for warehousing development in El Paso. Mr. Westin described that Global Reach Drive
near Spur 601 can be considered as a potential industrial park and/or warehousing facility in the
near future. He explained that land located near the border does not have the potential to grow
further due to space constraint. Mr. Westin also mentioned that city land available for development
is currently under the jurisdiction of the El Paso Water Utilities (EPWU). Therefore, for future
growth in the industrial sector, the City of El Paso or El Paso County should consider the purchase
or annexing parcels of land from EPWU.
With this meeting, it was possible to conclude that in order to achieve a successful industrial
expansion in the region, it is necessary for all parties involved having as a common goal to be part
21
of a strong and competitive industrial market. For this it would be necessary to consider both cities
as one and design a connected transportation and land use networks. EPWU should be included
as a stake holder in the future freight planning initiatives. It also appears that future land for
warehouse and distribution centers should be located at the fringe of the City of El Paso, along
major corridors such as I-10 Freeway and Loop 375 Freeway.
3.2 Ciudad Juarez
3.2.1 Borderplex Alliance
Future Growth for Industrial Parks
During the meeting at Borderplex Alliance, Mr. Manuel Ochoa provided insights on how industrial
parks were developed in Ciudad Juarez. Mr. Ochoa described that the distribution of the various
maquiladoras does not follow a strategic plan but rather has been accommodated based on the
growth of the city. This means that newest industrial parks have been located on the south part of
the city where economic expansion has taken place due to geographical constraints at other areas.
An unintended consequence of locating industrial parks far from the POEs is the congestion
generated when having commercial vehicles passing the principal arterials. Maquiladoras are
attracted to use the Bridge of the Americas (BOTA) POE to cross the border since it is the only
POE in the region that is free of charge. However, this results in a long trip for trucks from one
end of the city to the other. The other option is to use The Ysleta-Zaragoza POE which is closer
to industrial parks in the east side of the city. The Ysleta-Zaragoza POE offers longer hours of
operation. However, the heavy traffic demand and the crossing fee involved have discouraged
some trucking companies to use this POE.
According to Mr. Ochoa, the transportation of goods from Mexico to the U.S. has been a challenge
to the shippers and transportation companies. This is because there has not been a successful
combined effort between the U.S. CBP and manufacturing industries to optimize truck crossings
at the POEs. Securing the border has been the priority for CBP regardless of the long waiting time
for its clients (passenger cars and commercial vehicles). In addition, CBP offers limited hours of
operation for commercial vehicles, thus constraining the production schedule of maquiladoras and
trucking companies to deliver products. At the same time, within the above operating constrain,
the maquiladoras and/or trucking companies have not implemented a logistic strategy that includes
freight carrier collaboration to minimize expenses for freight transportation. As a result,
maquiladoras have included the cost of 2 to 3 hours of waiting time at the POEs as part of the
supply chain solution.
3.2.2 TCC Soft Inteligente
In order to gain an insight of maquiladora industry in Ciudad Juarez, the research team contacted
TCC Soft Inteligente. Mr. Miguel A. Miramontes who works as a commercial representative
shared with us his knowledge on manufacturing companies in Ciudad Juarez. According to Mr.
Miramontes, the industrial parks located in Ciudad Juarez that have a potential to expand are:
Santa Teresa Industrial Park
Intermex Sur Industrial Park

22
(Location: Blvd independencia /Paseos del Sur/ Prol. Miguel de la Madrid)
Tierra Nueva Industrial Park
(Location: Blvd Independencia and Puerto de Palos)
Salvacar Industrial Park : Location
(Location: Blvd Independencia y Santiago Troncoso)
Their locations are shown in Figure 3.4.
Mr. Miramontes explained that these industrial parks have an opportunity to grow as the safety in
the city gets better. Growth is expected for corporative engineering design centers with diverse
expertise. In addition, Mr. Miramontes expects that industries that require complex manufacturing
process will be potential candidates in the future.
Figure 3.4 Potential expansions of industrial parks in Ciudad Juarez

23

24
4 Freight Industry Outlook and Survey
This chapter reports the outlook of freight-related industries in the El Paso region. It first begins
by reporting the key economic indicators in this region. This is followed by an analysis of truck
volumes at border crossings, and the challenges. To understand the freight transportation demand,
this chapter also includes a survey conducted earlier on brokers and maquiladora who are the main
driving forces of shipping goods across the border in the El Paso-Juarez region.
4.1 El Paso
4.1.1 Regional Border Complex
The El Paso-Juarez POEs provide critical links of regional, statewide and national significance.
Maquiladora factories, mainly located in Ciudad Juarez, are linked to consumer markets and
distribution centers located in metropolitan El Paso, and states like Texas, New Mexico, and
beyond. The region’s POEs handled nearly 18% of total trade (in dollars) between U.S. and
Mexico in 2010, making El Paso-Juarez region the second busiest U.S. land POEs by total trade
value. Overall, the region’s manufacturing, services, educational, and retail sectors are strongly
linked and are of crucial importance for the regional, statewide, national and international
economic strength.
Located in a 45-mile stretch of the U.S.-Mexico border, comprising two U.S. states (Texas and
New Mexico) and one Mexican state (Chihuahua), the six POEs in the region, as shown in Figure
4.1, include:
Santa Teresa, located in Dona Ana County, New Mexico. Non-tolled facility.
Paso del Norte Bridge (PDN), handles northbound automobile traffic and northbound and
southbound pedestrian traffic. Tolled facility.
Stanton St. Bridge, handles mostly southbound vehicular traffic. Tolled facility.
Bridge of the Americas (BOTA), handles more than half of all international passenger and
commercial crossings in the region. Non-tolled facility.
Ysleta-Zaragoza Bridge, located in Eastern El Paso. Tolled facility.
Fabens-Caseta Bridge, is a small, light-duty bridge.
Together, these POEs handle the second largest volumes of trucks, passenger vehicles and
pedestrians.
The movement of goods and passengers across the border contributes greatly to the regional
economy, providing jobs and increasing the Gross Regional Product (GRP). Industries dependent
on border crossing such as the manufacturing and good-producing industries (natural resources,
and construction) account for a great share of the El Paso and Juárez economies. El Paso supply
and distribution facilities, administrative offices, and legal, accounting and financial services and
manufacturing industries (maquiladoras) located in Ciudad Juarez require each other, and create a
link between both economies.

25
Source: Cambridge Systematics (2011)
Figure 4.1 El Paso regional border crossings
4.1.2 El Paso Industrial Market
Since 2010, maquiladora production has started to recover (CBRE Global Research and Consulting
2013a). Due to some concerns including the violence in Juarez and slowdown in the global
economy, firms started looking for better and more flexible real estate options in El Paso rather
than investing in Juarez. In the past two years, El Paso started to experience a shift in the industry
going from old multi-facility operations to a consolidated class A set-up. This shift has created an
impact in the overall market. Most of the class A warehouse space has been leased. Rental rates
are climbing and several submarkets are very tight for core space. Overall, an improvement for
El Paso’s industrial real estate market is expected in 2013. Growing demand related to the

26
maquiladora industry, infrastructure improvements and increasing interest from regional investors
will have a positive impact in the local market demand. The current breakdown in industrial space
in El Paso is presented in Table 4.1.
Table 4.1 Market statistics for El Paso in 2013
Source: CBRE Global Research and Consulting (2013a)
Although El Paso added close to 3,600 new jobs in December 2012, the overall employment
decreased at a 0.4% annualized rate (see Figure 4.2). Job losses were widespread among the
service-providing sectors (including the transportation, warehousing and distribution industries),
while the goods-producing sectors registered gains. El Paso’s unemployment rate now stands at
8.9% (CBRE Global Research and Consulting 2013a).
Source: CBRE Global Research and Consulting (2013a)
Figure 4.2 Unemployment rates for El Paso

27
CBRE Global Research and Consulting expects the rising trend of pricing dynamics to continue
as shown in Figure 4.3.
Source: CBRE Global Research and Consulting (2013a)
Figure 4.3 Annual average asking rates for El Paso
There are many potential users looking for space in El Paso. These companies will consider a
build-to-suit even though buildings in El Paso have remained unchanged and land developers do
not plan any construction in the near future (see Figure 4.4).
Source: CBRE Global Research and Consulting (2013a)
Figure 4.4 Construction in square feet in El Paso
According to CBRE, One factor that may impact new construction is the Union Pacific Rail Yard
in Santa Teresa, New Mexico. Once this facility becomes operational in 2015 the attractiveness of
the intermodal capabilities along with the Overweight Cargo Zone in New Mexico could attract
new users to this area. The logistical cost benefits could outweigh the real estate considerations
and make new construction more viable.
28
4.2 Ciudad Juarez
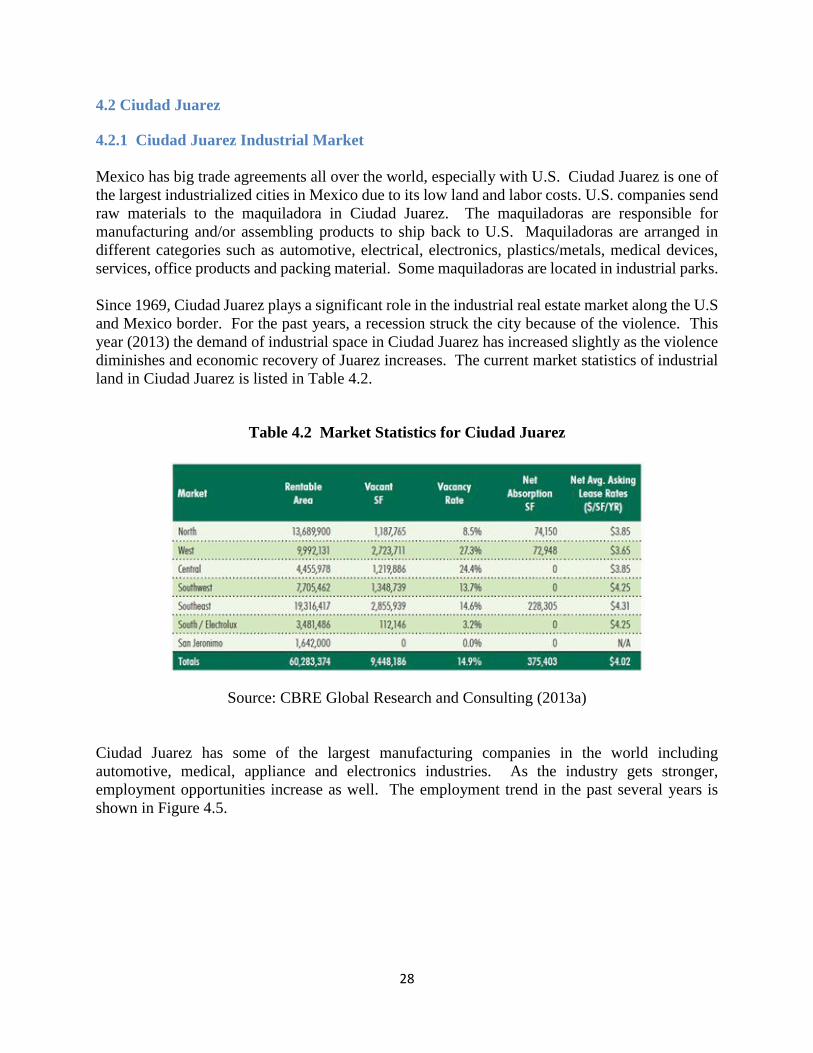
4.2.1 Ciudad Juarez Industrial Market
Mexico has big trade agreements all over the world, especially with U.S. Ciudad Juarez is one of
the largest industrialized cities in Mexico due to its low land and labor costs. U.S. companies send
raw materials to the maquiladora in Ciudad Juarez. The maquiladoras are responsible for
manufacturing and/or assembling products to ship back to U.S. Maquiladoras are arranged in
different categories such as automotive, electrical, electronics, plastics/metals, medical devices,
services, office products and packing material. Some maquiladoras are located in industrial parks.
Since 1969, Ciudad Juarez plays a significant role in the industrial real estate market along the U.S
and Mexico border. For the past years, a recession struck the city because of the violence. This
year (2013) the demand of industrial space in Ciudad Juarez has increased slightly as the violence
diminishes and economic recovery of Juarez increases. The current market statistics of industrial
land in Ciudad Juarez is listed in Table 4.2.
Table 4.2 Market Statistics for Ciudad Juarez
Source: CBRE Global Research and Consulting (2013a)
Ciudad Juarez has some of the largest manufacturing companies in the world including
automotive, medical, appliance and electronics industries. As the industry gets stronger,
employment opportunities increase as well. The employment trend in the past several years is
shown in Figure 4.5.

29
Source: CBRE Global Research and Consulting (2013a)
Figure 4.5 Maquiladora employment in Ciudad Juarez
For the past years as the recession intensified, rental rates decreased. There were over 100
buildings available but since 2011 the rental rate has been increasing (as can be seen in Figure
4.6). It is likely to continue to increase for the next years. Since there were too many empty
buildings several years ago, the construction of new buildings stopped (see Figure 4.7) and it
appears that it will remain like this in the near future.
Source: CBRE Global Research and Consulting (2013a)
Figure 4.6 Annual average asking rates per square foot in Ciudad Juarez
30
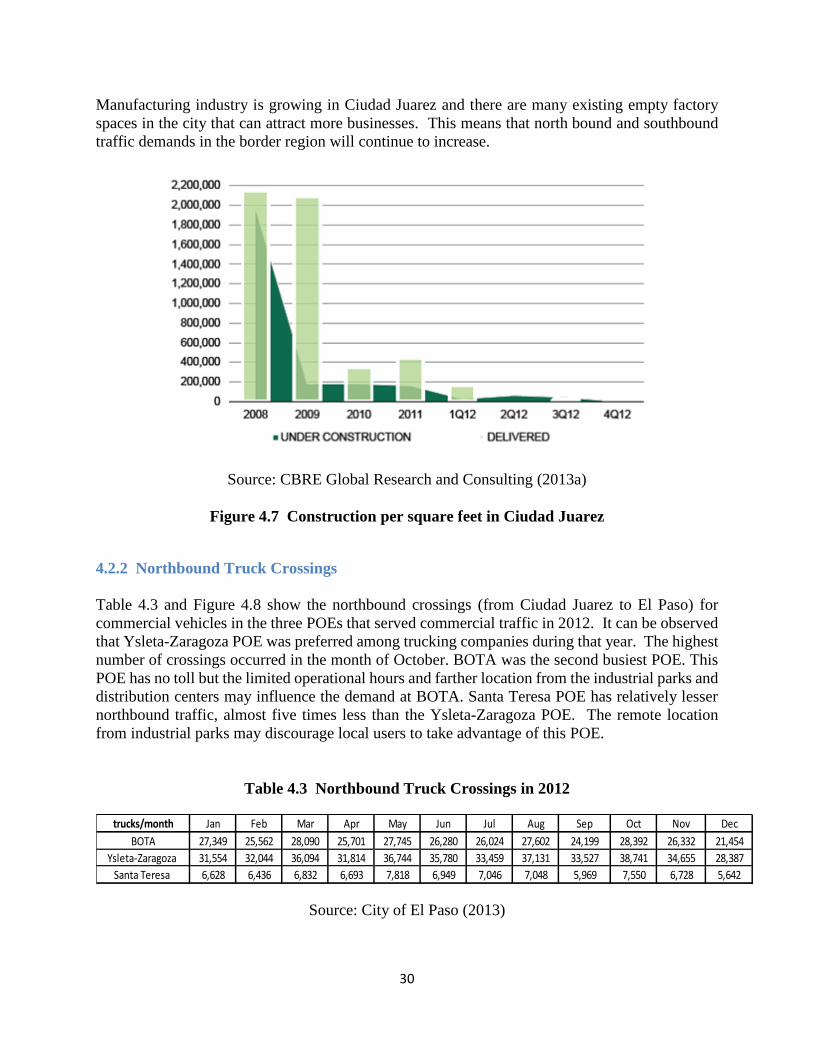
Manufacturing industry is growing in Ciudad Juarez and there are many existing empty factory
spaces in the city that can attract more businesses. This means that north bound and southbound
traffic demands in the border region will continue to increase.
Source: CBRE Global Research and Consulting (2013a)
Figure 4.7 Construction per square feet in Ciudad Juarez
4.2.2 Northbound Truck Crossings
Table 4.3 and Figure 4.8 show the northbound crossings (from Ciudad Juarez to El Paso) for
commercial vehicles in the three POEs that served commercial traffic in 2012. It can be observed
that Ysleta-Zaragoza POE was preferred among trucking companies during that year. The highest
number of crossings occurred in the month of October. BOTA was the second busiest POE. This
POE has no toll but the limited operational hours and farther location from the industrial parks and
distribution centers may influence the demand at BOTA. Santa Teresa POE has relatively lesser
northbound traffic, almost five times less than the Ysleta-Zaragoza POE. The remote location
from industrial parks may discourage local users to take advantage of this POE.
Table 4.3 Northbound Truck Crossings in 2012
trucks/month Jan Feb Mar Apr May Jun Jul Aug Sep Oct Nov Dec
BOTA 27,349 25,562 28,090 25,701 27,745 26,280 26,024 27,602 24,199 28,392 26,332 21,454
Ysleta-Zaragoza 31,554 32,044 36,094 31,814 36,744 35,780 33,459 37,131 33,527 38,741 34,655 28,387
Santa Teresa 6,628 6,436 6,832 6,693 7,818 6,949 7,046 7,048 5,969 7,550 6,728 5,642
Source: City of El Paso (2013)

31
Figure 4.8 Monthly northbound truck crossings
4.2.3 Freight Transportation Challenges
Based on the above information collected, the following challenges and constraints for freight
transportation in the El Paso-Juarez region have been identified.
Delivery Constraints
The actual border crossing inspection infrastructure in the El Paso-Juarez region is not serving the
commercial demand and this results in long waiting times. Time spent in border crossings
(northbound and southbound) directly affect the cost of production of sub-assembled and final
products manufactured in Ciudad Juarez. The delays increase the operating costs of the
maquiladoras and this translates into the cost of final products. Ultimately, this becomes a
challenge for the region’s economy.
Congestion
The lack of planned road network infrastructure for freight causes a lengthy movement of goods
in Ciudad Juarez. The congestion generated in principal arterials delays freight movement. Trucks
in return cause more congestion in the arterials. Industrial parks require better access to deliver
raw material and assembled products.
0
5,000
10,000
15,000
20,000
25,000
30,000
35,000
40,000
Jan
Feb
Mar
Ap
r
May Jun
Jul
Au
g
Sep
Oct
No
v
De
c
BOTA
Ysleta
Santa Teresa

32
Pollution
In order to overcome delivery constraints, trucking industry must rely on newer vehicle models
with higher load carrying capacities, better fuel efficiency and mechanical performance. Getting
newer tractors and cargo units not only allows a more efficient movement of goods, but also,
reduces pollution generated by old cargo trucks. At the same time, long vehicle queues accelerate
the emission of greenhouses gases to the atmosphere. Shortening inspection times is a challenge
that can benefit the environment. However, emission is always considered as an external cost to
private companies, although air quality is always of concern by government agencies such as the
El Paso Metropolitan Planning Organization and Texas Commission of Environmental Quality.
Safety
Due to the violence in the region many manufacturing companies were closed. The lack of
employees is a limitation when maquiladoras try to open more shifts to satisfy their production
demands.
4.2.4 Broker and Maquiladora Survey
This section reports a survey that was conducted over a period of four weeks, from September 12th
to October 12th of 2012, under the direction of El Paso Ports of Entry Task Force and Mayor John
Cook (Caviness-Tantimonaco and Hernandez 2013). The purpose of the survey was to gather
information from maquiladoras located in Ciudad Juarez, and brokers and importers serving the
El Paso and Ciudad Juarez region regarding the impact of proposed alternatives that may help
improve the border wait times at the POEs. The questions were posed to the top operational
executive in charge of the day-to-day operations for the maquiladoras, and to brokers and importers
who service manufacturing cross-border operations in El Paso and Ciudad Juarez region. The
survey was conducted through an online survey with an average completion time of about 15
minutes. A total of 107 emails were sent of which 48 were to maquiladoras and 59 were to brokers
and importers. A total of 40 completed responses were collected. Of the 40 responses collected,
19 were from the maquiladoras and 21 from the brokers and importers.
The survey was comprised of two sections:
The first section dealt with questions regarding the operational characteristics of the
respondents.
The second section dealt with questions regarding scenarios under consideration for the Bridge
of the Americas (BOTA).
The survey results provide insights into two surveyed groups: (1) the maquiladoras, and (2) brokers
and importers. Important findings about the current operations are presented in the remaining parts
of this section.
Figure 4.9 shows the distribution of companies that have different number of shipments, in the
northbound and southbound directions, respectively. Each shipment may be approximated as one
one-way trip. Although majority of the companies surveyed have less than 20 shipments/day,
there are a few companies with over 100 shipments/day.
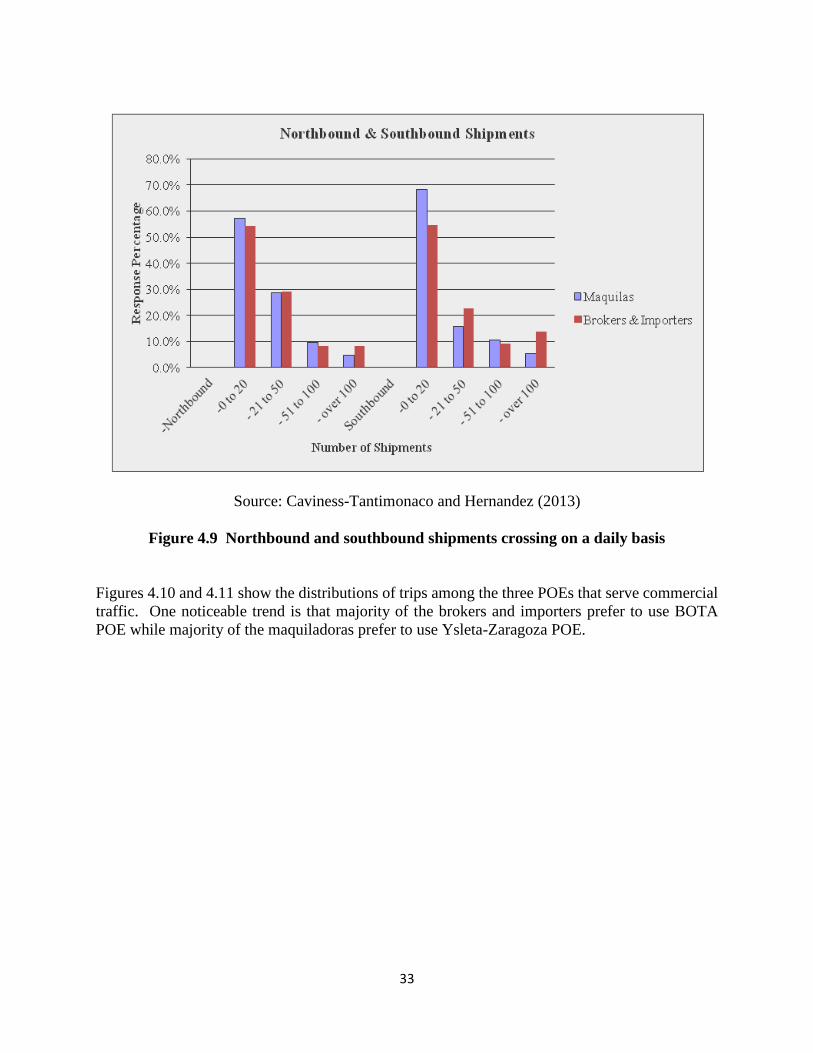
33
Source: Caviness-Tantimonaco and Hernandez (2013)
Figure 4.9 Northbound and southbound shipments crossing on a daily basis
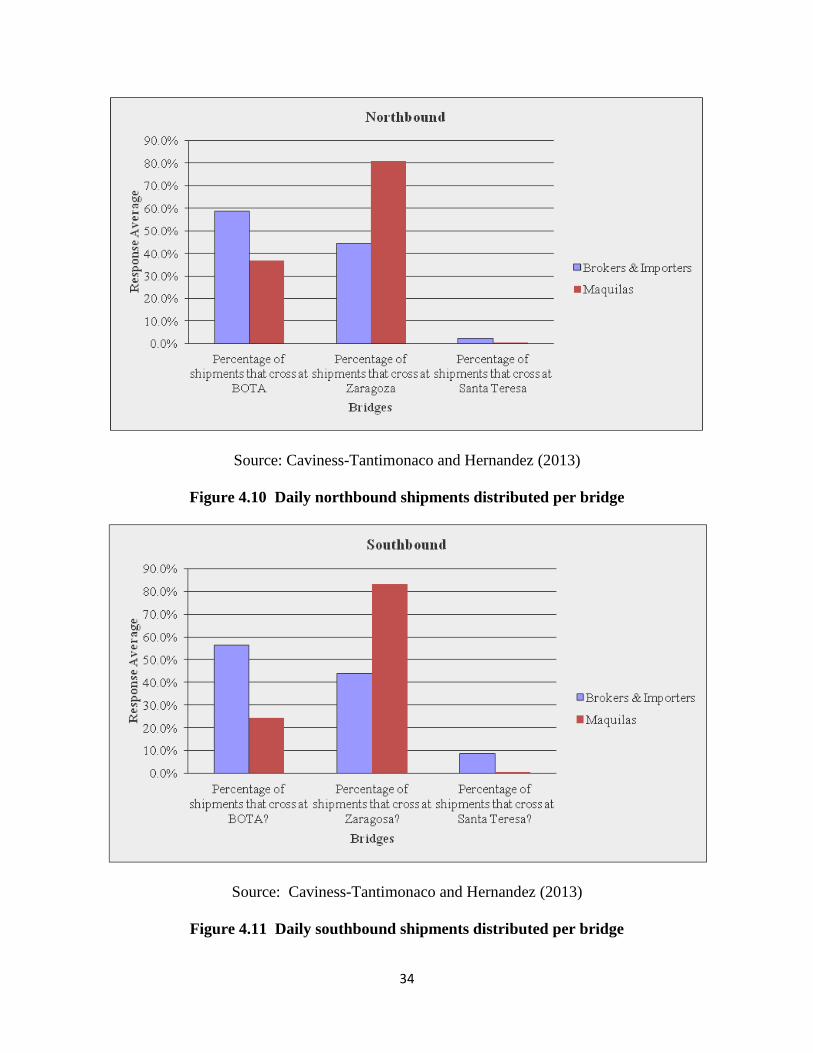
Figures 4.10 and 4.11 show the distributions of trips among the three POEs that serve commercial
traffic. One noticeable trend is that majority of the brokers and importers prefer to use BOTA
POE while majority of the maquiladoras prefer to use Ysleta-Zaragoza POE.
34
Source: Caviness-Tantimonaco and Hernandez (2013)
Figure 4.10 Daily northbound shipments distributed per bridge
Source: Caviness-Tantimonaco and Hernandez (2013)
Figure 4.11 Daily southbound shipments distributed per bridge

35
Fast and Secured Trade (FAST) is a U.S. Customs and Border Protection (CBP) program that
allowed expedited processing of import documents. Figure 4.12 shows the percentages of
shipments among all northbound shipments made by the companies. It further breaks the FAST
shipments down to the two POEs which handle this type of shipment. Overall, the responded
companies have at least 42% of the shipment that are classified as FAST. However, the
breakdowns into the BOTA and Ysleta-Zaragoza POEs do not match with the total percentages.
Source: Caviness-Tantimonaco and Hernandez (2013)
Figure 4.12 Total daily percentage of shipments that are FAST and bridge used
About half of the trailers crossing northbound at the BOTA POE are empty. One suggestion to
reduce the number of empty trailer is to set up "empty trailer pools" at strategic locations in Juarez.
Shippers could request trailers from the pools as needed. A question in the survey asked the
respondents if they were willing to participate in a trailer pool program to help to reduce cost or
improve efficiency. As seen from Figure 4.13, roughly half of the brokers and importers would
consider an empty trailer program if it cost less than $10 per trailer. In contrast, some of the
maquiladoras were in favor for a cost between $10 and $25.

36
Source: Caviness-Tantimonaco and Hernandez (2013)
Figure 4.13 Empty trailer pools
Figure 4.14 displays, according to the survey results, the total number of empty trainers that are
moved across the three POEs by all the respondents. The movements of such empty trailers add
to the queue and waiting time of real shipments at POEs.

37
Source: Caviness-Tantimonaco and Hernandez (2013)
Figure 4.14 Empty trailers shipped monthly
Customs-Trade Partnership against Terrorism (C-TPAT) is a CBP program that involves all
stakeholders in a supply chain to improve the security of shipments. Majority (approximately
75%) of the companies which participated in this survey are C-TPAT certified.
Source: Caviness-Tantimonaco and Hernandez (2013)
Figure 4.15 C-TPAT certification

38
39
5 Data Collection and Analysis
This chapter reports the regional freight activity data gathered by the research team from various
sources. The freight related data included, in El Paso the locations of industrial zones, statistics of
parcels, list of trucking companies and manufacturing facilities, truck volumes on major highways,
accident locations; and in Juarez the locations of industrial parks, statistics of maquiladoras and
future sites.
5.1 El Paso
5.1.1 Land Development
The land development data was found in the website Paso del Norte Mapa (UTEP Regional
Geospatial Service Center 2013). Paso del The Paso del Norte Mapa steering committee consists
of: Paso del Norte Health Foundation, Center for Border Health Research, EPWU, City of El Paso,
El Paso County Central Appraisal District, El Paso County Roads and Bridges, El Paso County
911, The University of Texas at El Paso, The Institute for Municipal Planning and Development
of Ciudad Juárez (Instituto Municipal de Investigacion y Planeacion, or IMIP). The coalition has
the support of representatives of the City of Las Cruces, Doña Ana County Planning Department,
and New Mexico State University.
Norte Mapa is in charge of providing the County of El Paso with parcel information. Paso del
Norte Mapa provides an ArcGIS database with a parcel layer that gives a specific record on each
parcel. The website also includes an interactive map where any person can search and find
information within a parcel. Paso del Norte Mapa works in hand with EPWU, the latter provides
aerial photographs to make the coding of the parcel layer possible. This dataset contains the
following useful layers, each with specific attributes: Parcels, Traffic Count, Schools, Head Start
Locations, Clinics, EP Centerline, Historic Districts, Foreign Trade Zones, and Rep. Districts. The
most important layer for this research is the parcel layer. A parcel is a plot of land that comes from
a division of larger areas that can be owned by different people. In this layer the research team
was able to find zoning area according to their districts. Some districts found were residential,
commercial, special purpose and, industrial and manufacturing. Figure 5.1 is a map of the parcel
layer.

40
Figure 5.1 Parcels and industrial zones
5.1.2 Industrial Zoning
Zoning data was collected from Municode (Municipal Code Corporation 2013) which is a data
source that codify municipal laws and ordinances. According to the Municipal Code of the City
of El Paso, the code of ordinances used in the project was processed on October 9, 2012. The data
implemented on the ArcMap is located in Chapter 20.06 called Zoning Districts and Map under a
file named Zoning.
41
In order to identify the industrial and manufacturing districts located in El Paso, three different
zone classifications were selected as shown in Table 5.1.
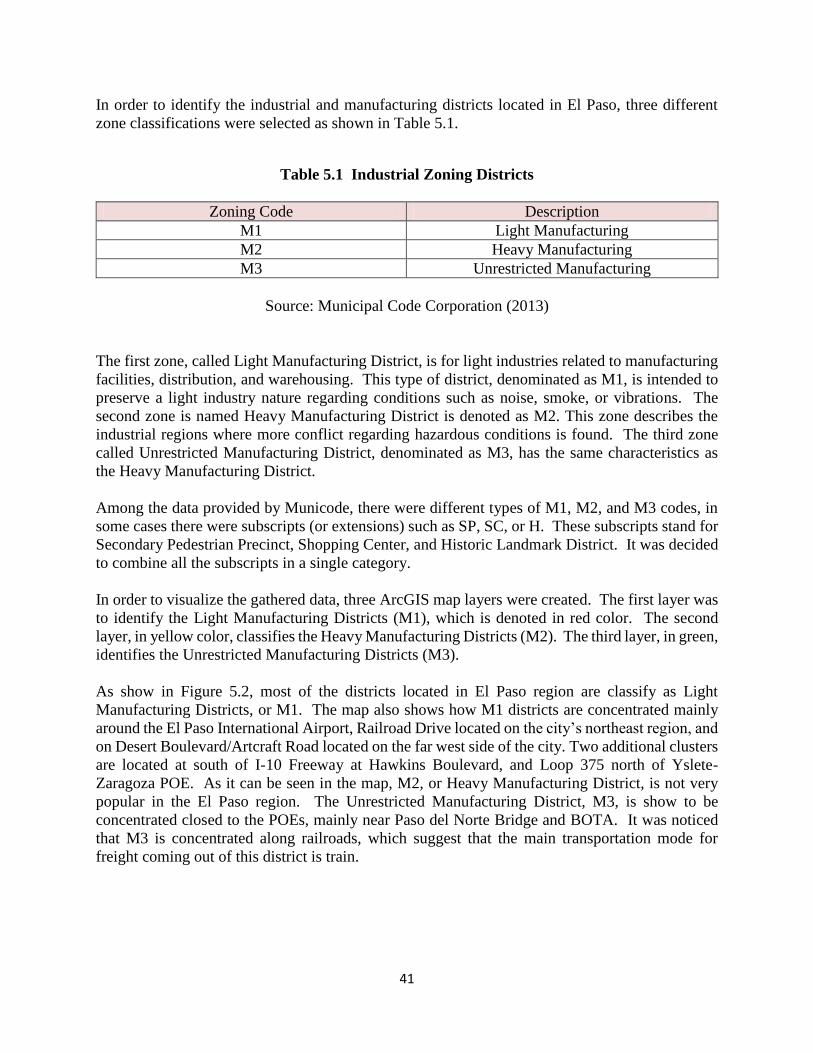
Table 5.1 Industrial Zoning Districts
Zoning Code Description
M1 Light Manufacturing
M2 Heavy Manufacturing
M3 Unrestricted Manufacturing
Source: Municipal Code Corporation (2013)
The first zone, called Light Manufacturing District, is for light industries related to manufacturing
facilities, distribution, and warehousing. This type of district, denominated as M1, is intended to
preserve a light industry nature regarding conditions such as noise, smoke, or vibrations. The
second zone is named Heavy Manufacturing District is denoted as M2. This zone describes the
industrial regions where more conflict regarding hazardous conditions is found. The third zone
called Unrestricted Manufacturing District, denominated as M3, has the same characteristics as
the Heavy Manufacturing District.
Among the data provided by Municode, there were different types of M1, M2, and M3 codes, in
some cases there were subscripts (or extensions) such as SP, SC, or H. These subscripts stand for
Secondary Pedestrian Precinct, Shopping Center, and Historic Landmark District. It was decided
to combine all the subscripts in a single category.
In order to visualize the gathered data, three ArcGIS map layers were created. The first layer was
to identify the Light Manufacturing Districts (M1), which is denoted in red color. The second
layer, in yellow color, classifies the Heavy Manufacturing Districts (M2). The third layer, in green,
identifies the Unrestricted Manufacturing Districts (M3).
As show in Figure 5.2, most of the districts located in El Paso region are classify as Light
Manufacturing Districts, or M1. The map also shows how M1 districts are concentrated mainly
around the El Paso International Airport, Railroad Drive located on the city’s northeast region, and
on Desert Boulevard/Artcraft Road located on the far west side of the city. Two additional clusters
are located at south of I-10 Freeway at Hawkins Boulevard, and Loop 375 north of Yslete-
Zaragoza POE. As it can be seen in the map, M2, or Heavy Manufacturing District, is not very
popular in the El Paso region. The Unrestricted Manufacturing District, M3, is show to be
concentrated closed to the POEs, mainly near Paso del Norte Bridge and BOTA. It was noticed
that M3 is concentrated along railroads, which suggest that the main transportation mode for
freight coming out of this district is train.

42
Figure 5.2 Industrial and manufacturing districts
Lot Size
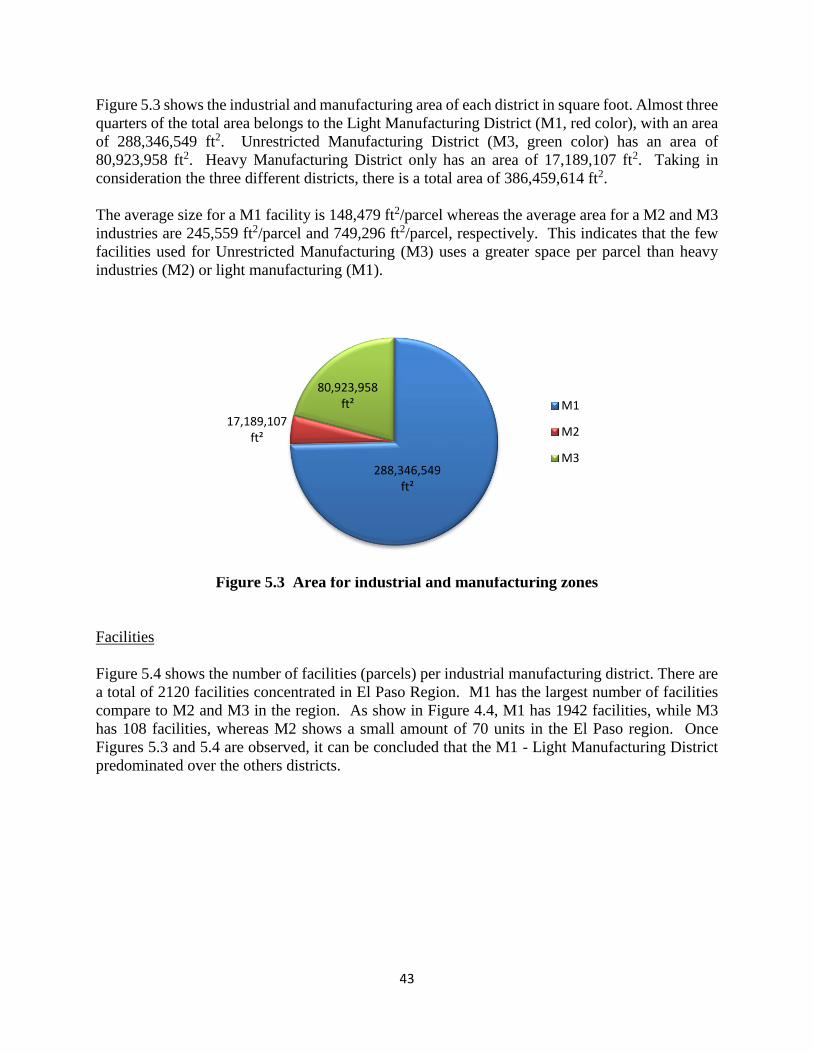
43
Figure 5.3 shows the industrial and manufacturing area of each district in square foot. Almost three
quarters of the total area belongs to the Light Manufacturing District (M1, red color), with an area
of 288,346,549 ft2. Unrestricted Manufacturing District (M3, green color) has an area of
80,923,958 ft2. Heavy Manufacturing District only has an area of 17,189,107 ft2. Taking in
consideration the three different districts, there is a total area of 386,459,614 ft2.
The average size for a M1 facility is 148,479 ft2/parcel whereas the average area for a M2 and M3
industries are 245,559 ft2/parcel and 749,296 ft2/parcel, respectively. This indicates that the few
facilities used for Unrestricted Manufacturing (M3) uses a greater space per parcel than heavy
industries (M2) or light manufacturing (M1).
Figure 5.3 Area for industrial and manufacturing zones
Facilities
Figure 5.4 shows the number of facilities (parcels) per industrial manufacturing district. There are
a total of 2120 facilities concentrated in El Paso Region. M1 has the largest number of facilities
compare to M2 and M3 in the region. As show in Figure 4.4, M1 has 1942 facilities, while M3
has 108 facilities, whereas M2 shows a small amount of 70 units in the El Paso region. Once
Figures 5.3 and 5.4 are observed, it can be concluded that the M1 - Light Manufacturing District
predominated over the others districts.
288,346,549 ft²
17,189,107 ft²
80,923,958 ft² M1
M2
M3

44
Figure 5.4 Number of facilities per manufacturing zone
5.1.3 Trucking and Warehousing Facilities
Trucking and warehousing data was collected from Miss Denisse Rodarte, Program Administrator
in the City of El Paso. Miss Rodarte used a software program called Hoovers (Hoover’s Inc. 2013)
which provides information about companies, decision makers, and industries. Hoovers also helps
to identify and evaluate potential sales leads, markets, and business partners; build presentations,
reports and customized lists of companies, industries for decision makers. Hoovers’ information
was updated in 2013. The list of warehouses and trucking companies included company’s name,
address, longitude, latitude, and other information as seen in Tables 5.2 and 5.3. Companies not
listed but still in the scope of work of this project, such as Mesilla Valley Transportation
and Kuehne & Nagel, were manually added.
Table 5.2 Trucking Companies in El Paso
Source: Hoover’s Inc. (2013)
1942
70108
M1
M2
M3

45
Table 5.3 Warehousing Facilities in El Paso
Source: Hoover’s Inc. (2013)
With the longitude and latitude, it was possible to label the spatial locations of companies in a GIS
map. Two different symbols were used, one for warehouses and another for the trucking
companies. For Warehouses a blue box with a “w” was used and for the trucking companies a
truck icon. The locations of warehouses and trucking companies can be seen in the following
figures. The map includes registered office addresses, not necessary the operation facilities.
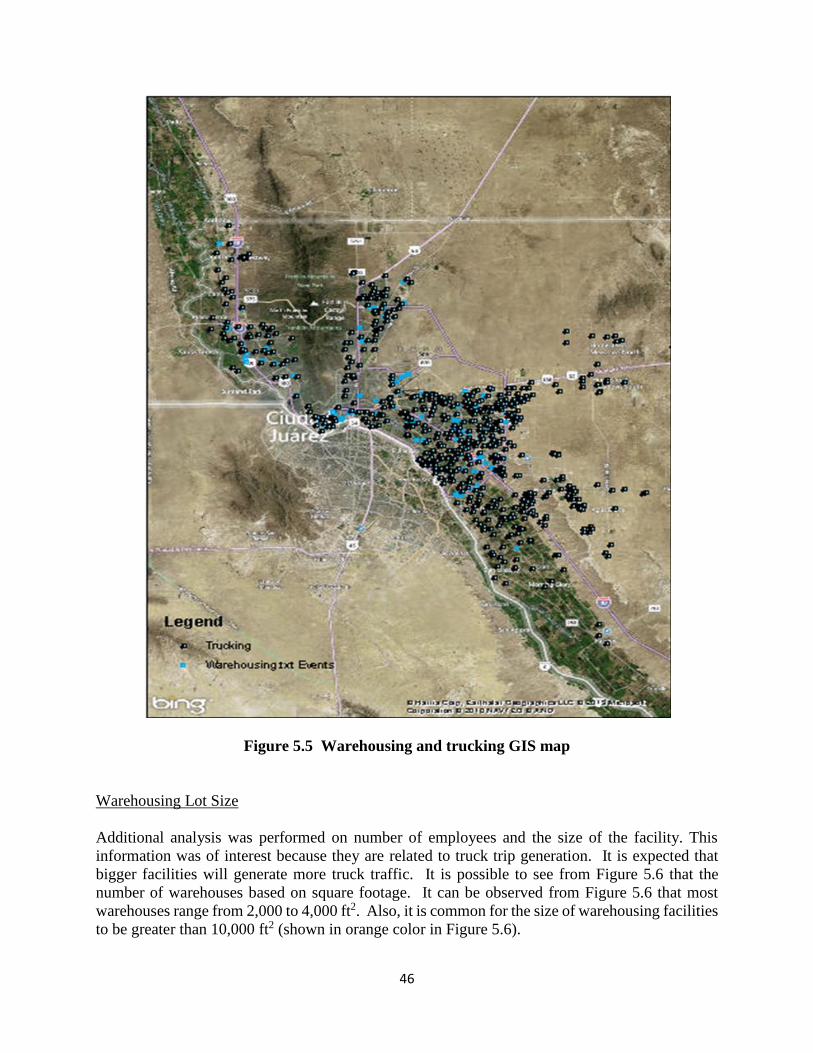
46
Figure 5.5 Warehousing and trucking GIS map
Warehousing Lot Size
Additional analysis was performed on number of employees and the size of the facility. This
information was of interest because they are related to truck trip generation. It is expected that
bigger facilities will generate more truck traffic. It is possible to see from Figure 5.6 that the
number of warehouses based on square footage. It can be observed from Figure 5.6 that most
warehouses range from 2,000 to 4,000 ft2. Also, it is common for the size of warehousing facilities
to be greater than 10,000 ft2 (shown in orange color in Figure 5.6).
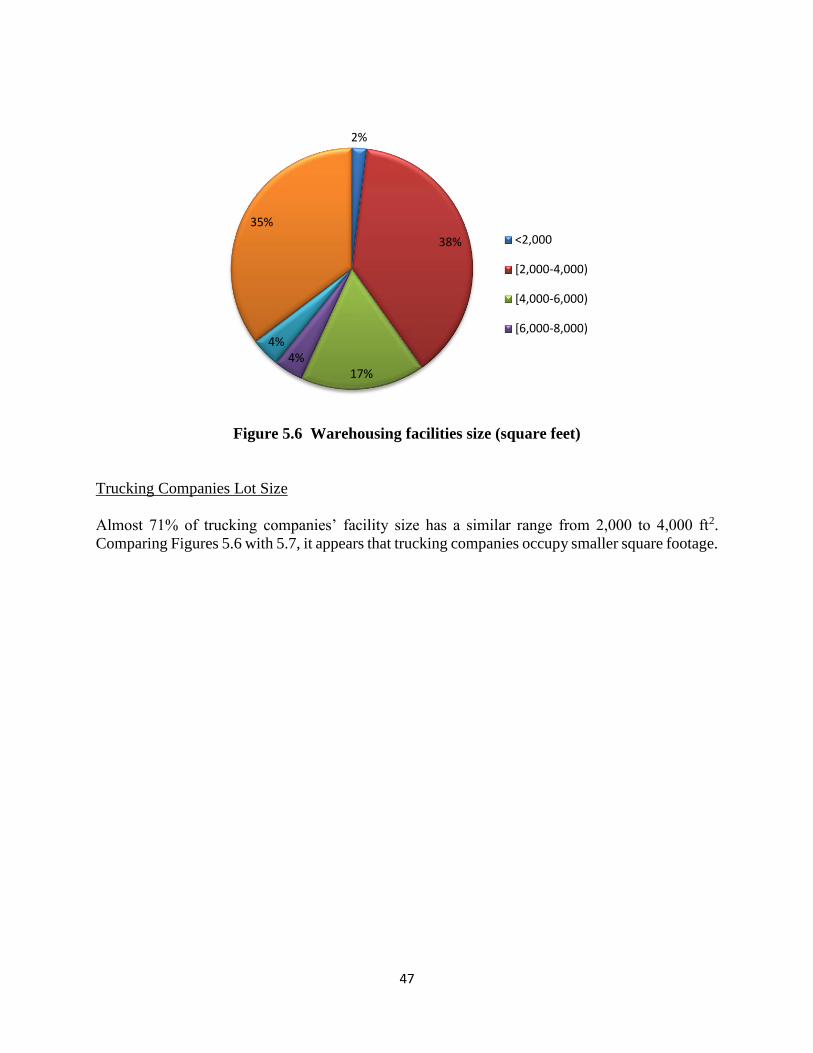
47
Figure 5.6 Warehousing facilities size (square feet)
Trucking Companies Lot Size
Almost 71% of trucking companies’ facility size has a similar range from 2,000 to 4,000 ft2.
Comparing Figures 5.6 with 5.7, it appears that trucking companies occupy smaller square footage.
2%
38%
17%4%
4%
35%
<2,000
[2,000-4,000)
[4,000-6,000)
[6,000-8,000)
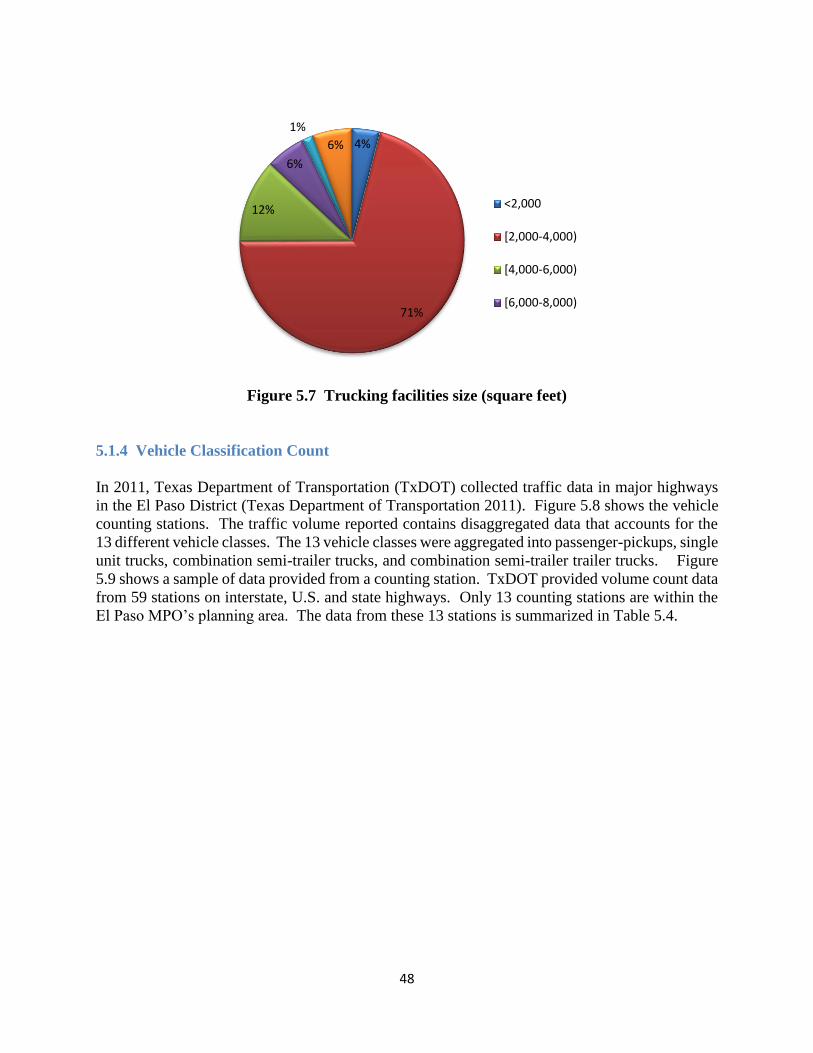
48
Figure 5.7 Trucking facilities size (square feet)
5.1.4 Vehicle Classification Count
In 2011, Texas Department of Transportation (TxDOT) collected traffic data in major highways
in the El Paso District (Texas Department of Transportation 2011). Figure 5.8 shows the vehicle
counting stations. The traffic volume reported contains disaggregated data that accounts for the
13 different vehicle classes. The 13 vehicle classes were aggregated into passenger-pickups, single
unit trucks, combination semi-trailer trucks, and combination semi-trailer trailer trucks. Figure
5.9 shows a sample of data provided from a counting station. TxDOT provided volume count data
from 59 stations on interstate, U.S. and state highways. Only 13 counting stations are within the
El Paso MPO’s planning area. The data from these 13 stations is summarized in Table 5.4.
4%
71%
12%
6%
1%
6%
<2,000
[2,000-4,000)
[4,000-6,000)
[6,000-8,000)
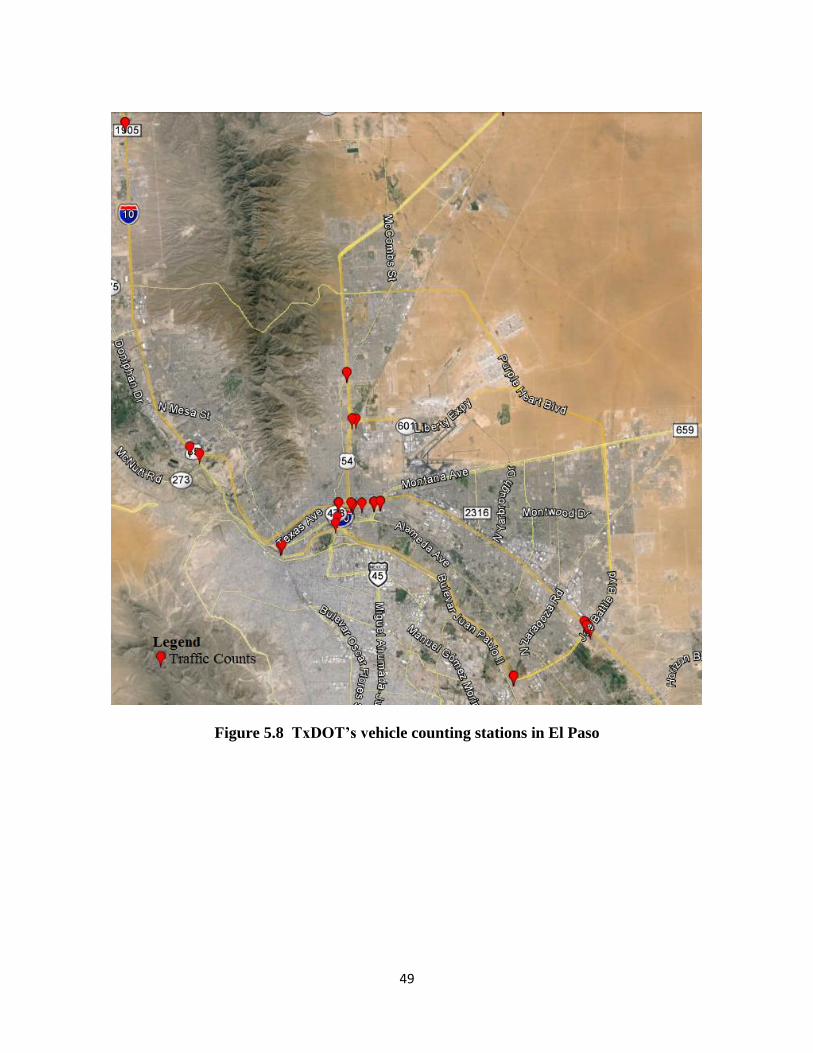
49
Figure 5.8 TxDOT’s vehicle counting stations in El Paso

50
Figure 5.9 Format of vehicle volume count data provided by TxDOT

51
Table 5.4 Summary of Traffic Count Provided by TxDOT
The data in Table 5.4 may be analyzed by (i) percentage of trucks; and (ii) by total number of
trucks. Station MS-152 has the highest truck percentages in traffic (63% and 66% respectively).
This station has two counting locations at the connectors from BOTA to I-10 Freeway toward the
westbound and eastbound directions, respectively. Several other locations (such as Stations LW-
510, M-1168, MT-660, M-1680 and M680) also have high percentages of trucks. These locations
are near Texas-New Mexico state lines in the west and north of El Paso, Zaragosa POE, I-10 and
Loop 375 interchange (Americas Interchange), and BOTA POE. The percentage of trucks at these
stations ranges from 15% to 19%. In terms of total truck volume, Stations HP-973, HP974, HP-
975 and MS-162 have the highest truck volumes (more than 5000 trucks/day). In general, the I-
10 and U.S. 54 interchange (also known as Spaghetti Bowl), and the I-10 and Loop 375 (Americas
Interchange) have high truck volumes.
Station Location Direction Date% Mcycle,
cars,
pickups
% heavy
trucks
Pax,
pickups
Single
unit
trucks
Combi
semi-
trailer
Combi,
semi-
trailer
trailer
Total
trucks
Total
HP-972 DYER ST. W OF US0054 North 9/12/11 98 2 8520 204 11 0 215 8735
HP-972 DYER ST. W OF US0054 South 9/12/11 98 2 7134 162 5 0 167 7301
HP-973 IH0010 W OF US0054 West 9/15/11 92 8 70218 2299 3520 221 6040 76258
HP-973 IH0010 W OF US0054 East 9/15/11 93 7 72170 1930 3669 222 5821 77991
HP-974 IH0010 W OF US0085 East 9/15/11 91 9 61345 2203 3646 292 6141 67486
HP-974 IH0010 W OF US0085 West 9/15/11 91 9 60780 1997 3458 229 5684 66464
HP-975 IH0010 W OF US0062 West 9/12/11 92 8 73700 1966 3973 143 6082 79782
HP-975 IH0010 W OF US0062 East 9/12/11 93 7 63831 1849 2881 127 4857 68688
HP-975 FRRD IH0010 EB E OF US0062 West 9/12/11 93 7 13554 581 508 1 1090 14644
HP-975 FRRD IH0010 EB E OF US0062 East 9/12/11 94 6 15540 488 516 3 1007 16547
HP-976 FRED WILSON RD E OF US0054 East 9/14/11 96 4 28379 698 431 14 1143 29522
HP-976 FRED WILSON RD E OF US0054 West 9/14/11 97 3 13486 295 123 1 419 13905
LW-510 IH0010 N OF EL PASO North 9/15/11 81 19 19443 1238 2968 212 4418 23861
LW-510 IH0010 N OF EL PASO South 9/15/11 82 18 19831 1125 3122 222 4469 24300
M-1168 US0054 S OF NEW MEXICO ST L SW 11/15/11 85 15 2963 227 307 3 537 3500
M-1168 US0054 S OF NEW MEXICO ST L Northeast 11/15/11 85 15 2342 194 213 3 410 2752
M-1680 IH0010 SE OF LP0375 EL PASO EAST 9/12/11 87 13 27277 1111 2826 171 4108 31385
M-1680 IH0010 SE OF LP0375 EL PASO WEST 9/12/11 88 12 28283 1240 2519 114 3873 32156
M-1680 FRRD IH0010 WB SE OF LP0375 WEST 9/12/11 88 12 4144 389 184 15 588 4732
M-1680 FRRD IH0010 EB SE OF LP0375 EAST 9/12/11 94 6 4681 155 143 3 301 4982
MS-123 IH0010 S OF LP0375 SOUTH 9/15/11 86 14 26013 820 3483 0 4303 30316
MS-123 IH0010 S OF LP0375 NORTH 9/15/11 86 14 23123 723 2903 172 3798 26921
MS-152 IH0010 W OF SH0054 EAST 9/8/11 34 66 1816 265 2996 257 3518 5334
MS-152 IH0010 W OF SH0054 WEST 9/8/11 37 63 1813 194 2576 260 3030 4843
MS-162 IH0010 W OF US0054 WEST 9/15/11 94 6 94324 2245 3575 173 5993 100317
MS-162 IH0010 W OF US0054 EAST 9/15/11 94 6 92585 2019 3694 239 5952 98537
MT-660 ZARAGOSA ROAD BRG SOUTH 11/17/11 82 18 6094 241 1072 1 1314 7408
MT-660 ZARAGOSA ROAD BRG NORTH 11/17/11 87 13 8539 288 1036 0 1324 9863
MT-680 IH0110 BRG OF THE AMERICAS SOUTH 9/13/11 85 15 17011 1251 1811 28 3090 20101
MT-680 IH0110 BRG OF THE AMERICAS NORTH 9/13/11 99 1 9217 54 1 0 55 9272
MT-700S US0062 SB STANTON STR BRG SOUTH 9/13/11 97 3 2831 83 0 0 83 2914
MT-700S US0062 NB STANTON STR BRG NORTH 9/13/11 100 0 3871 1 0 0 1 3872
MT-704N US0062 NB ONLY EL PASO ST BRG NORTH 9/13/11 100 0 4089 6 0 0 6 4095
Traffic composition
(%) Daily volime (veh/day)

52
5.1.5 Crashes Involving Commercial Vehicles
A request for the Crash Records Information System (CRIS) was ordered through the TxDOT
website (Texas Department of Transportation 2013). The data was given in an Excel file. The
data provided all the automotive crashes in the State of Texas from years 2008 through 2012. It
was necessary to filter all the crashes of Texas to only the ones that occurred in El Paso (city
identification 136). After identifying the crashes in El Paso, the CRIS information was filtered
again, but this time, to account crashes that involved a Commercial Motor Vehicle (CMV). The
final Excel spreadsheet contained only crashes in El Paso in which a CMV was involved. In the
data there were two important columns for the study: latitude and longitude of the crash. With the
latitude and longitude it was possible to plot the crashes into the GIS map as shown in Figure 5.9.
From here, it can be observed that most crashes involving CMV were located in I-10 or in main
streets of the city. The concentration of crash spots does not appear to correlate with locations of
industrial districts in Figure 5.2.
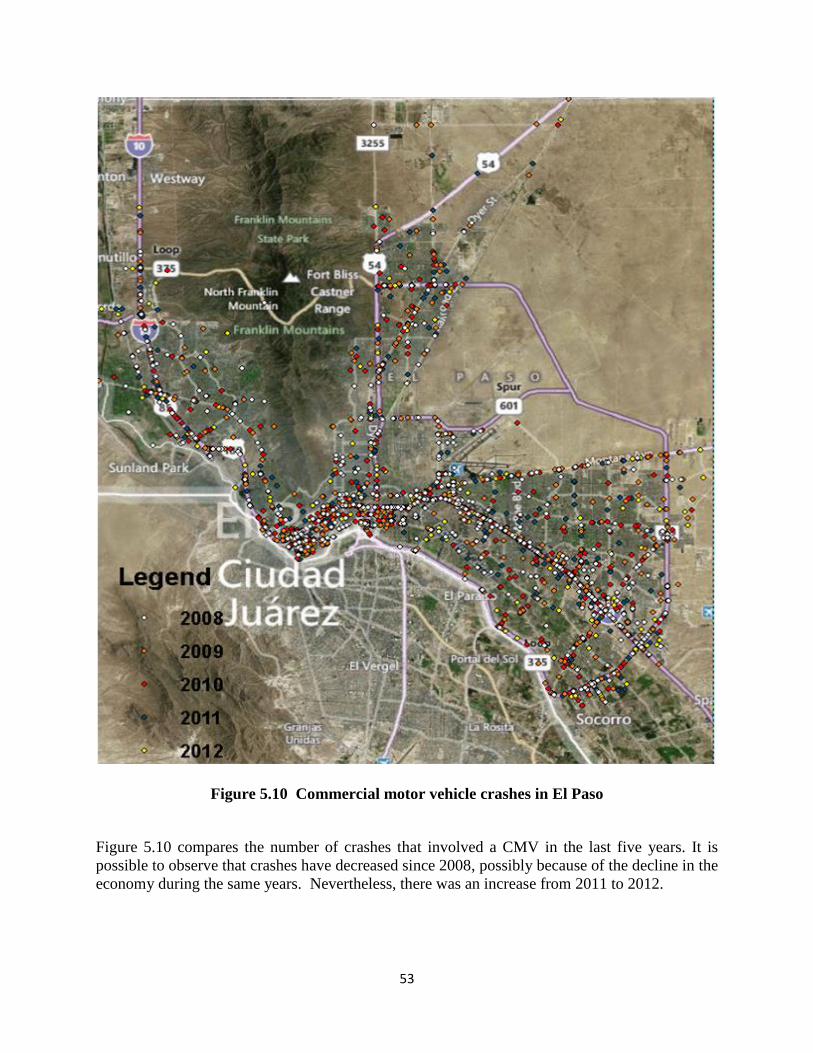
53
Figure 5.10 Commercial motor vehicle crashes in El Paso
Figure 5.10 compares the number of crashes that involved a CMV in the last five years. It is
possible to observe that crashes have decreased since 2008, possibly because of the decline in the
economy during the same years. Nevertheless, there was an increase from 2011 to 2012.

54
Figure 5.11 Commercial motor vehicle crashes per year
5.1.6 Available Land
Based on the available properties listed in CBRE Global Research and Consulting (2013b), it is
possible to identify the commercial real estate in the border region. Information available in El
Paso market is summarized in the following Tables 5.5, 5.6 and Figure 5.12. Most of the available
industrial parcels are in the northeast of El Paso, around El Paso International Airport, and along
I-10 and Loop 375 Freeways in the east El Paso.
718714
692
602
637
540
560
580
600
620
640
660
680
700
720
740
2008 2009 2010 2011 2012
Cra
she
s
Year
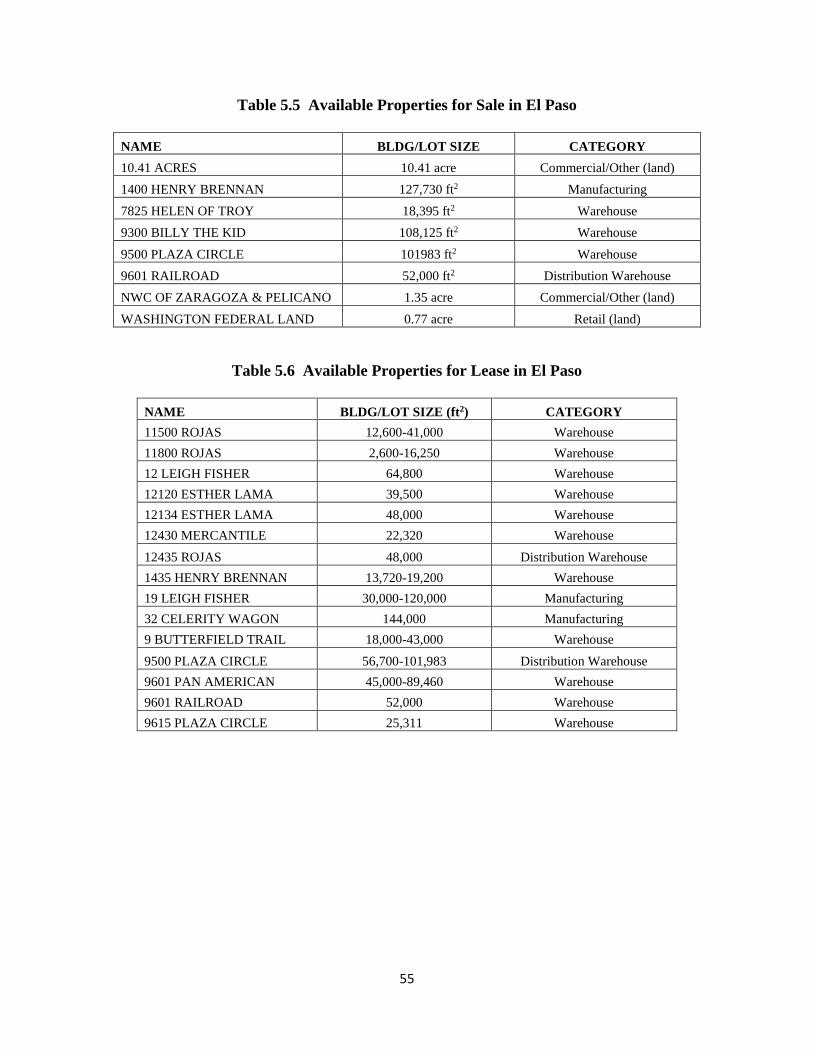
55
Table 5.5 Available Properties for Sale in El Paso
NAME BLDG/LOT SIZE CATEGORY
10.41 ACRES 10.41 acre Commercial/Other (land)
1400 HENRY BRENNAN 127,730 ft2 Manufacturing
7825 HELEN OF TROY 18,395 ft2 Warehouse
9300 BILLY THE KID 108,125 ft2 Warehouse
9500 PLAZA CIRCLE 101983 ft2 Warehouse
9601 RAILROAD 52,000 ft2 Distribution Warehouse
NWC OF ZARAGOZA & PELICANO 1.35 acre Commercial/Other (land)
WASHINGTON FEDERAL LAND 0.77 acre Retail (land)
Table 5.6 Available Properties for Lease in El Paso
NAME BLDG/LOT SIZE (ft2) CATEGORY
11500 ROJAS 12,600-41,000 Warehouse
11800 ROJAS 2,600-16,250 Warehouse
12 LEIGH FISHER 64,800 Warehouse
12120 ESTHER LAMA 39,500 Warehouse
12134 ESTHER LAMA 48,000 Warehouse
12430 MERCANTILE 22,320 Warehouse
12435 ROJAS 48,000 Distribution Warehouse
1435 HENRY BRENNAN 13,720-19,200 Warehouse
19 LEIGH FISHER 30,000-120,000 Manufacturing
32 CELERITY WAGON 144,000 Manufacturing
9 BUTTERFIELD TRAIL 18,000-43,000 Warehouse
9500 PLAZA CIRCLE 56,700-101,983 Distribution Warehouse
9601 PAN AMERICAN 45,000-89,460 Warehouse
9601 RAILROAD 52,000 Warehouse
9615 PLAZA CIRCLE 25,311 Warehouse

56
Figure 5.12 Available properties in El Paso
5.2 Ciudad Juarez
5.2.1 Industrial Parks
Information regarding Ciudad Juarez was gathered from different sources: Desarrollo Economico
de Ciudad Juarez (2011), Al Dia editors (2011), Instituto Nacional de Estadistica y Geografia
(2011). These references provided economic and business information for the study.
Juarez Invest is an organization responsible for economic development and international trade
(Desarrollo Economico de Ciudad Juarez 2011). The website has an interactive map that has the
most updated information about industrial parks and maquiladoras.
57
“Al Dia” is a magazine that contains a directory of manufacturing industries in Ciudad Juarez that
has their address , zip code , telephone ,category , and industrial park (Al Dia 2011).
The Instituto Nacional de Estadistica y Geografia (INEGI, or National institute of Statistic and
Geography) is an agency of the Mexican government dedicated to coordinate the national system
of statistical and geographical information of the country. The web has the number of employees
of each maquiladora on Ciudad Juarez.
Some information was missing from the ArcGIS file used as base map which was provided by
Borderplex Alliance (Figure 3.3). Some industrial parks and maquiladoras were not found on the
based map. Another attribute omitted in the original file was the number of employees. The
ArcGIS map was updated using the sources previously described. Juarez Invest, a primary
resource of information, was compared with the base map to find current industrial parks and
maquiladoras that were not located in the map. In order to find the exact location of each industrial
park and maquiladora “Al Dia” magazine was essential.
Google Earth (Google 2013) is a virtual map that has geographical information all over the world.
With the help of Google Earth, missing locations for industrial parks with polygon shapes were
identified and created.
ArcGIS was used to measure distance, area, perimeter in a map. With this tool, the area and
perimeter of the industrial parks that need to be updated were calculated. The use of INEGI website
was necessary because the number of employees of some maquiladoras was not present.
The following figure (Figure 5.13) is an updated map of Ciudad Juarez’s maquiladoras and
industrial parks. It includes green polygons that represent Industrial parks and orange points that
represent maquiladoras. Table 5.7 shows the area and perimeter for the different industrial parks.

58
Figure 5.9 Ciudad Juarez maquiladora industry locations

59
Table 5.7 Industrial Park Size
FID NAME OF INDUSTRIAL PARK AREA (ft2) PERIMETER (ft)
0 PARQUE IND. ALTAVISTA 83,429.60 1,624.43
1 PARQUE INDUSTRIAL OMEGA 1,757,461.96 8,690.64
2 PARQUE INDUSTRIAL LOS FUENTES 771,259.50 5,293.56
3 PARQUE IND. ANTONIO J. BERMUDEZ 1,874,142.34 9,167.03
4 PARQUE INDUSTRIAL EJE J. GABRIEL 534,777.33 6,926.64
5 PARQUE INDUSTRIAL JUAREZ 724,726.40 4,213.34
6 PARQUE INDUSTRIAL RAMON RIVERA LARA 370,638.87 3,387.23
7 PARQUE INDUSTRIAL FERNANDEZ 606,327.77 4,106.32
8 PARQUE INDUSTRIAL GEMA 430,953.95 2,892.92
9 PARQUE INDUSTRIAL ZARAGOZA 266,373.75 2,175.78
10 PARQUE INDUSTRIAL GEMA II 312,133.93 2,427.87
11 PARQUE INDUSTRIAL AZTECAS 518,869.70 3,375.77
12 PARQUE INDUSTRIAL LAS LOMAS 393,958.40 4,950.96
13 PARQUE INDUSTRIAL RIO BRAVO 1,200,509.36 5,071.63
14 PARQUE INDUSTRIAL ABH 290,023.41 2,736.13
15 PARQUE INDUSTRIAL NORTH GATE 399,990.95 2,910.43
16 PARQUE INDUSTRIAL HENEQUEN 307,301.32 2,254.61
17 PARQUE IND. AEROPUERTO 522,714.65 3,039.01
18 PARQUE INDUSTRIAL PIMSA INTERMEX 792,013.61 3,674.79
19 PARQUE IND. AEROJUAREZ 737,498.25 4,075.29
20 PARQUE INDUSTRIAL PANAMERICANO 416,598.16 3,606.06
21 INTERMEX INDUSTRIAL LAS TORRES 778,178.35 4,076.33
22 LAS TORRES INDUSTRAIL ZONE 10,550,240.70 14,585.78
23 PARQUE INDUSTRIAL AXIAL 428,962.91 3,018.05
24 PARQUE INDUSTRIAL SALVARCAR 414,168.49 2,569.45
25 CENTRO INDUSTRIAL JUAREZ 1,263,040.61 5,460.64
26 PARQUE INDUSTRIAL AMERICAS 320,498.06 2,305.95
27 PARQUE INDUSTRIAL INTERMEX SUR 929,523.99 3,869.42
28 PARQUE INDUSTRIAL ELECTROLUX 2,100,794.47 6,537.12
29 ZONA INDUSTRIAL THOMSON 330,919.89 2,436.43
30 VERDE INDEPENDENCIA INDUSTRIAL PARK 5,205,151.69 10,605.80
31 PUNTAL DEL ESTE INDUSTRIAL ZONE 2,865,397.95 15,248.87
32 IGS-PASO DEL NORTE INDUSTRIAL PARK 1,526,994.15 8,958.97
33 PROLOGIS INDEPENDENCIA INDUSTRIAL PARK 1,990,356.87 5995.02
Average 1,357,429.52 5,066.71
Minimum 83,429.60 1624.43
Maximum 10,550,240.70 15,248.87

60
The following figure shows different ranges of number of employees in the maquiladoras taken
from Instituto Nacional de Estadistica y Geografia (2011). The highest range indicates that
maquiladora employees have up to 5000 workers. The lowest range, on the contrary represents
maquiladoras with up to 100 employees. The numbers in the pie chart indicate the number of
maquiladoras that have the range of employees.
Figure 5.10 Number of employees in maquiladoras
5.2.2 Available Land
Real estate information for sale and lease of industrial property in Ciudad Juarez can be found in
the following tables and figure. The market information was provided by CBRE Global Research
and Consulting (2013b).
Table 5.8 Available Properties for Sale in Ciudad Juarez
NAME BLDG/LOT SIZE CATEGORY
KIT 43,900 ft2 Manufacturing
VERDE LAND AIRPORT 29.2 acre Industrial (Land)
VERDE LAND-AIRPORT WEST 21 acre Industrial (Land)
67
154
62
73
0-100
101-500
501-1000
1001-5000

61
Table 5.9 Available Properties for Lease in Ciudad Juarez
NAME BLDG/LOT SIZE (ft2) CATEGORY
COCLISA CHAMIZAL 309,135 Warehouse
FORMER GREENBAY BUILDING 83,278 Warehouse
O'DONNEL CALLE HORNOS 174,802 Manufacturing
O'DONNEL HENEQUEN V 79,700 Manufacturing
PANAMERICANO 3 103,644 Manufacturing
NORTHGATE I 59,901 Manufacturing

62
Figure 5.15 Available properties in Ciudad Juarez
5.3 Truck Origin-Destination in the El Paso-Juarez Region
Having obtained the locations of industrial lands/parcels in El Paso and Ciudad Juarez, the
following map is created to visualize the origins and destinations of truck trips in the region,
without the use of trip volume data. The origins and destinations include the industrial park near
the Santa Teresa POE at the western end of the region.
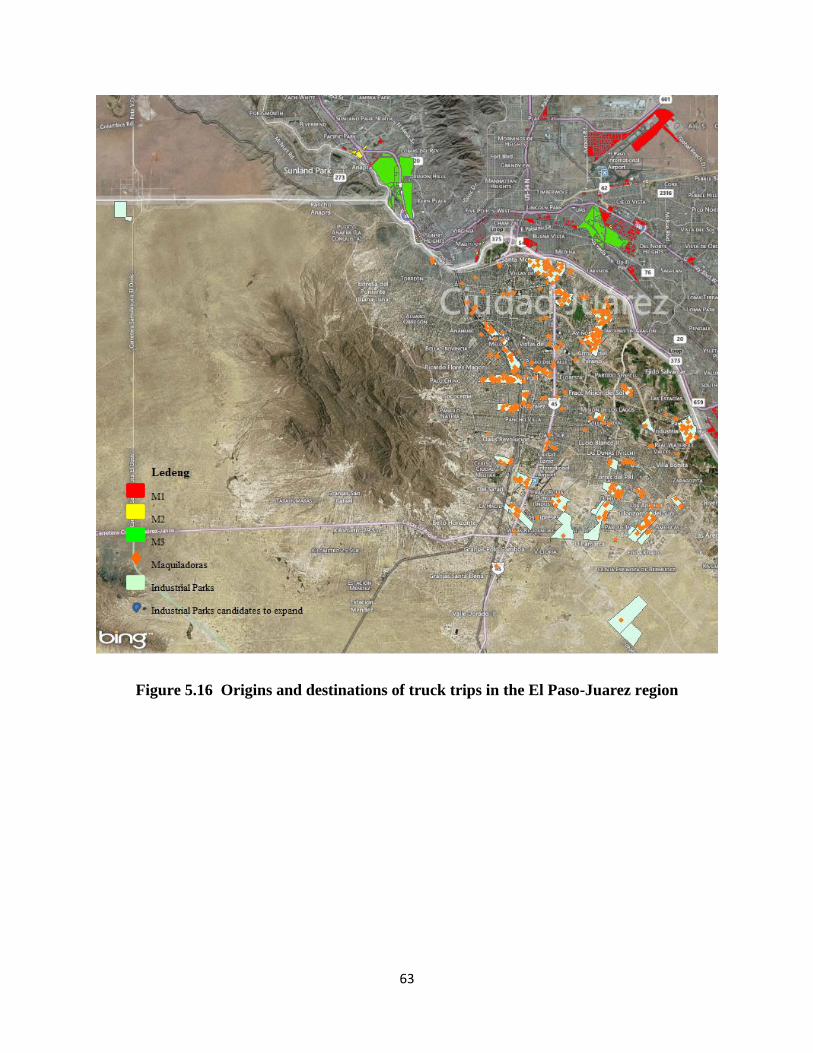
63
Figure 5.16 Origins and destinations of truck trips in the El Paso-Juarez region
64
6 Trip Generation Analysis
This chapter analyzes truck trip generation and attraction rates for warehouses and distribution
centers in El Paso. Truck volumes at four selected sites in El Paso were collected and then
correlated with land use attributes. The observed trip generation and attraction rates were
compared with the values calculated by the models recommended by the Trip Generation Manual
(ITE 2003). The purpose of this chapter is to gather information on truck trip generation rate in
El Paso, and to determine if the Trip Generation Manual can be used to predict the truck trip
generation rates in El Paso with reasonable accuracy.
6.1 Data Collection Sites
Four sites were selected in the City of El Paso. The criteria of site selection were:
1. Each site has a catchment consisted of predominantly warehouses and distribution centers
of M1 land use classification (as described in Figure 5.2); and
2. The site was the major entrance and exit for trucks to from the catchment.
The four sites and not more were selected for this project because of budget and time limitations.
In addition, there are also limited sites in the El Paso region that meet the selection criteria.
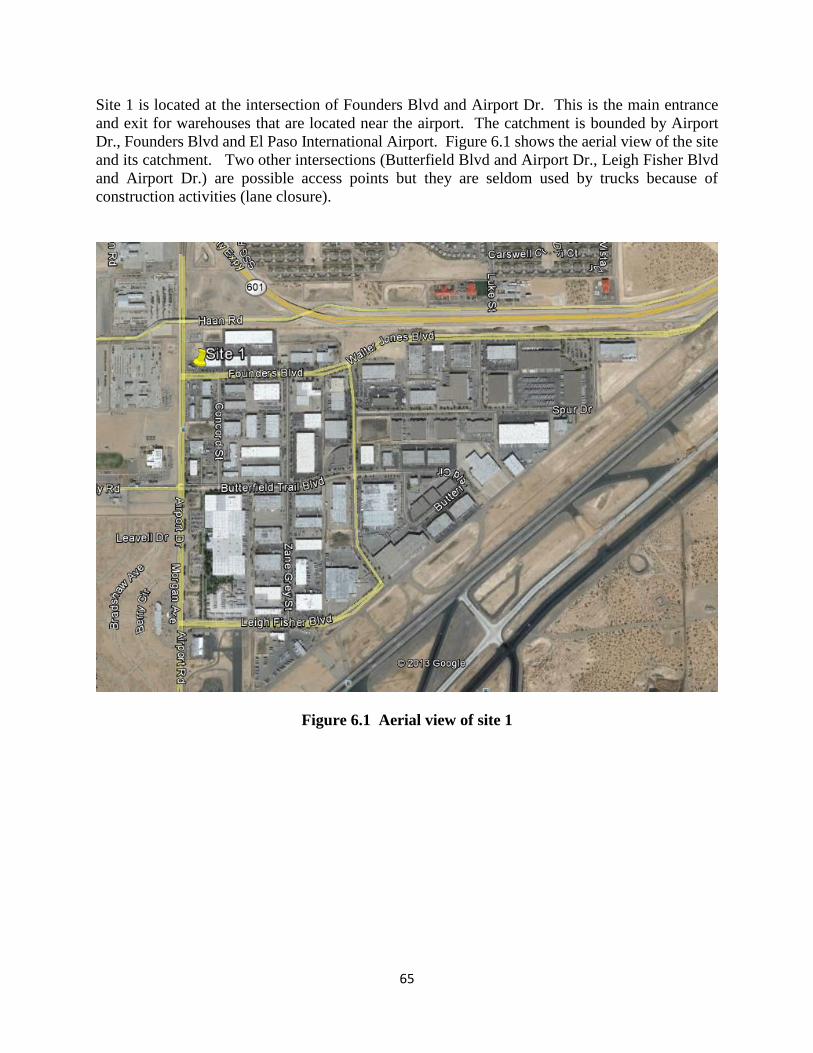
65
Site 1 is located at the intersection of Founders Blvd and Airport Dr. This is the main entrance
and exit for warehouses that are located near the airport. The catchment is bounded by Airport
Dr., Founders Blvd and El Paso International Airport. Figure 6.1 shows the aerial view of the site
and its catchment. Two other intersections (Butterfield Blvd and Airport Dr., Leigh Fisher Blvd
and Airport Dr.) are possible access points but they are seldom used by trucks because of
construction activities (lane closure).
Figure 6.1 Aerial view of site 1
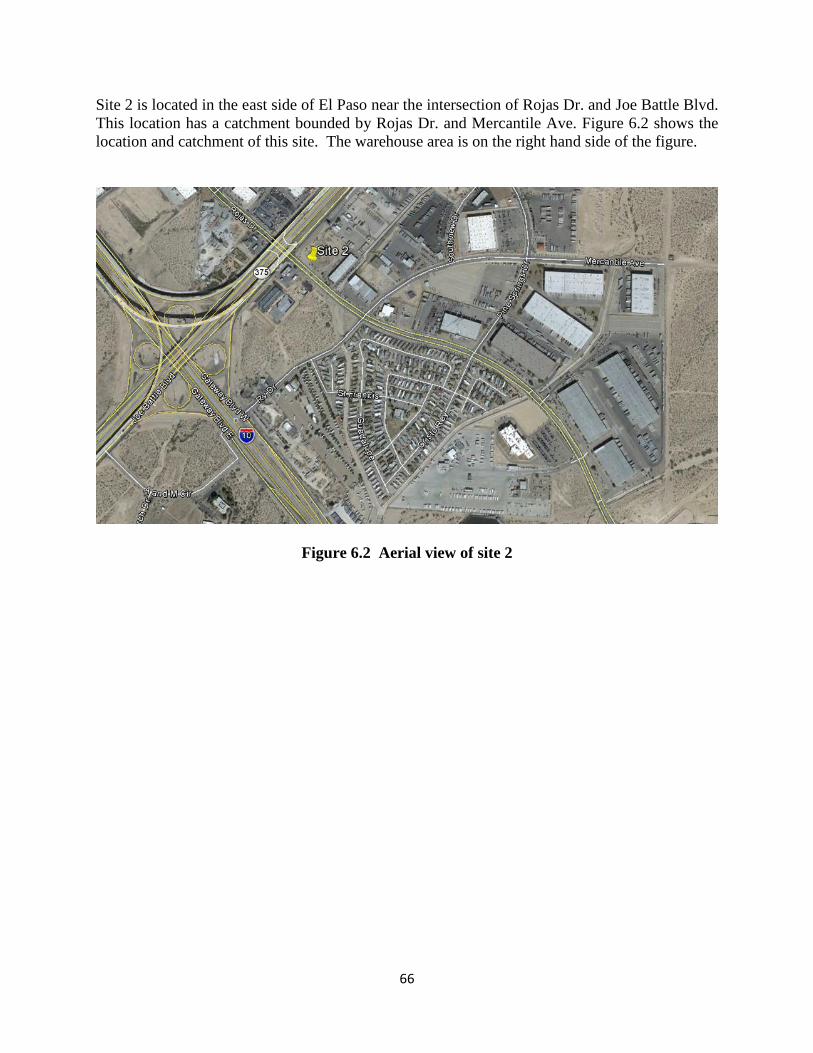
66
Site 2 is located in the east side of El Paso near the intersection of Rojas Dr. and Joe Battle Blvd.
This location has a catchment bounded by Rojas Dr. and Mercantile Ave. Figure 6.2 shows the
location and catchment of this site. The warehouse area is on the right hand side of the figure.
Figure 6.2 Aerial view of site 2

67
The third site (site 3) is also located in the east side of El Paso, near the intersection of Don Haskins
Dr. and Rojas Dr. This location was chosen because of the high volume of trucks traveling in the
out of the north approach of the intersection. Figure 6.3 shows the location of the site and part of
the catchment. The warehouse area is in the north of the intersection along Don Haskins Dr. From
a preliminary site reconnaissance rucks in this catchment area use Don Haskins Dr. to access the
I-10 Freeway.
Figure 6.3 Aerial view of site 3

68
Site 4 is located near the intersection of Pan American Dr. and Plaza Circle. The site is near the
interchange of Loop 375 Freeway (also known as the Cesar Chavez Border Highway) and Pan
American Dr. It is also near the Isleta-Zaragoza POE. Figure 6.4 shows the location of the site
and its catchment. This site was chosen because it is the only access point for trucks to enter and
exit the warehouses in the catchment area from the Loop 275 Freeway.
Figure 6.4 Aerial view of site 4
69
6.2 Data Collection Process
At each site, videos of traffic movements along the main road (in both directions) were recorded
from a parked vehicle. Videos of traffic movements were record for one week, on Monday,
Wednesday and Friday from 6:00 a.m. to 10:00 a.m. and from 12:00 p.m. to 3:00 p.m. (with the
exception of site 4 which lasted until 4:00 p.m.). The durations of video recordings were limited
by one camera and its battery life. These days and hours were recommended by staff in Kuehne
and Nagel, and the hours coincided with the opening hours of commercial lanes of the POEs.
Table 6.1 lists the dates and time for data collection.
The video was later replayed in the laboratory (in a desktop or laptop computer) so that trucks
were counted manually. Trucks have been divided into medium and large trucks depending on the
number of axles. Two axle trucks (including tandem rear axle trucks) were counted as medium
trucks while triple axle trucks (including trailer with or without a container) were counted as heavy
trucks. The only exception was truck tractors or caps (without towing a trailer) were considered
as heaving trucks, because their presence is related to heavy truck generations. That is, they were
going to warehouses to tow trailers, or coming from warehouses after dropping off trailers. Each
video file was replayed twice and counted by the same person, or once but counted by two persons,
so that medium and heavy trucks could be counted separately. Medium and heavy trucks volumes
were counted at every 15-minute intervals and then summarized into hourly volume. They were
further divided into outbound (trip generated) and outbound (trip attracted).
The hourly trends of medium and heavy trucks in the inbound and outbound directions were
analyzed. No distinct difference in the trends has been found. Therefore, in the subsequent
analysis the volumes of medium and heavy trucks were combined.
The counted hourly volumes of trucks were further processed as follows:
For each morning or afternoon observation period, the peak hour was identified, and
labeled as “maximum” volume.
For each morning or afternoon observation period, the average hourly volume was
identified, and labeled as “average” volume.
The processed volumes are summarized in Tables 6.2 and 6.3.
Table 6.1 Data Collection Dates and Times
Site Date Day Time 05/31/13 Friday 6:00 a.m.-10:00 a.m.
06/03/13 Monday 12:00 p.m.-3:00 p.m.
Site 1 06/05/13 Wednesday 12:00 p.m.-3:00 p.m.
06/07/13 Friday 12:00 p.m.-3:00 p.m.
06/10/13 Monday 6:00 a.m.-10:00 a.m.
06/19/13 Wednesday 8:00 a.m-10:00 a.m.
06/19/13 Wednesday 12:00 p.m.-3:00 p.m.

70
06/21/13 Friday 12:00 p.m.-3:00 p.m.
Site 2 06/24/13 Monday 6:00 a.m.-10:00 a.m.
06/24/13 Monday 12:00 p.m.-3:00 p.m.
06/26/13 Wednesday 6:00 a.m.-10:00 a.m.
06/28/13 Friday 6:00 a.m.-10:00 a.m.
07/10/13 Wednesday 6:00 a.m.-10:00 a.m.
07/12/13 Friday 6:00 a.m.-10:00 a.m.
Site 3 07/15/13 Monday 6:00 a.m.-10:00 a.m.
07/29/13 Friday 12:00 p.m.-3:00 p.m.
07/22/13 Monday 12:00 p.m.-3:00 p.m.
07/24/13 Wednesday 12:00 p.m.-3:00 p.m.
08/07/13 Wednesday 6:00 a.m.-10:00 a.m.
08/09/13 Friday 6:00 a.m.-10:00 a.m.
Site 4 08/12/13 Monday 6:00 a.m.-10:00 a.m.
08/14/13 Wednesday 12:00 p.m.-4:00 p.m.
08/16/13 Friday 12:00 p.m.-4:00 p.m.
08/19/13 Monday 12:00 p.m.-4:00 p.m.

71
Table 6.2 Summary of Truck Volume in the Morning Period
Site
Day of week
AM
average
inbound
volume
(veh/hr)
AM
maximum
inbound
volume
(veh/hr)
AM
average
outbound
volume
(veh/hr)
AM
maximum
outbound
volume
(veh/hr)
AM
average
inbound &
outbound
volume
(veh/hr)
AM
maximum
inbound &
outbound
volume
(veh/hr)
Monday 46 60 60 108 105 168
Site 1 Wednesday 28 34 43 93 71 125
Friday 38 47 60 110 98 157
Monday 65 83 48 64 113 141
Site 2 Wednesday 33 43 33 44 66 82
Friday 49 67 34 50 82 116
Monday 35 55 26 44 61 99
Site 3 Wednesday 28 51 24 44 52 95
Friday 30 45 25 50 55 95
Monday 39 60 27 53 66 113
Site 4 Wednesday 26 41 20 40 46 76
Friday 33 50 26 42 58 91
Table 6.3 Summary of Truck Volume in the Afternoon Period
Site
Day of week
PM
average
inbound
volume
(veh/hr)
PM
maximum
inbound
volume
(veh/hr)
PM
average
outbound
volume
(veh/hr)
PM
maximum
outbound
volume
(veh/hr)
PM
average
inbound &
outbound
volume
(veh/hr)
PM
maximum
inbound &
outbound
volume
(veh/hr)
Monday 53 59 76 82 128 141
Site 1 Wednesday 51 53 63 74 114 125
Friday 42 49 67 71 117 119
Monday 56 62 38 43 94 105
Site 2 Wednesday 72 85 44 51 116 121
Friday 62 66 49 51 110 117
Monday 53 57 62 71 115 128
Site 3 Wednesday 57 68 65 68 122 133
Friday 69 75 69 79 138 154
Monday 38 43 38 42 74 85
Site 4 Wednesday 50 58 49 60 99 117
Friday 50 52 49 54 99 105
72
6.3 Trip Generation Modeling
6.3.1 Land Use Attributes
Trips generation (and attraction) models predict vehicle volume using land use attributes such as
land area, floor area and number of employees. The model is usually a simple linear equation
with volume in vehicles per hour as the dependent variable and only one land use attribute as the
independent variable.
From the National Cooperative Highway Research Report (NCHRP) 739 and National
Cooperative Freight Research Report (NCFRP) 19 (Holguin-Veras et al., 2012), the number of
employees appears to be the best predictor of truck trip generation rate. However, the data on the
number of employee of trucking companies and warehouse facilities in El Paso is incomplete (see
Tables 5.2 and 5.3, for examples). The data provided by Hoover’s Inc. (2013) does not list all the
facilities that are within the catchment areas of the four sites. Of the data provided, the numbers
of employee of some companies are missing. Therefore, the number of employees cannot be used
as an independent variable in trip generation. The alternatives are total parcel area (in acre) and
total building area (in acre) which can be measured from GIS maps.
The catchment land area of each of the four sites were measured from a polygon drawn to cover
the parcels from which trucks were generated (or attracted) and passed through the counting
location. The sum of areas from all the parcels was taken as the total parcel area. Figures 6.5 to
6.8 show the polygons of the sites. The building area within each catchment was measured from
the footprint of the aerial photograph, assuming all the facilities are single story. Table 6.4
summarizes the land areas and the building areas of the four sites.
Table 6.4 Land Area and Building Area
Site Total parcel area (acre) Total building area (acre)
1 492 209
2 81 28
3 118 48
4 121 53

73
The parcels that are not included are call centers or empty plots.
Figure 6.5 Parcels that generate truck trips at site 1

74
The parcels that are not included are schools.
Figure 6.6 Parcels that generate truck trips at site 2
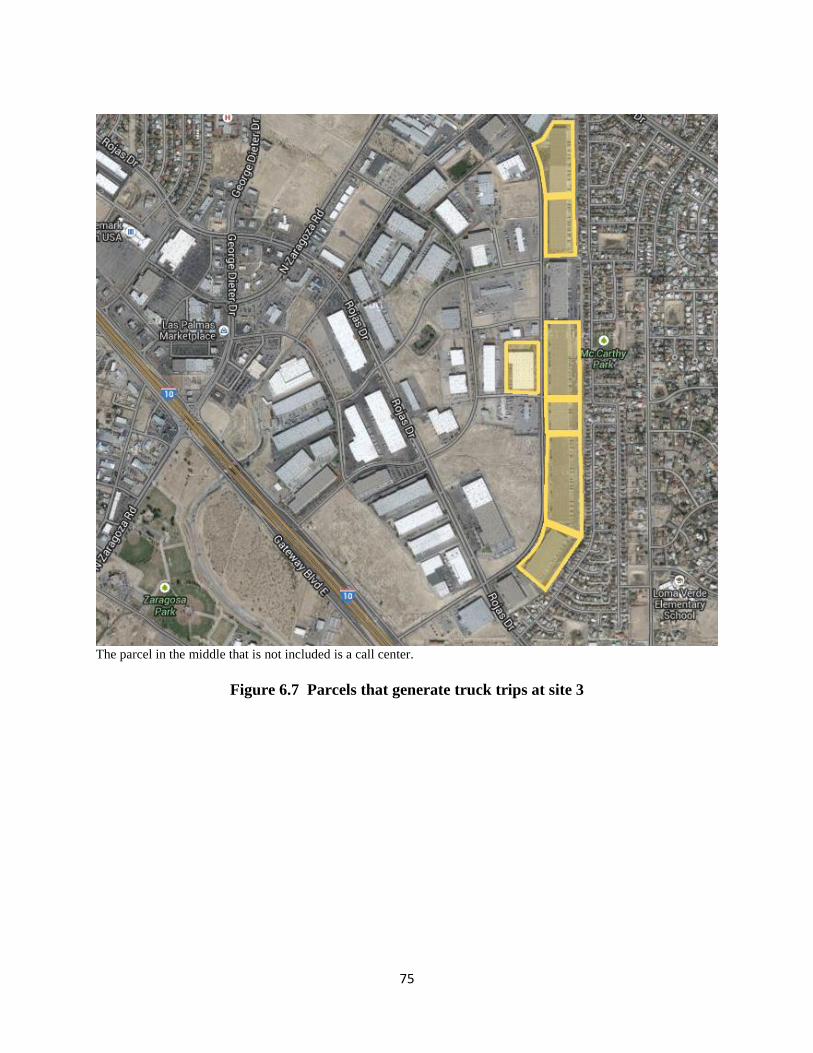
75
The parcel in the middle that is not included is a call center.
Figure 6.7 Parcels that generate truck trips at site 3
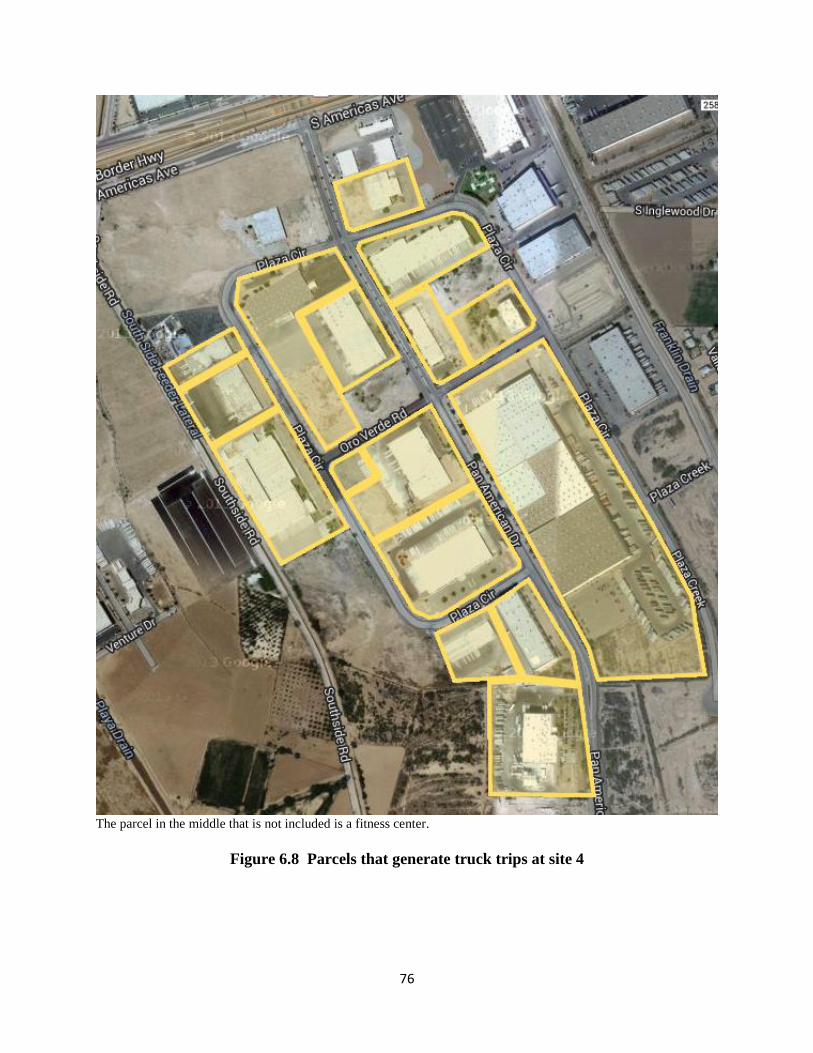
76
The parcel in the middle that is not included is a fitness center.
Figure 6.8 Parcels that generate truck trips at site 4

77
6.3.2 Trip Generation Rates
Figures 6.9 to 6.12 plot the observed maximum hourly volume against the total parcel area or total
building area. Since there are four sites, and each site was observed on a Monday, a Wednesday
and a Friday, there are 12 data points in each plot. Data for the morning and afternoon periods are
presented in separate figures. Each figure is further divided into three plots for inbound volume,
outbound volume and inbound and outbound volume, respectively.
From these figures it can be concluded that only the outbound volume is correlated with the total
parcel area and total building area. The inbound volume appears relatively independent from the
catchment’s the total parcel area and total building area. Because of this the total inbound and
outbound volume is also relatively uncorrelated with the total parcel area and total building area.
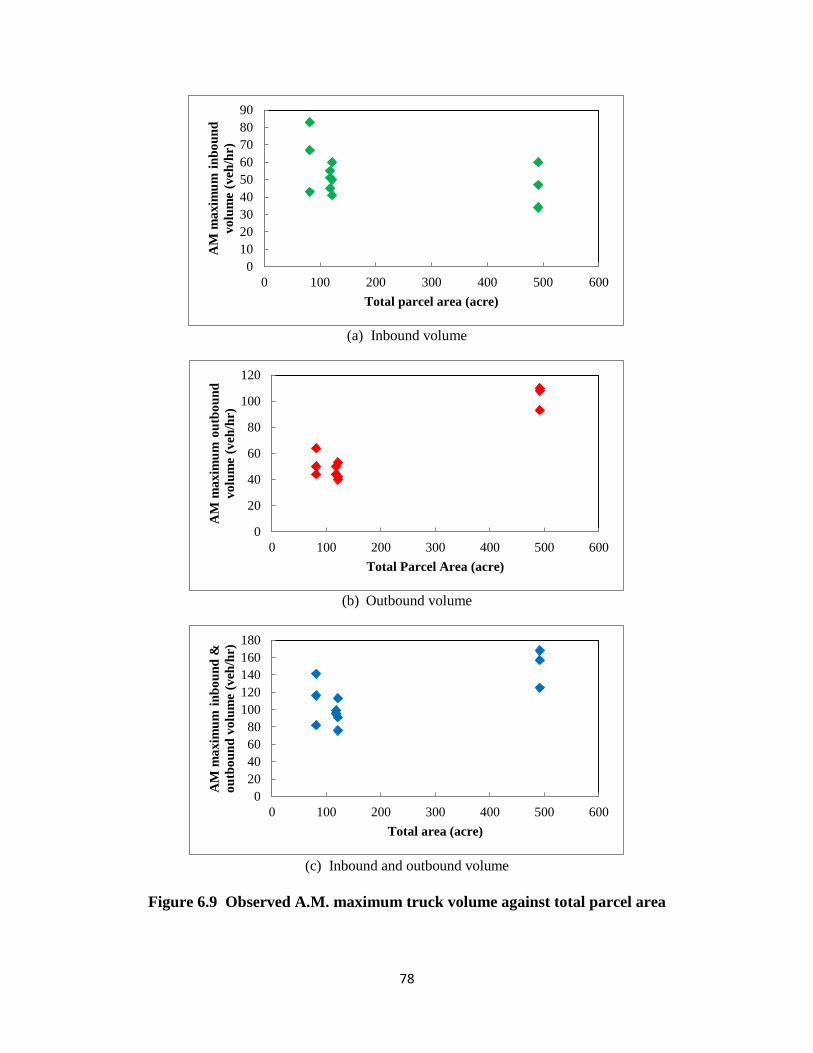
78
(a) Inbound volume
(b) Outbound volume
(c) Inbound and outbound volume
Figure 6.9 Observed A.M. maximum truck volume against total parcel area
0
10
20
30
40
50
60
70
80
90
0 100 200 300 400 500 600
AM
ma
xim
um
in
bo
un
d
vo
lum
e (v
eh/h
r)
Total parcel area (acre)
0
20
40
60
80
100
120
0 100 200 300 400 500 600
AM
ma
xim
um
ou
tbo
un
d
vo
lum
e (v
eh/h
r)
Total Parcel Area (acre)
0
20
40
60
80
100
120
140
160
180
0 100 200 300 400 500 600
AM
ma
xim
um
in
bo
un
d &
ou
tbo
un
d v
olu
me
(veh
/hr)
Total area (acre)
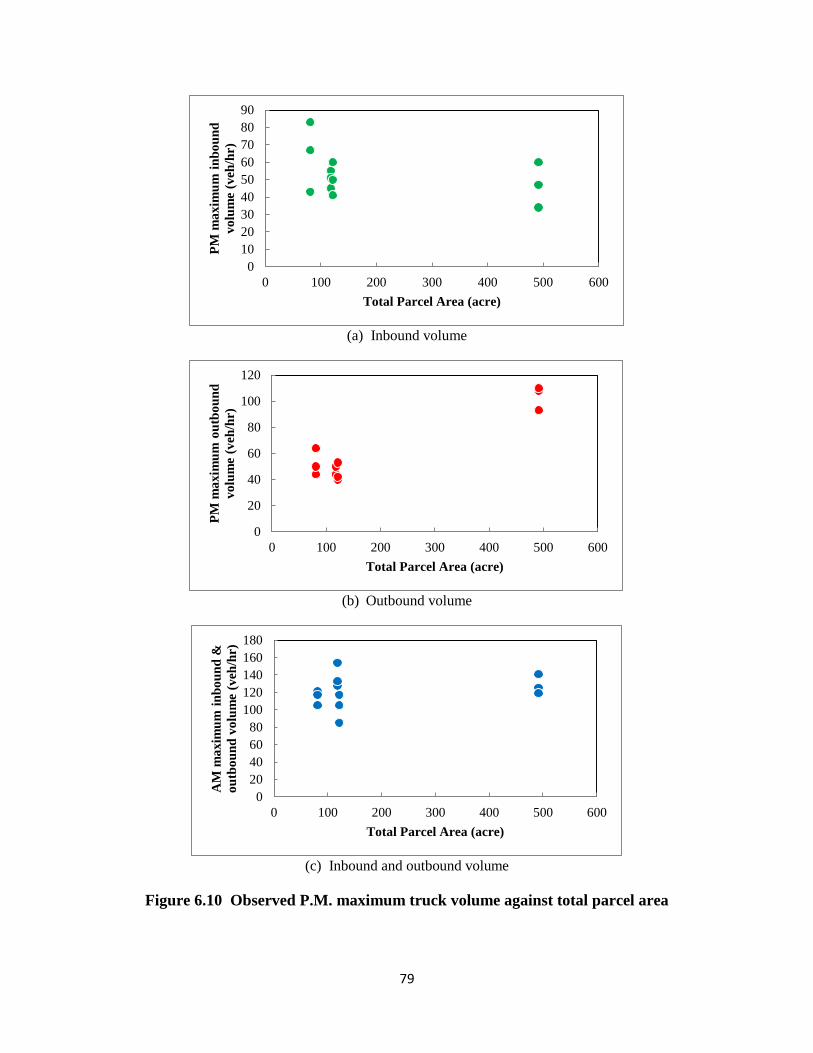
79
(a) Inbound volume
(b) Outbound volume
(c) Inbound and outbound volume
Figure 6.10 Observed P.M. maximum truck volume against total parcel area
0
10
20
30
40
50
60
70
80
90
0 100 200 300 400 500 600
PM
ma
xim
um
in
bo
un
d
vo
lum
e (v
eh/h
r)
Total Parcel Area (acre)
0
20
40
60
80
100
120
0 100 200 300 400 500 600
PM
ma
xim
um
ou
tbo
un
d
vo
lum
e (v
eh/h
r)
Total Parcel Area (acre)
0
20
40
60
80
100
120
140
160
180
0 100 200 300 400 500 600
AM
ma
xim
um
in
bo
un
d &
ou
tbo
un
d v
olu
me
(veh
/hr)
Total Parcel Area (acre)

80
(a) Inbound volume
(b) Outbound volume
(c) Inbound and outbound volume
Figure 6.11 Observed A.M. maximum truck volume against total building area
0
10
20
30
40
50
60
70
80
90
0 2000 4000 6000 8000 10000
AM
ma
xim
um
in
bo
un
d
vo
lum
e (v
eh/h
r)
Total Building Area (1000 ft2)
0
20
40
60
80
100
120
0 2000 4000 6000 8000 10000
AM
ma
xim
um
ou
tbo
un
d
vo
lum
e (v
eh/h
r)
Total Building Area (ft2)
0
20
40
60
80
100
120
140
160
180
0 2000 4000 6000 8000 10000
AM
ma
xim
um
in
bo
un
d &
ou
tbo
un
d v
olu
me
(veh
/hr)
Total Building Area (ft2)

81
(a) Inbound volume
(b) Outbound volume
(c) Inbound and outbound volume
Figure 6.12 Observed P.M. maximum truck volume against total building
0
10
20
30
40
50
60
70
80
90
0 2000 4000 6000 8000 10000
PM
ma
xim
um
in
bo
un
d
vo
lum
e (v
eh/h
r)
Total Building Area (ft2)
0
20
40
60
80
100
120
0 2000 4000 6000 8000 10000
PM
ma
xim
um
ou
tbo
un
d
vo
lum
e (v
eh/h
r)
Total Building Area (ft2)
0
20
40
60
80
100
120
140
160
180
0 2000 4000 6000 8000 10000
AM
ma
xim
um
in
bo
un
d &
ou
tbo
un
d v
olu
me
(veh
/hr)
Total Building Area (ft2)

82
6.3.3 Comparison with ITE Trip Generation Models
This sub-section compares the selected trip generation rates with the corresponding models found
in ITE Trip Generation Manual (ITE 2003). Among the many land use classifications presented
in the ITE Trip Generation Manual, the followings were found to be closest to the M1 classification
in El Paso and at the four data collection sites:
General light industrial (code 110)
Industrial park (130)
Warehousing (150)
The following models were extracted from the ITE Trip Generation Manual and used in this
comparison. The equations apply to average A.M. or average P.M. peak hours on weekday.
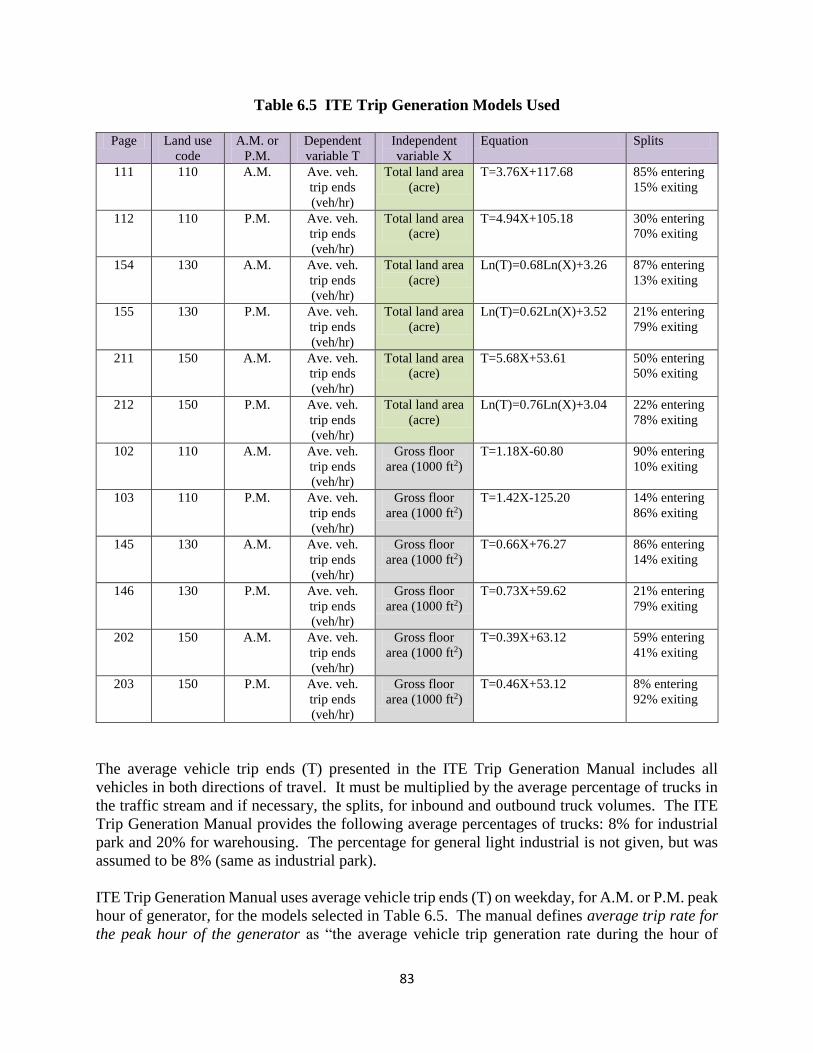
83
Table 6.5 ITE Trip Generation Models Used
Page Land use
code
A.M. or
P.M.
Dependent
variable T
Independent
variable X
Equation Splits
111 110 A.M. Ave. veh.
trip ends
(veh/hr)
Total land area
(acre)
T=3.76X+117.68 85% entering
15% exiting
112 110 P.M. Ave. veh.
trip ends
(veh/hr)
Total land area
(acre)
T=4.94X+105.18 30% entering
70% exiting
154 130 A.M. Ave. veh.
trip ends
(veh/hr)
Total land area
(acre)
Ln(T)=0.68Ln(X)+3.26 87% entering
13% exiting
155 130 P.M. Ave. veh.
trip ends
(veh/hr)
Total land area
(acre)
Ln(T)=0.62Ln(X)+3.52 21% entering
79% exiting
211 150 A.M. Ave. veh.
trip ends
(veh/hr)
Total land area
(acre)
T=5.68X+53.61 50% entering
50% exiting
212 150 P.M. Ave. veh.
trip ends
(veh/hr)
Total land area
(acre)
Ln(T)=0.76Ln(X)+3.04 22% entering
78% exiting
102 110 A.M. Ave. veh.
trip ends
(veh/hr)
Gross floor
area (1000 ft2)
T=1.18X-60.80 90% entering
10% exiting
103 110 P.M. Ave. veh.
trip ends
(veh/hr)
Gross floor
area (1000 ft2) T=1.42X-125.20 14% entering
86% exiting
145 130 A.M. Ave. veh.
trip ends
(veh/hr)
Gross floor
area (1000 ft2) T=0.66X+76.27 86% entering
14% exiting
146 130 P.M. Ave. veh.
trip ends
(veh/hr)
Gross floor
area (1000 ft2) T=0.73X+59.62 21% entering
79% exiting
202 150 A.M. Ave. veh.
trip ends
(veh/hr)
Gross floor
area (1000 ft2) T=0.39X+63.12 59% entering
41% exiting
203 150 P.M. Ave. veh.
trip ends
(veh/hr)
Gross floor
area (1000 ft2) T=0.46X+53.12 8% entering
92% exiting
The average vehicle trip ends (T) presented in the ITE Trip Generation Manual includes all
vehicles in both directions of travel. It must be multiplied by the average percentage of trucks in
the traffic stream and if necessary, the splits, for inbound and outbound truck volumes. The ITE
Trip Generation Manual provides the following average percentages of trucks: 8% for industrial
park and 20% for warehousing. The percentage for general light industrial is not given, but was
assumed to be 8% (same as industrial park).
ITE Trip Generation Manual uses average vehicle trip ends (T) on weekday, for A.M. or P.M. peak
hour of generator, for the models selected in Table 6.5. The manual defines average trip rate for
the peak hour of the generator as “the average vehicle trip generation rate during the hour of
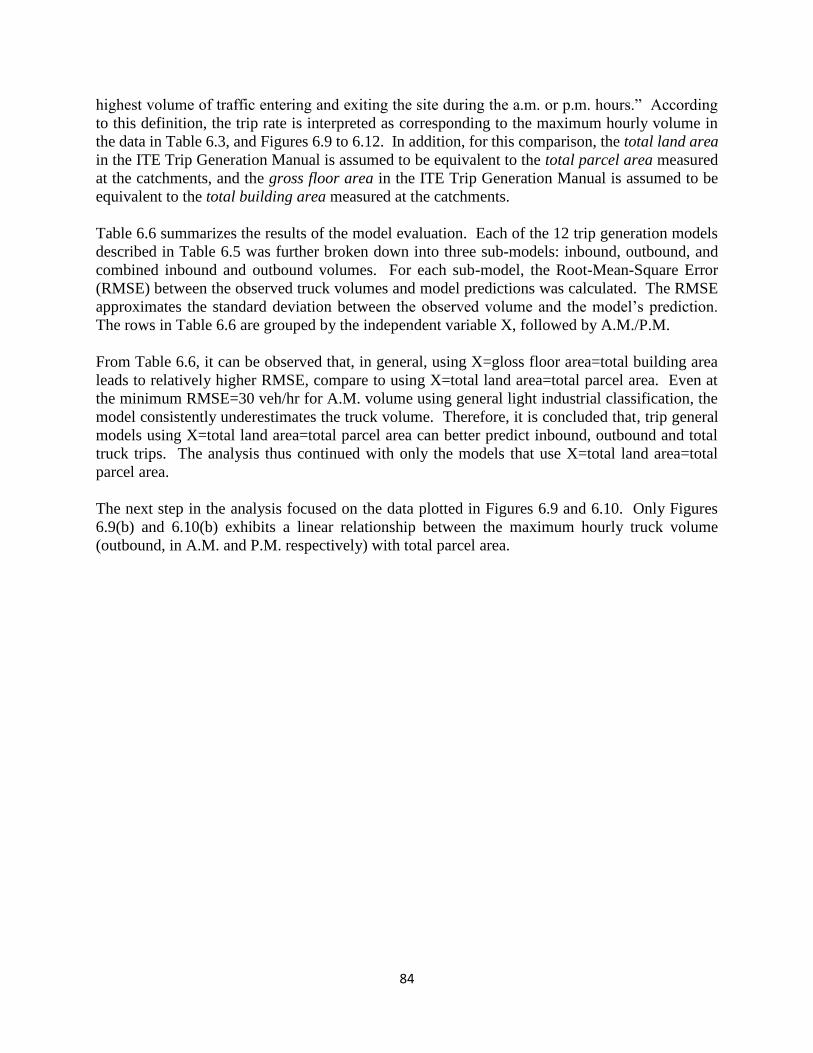
84
highest volume of traffic entering and exiting the site during the a.m. or p.m. hours.” According
to this definition, the trip rate is interpreted as corresponding to the maximum hourly volume in
the data in Table 6.3, and Figures 6.9 to 6.12. In addition, for this comparison, the total land area
in the ITE Trip Generation Manual is assumed to be equivalent to the total parcel area measured
at the catchments, and the gross floor area in the ITE Trip Generation Manual is assumed to be
equivalent to the total building area measured at the catchments.
Table 6.6 summarizes the results of the model evaluation. Each of the 12 trip generation models
described in Table 6.5 was further broken down into three sub-models: inbound, outbound, and
combined inbound and outbound volumes. For each sub-model, the Root-Mean-Square Error
(RMSE) between the observed truck volumes and model predictions was calculated. The RMSE
approximates the standard deviation between the observed volume and the model’s prediction.
The rows in Table 6.6 are grouped by the independent variable X, followed by A.M./P.M.
From Table 6.6, it can be observed that, in general, using X=gloss floor area=total building area
leads to relatively higher RMSE, compare to using X=total land area=total parcel area. Even at
the minimum RMSE=30 veh/hr for A.M. volume using general light industrial classification, the
model consistently underestimates the truck volume. Therefore, it is concluded that, trip general
models using X=total land area=total parcel area can better predict inbound, outbound and total
truck trips. The analysis thus continued with only the models that use X=total land area=total
parcel area.
The next step in the analysis focused on the data plotted in Figures 6.9 and 6.10. Only Figures
6.9(b) and 6.10(b) exhibits a linear relationship between the maximum hourly truck volume
(outbound, in A.M. and P.M. respectively) with total parcel area.
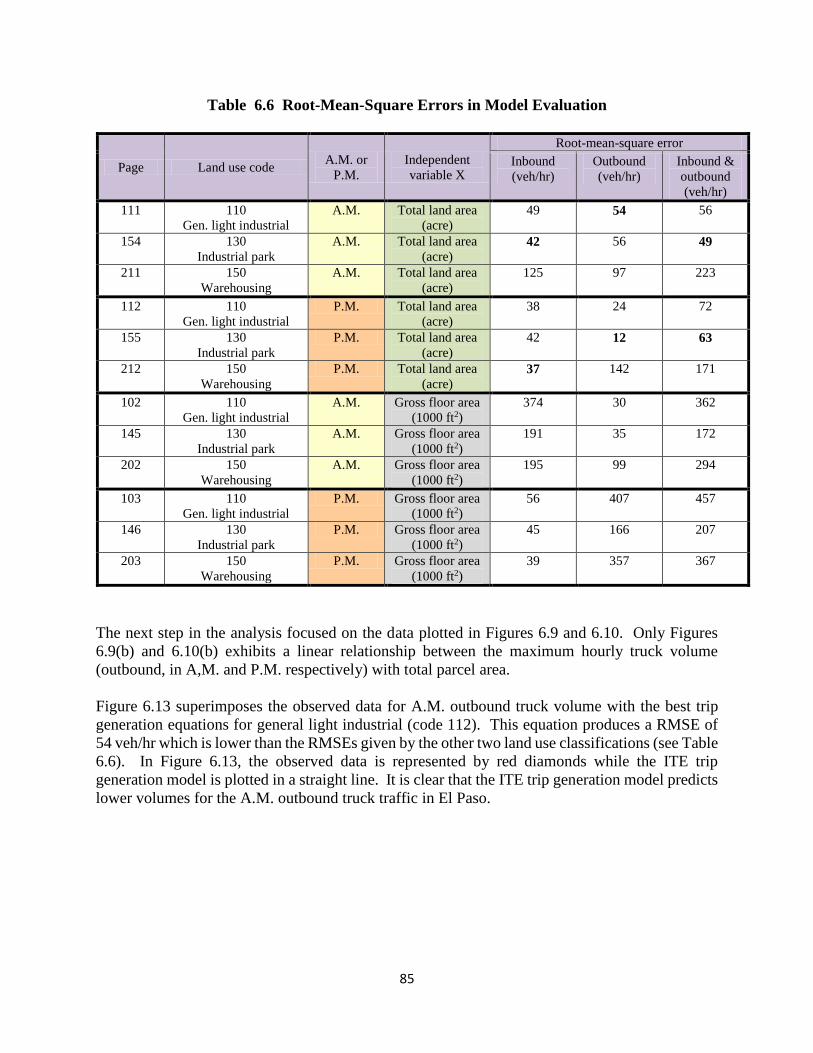
85
Table 6.6 Root-Mean-Square Errors in Model Evaluation
Page Land use code A.M. or
P.M.
Independent
variable X
Root-mean-square error
Inbound
(veh/hr)
Outbound
(veh/hr)
Inbound &
outbound
(veh/hr)
111 110
Gen. light industrial
A.M. Total land area
(acre)
49 54 56
154 130
Industrial park
A.M. Total land area
(acre) 42 56 49
211 150
Warehousing
A.M. Total land area
(acre)
125
97
223
112 110
Gen. light industrial
P.M. Total land area
(acre)
38 24 72
155 130
Industrial park
P.M. Total land area
(acre)
42 12 63
212 150
Warehousing
P.M. Total land area
(acre) 37
142 171
102 110
Gen. light industrial
A.M. Gross floor area
(1000 ft2)
374 30 362
145 130
Industrial park
A.M. Gross floor area
(1000 ft2) 191 35 172
202 150
Warehousing
A.M. Gross floor area
(1000 ft2) 195
99 294
103 110
Gen. light industrial
P.M. Gross floor area
(1000 ft2) 56 407 457
146 130
Industrial park
P.M. Gross floor area
(1000 ft2) 45 166 207
203 150
Warehousing
P.M. Gross floor area
(1000 ft2) 39 357 367
The next step in the analysis focused on the data plotted in Figures 6.9 and 6.10. Only Figures
6.9(b) and 6.10(b) exhibits a linear relationship between the maximum hourly truck volume
(outbound, in A,M. and P.M. respectively) with total parcel area.
Figure 6.13 superimposes the observed data for A.M. outbound truck volume with the best trip
generation equations for general light industrial (code 112). This equation produces a RMSE of
54 veh/hr which is lower than the RMSEs given by the other two land use classifications (see Table
6.6). In Figure 6.13, the observed data is represented by red diamonds while the ITE trip
generation model is plotted in a straight line. It is clear that the ITE trip generation model predicts
lower volumes for the A.M. outbound truck traffic in El Paso.
86
Figure 6.13 A.M. maximum truck volume against total parcel area: observed data versus
ITE trip generation model
Figure 6.14 superimposes the observed data for P.M. outbound truck volume with the best trip
generation equations for industrial park (code 155). This equation produces a RMSE of 12 veh/hr
which is lower than the RMSEs given by the other two land use classifications (see Table 6.6). In
Figure 6.14, the observed data is represented by red circles while the ITE trip generation model is
plotted in a line. The plotted line is not linear because the trip generation equation is in the log-
log format (see Table 6.5). The ITE trip generation model appears to provide a good fit to the
P.M. outbound truck traffic in El Paso.
0
20
40
60
80
100
120
0 100 200 300 400 500 600
AM
ma
xim
um
ou
tbo
un
d v
olu
me
(veh
/hr)
Total Parcel Area (acre)
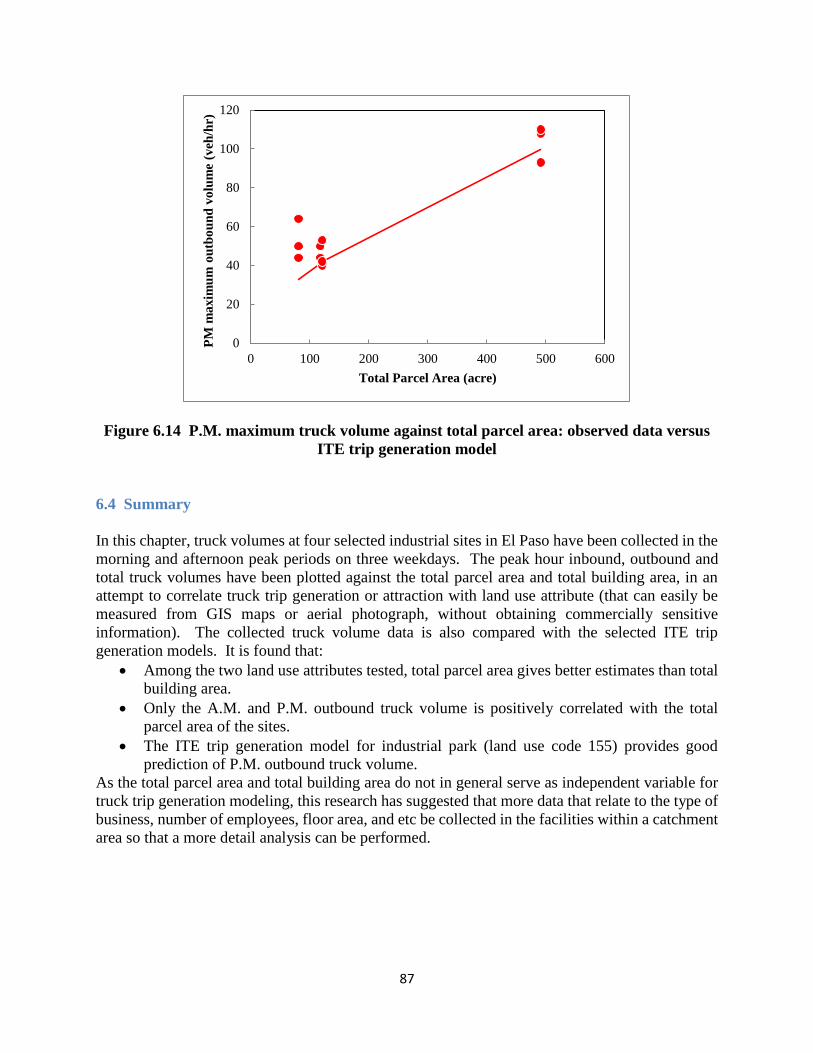
87
Figure 6.14 P.M. maximum truck volume against total parcel area: observed data versus
ITE trip generation model
6.4 Summary
In this chapter, truck volumes at four selected industrial sites in El Paso have been collected in the
morning and afternoon peak periods on three weekdays. The peak hour inbound, outbound and
total truck volumes have been plotted against the total parcel area and total building area, in an
attempt to correlate truck trip generation or attraction with land use attribute (that can easily be
measured from GIS maps or aerial photograph, without obtaining commercially sensitive
information). The collected truck volume data is also compared with the selected ITE trip
generation models. It is found that:
Among the two land use attributes tested, total parcel area gives better estimates than total
building area.
Only the A.M. and P.M. outbound truck volume is positively correlated with the total
parcel area of the sites.
The ITE trip generation model for industrial park (land use code 155) provides good
prediction of P.M. outbound truck volume.
As the total parcel area and total building area do not in general serve as independent variable for
truck trip generation modeling, this research has suggested that more data that relate to the type of
business, number of employees, floor area, and etc be collected in the facilities within a catchment
area so that a more detail analysis can be performed.
0
20
40
60
80
100
120
0 100 200 300 400 500 600
PM
ma
xim
um
ou
tbo
un
d v
olu
me
(veh
/hr)
Total Parcel Area (acre)
88
7 Conclusions
In this research, a literature review on freight activity planning and freight data sources has been
conducted. For the El Paso-Juarez region, interviews and questionnaire survey with local industry
stakeholders to understand the process of transporting goods across the U.S.-Mexico border, their
choices of warehouse and transportation facilities. The research has collected information
concerning trucking and warehouse activities in the El Paso-Juarez region, and whenever possible
organized into GIS maps. Economic market in El Paso and Ciudad Juarez for industrial activity
is also described in this report. This report represents the most comprehensive compilation of
freight, warehousing and trucking activities in the region.
To supplement the data collected from existing sources, truck volume counts were performed at
four selected industrial sites in El Paso. The counted traffic volumes in the morning and evening
peaks were correlated with the land use attributes, using site’s total building area as well as total
parcel area as the independent variable. The observed truck volumes were also compared with the
ITE trip generation models. It was found that (i) only the total parcel area provides good
predictions of the afternoon peak outbound truck volumes leaving the sites; (ii) the ITE trip
generation model for industrial park (land use code 155) provides good predictions of the afternoon
peak outbound truck volumes. Because of these findings, it is recommended that more detailed
data concerning industry type and number of employees be collected to develop truck trip
generation and attraction models with better accuracy. However, this will involve massive data
collection effort.
89
References
Al Dia editors. (2011). “Made in Mexico.” Ciudad Juarez , Chihuahua, Mexico.
Cambridge Systematics. (2011). El Paso Regional Ports of Entry Operations Plan. Austin, Texas.
Caviness-Tantimonaco, S. and Hernandez, S. (2013). Commercial Cross-Border Traffic at BOTA
Survey., City of El Paso, Texas.
CBRE Global Research and Consulting. (2013a). El Paso , Industrial MarketView. 1–4.
http://www.cbre.com/EN/research/Pages/default.aspx. (May 8, 2013).
CBRE Global Research and Consulting. (2013b). “Available Properties - El Paso-Ciudad Juarez.”
<http://www.cbre.us/o/elpaso/Pages/search-for-properties.aspx> (May 8, 2013).
Christensen Associates, Grow & Bruening, Bret, K. H. S. (2012). Preserving and Protecting
Freight Infrastructure and Routes. National Cooperative Freight Research Program Report
16, Transportation Research Board.
City of El Paso. (2013). “International Bridges.” <http://home.elpasotexas.gov/bridges/> (May 7,
2013).
Desarrollo Economico de Ciudad Juarez. (2011). “Juarez Invenst.” Interactive Map,
<http://www.juarezinvest.com/maquilas/maquilas.html>. (May 7, 2013).
Google. (2013). “Google Earth.” <http://www.google.com/earth/index.html> (May. 7, 2013).
Holguin-Veras, J., Jaller, M., Sanchez-Diaz, I., Wojtowicz, J., Campbell, S., Levinson, H., Lawson,
C., Powers, E. L., Tavasszy. (2012). Freight Trip Generation and Land Use. National
Cooperative Highway Research Program Report 739 and National Cooperative Freight
Research Program Report 19, Transportation Research Board.
Hoover’s Inc. (2013). “Hoovers Company Information Industry Information Lists.”
<http://www.hoovers.com> (May 16, 2013).
Instituto Nacional de Estadistica y Geografia. (2011). “INEGI.” <http://www.inegi.org.mx/>.
(May 15, 2013).
ITE (2003). Trip Generation, 7th Edition, Institution of Transportation Engineers.
Kuehne and Nagel. (2013). “Kuehne and Nagel Inc-El Paso.” El Paso.
Municipal Code Corporation. (2013). “Municode.”
<http://library.municode.com/index.aspx?clientId=16180&startPage=/HTML/16180/level2/
TIT20ZO_CH20.06ZODIMA.html> (May. 6, 2013).
90
Ojah, M. I., Villa, J. C., Stockton, W. R., Luskin, D. M., and Harrison, R. (2002). Truck
Transportation through Border Ports of Entry: Analysis of Coordination Systems. College
Station, TX.
REDCo. (2013). “FastGIS.”
<http://www.giswebhosting.com/fastfacility/elpasoflex/?Site=35876&Lat=31.8113575&Lo
n=-106.3921242&Address=47 Butterfield&City=El Paso&State=TX&Name=47
Butterfield&Size=123955&nSize=Sq.Ft.&GIS=35876A.jpg&Image3.x=9&Image3.y=4>
(May. 7, 2013).
Regional Geospatial Service Center. (2013). “Paso del Norte Mapa.” The University of Texas at
El Paso. <http://www.pdnmapa.org/> (May. 6, 2013).
Rhodes, S. S., Berndt, M., Bingham, P., Bryan, J., Cherrett, T. J., Plumeau, P., Weisbrod, R. (2012).
Guidebook for Understanding Urban Goods Movement. National Cooperative Freight
Research Program Report 14, Transportation Research Board.
Texas Department of Transportation. (2011). “Traffic Volume Count.” TxDOT El Paso District.
Texas Department of Transportation. (2013). “Crash Reports and Records.”
<http://www.txdot.gov/driver/laws/crash-reports.html> (May. 6, 2013).
Top Related