


Languages
Pages
Legal


VoIP: Telecom Services Sector Impacts
CITI WorkshopMay 25, 2004
CITI WorkshopMay 25, 2004
Glen CampbellTelecom & Cable Analyst
Merrill Lynch Canada
Glen CampbellTelecom & Cable Analyst
Merrill Lynch Canada

2
Everything Over IP: The Direction is Clear
THE PAST:
Applications tied to purpose-built networks
Cable TV and phone service as natural monopolies
Billing based on time and distance
Broadband as a value added service
Regulation focuses on voice as essential service
THE FUTURE:
Applications separate from the network
Multiple application providers; two or more BB networks
Billing based on bandwidth and applications
Broadband is the new core service
Regulation focuses on broadband availability
3
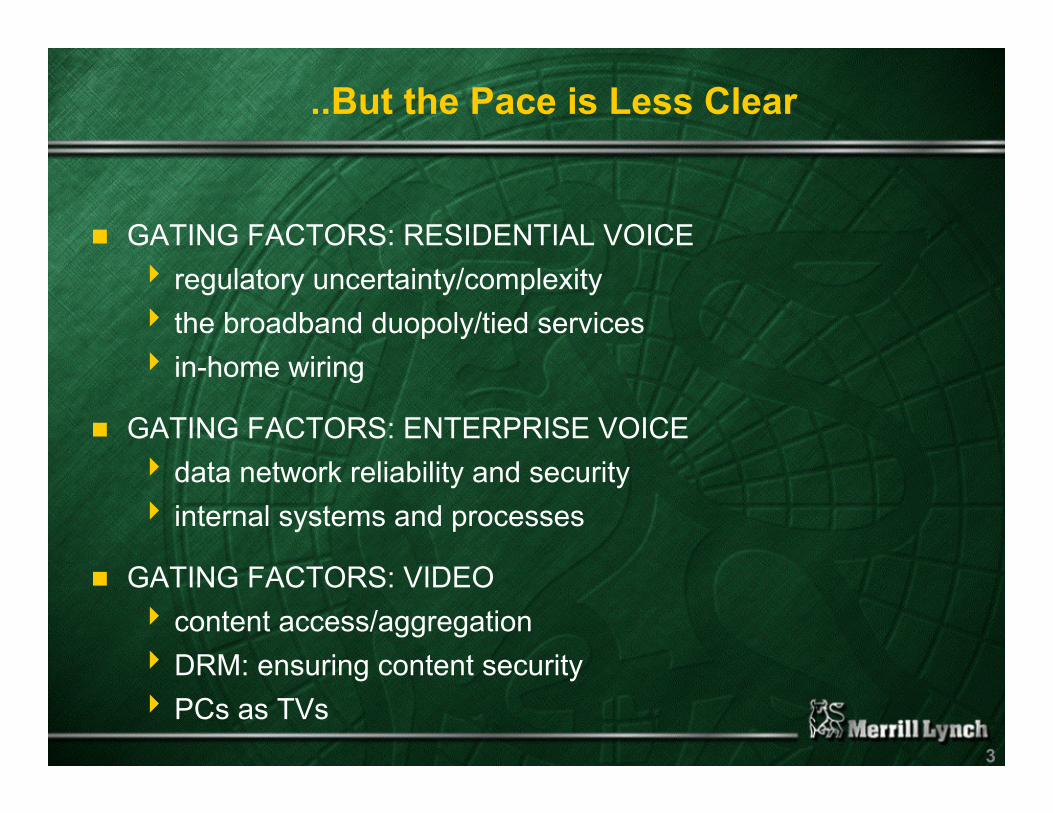
..But the Pace is Less Clear
GATING FACTORS: RESIDENTIAL VOICE4 regulatory uncertainty/complexity4 the broadband duopoly/tied services4 in-home wiring
GATING FACTORS: ENTERPRISE VOICE4 data network reliability and security4 internal systems and processes
GATING FACTORS: VIDEO4 content access/aggregation4DRM: ensuring content security4 PCs as TVs

4
Who Will Play?
���������������������������������������������
���������������������������������������������
���������������������������������������������
��������������������������������������������������������������������������������������������������������������������������������������
�����������������������������������������������������������������������������������������
�����������������������������������������������������������������������������������������
��������������������������������������������������������������������������������������������������������������������������������������
���������������������������������������������
������������������������������������������������������������������������������������������
���������������������������������������������
������������������������������������������������������������������������������������������
���������������������������������������������
������������������������������������������������������������������������������������������
���������������������������������������������
���������������������������������������������
���������������������������������������������
���������������������������������������������
���������������������������������������������
�������������������������
�������������������������
�������������������������
�������������������������
�������������������������
�������������������������
�������������������������
�������������������������
IXCs and Telcos "Virtual" In-House/Resellers CLECs X-Region Cablecos Operators IT Services
ResidentialSMEEnterprise
Competition: Established Emerging Potential
5
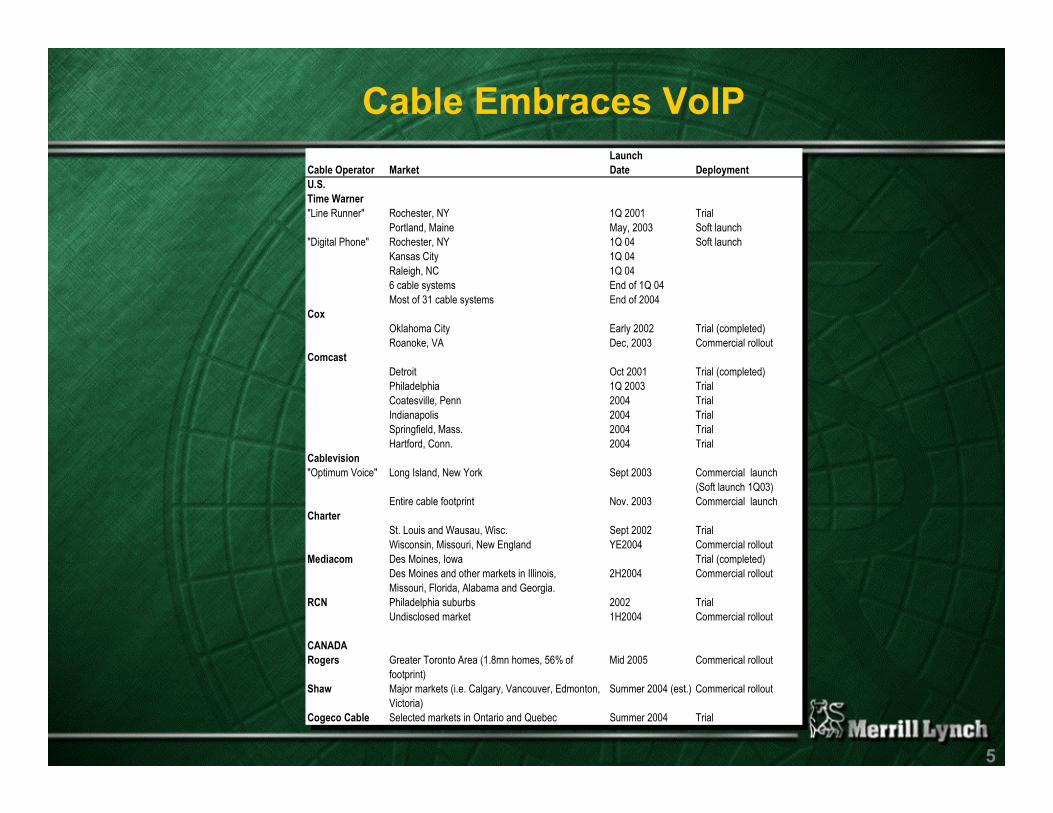
Cable Embraces VoIP Launch
Cable Operator Market Date DeploymentU.S.Time Warner"Line Runner" Rochester, NY 1Q 2001 Trial
Portland, Maine May, 2003 Soft launch"Digital Phone" Rochester, NY 1Q 04 Soft launch
Kansas City 1Q 04Raleigh, NC 1Q 046 cable systems End of 1Q 04Most of 31 cable systems End of 2004
CoxOklahoma City Early 2002 Trial (completed)Roanoke, VA Dec, 2003 Commercial rollout
ComcastDetroit Oct 2001 Trial (completed)Philadelphia 1Q 2003 TrialCoatesville, Penn 2004 TrialIndianapolis 2004 TrialSpringfield, Mass. 2004 TrialHartford, Conn. 2004 Trial
Cablevision"Optimum Voice" Long Island, New York Sept 2003 Commercial launch
(Soft launch 1Q03)Entire cable footprint Nov. 2003 Commercial launch
CharterSt. Louis and Wausau, Wisc. Sept 2002 TrialWisconsin, Missouri, New England YE2004 Commercial rollout
Mediacom Des Moines, Iowa Trial (completed)Des Moines and other markets in Illinois, 2H2004 Commercial rolloutMissouri, Florida, Alabama and Georgia.
RCN Philadelphia suburbs 2002 TrialUndisclosed market 1H2004 Commercial rollout
CANADARogers Greater Toronto Area (1.8mn homes, 56% of Mid 2005 Commerical rollout
footprint)Shaw Major markets (i.e. Calgary, Vancouver, Edmonton, Summer 2004 (est.) Commerical rollout
Victoria)Cogeco Cable Selected markets in Ontario and Quebec Summer 2004 Trial
LaunchCable Operator Market Date DeploymentU.S.Time Warner"Line Runner" Rochester, NY 1Q 2001 Trial
Portland, Maine May, 2003 Soft launch"Digital Phone" Rochester, NY 1Q 04 Soft launch
Kansas City 1Q 04Raleigh, NC 1Q 046 cable systems End of 1Q 04Most of 31 cable systems End of 2004
CoxOklahoma City Early 2002 Trial (completed)Roanoke, VA Dec, 2003 Commercial rollout
ComcastDetroit Oct 2001 Trial (completed)Philadelphia 1Q 2003 TrialCoatesville, Penn 2004 TrialIndianapolis 2004 TrialSpringfield, Mass. 2004 TrialHartford, Conn. 2004 Trial
Cablevision"Optimum Voice" Long Island, New York Sept 2003 Commercial launch
(Soft launch 1Q03)Entire cable footprint Nov. 2003 Commercial launch
CharterSt. Louis and Wausau, Wisc. Sept 2002 TrialWisconsin, Missouri, New England YE2004 Commercial rollout
Mediacom Des Moines, Iowa Trial (completed)Des Moines and other markets in Illinois, 2H2004 Commercial rolloutMissouri, Florida, Alabama and Georgia.
RCN Philadelphia suburbs 2002 TrialUndisclosed market 1H2004 Commercial rollout
CANADARogers Greater Toronto Area (1.8mn homes, 56% of Mid 2005 Commerical rollout
footprint)Shaw Major markets (i.e. Calgary, Vancouver, Edmonton, Summer 2004 (est.) Commerical rollout
Victoria)Cogeco Cable Selected markets in Ontario and Quebec Summer 2004 Trial

6
U.S. VoIP Penetration Forecast
0.0%
2.0%
4.0%
6.0%
8.0%
10.0%
12.0%
14.0%
YE03E YE04E YE05E YE06E YE07E YE08E
Pene
trat
ion
(%)*
Cable IndependentPenetraton % of total residential and small business access lines and cable VoIP subscribers.
0.0%
2.0%
4.0%
6.0%
8.0%
10.0%
12.0%
14.0%
YE03E YE04E YE05E YE06E YE07E YE08E
Pene
trat
ion
(%)*
Cable IndependentPenetraton % of total residential and small business access lines and cable VoIP subscribers.

7
The Key Issue: Duopoly or Multiple Players?
DUOPOLY
4 Cable and phone companies remain the dominant providers
4 Requires tied selling– DSL tied to voice– cable operators use
packet prioritization4 Manageable price
competition
MULTI-PLAYER MARKET
4 Cable and phone companies become “bit carriers”
4 Multiple providers of voice and other services
4 Requires “open” broadband infrastructure, based on– customer demand– regulation or– new competitors (“3rd
pipe”)

8
Telcos Under Pressure
Broadband data: from “let’s try it” to “can’t afford to lose”
Network upgrades4 needed for TV4 likely also needed to keep pace with cable data services4 costly and time-consuming4 painful for FCF-based stocks
DSL-TV: Working outside the U.S.
Satellite TV alliances: Likely not just temporary
9
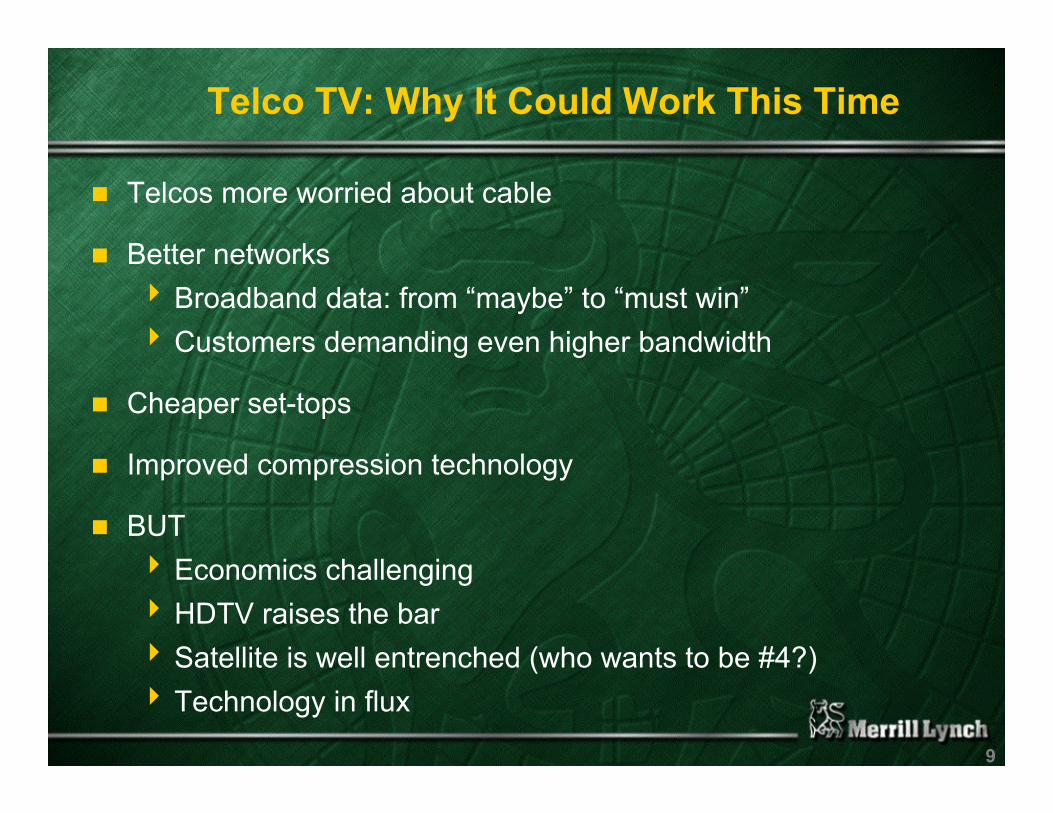
Telco TV: Why It Could Work This Time
Telcos more worried about cable
Better networks4 Broadband data: from “maybe” to “must win”4Customers demanding even higher bandwidth
Cheaper set-tops
Improved compression technology
BUT4 Economics challenging4HDTV raises the bar4 Satellite is well entrenched (who wants to be #4?)4 Technology in flux
10
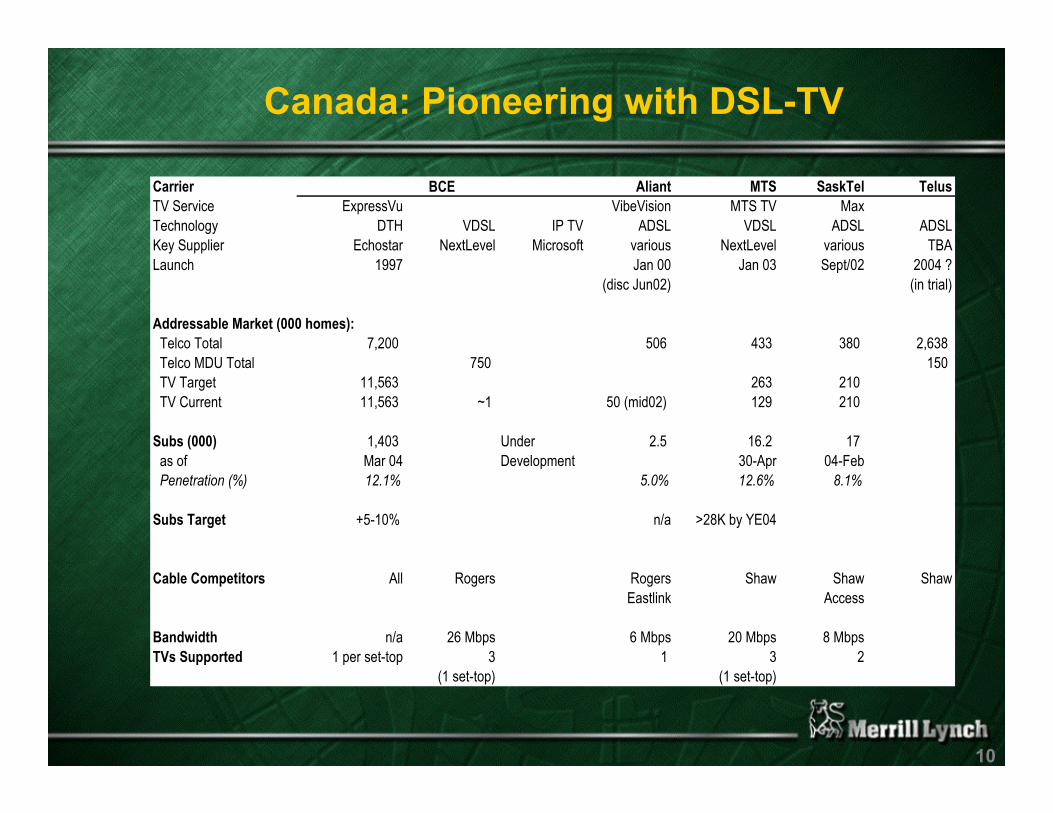
Canada: Pioneering with DSL-TV
Carrier Aliant MTS SaskTel TelusTV Service ExpressVu VibeVision MTS TV MaxTechnology DTH VDSL IP TV ADSL VDSL ADSL ADSLKey Supplier Echostar NextLevel Microsoft various NextLevel various TBALaunch 1997 Jan 00 Jan 03 Sept/02 2004 ?
(disc Jun02) (in trial)
Addressable Market (000 homes): Telco Total 7,200 506 433 380 2,638 Telco MDU Total 750 150 TV Target 11,563 263 210 TV Current 11,563 ~1 50 (mid02) 129 210
Subs (000) 1,403 Under 2.5 16.2 17 as of Mar 04 Development 30-Apr 04-Feb Penetration (%) 12.1% 5.0% 12.6% 8.1%
Subs Target +5-10% n/a >28K by YE04
Cable Competitors All Rogers Rogers Shaw Shaw ShawEastlink Access
Bandwidth n/a 26 Mbps 6 Mbps 20 Mbps 8 MbpsTVs Supported 1 per set-top 3 1 3 2
(1 set-top) (1 set-top)
BCE

11
Phone and cable companies are likely to have both price and product advantages in each other’s core markets

12
Share Shift Impacts: US (Illustrative Data)
Service Type Assumption Current Future Current Future Current Future Telcos Cablecos
High-Speed Data Penetration 8% 25% 12% 35% 20% 60% 2% 3%ARPU ($) 40.00 35.00 40.00 40.00 -2% 0%Rev/Home ($/mo) 3.20 8.75 4.80 14.00 EBITDA Margin (%) 20% 52% 50% 63%Incremental Margin (%) 70% 70%EBITDA/Home ($/mo) 0.64 4.53 2.40 8.84
Wireline Phone Penetration 100% 60% 5% 30% 105% 90% -6% 4%ARPU ($) 47.50 40.00 50.00 25.00 -2% -9%Rev/Home ($/mo) 47.50 24.00 2.50 7.50 EBITDA Margin (%) 40% 11% 0% 40%Incremental Margin (%) 70% 60%EBITDA/Home ($/mo) 19.00 2.55 - 3.00
TV Penetration 0% 15% 63% 58% 63% 73% 2% -1%ARPU ($) 45.00 50.00 45.00 60.00 2% 4%Rev/Home ($/mo) - 7.50 28.13 34.50 EBITDA Margin (%) 0% 50% 40% 42%Incremental Margin (%) 50% 50%EBITDA/Home ($/mo) - 3.75 11.25 14.44
Total ARPU for 3 Svcs 132.50 125.00 135.00 125.00 Rev/Home ($/mo) 50.70 40.25 35.43 56.00 EBITDA/Home ($/mo) 19.64 10.83 13.65 26.28 EBITDA Margin (%) 39% 27% 39% 47%
CAGR based on 7 years (in projection period1.25% annual growth in homes passed
Revenue/Home -3.2% 6.8%Total Revenue -2.0% 8.1%Total EBITDA -7.0% 11.2%
Telcos Cablecos Telcos + Cable CAGR (%)Service Type Assumption Current Future Current Future Current Future Telcos Cablecos
High-Speed Data Penetration 8% 25% 12% 35% 20% 60% 2% 3%ARPU ($) 40.00 35.00 40.00 40.00 -2% 0%Rev/Home ($/mo) 3.20 8.75 4.80 14.00 EBITDA Margin (%) 20% 52% 50% 63%Incremental Margin (%) 70% 70%EBITDA/Home ($/mo) 0.64 4.53 2.40 8.84
Wireline Phone Penetration 100% 60% 5% 30% 105% 90% -6% 4%ARPU ($) 47.50 40.00 50.00 25.00 -2% -9%Rev/Home ($/mo) 47.50 24.00 2.50 7.50 EBITDA Margin (%) 40% 11% 0% 40%Incremental Margin (%) 70% 60%EBITDA/Home ($/mo) 19.00 2.55 - 3.00
TV Penetration 0% 15% 63% 58% 63% 73% 2% -1%ARPU ($) 45.00 50.00 45.00 60.00 2% 4%Rev/Home ($/mo) - 7.50 28.13 34.50 EBITDA Margin (%) 0% 50% 40% 42%Incremental Margin (%) 50% 50%EBITDA/Home ($/mo) - 3.75 11.25 14.44
Total ARPU for 3 Svcs 132.50 125.00 135.00 125.00 Rev/Home ($/mo) 50.70 40.25 35.43 56.00 EBITDA/Home ($/mo) 19.64 10.83 13.65 26.28 EBITDA Margin (%) 39% 27% 39% 47%
CAGR based on 7 years (in projection period1.25% annual growth in homes passed
Revenue/Home -3.2% 6.8%Total Revenue -2.0% 8.1%Total EBITDA -7.0% 11.2%
Telcos Cablecos Telcos + Cable CAGR (%)

13
Merrill Lynch Disclaimer (cont’d)
Copyright 2003 Merrill Lynch, Pierce, Fenner & Smith Incorporated (MLPF&S). All rights reserved. Any unauthorized use or disclosure is prohibited. This report has been prepared and issued by MLPF&S and/or one of its affiliates and has been approved for publication in the United Kingdom by Merrill Lynch, Pierce, Fenner & Smith Limited, which is regulated by the FSA; has been considered and distributed in Australia by Merrill Lynch Equities (Australia) Limited (ACN 006 276 795), a licensed securities dealer under the Australian Corporations Law; is distributed in Hong Kong by Merrill Lynch (Asia Pacific) Ltd, which is regulated by the Hong Kong SFC; and is distributed in Singapore by Merrill Lynch International Bank Ltd (Merchant Bank) and Merrill Lynch (Singapore) Pte Ltd, which are regulated by the Monetary Authority of Singapore. The information herein was obtained from various sources; we do not guarantee its accuracy or completeness. Additional information available.Neither the information nor any opinion expressed constitutes an offer, or an invitation to make an offer, to buy or sell any securities or any options, futures or other derivatives related to such securities ("related investments"). MLPF&S, its affiliates, directors, officers, employees and employee benefit programs may have a long or short position in any securities of this issuer(s) or in related investments. MLPF&S or its affiliates may from time to time perform investment banking or other services for, or solicit investment banking or other business from, any entity mentioned in this report.This research report is prepared for general circulation and is circulated for general information only. It does not have regard to the specific investment objectives, financial situation and the particular needs of any specific person who may receive this report. Investors should seek financial advice regarding the appropriateness of investing in any securities or investment strategies discussed or recommended in this report and should understand that statements regarding future prospects may not be realized. Investors should note that income from such securities, if any, may fluctuate and that each security's price or value may rise or fall. Accordingly, investors may receive back less than originally invested. Past performance is not necessarily a guide to future performance
Copyright 2003 Merrill Lynch, Pierce, Fenner & Smith Incorporated (MLPF&S). All rights reserved. Any unauthorized use or disclosure is prohibited. This report has been prepared and issued by MLPF&S and/or one of its affiliates and has been approved for publication in the United Kingdom by Merrill Lynch, Pierce, Fenner & Smith Limited, which is regulated by the FSA; has been considered and distributed in Australia by Merrill Lynch Equities (Australia) Limited (ACN 006 276 795), a licensed securities dealer under the Australian Corporations Law; is distributed in Hong Kong by Merrill Lynch (Asia Pacific) Ltd, which is regulated by the Hong Kong SFC; and is distributed in Singapore by Merrill Lynch International Bank Ltd (Merchant Bank) and Merrill Lynch (Singapore) Pte Ltd, which are regulated by the Monetary Authority of Singapore. The information herein was obtained from various sources; we do not guarantee its accuracy or completeness. Additional information available.Neither the information nor any opinion expressed constitutes an offer, or an invitation to make an offer, to buy or sell any securities or any options, futures or other derivatives related to such securities ("related investments"). MLPF&S, its affiliates, directors, officers, employees and employee benefit programs may have a long or short position in any securities of this issuer(s) or in related investments. MLPF&S or its affiliates may from time to time perform investment banking or other services for, or solicit investment banking or other business from, any entity mentioned in this report.This research report is prepared for general circulation and is circulated for general information only. It does not have regard to the specific investment objectives, financial situation and the particular needs of any specific person who may receive this report. Investors should seek financial advice regarding the appropriateness of investing in any securities or investment strategies discussed or recommended in this report and should understand that statements regarding future prospects may not be realized. Investors should note that income from such securities, if any, may fluctuate and that each security's price or value may rise or fall. Accordingly, investors may receive back less than originally invested. Past performance is not necessarily a guide to future performance
Top Related