


Languages
Pages
Legal

Visible Satellite Imagery
Spring 2015
ARSET - AQApplied Remote Sensing Education and Training – Air Quality
A project of NASA Applied Sciences
Week – 2 – April 08, 2015
Today’s Speakers
Pawan GuptaResearch ScientistNASA Goddard Space Flight Center/USRAEmail: [email protected]
Guest Speak:Adam VoilandScience Writer, NASA's Earth ObservatoryNASA Goddard Space Flight Center, [email protected]

Session 2 – Outline
1. What are true and false color images?2. What can we learn from images?3. Near real time image visualization 4. A tour of useful image archives.

Visible Image Science
Visible satellite images are essentially photographs taken from space.
All of the energy collected by the visible sensors (cameras) on board the satellite is light energy from the sun reflected by the Earth.
The reflectance is a measure of albedo, which is the percentage of light energy reflected by the earth.
The higher the albedo the more light reflected back into space whereas the lower the albedo, the more light energy absorbed.
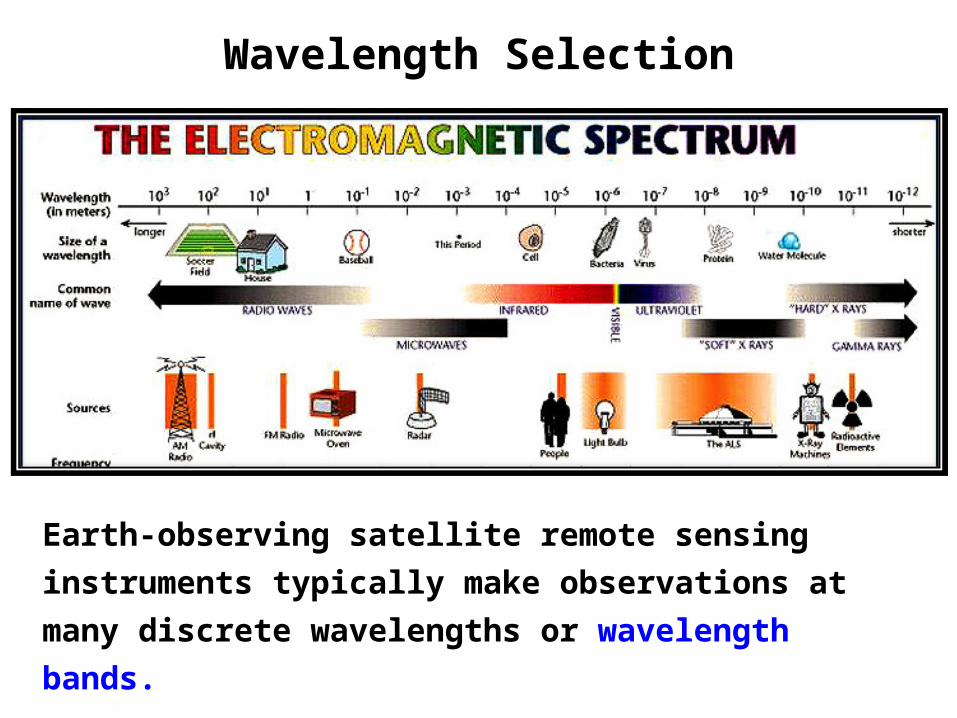
Earth-observing satellite remote sensing instruments typically make observations at many discrete wavelengths or wavelength bands.
Wavelength Selection
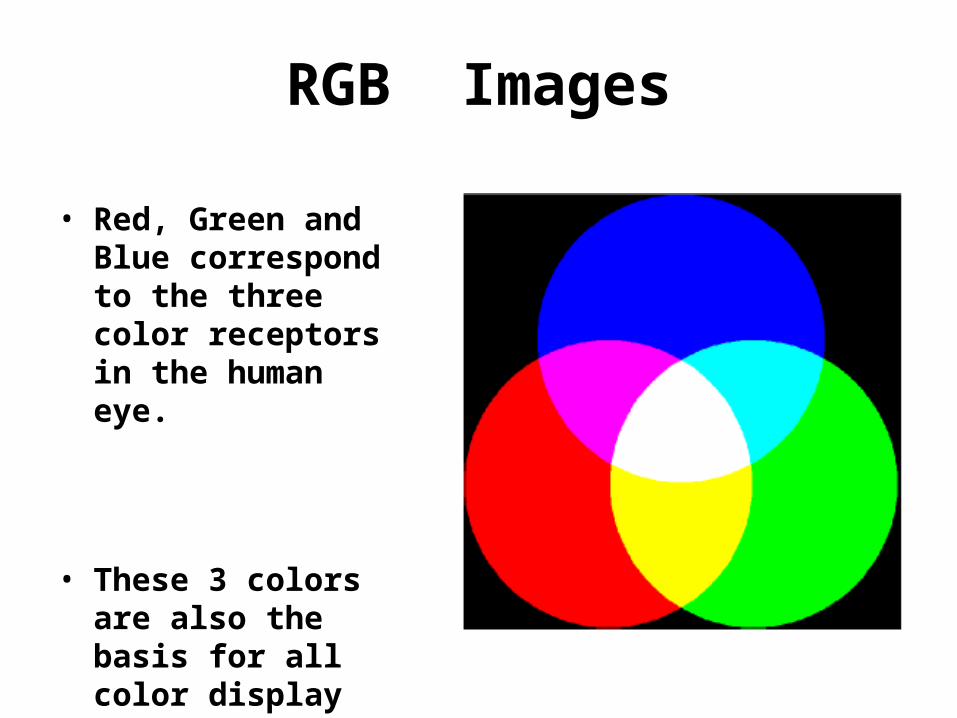
RGB Images
• Red, Green and Blue correspond to the three color receptors in the human eye.
• These 3 colors are also the basis for all color display technologies from LCD sub-pixels to television color “guns”.

RGB Images Cont…
True Color ImageTo simulate what the human eye sees
we load the red, green and blue satellite bands into the corresponding display channels.
We can create an image by selecting any three bands and load them into the “Red”“Green” and “Blue” displaychannels.

MODIS (Moderate Resolution Imaging Spectroradiometer)
Spatial Resolution 250m, 500m, 1km
Temporal Resolution Daily, 8-day, 16-day, monthly, quarterly, yearly 2000-present
Data Format Hierarchal data format – Earth Observing System
Format (HDF-EOS)
Spectral Coverage 36 bands (major bands include
Red, Blue, IR, NIR, MIR) Bands 1-2: 250m Bands 3-7: 500m Bands 8-36: 1000m
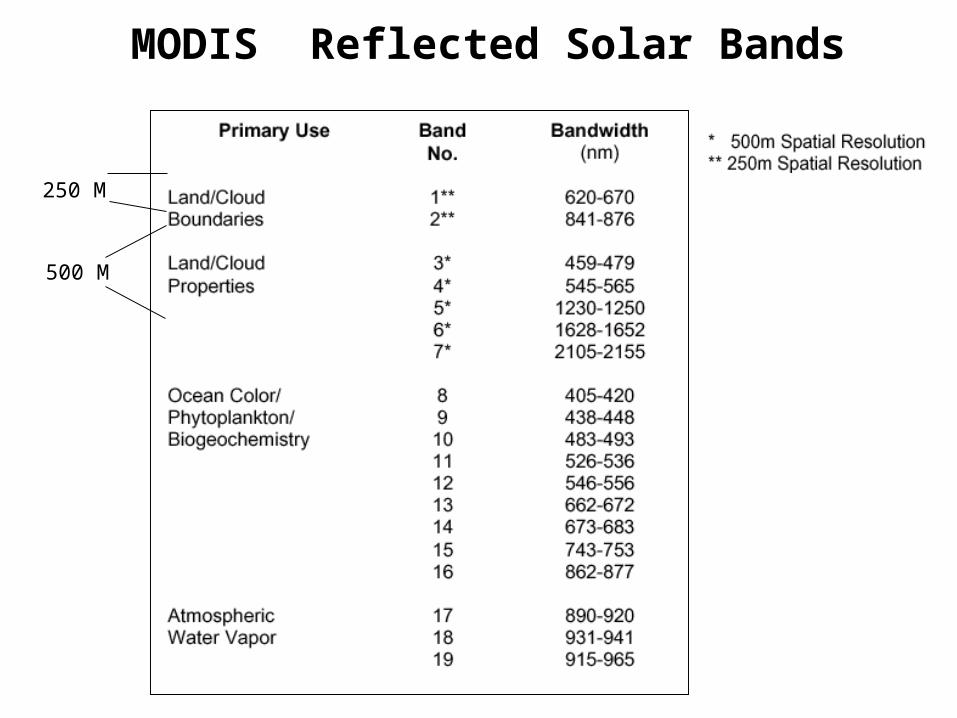
MODIS Reflected Solar Bands
250 M
500 M

MO
DIS
The
rmal
Ban
ds

R = 0.66 µmG = 0.55 µmB = 0.47 µm
MODIS True Color Image
A MODIS “True Color Image”
will use MODIS visible wavelength
bands1-4-3

True Color Image from VIIRS
VIIRS also provides MODIS like true color images over global regions
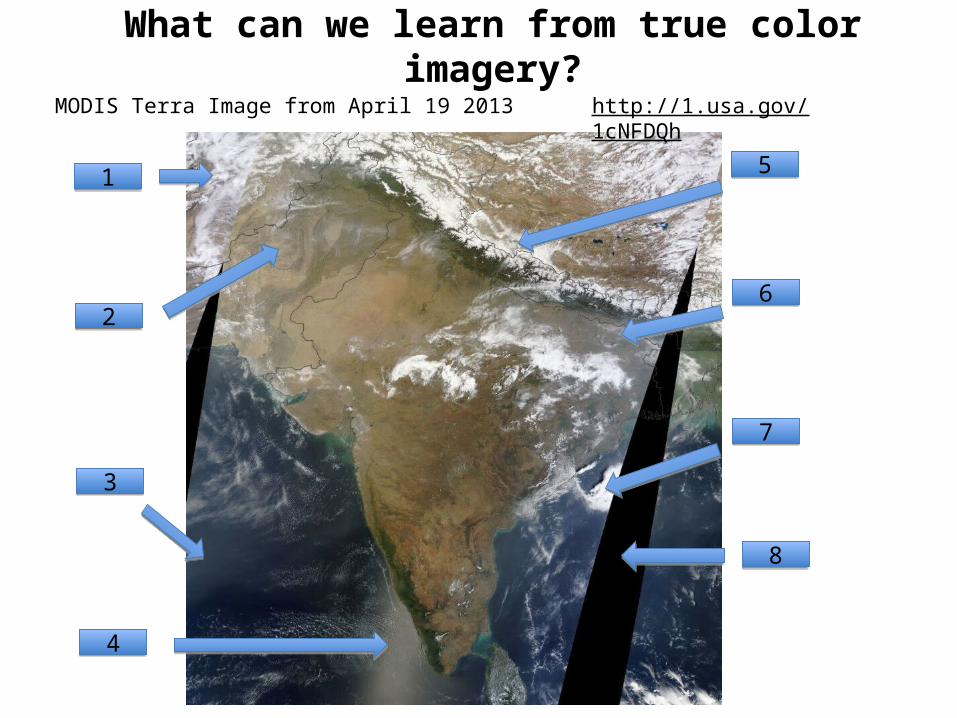
What can we learn from true color imagery?
11
22
33
44
55
66
88
77
MODIS Terra Image from April 19 2013 http://1.usa.gov/1cNFDQh

Features In True Color Image (Atmosphere)

Glint

Feature Identification is more reliable when a clear source can be seen in the image.
Indian oil fires
Australia dust
Sangeang Api, Indonesia eruption
Urban-industrial/smoke pollution?
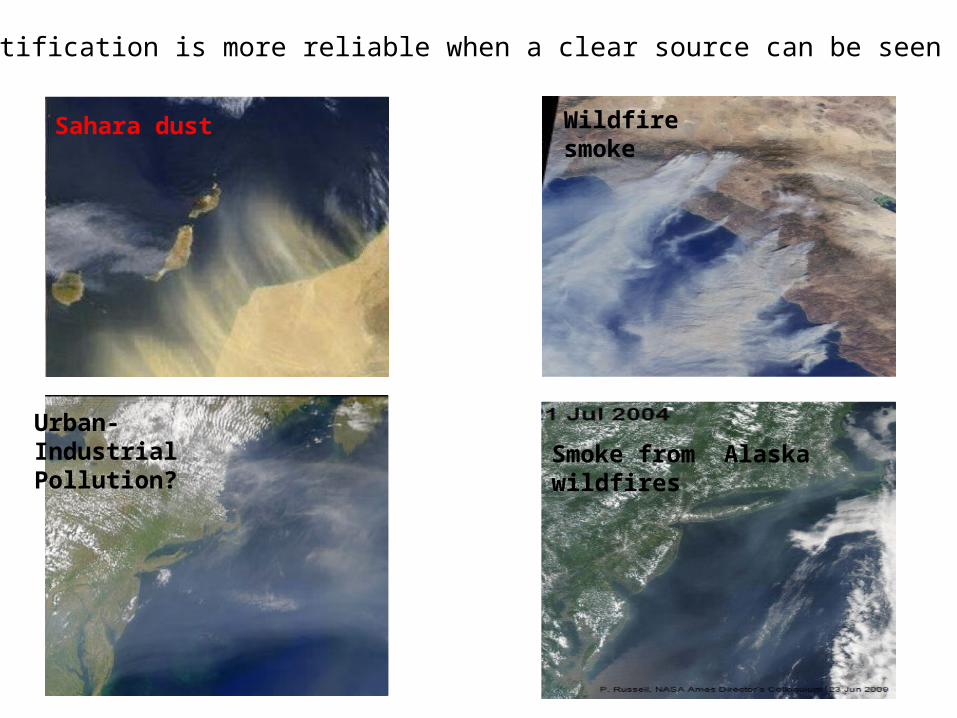
Sahara dust Wildfire smoke
Urban-IndustrialPollution?
Smoke from Alaska wildfires
Feature Identification is more reliable when a clear source can be seen in the image.
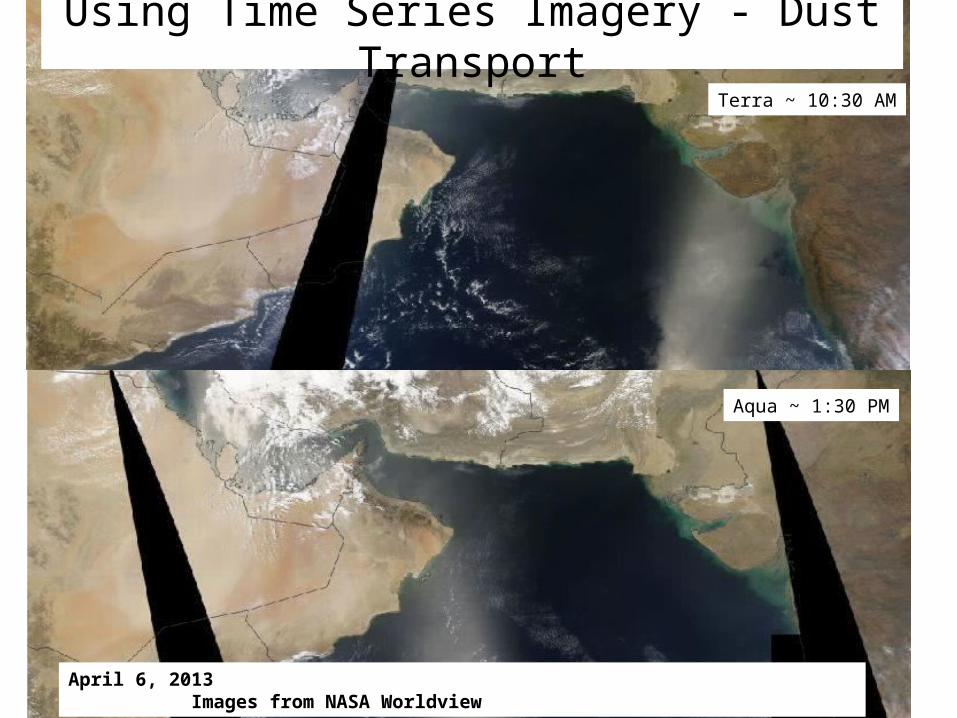
Using Time Series Imagery - Dust Transport
April 6, 2013 Images from NASA Worldview
Terra ~ 10:30 AM
Aqua ~ 1:30 PM
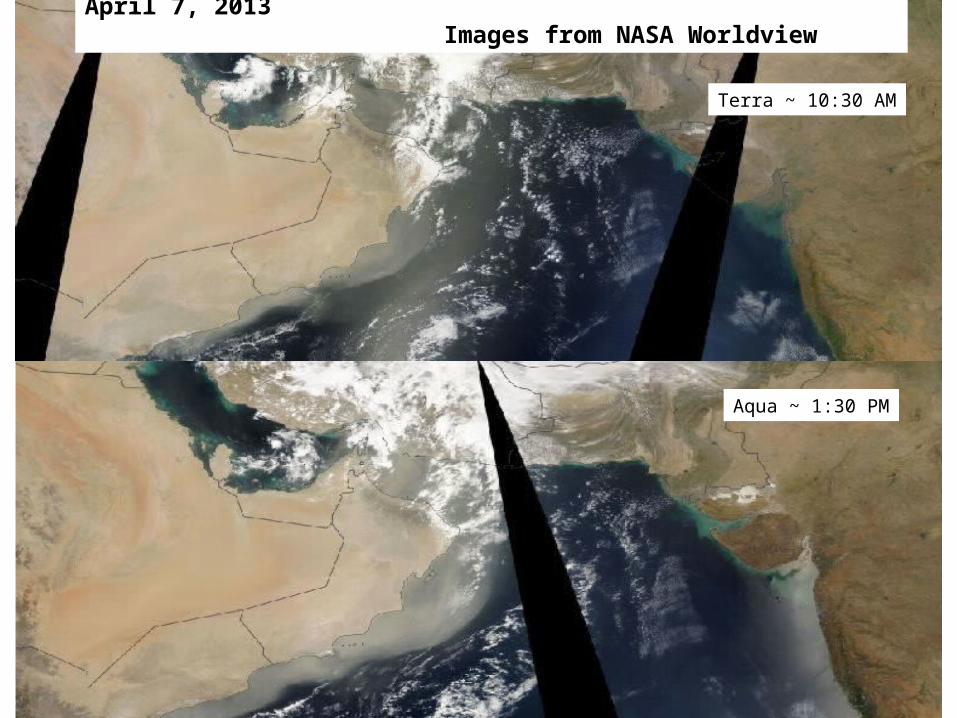
April 7, 2013 Images from NASA Worldview
Terra ~ 10:30 AM
Aqua ~ 1:30 PM

April 8, 2013 Images from NASA Worldview
Terra ~ 10:30 AM
Aqua ~ 1:30 PM

Color, texture and shape
http://earthobservatory.nasa.gov/Features/ColorImage/page2.php
Earth Observatory Story on Feature Detection in an Image

Doing More with Satellite Imagery
In visible imagery water is dark because it absorbs most of the energy.
Clouds are white because most of the incoming energy is reflected
Pollution is hazy depending upon its absorptive properties
If we understand the physics of how particular wavelengths interact withobjects in the world we can create images to emphasize what we want to see

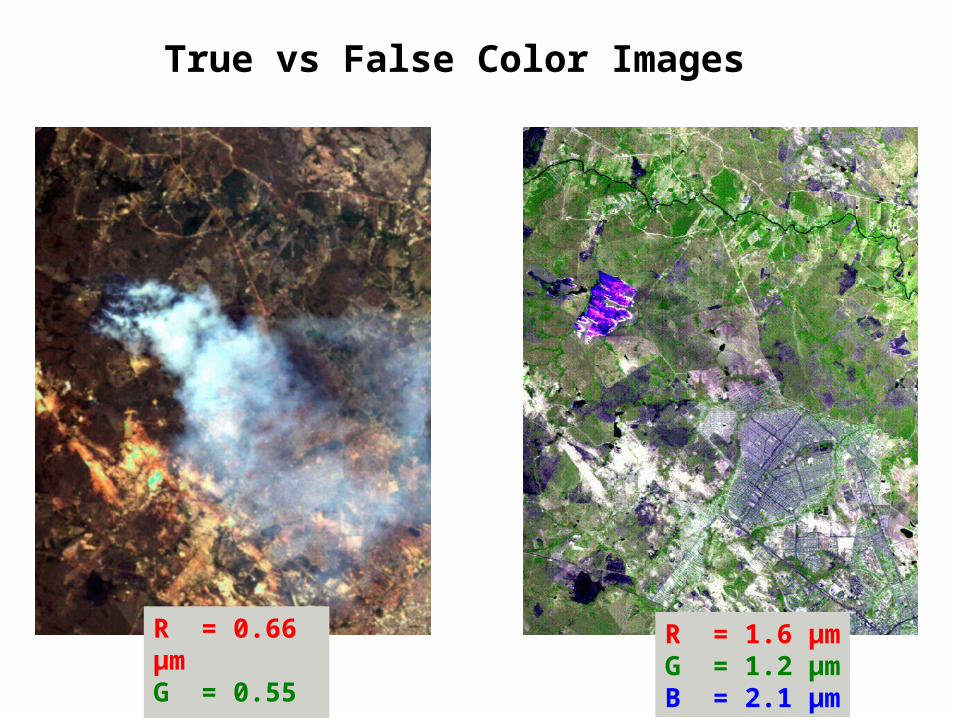
R = 1.6 µmG = 1.2 µmB = 2.1 µm
False Color Images
“False Color Image”To enhance particularfeatures we want to seein an image we loadbands into thered, green and bluedisplay channelswhich do not correspondto the visible red, green,and blue wavelengths.
R = 1.6 µmG = 1.2 µmB = 2.1 µm
True vs False Color Images
R = 0.66 µmG = 0.55 µmB = 0.47 µm
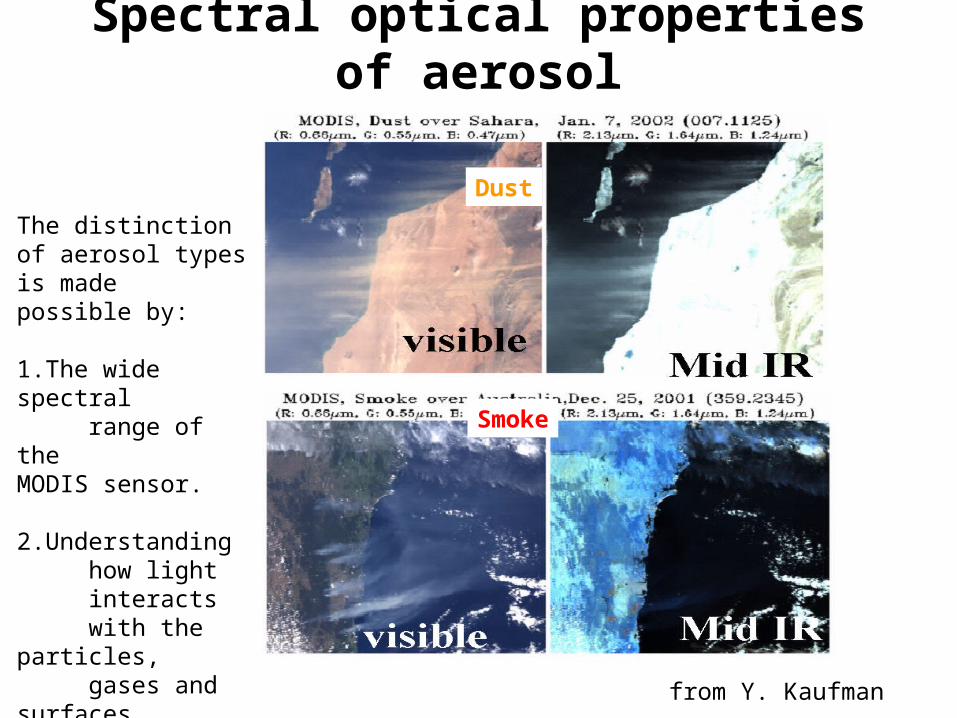
Spectral optical properties of aerosol
Dust
Smoke
from Y. Kaufman
The distinctionof aerosol typesis madepossible by:
1.The wide spectral range of the MODIS sensor.
2.Understanding how light interacts with the particles, gases and surfaces it interacts with.

True Color Image vs Color Map

Earth Observatory – Events & Morehttp://earthobservatory.nasa.gov/
World View – Near Real Timehttp://earthdata.nasa.gov/labs/
worldview/
A Brief Tour of Some Useful Image Archives

Image Archive and Gallery Links
ARSET Satellite Imagery Overview and linkshttp://airquality.gsfc.nasa.gov/index.php?section=64
MODIS Rapid Response Sitehttp://earthdata.nasa.gov/data/near-real-time-data/rapid-response
NASA’s Visible Earthhttp://visibleearth.nasa.gov
NASA’s Earth Observatoryhttp://earthobservatory.nasa.gov
NASA Earth Observations (NEO)http://neo.sci.gsfc.nasa.gov
MODIS- Atmos (MODIS Atmosphere Product Reference Site)http://modis-atmos.gsfc.nasa.gov/IMAGES/index.html
•GLIDER Toolhttp://www.ssec.wisc.edu/hydra/
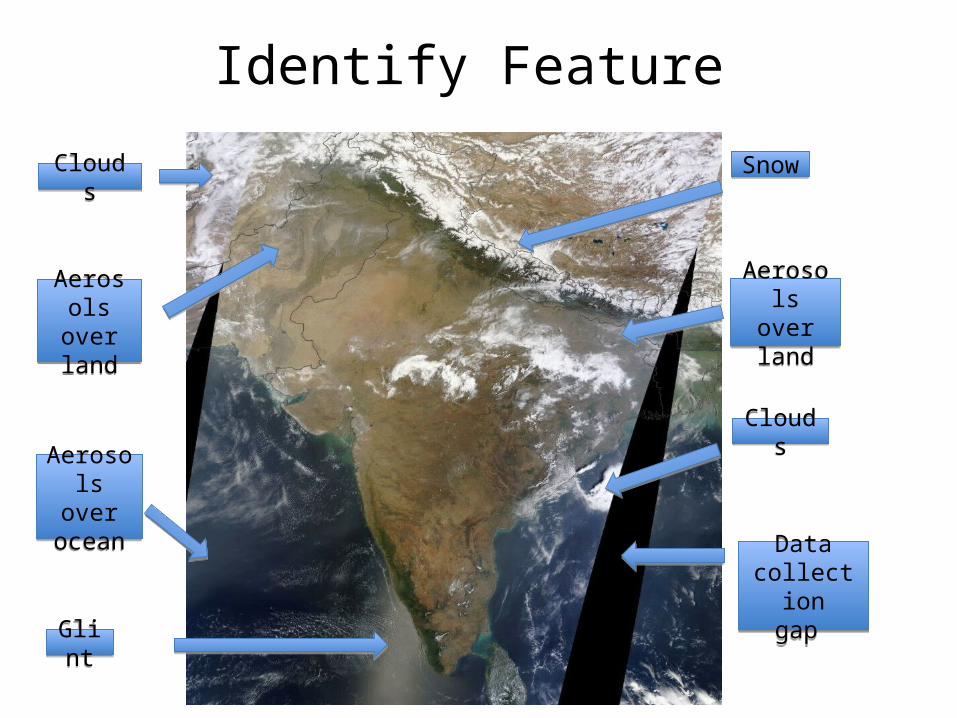
Identify Feature
CloudsClouds
Aerosols over land
Aerosols over land
Aerosols over
ocean
Aerosols over
ocean
GlintGlint
SnowSnow
Aerosols over land
Aerosols over land
Data collection
gap
Data collection
gap
CloudsClouds
Top Related