


Languages
Pages
Legal


RECONSTRUCTING FLUVIAL STYLE
RECONSTRUCTING FLUVIAL STYLE IN THE BEAUFORT GROUP, SOUTH
AFRICA: DISTRIBUTIVE FLUVIAL SYSTEM OR TRUNK RIVER MODEL?
ALICE R. GULLIFORD,*1 STEPHEN S. FLINT,1 AND DAVID M. HODGSON 2
1Stratigraphy Group, School of Earth, Atmospheric and Environmental Sciences, University
of Manchester, Oxford Road, Manchester M13 9PL, U.K.
2Stratigraphy Group, School of Earth and Environment, University of Leeds, Leeds LS2 9JT,
U.K.
e-mail: [email protected]
*Corresponding author.
Keywords: fluvial hierarchy, stacking patterns, ephemeral deposits, distributive fluvial
system, Karoo Basin
1
2
3
4
5
6
7
8
9
10
11
12
13
14
15
16
17
18
19
20
21
22
23

ABSTRACT: Multi-kilometer scale strike and dip exposures of fluvial deposits from the
Permo-Triassic Beaufort Group enable detailed analysis of spatial and temporal changes in
fluvial style and stacking patterns. A 145 m thick study succession within the Abrahamskraal
Formation comprises a hierarchy of channel-related deposits, from storeys, through channel-
belts that are stacked into nine channel-belt complexes within four complex sets. Channel-
belts show evidence for both downstream and lateral accretion and include common upper
phase plane bedding. Floodplain deposits comprise crevasse splay sandstones and siltstone
packages showing upward-fining from green-gray siltstone into distinctive purple claystone,
interpreted as a drying-upward trend in shallow ephemeral lakes. The lower stratigraphy is
dominated by splay complexes, overlain by increasingly incised and amalgamated
channelized systems with little preserved floodplain material. Paleocurrents are consistently
to the NE.
While parts of the dataset fit a basin-axial trunk river-dominated system, they better
(but not entirely) reflect a prograding distributive fluvial system (DFS). Lines of evidence
include the consistent paleocurrents in early (frontal) splays and younger channel-belt
complexes, and the presence of splay complexes only in the lower stratigraphy, interpreted as
precursors to the prograding fluvial system. Deposition took place under conditions of flashy
discharge influenced by high frequency climate cycles, also expressed in the mudrock color
changes and distribution of paleosols. These cycles overprint the expected gradual drying-
upward trend in overbank deposits proposed in DFS models. The abrupt increase in channel-
belt incision, amalgamation and lack of floodplain preservation associated with Complex 6 is
interpreted to reflect sequence boundary formation and a basinward facies shift that forced
progradation beyond the rate predicted in gradualistic DFS models.
INTRODUCTION
1
24
25
26
27
28
29
30
31
32
33
34
35
36
37
38
39
40
41
42
43
44
45
46
47
48

Traditional fluvial facies models focused on either humid, perennial rivers or arid,
dryland environments (e.g., Miall 1977; Cant and Walker 1978; Tunbridge 1984; Collinson
1996; Miall 1996; Bridge 2003; 2006). Recent studies of both modern and ancient dryland as
well as ephemeral systems have widened the range of facies models (North and Taylor 1996;
Nanson et al. 2002; Fielding et al. 2009; 2011; North and Davidson 2012; Wilson et al.
2014), but there remains limited understanding of spatial and temporal stratigraphic patterns
and facies distributions in dryland fluvial systems, which requires better 3-D outcrop control.
The interpretation of large scale fluvial dispersal patterns in the ancient record has
emphasized trunk river systems that feed deltas (e.g., Cowan 1993; Archer and Greb 1995;
Kvale and Archer 2007), but there has been a recent re-emphasis on the role of large scale
fan-shaped systems (e.g., Stanistreet and McCarthy 1993; Hartley et al. 2010a; 2010b).
Weissmann et al. (2010) proposed that these distributive fluvial systems (hereafter, DFS) can
be identified by their radial paleocurrent distribution away from the apex, as well as by a
downstream decrease in channel-belt dimensions and grain size. There is an ongoing debate
over the relative importance of basin-axial trunk river vs. DFS models in explaining
stratigraphic patterns of ancient fluvial deposits (Nichols and Fisher 2007; Fielding 2010;
Hartley et al. 2010a; 2010b; Sambrook Smith et al. 2010; Weissmann et al. 2010; 2011a;
2011b; Fielding et al. 2012), and how the response to changing accommodation, sediment
supply and lobe switching that can perturb these models will be expressed in the stratigraphic
record. The depositional architecture of fluvial systems preserved in high resolution reflection
seismic data (Carter 2003; Maynard 2006; Hubbard et al. 2011; Mellett et al. 2013) can help
to inform the debate. However, the river and floodplain processes, and the stacking of small-
scale elements, recorded in exhumed ancient fluvial systems provide an essential test for
these conceptual models.
2
49
50
51
52
53
54
55
56
57
58
59
60
61
62
63
64
65
66
67
68
69
70
71
72

Assessment of the validity of these conceptual models at outcrop requires excellent
exposure quality and a good planform spread of observations over the stratigraphic interval of
interest. Ephemeral systems are largely characterized by dry fluvial channels throughout the
year with intermittent or seasonal discharge (e.g., Tunbridge 1984; North and Taylor 1996;
Wilson et al. 2014) and this ephemeral character has significant implications on depositional
architecture. Many detailed architectural and stratigraphic studies of ancient ephemeral
fluvial deposits are restricted to two-dimensional exposures. Examples include the Miocene
Siwalik Group of northern Pakistan (Willis 1993) and many Mesozoic examples from the US,
such as the Triassic Chinle Formation of Utah (Blakey and Gubitosa 1984; Cleveland et al.
2007; Trendell et al. 2013) and the Lower Jurassic Kayenta Formation from the Colorado
Plateau (Bromley 1991; Luttrell 1993; North and Taylor 1996). Recent work by Wilson et al.
(2014) has looked to characterize the depositional architecture and sedimentology elsewhere
in the lower Beaufort Group using photo panel interpretations. However, many parts of these
outcrop belts are inaccessible, leading to uncertainties regarding paleoflow and facies
distributions.
This paper aims to contribute to our understanding of the stratigraphic record of
ephemeral fluvial systems by reconstructing river and overbank styles through a well-
exposed succession of the Permo-Triassic Beaufort Group adjacent to the town of Sutherland,
South Africa (Fig. 1). The outcrop distribution permits full detailed mapping of individual
channel-belts and channel-belt complexes with good 3-D constraints in a 145 m thick
stratigraphic interval. We document intricate trends and changes in preserved river
morphology and style, allowing for better understanding of the interplay between controls on
this ancient fluvial succession. The depositional architecture and temporal evolution of the
system are described in relation to and tested against both DFS and axial trunk river models.
3
73
74
75
76
77
78
79
80
81
82
83
84
85
86
87
88
89
90
91
92
93
94
95
96
97

GEOLOGICAL SETTING
The Karoo Supergroup spans from the Upper Carboniferous to the Middle Jurassic
and is up to 5,500 m thick in the Laingsburg area. Basal Upper Carboniferous to Lower
Permian diamictites of the Dwyka Group are overlain by Permian clastic marine strata of the
Ecca Group and capped by the Permo-Triassic fluvial Beaufort Group (Fig. 2). Basin
subsidence during deposition of the Dwyka, Ecca and lower Beaufort Group was generated
by negative dynamic topography resulting from mantle flow, associated with a subducting
slab (Pysklywec and Mitrovica 1999; Tankard et al. 2009).
The Beaufort Group is divided into the Upper Permian Adelaide Subgroup and the
overlying Lower Triassic Tarkastad Subgroup (Stear 1980; Johnson et al. 1997). The lower
part of the Adelaide Subgroup comprises some 2,500 m of fluvial channel-belt and overbank
deposits of the Capitanian (late Guadalupian) aged (Lanci et al. 2013) Abrahamskraal
Formation and the overlying 1,000 m thick Teekloof Formation (Johnson et al. 1997).
Extensive research focused on unravelling the sedimentology and paleoclimate of the
Beaufort Group by Smith (1987; 1990) has been supported by biostratigraphic studies by
Smith and Keyser (1995) and Rubidge et al. (2000) to the east of the study area.
Additionally, lithostratigraphic work by Jirah and Rubidge (2014) and Day and Rubidge
(2014) has refined the stratigraphy towards the south margin of the basin. The most recent
sedimentological analysis of the lower Beaufort Group in the Sutherland to Laingsburg area
is that of Wilson et al. (2014), whose study area covered some 7,000 km2. These authors
documented six styles of fluvial channel deposits, a largely NE paleoflow direction with
some spread and proposed a DFS model for the Abrahamskraal Formation. This studyfocuses
on the Abrahamskraal Formation and the informally recognized, sandstone-dominated
Moordenaars Member (Le Roux 1985) near Sutherland, using outcrops not studied by Wilson
4
98
99
100
101
102
103
104
105
106
107
108
109
110
111
112
113
114
115
116
117
118
119
120
121

et al. (2014). Sedimentological comparisons will be drawn explicitly linking this research to
that of Wilson et al. (2014), where appropriate.
DATASET AND METHODS
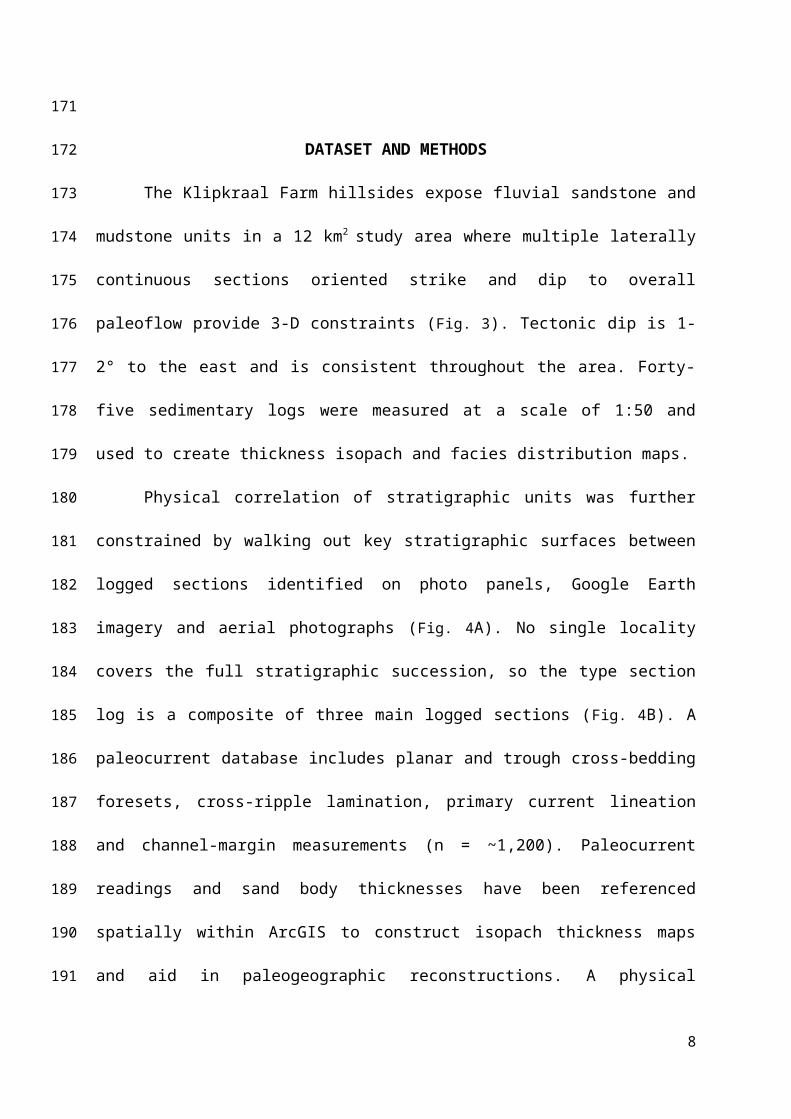
The Klipkraal Farm hillsides expose fluvial sandstone and mudstone units in a 12 km2
study area where multiple laterally continuous sections oriented strike and dip to overall
paleoflow provide 3-D constraints (Fig. 3). Tectonic dip is 1-2° to the east and is consistent
throughout the area. Forty-five sedimentary logs were measured at a scale of 1:50 and used to
create thickness isopach and facies distribution maps.
Physical correlation of stratigraphic units was further constrained by walking out key
stratigraphic surfaces between logged sections identified on photo panels, Google Earth
imagery and aerial photographs (Fig. 4A). No single locality covers the full stratigraphic
succession, so the type section log is a composite of three main logged sections (Fig. 4B). A
paleocurrent database includes planar and trough cross-bedding foresets, cross-ripple
lamination, primary current lineation and channel-margin measurements (n = ~1,200).
Paleocurrent readings and sand body thicknesses have been referenced spatially within
ArcGIS to construct isopach thickness maps and aid in paleogeographic reconstructions. A
physical stratigraphic hierarchy based upon lithofacies, paleocurrent indicators and key
surfaces has been developed to capture features across multiple scales from bed to
depositional sequence (Fig. 5). For sandstones, the hierarchy of architectural elements from
smallest to largest includes bed, bedset, storey, channel-belt, channel-belt complex and
channel-belt complex set (hereafter, CS). The Klipkraal locality includes nine sandstone units
separated vertically by eight laterally extensive, generally poorly exposed mudstone units.
LITHOFACIES ANALYSIS
5
122
123
124
125
126
127
128
129
130
131
132
133
134
135
136
137
138
139
140
141
142
143
144
145
146

Sixteen lithofacies (Fig. 6) have been identified based on rock type, grain size,
thickness, sedimentary structures and color variations (Tables Table 1 and Table 2). Eight
facies comprise very fine- to lower medium-grained sandstone (S), two are intraformational
conglomerate (G) and six are from the mudstone (F) assemblage.
Lithofacies include massive fine-grained sandstone (Sm) (Fig. 6A), planar laminated
sandstone (Sh) (Fig. 6B), low angle (< 10°) cross-stratified sandstone (Sl) (Fig. 6C), high angle
(> 10°) planar cross-stratified sandstone (Sp) (Fig. 6D), trough cross-stratified sandstone (St),
ripple cross-laminated sandstone (Sr) (Fig. 6E), convolute laminated sandstone (Sd) and wavy
laminated sandstone (Sw), in accordance with Wilson et al. (2014). The conglomerates are
matrix supported (either mudstone or poorly-sorted sandstone) with intraformational clasts of
reworked calcrete nodules, mudstone and organic material distributed above erosion surfaces
(Gl) (Fig. 6F). Mudstone clast horizons (Gm) occur within the channelized deposits and have
smaller clast sizes and a predominantly sandy matrix (Fig. 6G). The main mudstone facies are
fissile purple mudstone (Fp), poorly sorted purple siltstone (Fpu) (Fig. 6H) and poorly sorted
green-gray-blue siltstone (Fggb) (Figures Fig. 6I and Fig. 6J). Bright green massive mudstone
(Fbg) (Fig. 6K), laminated organic-rich dark gray mudstone (Fgl) (Fig. 6L) and sharp-based
thinly bedded coarse-grained siltstone or very fine-grained sandstone (Fcs) are also present.
SAND BODY ARCHITECTURE AND HIERARCHY
Classifying sand bodies by using a hierarchical scheme simplifies comparison
between outcrop analogs and core data from subsurface reservoirs. Fluvial hierarchical
schemes (e.g., Allen 1983; Miall 1985; Bridge 1993) form a conceptual framework between
comparably scaled elements, which is especially important when creating geometrical
databases (Bridge 1993). The analysis of depositional architecture at different scales aids
6
147
148
149
150
151
152
153
154
155
156
157
158
159
160
161
162
163
164
165
166
167
168
169
170

with reconstructing the paleoenvironment and unravelling controls on deposition at a range of
spatial and temporal scales (Miall 1996).
Similarly to Wilson et al. (2014), this paper uses Chevron’s FRAC (Fluvial Reservoir
Architectural Classification) Scheme (Payenberg et al. 2011), which is based on that of Miall
(1996), and consists of dividing the stratigraphy into genetically related intervals, each related
to scale, environment, key surfaces and facies relationships (Fig. 5). A similar approach was
used in fluvial deposits of the Wasatch Formation, Utah, by Ford and Pyles (2014).
Architectural Elements
Eight architectural elements (LA, DA, FL, CH, AB, FF, FFL and SS) have been
identified based upon lithofacies associations, sedimentary structures, paleocurrent
observations, scale, vertical and lateral profile and geometries (Miall 1985; 1996) (Fig. 7A).
We distinguish two types of accretion sets, one with prominent surfaces and depositional
elements that dip at a high angle to paleoflow measured from ripple cross-laminated
sandstone (Sr) and the other type in which bedding inclination and paleocurrent indicators are
aligned. We interpret these very fine- to lower medium-grained sandstone facies (St, Sp, Sl,
Sh, Sw, Sm and Sr) as representing lateral accretion elements (LA) and downstream accretion
elements (DA), respectively. One distinctive style of accretion element consists of flat
lamination (FL) dominated deposits, largely consisting of upper phase plane bedding (Sh).
This style exists as an modification to the laminated sand sheets proposed by Miall (1996) as
upper flow regime structures can be observed throughout sand bodies in the lower Beaufort
Group forming standalone architectural elements, rather than being locally restricted to
deposition at the tops of barforms (e.g., Fielding 2006). Commonly, intraformational
conglomerates (Gl and Gm) overlie erosion surfaces towards the base of the larger scale
aggradational channel-fill elements (CH). Ripple-laminated, coarse-grained siltstones to fine-
7
171
172
173
174
175
176
177
178
179
180
181
182
183
184
185
186
187
188
189
190
191
192
193
194
195

grained sandstones, or mudstones within the upper sections of erosionally based lenticular
bodies commonly fine-upwards and are interpreted as channel-abandonment fill deposits
(AB). Channel-fill elements can also be categorized by their axial, off-axial and channel-
margin facies associations (Bridge 2006). Axial deposits comprise mainly lower fine- to
lower medium-grained sandstone (St, Sp, Sl, Sm) and intraformational conglomerates (Gm
and Gl), with abundant amalgamation, dm-scale beds and erosion surfaces. Channel margin
deposits are very fine- to lower fine-grained sandstone (Sr, Sh and Sl) and thinly bedded (cm-
scale). Off-axis deposits are transitional comprising both axial and marginal characteristics.
Purple, green and dark gray siltstone successions are interpreted as floodplain (FF)
and floodplain lake (FFL) deposits (Fig. 7B). These purple and green color variations, similar
to those described by Stear (1980) from the Beaufort Group and by Dubiel (1987) from the
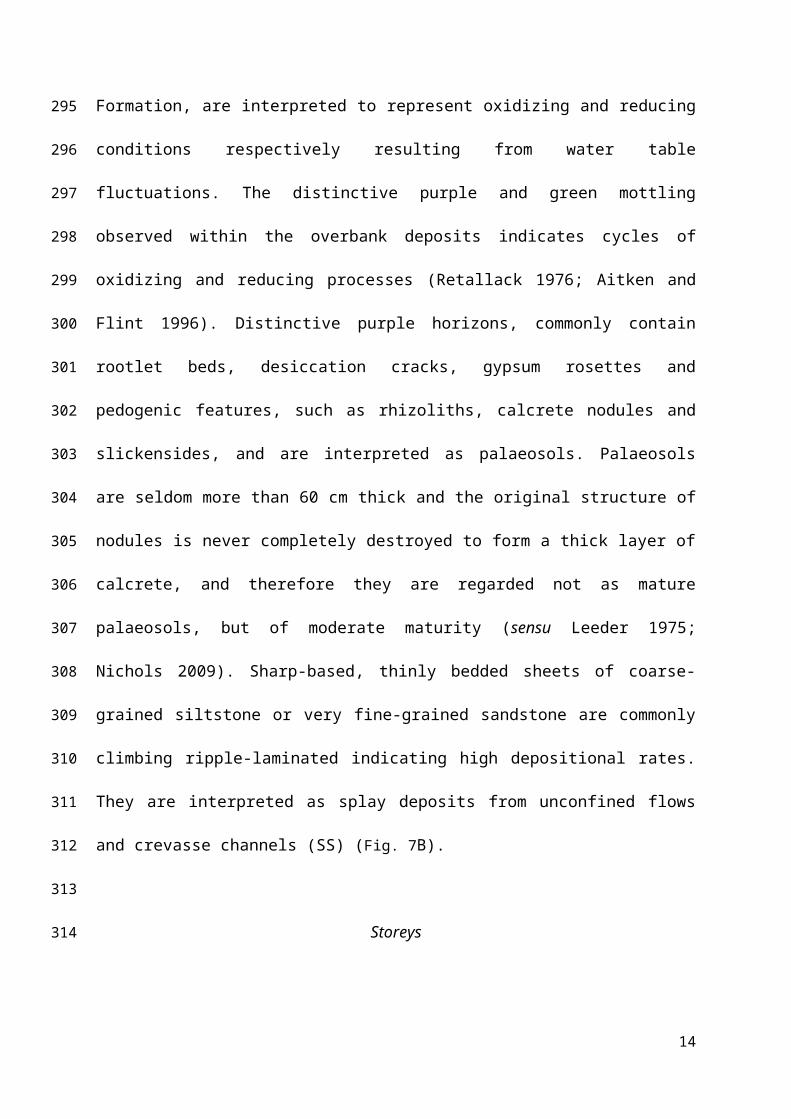
Upper Triassic Chinle Formation, are interpreted to represent oxidizing and reducing
conditions respectively resulting from water table fluctuations. The distinctive purple and
green mottling observed within the overbank deposits indicates cycles of oxidizing and
reducing processes (Retallack 1976; Aitken and Flint 1996). Distinctive purple horizons,
commonly contain rootlet beds, desiccation cracks, gypsum rosettes and pedogenic features,
such as rhizoliths, calcrete nodules and slickensides, and are interpreted as palaeosols.
Palaeosols are seldom more than 60 cm thick and the original structure of nodules is never
completely destroyed to form a thick layer of calcrete, and therefore they are regarded not as
mature palaeosols, but of moderate maturity (sensu Leeder 1975; Nichols 2009). Sharp-
based, thinly bedded sheets of coarse-grained siltstone or very fine-grained sandstone are
commonly climbing ripple-laminated indicating high depositional rates. They are interpreted
as splay deposits from unconfined flows and crevasse channels (SS) (Fig. 7B).
Storeys
8
196
197
198
199
200
201
202
203
204
205
206
207
208
209
210
211
212
213
214
215
216
217
218
219
220
A storey comprises bedsets (Fig. 7C) forming channel bar accretion deposits (LA, DA,
FL) with associated channel-abandonment fill (AB), such as a point bar with mud plug. In the
case of sinuous rivers, storeys will have an initiation margin and a cutbank, related to channel
migration within the channel-belt (Payenberg et al. 2011).
In a multi-storey sand body a storey boundary, when fully preserved, is marked by a
thin siltstone drape on the upper surface of the underlying storey that represents a pause in
fluvial deposition. This siltstone is commonly partly to completely eroded, in which case an
intraformational conglomerate marks the base of the next storey (Fig. 7D). The absence of
floodplain fines between storeys is interpreted as either indicating that there was insufficient
time between deposition of successive storeys for floodplain deposits to accumulate or the
lack of floodplain material may be attributed to erosion. The scour surfaces between stories
are equivalent to the third-order bounding surfaces of Miall (1996).
Channel-belt
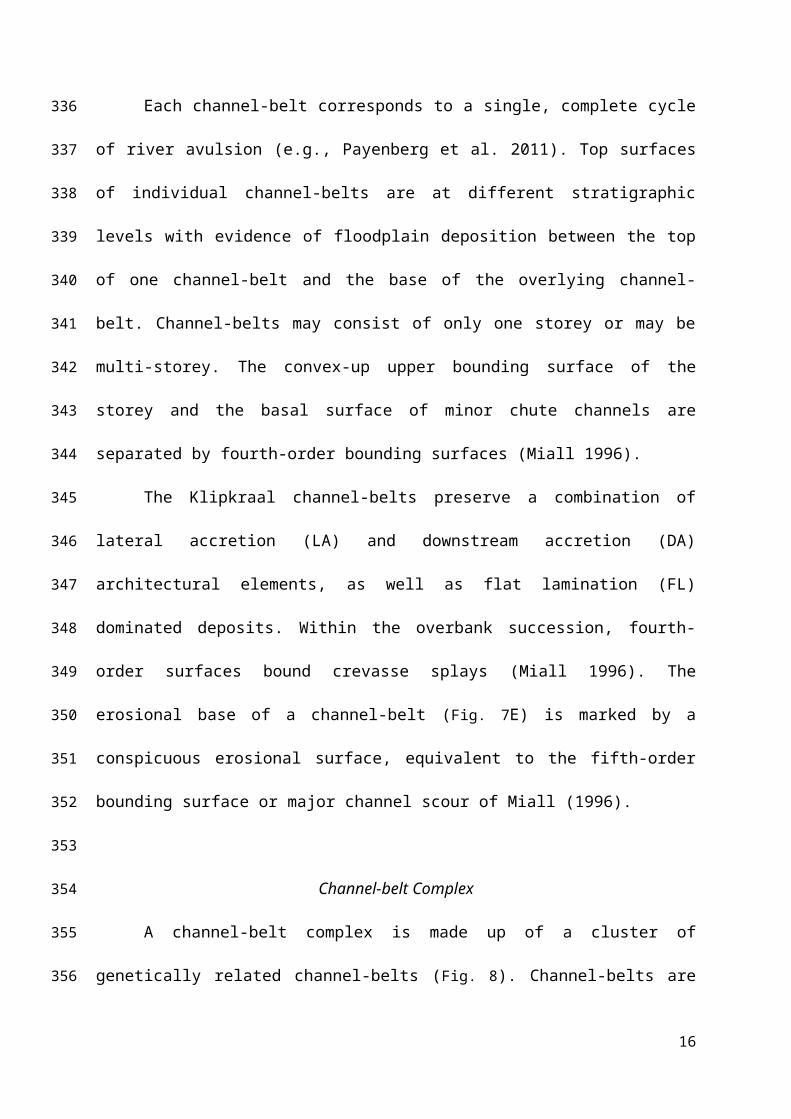
Each channel-belt corresponds to a single, complete cycle of river avulsion (e.g.,
Payenberg et al. 2011). Top surfaces of individual channel-belts are at different stratigraphic
levels with evidence of floodplain deposition between the top of one channel-belt and the
base of the overlying channel-belt. Channel-belts may consist of only one storey or may be
multi-storey. The convex-up upper bounding surface of the storey and the basal surface of
minor chute channels are separated by fourth-order bounding surfaces (Miall 1996).
The Klipkraal channel-belts preserve a combination of lateral accretion (LA) and
downstream accretion (DA) architectural elements, as well as flat lamination (FL) dominated
deposits. Within the overbank succession, fourth-order surfaces bound crevasse splays (Miall
1996). The erosional base of a channel-belt (Fig. 7E) is marked by a conspicuous erosional
9
221
222
223
224
225
226
227
228
229
230
231
232
233
234
235
236
237
238
239
240
241
242
243
244

surface, equivalent to the fifth-order bounding surface or major channel scour of Miall
(1996).
Channel-belt Complex
A channel-belt complex is made up of a cluster of genetically related channel-belts
(Fig. 8). Channel-belts are considered to be genetically related if they share a dominant
paleotransport direction and display similar architectures and scale, without which they
would be considered a random cluster (Wilson et al. 2014). Different channel-belt complexes
are typically separated vertically by laterally extensive overbank material, associated with a
channel-belt or complex elsewhere in the system. Channel-belt complexes can be subdivided
based upon high, moderate and low degrees of amalgamation of their constituent channel-
belts (Fig. 5). Styles of amalgamation include laterally and vertically stacked channel-belts
(Complex Type A) (Fig. 9) or sub-vertically stacked, aggradational channel-belts (Complex
Type B). The hierarchical scheme cannot be easily applied to the overbank deposits at the
complex and CS scales.
Channel-belt Complex Set (CS)
Complex sets constitute the highest-order hierarchical component recognized. The
stacking of two or more genetically related, partially amalgamated channel-belt complexes
forms a CS. Valley fills are complex sets, confined by a single composite master surface, but
have not been recognized in this study. CSs can also be subdivided based upon high,
moderate and low degrees of amalgamation of constituent complexes.
STRATIGRAPHIC DESCRIPTION
10
245
246
247
248
249
250
251
252
253
254
255
256
257
258
259
260
261
262
263
264
265
266
267
268

This section presents descriptions and interpretations for specific mapped units from
base to top of the 145 m thick succession. Sedimentary logs and log correlation panels are
presented in Figures Fig. 10-Fig. 12. Where appropriate, the quadrants defined in Figure Fig. 3
will be used to relate descriptions and accompanying paleogeographic reconstructions. The
well exposed channelized deposits and intercalated overbank mudstones have been mapped
in 3-D.
Overbank Interval A
The basal interval is a minimum of 13 m thick, but the base is not seen. Two light
gray planar laminated fine-grained sandstones (0.8 m and 1 m thick) have minimum
measured lateral extents of 700 m and are interpreted as crevasse splays (Fcs). Three purple
paleosols (Fp) each 15-40 cm thick are present in the lower half of the interval, in association
with the purple nodular facies (Fpu) and a 60 cm thick massive mudstone bed (Fbg). The
upper 9 m is dominated by green-gray siltstone (Fggb). Bioturbation within this interval is
rare and there is a 15 cm thick intermittent nodular horizon towards the top.
Channel-belt Complex 1
Complex 1 comprises two channel-belts, which become vertically separated by
overbank deposits towards the north-west (Fig. 13A). Maximum complex thickness is 11.35
m, with a true width (perpendicular to paleocurrent) of 800 m. The paleocurrent direction is
predominantly north-easterly in the channel-belts. The base of Complex 1 is marked by a 30-
70 cm thick brown intraformational conglomerate containing nodules and mudstone clasts
overlying an erosion surface that incises up to 3 m into Overbank Interval A.
The constituent storeys within channel-belts consist of Sl, Sr, (rare) Sp and Sm facies,
with minor St in the axis, organized into curved-crested dunes (~90 cm preserved dune
11
269
270
271
272
273
274
275
276
277
278
279
280
281
282
283
284
285
286
287
288
289
290
291
292
293

height). Off-axis the lower channel-belt comprises Sl, Gl and Gm. The upper channel-belt
contains two storeys, with a number of mudstone clast horizons (Gm).
In the north-eastern and south-western quadrants (Fig. 3), the complex comprises of
climbing ripple-laminated stacked gray-blue coarse siltstone and very fine-grained sandstone
beds. The beds thin to 10-15 cm and the overall thickness decreases to 0.7 m, making it
difficult to trace laterally. Paleocurrents are north to north-east and consistent with those from
the channel-belts. This relationship combined with mapping supports an interpretation that
Complex 1 is a terminal splay complex rather than a crevasse splay complex lateral to a
larger fluvial channel outside of the study area.
Overbank Interval B
Overbank Interval B, which is 6.4-19.25 m thick, overlies Complex 1 and is
dominated by green (and rare gray-green) siltstone (Fggb). A commonly mottled purple
siltstone (Fpu) midway through the unit consists of 5-40 cm thick beds with vertical pipe
burrows and moderate to intense bioturbation. Two paleosols (Fp) are common towards the
top as well as a traceable nodular horizon 2 m beneath the base of Complex 2. Immediately
above the mottled purple siltstone is an 85 cm thick coarse-grained siltstone to very fine-
grained sandstone deposit (Fcs) with distinct dm-scale climbing ripple-laminated beds with a
north-north-easterly paleocurrent direction, interpreted as a splay deposit.
Complex 2
Complex 2 comprises two channel-belts, each with two storeys. Main facies are Sh
and Sl towards the base, overlain by Sr. At the axis, Complex 2 reaches 8.1 m thick and has a
true width of 1,000 m. St is found midway up through the axis with Sp above. The lowermost
channel-belt scours into Overbank Interval B with a basal 30 cm thick intraformational
12
294
295
296
297
298
299
300
301
302
303
304
305
306
307
308
309
310
311
312
313
314
315
316
317
318

conglomerate (Gm). The channel-belts fine upwards with primary current lineations visible
on their flat tops. The channel-belts have wings, which are interpreted as deposits of overland
flow during peak discharge (sensu Stear 1983) and show some resemblance to channel-belt
Type 4 of Wilson et al. (2014).
Towards the south-western and north-eastern quadrants (Fig. 3), the component
channel-belts of Complex 2 pass into 1.5 m thick thinly bedded, very fine-grained sandstone,
fining-up into coarse-grained siltstone and these channel-belts become difficult to trace
laterally (Fig. 13B). Dominant facies are Sr and Sl, with occasional mudstone clasts (Gm) at
the base.
The main paleocurrent direction of Complex 2 is towards the north-northwest, where
sandstones grade laterally into siltstones. The downstream fining and paleocurrents support
an interpretation that Complex 2 represents a terminal splay complex.
Overbank Interval C
The 25 m thick Overbank Interval C is distinguished by purple siltstone (Fpu) and
five moderate maturity paleosols (Fp), in horizons up to 60 cm thick. This indicates well-
drained floodplain conditions (e.g., Retallack 1988). The Fpu facies consists of siltstone beds
10-60 cm thick. Thin bedded (~2 cm) bright green Fbg facies occur with green-gray siltstone
(Fggb) that has desiccation cracks on bed tops. Dark gray lacustrine (Fgl) mudstones and a
single 50 cm thick, climbing ripple-laminated, splay deposit (Fcs) are interbedded with the
Fpu and Fp facies. Exposure limitations prevent using the paleosols as regional marker beds.
Complex 3
Complex 3 has an estimated width of 1,250 m, is 10 m thick and comprises three
multi-storey channel-belts (Fig. 13C). The channel-belts thicken towards the north-east to
13
319
320
321
322
323
324
325
326
327
328
329
330
331
332
333
334
335
336
337
338
339
340
341
342
343

south-west trending axis of Complex 3 and consist of Sl facies with Sh and Sr (towards the
top) and minor St, Sp and Sm. Facies Gl (20 cm thick) is found above the basal erosional
surface of the complex, and commonly along storey boundaries. In places the beds appear
heterolithic, mottled and intensely bioturbated, with parting lineation apparent towards the
tops of channel-belts.
The lower two channel-belts are made up of fining-upward sandstones with low angle
internal dipping surfaces (< 10°) to the north-north-east. Paleoflow indicators from current
ripples (Sr) and cross-stratified dunes (Sl, St and Sp) are to the east, and thus are
perpendicular to these low angle surfaces that are therefore interpreted as lateral accretion
surfaces (LA). Due to the presence of lateral accretion surfaces the channels are interpreted to
be moderate to high sinuosity. Channel-belt 5 is an erosional remnant and in places is fully
removed, with ~6.5 m of incision on the base of Channel-belt 6. The lower two channel-belts
have up to three adjacent splay deposits with paleocurrents to the north-east and north.
Channel-belt 7 trends west-north-west and contains large barforms (~3 m high) with foresets
that dip consistently west, interpreted as downstream accretion surfaces (DA). Ripple cross-
lamination up the foresets is interpreted as backflow ripples, which are likely to have formed
as a result of a vortex and secondary flow up the bedform front (Boersma et al. 1968). The
youngest storey within Channel-belt 7 consists of flat-lamination dominated accretion
deposits (FL) with an abundance of Sh facies.
Overbank Interval D
Overbank Interval D is poorly exposed, 17.25 m thick and predominantly gray-green
with an occasional blue tinge and purple mottling. Fggb is the main facies with beds 10-40
cm thick. In its thicker sections the interval fines upward from coarse siltstone at the base to
fine siltstone with nodules. Two purple paleosols (Fp), 10-50 cm thick, are present in the
14
344
345
346
347
348
349
350
351
352
353
354
355
356
357
358
359
360
361
362
363
364
365
366
367
368
lower part of the unit, with a 65 cm moderately bioturbated crevasse splay towards the
middle.
Complex 4
Complex 4 is up to 11 m thick, with a corrected width of 1,200 m (Fig. 13D). It
includes three channel-belts which range in width between 250 and 700 m, each narrowing
down-dip. Dominant paleocurrent trend is north-eastward.
Main facies include Sl, Sm, and Sh, with minor Sp, Sr, St and Sw. Each channel-belt
has an erosive base, with a rounded top and minor bioturbation throughout. The oldest
channel-belt, trending north-north-east, has an associated splay (coarse-grained siltstone and
very fine-grained sandstone) to the north-east. The splay now only forms an erosional
remnant, largely cut out by Channel-belt 9, within the south-eastern quadrant (Fig. 3). This
accounts for the complex being absent across part of the north-eastern quadrant, where the
channel-belts have slightly different orientations.
Overbank Interval E
The interval is 18 m thick and dominated by green-gray-blue fine to coarse siltstone
(Fggb), weathering green-brown with a weak fining upward trend. Where it is thickest a red-
purple paleosol (Fp) and purple siltstone (Fpu) horizon (~80 cm thick) containing calcrete
nodules is commonly present approximately 12 m above the base. A single 0.6-1.7 m thick
climbing ripple laminated splay (Fcs) lies in the lower section.
Complex 5
Complex 5 is up to 12.25 m thick and at least 1,200 m wide, comprising two channel-
belts. Paleocurrents vary between north-north-west and north-east ( Fig. 14A). Complex 5 is
15
369
370
371
372
373
374
375
376
377
378
379
380
381
382
383
384
385
386
387
388
389
390
391
392
393

absent in the north-eastern quadrant (Fig. 3) and towards the west of the study area due to
incision at the base of Complex 6.
Overbank Interval F
Overbank Interval F is the thinnest of the fine-grained units (6.3 m), is poorly exposed
and widely absent due to erosion at the base of Complex 6. The main facies is green-gray
siltstone (Fggb), with a 1.8 m thick Fp facies containing rootlets and a nodular Fpu horizon.
This unit is less bioturbated than the underlying intervals.
Complex 6
The base of Complex 6 is marked by the deepest incision surface of the entire study
area. The complete complex measures 20.35 m thick, with an estimated minimum width
perpendicular to paleocurrent of 2 km. Paleocurrents are predominantly towards the north-
north-east, but with scatter to the west ( Fig. 14B). The complex contains three channel-belts
of ~5 m, 9 m and 6 m thick (lower, middle and upper channel-belts, respectively). They are
laterally offset stacked towards the east and contain the greatest abundance of
intraformational conglomerates. These high energy Gl and Gm facies are up to 1.4 m thick
and contain rounded nodules, mudstone clasts and bone fragments, with laminated sandstone
stringers, muddy drapes, and dune scale cross-bedding (dips of up to 22°). Sandstones
overlying the intraformational conglomerates contain 10 cm thick siltstone drapes to foresets,
deposition during waning flood conditions (e.g., Fielding et al. 2009). Beds of siltstone that
onlap erosion surfaces are interpreted as marking periods of sediment bypass during high
flood stages, as documented in the Chinle Formation of Utah (Trendell et al. 2013).
In the north-eastern quadrant (Fig. 3), Complex 6 fully cuts out Overbank Interval F
and Complex 5 with more than 9 m of composite erosion (Fig. 11). Complex 6 is
16
394
395
396
397
398
399
400
401
402
403
404
405
406
407
408
409
410
411
412
413
414
415
416
417
418
architecturally similar to the unconfined, strongly amalgamated sheet complex described by
Wilson et al. (2014) and interpreted to be a product of limited accommodation.
Overbank Interval G
Overbank Interval G is 11.35 m thick and poorly exposed. Gray siltstone (Fggb) is the
dominant facies indicating a poorer drainage condition compared to the overbank intervals
below. Only minor Fpu and two Fp facies are present and no splay deposits are observed.
Complex 7
Complex 7 has a minimum true width of 2.2 km ( Fig. 14C), is up to 15 m thick in the
west and completely truncates Overbank Interval G and Complex 6 in the north-eastern
quadrant (Fig. 3). Of the two channel-belts, the oldest is a 6 m thick erosional remnant with
three storeys (~1 m, 3 m and 2 m thick). Paleocurrents trend towards north-west to north-east.
The complex contains only minimal Gl facies, suggesting that the rivers were less incisional
and of lower energy than in Complex 6. There are no splay deposits within the complex and
bioturbation is rare.
Overbank Interval H
Overbank Interval H is up to 11.8 m thick and comprises green-gray structureless,
very fine-grained to medium-grained siltstone (Fggb), with bed thicknesses varying between
30-50 cm.
Complexes 8, 9 and Overbank Interval I
Above Complex 7 exposure is limited, with the youngest complexes and overbank
intervals largely exposed in the north-eastern quadrant. Complex 8 is 5.25-8.35 m thick and is
17
419
420
421
422
423
424
425
426
427
428
429
430
431
432
433
434
435
436
437
438
439
440
441
442
443

erosionally truncated by Complex 9 (2.1-4.5 m thick). Width estimates of complexes 8 and 9
cannot be made due to the poor exposure. Intervening Overbank Interval I is poorly exposed,
up to 8.1 m thick and mainly green in color. A 20 m thick, laterally extensive, poorly exposed
overbank unit caps Complex 9.
Channel-belts within Complex 8 and Complex 9 are flat topped, a feature commonly
recognized by Wilson et al. (2014) in the lower Beaufort Group. Lower fine-grained to upper
fine-grained sandstone is dominant, with minor intraformational conglomerate. Sl is common
throughout, although there are rare examples of Sm. No bioturbation is recognized.
STRATIGRAPHIC SUMMARY
Between complexes 1 and 6, there is an overall upward increase in individual
channel-belt thickness (< 2 m to > 8 m), complex thickness (8 m to > 20 m) and an increased
amount of incision at the base of each successive complex (< 3 m to > 9 m). This incision
results in increased amalgamation up-stratigraphy and a greater proportion of channel-belt
sandstone to overbank mudstone, along with an increased abundance of intraformational
conglomerate facies (Fig. 15). Above Complex 6, the trends appear to reverse, as channel-belt
thickness, complex thickness and the amount of amalgamation decreases. Channelized facies
vary from thinly bedded climbing ripple-laminated, lower fine-grained sandstones in
complexes 1 and 2, to thicker bedded (up to 50 cm) coarser grained deposits (upper fine- to
medium-grained) dominated by steeper cross-stratification (dips of up to 22°) up-
stratigraphy.
Channel-belts in complexes 5, 6 and 7 are interpreted as having been deposited by
lower sinuosity rivers than channel-belts in complexes 3 and 4. The channel-belt deposits of
complexes 5, 6 and 7 are characterized by steeply dipping cross-stratified dunes (dips of up to
20°) in the downstream direction and upper phase plane beds. The abundance of these upper
18
444
445
446
447
448
449
450
451
452
453
454
455
456
457
458
459
460
461
462
463
464
465
466
467
468

flow regime structures combined with a complicated internal architecture support the
interpretation of a flashy discharge, characterized by highly variable flow conditions (Stear
1978; Turner 1981; 1983; Stear 1985; Smith et al. 1993; Fielding 2006; Fielding et al. 2009;
Wilson et al. 2014).
The older floodplain deposits are typically reddened with pedogenic features. Unit
tops are marked by the abrupt juxtaposition of green-gray-blue siltstone over purple siltstone,
the surface of which is interpreted to represent a rapid rise in water table. At a bed scale,
Overbank Intervals A to C include up to 6 m thick successions of green-gray siltstone that
fine upwards into distinctive purple claystone, which we interpret as a drying-upward trend
(Blakey and Gubitosa 1984; Gallois 2008). One explanation for the distinctive color cyclicity
is that the deposits formed in shallow ephemeral playa lakes that periodically dried up,
leaving desiccation cracks overlain by reddened mudstones. The base of each of these
interpreted reducing-oxidizing cycles is marked by a paleosurface, representing a break in
deposition, perhaps indicating channel abandonment.
Towards the middle of the Klipkraal succession (Complex 3), both the splay deposits
and channel-belts become more intensely bioturbated (both vertical and horizontal burrows).
There is a marked upward decrease in the number of splay deposits, red beds and paleosols,
with none present from Complex 5 upwards. Instead, green-gray siltstones become more
common within the younger stratigraphy. These bed- to complex-scale thickness variations
and changes in facies and erosion are indicative of an increase in energy and wetness within
both the channelized and overbank deposits.
The nine channel-belt complexes have been grouped into four complex sets based on
similarities in mean grain size, facies and thicknesses of channel-belt complexes. The same
level of hierarchy cannot be accurately applied to the mudstone successions between complex
sets due to exposure limitations and therefore the hierarchy is biased towards the channel-
19
469
470
471
472
473
474
475
476
477
478
479
480
481
482
483
484
485
486
487
488
489
490
491
492
493
belts. This descriptive scheme is not tied to sequence stratigraphy, as shown by the grouping
of channel-belt complexes 5, 6 and 7 into one complex set to capture connectivity style, while
acknowledging that this increased connectivity is due to an interpreted sequence boundary at
the base of Complex 6 (see below). Thicknesses for each complex set are calculated using the
type section log in Figure Fig. 15 and their key characteristics are discussed below.
Complex Set 1 (CS 1)
Complex 1 and Complex 2 share similar sedimentary facies and thickness. Together
with Overbank Interval B they are interpreted to form CS 1, which is 19 m thick (Fig. 16).
Within the dome quadrant (Fig. 3), the splay deposits of both complexes appear to
amalgamate locally to form a splay complex set.
Complex Set 2 (CS 2)
Complex 3 and Complex 4 are aggradational units, with similar channel-belt
thicknesses, facies proportions and grain size and are interpreted to form CS 2, together with
Overbank Interval D. Locally the two complexes vertically amalgamate. CS 2 is 22 m thick
and is interpreted as comprising moderate to high sinuosity channel-belts.
Complex Set 3 (CS 3)
CS 3 includes Complexes 5, 6 and 7 together with overbank intervals F and G and
reaches 36 m thick. Little overbank material is preserved due to the extensive incision;
however that which remains is less well-drained with fewer paleosols. All three complexes
are amalgamated locally. Splay deposits are absent.
Complex Set 4 (CS 4)
20
494
495
496
497
498
499
500
501
502
503
504
505
506
507
508
509
510
511
512
513
514
515
516
517
518
Poorly exposed CS 4 comprises amalgamated complexes 8 and 9. In places, Overbank
Interval I has been completely removed by erosion at the base of complex 9. From the type
section log (Fig. 16) CS 4 has a minimum preserved thickness of 12.05 m. The channel-belts
within CS 4 are commonly fine-grained sandstones, with limited bioturbation and a north-
eastward paleocurrent trend.
21
519
520
521
522
523
DISCUSSION
Stratigraphic Trends
The distribution of facies and architectural elements indicates that the channel
complexes 1 and 2 (the lower part of CS 1) represent distributive channels that cut into splay
deposits. A compensational stacking pattern is evident, where Complex 2 is laterally offset
from Complex 1, which may indicate avoidance of depositional relief generated above
Complex 1, relocating to the lowest point on the floodplain, in a manner described by Straub
et al. (2009) for the Mississippi River deposits and Hajek et al. (2010) for the late Cretaceous-
Paleogene Ferris Formation of Wyoming. Mean paleocurrent directions change up
stratigraphy, from north and north-west directed in the two complexes of CS 1, to north-
eastwards in complexes 3 to 9 (CS 2 to CS 4). The north-easterly paleoflow is consistent with
the regional north-east direction of main Beaufort channel systems (Johnson et al. 1997;
Wilson et al. 2014).
Overbank Interval C contains the greatest number of paleosols and the lowest
proportion of green siltstone, implying that maximum floodplain dryness is recorded at this
part of the stratigraphy. Five moderate maturity paleosols including the thickest paleosol (60
cm) in the measured section are rooted and contain calcrete, signifying prolonged periods of
relative climatic stability, which enabled soil development (Ruskin and Jordan 2007). Coarse
green siltstones of Overbank Interval D are interpreted as poorly drained to lacustrine,
resulting in reducing conditions and mark a wetting-upward trend from Overbank Interval C
to D. Overbank Interval D contains beds that are moderately to intensely bioturbated and
includes a 25 to 35 cm thick bed of dark gray laminated carbonaceous siltstone interpreted to
represent a period of localized oxygen-limited, ponded water conditions. Maximum wetness
in the succession is interpreted to be within the lower part of Overbank Interval D.
22
524
525
526
527
528
529
530
531
532
533
534
535
536
537
538
539
540
541
542
543
544
545
546
547

The channel-belts in complexes 5, 6 and 7 (CS 3) display a low- to moderate-
sinuosity with abundant examples of downstream accretion (Fig. 7D). Overall the fluvial
system shows an increase in energy and grain size range up stratigraphy until the highly
incisional Complex 6, consisting of dune-scale cross-bedded sandstones and intraformational
conglomerates. Above Complex 6 the trends appear to reverse and the floodplain deposits
above Complex 9 reach 20 m in thickness.
Controls on Stratigraphy
The stratigraphic organization of the Klipkraal section is discussed in terms of two
possible models, both of which show a partial fit to the dataset; these are a trunk river model
(e.g., Cowan 1993) and a progradational DFS model (e.g., Weissmann et al. 2013) (Fig. 16).
The effects of autogenic processes, such as lateral channel migration, and far field controls
such as climatic variability and sediment supply, are later discussed within the context of
these models.
A sequence stratigraphic approach can be used to interpret the evolutionary changes
observed up stratigraphy. The Beaufort Group conformably overlies marine deltaic strata of
the Waterford Formation and the rivers at least in the lower part of the Beaufort Group were
connected to a shoreline towards the north-east (Smith et al. 1993; Wilson et al. 2014). In
fluvial sequence stratigraphy regional water table is commonly used as a landward extension
of relative sea level (Shanley and McCabe 1994; Aitken and Flint 1995; Swenson et al. 2000;
Catuneanu 2002; Blum et al. 2013), with lakes and poorly drained floodplain deposits
associated with times of relative sea level rise (Shanley and McCabe 1994). Relative sea level
fall results in water table fall and river incision, producing typical low accommodation facies
associations that include mature paleosols marking interfluve sequence-boundaries (Aitken
and Flint 1996; O’Byrne and Flint 1996; McCarthy and Plint 1998; Hajek et al. 2010). Rivers
23
548
549
550
551
552
553
554
555
556
557
558
559
560
561
562
563
564
565
566
567
568
569
570
571
572

increase in grade and deliver sediment to lowstand shorelines (Shanley and McCabe 1994;
Holbrook et al. 2006; Leleu et al. 2010). Depending on the amount of relative sea level fall
and physiography of the alluvial to coastal plain, rivers may cut valleys during relative sea
level fall.
The study section lies approximately 700 m above the Waterford/Beaufort contact and
the lower Beaufort succession is characterized by a generally aggradational stacking pattern
of channel-belts, with incised valleys only present in the lowermost fluvial stratigraphy
(Wilson et al. 2014). No marine deposits are reported from the succession and the time-
equivalent shoreline during development of the river system was an unknown distance to the
north-east of the Klipkraal study area (possibly > 100 km). Regional tectonic dip to the east
means that the time equivalent down dip stratigraphy is in the subsurface. The aggradational
stacking pattern of the lower Beaufort suggests a balance between subsidence rate and
sediment supply through time.
Despite the semi-arid climate, evidence for the maintenance of a high water table
level throughout CS 2 includes the high intensity of bioturbation and gray mudstone
indicative of poor drainage/standing water conditions in the middle of the section. This
‘maximum wetness’ section is tentatively interpreted to contain the non-marine equivalent of
a maximum flooding surface, sensu Shanley and McCabe (1994). The section also shows the
highest volume of preserved floodplain deposits, indicative of high accommodation, but
larger scale mapping of this zone is needed to confirm regional significance.
The upward increase in incision at channel-belt bases, reaches a maximum at the base
of Complex 6, which exhibits 9 m of erosional relief. Coupled with the low degree of
preservation of floodplain fines at this level, these observations are consistent with a
minimum accommodation state and the base of complex 6 is interpreted as a sequence
boundary (sensu Shanley and McCabe 1994). The implication of a sequence boundary is that
24
573
574
575
576
577
578
579
580
581
582
583
584
585
586
587
588
589
590
591
592
593
594
595
596
597

a substantial period of time is locked up on this surface and there is no genetic relationship
between the strata below and the strata above (Van Wagoner et al. 1990). This means that,
while useful for understanding sand body connectivity in a hydrocarbon reservoir sense, CS 3
should not be regarded genetically as one complex set.
Similar fluvial architecture to CS 3, from the temperate to humid Balfour Formation,
higher in the Beaufort Group, has been described as tectonically influenced (Catuneanu and
Elango 2001). However, in the Klipkraal section the absence of significant thickness changes
and the uniformity of architectural patterns do not support a tectonic control on the
stratigraphic cyclicity; although the scale of the study area may be too small to accurately
reject this. At a higher resolution the regular (0.5 m to 6 m thick) drying upward cycles may
reflect high resolution climatic cycles superimposed on the accommodation/sediment supply
balance.
Axial Trunk River Model.— In this scenario the splay deposits of complexes 1 and
2 would represent crevasse splays fed by crevasse channels, all lateral to a larger scale
longitudinal trunk river system. The predominantly NW-directed paleocurrents in these lower
units compared to the north-east flow directions in the overlying, larger scale, more incisional
channel-belts would fit this model. The compensational stacking of channel-belt/splay
complexes in the lowermost stratigraphy is interpreted to be a result of autogenic channel
avulsion, supported by no distinct grain size variation between Complex 1 and Complex 2
and an absence of significant erosion. The larger channel-belts in CS 3 (predominantly within
complexes 6 and 7) would represent the migration of the axis of the trunk river system into
the study area. However the architecture and facies distributions, including the maximum
wetness zone and the deep incision associated with Complex 6, may indicate modification of
a simple trunk fluvial system by allogenic factors, such as subsidence and climate.
25
598
599
600
601
602
603
604
605
606
607
608
609
610
611
612
613
614
615
616
617
618
619
620
621
622
Arguments against a trunk river model include the consistent paleocurrents in early (frontal)
splays and younger channel complexes, and the presence of splay complexes only in the
lower stratigraphy, interpreted as precursors to the prograding fluvial system. In an axial river
system that reoccupied the flood plain area multiple times, we would expect splay systems to
precede each reoccupation of the floodplain by the trunk river.
Progradation of a Distributive Fluvial System (DFS).— An alternative hypothesis
to the trunk river and lateral splays model to explain the stratigraphic evolution of the
Klipkraal succession is that of a DFS. Distributive fluvial systems, if progradational, are
marked by an upward increase in grain size, and an upward trend towards increasingly well-
drained floodplain and increased channel-belt amalgamation (Nichols and Fisher 2007;
Weissmann et al. 2011b; Davidson et al. 2013; Weissmann et al. 2013). As documented
above, the Klipkraal stratigraphy shows an upward-coarsening and increase in channel-belt
size and clustering, which fits a prograding DFS model. The maximum incisional base of
Complex 6 may represent the point of maximum alluvial progradation, followed by gradual
retreat or lateral switch in the axis of the DFS to explain the upward decrease in sandstone
amalgamation and content from Complex 7 upwards (Fig. 17).
A major river channel can form part of a larger DFS as it shifts position across the fan
or it can be an axial trunk river system with sediment supplied by a DFS (Hartley et al.
2010a; Weissmann et al. 2010); as such, the DFS and axial system can coexist in time, but the
two models remain mutually exclusive. A key difference between a trunk river model and a
DFS model is that in the DFS scenario the lower stratigraphy of CS 1 and CS 2 would be
interpreted as distal distributive terminal splay systems, rather than lateral crevasse splays
from a trunk river. If the terminal reaches of a DFS are beneath the study section and CS 1
represents the distal reaches of a DFS, the model predicts the paleosols to be poorly-drained,
26
623
624
625
626
627
628
629
630
631
632
633
634
635
636
637
638
639
640
641
642
643
644
645
646
647

rather than the moderately mature, well-drained soils observed. Likewise the paleosols within
CS 3 are not well-drained and so do not fit with the predicted character of proximal
floodplain deposits in a DFS model.
A similar up-section increase in grain size, amalgamation and channel-belt thickness
has also been described by Trendell et al. (2013) for the Triassic Chinle Formation of Utah
and is interpreted as recording deposition in a progradational DFS (Weissmann et al. 2013).
Just like for CS 1, the Blue Mesa Member of the Chinle Formation has also been interpreted
as distal DFS deposits (Trendell et al. 2013) due to the increased mudstone to sandstone ratio,
more mature sediments and high accommodation setting. The documented up-section
increase in well-drained floodplain within the Chinle Formation (Trendell et al. 2013)
contrasts with the poorly-drained overbank conditions observed in the upper zones at
Klipkraal (CS 3 and CS 4). These increasingly well-drained paleosols from the Chinle
Formation are attributed to deposition in more upland positions during fan or avulsion-
complex progradation, rather than any change in climate (Trendell et al. 2013). Turner (1977)
suggested that the lower Beaufort Group was also subjected to repeated river avulsions.
Various studies associate these unstable, avulsive systems with semi-arid climatic settings
and highly variable, flashy discharges (e.g., Kelly and Olsen 1993; Trendell et al. 2013), like
those responsible for depositing the Klipkraal succession.
The progradational DFS model (e.g., Nichols and Fisher 2007; Hartley et al. 2010b;
Weissmann et al. 2011b; 2013) offers limited consideration to base level change, in contrast
to more traditional trunk river-dominated models (e.g., Wright and Marriott 1993; Shanley
and McCabe 1994; Holbrook et al. 2006). The gradual up-section increase in grain size,
amalgamation and thickness of channel-belts and complexes in the lower to middle
succession is interpreted to represent a progradational DFS, influenced by climatic cycles that
are preserved in the floodplain deposits as small-scale drying upward cycles, not fully in
27
648
649
650
651
652
653
654
655
656
657
658
659
660
661
662
663
664
665
666
667
668
669
670
671
672

phase with the progradation. At the base of CS 3, the abrupt increase in channel-belt
connectivity and reduced preservation of floodplain deposits is interpreted as a low-
accommodation system, similar to that described by Wilson et al. (2014). We therefore
conclude that the stratigraphy preserves the partly competing effects of accommodation,
sediment supply and lobe switching, along with high-frequency climate cyclicity, all
superimposed on a weakly prograding DFS. We propose that the DFS model also needs to
better incorporate the effects of these mechanisms on progradational stratigraphy..
Limitations of the Dataset
The Klipkraal stratigraphy only represents a minor part of the Abrahamskraal
Formation and distributive fluvial systems span tens to hundreds of km in radius (Nichols and
Fisher 2007). Criteria used to distinguish prograding DFSs in the modern and ancient record,
such as the characteristic upward increase in grain size, amalgamation and proportion of
sandstone (e.g., Trendell et al. 2013; Weissmann et al. 2013), cannot be fully applied here.
The study area provides only a glimpse into the evolution of the larger depositional system
and subsequently may be too small to objectively decide between the models of an axial
trunk river and a major river associated with a prograding DFS. However, when this dataset
is integrated into the more regional (7,000 km2) study of Wilson et al. (2014), which showed
consistent paleocurrents to the NE with some spread, the evidence for a DFS model increases.
This is further supported by regional radial paleocurrent dispersal patterns reported by earlier
workers (Jordaan 1990; Cole and Wipplinger 2001). Significantly, Wilson et al. (2014) found
no evidence for any axial trunk river deposits in the larger Beaufort area.
The 3-D control afforded by the outcrop belt highlights the lateral and stratigraphic
variability in fluvial-overbank architecture, and the challenge in untangling the interplay of
controls on fluvial stratigraphy. The study section demonstrates the relationship between
28
673
674
675
676
677
678
679
680
681
682
683
684
685
686
687
688
689
690
691
692
693
694
695
696
697

several allogenic forcing factors on fluvial deposits, which principally include
accommodation driven by subsidence and changes in sediment supply.
29
698
699
CONCLUSIONS
The observed up-section progradation occurs over a relatively narrow succession (145
m) with splay deposits only abundant in the lowermost intervals (Fig. 15). If these splays
happened to correspond to deposition within part of a major trunk river system, their presence
would be expected throughout the entire stratigraphic section as precursors to each channel
reoccupation, which is not seen here. The findings outlined in this study of the lower
Beaufort Group, combined with the prevalence of upper flow regime structures within what
are largely interpreted low sinuosity channel-belts with a narrow paleocurrent range, favor
the model of a DFS. This is further supported by regional radial paleocurrent dispersal
patterns (Jordaan 1990; Johnson et al. 1997; Cole and Wipplinger 2001) and the recent work
of Wilson et al. (2014) who concluded that the large-scale architecture of the Beaufort system
is consistent with deposition in an aggrading fluvial megafan.
In summary, the Klipkraal section best reflects a prograding DFS under conditions of
flashy discharge influenced by high frequency climate cycles, also expressed in the mudrock
color changes and distribution of paleosols (Fig. 17). These cycles complicate the gradual
drying upward trend in overbank deposits proposed in DFS models. The abrupt increase in
channel-belt amalgamation and lack of floodplain preservation associated with channel-belt
CS 3 is interpreted to reflect sequence boundary formation and a basinward facies shift that
forced progradation beyond the rate predicted in DFS models. The next stage in refining DFS
models will be the incorporation of the effects of base level transit cycles on the robust long
term progradation model.
30
700
701
702
703
704
705
706
707
708
709
710
711
712
713
714
715
716
717
718
719
720
721

ACKNOWLEDGEMENTS
The authors are extremely grateful to Chevron Australia Pty Ltd. for financially
supporting this research. Andrew Wilson, John Kavanagh, Laura Fielding, Ashley Clarke and
Janet Richardson are acknowledged for their assistance in the field, as are the farmers in the
Sutherland area for kindly permitting access to their land. In addition we would like to thank
all members of the Beaufort Project, namely Tobias Payenberg, Anne Powell, Andy Palfrey,
Jösta Vermeulen and Emma King. Thanks also to Brian Willis, Bryan Bracken and Kristy
Milliken for helpful discussions. This manuscript has benefited from thorough and helpful
reviews by Timothy Lawton, Colin North and Associate Editor Martin Gibling.
31
722
723
724
725
726
727
728
729
730

REFERENCES
Aitken, J.F., and Flint, S.S., 1995, The application of high-resolution sequence stratigraphy to
fluvial systems: A case study from the Upper Carboniferous Breathitt Group, eastern
Kentucky, U.S.A.: Sedimentology, v. 42, p. 3-30.
Aitken, J.F., and Flint, S.S., 1996, Variable expressions of interfluvial sequence boundaries in
the Breathitt Group (Pennsylvanian), eastern Kentucky, U.S.A.: Geological Society,
London, Special Publications, v. 104, p. 193-206.
Allen, J.R.L., 1983, Studies in fluviatile sedimentation: Bars, bar-complexes and sandstone
sheets (low-sinuosity braided streams) in the brownstones (L. Devonian), Welsh
borders: Sedimentary Geology, v. 33, p. 237-293.
Archer, A.W., and Greb, S.F., 1995, An Amazon-scale drainage system in the Early
Pennsylvanian of central North America: The Journal of Geology, p. 611-627.
Blakey, R.C., and Gubitosa, R., 1984, Controls of sandstone body geometry and architecture
in the Chinle Formation (Upper Triassic), Colorado Plateau: Sedimentary Geology, v.
38, p. 51-86.
Blum, M.D., Martin, J., Milliken, K., and Garvin, M., 2013, Paleovalley systems: Insights
from Quaternary analogs and experiments: Earth-Science Reviews, v. 116, p. 128-
169.
Boersma, J.R., Van De Meene, E.A., and Tjalsma, R.C., 1968, Intricated cross-stratification
due to interaction of a mega ripple with its lee-side system of backflow ripples (upper-
pointbar deposits, Lower Rhine) Sedimentology, v. 11, p. 147-162.
Bridge, J.S., 1993, Description and interpretation of fluvial deposits: A critical perspective:
Sedimentology, v. 40, p. 801-810.
32
731
732
733
734
735
736
737
738
739
740
741
742
743
744
745
746
747
748
749
750
751
752
753

Bridge, J.S., 2003, Rivers and floodplains: Forms, processes, and sedimentary record:
Oxford, Blackwell Science, 491 p.
Bridge, J.S., 2006, Fluvial facies models: Recent developments, in Posamentier, H.W., and
Walker, R.G., eds., Facies Models Revisited: Tulsa, Oklahoma, SEPM Special
Publication 84, p. 85-170.
Bromley, M.H., 1991, Architectural features of the Kayenta Formation (Lower Jurassic),
Colorado Plateau, U.S.A.: Relationship to salt tectonics in the Paradox Basin:
Sedimentary Geology, v. 73, p. 77-99.
Cant, D.J., and Walker, R.G., 1978, Fluvial processes and facies sequences in the sandy
braided South Saskatchewan River, Canada: Sedimentology, v. 25, p. 625-648.
Carter, D.C., 2003, 3-D seismic geomorphology: Insights into fluvial reservoir deposition and
performance, Widuri field, Java Sea: AAPG Bulletin, v. 87, p. 909-934.
Catuneanu, O., 2002, Sequence stratigraphy of clastic systems: Concepts, merits, and pitfalls:
Journal of African Earth Sciences, v. 35, p. 1-43.
Catuneanu, O., and Elango, H.N., 2001, Tectonic control on fluvial styles: The Balfour
Formation of the Karoo Basin, South Africa: Sedimentary Geology, v. 140, p. 291-
313.
Cleveland, D.M., Atchley, S.C., and Nordt, L.C., 2007, Continental sequence stratigraphy of
the Upper Triassic (Norian Rhaetian) Chinle Strata, northern New Mexico, U.S.A.:
Allocyclic and autocyclic origins of paleosol-bearing alluvial successions: Journal of
Sedimentary Research, v. 77, p. 909-924.
Cole, D.I., and Wipplinger, P.E., 2001, Sedimentology and molybdenum potential of the
Beaufort Group in the main Karoo basin, South Africa: Council for Geoscience,
Memoir, v. 80, p. 225.
33
754
755
756
757
758
759
760
761
762
763
764
765
766
767
768
769
770
771
772
773
774
775
776
777
Collinson, J.D., 1996, Alluvial sediments, in Reading, H.G., ed., Sedimentary environments:
Processes, facies, stratigraphy: Oxford, Blackwell Science, p. 37-82.
Cowan, E.J., 1993, Longitudinal fluvial drainage patterns within a foreland basin-fill: Permo-
Triassic Sydney Basin, Australia: Sedimentary Geology, v. 85, p. 557-577.
Davidson, S.K., Hartley, A.J., Weissmann, G.S., Nichols, G.J., and Scuderi, L.A., 2013,
Geomorphic elements on modern distributive fluvial systems: Geomorphology, v.
180-181, p. 82-95.
Day, M.O., and Rubidge, B.S., 2014, A brief lithostratigraphic review of the Abrahamskraal
and Koonap formations of the Beaufort Group, South Africa: towards a basin-wide
stratigraphic scheme for the Middle Permian Karoo: Journal of African Earth
Sciences, v. 100, p. 227-242.
Dubiel, R.F., 1987, Sedimentology of the Upper Triassic Chinle Formation southeastern
Utah: Paleoclimatic implications: Journal of the Arizona-Nevada Academy of
Science, v. 22, p. 35-45.
Fielding, C.R., 2006, Upper flow regime sheets, lenses and scour fills: Extending the range of
architectural elements for fluvial sediment bodies: Sedimentary Geology, v. 190, p.
227-240.
Fielding, C.R., 2010, Preservation of distributive vs. tributive and other fluvial system
deposits in the rock record: AGU Fall Meeting Abstracts p. 08.
Fielding, C.R., Allen, J.P., Alexander, J., and Gibling, M.R., 2009, Facies model for fluvial
systems in the seasonal tropics and subtropics: Geology, v. 37, p. 623-626.
Fielding, C.R., Allen, J.P., Alexander, J., Gibling, M.R., Rygel, M.C., and Calder, J.H., 2011,
Fluvial systems and their deposits in hot, seasonal semiarid and subhumid settings:
Modern and ancient examples, in Davidson, S.K., Leleu, S., and North, C.P., eds.,
34
778
779
780
781
782
783
784
785
786
787
788
789
790
791
792
793
794
795
796
797
798
799
800
801

From River to Rock Record: the Preservation of Fluvial Sediments and their
Subsequent Interpretation: Tulsa, Oklahoma, SEPM Special Publication 97, p. 447.
Fielding, C.R., Ashworth, P.J., Best, J.L., Prokocki, E.W., and Sambrook Smith, G.H., 2012,
Tributary, distributary and other fluvial patterns: What really represents the norm in
the continental rock record?: Sedimentary Geology, v. 261, p. 15-32.
Gallois, R., 2008, The stratigraphy of the Mercia Mudstone Group succession (mid to late
Triassic) proved in the Wiscombe Park boreholes, Devon: Geoscience in south-west
England: Proceedings of the Ussher Society, v. 11, p. 280-286.
Hajek, E.A., Heller, P.L., and Sheets, B.A., 2010, Significance of channel-belt clustering in
alluvial basins: Geology, v. 38, p. 535-538.
Hartley, A.J., Weissmann, G.S., Nichols, G.J., and Scuderi, L.A., 2010a, Fluvial form in
modern continental sedimentary basins: Distributive fluvial systems: REPLY:
Geology, v. 38, p. 231-231.
Hartley, A.J., Weissmann, G.S., Nichols, G.J., and Warwick, G.L., 2010b, Large distributive
fluvial systems: Characteristics, distribution, and controls on development: Journal of
Sedimentary Research, v. 80, p. 167-183.
Holbrook, J., Scott, R.W., and Oboh-Ikuenobe, F.E., 2006, Base-level buffers and buttresses:
A model for upstream versus downstream control on fluvial geometry and
architecture within sequences: Journal of Sedimentary Research, v. 76, p. 162-174.
Hubbard, S.M., Smith, D.G., Nielsen, H., Leckie, D.A., Fustic, M., Spencer, R.J., and Bloom,
L., 2011, Seismic geomorphology and sedimentology of a tidally influenced river
deposit, Lower Cretaceous Athabasca oil sands, Alberta, Canada: AAPG Bulletin, v.
95, p. 1123-1145.
35
802
803
804
805
806
807
808
809
810
811
812
813
814
815
816
817
818
819
820
821
822
823
824

Jirah, S., and Rubidge, B.S., 2014, Refined stratigraphy of the middle Permian
Abrahamskraal formation (Beaufort Group) in the southern Karoo Basin: Journal of
African Earth Sciences, v. 100, p. 121-135.
Johnson, M.R., Van Vuuren, C.J., Visser, J.N.J., Cole, D.I., Wickens, H.D.V., Christie,
A.D.M., and Roberts, D.L., 1997, The foreland Karoo Basin, South Africa, in Selley,
R.C., ed., Sedimentary Basins of the World: African Basins: Amsterdam, Elsevier
Science, p. 269-317.
Jordaan, M.J., 1990, Basin analysis of the Beaufort Group in the western part of the Karoo
Basin [unpublished PhD thesis]: University of the Orange Free State, Bloemfontein.
Kelly, S.B., and Olsen, H., 1993, Terminal fans—a review with reference to Devonian
examples: Sedimentary Geology, v. 85, p. 339-374.
Kvale, E.P., and Archer, A.W., 2007, Paleovalley fills: Trunk vs. tributary: AAPG Bulletin,
v. 91, p. 809-821.
Lanci, L., Tohver, E., Wilson, A., and Flint, S., 2013, Upper Permian magnetic stratigraphy
of the lower Beaufort Group, Karoo Basin: Earth and Planetary Science Letters, v.
375, p. 123-134.
Le Roux, J.P., 1985, Palaeochannels and uranium mineralisation in the Main Karoo Basin of
South Africa [unpublished PhD thesis]: University of Port Elizabeth, South Africa,
250 p.
Leeder, M.R., 1975, Pedogenic carbonates and flood sediment accretion rates: a quantitative
model for alluvial arid-zone lithofacies: Geological Magazine, v. 112, p. 257-270.
Leleu, S., Van Lanen, X.M.T., and Hartley, A.J., 2010, Controls on the architecture of a
Triassic sandy fluvial system, Wolfville Formation, Fundy Basin, Nova Scotia,
Canada: Implications for the interpretation and correlation of ancient fluvial
successions: Journal of Sedimentary Research, v. 80, p. 867-883.
36
825
826
827
828
829
830
831
832
833
834
835
836
837
838
839
840
841
842
843
844
845
846
847
848
849

Luttrell, P.R., 1993, Basinwide sedimentation and the continuum of paleoflow in an ancient
river system: Kayenta Formation (Lower Jurassic), central portion Colorado Plateau:
Sedimentary Geology, v. 85, p. 411-434.
Maynard, J.R., 2006, Fluvial response to active extension: Evidence from 3-D seismic data
from the Frio Formation (Oligo-Miocene) of the Texas Gulf of Mexico Coast, U.S.A.:
Sedimentology, v. 53, p. 515-536.
Mccarthy, P.J., and Plint, A.G., 1998, Recognition of interfluve sequence boundaries:
Integrating paleopedology and sequence stratigraphy: Geology, v. 26, p. 387-390.
Mellett, C.L., Hodgson, D.M., Plater, A.J., Mauz, B., Selby, I., and Lang, A., 2013,
Denudation of the continental shelf between Britain and France at the glacial-
interglacial timescale: Geomorphology, v. 203, p. 79-96.
Miall, A.D., 1977, A review of the braided-river depositional environment: Earth-Science
Reviews, v. 13, p. 1-62.
Miall, A.D., 1985, Architectural-element analysis - a new method of facies analysis applied
to fluvial deposits: Earth-Science Reviews, v. 22, p. 261-308.
Miall, A.D., 1996, The geology of fluvial deposits: New York, Springer-Verlag, 582 p.
Nanson, G.C., Tooth, S., and Knighton, A.D., 2002, A global perspective on dryland rivers:
Perceptions, misconceptions and distinctions, in Bull, L.J., and Kirkby, M.J., eds.,
Dryland Rivers: Hydrology and Geomorphology of Semi-arid Channels: Chichester,
John Wiley and Sons, p. 388.
Nichols, G.J., 2009, Sedimentology and stratigraphy, John Wiley & Sons, 432 p.
Nichols, G.J., and Fisher, J.A., 2007, Processes, facies and architecture of fluvial distributary
system deposits: Sedimentary Geology, v. 195, p. 75-90.
37
850
851
852
853
854
855
856
857
858
859
860
861
862
863
864
865
866
867
868
869
870
871
872

North, C.P., and Davidson, S.K., 2012, Unconfined alluvial flow processes: Recognition and
interpretation of their deposits, and the significance for palaeogeographic
reconstruction: Earth-Science Reviews, v. 111, p. 199-223.
North, C.P., and Taylor, K.S., 1996, Ephemeral-fluvial deposits; integrated outcrop and
simulation studies reveal complexity: AAPG Bulletin, v. 80, p. 811-830.
O’byrne, C.J., and Flint, S.S., 1996, Interfluve sequence boundaries in the Grassy Member,
Book Cliffs, Utah: Criteria for recognition and implications for subsurface
correlation: Geological Society, London, Special Publications, v. 104, p. 207-220.
Payenberg, T.H.D., Willis, B.J., Bracken, B., Posamentier, H.W., Pyrcz, M.J., Pusca, V., and
Sullivan, M.D., 2011, Revisiting the subsurface classification of fluvial sandbodies:
AAPG Search and Discovery Article, #90124. AAPG Annual Convention and
Exhibition, April 10-13, 2011, Houston, Texas.
Pysklywec, R.N., and Mitrovica, J.X., 1999, The role of subduction-induced subsidence in
the evolution of the Karoo Basin: The Journal of Geology, v. 107, p. 155-164.
Retallack, G.J., 1976, Triassic palaeosols in the Upper Narrabeen Group of New South
Wales. Part I: features of the palaeosols: Journal of the Geological Society of
Australia, v. 23, p. 383-399.
Retallack, G.J., 1988, Field recognition of paleosols: Geological Society of America Special
Papers, v. 216, p. 1-20.
Rubidge, B.S., 2000, Permo-Triassic fossil vertebrates from the Karoo of South Africa and
their use in basin analysis: Journal of African Earth Sciences, v. 30, p. 1-94.
Ruskin, B.G., and Jordan, T.E., 2007, Climate change across continental sequence
boundaries: Paleopedology and lithofacies of Iglesia Basin, northwestern Argentina:
Journal of Sedimentary Research, v. 77, p. 661-679.
38
873
874
875
876
877
878
879
880
881
882
883
884
885
886
887
888
889
890
891
892
893
894
895
896

Sambrook Smith, G.H., Best, J.L., Ashworth, P.J., Fielding, C.R., Goodbred, S.L., and
Prokocki, E.W., 2010, Fluvial form in modern continental sedimentary basins:
Distributive fluvial systems: COMMENT: Geology, v. 38, p. 230.
Shanley, K.W., and Mccabe, P.J., 1994, Perspectives on the sequence stratigraphy of
continental strata: AAPG Bulletin, v. 78, p. 544-568.
Smith, R.M.H., 1987, Morphology and depositional history of exhumed Permian point bars in
the southwestern Karoo, South Africa: Journal of Sedimentary Petrology, v. 57, p. 19-
29.
Smith, R.M.H., 1990, A review of stratigraphy and sedimentary environments of the Karoo
Basin of South Africa: Journal of African Earth Sciences, v. 10, p. 117-137.
Smith, R.M.H., Eriksson, P.G., and Botha, W.J., 1993, A review of the stratigraphy and
sedimentary environments of the Karoo-aged basins of Southern Africa: Journal of
African Earth Sciences, v. 16, p. 143-169.
Smith, R.M.H., and Keyser, A.W., 1995, Biostratigraphy of the Tapinocephalus assemblage
zone, in Rubidge, B.S., ed., Biostratigraphy of the Beaufort Group (Karoo
Supergroup). South African Committee for Stratigraphy, Biostratigraphic Series:
Pretoria, Council for Geoscience, p. 8-12.
Stanistreet, I.G., and Mccarthy, T.S., 1993, The Okavango Fan and the classification of
subaerial fan systems: Sedimentary Geology, v. 85, p. 115-133.
Stear, W.M., 1978, Sedimentary structures related to fluctuating hydrodynamic conditions in
flood plain deposits of the Beaufort Group near Beaufort West, Cape: Transactions of
the Geological Society of South Africa, v. 81, p. 393-399.
Stear, W.M., 1980, The sedimentary environment of the Beaufort Group Uranium Province
in the vacinity of Beaufort West, South Africa [unpublished PhD thesis]: University
of Port Elizabeth, Port Elizabeth, 257 p.
39
897
898
899
900
901
902
903
904
905
906
907
908
909
910
911
912
913
914
915
916
917
918
919
920
921
Stear, W.M., 1983, Morphological characteristics of ephemeral stream channel and overbank
splay sandstone bodies in the Permian lower Beaufort Group, Karoo Basin, South
Africa, in Collinson, J.D.a.L., J., ed., Modern and ancient fluvial systems: Oxford,
International Association of Sedimentologists Special Publication, p. 575.
Stear, W.M., 1985, Comparison of the bedform distribution and dynamics of modern and
ancient sandy ephemeral flood deposits in the southwestern Karoo region, South
Africa: Sedimentary Geology, v. 45, p. 209-230.
Straub, K.M., Paola, C., Mohrig, D., Wolinsky, M.A., and George, T., 2009, Compensational
stacking of channelized sedimentary deposits: Journal of Sedimentary Research, v.
79, p. 673-688.
Swenson, J.B., Voller, V.R., Paola, C., Parker, G., and Marr, J.G., 2000, Fluvio-deltaic
sedimentation: A generalized Stefan problem: European Journal of Applied
Mathematics, v. 11, p. 433-452.
Tankard, A., Welsink, H., Aukes, P., Newton, R., and Stettler, E., 2009, Tectonic evolution of
the Cape and Karoo basins of South Africa: Marine and Petroleum Geology, v. 26, p.
1379-1412.
Trendell, A.M., Atchley, S.C., and Nordt, L.C., 2013, Facies analysis of a probable large-
fluvial-fan depositional system: The Upper Triassic Chinle Formation at Petrified
Forest National Park, Arizona, USA: Journal of Sedimentary Research, v. 83, p. 873-
895.
Tunbridge, I.P., 1984, Facies model for a sandy ephemeral stream and clay playa complex;
the Middle Devonian Trentishoe Formation of North Devon, U.K.: Sedimentology, v.
31, p. 697-715.
40
922
923
924
925
926
927
928
929
930
931
932
933
934
935
936
937
938
939
940
941
942
943
944
Turner, B.R., 1977, Sedimentary patterns of uranium mineralisation in the Beaufort Group of
the southern Karoo (Gondwana) Basin, South Africa: Fluvial Sedimentology, v.
Memoir 5, p. 831-848.
Turner, B.R., 1981, Possible origin of low angle cross-strata and horizontal lamination in
Beaufort Group sandstones of the southern Karoo Basin: Transactions of the
Geological Society of South Africa, v. 84, p. 193-197.
Turner, B.R., 1983, Braidplain Deposition of the Upper Triassic Molteno Formation in the
Main Karoo (Gondwana) Basin, South Africa: Sedimentology, v. 30, p. 77-89.
Van Wagoner, J.C., Mitchum, R.M., Campion, K.M., and Rahmanian, V.D., 1990,
Siliciclastic sequence stratigraphy in well logs, cores, and outcrops: concepts for high-
resolution correlation of time and facies: AAPG Methods in Exploration Series:
Tulsa, Oklahoma, The American Association of Petroleum Geologists, 55 p.
Weissmann, G.S., Hartley, A.J., Nichols, G.J., Scuderi, L.A., Olson, M., Buehler, H., and
Banteah, R., 2010, Fluvial form in modern continental sedimentary basins:
Distributive fluvial systems: Geology, v. 38, p. 39-42.
Weissmann, G.S., Hartley, A.J., Nichols, G.J., Scuderi, L.A., Olson, M.E., Buehler, H.A., and
Massengill, L.C., 2011a, Alluvial facies distributions in continental sedimentary
basins—distributive fluvial systems: From River to Rock Record: the Preservation of
Fluvial Sediments and their Subsequent Interpretation, SEPM Special Publication 97,
447 p.
Weissmann, G.S., Hartley, A.J., Nichols, G.J., Scuderi, L.A., Owen, A., and Davidson, S.K.,
2011b, Predicted progradational signatures of distributive fluvial systems (DFS):
AGU Fall Meeting Abstracts, p. 702.
Weissmann, G.S., Hartley, A.J., Scuderi, L.A., Nichols, G.J., Davidson, S.K., Owen, A.,
Atchley, S.C., Bhattacharyya, P., Chakraborty, T., and Ghosh, P., 2013, Prograding
41
945
946
947
948
949
950
951
952
953
954
955
956
957
958
959
960
961
962
963
964
965
966
967
968
969

distributive fluvial systems—geomorphic models and ancient examples, in Driese,
S.G., and Nordt, L.C., eds., New Frontiers in Paleopedology and Terrestrial
Paleoclimatology, Paleosols and Soil Surface Analog Systems: Tulsa, Oklahoma,
SEPM (Society for Sedimentary Geology) Special Publication, p. 275.
Wickens, H.D.V., 1994, Basin floor fan building turbidites of the Southwestern Karoo Basin,
Permian Ecca Group, South Africa [unpublished PhD thesis]: University of Port
Elizabeth, South Africa, 233 p.
Willis, B.J., 1993, Ancient river systems in the Himalayan foredeep, Chinji Village area,
northern Pakistan: Sedimentary Geology, v. 88, p. 1-76.
Wilson, A., Flint, S.S., Payenberg, T.H.D., Tohver, E., and Lanci, L., 2014, Architectural
styles and sedimentology of the fluvial lower Beaufort Group, Karoo Basin, South
Africa: Journal of Sedimentary Research, v. 84, p. 326-348.
Wright, P.V., and Marriott, S.B., 1993, The sequence stratigraphy of fluvial depositional
systems: the role of floodplain sediment storage: Sedimentary Geology, v. 86, p. 203-
210.
42
970
971
972
973
974
975
976
977
978
979
980
981
982
983
984
985
TABLE 1.—Sandstone (S) and intraformational conglomerate (G) lithofacies classification scheme adopted within the Abrahamskraal
Formation, lower Beaufort Group, SW Karoo Basin. Modified after Miall (1996).
986
987
Facies Lithology Sedimentary Structures Interpretation and Environment of Deposition
Sm Sandstone (v.f-m) Massive/ structureless sandstoneStructureless sandstone may form as a result of weathering or the uniform grain size. Internal structures often destroyed due to intense
bioturbation (localized), dewatering or weathering. Alternative interpretation of insufficient time available for bedform development, for example small channel bank collapse.
Sh Sandstone (f-m) Planar laminated sandstone. Parting lineations (pcl) common
High flow velocities, often in shallow water depths, deposit under upper flow regime plane bed conditions, destroying dunes and ripples. Primary current lineation often produced by turbulent eddies near the water surface. Paleocurrent direction parallel to lineation.
Sl Sandstone (f-m) Low angle (< 10°) cross -stratified sandstone
Large scale dunes and barforms. Sl may form from lateral migration of the channel and lateral migration of point bars (lateral accretion surfaces), in more sinuous systems.
Sp Sandstone (f-m) High angle (> 10°) planar cross-stratified sandstone
Commonly located towards the base of channel-belts. Represents the migration of 2-D dunes that form at lower flow velocities than trough cross-stratified sandstone (dune height is proportional to water depth). Alternatively may form due to lateral migration of point bars in a fluvial channel or from deposition in erosional scours.
St Sandstone (f-m) Trough cross-stratified sandstone In-channel migration of 3-D dunes (bedload transportation), where deep scours are common. Often located at the base of a point bar and dunes may have a sigmoidal profile. Trough cross-stratification is formed by linguoid ripples.
Sr Sandstone (f),siltstone (c)
Ripple cross-laminated sandstone (asymmetrical climbing; symmetrical; wave; rib and furrow; ripple tops)
Ripples represent low flow regime conditions and they correspond to the transportation of sand through the channel due to water currents flowing over the surface of the sediment. Bi-directional wave motion creates straight-crested symmetrical wave ripples (weaker flows), whereas the more sinuous-crested current ripples are produced by uni-directional currents (stronger currents). Rib-and-furrow is produced by the downstream migration of current ripples. Ladder-back ripples are secondary ripple sets that form between larger ripple troughs. Ripples can be deposited on tops of levees or in crevasse channels as the flood energy subsides, for example at the top of a sheet-like proximal splay sand. Alternatively ripples may form in channel-fills during stable flow conditions or throughout a waning flow on barform tops, such as point bars. Commonly associated with the upper part of Sl facies.
Sd Sandstone (f),siltstone (c) Convolute laminated sandstone
Deformation of bedding and/or laminations. May create localized brecciation. High deposition rates lead to loosely packed sediment prone to deformation. Convolute beds and laminations and dish and pillar structures are formed from dewatering. Flame structures occur from denser sand/coarse silt being deposited on top of less dense fine silt.
Sw Sandstone (f) Wavy laminated sandstone Often associated within vertical facies changes from parallel laminations to wavy laminations to climbing ripples. The wavy laminae may be the product of previously rippled surfaces.
Gl
Matrix-supported (siltstone to f. sandstone) with clasts
Matrix-supported intraformational conglomerate comprising mud clasts, concretions and rare bone fragments.
Basal channel lag deposits often formed during bank collapse from erosion of the outer river bend (high energy flows and migration of the channel). Alternatively due to channel-belt avulsion when there is power to erode the banks and after avulsion the channel then cuts into its new banks. Lags are deposited when the river can no longer support the transport of bedload. This coarser sediment is commonly deposited at the base of cross-beds, for example on the lee side of dunes at the base of the foresets or at the base of the channel-belt. Stratified sandstone stringers within lags are likely to be down-cutting bedset toes. Thicker conglomerates represent axial deposition.
Gm
Mudstone clasts, matrix supported(f. sandstone)
Mudstone clast horizon, aligned Mudstone rip-up clasts from underlying bed. Mudstone clast horizons often found nearer to channel margins. Mid-channel formation as floods mobilise the mudstone clasts. Sand re-enters the system afterwards.
v.f, very fine-grained; f, fine-grained; m, medium-grained; c, coarse-grained
988

TABLE 2.—Mudstone (F) lithofacies classification scheme adopted within the Abrahamskraal Formation, lower Beaufort Group, SW Karoo
Basin. Modified after Miall (1996).
Facies Lithology Sedimentary Structures Interpretation and Environment of Deposition
Fbg Siltstone (v.f- f), claystone Bright green massive mudstone Interpreted as reducing conditions within the overbank and commonly associated with purple mudstones (Fp).
Fp Siltstone (v.f-m), claystone Fissile purple mudstone Moderate maturity paleosols comprising pedogenic features, such as rhizoliths, calcrete nodules and slickensides, are interpreted as
distal overbank facies that have reddened post-deposition.
Fpu Siltstone (v.f-c) Poorly sorted purple siltstone Located within distal overbank deposits and channel abandonment, interpreted as oxidising conditions. May be mottled green.
Fgl Siltstone (m), claystone
Laminated organic-rich dark gray mudstone
Interpreted to represent low energy conditions or standing water, for example a rise in the water table or increased precipitation. Indicative of lacustrine fill and/or ponded water, such as an oxbow lake.
Fggb Siltstone (v.f-c), claystone
Poorly sorted green-gray-blue siltstone
Overbank deposits, representing reducing conditions. Massive beds and structured beds are interpreted as proximal and distal splay deposits, respectively. Often mottled purple.
Fcs Siltstone (c), sandstone (v.f-f)
Sharp-based thinly bedded coarse siltstone or very fine sandstone
Unconfined sheet-like splay deposits, within the overbank environment. Interpreted as flood events, as sediment (largest first) is deposited on the floodplain. Often occurs on the outer bend of a meandering river where the water energy is greatest.
T Ash (f) Tuff deposit Interpreted as sub-aerial volcanic ash fall that has consolidated following a volcanic eruption.
v.f, very fine-grained; f, fine-grained; m, medium-grained; c, coarse-grained
989
990

FIGURE CAPTIONS
FIG. 1.—A) Topographic map of the SW Karoo Basin, South Africa, using SRTM
elevation data superimposed upon Google EarthTM Landsat. Warm colors relate to higher
elevations, cool colors refer to lower elevations. The Great Escarpment and the town of
Sutherland are highlighted. B) Google EarthTM Landsat image displaying the 3-D control that
the outcrops afford.
FIG. 2.—A) Cape lithostratigraphy, redrawn after Wickens (1994), showing the
stratigraphic position of the fluvial Abrahamskraal Formation, lower Beaufort Group within
the Karoo Supergroup. The Beaufort Group conformably overlies deltaic strata of the
Waterford Formation. B) Schematic representation of the Abrahamskraal Formation based on
the Great Escarpment and Sutherland area stratigraphy.
FIG. 3.—Topographic map of the Klipkraal study area relative to the town of
Sutherland (in gray). The R354 road is outlined in red. The map is divided into quadrants and
the base of each logged section (labeled KK-1 to KK-45) is highlighted by a red dot.
FIG. 4.—A) Aerial image of the Klipkraal study area displaying the locations of
correlation panels X-X′, Y-Y′ and Z-Z′, labeled in white. Numbers relate to correlation panels
presented in Figures FIG. 10-FIG. 12 and colored dots represent log locations. B) Type section
sedimentary log is a composite of three log sections (from KK-31, KK-35, KK-39 and KK-
42) as the complete stratigraphy is not represented in any one area.
FIG. 5.—Fluvial hierarchy used in this study. The scheme separates channel-related
from floodplain-related features and characterizes small scale architectural elements, up to
larger channel-belt complex set (CS) scale. Hierarchical scheme and schematic diagrams are
991
992
993
994
995
996
997
998
999
1000
1001
1002
1003
1004
1005
1006
1007
1008
1009
1010
1011
1012

based on observations and descriptions by Miall (1996), Bridge (2006) and Payenberg et al.
(2011).
FIG. 6.—Representative lithofacies from the Abrahamskraal Formation. Tables TABLE
1-TABLE 2 outline the lithofacies codes and interpretation of depositional environment. A)
Massive fine-grained sandstone (Sm). B) Planar laminated sandstone (Sh), with primary
current lineations highlighted on the bed surface. C) Low angle (< 10°) cross-stratified
sandstone (Sl). D) High angle (> 10°) planar cross-stratified sandstone (Sp). E) Climbing
ripple cross-laminated sandstone (Sr). F) Matrix supported conglomerate with
intraformational clasts of reworked calcrete nodules and mudstone that is interpreted to
represent a channel-belt lag deposit, overlying a large erosion surface (Gl). G) Poorly-sorted,
angular mud clasts within a predominantly sandy matrix (Gm). H) Poorly sorted purple
siltstone (Fpu). I) Poorly sorted green-gray-blue siltstone containing a 60 cm thick nodular
horizon (Fggb). J) Green-gray siltstone (Fggb) containing desiccation cracks on bed top. K)
Bright green massive mudstone (Fbg), mottled purple. L) Laminated organic-rich dark gray
mudstone (Fgl).
FIG. 7.—Outcrop photographs displaying key facies, architectural elements and
characteristics from bedset scale through to channel-belt scale. For facies abbreviations refer
to Tables TABLE 1 and TABLE 2. A) Lateral accretion (LA) surfaces are present within a
large-scale channel-belt, which cuts into floodplain fines (FF) and floodplain lake (FFL)
deposits beneath. B) Floodplain fines (FF) comprise purple, green and gray siltstone
successions (Fggb and Fp) and laterally extensive splay deposits (SS) are defined by the
climbing ripple cross-laminated very fine-grained sandstone. C) Bedset scale features,
bounded by the yellow line. Flat lamination (FL) dominated elements and larger scale
aggradational channel-fill elements (CH) are labeled. D) Downstream accretion elements
(DA) overlying an erosional storey boundary, outlined in yellow. DA example comprises Sl,
1013
1014
1015
1016
1017
1018
1019
1020
1021
1022
1023
1024
1025
1026
1027
1028
1029
1030
1031
1032
1033
1034
1035
1036
1037

Sm, Gl and Gm facies. E) Erosional base of channel-belt (highlighted in yellow) overlain by
channel-fill elements (CH), comprising Gl, Sm, Sl and St facies.
FIG. 8.—Outcrop photographs displaying architectural elements and characteristics
from channel-belt complex to channel-belt complex set scale. Sedimentary log locations are
overlain in black (FIG. 8A) or white (FIG. 8B). A) Image from the SE quadrant (FIG. 3) from
part of the Z to Z′ correlation panel (FIG. 4). Individual complexes (Cx 3 to 8) and
architectural elements (FF, floodplain fines; FFL, floodplain lake deposits; DA, downstream
accretion dominated deposits) are labeled. B) Photograph from the NE quadrant (FIG. 3) from
part of the Y to Y′ correlation panel (FIG. 4). Individual channel-belt complexes (Cx 4 to 9)
and floodplain fines (FF) are labeled.
FIG. 9.—Detailed photo panel interpretation of Complex 3 with sedimentary log
positions and channel-belt bounding surfaces overlain. Each of the three channel-belts is
labeled, along with corresponding architectural elements (LA, lateral accretion surfaces; DA,
downstream accretion surfaces; FL, flat lamination dominated deposits). The lithofacies
distribution for Complex 3 is shown in the logs and accompanying pie charts. Complex 3
displays laterally and vertically stacked channel-belts (i.e., Complex Type A, FIG. 5).
Fig. 10.—Correlation panel X-X′, displaying sedimentary logs from the dome at
Klipkraal (refer to Fig. 3). Each complex (Cx 1 to 6) is separated into individually numbered
channel-belts where possible. Overbank intervals are labeled (A to E) and the panel location
is presented in Fig. 4A.
FIG. 11.—Correlation panel Y-Y′, representing sedimentary logs from the north-
eastern quadrant at Klipkraal (refer to FIG. 3). Complete section is ~2 km in length. Each
complex (Cx 3 to 9) is separated into individually numbered channel-belts where possible.
Overbank intervals are labeled (C to I) and the panel location is presented in FIG. 4A.
1038
1039
1040
1041
1042
1043
1044
1045
1046
1047
1048
1049
1050
1051
1052
1053
1054
1055
1056
1057
1058
1059
1060
1061

FIG. 12.—Correlation panel Z-Z′, showing sedimentary logs from the main south-
western and south-eastern quadrants at Klipkraal (refer to FIG. 3). Complete length of section
is ~5 km. Each complex (Cx 1 to 9) is separated into individually numbered channel-belts
where possible. Overbank intervals are labeled (A to I) and the panel location is presented in
FIG. 4A.
FIG. 13.—A) Paleogeographic reconstruction of Complex 1, comprising two channel-
belts with north-easterly paleocurrents. Complex 1 is in the sub-crop towards the north-east.
B) Complex 2, made up of two channel-belts, each with two storeys. Complex 2 is sub-crop
towards the north-east. C) Complex 3, comprising three channel-belts. D) Complex 4,
consisting of three channel-belts. Channel-belt 8 has an associated splay deposit that forms an
erosional remnant cut by channel-belt 9.
FIG. 14.—Paleogeographic reconstruction of Complex Set 3 (complexes 5 to 7)
during deposition. A) Complex 5, comprising two channel-belts with variable north-north-
west and north-easterly paleocurrents. Complex 5 is absent towards the north-east and west,
due to incision at the base of Complex 6. B) Complex 6, made up of three channel-belts.
Complex 6 fully cuts out Complex 5 towards the north-east. C) Complex 7, containing two
channel-belts with north-westerly and north-easterly paleocurrents.
FIG. 15.—Schematic sedimentary log from the Klipkraal type localities (refer to FIG.
4). Each channel-belt complex (Cx 1 to 9) and overbank interval (A to I) is labeled with
descriptive text to characterize the up-stratigraphy changes in thickness, color, and number of
splays and paleosols.
FIG. 16.—Schematic stratigraphic log with fluvial hierarchy overlain. Both sequence
stratigraphic and distributive fluvial system (DFS) model interpretations are shown. List of
1062
1063
1064
1065
1066
1067
1068
1069
1070
1071
1072
1073
1074
1075
1076
1077
1078
1079
1080
1081
1082
1083
1084
abbreviations: Transgressive System Tract (TST), Maximum Flooding Surface (MFS),
Highstand System Tract (HST), Sequence Boundary (SB), Lowstand System Tract (LST).
FIG. 17.—Conceptual image depicting the evolution of the Abrahamskraal Formation
based on the progradational distributive fluvial system (DFS) model. The schematic diagrams
are based on observations made in this study, and are modified after Nichols and Fisher
(2007), Trendell et al. (2013) and Weissmann et al. (2011a; 2013). A) Complex Set 1 (CS 1)
is interpreted as terminal distal deposits and signifies gradual progradation of the DFS. B) CS
2 is interpreted as medial DFS deposits and represents continued gradual DFS progradation.
C) CS 3 is interpreted as proximal DFS deposits. The incisional base of Complex 6 is
considered as the point of maximum alluvial progradation, marked by a sequence boundary
and a basinward shift in facies. D) An upward decrease in sandstone amalgamation and
content from Complex 7 upwards (refer to FIG. 15) is interpreted as gradual retreat or lateral
switch in the axis of the DFS. E) Schematic cross-section through the four complex sets (CS
1 to 4). Sediment was transported hundreds of km from Patagonia during deposition of the
Abrahamskraal Formation.
1085
1086
1087
1088
1089
1090
1091
1092
1093
1094
1095
1096
1097
1098
1099
Top Related