


Languages
Pages
Legal

S
Transport for Surrey
VICARAGE ROAD UNDERPASS & ASSOCIATED MITIGATION MEASURES
Modelling Report

Project Title: Vicarage Road Underpass & Associated Mitigation Measures
Document Title: Modelling Report Client Reference: Date: 16/11/10 Prepared By: Print Gemma Joyner
Sign ......... ....................... Authorised By: Print William Bryans
Sign .......... ........................ Amendment List
Iss. / Rev. Iss. / Rev Date Amended Pages
2 05/11/10 23 – 25, 40, 54 - 55 3 16/11/10 4, 7, 51 – 58, 62 – 63 4 16/11/10 Removal of highlights – no changes to text to content
0201SF10 07/08/02 Filename: S:\Project-Current\7994\07 Reports\Pooley Green Underpass_Modelling Report.Doc
Issue No. 02 Page 2 of 67 Document No.7994/01
Vicarage Road Underpass & Associated Mitigation Measures Modelling Report
CONTENTS
1 INTRODUCTION 4 1.1 Background 4 1.2 Mitigation Measures 4 1.3 Objectives 4 1.4 Study Area 5 1.5 Scenarios 5 2 MODEL DEVELOPMENT 7 2.1 Modelling Program & Model Definition 7 2.2 Assignment Method 7 2.3 Observed Traffic Data 7 2.4 Revised Zoning System 7 2.5 Network Audit & Level Crossing Replication 8 2.6 Calibration 9 2.7 Validation 15 3 FORECASTING 20 3.1 Forecast Years 20 3.2 Future Year Network Changes 20 3.3 Waitrose and Travelodge Development Site 20 3.4 Forecasting Methodology 21 4 SCENARIO TESTING & ANALYSES 22 4.1 Introduction 22 4.2 Overall Impact at the Level Crossings 23 4.3 Flow Difference Plots 26 4.4 Journey Time Comparisons 35 4.5 Select Link Analyses 38 4.6 Mini-Roundabout Junction of B3407 High Street with B388 Vicarage Road 41 4.7 B3407 The Avenue Arm of the Runnymede Roundabout 41 4.8 Scenario 1: Do-Nothing 42 4.9 Scenario 2: Do-Minimum 42 4.10 Scenario 3: Do-Something 44 4.11 Scenario 4: Do-Something 45 4.12 Scenario 5: Do-Something Sensitivity Test 45 4.13 Scenario 6: Do-Something Sensitivity Test 46 4.14 Further Sensitivity Tests 46 4.15 Verification of Calculated Delay by OmniTRANS at Level Crossings 48 4.16 Queue Lengths at the Level Crossings 49 4.17 Comparison of Average and Actual Barrier Closures 51 4.18 Cordon Assessment 51 5 DISCUSSION OF RESULTS 56 6 OTHER EFFECTS 59 7 MITIGATION TRIP ABSTRACTION 60 8 CONCLUSIONS 62 9 APPENDICES 63 9.1 Appendix A: Modelled Level Crossing Downtimes 63 9.2 Appendix B: Roadside Interview Analyses 65 9.3 Appendix C: Validation Acceptability Guidelines 67
Issue No. 02 Page 3 of 67 Document No.7994/01

Vicarage Road Underpass & Associated Mitigation Measures Modelling Report
1 INTRODUCTION
1.1 Background
1.1.1 The Airtrack major scheme, promoted by BAA, aims to provide a direct rail link to Heathrow from London Waterloo, Guildford, Reading and the wider hinterland of south-west London, Surrey and Berkshire.
1.1.2 Within the county of Surrey, this will require the re-construction of the existing Staines railway station and a new chord in Staines town centre, which will link the existing Windsor line with lines to Guildford and Reading.
1.1.3 Moreover, the Airtrack scheme will see the increase usage of existing rail lines. In particular, the rail line between Staines and Virginia Water has four level crossings. From east to west, these are: Thorpe Road; Vicarage Road; Station Road; and Prune Hill. Already the level crossings can be closed to traffic and pedestrians for 26 minutes out of an hour during peak periods1. This creates an accessibility issue for local residents, particularly at Thorpe Road, Vicarage Road and Station Road, as these are situated in urban areas near to Egham and Staines town centres. The introduction of Airtrack will see an increase in level crossing closure of up to 33 minutes out of an hour during peak periods2.
1.2 Mitigation Measures
1.2.1 To reduce the impact of Airtrack on the local highway, an underpass at Vicarage Road level crossing, near Egham, has been proposed at the Airtrack Level Crossing Subgroup. The underpass, which is also known as the Pooley Green underpass, would allow vehicles to travel under the rail line, unhindered by the passage of trains.
1.2.2 An underpass has not been considered at the other level crossings due to land availability and engineering constraints.
1.2.3 Other mitigation measures have also been considered to accompany the underpass, as listed below and shown in Figure 1.1:
- Traffic calming along B388 Vicarage Road to assist in the enforcement of a reduced speed limit of 20mph required for the passage of vehicles through the underpass due to its design constraints; and
- The enhancement of the operation of Runnymede Roundabout.
1.2.4 This report outlines the transport modelling undertaken to determine the feasibility of the underpass and associated mitigation measures, together with an assessment into its impact on vehicular traffic.
1.3 Objectives
1.3.1 The objectives of the transport modelling are to:
- Develop a base year macroscopic highway model suitable to forecast and test the proposed mitigation measures;
1 Barrier time closure extracted from Count On Us surveys conducted on behalf of BAA provided in an email to William Bryans from Geoffrey Hill dated 06/11/09. 2 Airtrack scheme barrier time closure calculated from forecasts provided by Geoffrey Hill on behalf of BAA in an email to Abigail Fielder dated 04/03/10. It must be noted that barrier closure time varies between the level crossings.
Issue No. 02 Page 4 of 67 Document No.7994/01

Vicarage Road Underpass & Associated Mitigation Measures Modelling Report
- Produce forecast year models to test the implementation of the underpass and associated mitigation measures, and to compare with the non-construction of the underpass which maintains the existing level crossing arrangement but with revised downtime;
- Analyse the impact of the underpass and its feasibility;
- Use the modelling results to assist in the identification of any further mitigation measures required or other recommendations; and
- Determine to total trip abstraction required at the level crossings to mitigate against the Airtack scheme.
1.4 Study Area
1.4.1 The study area is shown in Figure 1.1. It is centred on the towns of Egham and Staines. It encompasses both the Surrey boroughs of Runnymede and Spelthorne, as well as a small part of Berkshire and Greater London to the north.
N
Key
Study area Existing rail line
Level Crossings:
Thorpe Road Vicarage Road Station Road Prune Hill
Figure 1.1: Study area
1.5 Scenarios
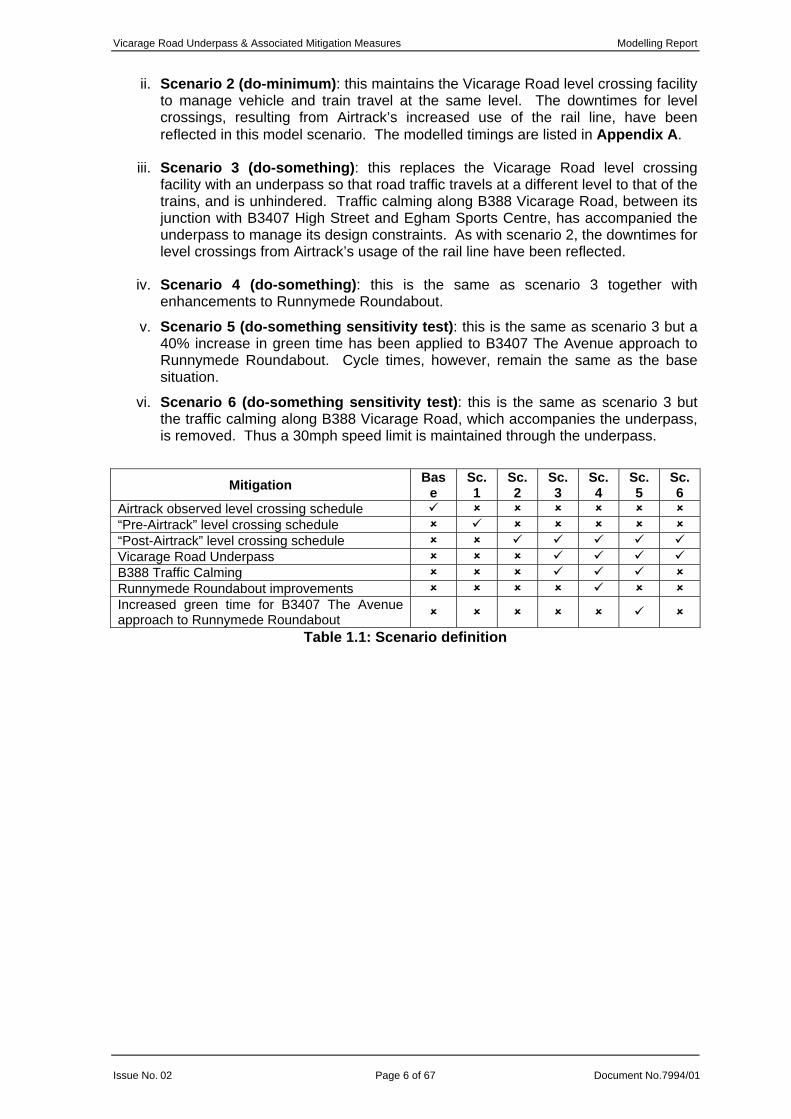
1.5.1 Six scenarios have been created as described below and listed in Table 1.1.
i. Scenario 1 (do-nothing): this is the forecast situation without the Airtrack scheme. Hence the level crossing facilities do not include Airtrack trains, but they do reflect the future estimation of train schedules as shown in Appendix A.
Issue No. 02 Page 5 of 67 Document No.7994/01
Vicarage Road Underpass & Associated Mitigation Measures Modelling Report
ii. Scenario 2 (do-minimum): this maintains the Vicarage Road level crossing facility to manage vehicle and train travel at the same level. The downtimes for level crossings, resulting from Airtrack’s increased use of the rail line, have been reflected in this model scenario. The modelled timings are listed in Appendix A.
iii. Scenario 3 (do-something): this replaces the Vicarage Road level crossing facility with an underpass so that road traffic travels at a different level to that of the trains, and is unhindered. Traffic calming along B388 Vicarage Road, between its junction with B3407 High Street and Egham Sports Centre, has accompanied the underpass to manage its design constraints. As with scenario 2, the downtimes for level crossings from Airtrack’s usage of the rail line have been reflected.
iv. Scenario 4 (do-something): this is the same as scenario 3 together with enhancements to Runnymede Roundabout.
v. Scenario 5 (do-something sensitivity test): this is the same as scenario 3 but a 40% increase in green time has been applied to B3407 The Avenue approach to Runnymede Roundabout. Cycle times, however, remain the same as the base situation.
vi. Scenario 6 (do-something sensitivity test): this is the same as scenario 3 but the traffic calming along B388 Vicarage Road, which accompanies the underpass, is removed. Thus a 30mph speed limit is maintained through the underpass.
Mitigation Bas
e Sc. 1
Sc. 2
Sc. 3
Sc. 4
Sc. 5
Sc. 6
Airtrack observed level crossing schedule “Pre-Airtrack” level crossing schedule “Post-Airtrack” level crossing schedule Vicarage Road Underpass B388 Traffic Calming Runnymede Roundabout improvements Increased green time for B3407 The Avenue approach to Runnymede Roundabout
Table 1.1: Scenario definition
Issue No. 02 Page 6 of 67 Document No.7994/01
Vicarage Road Underpass & Associated Mitigation Measures Modelling Report
2 MODEL DEVELOPMENT
2.1 Modelling Program & Model Definition
2.1.1 The OmniTRANS modelling program, version 5.0.34 was used, together with SINTRAM version 4.0 (101116), for this study.
2.1.2 SINTRAM is Surrey County Council’s strategic highway model, which encapsulates the road network of Surrey and surrounding local authorities; at a national level the model incorporates all strategic roads within Great Britain.
2.1.3 A strategic model was used for this assessment because it is able to catch any re-routeing impacts across a wide area. This was particularly pertinent given Egham’s proximity to the M25. Furthermore, the model was already available for immediate use.
2.1.4 The model was enhanced within the study area to facilitate the analyses of the underpass. The required calibration of the model is described in the subsequent sections.
2.1.5 The model was developed for the base year 2005 and forecast years 2016 and 2031. It is a highway only model and assigns the vehicle classes: car, light goods vehicle (LGV) and heavy goods vehicle (HGV).
2.1.6 Two time periods were represented within the model:
- AM peak hour (08:00 – 09:00); and
- PM average peak hour (16:00 – 19:00).
2.1.7 The modelled PM peak is an average of the peak period. This enables both school and work trips to be captured. The level crossing timetable has greater impact during the shoulder of the peak hour, which is being captured within the assessment.
2.2 Assignment Method
2.2.1 A fixed trip equilibrium assignment was performed using the Method of Successive Averages (MSA) with Burrell type perturbations. Using a spread factor of 2, the assignment was run for 70 iterations to ensure stability. The number of iterations was kept consistent for the base and each scenario.
2.3 Observed Traffic Data
2.3.1 Traffic data was obtained from Surrey County Council’s database of manual classified turning counts and automatic traffic counts, and count and roadside interview (RSI) data collected by Count On Us on behalf of BAA. The latter data was provided to Surrey County Council by Geoffrey Hill. This observed data was used to enhance the base model within the study area, as described below.
2.4 Revised Zoning System
2.4.1 The original zoning system in the study area was too coarse to model the impact of the level crossing versus an underpass. Analyses of the RSI data, presented in Appendix B, showed that a large proportion of trips were local3. As a result,
3 Approximately 45% of all recorded vehicle trips at Station Road, Vicarage Road and Thorpe Road level crossings, were less than 3 miles in distance (07:00 – 19:00). This was calculated based on the model’s zoning system and centroid positioning.
Issue No. 02 Page 7 of 67 Document No.7994/01

Vicarage Road Underpass & Associated Mitigation Measures Modelling Report
zones 386, 390 and 391 were split into two, following as closely as possible the railway line. This provided zone connections either side of the level crossings for the local area.
2.4.2 Figure 2.1 shows the revised zone plan for the study area. Zones 386, 390 and 391 have been reduced, whilst zones 538, 539 and 540 have been added. All zone modifications have maintained the census output area boundaries.
2.4.3 Consequently, the original base matrices had to reflect the new zone plan. The origins and destinations of the original zones were apportioned to the new zone boundaries by their population which were derived from the 2001 census.
0
Key
Zone boundary Revised zone boundary
Zone 386 split into zones 386 & 538 Zone 390 split into zones 390 & 539 Zone 391 split into zones 391 & 540
N
Figure 2.1: R 2.5 Network Audit & Level Cro
2.5.1 The model’s highway netwensuring that key junctionsreflect on-street conditions
2.5.2 Moreover, the model did n(as shown in Figure 1.1):
i) Thorpe Road;
ii) Vicarage Road;
Issue No. 02
39
evised zo
ssing Rep
ork was a were inc.
ot include
Pag
386
539
ne plan in
lication
udited for thluded and d
the four le
e 8 of 67
391
540
the s
e enefine
vel cr
538
tudy area
tire study area. This involved d correctly, and that link types
ossings within the study area
Document No.7994/01

Vicarage Road Underpass & Associated Mitigation Measures Modelling Report
iii) Station Road; and
iv) Prune Hill.
2.5.3 Consequently, the level crossings were simulated within the model using dummy signalised crossroads. Two stages were compiled: the first being for road traffic and the second for the trains. Thus the first stage represents the time when the crossing is open to road traffic, and the second stage refers to when the crossing is closed to road traffic. The observed signal timings were acquired from survey data collected by Count on Us on behalf of BAA, and are listed in Appendix A, together with an explanation of how they were acquired and employed within the model.
2.6 Calibration
2.6.1 The SINTRAM (v4.0) base matrices were developed and calibrated for the entire county of Surrey. It is not surprising then that the matrices had to be progressed further to provide adequate replication of observed conditions within the study area. This was achieved by two means described below.
2.6.2 Firstly the roadside interview (RSI) survey data provided by BAA was used to enhance the 2005 base matrices. RSI surveys collected origin and destination data by vehicle class and time of day at the following locations:
- B3376 Thorpe Road northbound at the level crossing;
- B388 Vicarage Road northbound at the level crossing; and
- Station Road northbound at the level crossing.
2.6.3 The existing base matrices were calibrated to observed flows at these locations using the program’s matrix estimation routine. Screenline matrices were then compiled at these locations before omitting these identified trips from the calibrated base matrices. This enabled the trips identified from the screenline matrices to be replaced with those from the observed RSI data. In this way, the subsequent matrices inherited the observed RSI trip distribution.
2.6.4 Secondly, the model was populated with Surrey County Council’s observed traffic flows, as listed in Table 2.2. The base year is 2005, and, where possible, data from this or adjacent years were inserted. Matrix estimation was then performed to provide a good reflection of observed traffic flow in the study area.
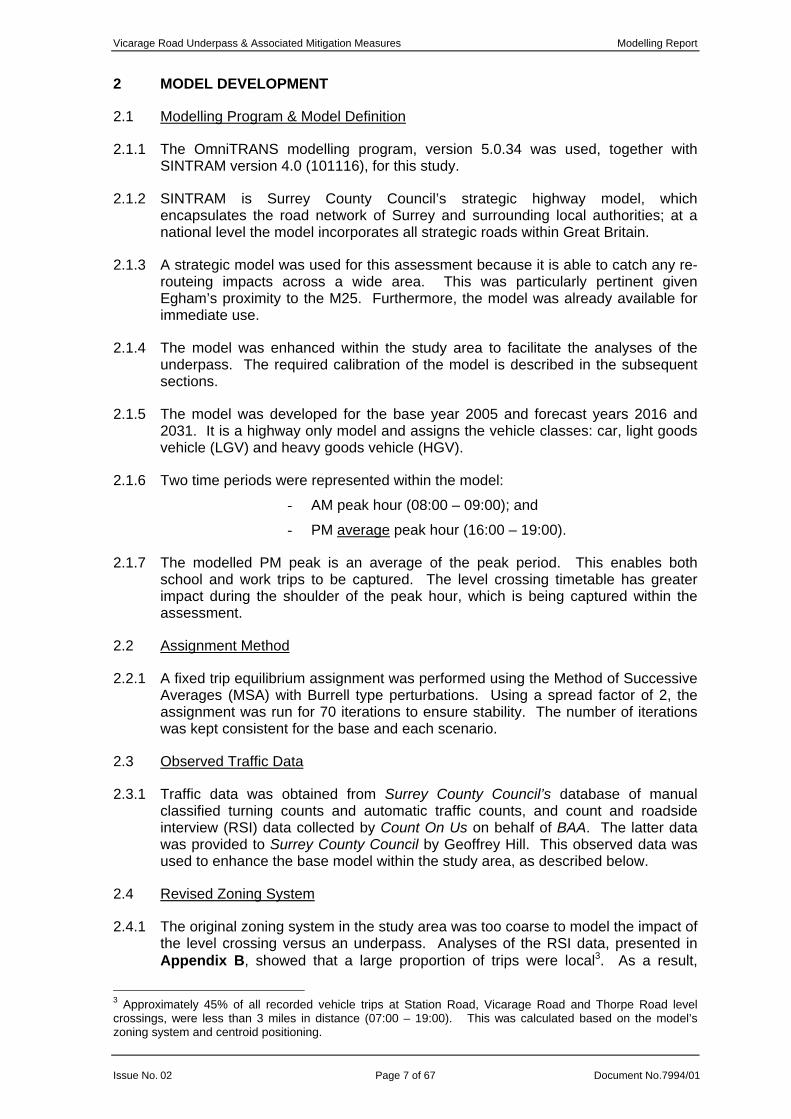
2.6.5 Tables 2.1 and 2.2 present a comparison between observed and modelled flows in accordance with the Department for Transport’s (DfT) guidance for the AM peak hour and average PM peak hour respectively.
2.6.6 A screenline has also been established which follows the railway line between Prune Hill and Thorpe Road level crossings.
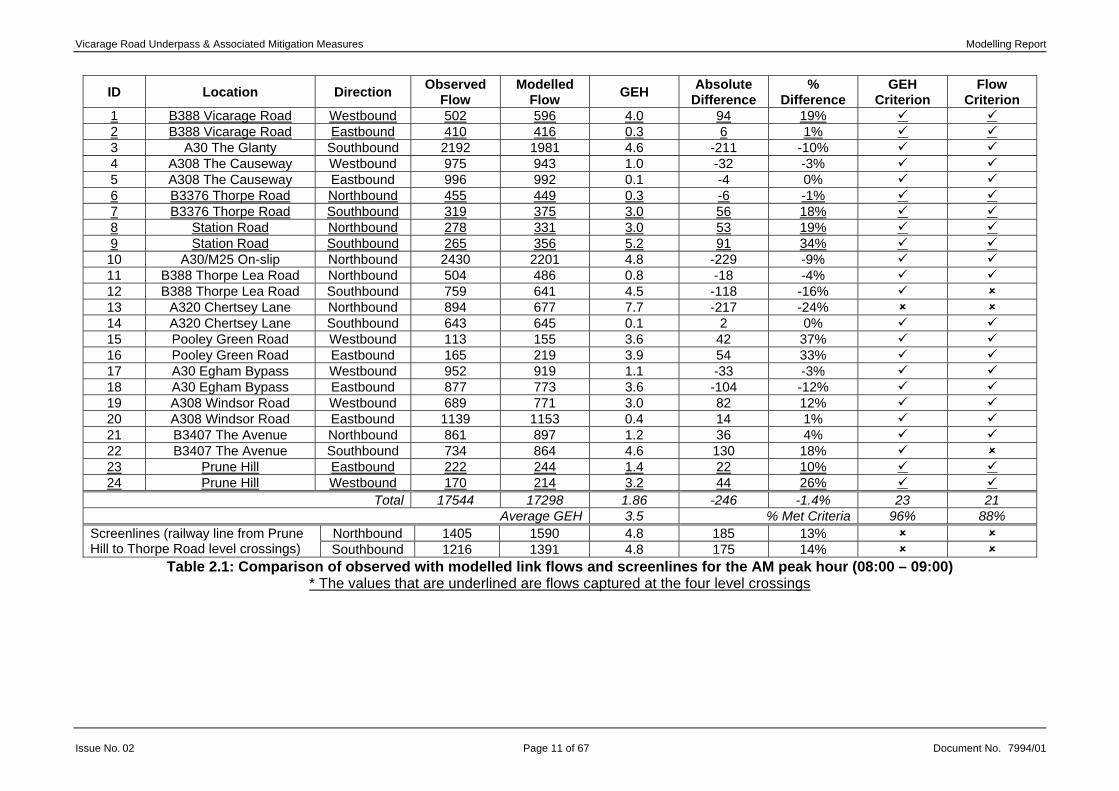
2.6.7 Figures 2.2 and 2.3 show the modelled flows plotted against the observed, which helps visualise the goodness of fit. An R2 value greater than 0.95 is considered to indicate that the model reflects observed traffic flows well.
2.6.8 Further guidelines for model validation are set out in the ‘Traffic Appraisal in Urban Areas4’. Its validation acceptability guidelines are summarised in Appendix C, for reference.
4 Highways Agency (1996), Design Manual for Roads and Bridges, Traffic Appraisals of Road Schemes, Volume 12a, Section 2, ‘Part 1: Traffic Appraisal in Urban Areas’, Chapter 4: Model Development.
Issue No. 02 Page 9 of 67 Document No.7994/01

Vicarage Road Underpass & Associated Mitigation Measures Modelling Report
2.6.9 The modelled 08:00 to 09:00 AM peak hour meets acceptability criteria when observed and modelled link flows are compared, as shown in Table 2.1 and in Figure 2.2. The A320 Chertsey Road northbound is the only location which does not meet both criterions with a GEH value of 7.7. The B388 Thorpe Lea Road southbound and B3407 The Avenue meet the GEH criterion but just fall short of achieving the flow criteria.
2.6.10 The screenline results, however, show an overestimation of flow across the railway line in both directions of travel. This is also true for the modelled average peak hour, 16:00 – 19:00.
2.6.11 Similarly the acceptability guidelines are met for the comparison of observed with modelled flows of the average PM peak hour, as shown in Table 2.2 and Figure 2.3. The criteria were not met, however, for the A30 Egham Bypass and Prune Hill in the westbound direction of travel. The GEH criterion is also not achieved for Prune Hill in the eastbound direction of travel.
2.6.12 In the achievement of these traffic flows, a few parameters had to be altered from their typical representation. These are listed below, and were only employed after other avenues had been exhausted.
- The link type for Prune Hill was set for a 20mph speed limited road. Although the actual limit is higher, observed speed data obtained from CJAMS (described below in Section 2.7) showed that during the AM peak hour (08:00 - 09:00) the average speed was 22mph in 2005, and during the PM peak (16:00 - 19:00) it was between 19 to 24mph. Prune Hill is essentially a rural lane that is winding, narrow and travels along steep gradients in places. Only with this link type could the base model come near to reflecting the low flow of vehicles which use this route. Moreover the link type will remain consistent for each scenario.
- The modelled delay value for the A30 Egham Bypass approach arm to Runnymede Roundabout was restricted to a maximum calibrated impedance value of 400 seconds. Without this, vehicles were not using the A30 here to access Runnymede Roundabout and it resulted in unrealistic routeing.
Issue No. 02 Page 10 of 67 Document No.7994/01
Vicarage Road Underpass & Associated Mitigation Measures Modelling Report
ID Location Direction Observed Flow
Modelled Flow GEH Absolute
Difference %
Difference GEH
Criterion Flow
Criterion 1 B388 Vicarage Road Westbound 502 596 4.0 94 19%2 B388 Vicarage Road Eastbound 410 416 0.3 6 1%3 A30 The Glanty Southbound 2192 1981 4.6 -211 -10% 4 A308 The Causeway Westbound 975 943 1.0 -32 -3% 5 A308 The Causeway Eastbound 996 992 0.1 -4 0% 6 B3376 Thorpe Road Northbound 455 449 0.3 -6 -1%7 B3376 Thorpe Road Southbound 319 375 3.0 56 18%8 Station Road Northbound 278 331 3.0 53 19%9 Station Road Southbound 265 356 5.2 91 34%10 A30/M25 On-slip Northbound 2430 2201 4.8 -229 -9% 11 B388 Thorpe Lea Road Northbound 504 486 0.8 -18 -4% 12 B388 Thorpe Lea Road Southbound 759 641 4.5 -118 -16% 13 A320 Chertsey Lane Northbound 894 677 7.7 -217 -24% 14 A320 Chertsey Lane Southbound 643 645 0.1 2 0% 15 Pooley Green Road Westbound 113 155 3.6 42 37% 16 Pooley Green Road Eastbound 165 219 3.9 54 33% 17 A30 Egham Bypass Westbound 952 919 1.1 -33 -3% 18 A30 Egham Bypass Eastbound 877 773 3.6 -104 -12% 19 A308 Windsor Road Westbound 689 771 3.0 82 12% 20 A308 Windsor Road Eastbound 1139 1153 0.4 14 1% 21 B3407 The Avenue Northbound 861 897 1.2 36 4% 22 B3407 The Avenue Southbound 734 864 4.6 130 18% 23 Prune Hill Eastbound 222 244 1.4 22 10%24 Prune Hill Westbound 170 214 3.2 44 26%
Total 17544 17298 1.86 -246 -1.4% 23 21Average GEH 3.5 % Met Criteria 96% 88%
Northbound 1405 1590 4.8 185 13% Screenlines (railway line from Prune Hill to Thorpe Road level crossings) Southbound 1216 1391 4.8 175 14%
Table 2.1: Comparison of observed with modelled link flows and screenlines for the AM peak hour (08:00 – 09:00) * The values that are underlined are flows captured at the four level crossings
Issue No. 02 Page 11 of 67 Document No. 7994/01
Vicarage Road Underpass & Associated Mitigation Measures Modelling Report
Modelled Versus Observed Flows for the AM Peak Hour
y = 0.94xR2 = 0.97
0
500
1000
1500
2000
2500
0 500 1000 1500 2000 2500
Observed Flow
Mod
elle
d Fl
ow
Figure 2.2: Comparison plot of modelled against observed link flows with best-fit regression line and correlation coefficient (R) for the AM
peak hour
Issue No. 02 Page 12 of 67 Document No. 7994/01

Vicarage Road Underpass & Associated Mitigation Measures Modelling Report
ID Location Direction Observed Flow
Modelled Flow GEH Absolute
Difference %
Difference GEH
Criterion Flow
Criterion 1 B388 Vicarage Road Westbound 378 374 0.2 -4 -1%2 B388 Vicarage Road Eastbound 536 480 2.5 -56 -10%3 A30 The Glanty Southbound 1865 1700 3.9 -165 -9% 4 A308 The Causeway Westbound 1216 1258 1.2 42 3% 5 A308 The Causeway Eastbound 668 585 3.3 -83 -12% 6 B3376 Thorpe Road Northbound 339 378 2.1 39 12%7 B3376 Thorpe Road Southbound 353 440 4.4 87 25%8 Station Road Northbound 232 291 3.7 59 25%9 Station Road Southbound 281 364 4.6 83 30%10 A30/M25 On-slip Northbound 2118 2188 1.5 70 3% 11 B388 Thorpe Lea Road Northbound 523 479 2.0 -44 -8% 12 B388 Thorpe Lea Road Southbound 376 471 4.6 95 25% 13 A320 Chertsey Lane Northbound 643 713 2.7 70 11% 14 A320 Chertsey Lane Southbound 816 761 2.0 -55 -7% 15 Pooley Green Road Westbound 121 76 4.5 -45 -37% 16 Pooley Green Road Eastbound 178 213 2.5 35 20% 17 A30 Egham Bypass Westbound 1179 911 8.3 -268 -23% 18 A30 Egham Bypass Eastbound 859 796 2.2 -63 -7% 19 A308 Windsor Road Westbound 834 876 1.4 42 5% 20 A308 Windsor Road Eastbound 907 932 0.8 25 3% 21 B3407 The Avenue Northbound 562 562 0.0 0 0% 22 B3407 The Avenue Southbound 612 688 3.0 76 12% 23 Prune Hill Eastbound 100 181 6.8 81 81%24 Prune Hill Westbound 153 290 9.2 137 90%
Total 15849 16007 1.3 158 1.0% 21 22Average GEH 3.2 % Met Criteria 88% 92%
Northbound 1102 1333 6.6 231 21% Screenlines (railway line from Prune Hill to Thorpe Road level crossings) Southbound 1270 1465 5.3 195 15%
Table 2.2: Comparison of observed with modelled link flows and screenlines for the average PM peak hour (16:00 – 19:00) * The values that are underlined are flows captured at the four level crossings
Issue No. 02 Page 13 of 67 Document No. 7994/01

Vicarage Road Underpass & Associated Mitigation Measures Modelling Report
Modelled Versus Observed Flows for the Average PM Peak Hour
y = 0.98xR2 = 0.97
0
500
1000
1500
2000
2500
0 500 1000 1500 2000 2500
Observed Flow
Mod
elle
d Fl
ow
Figure 2.3: Comparison plot of modelled against observed link flows with best-fit regression line and correlation coefficient (R) for the
average PM peak hour
Issue No. 02 Page 14 of 67 Document No. 7994/01

Vicarage Road Underpass & Associated Mitigation Measures Modelling Report
2.7 Validation
2.7.1 Independent assessment of the validity of the model was conducted. This involved comparing observed journey times, from the Congestion and Journey-time Acquisition and Monitoring System (CJAMS), with those from the model. CJAMS is developed by Motts MacDonald and holds observed journey time information from global positioning systems. Data has been obtained from CJAMS for the entire year 2005, for the AM peak hour (08:00 – 09:00) and the average of the PM peak period (16:00 – 19:00).
2.7.2 Figure 2.4 displays the selected routes for comparison which all bisect a level crossing. A route which crosses the Prune Hill level crossing has not been presented, because observed speeds from CJAMS were used to calibrate the link types in this location. The validation exercise must remain an independent assessment.
N
2.7.3 Tables 2.3 an
journey times 16:00 – 19:00similar to thoseroute 5 from B
Issue No. 02
Key Route 1: B388 Thorpe Road to Runnymede Roundabout (Northbound) Route 2: Runnymede Roundabout to B388 Thorpe Road (Southbound) Route 3: B3376 Thorpe Lea Road to A308 The Causeway (Northbound) Route 4: A308 The Causeway to B3376 Thorpe Lea Road (Southbound) Route 5: C10 Stroude Road to Runnymede Roundabout (Northbound) Route 6: Runnymede Roundabout to C10 Stroude Road (Southbound)
1
6
5
2
3
4
Figure 2.4: Journey time routes
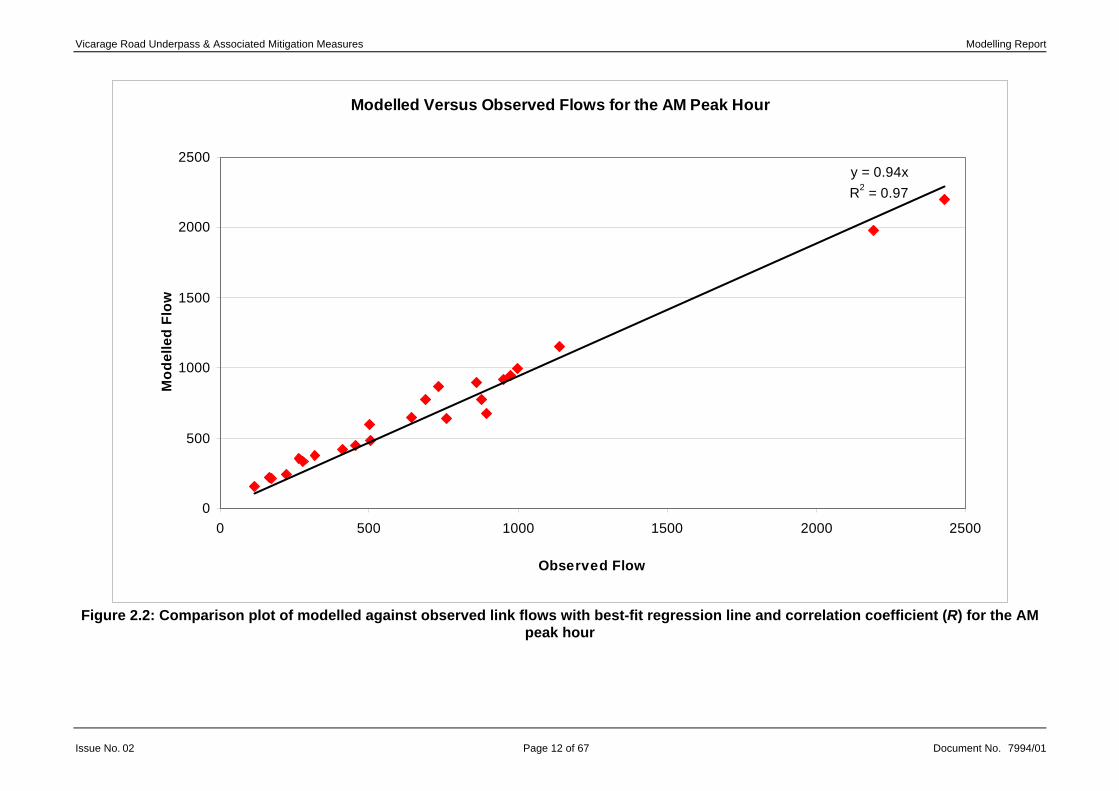
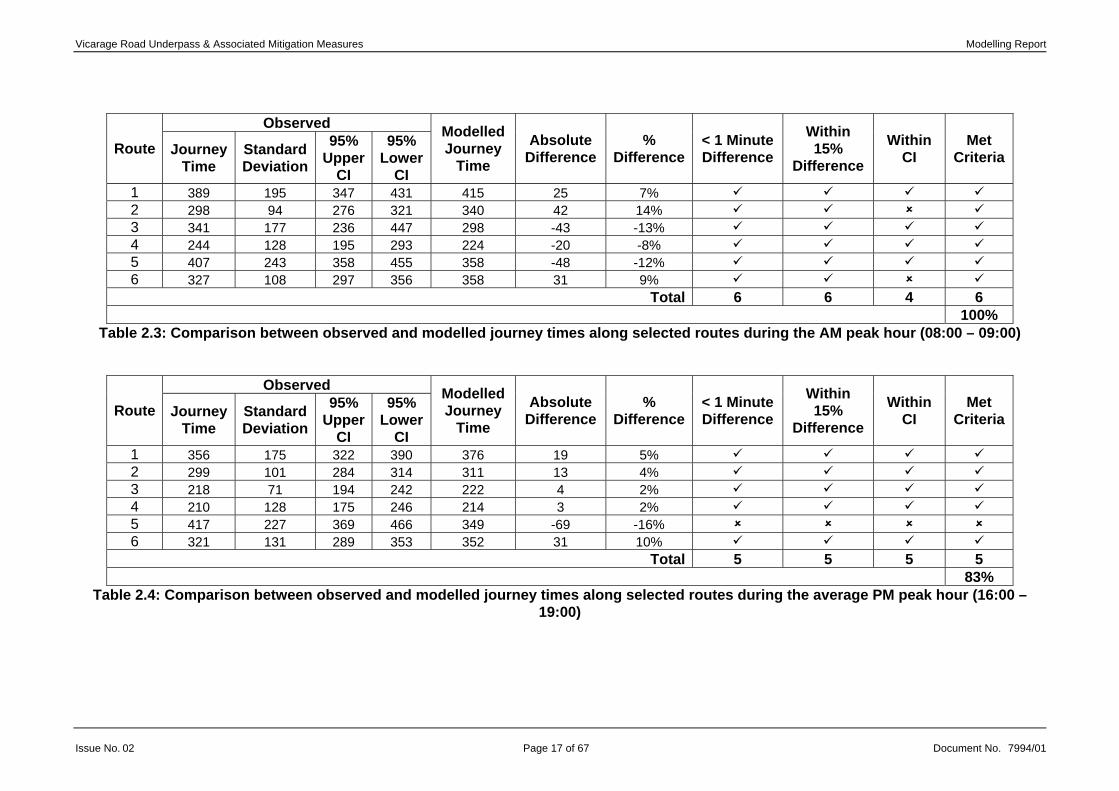
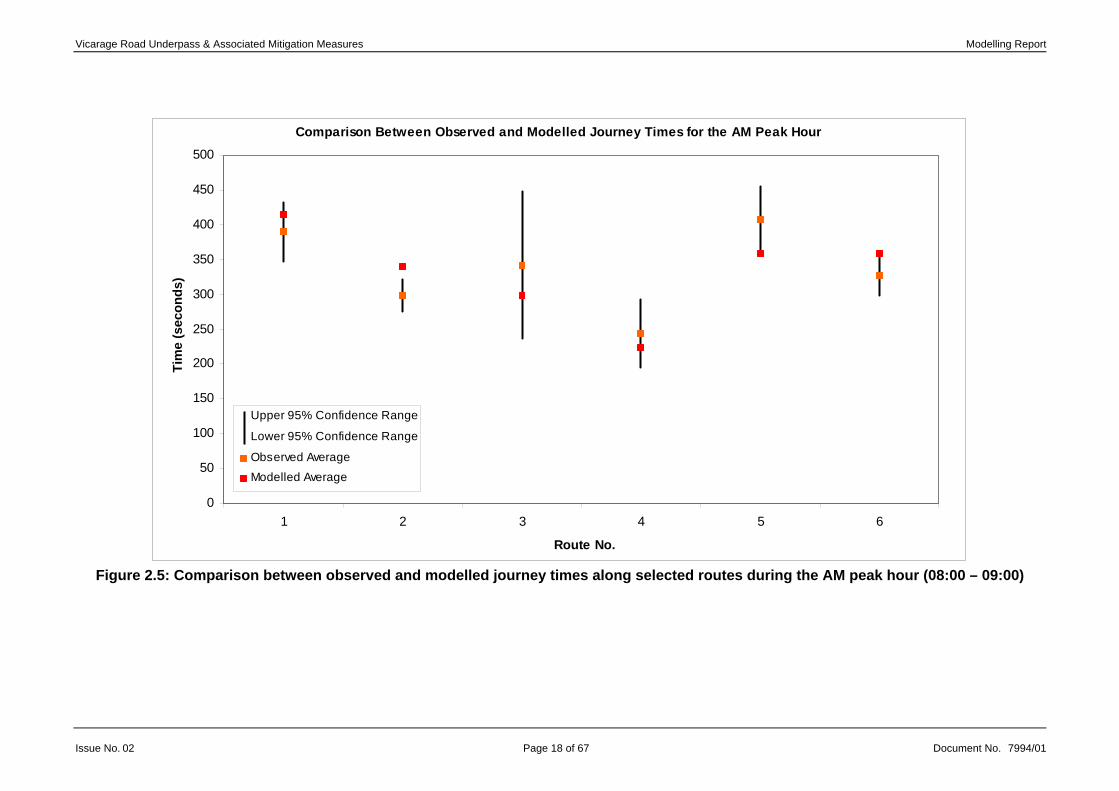
d 2.4 present the comparison between observed and modelled for the AM peak hour 08:00 – 09:00, and average PM peak hour , respectively. It shows that the modelled journey times are very that are observed. The only route that does not meet the criteria is
388 Vicarage Road to Runnymede Roundabout northbound. With a
Page 15 of 67 Document No.7994/01

Vicarage Road Underpass & Associated Mitigation Measures Modelling Report
modelled journey time of 349 seconds, it is 20 seconds short of the 95% lower confidence interval.
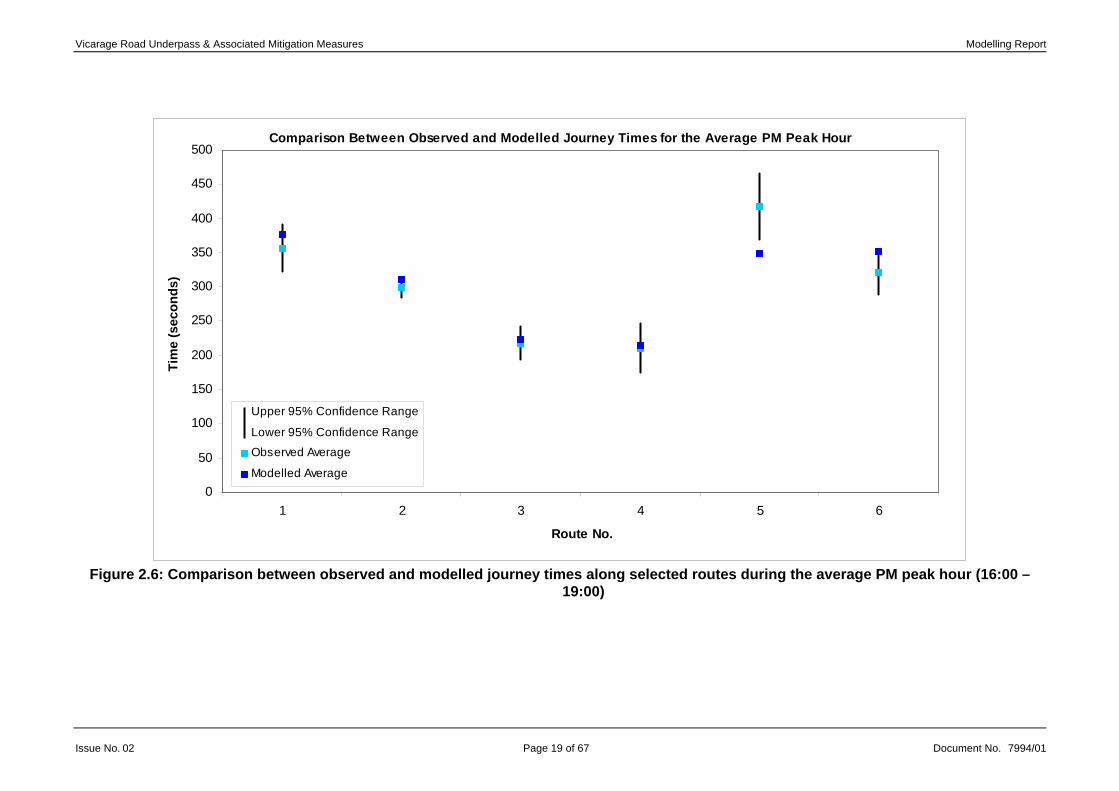
2.7.4 Figures 2.5 and 2.6 show the modelled journey times graphically displayed against the confidence intervals for the observed values.
2.7.5 Overall, the model is considered to be a good representation of the observed highway network, and to be an adequate tool for the assessment of an underpass at Vicarage Road level crossing as well as associated mitigation measures.
Issue No. 02 Page 16 of 67 Document No.7994/01
Vicarage Road Underpass & Associated Mitigation Measures Modelling Report
Observed
Route Journey Time
Standard Deviation
95% Upper
CI
95% Lower
CI
Modelled Journey
Time
Absolute Difference
% Difference
< 1 Minute Difference
Within 15%
Difference
Within CI
Met Criteria
1 389 195 347 431 415 25 7% 2 298 94 276 321 340 42 14% 3 341 177 236 447 298 -43 -13% 4 244 128 195 293 224 -20 -8% 5 407 243 358 455 358 -48 -12% 6 327 108 297 356 358 31 9%
Total 6 6 4 6 100%
Table 2.3: Comparison between observed and modelled journey times along selected routes during the AM peak hour (08:00 – 09:00)
Observed
Route Journey Time
Standard Deviation
95% Upper
CI
95% Lower
CI
Modelled Journey
Time
Absolute Difference
% Difference
< 1 Minute Difference
Within 15%
Difference
Within CI
Met Criteria
1 356 175 322 390 376 19 5% 2 299 101 284 314 311 13 4% 3 218 71 194 242 222 4 2% 4 210 128 175 246 214 3 2% 5 417 227 369 466 349 -69 -16% 6 321 131 289 353 352 31 10%
Total 5 5 5 5 83%
Table 2.4: Comparison between observed and modelled journey times along selected routes during the average PM peak hour (16:00 – 19:00)
Issue No. 02 Page 17 of 67 Document No. 7994/01
Vicarage Road Underpass & Associated Mitigation Measures Modelling Report
Comparison Between Observed and Modelled Journey Times for the AM Peak Hour
0
50
100
150
200
250
300
350
400
450
500
1 2 3 4 5 6
Route No.
Tim
e (s
econ
ds)
Upper 95% Confidence Range
Lower 95% Confidence Range
Observed Average
Modelled Average
Figure 2.5: Comparison between observed and modelled journey times along selected routes during the AM peak hour (08:00 – 09:00)
Issue No. 02 Page 18 of 67 Document No. 7994/01
Vicarage Road Underpass & Associated Mitigation Measures Modelling Report
Comparison Between Observed and Modelled Journey Times for the Average PM Peak Hour
0
50
100
150
200
250
300
350
400
450
500
1 2 3 4 5 6
Route No.
Tim
e (s
econ
ds)
Upper 95% Confidence Range
Lower 95% Confidence Range
Observed Average
Modelled Average
Figure 2.6: Comparison between observed and modelled journey times along selected routes during the average PM peak hour (16:00 –
19:00)
Issue No. 02 Page 19 of 67 Document No. 7994/01
Vicarage Road Underpass & Associated Mitigation Measures Modelling Report
3 FORECASTING
3.1 Forecast Years
3.1.1 Two forecast years have been created to represent the opening year and design year, respectively:
- 2016; and
- 2031.
3.2 Future Year Network Changes
3.2.1 The following changes have been made to all future year model networks to reflect committed major highway schemes, and minor schemes within the immediate study area, that will be in position in 2016 and 2031.
- M25 junction 16 to 13 carriageway widening from dual 3 lanes to dual 4 lanes in each direction.
- M25 junction 27 to 30 carriageway widening from dual 3 lanes to dual 4 lanes in each direction.
- A3 Hindhead Improvement which includes a new dual 2 lane road of 6.5km with tunnels, and a new “Hazel Grove” grade-separated junction south of the existing Hindhead crossroads.
- Traffic calming along the entire stretch of Pooley Green Road between B3376 Thorpe Lea Road and B388 Vicarage Road.
3.2.2 All other network changes reflect the individual scenarios being modelled, as defined in Section 1.5. The modelled level crossing downtimes are provided in Appendix A, and have been determined from level crossing information provided by Geoffrey Hill on behalf on BAA5.
3.3 Waitrose and Travelodge Development Site
3.3.1 A Waitrose store with a gross floor area of 3,372m2 and a 60-room Travelodge hotel is due to be opening within the next 12 months. It will be situated in the Church Road shopping precinct on Ardale Way car park in Egham town centre.
3.3.2 Given its close proximity to the Vicarage Road level crossing, its agreed predicted trip generation from the development’s approved Transport Assessment, as shown in Table 3.1, has been included in the forecasting methodology.
5 Observed level crossing operations were provided in an email to William Bryans dated 06/11/09 and to Gemma Thomas on 06/04/10, both from Geoffrey Hill. Revised forecasted level crossing operations were provided in an email to Abigail Fielder dated 04/03/10 from Geoffrey Hill.
Issue No. 02 Page 20 of 67 Document No.7994/01

Vicarage Road Underpass & Associated Mitigation Measures Modelling Report
Time Period Arrivals Departures Waitrose
08:00 – 09:00 122 49 16:00 – 17:00 167 182 17:00 – 18:00 158 182 18:00 – 19:00 102 124 Average PM peak hour (16:00 – 19:00) 142 163
Travelodge 08:00 – 09:00 6 13 16:00 – 17:00 6 6 17:00 – 18:00 9 6 18:00 – 19:00 9 5 Average PM peak hour (16:00 – 19:00) 8 6
Total Trip Generation for Modelled Time Periods AM peak hour (08:00 – 09:00) 128 62 Average PM peak hour (16:00 – 19:00) 150 169
Table 3.1: Agreed trip generation for 2010 (opening year when the planning application was granted)
3.4 Forecasting Methodology
3.4.1 To generate 2016 and 2031 demand matrices, growth factors were derived from TEMPRO version 5.4. The TEMPRO software is supplied by the DfT and provides summaries of National Trip End Model (NTEM) forecast data for transport planning purposes. The forecasts include population, employment, trip ends and households by car ownership.
3.4.2 In this instance, trip end growth was simply calculated by taking the ratio of the forecast year divided by the base year. The all-purpose origin/destination forecasts for car drivers have been used to forecast the car vehicle trip ends. Whereas, the non-home based employers business forecast have been employed to generate forecast trip ends for LGV and HGV users. The resultant growth factors have be used to create forecast matrices using the Furness method for each modelled user group.
3.4.3 Due to the limited changes in travel cost from the proposed mitigation measures, the forecast demand was fixed.
Issue No. 02 Page 21 of 67 Document No.7994/01

Vicarage Road Underpass & Associated Mitigation Measures Modelling Report
4 SCENARIO TESTING & ANALYSES
4.1 Introduction
4.1.1 Basic analyses of the different scenarios and forecast years have been undertaken and are presented in this section. The following measures were acquired from the model to assist with this.
- Link flows;
- Link average travel speeds;
- Link travel times;
- Highway capacity;
- Vehicle kilometres travelled; and
- Junction delay.
4.1.2 Sections 4.2 to 4.7 present direct outputs from the model. Commentary regarding the output and the impact of each scenario on the highway is provided in the subsequent Sections 4.8 to 4.13.
4.1.3 Please note that not all scenarios have required to be evaluated to the same level of detail.
4.1.4 Moreover, scenario 4 was not assessed within the model due to continuing queries regarding its design and the detail required for its representation.
Issue No. 02 Page 22 of 67 Document No.7994/01
Vicarage Road Underpass & Associated Mitigation Measures Modelling Report
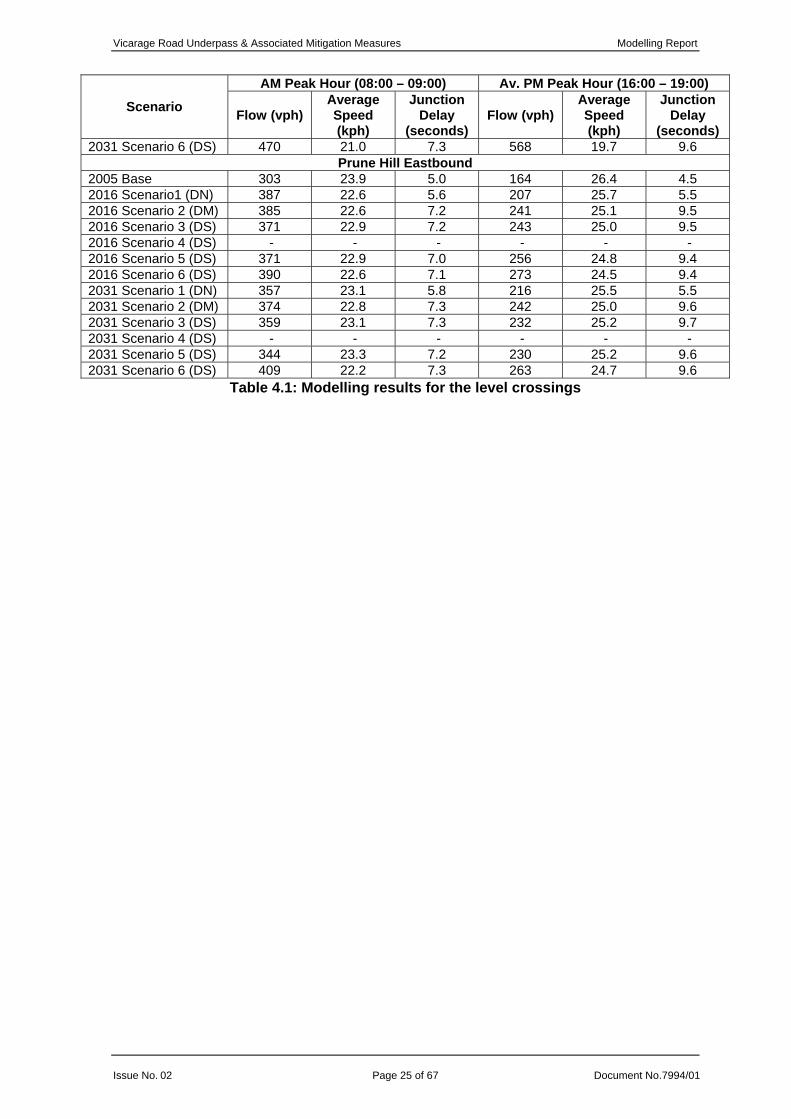
4.2 Overall Impact at the Level Crossings
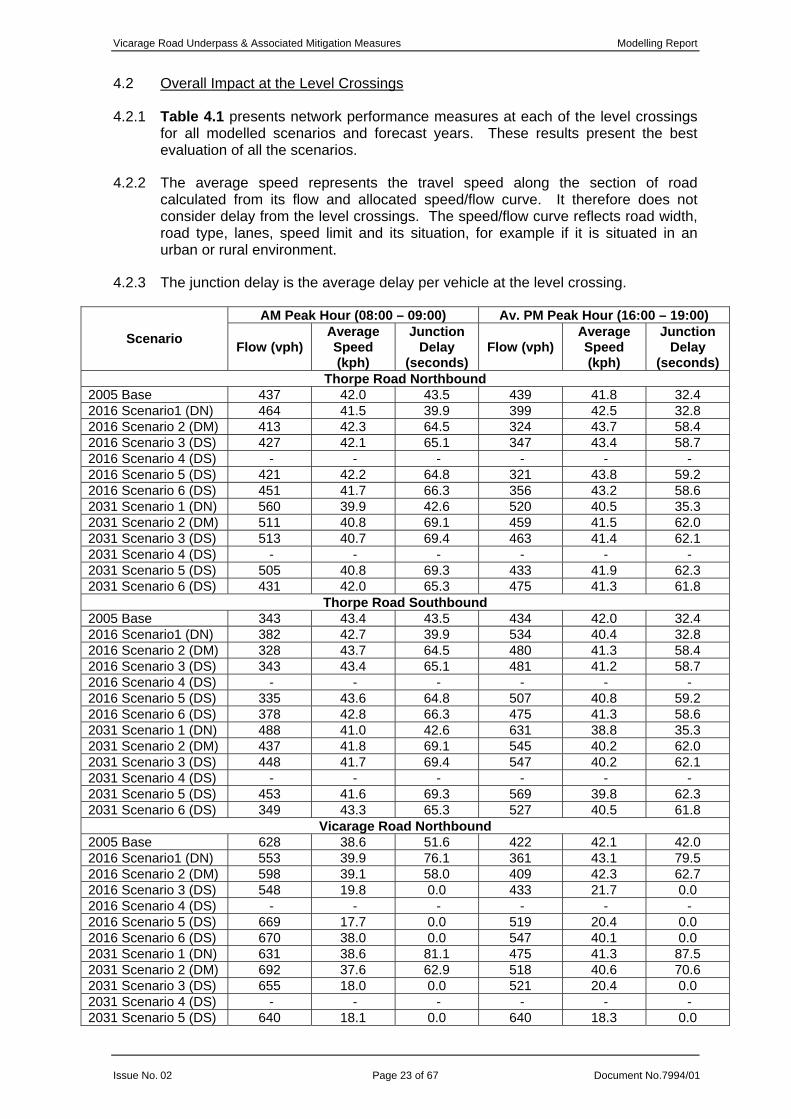
4.2.1 Table 4.1 presents network performance measures at each of the level crossings for all modelled scenarios and forecast years. These results present the best evaluation of all the scenarios.
4.2.2 The average speed represents the travel speed along the section of road calculated from its flow and allocated speed/flow curve. It therefore does not consider delay from the level crossings. The speed/flow curve reflects road width, road type, lanes, speed limit and its situation, for example if it is situated in an urban or rural environment.
4.2.3 The junction delay is the average delay per vehicle at the level crossing.
AM Peak Hour (08:00 – 09:00) Av. PM Peak Hour (16:00 – 19:00)
Scenario Flow (vph) Average Speed (kph)
Junction Delay
(seconds) Flow (vph)
Average Speed (kph)
Junction Delay
(seconds) Thorpe Road Northbound
2005 Base 437 42.0 43.5 439 41.8 32.4 2016 Scenario1 (DN) 464 41.5 39.9 399 42.5 32.8 2016 Scenario 2 (DM) 413 42.3 64.5 324 43.7 58.4 2016 Scenario 3 (DS) 427 42.1 65.1 347 43.4 58.7 2016 Scenario 4 (DS) - - - - - - 2016 Scenario 5 (DS) 421 42.2 64.8 321 43.8 59.2 2016 Scenario 6 (DS) 451 41.7 66.3 356 43.2 58.6 2031 Scenario 1 (DN) 560 39.9 42.6 520 40.5 35.3 2031 Scenario 2 (DM) 511 40.8 69.1 459 41.5 62.0 2031 Scenario 3 (DS) 513 40.7 69.4 463 41.4 62.1 2031 Scenario 4 (DS) - - - - - - 2031 Scenario 5 (DS) 505 40.8 69.3 433 41.9 62.3 2031 Scenario 6 (DS) 431 42.0 65.3 475 41.3 61.8
Thorpe Road Southbound 2005 Base 343 43.4 43.5 434 42.0 32.4 2016 Scenario1 (DN) 382 42.7 39.9 534 40.4 32.8 2016 Scenario 2 (DM) 328 43.7 64.5 480 41.3 58.4 2016 Scenario 3 (DS) 343 43.4 65.1 481 41.2 58.7 2016 Scenario 4 (DS) - - - - - - 2016 Scenario 5 (DS) 335 43.6 64.8 507 40.8 59.2 2016 Scenario 6 (DS) 378 42.8 66.3 475 41.3 58.6 2031 Scenario 1 (DN) 488 41.0 42.6 631 38.8 35.3 2031 Scenario 2 (DM) 437 41.8 69.1 545 40.2 62.0 2031 Scenario 3 (DS) 448 41.7 69.4 547 40.2 62.1 2031 Scenario 4 (DS) - - - - - - 2031 Scenario 5 (DS) 453 41.6 69.3 569 39.8 62.3 2031 Scenario 6 (DS) 349 43.3 65.3 527 40.5 61.8
Vicarage Road Northbound 2005 Base 628 38.6 51.6 422 42.1 42.0 2016 Scenario1 (DN) 553 39.9 76.1 361 43.1 79.5 2016 Scenario 2 (DM) 598 39.1 58.0 409 42.3 62.7 2016 Scenario 3 (DS) 548 19.8 0.0 433 21.7 0.0 2016 Scenario 4 (DS) - - - - - - 2016 Scenario 5 (DS) 669 17.7 0.0 519 20.4 0.0 2016 Scenario 6 (DS) 670 38.0 0.0 547 40.1 0.0 2031 Scenario 1 (DN) 631 38.6 81.1 475 41.3 87.5 2031 Scenario 2 (DM) 692 37.6 62.9 518 40.6 70.6 2031 Scenario 3 (DS) 655 18.0 0.0 521 20.4 0.0 2031 Scenario 4 (DS) - - - - - - 2031 Scenario 5 (DS) 640 18.1 0.0 640 18.3 0.0
Issue No. 02 Page 23 of 67 Document No.7994/01

Vicarage Road Underpass & Associated Mitigation Measures Modelling Report
AM Peak Hour (08:00 – 09:00) Av. PM Peak Hour (16:00 – 19:00)
Scenario Flow (vph) Average Speed (kph)
Junction Delay
(seconds) Flow (vph)
Average Speed (kph)
Junction Delay
(seconds) 2031 Scenario 6 (DS) 759 36.4 0.0 660 38.3 0.0
Vicarage Road Southbound 2005 Base 590 39.3 51.6 596 39.3 42.0 2016 Scenario1 (DN) 505 40.7 76.1 656 38.4 79.5 2016 Scenario 2 (DM) 576 39.5 58.0 679 38.0 62.7 2016 Scenario 3 (DS) 504 20.5 0.0 677 17.8 0.0 2016 Scenario 4 (DS) - - - - - - 2016 Scenario 5 (DS) 508 20.4 0.0 657 18.1 0.0 2016 Scenario 6 (DS) 698 37.5 0.0 874 34.8 0.0 2031 Scenario 1 (DN) 585 39.3 81.1 783 36.2 87.5 2031 Scenario 2 (DM) 661 38.1 62.9 816 35.6 70.6 2031 Scenario 3 (DS) 613 18.5 0.0 800 15.0 0.0 2031 Scenario 4 (DS) - - - - - - 2031 Scenario 5 (DS) 530 20.1 0.0 767 15.3 0.0 2031 Scenario 6 (DS) 798 35.7 0.0 989 32.8 0.0
Station Road Northbound 2005 Base 322 43.8 38.2 233 45.2 26.8 2016 Scenario1 (DN) 349 43.4 29.5 244 45.1 28.9 2016 Scenario 2 (DM) 327 43.7 54.1 203 45.8 68.7 2016 Scenario 3 (DS) 335 43.6 54.3 195 45.9 69.0 2016 Scenario 4 (DS) - - - - - - 2016 Scenario 5 (DS) 332 43.7 54.8 214 45.6 68.0 2016 Scenario 6 (DS) 314 43.9 53.0 160 46.5 66.5 2031 Scenario 1 (DN) 349 43.4 30.2 257 44.9 28.6 2031 Scenario 2 (DM) 334 43.7 54.7 234 45.3 68.7 2031 Scenario 3 (DS) 332 43.6 55.1 233 45.3 70.1 2031 Scenario 4 (DS) - - - - - - 2031 Scenario 5 (DS) 350 43.4 56.5 228 45.4 69.9 2031 Scenario 6 (DS) 315 43.9 53.8 182 46.1 67.3
Station Road Southbound 2005 Base 335 43.5 38.2 348 43.5 26.8 2016 Scenario1 (DN) 456 41.5 29.5 499 41.0 28.9 2016 Scenario 2 (DM) 421 42.1 54.1 428 42.1 68.7 2016 Scenario 3 (DS) 427 42.0 54.3 436 42.0 69.0 2016 Scenario 4 (DS) - - - - - - 2016 Scenario 5 (DS) 451 41.6 54.8 405 42.5 68.0 2016 Scenario 6 (DS) 376 42.8 53.0 365 43.2 66.5 2031 Scenario 1 (DN) 505 40.7 30.2 476 41.3 28.6 2031 Scenario 2 (DM) 444 41.6 54.7 422 42.2 68.7 2031 Scenario 3 (DS) 462 41.4 55.1 461 41.6 70.1 2031 Scenario 4 (DS) - - - - - - 2031 Scenario 5 (DS) 508 40.6 56.5 455 41.7 69.9 2031 Scenario 6 (DS) 413 42.2 53.8 387 42.8 67.3
Prune Hill Westbound 2005 Base 184 25.9 5.0 339 23.4 4.5 2016 Scenario1 (DN) 398 22.3 5.6 554 20.0 5.5 2016 Scenario 2 (DM) 432 21.7 7.2 537 20.2 9.5 2016 Scenario 3 (DS) 441 21.5 7.2 533 20.3 9.5 2016 Scenario 4 (DS) - - - - - - 2016 Scenario 5 (DS) 381 22.6 7.0 512 20.6 9.4 2016 Scenario 6 (DS) 401 22.2 7.1 529 20.3 9.4 2031 Scenario 1 (DN) 487 20.7 5.8 585 19.4 5.5 2031 Scenario 2 (DM) 470 21.0 7.3 553 20.0 9.6 2031 Scenario 3 (DS) 492 20.7 7.3 573 19.6 9.7 2031 Scenario 4 (DS) - - - - - - 2031 Scenario 5 (DS) 461 21.1 7.2 568 19.7 9.6
Issue No. 02 Page 24 of 67 Document No.7994/01
Vicarage Road Underpass & Associated Mitigation Measures Modelling Report
AM Peak Hour (08:00 – 09:00) Av. PM Peak Hour (16:00 – 19:00)
Scenario Flow (vph) Average Speed (kph)
Junction Delay
(seconds) Flow (vph)
Average Speed (kph)
Junction Delay
(seconds) 2031 Scenario 6 (DS) 470 21.0 7.3 568 19.7 9.6
Prune Hill Eastbound 2005 Base 303 23.9 5.0 164 26.4 4.5 2016 Scenario1 (DN) 387 22.6 5.6 207 25.7 5.5 2016 Scenario 2 (DM) 385 22.6 7.2 241 25.1 9.5 2016 Scenario 3 (DS) 371 22.9 7.2 243 25.0 9.5 2016 Scenario 4 (DS) - - - - - - 2016 Scenario 5 (DS) 371 22.9 7.0 256 24.8 9.4 2016 Scenario 6 (DS) 390 22.6 7.1 273 24.5 9.4 2031 Scenario 1 (DN) 357 23.1 5.8 216 25.5 5.5 2031 Scenario 2 (DM) 374 22.8 7.3 242 25.0 9.6 2031 Scenario 3 (DS) 359 23.1 7.3 232 25.2 9.7 2031 Scenario 4 (DS) - - - - - - 2031 Scenario 5 (DS) 344 23.3 7.2 230 25.2 9.6 2031 Scenario 6 (DS) 409 22.2 7.3 263 24.7 9.6
Table 4.1: Modelling results for the level crossings
Issue No. 02 Page 25 of 67 Document No.7994/01

Vicarage Road Underpass & Associated Mitigation Measures Modelling Report
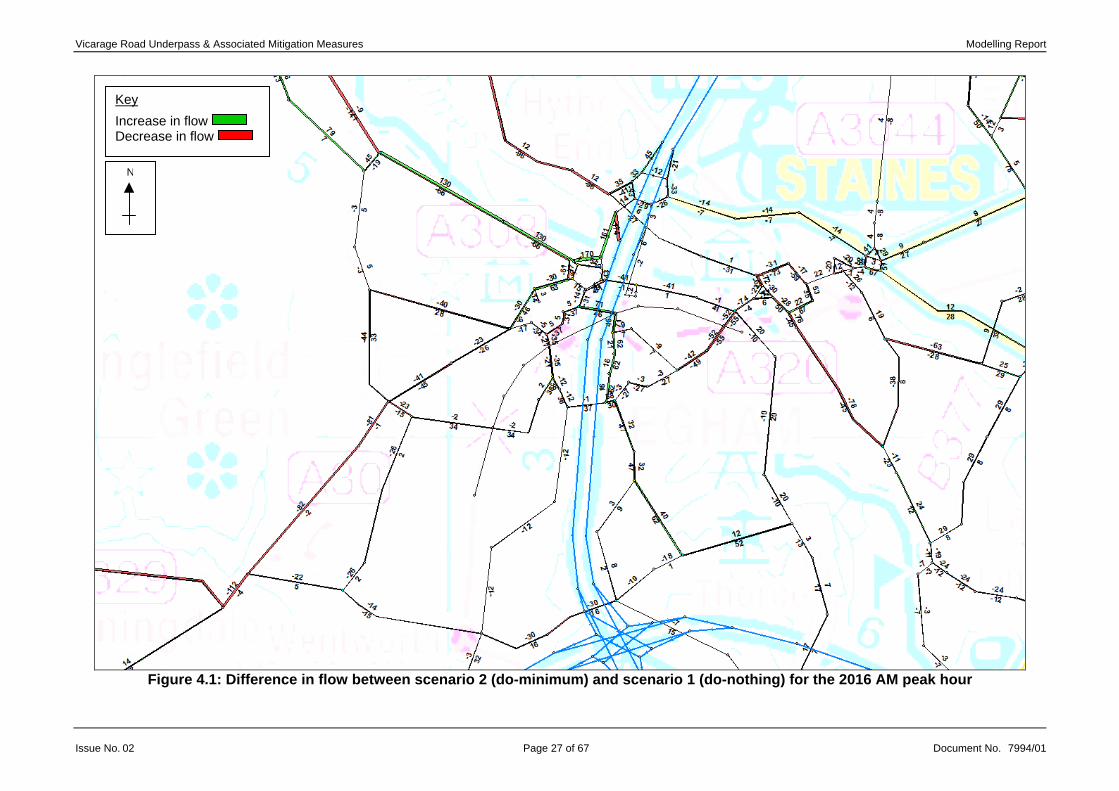
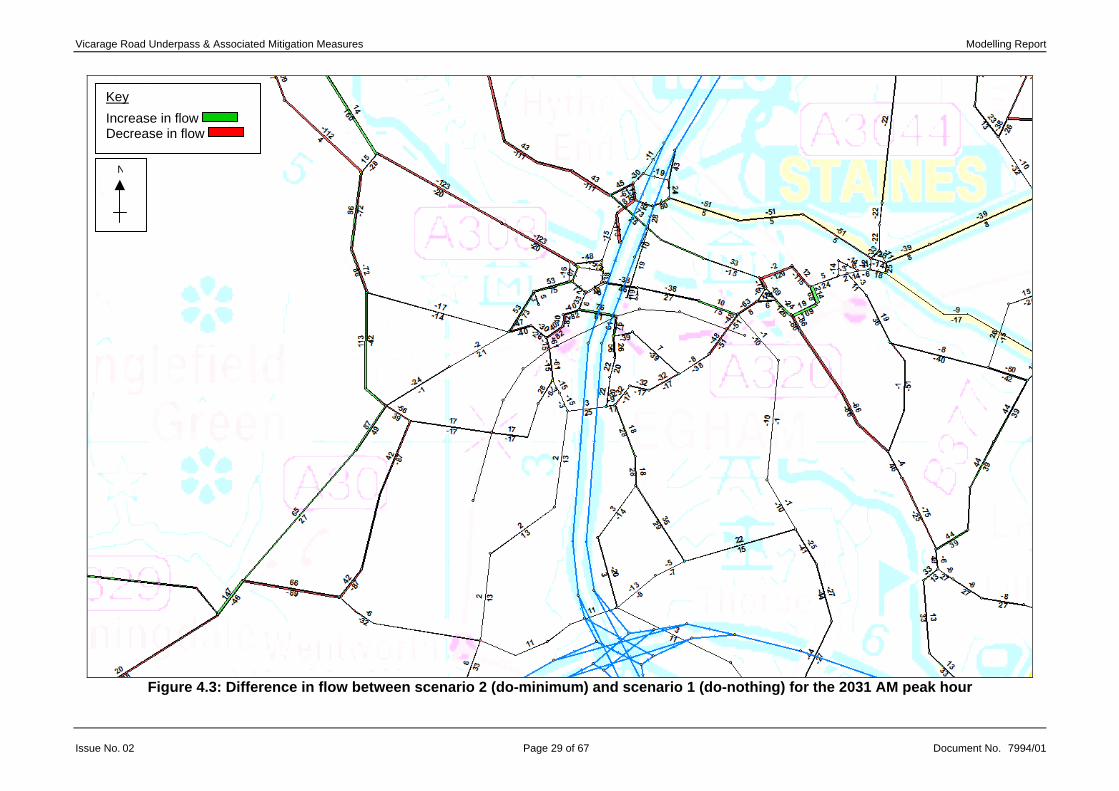
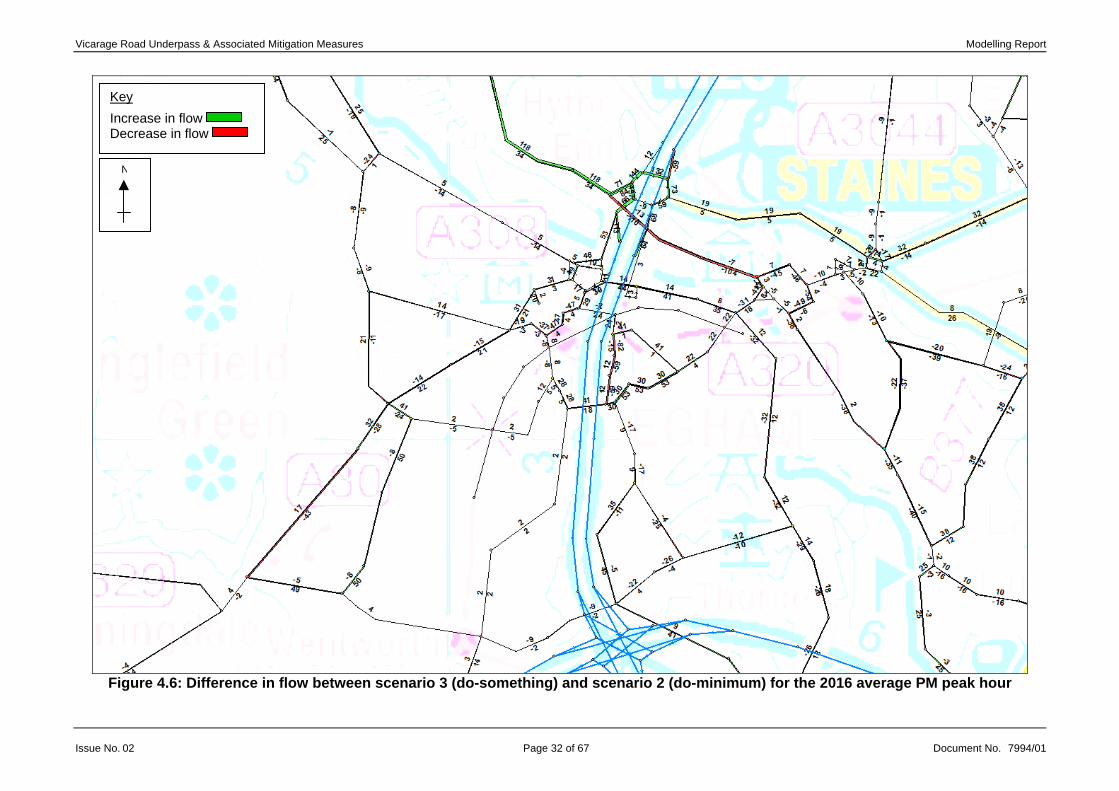
4.3 Flow Difference Plots
4.3.1 Flow difference plots have been presented for the following assessments:
- 2016 AM peak hour, scenario 2 (do-minimum) minus scenario 1 (do-nothing) in Figure 4.1;
- 2016 average PM peak hour, scenario 2 (do-minimum) minus scenario 1 (do-nothing) in Figure 4.2;
- 2031 AM peak hour, scenario 2 (do-minimum) minus scenario 1 (do-nothing) in Figure 4.3;
- 2031 average PM peak hour, scenario 2 (do-minimum) minus scenario 1 (do-nothing) in Figure 4.4;
- 2016 AM peak hour, scenario 3 (do-something) minus scenario 2 (do-minimum) in Figure 4.5;
- 2016 average PM peak hour, scenario 3 (do-something) minus scenario 2 (do-minimum) in Figure 4.6;
- 2031 AM peak hour, scenario 3 (do-something) minus scenario 2 (do-minimum) in Figure 4.7; and
- 2031 average PM peak hour, scenario 3 (do-something) minus scenario 2 (do-minimum) in Figure 4.8.
Issue No. 02 Page 26 of 67 Document No.7994/01
Vicarage Road Underpass & Associated Mitigation Measures Modelling Report
Key
Increase in flow Decrease in flow
N
Figure 4.1: Difference in flow between scenario 2 (do-minimum) and scenario 1 (do-nothing) for the 2016 AM peak hour
Issue No. 02 Page 27 of 67 Document No. 7994/01

Vicarage Road Underpass & Associated Mitigation Measures Modelling Report
Key
Increase in flow Decrease in flow
N
Figure 4.2: Difference in flow between scenario 2 (do-minimum) and scenario 1 (do-nothing) for the 2016 average PM peak hour
Issue No. 02 Page 28 of 67 Document No. 7994/01
Vicarage Road Underpass & Associated Mitigation Measures Modelling Report
Key
Increase in flow Decrease in flow
N
Figure 4.3: Difference in flow between scenario 2 (do-minimum) and scenario 1 (do-nothing) for the 2031 AM peak hour
Issue No. 02 Page 29 of 67 Document No. 7994/01

Vicarage Road Underpass & Associated Mitigation Measures Modelling Report
Key
Increase in flow Decrease in flow
N
Figure 4.4: Difference in flow between scenario 2 (do-minimum) and scenario 1 (do-nothing) for the 2031 average PM peak hour
Issue No. 02 Page 30 of 67 Document No. 7994/01

Vicarage Road Underpass & Associated Mitigation Measures Modelling Report
Key
Increase in flow Decrease in flow
N
Figure 4.5: Difference in flow between scenario 3 (do-something) and scenario 2 (do-minimum) for the 2016 AM peak hour
Issue No. 02 Page 31 of 67 Document No. 7994/01
Vicarage Road Underpass & Associated Mitigation Measures Modelling Report
Key
Increase in flow Decrease in flow
N
Figure 4.6: Difference in flow between scenario 3 (do-something) and scenario 2 (do-minimum) for the 2016 average PM peak hour
Issue No. 02 Page 32 of 67 Document No. 7994/01

Vicarage Road Underpass & Associated Mitigation Measures Modelling Report
Key
Increase in flow Decrease in flow
N
Figure 4.7: Difference in flow between scenario 3 (do-something) and scenario 2 (do-minimum) for the 2031 AM peak hour
Issue No. 02 Page 33 of 67 Document No. 7994/01
Vicarage Road Underpass & Associated Mitigation Measures Modelling Report
Key
Increase in flow Decrease in flow
N
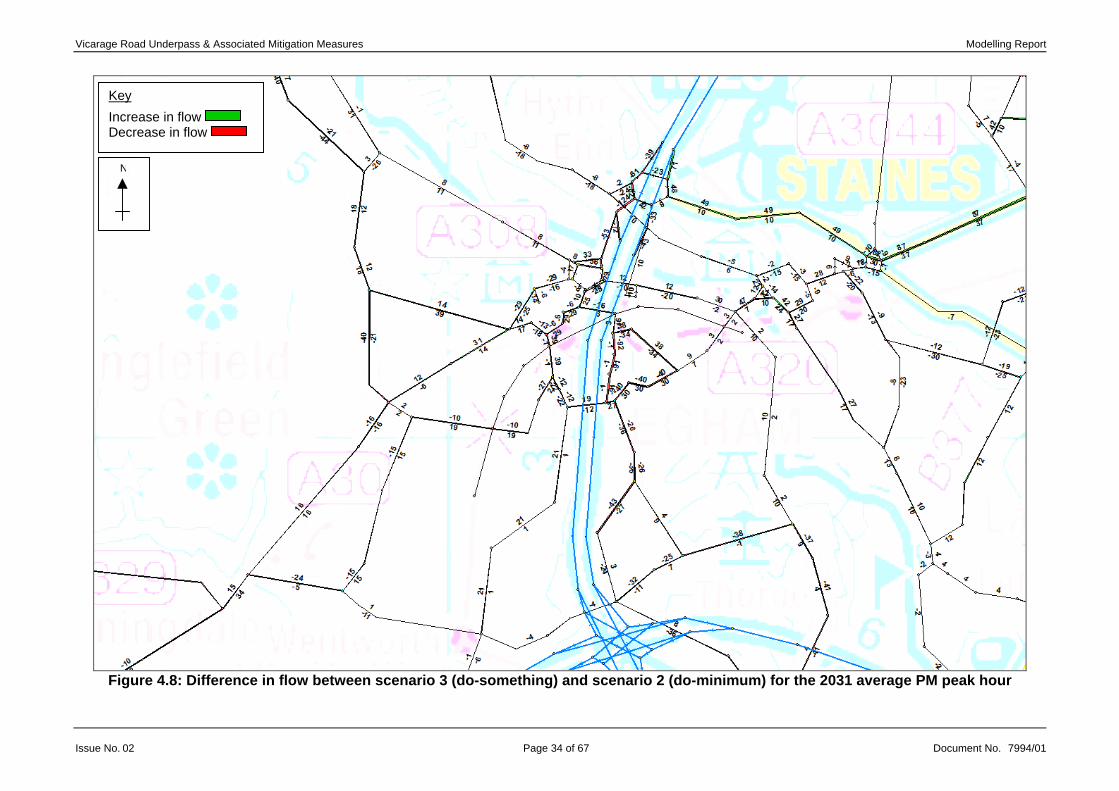
Figure 4.8: Difference in flow between scenario 3 (do-something) and scenario 2 (do-minimum) for the 2031 average PM peak hour
Issue No. 02 Page 34 of 67 Document No. 7994/01

Vicarage Road Underpass & Associated Mitigation Measures Modelling Report
4.4 Journey Time Comparisons
4.4.1 The journey times for the validated routes described in Section 2.7 and shown in Figure 2.4, have been extracted for the model scenarios 1 to 3 and are presented in Table 4.2.
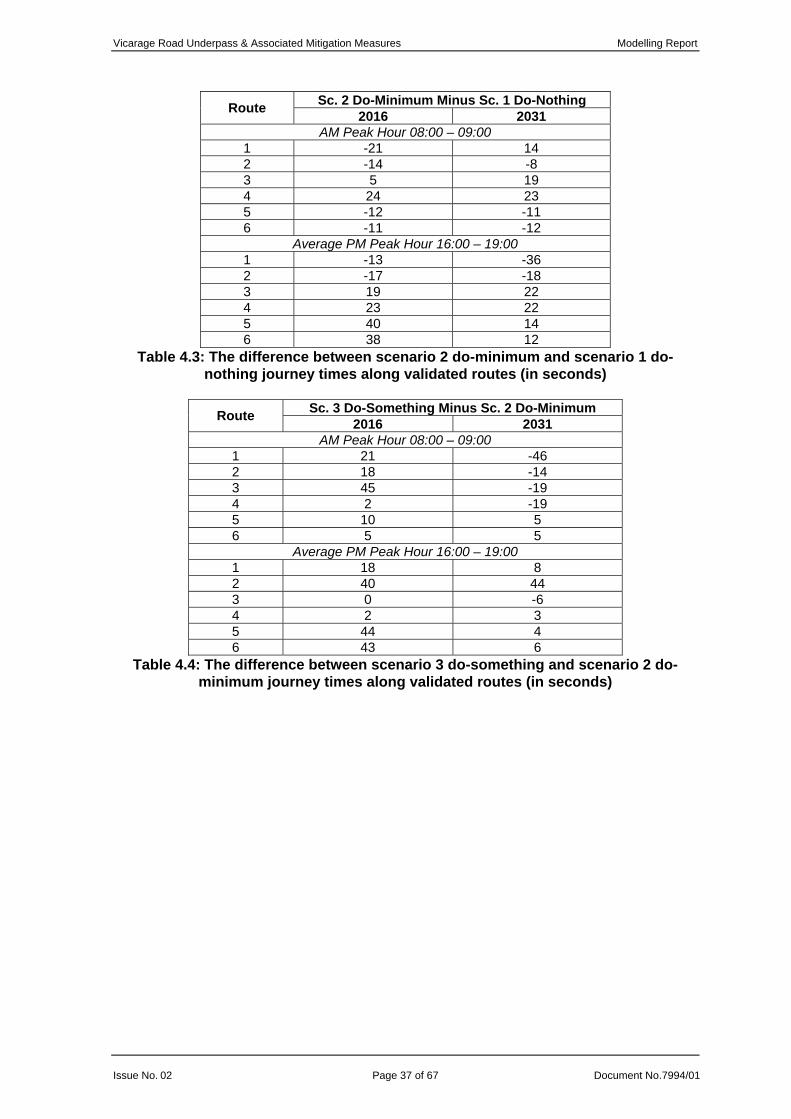
4.4.2 Table 4.3 presents the difference between journey times from scenario 2 (do-minimum) and scenario 1 (do-nothing).
4.4.3 Table 4.4 presents the difference between journey times from scenario 3 (do-something) and scenario 2 (do-minimum).
Issue No. 02 Page 35 of 67 Document No.7994/01

Vicarage Road Underpass & Associated Mitigation Measures Modelling Report
2016 2031Route Observed Base Sc.1 Do-
Nothing Sc. 2 Do-Minimum
Sc. 3 Do-Something
Sc.1 Do-Nothing
Sc. 2 Do-Minimum
Sc. 3 Do-Something
AM Peak Hour 08:00 – 09:00 1 389 415 464 443 464 609 623 5762 298 340 390 377 395 522 514 5013 341 298 325 329 375 410 430 4104 244 224 221 244 246 266 288 2695 407 358 434 422 432 484 473 4786 327 358 419 408 414 482 470 475
Average PM Peak Hour 16:00 – 19:00 1 356 376 418 404 423 534 498 5052 299 320 369 352 392 448 430 4743 218 222 248 266 266 289 311 3054 210 222 217 240 241 225 247 2505 417 349 455 495 539 606 620 6246 321 362 469 507 550 612 624 630
Table: 4.2: Journey time comparison along validated routes between scenarios (in seconds)
Issue No. 02 Page 36 of 67 Document No. 7994/01
Vicarage Road Underpass & Associated Mitigation Measures Modelling Report
Sc. 2 Do-Minimum Minus Sc. 1 Do-Nothing Route 2016 2031 AM Peak Hour 08:00 – 09:00
1 -21 14 2 -14 -8 3 5 19 4 24 23 5 -12 -11 6 -11 -12
Average PM Peak Hour 16:00 – 19:00 1 -13 -36 2 -17 -18 3 19 22 4 23 22 5 40 14 6 38 12
Table 4.3: The difference between scenario 2 do-minimum and scenario 1 do-nothing journey times along validated routes (in seconds)
Sc. 3 Do-Something Minus Sc. 2 Do-Minimum Route 2016 2031
AM Peak Hour 08:00 – 09:00 1 21 -46 2 18 -14 3 45 -19 4 2 -19 5 10 5 6 5 5
Average PM Peak Hour 16:00 – 19:00 1 18 8 2 40 44 3 0 -6 4 2 3 5 44 4 6 43 6
Table 4.4: The difference between scenario 3 do-something and scenario 2 do-minimum journey times along validated routes (in seconds)
Issue No. 02 Page 37 of 67 Document No.7994/01
Vicarage Road Underpass & Associated Mitigation Measures Modelling Report
4.5 Select Link Analyses
Select link analyses have been performed to assess the composition of flow across Prune Hill level crossing as listed below.
i) Figure 4.9 presents a plot showing the routes of traffic that travels via Prune Hill level crossing in both directions in the base AM peak hour model.
ii) Figure 4.10 presents a plot showing the routes of traffic that travels via Prune Hill level crossing in both directions in the base average PM peak hour model.
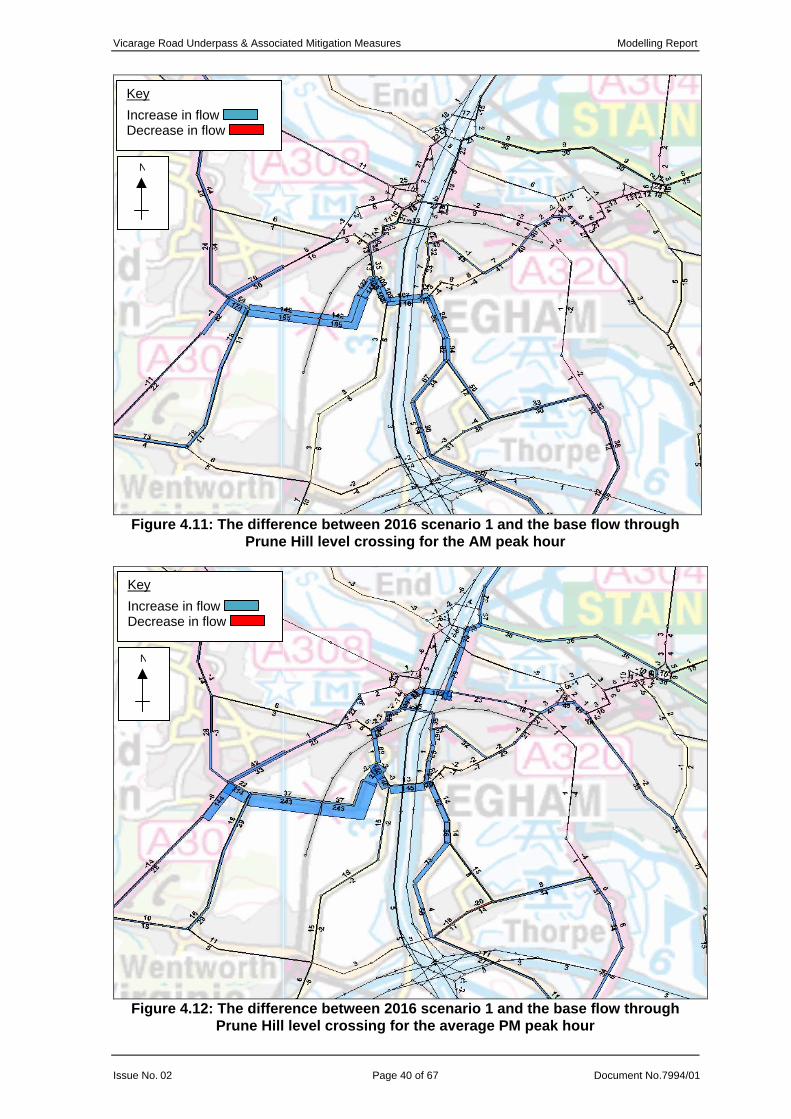
iii) Figure 4.11 presents the difference between 2016 scenario 1 and the base flow which travels via Prune Hill level crossing for the AM peak hour.
iv) Figure 4.12 presents the difference between 2016 scenario 1 and the base flow which travels via Prune Hill level crossing for the average PM peak hour.
4.5.2 In 2016, traffic flow through Prune Hill level crossing increases in all scenarios compared with the 2005 base situation. The plots suggest that the main reason for this is that vehicles are avoiding the congested areas around Egham and Runnymede roundabout. This phenomenon is consistent in all future year scenarios, and is apparent of fixed, as opposed to variable, demand forecasting.
Issue No. 02 Page 38 of 67 Document No.7994/01

Vicarage Road Underpass & Associated Mitigation Measures Modelling Report
N
Figure 4.9: Select link plot of two-way travel at Prune Hill level crossing in the AM peak hour base model
N
Figure 4.10: Select link plot of two-way travel at Prune Hill level crossing in the average PM peak hour base model
Issue No. 02 Page 39 of 67 Document No.7994/01
Vicarage Road Underpass & Associated Mitigation Measures Modelling Report
Key
Increase in flow Decrease in flow
N
Figure 4.11: The difference between 2016 scenario 1 and the base flow through Prune Hill level crossing for the AM peak hour
Key
Increase in flow Decrease in flow
N
Figure 4.12: The difference between 2016 scenario 1 and the base flow through Prune Hill level crossing for the average PM peak hour
Issue No. 02 Page 40 of 67 Document No.7994/01

Vicarage Road Underpass & Associated Mitigation Measures Modelling Report
4.6 Mini-Roundabout Junction of B3407 High Street with B388 Vicarage Road
4.6.1 Table 4.5 presents the maximum reported volume capacity ratio (VCR) for the mini-roundabout junction situated west of Vicarage Road level crossing, for each model scenario and forecast year.
4.6.2 In all instances in the AM peak hour, the maximum VCR is for the right turn from B388 Vicarage Road to B3407 High Street north. In the average PM peak hour, however, apart from in the 2031 Scenario 6, the greatest VCR were for the right turn movement from B3407 High Street north to B3407 High Street west. In the 2031 Scenario 6, this movement had a VCR of 0.54, but a larger VCR of 0.58 was given for the ahead movement from B3207 High Street west to B388 Vicarage Road.
4.6.3 In all the model scenarios and time periods, the traffic flow through this junction was not limited by its capacity.
Scenario AM Peak Hour (08:00 – 09:00)
Average PM Peak Hour (16:00 – 19:00)
2005 Base 0.49 0.40 2016 Scenario1 (DN) 0.70 0.62 2016 Scenario 2 (DM) 0.61 0.59 2016 Scenario 3 (DS) 0.70 0.59 2016 Scenario 4 (DS) - - 2016 Scenario 5 (DS) 0.85 0.61 2016 Scenario 6 (DS) 0.62 0.51 2031 Scenario 1 (DN) 0.73 0.67 2031 Scenario 2 (DM) 0.72 0.66 2031 Scenario 3 (DS) 0.70 0.65 2031 Scenario 4 (DS) - - 2031 Scenario 5 (DS) 0.84 0.65 2031 Scenario 6 (DS) 0.63 0.58
Table 4.5: Maximum VCR for mini-roundabout junction of B3407 The Avenue with B388 Vicarage Road
4.7 B3407 The Avenue Arm of the Runnymede Roundabout
4.7.1 Table 4.6 presents the volume capacity ratios (VCR) for B3407 approach to Runnymede Roundabout for each model scenario and forecast year.
Scenario AM Peak Hour (08:00 – 09:00)
Average PM Peak Hour (16:00 – 19:00)
2005 Base 0.84 0.93 2016 Scenario1 (DN) 0.83 0.93 2016 Scenario 2 (DM) 0.82 0.93 2016 Scenario 3 (DS) 0.83 0.93 2016 Scenario 4 (DS) - - 2016 Scenario 5 (DS) 0.75 0.91 2016 Scenario 6 (DS) 0.83 0.93 2031 Scenario 1 (DN) 0.81 0.96 2031 Scenario 2 (DM) 0.84 0.94 2031 Scenario 3 (DS) 0.81 0.96 2031 Scenario 4 (DS) - - 2031 Scenario 5 (DS) 0.71 0.91 2031 Scenario 6 (DS) 0.82 0.95
Table 4.6: VCR for B3407 The Avenue approach arm to Runnymede Roundabout
4.7.2 In the AM peak hour, the VCR is just below 0.85, apart from in scenario 5 when the green time for this approach is increased by 40%. A similar reduction in VCR in
Issue No. 02 Page 41 of 67 Document No.7994/01
Vicarage Road Underpass & Associated Mitigation Measures Modelling Report
scenario 5 compared with the other scenarios is also displayed in the average PM peak hour, due to this increase in green time. The results for the average PM peak hour, however, shows that flow here is limited by the junction capacity as the VCR is above 0.9 in all cases.
4.8 Scenario 1: Do-Nothing
4.8.1 Scenario 1 (the do-nothing) is the forecast situation without the Airtrack scheme.
Level Crossing Analyses (Table 4.1)
4.8.2 The only apparent difference between the base and do-nothing scenario at Thorpe Road level crossing is a small increase in flow due to forecasting.
4.8.3 At Vicarage Road level crossing in the southbound direction, however, in the AM peak hour, the average delay per vehicle here increases by up to 32% from 52 seconds in the base, to 76 seconds in 2016 and 63 seconds in 2031. Moreover, during the average PM peak hour, the delay increases by up to 52% from 42 seconds in the base to 80 seconds in 2016 and 88 seconds in 2031. In the northbound direction of travel, this results in a decrease of 75 vehicles in the AM peak hour, and 42 vehicles in the PM peak, in 2016. In 2031, flows are similar to the base situation due to traffic growth. This is similar for the southbound direction of travel, apart from during the average PM peak hour in 2016 when the flow increases by 60 vehicles. The large increase in delay at this crossing, compared to the other crossings, and other scenarios, is a result of the reduced number of closures of the crossing coupled with the longer amount of time that the barrier is closed. Thus vehicles have a longer time waiting for the barrier to reopen than at Thorpe Road and Station Road level crossings, and also compared with the base and do-minimum scenario 2.
4.8.4 There is little difference between vehicle flow and delay at Station Road for the northbound direction. In the southbound direction, however, flow increases by 121 vehicles in the AM peak hour, and 151 in the average PM peak hour, in 2016.
4.8.5 At Prune Hill level crossing, flow increases in both directions of travel and in both peak periods, despite junction delay being similar in the base and do-nothing scenario.
Journey Time Analyses (Table 4.2)
4.8.6 Compared with the base situation, all routes experience an increase in journey time during both modelled time periods and forecast years, apart from route 4, which is similar to the base. Route 4 is southbound along the B3376 Thorpe Road between the A308 and the B388.
4.9 Scenario 2: Do-Minimum
4.9.1 Scenario 2 (the do-minimum) is the forecast situation with Airtrack in operation which maintains the Vicarage Road level crossing facility. This is the same arrangement which currently operates but with different barrier down times to reflect the train schedule with the addition of Airtrack.
Level Crossing Analyses (Table 4.1)
4.9.2 In the do-minimum scenario 2, there is a large increase in delay at Thorpe Road, and Station Road level crossings compared with both the base and the do-nothing scenario 1. This leads to a decrease in flow in both directions at these locations during both modelled periods and forecast years, compared with the do-nothing scenario.
Issue No. 02 Page 42 of 67 Document No.7994/01
Vicarage Road Underpass & Associated Mitigation Measures Modelling Report
4.9.3 Conversely, at Vicarage Road level crossing, the delay reduces from 76 seconds in the AM peak hour do-nothing, to 58 seconds in the do-minimum. In the average PM peak hour, it reduces from 80 to 63 seconds. The delay reflects the barrier times provided by BAA, and it is unusual that the barrier down times here do not reflect the crossings both up and down stream, as with the other modelled scenarios.
4.9.4 At this location, delay has reduced despite increased train services. The projected timetable provided by BAA states that in the do-nothing scenario the barrier is closed 7 times in the AM and 6 times in the PM peaks. This rises to 11 and 10 times respectively in scenario 3 (and all other “post-Airtrack” scenarios). Conversely, the amount of time that the level crossing barrier is down during the peak hours is greater in “post-Airtrack” scenarios than the do-nothing “pre-Airtrack” scenario 1, but the delay reduces. The reason for this is that with the do-nothing “pre-Airtrack” scenario the number of closures is less, but the length of time that the barrier is down per closure is greater than that for “post-Airtrack” scenarios. Consequently, the impact on traffic is less time spent waiting for the barrier to reopen, and hence shorter delay in scenario 3 compared with scenario 1.
4.9.5 To reflect the reduction in delay at Vicarage Road level crossing compared with the do-nothing, traffic flow increases in both directions.
4.9.6 Junction delay increases by approximately 22% in the AM peak hour and 42% in the average PM peak hour at the Prune Hill level crossing from the do-nothing to the do-minimum scenario. Flow does not vary by much, however, because the delay is small (less than 10 seconds), particularly in the westbound direction of travel.
Flow Difference Plots (Figures 4.1 to 4.4)
4.9.7 The flow difference plots in Figures 4.1 to 4.4, which compares the flows of the do-minimum scenario 2 with the do-nothing scenario 1 on the local highway network, verifies the changes shown at the level crossings.
Journey Time Analyses (Tables 4.2 and 4.3)
4.9.8 In the do-minimum scenario 2, journey times mostly decrease from the do-nothing scenario 1 during both modelled time periods and forecast years. The exceptions are route 3, which increases by 5 and 24 seconds for 2016 and 2031 respectively in the AM peak hour, and by 19 and 23 seconds in the average PM peak hour, and route 4 which experiences increases of between 13 and 23 seconds. Both these routes pass through Thorpe Road level crossing, and the increase in delay is attributed to its increase in barrier closure.
4.9.9 In the average PM peak hour, the do-minimum also sees an increase in journey time along routes 5 and 6, compared with the do-nothing. These routes pass Station Road level crossing and similarly reflects the increase in barrier closure here. In the AM peak hour, however, the journey times are very similar (8 to 12 seconds less than the do-nothing) because other junctions, including the signalised junction of B3407 High Street with Station Road, performed better under the lower flow conditions.
Issue No. 02 Page 43 of 67 Document No.7994/01

Vicarage Road Underpass & Associated Mitigation Measures Modelling Report
4.10 Scenario 3: Do-Something
4.10.1 Scenario 3 (the do-something) is the forecast situation with Airtrack in operation but Vicarage Road level crossing is replaced with an underpass. The underpass is accompanied with traffic calming along B388 Vicarage Road, between its junction with B3407 High Street and Egham Sports Centre, to manage its design constraints.
Level Crossing Analyses (Table 4.1)
4.10.2 Since in scenario 3 an underpass replaces the level crossing at Vicarage Road, there is no delay to vehicles at this location. However, due its design constraints, the speed of vehicles through the underpass must be limited to 20mph. Consequently, the speed of vehicles here reduces from about 40kph to 20kph in both modelled time periods and forecast years. As a result, traffic flow through the underpass does not dramatically increase. In the AM peak hour, traffic flow reduces compared with the do-minimum, in both directions of travel. In the average PM peak hour, however, there is a small increase in flow of 14 and 4 vehicles in the northbound direction in 2016 and 2031 respectively. In the southbound direction there is a small reduction of 2 and 16 vehicles.
4.10.3 The underpass has not attracted trips away from the other level crossings. For example, B3376 Thorpe Road experiences similar traffic flow. In the AM peak hour, there is an increase of 14 vehicles in 2016 and 2 vehicles in 2031, in the northbound direction of travel along B3376 Thorpe Road. In the PM peak this is a 23 and 4 vehicles respectively. Similar small increases are apparent in the southbound direction too.
4.10.4 At Station Road level crossing little change in flow is repeated when comparing the do-something scenario 3 with the do-minimum scenario 2. Here flow in the northbound direction changes by a maximum of 8 vehicles during both modelled time periods and forecast years. There is a greater, but still relatively small, increase in vehicles in the southbound direction of travel. For instance, in the AM peak hour, flow increases by 18 vehicles and in the PM peak by 39 vehicles, in 2031.
4.10.5 Again there are similar flow levels at Prune Hill level crossing compared with the do-minimum scenario 2.
Flow Difference Plots (Figures 4.5 to 4.8)
4.10.6 The flow difference plots in Figures 4.5 to 4.8, which compares the flows of the do-something scenario 3 with the do-minimum scenario 2 on the local highway network, verifies the changes in flow at the level crossings which is discussed above.
Journey Time Analyses (Tables 4.2 and 4.4)
4.10.7 Compared with scenario 2 do-minimum, scenario 3 journey times along validated routes either are similar or increase in 2016 for both modelled time periods.
4.10.8 Routes 2 and 3, which encounter the proposed underpass at Pooley Green and its traffic calming, see an increase in journey time of about 20 seconds in each direction in the AM peak hour, and in the northbound direction during the average PM peak hour in 2016. In the southbound direction this increases to 40 seconds. The rise in travel time is due to the reduction of travel speed along the B388 through the underpass.
Issue No. 02 Page 44 of 67 Document No.7994/01

Vicarage Road Underpass & Associated Mitigation Measures Modelling Report
4.10.9 Although in 2031 AM peak hour, journey times along routes 2 and 3 are faster than scenario 2 do-minimum by 46 seconds in the northbound direction and 14 in the southbound direction. This is due to a reduction in junction delay at the B3407 approach to Runnymede Roundabout and the mini-roundabout junction of B3376 Thorpe Lea Road with B388. The difference in delay has resulted from a change in the balance of flow on the approaches to these junctions from the assignment.
4.10.10 The largest increase in travel time in the 2016 AM peak hour, however, is route 3 which crosses Thorpe Road level crossing. This is an increase of 45 seconds and is not attributed to the level crossing but that of the roundabout junction of A320 Chertsey Road with B3376 Thorpe Road and A308 The Causeway and Staines Bridge.
4.10.11 There is little difference in journey time between scenario 3 do-something and scenario 2 do-minimum for routes 5 and 6 which travel via Station Road level crossing. Apart from during the average PM peak hour in 2016, the maximum difference in journey time is 10 seconds. For the average PM peak hour in 2016, however, there is just over a 44 second increase in delay in each direction of travel which is due to more delay experienced at Egham Hill roundabout (junction of A30 Egham Bypass with B3407 High Street).
4.11 Scenario 4: Do-Something
4.11.1 Scenario 4 (the do-something) is the forecast situation as in scenario 3 (with Airtrack, Vicarage Road underpass and traffic calming) with the addition of improvements to Runnymede roundabout.
4.11.2 Unfortunately, due to ongoing queries regarding its design and the level of detail required in its replication, this scenario has not been assessed within the model.
4.12 Scenario 5: Do-Something Sensitivity Test
4.12.1 Scenario 5 (the do-something sensitivity test) is the forecast situation as in scenario 3 (with Airtrack, Vicarage Road underpass and traffic calming), but B3407 The Avenue approach to Runnymede is given a 40% increase in green time in each time period. Cycle times, however, have remained the same as in the base situation.
4.12.2 Thus stage 2 (green for B3407 The Avenue) increases from 12 seconds in AM peak hour to 17 seconds. In the average PM peak hour it increases from 7 to 10 seconds.
4.12.3 As a result, stage 1 (the circulatory carriageway of the roundabout receives green) reduces from 34 to 29 seconds in the AM peak hour, and from 40 to 37 seconds in the average PM peak hour.
Level Crossing Analyses (Table 4.1)
4.12.4 Comparing this with scenario 3 shows that more vehicles use the underpass in the northbound direction of travel. In 2016 there is an increase of 121 vehicles in the AM peak hour and 86 vehicles in the average PM peak hour. These trips have been attracted from more strategic routes; in the AM peak, in particular the model suggests that about 50 vehicles have been drawn from the A30.
4.12.5 In the southbound direction of travel, however, flows are similar or there is a small reduction. For example in the 2016 scenario 5 average PM peak hour there is a reduction of 20 vehicles, compared with scenario 3. Little or no change is expected in this direction of travel because the additional benefit from the increase
Issue No. 02 Page 45 of 67 Document No.7994/01
Vicarage Road Underpass & Associated Mitigation Measures Modelling Report
in green time for B3407 The Avenue approach to Runnymede Roundabout only affects northbound travel.
B3407 The Avenue Arm of Runnymede Roundabout VCR (Table 4.6)
4.12.6 By increasing the green time of B3407 The Avenue approach to Runnymede roundabout, lowered the volume capacity ratio in both the AM peak hour and average PM peak hour, as shown in Table 4.6. This reduction in capacity enabled more vehicles to travel northbound via the B388 Vicarage Road.
4.13 Scenario 6: Do-Something Sensitivity Test
4.13.1 Scenario 6 (the do-something sensitivity test) is the forecast situation as in scenario 3 (with Airtrack and Vicarage Road underpass), but without the traffic calming along B388 Vicarage Road. Thus a 30mph speed limit was maintained through the underpass and the model link types along B388 Vicarage Road are the same as in the base situation.
Level Crossing Analyses (Table 4.1)
4.13.2 Comparing scenario 6 with scenario 3 shows large increases in flow along the B388 Vicarage Road in each direction of travel. For example, in the northbound direction, flow in scenario 6 in the AM peak hour year 2016 is 122 more than scenario 3 where the road through the underpass is limited to 20mph. In the southbound direction there is a bigger increase of 194 vehicles.
4.13.3 Because the speed limit is no longer reduced here, the journey time along this section of road reduces and falls below that when Vicarage Road level crossing is in place. As a result, more vehicles are attracted to this route.
4.13.4 The model suggests, however, that the increase in flow here are not local but longer distance trips extracted from the A320 at the point where it meets the B388 in Chertsey. Moreover, it is not the aim of the underpass to attract these longer distance trips but to provide a viable alternative for those people who live and work in the local area.
4.14 Further Sensitivity Tests
4.14.1 Three further sensitivity tests were conducted for the forecast year 2016, as described below:
1. A test that combined scenarios 5 and 6 which involves an underpass at Pooley Green but without traffic calming, together with a 40% increase in green time for B3407 The Avenue approach to Runnymede. This was also accompanied by user-defined delay at the junction of B388 Thorpe Road Lea with Ten Acre Lane. This was to deter the attraction of vehicles from A320 to travel via the underpass, and is the last point at which A320 traffic can access the B388 prior to the proposed underpass. Specified delay was applied of 0, 50 and 100 seconds, to the ahead movement from B388 Thorpe Road Lea south to north, and the right turn from Ten Acre Lane to B388 Thorpe Road Lea. Delay was capped at 100 seconds; beyond this, it would be very difficult to replicate that level of delay within a semi-rural area.
2. A test that replicated scenario 3, which is the Vicarage Road underpass with its associated traffic calming, combined with an increase of the level crossing barrier down time for the “post-Airtrack” situation at Thorpe Road and Station Road level crossings by 5, 10 and 15 minutes in the modelled hours.
Issue No. 02 Page 46 of 67 Document No.7994/01
Vicarage Road Underpass & Associated Mitigation Measures Modelling Report
3. A test that replicated scenario 3, but closed all barrier controlled level crossings in Egham. This involved the closure of Thorpe Road, Station Road and Prune Hill level crossings, and was only conducted for the 2016 AM peak hour model.
4.14.2 The first sensitivity test was employed to deter A320 traffic from diverting to the underpass and to investigate if reducing the number of longer distance trips from using the proposed underpass would attract local trips to use it from the adjacent level crossing routes. It was found that there was a small abstraction of trips from Station Road and Prune Hill level crossings of a maximum of approximately 70 vehicles. There was virtually no abstraction, however, from Thorpe Road level crossing. It was found that increasing delay along B388 Thorpe Lea Road did not encourage sufficient use of Vicarage Road underpass by local trips.
4.14.3 The second sensitivity test was conducted to assess the impact of train service unreliability and day-to-day perturbation of level crossing closures. For instance the closure of the barrier is manually controlled via CCTV and on some occasions it takes longer for the crossings to be free of traffic before it can be shut than others. The other reason is to determine whether the increased barrier closure will encourage use of the proposed underpass.
4.14.4 The modelling showed that Vicarage Road underpass does experience an increase in flow due to the increase in delay at Thorpe Road and Station Road level crossings of a maximum of approximately 80 vehicles in a single direction. The attraction to the underpass is very much still constrained by both its traffic calming, Runnymede roundabout and the congested network which surrounds Egham. Thus, the increase in flow along B388 Vicarage Road is not sufficient to warrant an underpass. Furthermore, an increase in barrier down time of 5 minutes at Station Road and Thorpe Road level crossings shows that there is little difference in flow compared with scenario 3. Only when delay is 10 minutes or greater are the impacts significant, where flows along Thorpe Road and Station Road level crossings reduced by approximately 20% in the AM peak hour and 30% in the average PM peak hour. Delay at the level crossings increased by approximately 110% with an additional 15 minutes on the “post-Airtrack” level crossing barrier time for the modelled hours.
4.14.5 This increased total delay amounts to an average of 73 seconds per vehicle for traffic using Thorpe Road and 63 seconds for traffic using Station Road. Consequently, given the increased journey times due to the longer distances involved and the additional congestion trips would encounter, it is not worth many trips diverting to Vicarage Road. In addition, the higher the number of trips diverting increases the delay on the links and at the junctions on this alternative route, making it increasingly unattractive.
4.14.6 The final sensitivity test replicated the complete closure of all barrier controlled level crossings. Thus the only route across the railway line in Egham was provided at the proposed underpass, and was conducted to determine the maximum attraction of traffic to B388 Vicarage Road. It was found that approximately 900 vehicles in each direction used the underpass, a further 400 vehicles compared with scenario 3. Obviously, no vehicles used Thorpe Road, Station Road and Prune Hill level crossings. As a result, this also led to an increased usage of the A320 of approximately 150 vehicles in each direction.
4.14.7 A total of about 2350 are forecast to cross the Thorpe Road, Station Road and Prune Hill level crossing during the AM peak hour. Allowing for trips diverting to Vicarage Road and the A320, this leaves about 1100 trips rerouteing elsewhere around the network, bearing in mind that the modelling uses a fixed matrix
Issue No. 02 Page 47 of 67 Document No.7994/01
Vicarage Road Underpass & Associated Mitigation Measures Modelling Report
approach. The reasons more trips do not use the Vicarage Road underpass are due to limited link capacity, congested junctions and longer distances.
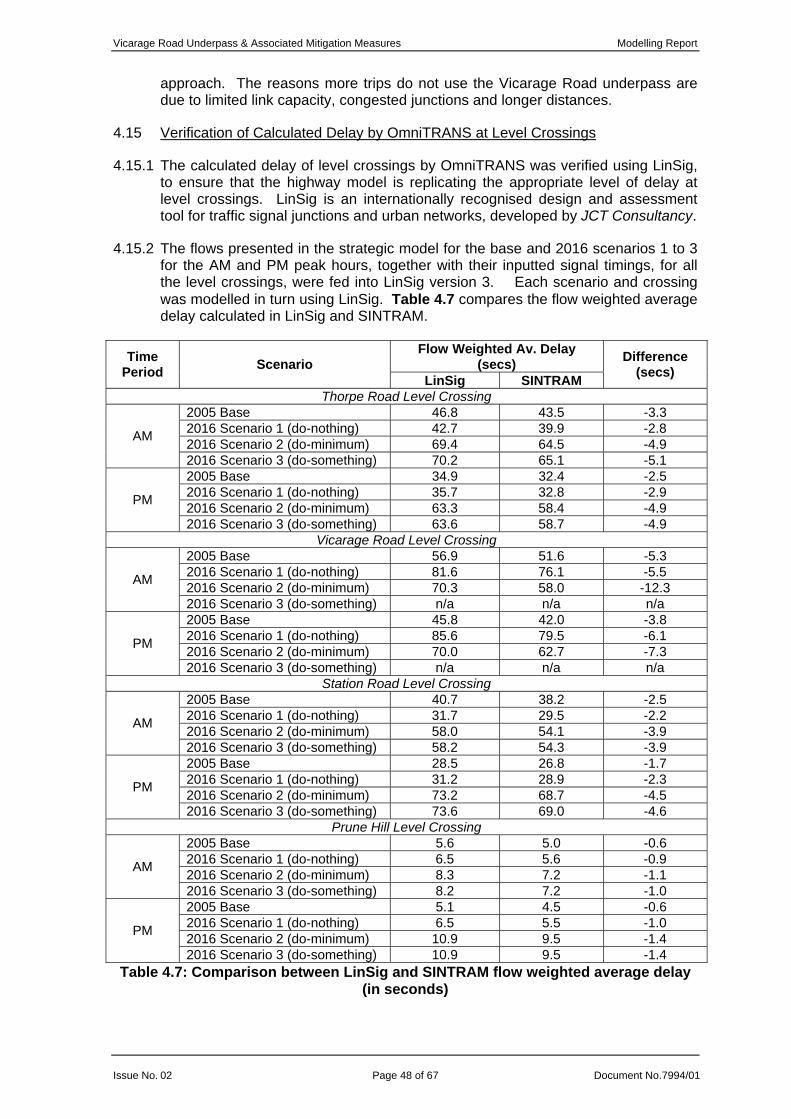
4.15 Verification of Calculated Delay by OmniTRANS at Level Crossings
4.15.1 The calculated delay of level crossings by OmniTRANS was verified using LinSig, to ensure that the highway model is replicating the appropriate level of delay at level crossings. LinSig is an internationally recognised design and assessment tool for traffic signal junctions and urban networks, developed by JCT Consultancy.
4.15.2 The flows presented in the strategic model for the base and 2016 scenarios 1 to 3 for the AM and PM peak hours, together with their inputted signal timings, for all the level crossings, were fed into LinSig version 3. Each scenario and crossing was modelled in turn using LinSig. Table 4.7 compares the flow weighted average delay calculated in LinSig and SINTRAM.
Flow Weighted Av. Delay (secs) Time
Period Scenario LinSig SINTRAM
Difference (secs)
Thorpe Road Level Crossing 2005 Base 46.8 43.5 -3.3 2016 Scenario 1 (do-nothing) 42.7 39.9 -2.8 2016 Scenario 2 (do-minimum) 69.4 64.5 -4.9 AM
2016 Scenario 3 (do-something) 70.2 65.1 -5.1 2005 Base 34.9 32.4 -2.5 2016 Scenario 1 (do-nothing) 35.7 32.8 -2.9 2016 Scenario 2 (do-minimum) 63.3 58.4 -4.9 PM
2016 Scenario 3 (do-something) 63.6 58.7 -4.9 Vicarage Road Level Crossing
2005 Base 56.9 51.6 -5.3 2016 Scenario 1 (do-nothing) 81.6 76.1 -5.5 2016 Scenario 2 (do-minimum) 70.3 58.0 -12.3 AM
2016 Scenario 3 (do-something) n/a n/a n/a 2005 Base 45.8 42.0 -3.8 2016 Scenario 1 (do-nothing) 85.6 79.5 -6.1 2016 Scenario 2 (do-minimum) 70.0 62.7 -7.3 PM
2016 Scenario 3 (do-something) n/a n/a n/a Station Road Level Crossing
2005 Base 40.7 38.2 -2.5 2016 Scenario 1 (do-nothing) 31.7 29.5 -2.2 2016 Scenario 2 (do-minimum) 58.0 54.1 -3.9 AM
2016 Scenario 3 (do-something) 58.2 54.3 -3.9 2005 Base 28.5 26.8 -1.7 2016 Scenario 1 (do-nothing) 31.2 28.9 -2.3 2016 Scenario 2 (do-minimum) 73.2 68.7 -4.5 PM
2016 Scenario 3 (do-something) 73.6 69.0 -4.6 Prune Hill Level Crossing
2005 Base 5.6 5.0 -0.6 2016 Scenario 1 (do-nothing) 6.5 5.6 -0.9 2016 Scenario 2 (do-minimum) 8.3 7.2 -1.1 AM
2016 Scenario 3 (do-something) 8.2 7.2 -1.0 2005 Base 5.1 4.5 -0.6 2016 Scenario 1 (do-nothing) 6.5 5.5 -1.0 2016 Scenario 2 (do-minimum) 10.9 9.5 -1.4 PM
2016 Scenario 3 (do-something) 10.9 9.5 -1.4 Table 4.7: Comparison between LinSig and SINTRAM flow weighted average delay
(in seconds)
Issue No. 02 Page 48 of 67 Document No.7994/01
Vicarage Road Underpass & Associated Mitigation Measures Modelling Report
4.15.3 The delay values calculated by LinSig are similar to those from SINTRAM. The only exception is a 12 second difference experienced for the 2016 scenario 2. Moreover, it is not a direct comparison, because LinSig inserts a minimum intergreen of 2 seconds. Hence SINTRAM flow weighted average delay is always less than that calculated in LinSig. Intergreens were not given in SINTRAM because of the uncertainty of the collection of observed level crossing data and of the forecasting methodology. SINTRAM facilitates the exclusion of intergreens, whereas LinSig does not.
4.15.4 Given the presented differences in Table 4.7, it is considered that OmniTRANS provides a good reflection of delay at the level crossings.
4.16 Queue Lengths at the Level Crossings
4.16.1 SINTRAM records delay as a measure of time; it does not provide queue lengths as an output. Consequently the queue lengths presented in Figure 4.13 have been acquired from the LinSig assessment described above in Paragraph 4.15.3.
4.16.2 There is little difference in queue lengths between 2016 scenarios 1, 2 and 3 at Thorpe Road level crossing. This is similar at Station Road and Prune Hill level crossings, during both time periods and in both directions of travel.
4.16.3 At Vicarage Road level crossing, however, queue lengths are much greater in scenario 1 (do-nothing) than in scenario 2 (do-minimum). For example, in the average PM peak hour the southbound queue length for scenario 1 is 75 vehicles, which reduces to 55 vehicles in scenario 2. This is a result of the differences in level crossing timings at this location as discussed in Paragraph 4.9.3. The level crossing barrier is closed less often in scenario 1, but for much longer periods of time, compared with scenario 2.
4.16.4 There are no queue lengths provided for scenario 3 at Vicarage Road level crossing because the level crossing is replaced by an underpass.
4.16.5 All level crossings experience an increase in queue length due to forecasting from the 2005 base to the future year 2016, with the exception of Thorpe Road level crossing in the northbound direction of travel during the PM peak period.
Issue No. 02 Page 49 of 67 Document No.7994/01

Vicarage Road Underpass & Associated Mitigation Measures Modelling Report
Thorpe Road - Southbound
1923 22 23 24
32 33 34
0
5
10
15
20
25
30
35
40
2005Base
2016 Sc.1 DN
2016 Sc.2 DM
2016 Sc.3 DS
2005Base
2016 Sc.1 DN
2016 Sc.2 DM
2016 Sc.3 DS
Thorpe Road - Northbound
2629 29 31
2421 20 22
0
5
10
15
20
25
30
35
2005Base
2016 Sc.1 DN
2016 Sc.2 DM
2016 Sc.3 DS
2005Base
2016 Sc.1 DN
2016 Sc.2 DM
2016 Sc.3 DS
Vicarage Road - Southbound
3947
41 41
75
55
0
10
20
30
40
50
60
70
80
2005Base
2016 Sc.1 DN
2016 Sc.2 DM
2016 Sc.3 DS
2005Base
2016 Sc.1 DN
2016 Sc.2 DM
2016 Sc.3 DS
Vicarage Road - Northbound
4353
43
2633
26
0
10
20
30
40
50
60
2005Base
2016 Sc.1 DN
2016 Sc.2 DM
2016 Sc.3 DS
2005Base
2016 Sc.1 DN
2016 Sc.2 DM
2016 Sc.3 DS
Station Road - Southbound
1725 27 28
17
2935 36
0
5
10
15
20
25
30
35
40
2005Base
2016 Sc.1 DN
2016 Sc.2 DM
2016 Sc.3 DS
2005Base
2016 Sc.1 DN
2016 Sc.2 DM
2016 Sc.3 DS
Station Road - Northbound
17 1720 20
11 1214 14
0
5
10
15
20
25
2005Base
2016 Sc.1 DN
2016 Sc.2 DM
2016 Sc.3 DS
2005Base
2016 Sc.1 DN
2016 Sc.2 DM
2016 Sc.3 DS
Prune Hill - Westbound
57
8 7
33
5 5
0
1
2
3
4
5
6
7
8
2005Base
2016 Sc.1 DN
2016 Sc.2 DM
2016 Sc.3 DS
2005Base
2016 Sc.1 DN
2016 Sc.2 DM
2016 Sc.3 DS
Prune Hill - Eastbound
3
79 9
6
1113 13
0
2
4
6
8
10
12
14
2005Base
2016 Sc.1 DN
2016 Sc.2 DM
2016 Sc.3 DS
2005Base
2016 Sc.1 DN
2016 Sc.2 DM
2016 Sc.3 DS
Figure 4.13: Predicted queue lengths at each level crossing for the 2005 base and 2016 scenarios 1 to 3 (number of vehicles)
Red = AM peak hour (08:00 – 09:00) Blue = average PM peak hour (16:00 – 19:00)
Issue No. 02 Page 50 of 67 Document No.7994/01

Vicarage Road Underpass & Associated Mitigation Measures Modelling Report
4.17 Comparison of Average and Actual Barrier Closures
4.17.1 In order to understand whether modelling the level crossing closures using average times, as calculated using the methodology set out in Appendix A, has an impact on the traffic flows and delays in the OmniTRANS model, a sensitivity test was carried out using a S-Paramics microsimulation model for the B3376 Thorpe Road level crossing. The S-Paramics model covers Staines town centre, Staines Bridge Roundabout and its approaches that incorporate Thorpe Road level crossing. It is an existing model which was developed for Staines town centre assessment in 2005.
4.17.2 The individual level crossing barrier downtimes can be modelled within S-Paramics to the nearest minute. This enables the variability in both consecutive and length of closure to be replicated within a transport model. The OmniTRANS model, which is strategic in nature, does not have this functionality. Therefore, in order to assess the impact of simulating average, as oppose to individual, downtimes, a comparison was performed using the Staines S-Paramics model in the AM peak for the base year.
4.17.3 Two base AM peak models were created. The only difference being that, at Thorpe Road level crossing, one model had each individual barrier closure replicated, and the other had the barrier closures averaged for the peak hour (as in the OmniTRANS model). Both modelled barrier timings are based on the same observed dataset collected on Tuesday 10th March 2009 by Count on Us Transportation Data Collection on behalf of BAA.
4.17.4 The results from the S-Paramics models are shown in Table 4.8. It can be seen that where the level crossings were replicated using average downtimes, as in OmniTRANS, mean journey times and total network delay were higher, with a corresponding decrease in average speed.
Network Performance Individual Downtimes
Average Downtimes
Percentage Difference
Total demand (no. of vehicles) 9841 9841 0% Total completed trips (no. of vehicles) 9816 9816 0% Mean speed (mph) 11.0 10.8 -2% Mean travel time for completed trips (mm:ss) 04:22 04:27 2% Total network delay (days) 29.8 30.3 2%
Table 4.8: AM peak period S-Paramics results of the comparison between replicating individual and average level crossing downtimes at Thorpe Road
4.17.5 Consequently the results illustrate that using averaged barrier timings provides
higher levels of congestion than modelling the actual barrier downtimes, but the results are similar with a difference of only 2%.
4.17.6 This suggests that the method of level crossing replication within the OmniTRANS model is sufficient for this assessment work. If anything, OmniTRANS overestimates delays at the level crossings and thus reflects more of a worst-case scenario.
4.18 Cordon Assessment
4.18.1 An assessment of the proposed Vicarage Road underpass had been performed using the full SINTRAM model (SINTRAM40_101116.Dev_Pooley), which was enhanced in the study area, as described in this report.
Issue No. 02 Page 51 of 67 Document No.7994/01
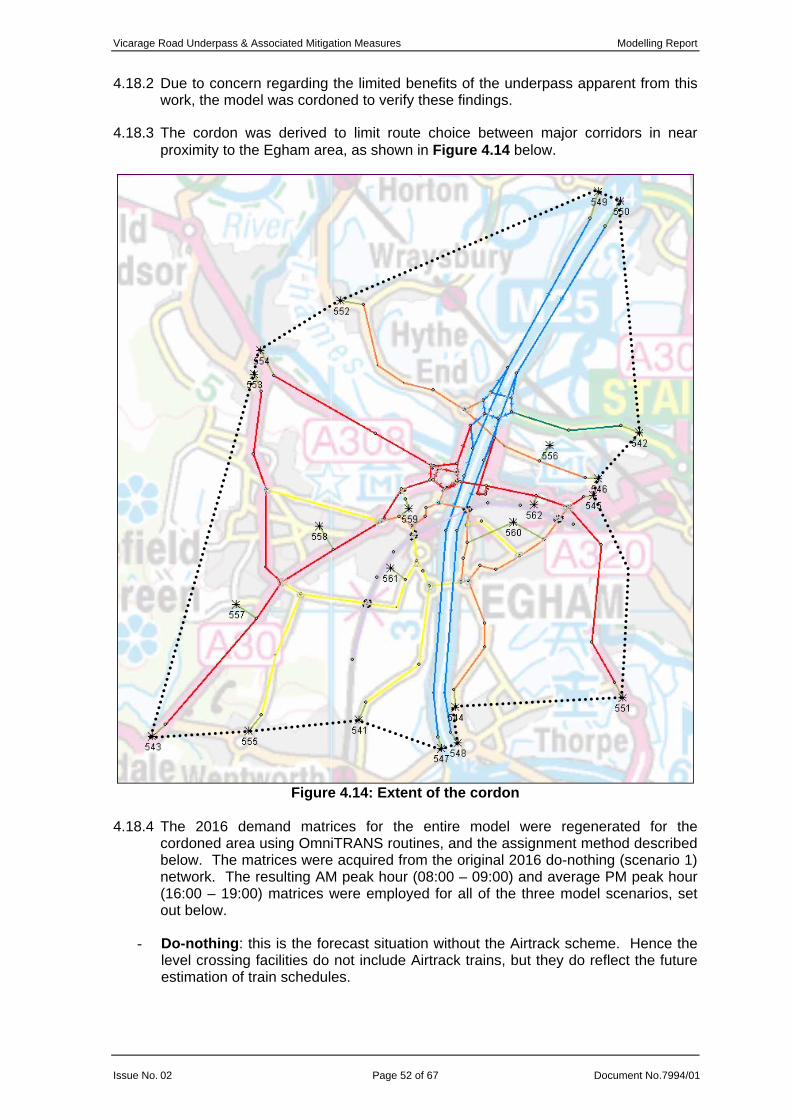
Vicarage Road Underpass & Associated Mitigation Measures Modelling Report
4.18.2 Due to concern regarding the limited benefits of the underpass apparent from this work, the model was cordoned to verify these findings.
4.18.3 The cordon was derived to limit route choice between major corridors in near proximity to the Egham area, as shown in Figure 4.14 below.
Figure 4.14: Extent of the cordon
4.18.4 The 2016 demand matrices for the entire model were regenerated for the
cordoned area using OmniTRANS routines, and the assignment method described below. The matrices were acquired from the original 2016 do-nothing (scenario 1) network. The resulting AM peak hour (08:00 – 09:00) and average PM peak hour (16:00 – 19:00) matrices were employed for all of the three model scenarios, set out below.
- Do-nothing: this is the forecast situation without the Airtrack scheme. Hence the level crossing facilities do not include Airtrack trains, but they do reflect the future estimation of train schedules.
Issue No. 02 Page 52 of 67 Document No.7994/01
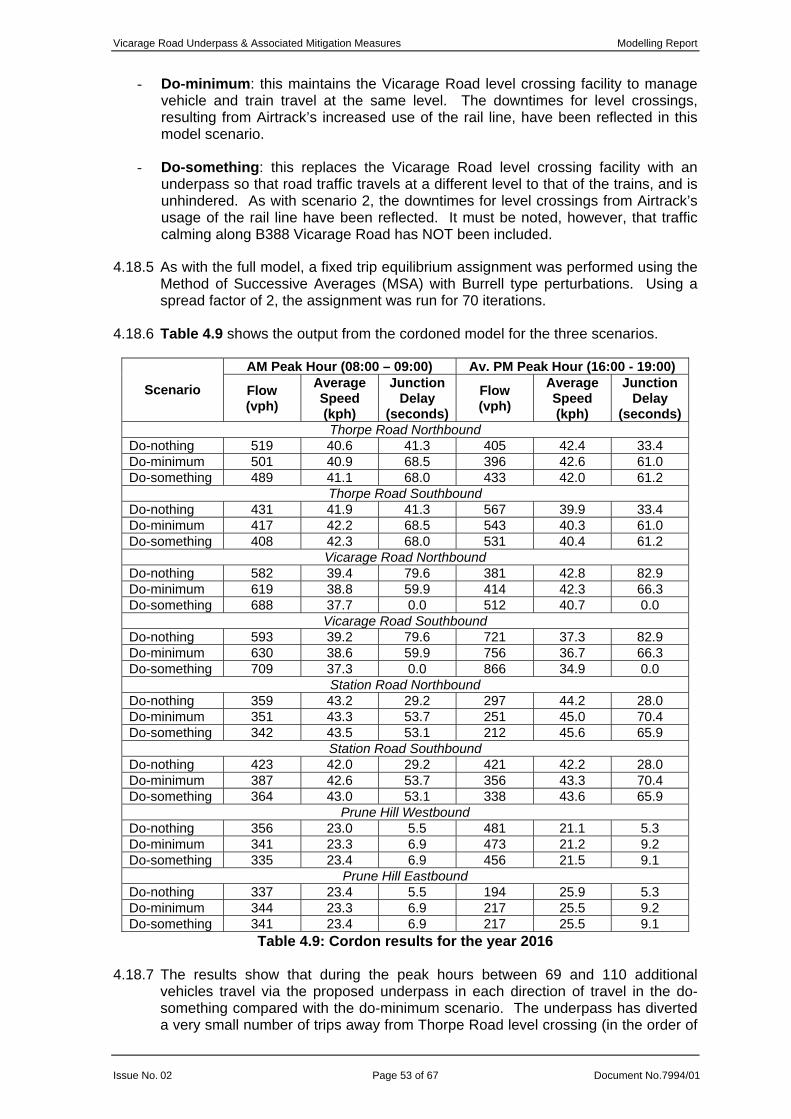
Vicarage Road Underpass & Associated Mitigation Measures Modelling Report
- Do-minimum: this maintains the Vicarage Road level crossing facility to manage vehicle and train travel at the same level. The downtimes for level crossings, resulting from Airtrack’s increased use of the rail line, have been reflected in this model scenario.
- Do-something: this replaces the Vicarage Road level crossing facility with an underpass so that road traffic travels at a different level to that of the trains, and is unhindered. As with scenario 2, the downtimes for level crossings from Airtrack’s usage of the rail line have been reflected. It must be noted, however, that traffic calming along B388 Vicarage Road has NOT been included.
4.18.5 As with the full model, a fixed trip equilibrium assignment was performed using the Method of Successive Averages (MSA) with Burrell type perturbations. Using a spread factor of 2, the assignment was run for 70 iterations.
4.18.6 Table 4.9 shows the output from the cordoned model for the three scenarios.
AM Peak Hour (08:00 – 09:00) Av. PM Peak Hour (16:00 - 19:00)
Scenario Flow (vph)
Average Speed (kph)
Junction Delay
(seconds)
Flow (vph)
Average Speed (kph)
Junction Delay
(seconds)Thorpe Road Northbound
Do-nothing 519 40.6 41.3 405 42.4 33.4 Do-minimum 501 40.9 68.5 396 42.6 61.0 Do-something 489 41.1 68.0 433 42.0 61.2
Thorpe Road Southbound Do-nothing 431 41.9 41.3 567 39.9 33.4 Do-minimum 417 42.2 68.5 543 40.3 61.0 Do-something 408 42.3 68.0 531 40.4 61.2
Vicarage Road Northbound Do-nothing 582 39.4 79.6 381 42.8 82.9 Do-minimum 619 38.8 59.9 414 42.3 66.3 Do-something 688 37.7 0.0 512 40.7 0.0
Vicarage Road Southbound Do-nothing 593 39.2 79.6 721 37.3 82.9 Do-minimum 630 38.6 59.9 756 36.7 66.3 Do-something 709 37.3 0.0 866 34.9 0.0
Station Road Northbound Do-nothing 359 43.2 29.2 297 44.2 28.0 Do-minimum 351 43.3 53.7 251 45.0 70.4 Do-something 342 43.5 53.1 212 45.6 65.9
Station Road Southbound Do-nothing 423 42.0 29.2 421 42.2 28.0 Do-minimum 387 42.6 53.7 356 43.3 70.4 Do-something 364 43.0 53.1 338 43.6 65.9
Prune Hill Westbound Do-nothing 356 23.0 5.5 481 21.1 5.3 Do-minimum 341 23.3 6.9 473 21.2 9.2 Do-something 335 23.4 6.9 456 21.5 9.1
Prune Hill Eastbound Do-nothing 337 23.4 5.5 194 25.9 5.3 Do-minimum 344 23.3 6.9 217 25.5 9.2 Do-something 341 23.4 6.9 217 25.5 9.1
Table 4.9: Cordon results for the year 2016 4.18.7 The results show that during the peak hours between 69 and 110 additional
vehicles travel via the proposed underpass in each direction of travel in the do-something compared with the do-minimum scenario. The underpass has diverted a very small number of trips away from Thorpe Road level crossing (in the order of
Issue No. 02 Page 53 of 67 Document No.7994/01
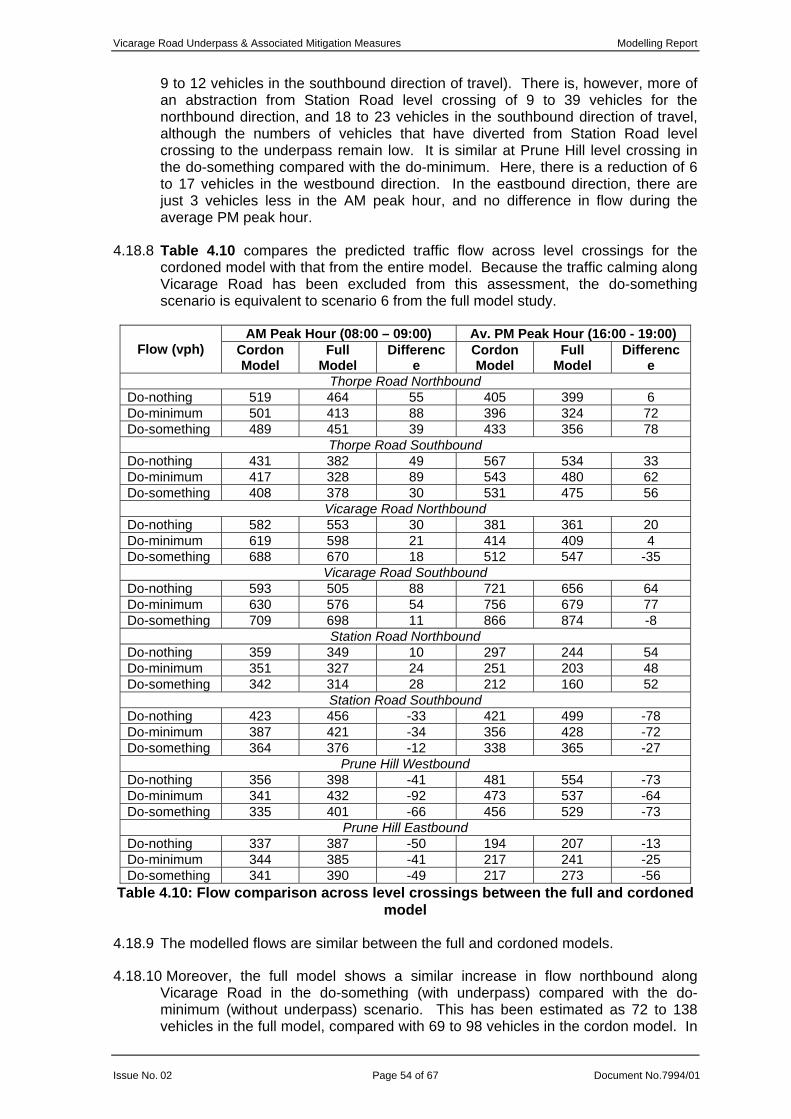
Vicarage Road Underpass & Associated Mitigation Measures Modelling Report
9 to 12 vehicles in the southbound direction of travel). There is, however, more of an abstraction from Station Road level crossing of 9 to 39 vehicles for the northbound direction, and 18 to 23 vehicles in the southbound direction of travel, although the numbers of vehicles that have diverted from Station Road level crossing to the underpass remain low. It is similar at Prune Hill level crossing in the do-something compared with the do-minimum. Here, there is a reduction of 6 to 17 vehicles in the westbound direction. In the eastbound direction, there are just 3 vehicles less in the AM peak hour, and no difference in flow during the average PM peak hour.
4.18.8 Table 4.10 compares the predicted traffic flow across level crossings for the cordoned model with that from the entire model. Because the traffic calming along Vicarage Road has been excluded from this assessment, the do-something scenario is equivalent to scenario 6 from the full model study.
AM Peak Hour (08:00 – 09:00) Av. PM Peak Hour (16:00 - 19:00) Flow (vph) Cordon
Model Full
Model Differenc
e Cordon Model
Full Model
Difference
Thorpe Road Northbound Do-nothing 519 464 55 405 399 6 Do-minimum 501 413 88 396 324 72 Do-something 489 451 39 433 356 78
Thorpe Road Southbound Do-nothing 431 382 49 567 534 33 Do-minimum 417 328 89 543 480 62 Do-something 408 378 30 531 475 56
Vicarage Road Northbound Do-nothing 582 553 30 381 361 20 Do-minimum 619 598 21 414 409 4 Do-something 688 670 18 512 547 -35
Vicarage Road Southbound Do-nothing 593 505 88 721 656 64 Do-minimum 630 576 54 756 679 77 Do-something 709 698 11 866 874 -8
Station Road Northbound Do-nothing 359 349 10 297 244 54 Do-minimum 351 327 24 251 203 48 Do-something 342 314 28 212 160 52
Station Road Southbound Do-nothing 423 456 -33 421 499 -78 Do-minimum 387 421 -34 356 428 -72 Do-something 364 376 -12 338 365 -27
Prune Hill Westbound Do-nothing 356 398 -41 481 554 -73 Do-minimum 341 432 -92 473 537 -64 Do-something 335 401 -66 456 529 -73
Prune Hill Eastbound Do-nothing 337 387 -50 194 207 -13 Do-minimum 344 385 -41 217 241 -25 Do-something 341 390 -49 217 273 -56
Table 4.10: Flow comparison across level crossings between the full and cordoned model
4.18.9 The modelled flows are similar between the full and cordoned models.
4.18.10 Moreover, the full model shows a similar increase in flow northbound along Vicarage Road in the do-something (with underpass) compared with the do-minimum (without underpass) scenario. This has been estimated as 72 to 138 vehicles in the full model, compared with 69 to 98 vehicles in the cordon model. In
Issue No. 02 Page 54 of 67 Document No.7994/01
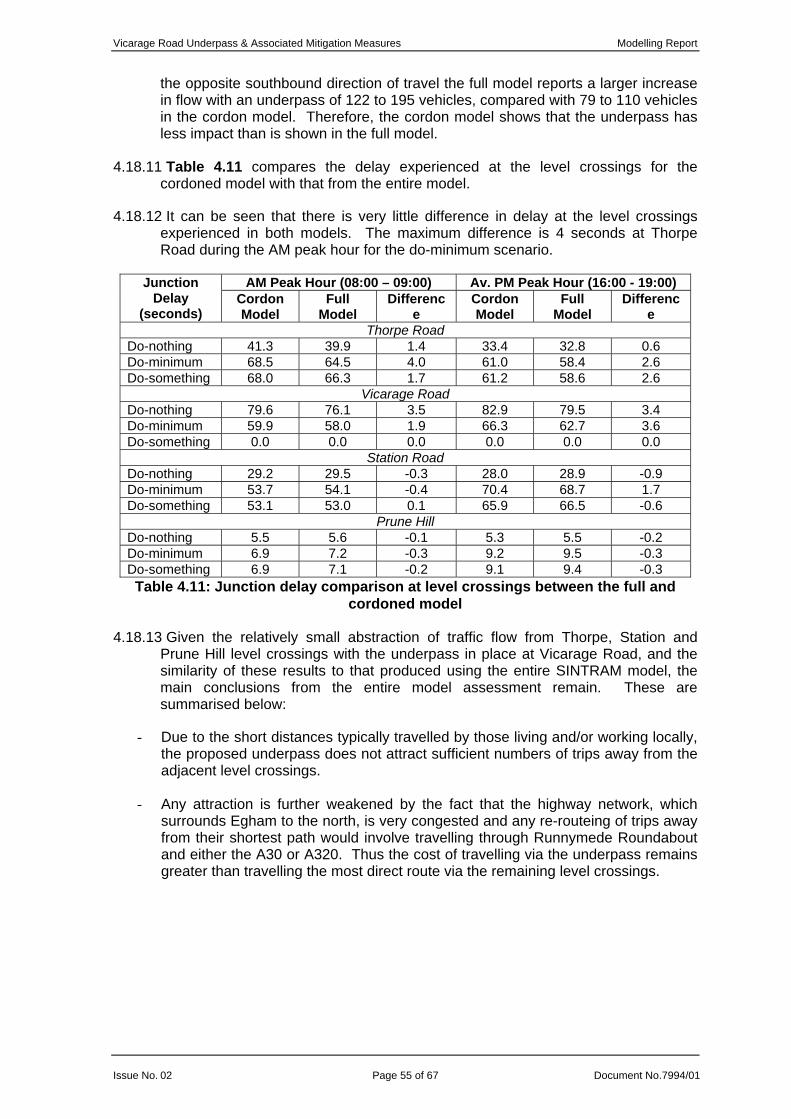
Vicarage Road Underpass & Associated Mitigation Measures Modelling Report
the opposite southbound direction of travel the full model reports a larger increase in flow with an underpass of 122 to 195 vehicles, compared with 79 to 110 vehicles in the cordon model. Therefore, the cordon model shows that the underpass has less impact than is shown in the full model.
4.18.11 Table 4.11 compares the delay experienced at the level crossings for the cordoned model with that from the entire model.
4.18.12 It can be seen that there is very little difference in delay at the level crossings experienced in both models. The maximum difference is 4 seconds at Thorpe Road during the AM peak hour for the do-minimum scenario.
AM Peak Hour (08:00 – 09:00) Av. PM Peak Hour (16:00 - 19:00) Junction Delay
(seconds) Cordon Model
Full Model
Difference
Cordon Model
Full Model
Difference
Thorpe Road Do-nothing 41.3 39.9 1.4 33.4 32.8 0.6 Do-minimum 68.5 64.5 4.0 61.0 58.4 2.6 Do-something 68.0 66.3 1.7 61.2 58.6 2.6
Vicarage Road Do-nothing 79.6 76.1 3.5 82.9 79.5 3.4 Do-minimum 59.9 58.0 1.9 66.3 62.7 3.6 Do-something 0.0 0.0 0.0 0.0 0.0 0.0
Station Road Do-nothing 29.2 29.5 -0.3 28.0 28.9 -0.9 Do-minimum 53.7 54.1 -0.4 70.4 68.7 1.7 Do-something 53.1 53.0 0.1 65.9 66.5 -0.6
Prune Hill Do-nothing 5.5 5.6 -0.1 5.3 5.5 -0.2 Do-minimum 6.9 7.2 -0.3 9.2 9.5 -0.3 Do-something 6.9 7.1 -0.2 9.1 9.4 -0.3 Table 4.11: Junction delay comparison at level crossings between the full and
cordoned model 4.18.13 Given the relatively small abstraction of traffic flow from Thorpe, Station and
Prune Hill level crossings with the underpass in place at Vicarage Road, and the similarity of these results to that produced using the entire SINTRAM model, the main conclusions from the entire model assessment remain. These are summarised below:
- Due to the short distances typically travelled by those living and/or working locally, the proposed underpass does not attract sufficient numbers of trips away from the adjacent level crossings.
- Any attraction is further weakened by the fact that the highway network, which
surrounds Egham to the north, is very congested and any re-routeing of trips away from their shortest path would involve travelling through Runnymede Roundabout and either the A30 or A320. Thus the cost of travelling via the underpass remains greater than travelling the most direct route via the remaining level crossings.
Issue No. 02 Page 55 of 67 Document No.7994/01

Vicarage Road Underpass & Associated Mitigation Measures Modelling Report
5 DISCUSSION OF RESULTS
5.1.1 The modelling work which has been undertaken suggests that the replacement of Vicarage Road level crossing with an underpass and associated traffic calming, as modelled in scenario 3, will not increase traffic flow along B388 Vicarage Road. In fact, traffic flow here will reduce compared with the do-minimum scenario 2, in 2016.
5.1.2 The intention of the underpass was to provide an unhindered route across the railway line for people who live and/or work locally. As shown, in the sensitivity test of scenario 6, the traffic calming situated along B388 Vicarage Road between its junction with B3407 High Street and Egham sports centre, restricts the number of vehicles that use this route. When the underpass is modelled with the traffic calming removed, the number of vehicles which traverse this route increases by more than 100 in each direction in 2016. However, the traffic calming is required to ensure that vehicles pass through the underpass at 20mph due its design constraints. Furthermore, the vehicles which were attracted to B388 Vicarage Road in scenario 6 previously travelled via A320 Chertsey Lane.
5.1.3 As exemplified in Figure 5.1, route A via the A320 and route B via B388 are exactly the same distance in length. Existing journey times show that there is just 10 seconds difference between the routes with route B being longer. Although route A is via higher classified roads and avoids level crossings, it passes through the congested A308 The Causeway. Consequently, any improvement to route B, that will shorten its journey time, does result in an increase of use by non-local vehicles which are attracted away from the A320. The aim of the underpass is not to attract longer distance trips from higher classified roads, such as this or the A30, particularly as these routes are unaffected by the railway line.
Figure 5.1: Illustrative example of route choice between A320 and B388
Key Origin Destination Route A via A320 (avoiding level crossings) Route B via B388
Issue No. 02 Page 56 of 67 Document No.7994/01

Vicarage Road Underpass & Associated Mitigation Measures Modelling Report
5.1.4 Similarly, the model suggests that northbound traffic flow through the underpass is constrained by the junction capacity at B3407 The Avenue approach to Runnymede roundabout. Scenario 5 was a sensitivity test that increased B3407 The Avenue green time by 40%. This increased flow through Vicarage Road underpass, but only in the northbound direction. Again, the increased flow was drawn from more strategic roads and not from either Thorpe Road or Station Road level crossings.
5.1.5 The reason why trips are not being drawn to the underpass from the surrounding level crossings is due to the existing trip distribution of those vehicles which cross the level crossings in Egham. Observed roadside interview (RSI) data, as presented in Appendix B, shows that the majority of vehicles which cross Thorpe Road, Vicarage Road and Station Road level crossings are local. For example, nearly 60% of trips that cross Thorpe Road level crossing are less than 3 miles (5km) in length.
5.1.6 Consequently, for short trip distances, vehicles are not diverting away from their most direct route to travel via the proposed underpass and avoid a level crossing. The cost (or journey time) of doing this remains greater than the existing route. This is further hindered by the fact that Egham is surrounded to the north by major junctions, which include Runnymede roundabout and Staines Bridge roundabout, and the entire area is congested. Thus, diversion for short distance trips will not occur.
5.1.7 A further illustration, as shown in Figure 5.2, is those vehicles that travel via B3376 Thorpe Road to reach their destination in Staines, will still travel via Thorpe Road level crossing and not Pooley Green underpass because the shortest route in distance still remains that with the least cost (and journey time).
5.1.8 For example, the origin – destination data from the road side interview undertaken on the B3376 Thorpe Road (northbound), as presented in Appendix B, shows a concentration of origins in the Egham Hythe, and Pooley Green and Thorpe Lea areas with a concentration of destinations in the Staines area. The distance between Egham Hythe and Staines via Thorpe Road, illustrated as route C in Figure 5.2, is 1.3 miles. This is the shortest path, which travels across Thorpe Road level crossing, and the journey time is 14 minutes.
5.1.9 Route D, however, is the same journey in terms of origin and destination, but the route that is taken differs. The route uses the proposed underpass at Vicarage Road. This enables unhindered passage across the rail line, but the journey distance increases to 2.8 miles. This is more than double the distance of route C and the overall journey time is 18 minutes. Additional congestion on the network, notably at Runnymede roundabout and the A308 The Causeway, is negotiated along route D.
5.1.10 Consequently, route C, which is the most direct, remains the route with the least delay, despite the increases in level crossing down time attributed to Airtrack. For this reason vehicles are not diverting from the other level crossings to use the proposed underpass.
5.1.11 For these reasons, and the high costs that would be involved in constructing an underpass at Vicarage Road level crossing, a single underpass situated here is not the appropriate solution to the problem.
Issue No. 02 Page 57 of 67 Document No.7994/01
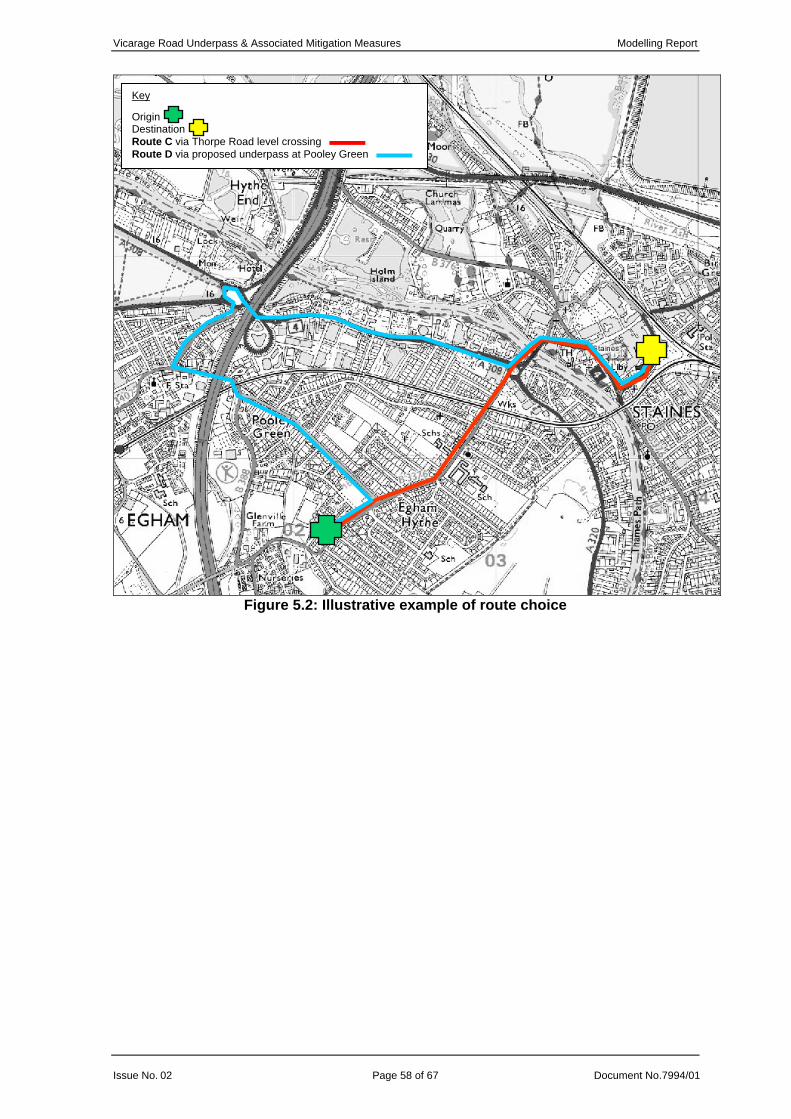
Vicarage Road Underpass & Associated Mitigation Measures Modelling Report
Key Origin Destination Route C via Thorpe Road level crossing Route D via proposed underpass at Pooley Green
Figure 5.2: Illustrative example of route choice
Issue No. 02 Page 58 of 67 Document No.7994/01

Vicarage Road Underpass & Associated Mitigation Measures Modelling Report
6 OTHER EFFECTS
6.1.1 The replacement of Vicarage Road level crossing with an underpass should provide benefit to train operations, which has not been quantified within this study.
6.1.2 Other benefits of an underpass, which have not been considered here, are safety and improved accessibility for all modes of travel, including walking and cycling.
Issue No. 02 Page 59 of 67 Document No.7994/01
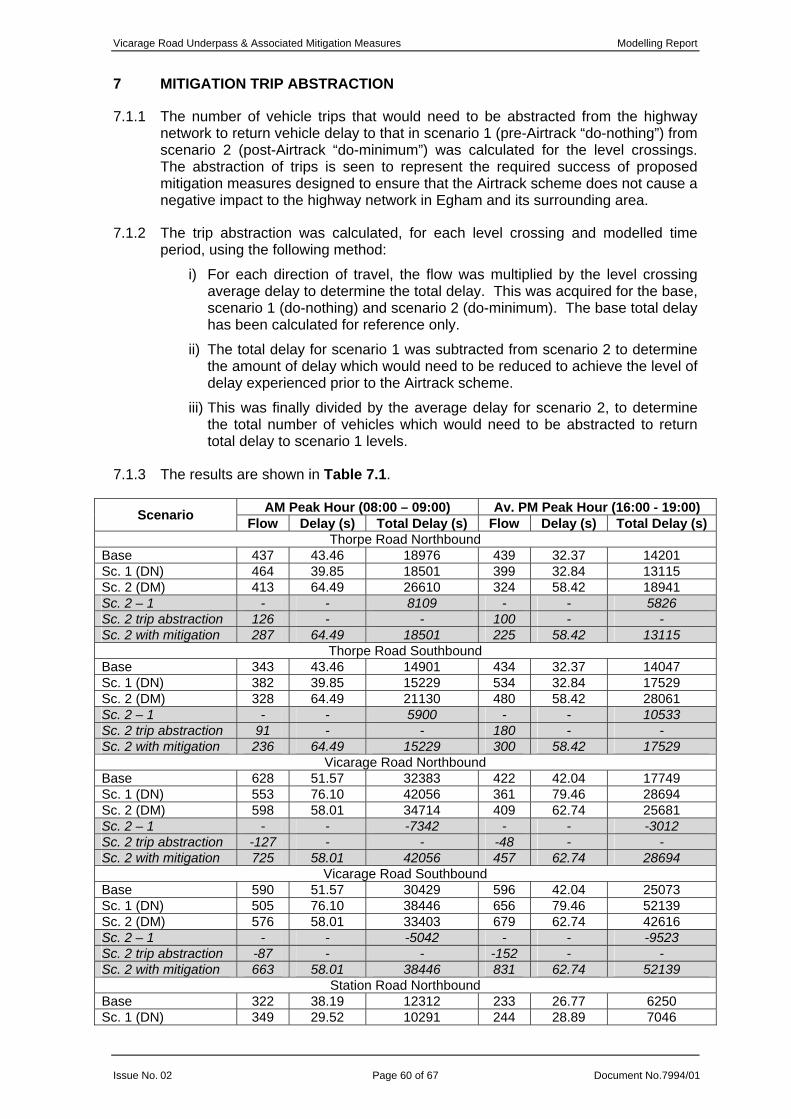
Vicarage Road Underpass & Associated Mitigation Measures Modelling Report
7 MITIGATION TRIP ABSTRACTION
7.1.1 The number of vehicle trips that would need to be abstracted from the highway network to return vehicle delay to that in scenario 1 (pre-Airtrack “do-nothing”) from scenario 2 (post-Airtrack “do-minimum”) was calculated for the level crossings. The abstraction of trips is seen to represent the required success of proposed mitigation measures designed to ensure that the Airtrack scheme does not cause a negative impact to the highway network in Egham and its surrounding area.
7.1.2 The trip abstraction was calculated, for each level crossing and modelled time period, using the following method:
i) For each direction of travel, the flow was multiplied by the level crossing average delay to determine the total delay. This was acquired for the base, scenario 1 (do-nothing) and scenario 2 (do-minimum). The base total delay has been calculated for reference only.
ii) The total delay for scenario 1 was subtracted from scenario 2 to determine the amount of delay which would need to be reduced to achieve the level of delay experienced prior to the Airtrack scheme.
iii) This was finally divided by the average delay for scenario 2, to determine the total number of vehicles which would need to be abstracted to return total delay to scenario 1 levels.
7.1.3 The results are shown in Table 7.1.
AM Peak Hour (08:00 – 09:00) Av. PM Peak Hour (16:00 - 19:00) Scenario Flow Delay (s) Total Delay (s) Flow Delay (s) Total Delay (s) Thorpe Road Northbound
Base 437 43.46 18976 439 32.37 14201 Sc. 1 (DN) 464 39.85 18501 399 32.84 13115 Sc. 2 (DM) 413 64.49 26610 324 58.42 18941 Sc. 2 – 1 - - 8109 - - 5826 Sc. 2 trip abstraction 126 - - 100 - - Sc. 2 with mitigation 287 64.49 18501 225 58.42 13115
Thorpe Road Southbound Base 343 43.46 14901 434 32.37 14047 Sc. 1 (DN) 382 39.85 15229 534 32.84 17529 Sc. 2 (DM) 328 64.49 21130 480 58.42 28061 Sc. 2 – 1 - - 5900 - - 10533 Sc. 2 trip abstraction 91 - - 180 - - Sc. 2 with mitigation 236 64.49 15229 300 58.42 17529
Vicarage Road Northbound Base 628 51.57 32383 422 42.04 17749 Sc. 1 (DN) 553 76.10 42056 361 79.46 28694 Sc. 2 (DM) 598 58.01 34714 409 62.74 25681 Sc. 2 – 1 - - -7342 - - -3012 Sc. 2 trip abstraction -127 - - -48 - - Sc. 2 with mitigation 725 58.01 42056 457 62.74 28694
Vicarage Road Southbound Base 590 51.57 30429 596 42.04 25073 Sc. 1 (DN) 505 76.10 38446 656 79.46 52139 Sc. 2 (DM) 576 58.01 33403 679 62.74 42616 Sc. 2 – 1 - - -5042 - - -9523 Sc. 2 trip abstraction -87 - - -152 - - Sc. 2 with mitigation 663 58.01 38446 831 62.74 52139
Station Road Northbound Base 322 38.19 12312 233 26.77 6250 Sc. 1 (DN) 349 29.52 10291 244 28.89 7046
Issue No. 02 Page 60 of 67 Document No.7994/01

Vicarage Road Underpass & Associated Mitigation Measures Modelling Report
AM Peak Hour (08:00 – 09:00) Av. PM Peak Hour (16:00 - 19:00) Scenario Flow Delay (s) Total Delay (s) Flow Delay (s) Total Delay (s) Sc. 2 (DM) 327 54.06 17700 203 68.70 13951 Sc. 2 – 1 - - 7409 - - 6905 Sc. 2 trip abstraction 137 - - 101 - - Sc. 2 with mitigation 190 54.06 10291 103 68.70 7046
Station Road Southbound Base 335 38.19 12796 348 26.77 9312 Sc. 1 (DN) 456 29.52 13464 499 28.89 14409 Sc. 2 (DM) 421 54.06 22765 428 68.70 29371 Sc. 2 – 1 - - 9300 - - 14962 Sc. 2 trip abstraction 172 - - 218 - - Sc. 2 with mitigation 249 54.06 13464 210 68.70 14409
Prune Hill Westbound Base 184 5.02 925 339 4.51 1529 Sc. 1 (DN) 398 5.62 2235 554 5.45 3020 Sc. 2 (DM) 432 7.18 3102 537 9.47 5088 Sc. 2 – 1 - - 868 - - 2068 Sc. 2 trip abstraction 121 - - 218 - - Sc. 2 with mitigation 311 7.18 2235 319 9.47 3020
Prune Hill Eastbound Base 303 5.02 1523 164 4.51 740 Sc. 1 (DN) 387 5.62 2173 207 5.45 1130 Sc. 2 (DM) 385 7.18 2764 241 9.47 2284 Sc. 2 – 1 - - 591 - - 1155 Sc. 2 trip abstraction 82 - - 122 - - Sc. 2 with mitigation 303 7.18 2173 119 9.47 1130
Total Trip Abstraction Northbound 257 - - 371 - - Southbound 259 - - 368 - - Both directions 516 - - 739 - -
Table 7.1: Trip abstraction to attain nil-detriment impact of the Airtrack scheme
7.1.4 At Vicarage Road level crossing, the barrier closure downtimes produce less delay with Airtrack in operation (in scenario 2) than without the Airtrack scheme (scenario 1). This has been explained further in Section 4.9.3. As a result, the total delay at Vicarage Road is less in scenario 2 than scenario 1 and negative abstraction values are shown in Table 7.1.
7.1.5 Regardless of this, at all the other level crossings, there is an increase in delay due to the Airtrack scheme.
7.1.6 In total, this assessment indicates that 516 vehicles will need to be abstracted at the level crossings in the AM peak hour (08:00 – 09:00), and 739 vehicles in the average PM peak hour (16:00 – 19:00), to ensure that Airtrack does not have a negative impact on the highway network within Egham and its surrounding area.
7.1.7 It must be noted, however, that the trip abstraction values cited above should be viewed as the maximum number of vehicles which would need to be removed to ensure a nil-detriment impact from the Airtrack scheme. This is because the method is simplistic. In particular, the delay at the crossing in scenario 2, in reality would reduce as the flow through the level crossings reduces. The reverse would also be true for an increase in flow. A change in delay resulting from trip abstraction has not been captured in the methodology applied above.
Issue No. 02 Page 61 of 67 Document No.7994/01

Vicarage Road Underpass & Associated Mitigation Measures Modelling Report
8 CONCLUSIONS
8.1.1 Surrey County Council have concerns regarding the increased length of level crossing closure to traffic in Egham due to Airtrack. As a result, the Council’s strategic model was enhanced in the study area to assess the impact of various forecast scenarios on the highway network. The model was calibrated using observed traffic counts and roadside interview data. It achieved good flow and journey time validation, and is considered adequate for the assessment of the underpass and its associated mitigation measures.
8.1.2 Several scenarios were developed to assess the existing highway network, with and without Airtrack, and also proposed changes to the highway in an attempt to mitigate its impact. The scenarios were modelled for the forecast years 2016 and 2031.
8.1.3 The predominant scenario, presented as scenario 3, involved the replacement of Vicarage Road level crossing with an underpass, accompanied with traffic calming due to its design constraints.
8.1.4 The modelling work indicated that due to the short distances typically travelled by those living and/or working locally, as exhibited in the roadside interview surveys, the proposed underpass does not attract trips away from the adjacent Thorpe Road and Station Road level crossings. Any attraction is further weakened by the fact that the highway network, which surrounds Egham to the north, is very congested and any re-routeing of trips away from their shortest path would involve travelling through Runnymede Roundabout and either the A30 or A320. Thus, the cost of travelling via the underpass remains greater than travelling the most direct route via the remaining level crossings.
8.1.5 Consequently from this assessment, and the high monetary costs that would be involved in constructing an underpass at Vicarage Road level crossing, a single underpass situated here does not appear to be the appropriate solution to the problem, in terms of vehicle impact.
8.1.6 Finally, the number of vehicle trips that would need to be abstracted from the highway network to return vehicle delay to scenario 1 (pre-Airtrack “do-nothing”) from scenario 2 (post-Airtrack “do-minimum”) has been calculated for the level crossings. The abstraction of trips is seen to represent the required success of proposed mitigation measures designed to ensure that the Airtrack scheme does not cause a negative impact to the highway network in Egham and its surrounding area. It has been determined that a maximum total of 516 vehicles will need to be abstracted at the level crossings in the AM peak hour (08:00 – 09:00), and 739 vehicles in the average PM peak hour (16:00 – 19:00).
Issue No. 02 Page 62 of 67 Document No.7994/01

Vicarage Road Underpass & Associated Mitigation Measures Modelling Report
9 APPENDICES
9.1 Appendix A: Modelled Level Crossing Downtimes
9.1.1 The modelled level crossing downtimes, in Table 8.1, have been determined from level crossing information provided by Geoffrey Hill on behalf of BAA.
9.1.2 Observed level crossings operations were provided in an email to William Bryans dated 06/11/09, and to Gemma Thomas dated 06/04/10, both from Geoffrey Hill. These were used to calculate the crossing timings for the base situation.
9.1.3 Forecasted level crossings for the Airtrack scheme were provided in an email to Abigail Fielder dated 04/03/10 from Geoffrey Hill. These were revised timings from modelling undertaken by Network Rail. The “pre” results were used to calculate the crossing timings for scenario 1 (do-nothing), whilst the “post” timings were used for the scenario 2 to 6 (do-minimum and do-something models). “Pre” results reflect the observed level crossing barrier times collated by Count on Us in addition to South West Trains aspired services prior to Airtrack becoming live. Thus, “post” results are the predicted crossing barrier times with the addition of Airtrack.
Modelled Timings (seconds) Level Crossing
No. of Times Barrier Shut
Total Time in Hour Barrier is Closed (mm:ss)
Vehicle Green Time
Train Green Time
Cycle Time
Base AM Peak Hour (08:00 – 09:00) Thorpe Road 10 26:00 204 156 360 Vicarage Road 10 26:06 203 157 360 Station Road 10 24:50 211 149 360 Prune Hill 10 08:25 310 50 360
Base Average PM Peak Hour (16:00 – 19:00) Thorpe Road 8 19:43 302 148 450 Vicarage Road 8 21:56 286 164 450 Station Road 8 18:37 310 140 450 Prune Hill 9 07:19 351 49 400
Scenario 1 (do-nothing) AM Peak Hour (08:00 – 09:00) Thorpe Road 8 22:01 285 165 450 Vicarage Road 7 27:35 278 236 514 Station Road 8 18:58 308 142 450 Prune Hill 12 09:24 253 47 300
Scenario 1 (do-nothing) PM Peak Hour (17:00 – 18:00) Thorpe Road 8 19:33 303 147 450 Vicarage Road 6 25:51 342 259 600 Station Road 7 17:32 364 150 514 Prune Hill 11 08:37 280 47 327
Scenarios 2 to 6 (do-minimum and do-something) AM Peak Hour (08:00 – 09:00) Thorpe Road 10 32:02 168 192 360 Vicarage Road 11 30:38 160 167 327 Station Road 10 29:06 185 175 360 Prune Hill 12 10:44 246 54 300
Scenarios 2 to 6 (do-minimum and do-something) PM Peak Hour (17:00 – 18:00) Thorpe Road 10 30:03 180 180 360 Vicarage Road 10 29:06 185 175 360 Station Road 8 29:41 227 223 450 Prune Hill 13 12:59 217 60 277
Table 8.1: Modelled level crossing timings
9.1.4 For the PM base signal timings, these are an average of the PM period 16:00 to 19:00 to reflect that being modelled. For the do-nothing and do-something scenarios, however, the entire model time period was not available. For that reason, the predicted barrier timings for 17:00 to 18:00 have been used.
Issue No. 02 Page 63 of 67 Document No.7994/01

Vicarage Road Underpass & Associated Mitigation Measures Modelling Report
9.1.5 An example of the signal calculation is provided below for reference.
Base AM peak hour (08:00 – 09:00) for Thorpe Road Total barrier open time = 34 minutes (= 60 minutes – 26 minutes) Total barrier down time = 26 minutes Number of times the barrier is down = 10
Stage 1 = open to vehicles = 1034
= 3 minutes 24 seconds (average time it is open
to traffic)
Stage 2 = closed to vehicles = 1026
= 2 minutes 36 seconds (average time it is
closed to traffic) Therefore:- Cycle time = 6 minutes (3:24 + 2:36) = 360 seconds Stage 1 = 3 minutes 24 seconds = 204 seconds Stage 2 = 2 minutes 36 seconds = 156 seconds
9.1.6 In the forecast timetables, the number of closures varies between level crossings. It is understood that this is due to the positioning of trains that are travelling in opposite directions along the two rail lines. Furthermore, the calculated cycle time relates to the number of level crossing closures.
9.1.7 The model represents traffic operations for a single hour within the AM and PM peak. Consequently, the signal timing values used in the model also reflects the average barrier closure operation for the same time periods. This is the most appropriate assessment of level crossing delay in this type of traffic model, particularly since there is daily fluctuation in barrier closures along the rail line, due to rail disruptions and the time it takes to clear the crossings of traffic, amongst other variables. Furthermore, modelled journey times along routes that pass across the level crossings showed a very good replication of those observed, as shown in Section 2.7. The method for calculating the level crossing times has been kept consistent between the base and each scenario, to ensure that the assessment is sound and that its impacts are evaluated appropriately.
Issue No. 02 Page 64 of 67 Document No.7994/01
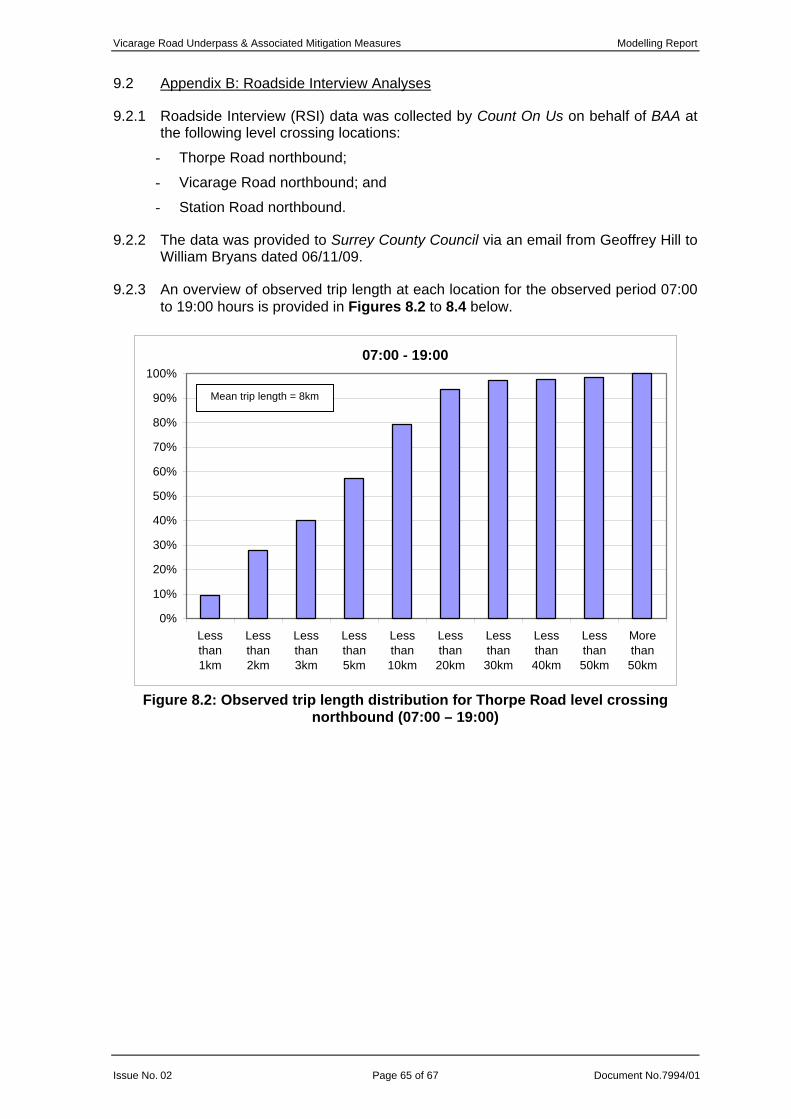
Vicarage Road Underpass & Associated Mitigation Measures Modelling Report
9.2 Appendix B: Roadside Interview Analyses
9.2.1 Roadside Interview (RSI) data was collected by Count On Us on behalf of BAA at the following level crossing locations:
- Thorpe Road northbound;
- Vicarage Road northbound; and
- Station Road northbound.
9.2.2 The data was provided to Surrey County Council via an email from Geoffrey Hill to William Bryans dated 06/11/09.
9.2.3 An overview of observed trip length at each location for the observed period 07:00 to 19:00 hours is provided in Figures 8.2 to 8.4 below.
07:00 - 19:00
0%
10%
20%
30%
40%
50%
60%
70%
80%
90%
100%
Lessthan1km
Lessthan2km
Lessthan3km
Lessthan5km
Lessthan10km
Lessthan20km
Lessthan30km
Lessthan40km
Lessthan50km
Morethan50km
Mean trip length = 8km
Figure 8.2: Observed trip length distribution for Thorpe Road level crossing northbound (07:00 – 19:00)
Issue No. 02 Page 65 of 67 Document No.7994/01

Vicarage Road Underpass & Associated Mitigation Measures Modelling Report
07:00 - 19:00
0%
10%
20%
30%
40%
50%
60%
70%
80%
90%
100%
Lessthan1km
Lessthan2km
Lessthan3km
Lessthan5km
Lessthan10km
Lessthan20km
Lessthan30km
Lessthan40km
Lessthan50km
Morethan50km
Mean trip length = 16km
Figure 8.3: Observed trip length distribution for Vicarage Road level crossing northbound (07:00 – 19:00)
07:00 - 19:00
0%
10%
20%
30%
40%
50%
60%
70%
80%
90%
100%
Lessthan1km
Lessthan2km
Lessthan3km
Lessthan5km
Lessthan10km
Lessthan20km
Lessthan30km
Lessthan40km
Lessthan50km
Morethan50km
Mean trip length = 9km
Figure 8.4: Observed trip length distribution for Station Road level crossing northbound (07:00 – 19:00)
Issue No. 02 Page 66 of 67 Document No.7994/01

Vicarage Road Underpass & Associated Mitigation Measures Modelling Report
9.3 Appendix C: Validation Acceptability Guidelines
9.3.1 Guidelines for model validation are set out in the ‘Traffic Appraisal in Urban Areas6’.
9.3.2 The standard method of comparison is to compare modelled values against observed.
9.3.3 The GEH statistic is recommended as a main indicator of comparison of traffic flows. It is a form of the Chi-squared statistic that incorporates both absolute and relative errors. The GEH statistic is defined as:
( )( ) 5.0
2
×+−
=CM
CMGEH
Where M = modelled flow, and C = observed flow. General guidance on the GEH statistic is: a GEH below 5 represents a high level of acceptability, while those above 10 are viewed as unacceptable.
9.3.4 Table 8.2 sets out the assignment acceptability guidelines, taken from the ‘Design Manual for Roads and Bridges’, which have been used to guide calibration and to check the validity of the model.
Criteria and Measures Acceptability Guideline Assigned Modelled Hourly Flows Compared with Observed Flows
1. Observed flow < 700vph Modelled flow within ±100vph 2. Observed flow 700 – 2,700vph Modelled flow within ±15% 3. Observed flow > 2,700vph Modelled flow within ±400vph 4. GEH statistic for individual flows <5
> 85% of cases
5. GEH statistic <4 for screenline totals 6. Total screenline flows (normally > 5 links) to be within 5% All (or nearly all screenlines)
Modelled Journey Times Compared with Observed Times 7. Times within ±15% (or one minute, if higher) > 85% of cases
All Comparisons should be Based on Directional Hourly Flows Table 8.2: Assignment acceptability guidelines
6 Highways Agency (1996), Design Manual for Roads and Bridges, Traffic Appraisals of Road Schemes, Volume 12a, Section 2, ‘Part 1: Traffic Appraisal in Urban Areas’, Chapter 4: Model Development.
Issue No. 02 Page 67 of 67 Document No.7994/01
Top Related