


Languages
Pages
Legal


Multilevel Analysis and Curriculum Effectiveness 1
Running head: MULTILEVEL ANALYSES AND CURRICULUM EFFECTIVENESS
Using Multilevel Analyses to Study the Effectiveness of Science Curriculum Materials
Vasuki Rethinam, Curtis Pyke, and Sharon Lynch
Graduate School of Education and Human Development The George Washington University, USA.
This work was conducted by SCALE-uP: A collaboration between George Washington University and Montgomery County Public Schools (MD); Sharon Lynch, Joel Kuipers, Curtis Pyke, and Michael Szesze, principal investigators. Funding for SCALE-uP was provided by the National Science Foundation, the U.S. Department of Education, and the National Institute of Health (REC-0228447). Any opinions, findings, conclusions, or recommendations are those of the authors and do not necessarily reflect the position or policy of endorsement of the funding agencies. Correspondence to: Vasuki Rethinam, Ph.D., Research Scientist, SCALE-uP, 2134 G St. N.W., Washington, DC 20052, USA. E-mail: [email protected], Phone: 202-994-0803 and Fax: 202-994-0692.

Multilevel Analysis and Curriculum Effectiveness 2
Running head: MULTILEVEL ANALYSES AND CURRICULUM EFFECTIVENESS
Using Multilevel Analyses to Study the Effectiveness of Science Curriculum Materials
Multilevel Analysis and Curriculum Effectiveness 3
Abstract
This paper explores the use of HLM analysis in determining the implementation
effects of two science curriculum units on student learning. It also compares HLM results
with prior results from ANCOVA analyses. HLM analyses were considered as an
alternative to ANCOVA because student data were nested within classrooms. The data
for this study are from the Scaling-up Curriculum for Achievement, Learning and Equity
Project (SCALE-uP). The sample consists of grade 6 students (n = 2441, classroom n =
107) and grade 7 students (n = 2929, classroom n = 111) from five matched pairs of
middle schools in a large, diverse, metropolitan school district in the United States. The
HLM null model indicate that approximately 15% of the total variance in student gain
scores was found between classrooms. Curriculum treated as a classroom factor was
significant for both units tested, as was also the case when treated at the individual level
in ANCOVA. However, there were large differences in the effect sizes reported by the
two analysis techniques. A major implication is that when the students are nested in
classrooms and schools, researchers should consider multilevel analysis and account for
classroom/school contexts.
Key Words: Curriculum effectiveness, Multilevel vs. single-level analysis, HLM,
classroom context, Science education, Gain scores.
Multilevel Analysis and Curriculum Effectiveness 4
Introduction
This paper uses Hierarchical Linear Modeling (HLM) to show that classroom
context, including classroom ethnic/racial diversity, complicates the estimation of effects
in studies of middle school science curriculum units. The paper is based on the premise
that classroom context predicts differences in outcomes, and classroom-level variables
can be used to control for the effects of context factors on an individual’s learning in
curriculum evaluation research. In other words, a significant portion of variance in
outcome measures is found between-classrooms and ought to be considered in curriculum
studies. This work is part of the ongoing effort of the Scaling-up Curriculum for
Achievement, Learning and Equity Project (SCALE-uP) to evaluate and understand the
effectiveness of reform-based curriculum materials, as a precursor to their scale-up in a
large and diverse school district in the north-east of the United States. Analytically, the
attention to classroom contextual effects and the use of HLM analyses are warranted to
account for systematic variability in the data caused by the non-random assignment of
students to schools and classrooms. In prior work, SCALE-uP relied on analysis of
covariance (ANCOVA) techniques for detecting the effectiveness of a curriculum unit
(Lynch, Kuipers, Pyke, & Szesze, 2005; Lynch, Taymans, Watson, Ochsendorf, Pyke, &
Szesze, 2007). The motivation for this current paper was to explore the utility of HLM
analyses for producing greater precision in quantifying the effects attributed to the
implementation of curriculum units.
Background
SCALE-uP Quasi-Experimental Studies
Multilevel Analysis and Curriculum Effectiveness 5
SCALE-uP’s goals are grounded in a commitment to quasi-experimental
curriculum unit effectiveness studies conducted in diverse school settings. The project’s
curriculum unit experiments are designed to elicit evidence to (1) confirm -- prior to
scaling up units -- that they “work,” i.e., they are more effective than comparison
curriculum and (2) to test if they close gaps, i.e., does the new unit allow all students to
achieve high standards. Student (single) level ANCOVA techniques on posttest scores
with pretests as covariates were initially employed to test for significant curriculum
differences (e.g., Lynch et al., 2005) although each student was not randomly placed in
curriculum units and students were nested within classrooms and schools. SCALE-uP
acknowledges that the choice of student level ANCOVA under these nested conditions is
controversial (for a recent discussion, see Lederman and Flick, 2005).
The SCALE-uP researchers argue that carefully matched samples; expectations of
medium to large effects; large numbers of students (~ 2500 for each study); and an
interest in statistical significance of group mean differences created conditions favorable
for determining effectiveness using ANCOVAs. Under these conditions, SCALE-uP
researchers believe that ANCOVAs are conservative for tests of significant mean
differences in concept understanding at the time of posttest. In addition, ANCOVA
results have the advantage of being easily presented and discussed across the boundaries
of researchers and practitioners (e.g., Lynch et al., 2005). Moreover, true experimental
studies employing random clinical trials for short-term curriculum units can be
impractical to impossible, given conditions of school systems (c.f., Cook, 2002).
SCALE-uP ANCOVA Results

Multilevel Analysis and Curriculum Effectiveness 6
The results of the first implementation1 study of a curriculum unit developed in
the United States called, Chemistry That Applies (CTA [State of Michigan, 1993])
conducted by SCALE-uP in 2001-02 supported the effectiveness of the unit and the
utility of ANCOVA for detecting group differences. The first CTA study and its
replication the following year met the expectations that a curriculum unit with a high
rating for instructional quality (American Association for the Advancement of Science
[AAAS], 2001) would result in positive outcomes overall and significant differences in
favor of the new curriculum unit. The ANCOVA analyses showed that students’
understanding of the target ideas as measured by the posttest assessment was higher with
the new unit and analyses of disaggregated student demographic data (gender,
ethnicity/race, socio-economic status [SES], language literacy, and special education
status) showed that subgroups of students learning with the new condition always
outscored their peers in the comparison condition (Lynch et al., 2005; Lynch et al., 2007).
In 2004, SCALE-uP conducted quazi-experiments on two additional curriculum
units: Motion and Forces (M&F) and Real Reasons for the Seasons (Seasons). These two
units did not rate as highly in instructional quality as the first unit (CTA), although these
materials do have instructional characteristics more promising than traditional U.S.
science textbooks (O’Donnell, Watson, Pyke, & Lynch, 2006; Ochsendorf, Lynch, &
Pyke, 2006). Unlike the first unit investigated, in which overall effects and effects when
the data were disaggregated mirrored each other, the ANCOVA results for these units
showed different profiles of effects for disaggregated data. The Implementation Reports
on the SCALE-uP website, www.gwu.edu/~scale-up, provide more information on the

Multilevel Analysis and Curriculum Effectiveness 7
findings from ANCOVAs. (Appendices A and B contain details on the M&F and Seasons
curriculum effect sizes for all levels of independent variables).
Need for Multi-level Analysis
SCALE-uP’s study of curriculum units with different patterns of instructional
characteristics coupled with very different patterns of results over four years of quasi-
experimental research resulted in a shift of interest in reporting findings. Originally the
work was positioned to answer the question, “did it work” and SCALE-uP reported on
tests of significance, coupled with reporting effect sizes (e.g, Cohen’s d) to address “how
well did it work for this subgroup or that one.” This practice follows from an U.S.
emphasis on experimental tests of curriculum and reporting of effect sizes for group
differences in experimental research (American Psychological Association, 2001).
The appearance of smaller effects than anticipated for some of the M&F and
Seasons data, and a greater variation in effect sizes among subgroups, made it important
that the best effects statistics and effect size estimates were calculated and reported.
There was concern for accurately reporting on the efficacy of new curriculum in light of
the smaller than expected differences and nested data structures. Concern over precision
in effect size estimation in U.S. curriculum research is not unique to SCALE-uP. The
field of education research in general is beginning to acknowledge that too often
researchers have ignored the fact that student outcomes are affected by complex,
multidimensional, inter-related factors that interact in organizational settings - the most
basic of which is classrooms within schools (Rowe, Hill, & Holmes-Smith, 1995; Rowe
& Hill, 1998). For example, researchers implementing interventions at the school or
classroom level commonly measure and analyze the effect of treatments at the student

Multilevel Analysis and Curriculum Effectiveness 8
level, overlooking the nested structure of the data. Nesting can result in an estimated
standard error of the treatment effect that is too small, leading to a liberal test of
significance thereby inflating probability of Type I error (Aitkin, Anderson, & Hinde,
1981). This could have been the case with SCALE-uP research which employed
ANCOVAs at the student level there by finding significant effects when not significant
In contrast, other researchers (e.g., in Goldstein, 1997) used classroom as the unit
of analysis and classroom means as the outcome. However, classroom analyses suffer
from aggregation bias and do not provide information on whether the treatment was
differentially effective for individuals or different subgroups of children because the
students’ characteristics (such as prior grades in science) cannot be used as covariates.
However, multilevel modeling allows the researcher a statistical alternative to
ANCOVA with individual level or classroom level analyses when analyzing nested data.
The assumption of independence of cases is not necessary in a multilevel analysis
because the probable dependence of students in the same classroom is explored explicitly
with nested data (Aitkin & Longford, 1986; Raudenbush & Bryk, 1988). Also, the
aggregation bias is avoided because the HLM technique allows investigation of the
effects of a similar phenomenon at more than one level of aggregation (e.g., student SES
and class average SES). Multilevel techniques allow analyses to be conducted
simultaneously at multiple levels of data thereby allowing the partitioning of variance
into within- and between-classroom components. Modeling effects using HLM provides
an effect size estimate that is generally larger and more precise than the estimates from
individual level or classroom level analyses (Raudenbush & Bryk, 1988). However, the

Multilevel Analysis and Curriculum Effectiveness 9
HLM effect size estimates will not be always larger than the individual level or class
level estimates; in some cases it will be smaller (Raudenbush & Bryk, 1988).
Research that has used a multilevel approach to study nested effects of students in
classrooms has successfully used variables such as: teacher attitudes, resources (Marks,
2000; Subedi, 2003), and teacher characteristics (Anderman, Yoon, Roeser, &
Blumenfeld, 1995). However, these studies did not measure traditional content learning
outcomes, using instead outcomes such as student engagement (Marks, 2000) and
learning to value mathematics (Anderman, et al. 1995). Other studies (Nye, Hedges, &
Konstantopoulos, 1999, 2002, 2004; Subedi, 2003) investigated class size effects on
achievement at the kindergarten level and the effects of small class size in early grades
relative to lasting benefits at later grade levels.
However, prior studies that used multilevel techniques to study classrooms appear
to have ignored the classroom context, which might be affected by ethnicity/race,
linguistic, or socioeconomic diversity or the proportion of students receiving special
education services. In other words, the heterogeneity of classrooms has not been
examined as a way of exploring how outcomes can be affected by the diverse
characteristics of the students who help create a ‘classroom context’. However, similar
contextual measures have been modeled at the school level with variables such as
school/class size, percent minority students, and school SES (e.g., Bembry &
Schumacker, 2003; Lee, 2000; Lee & Loeb, 2000). These factors used at the school level
have been shown to have a significant influence on patterns of student achievement.
Curriculum interventions are arguably a natural classroom level variable and
therefore it is important that the classroom context as well as individual characteristics be

Multilevel Analysis and Curriculum Effectiveness 10
considered both within- and between-classrooms when a treatment is being implemented.
Unfortunately, as a classroom variable, the effects of high quality curriculum
interventions may be masked by other classroom context factors when data are analyzed
only at individual level. For example, consider a curriculum experiment in a science
classroom with high percentages of male students that do very poorly when compared to
their few female peers. If the curriculum intervention introduced in this predominately
male environment produces unusual bias acting to depress male performance, then
student level statistical analyses will show a gender effect in favor of females and mask
the problem. It is likely the combined classroom level factors (high male percentage and
curriculum quality) will statistically get absorbed between the curriculum units and
gender variable when data are analyzed at the individual level. The likely effect is a
diluting of the observed effect of the intervention and perhaps enhancing the observed
gender effect in favor of females. Given such possibilities it is increasingly important for
curriculum researchers to grapple with the reality of cross-level modeling among a
variety of variables, but first, variables relevant to classroom effects must be established.
SCALE-uP began to explore classroom variability descriptively after the first
implementations of M&F and Seasons. Classroom mean scores were visually inspected to
consider differences in classroom pretest means, posttest means, and gain. Using M&F as
an example, Figure 1 shows there are differences in pretest scores of treatment and
comparison classrooms, as well as in gain scores across classrooms. The observation of
classroom differences further supported the need to address the nested nature of SCALE-
uP data to provide better effect estimates by modeling classroom context variables.
[Insert Figure 1 here please]
Multilevel Analysis and Curriculum Effectiveness 11
Conceptual Framework
It is important to understand the contexts in which interventions are implemented
and student learning occurs (McDonald, Keesler, Kauffman, & Schneider, 2006). These
classroom contexts can impede or promote student learning because each student is
affected by multiple factors, widely understood to account for variation in student
learning. It is not enough to just look at individual student characteristics to explain the
success or failure of an intervention. There is empirical evidence provided by sociologists
on school- and classroom-level influences that impede or promote student learning (see
McDonald et al., 2006).
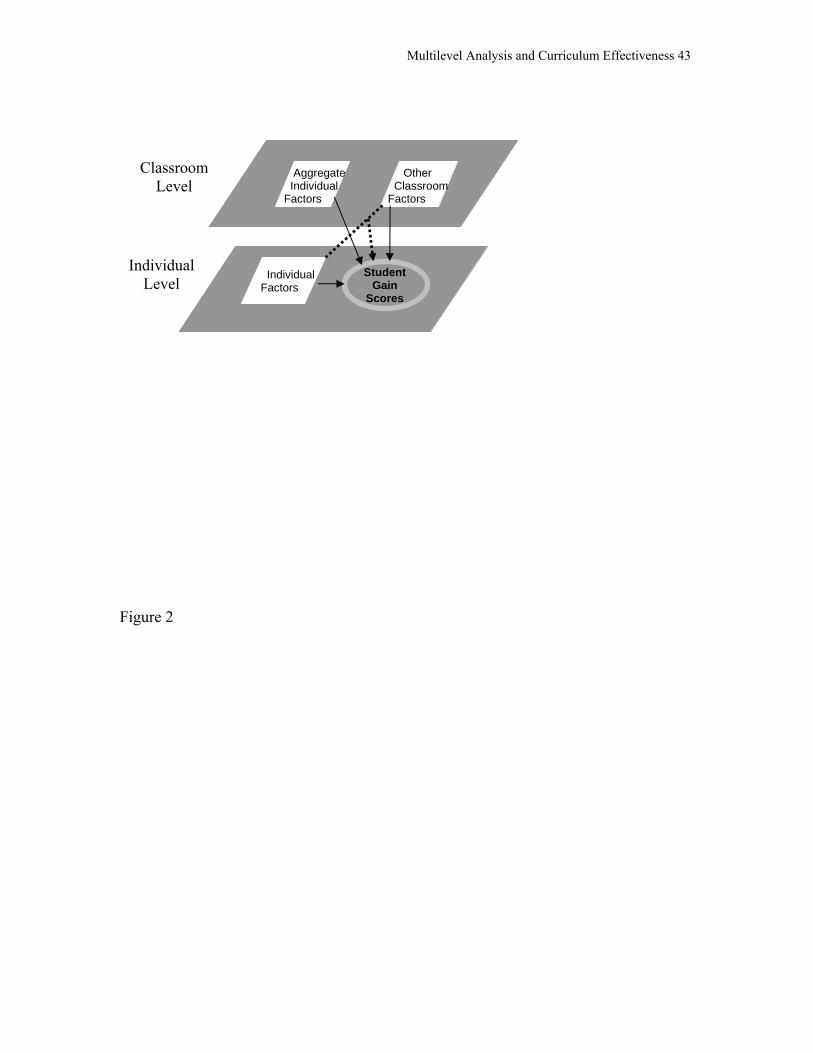
[Insert Figure 2 about here]
A multilevel model is used to guide analyses of individual and classroom context
effects (see Figure 22). The individual level variables in the SCALE-uP data consist of:
SES, language literacy, special education status, ethnicity/race, gender, prior science
GPA, and gain scores for concept understanding. Classroom level variables are:
percentages of low SES, low language literacy, special education status, African
American, Asian American, and Hispanic students. Other classroom factors, curriculum
units and class size, are also used. All of these variables constitute “classroom context”
for this study. Classroom context and classroom level variables will be used
interchangeably in this paper from here on.
Research Questions
Three research questions guide the HLM analyses:
1. Does the curriculum intervention improve student gain scores?
2. Do the curriculum units interact with individual level demographic variables?

Multilevel Analysis and Curriculum Effectiveness 12
3. Which classroom level and individual level variables are statistically significant
predictors of gain score?
Method
SCALE-uP Participants
The participants in the SCALE-uP studies are from a very large suburban school
district in the north-east of the United States. The data analyzed here are from 2,441
grade 6 students (classroom n = 107) and 2,889 grade 7 students (classroom n =111) from
ten large public middle schools. The ten schools were matched on demographic variables,
resulting in five matched pairs of schools. The school district has a student population
that is diverse in ethnicity/race, gender, socioeconomic status (SES), students’ language
literacy, or as having identified disabilities.
SCALE-uP Procedures
In each of the SCALE-up quasi-experiments, schools were selected randomly
from sets of matched pairs to implement the treatment curriculum units, with comparison
schools serving as controls. This current analysis uses data from the grade 6 students
indicated above that used the unit M&F (Harvard Smithsonian Center for Astrophysics,
2001), while the second set is grade 7 students that used Seasons (Lawrence Hall of
Science, 2000) curriculum unit for grade 7 students. The comparison groups in both cases
experienced the regular curriculum offered by the school district, which focused on the
same target ideas. Students in both the treatment and comparison conditions were given a
pretest and posttest using an instrument that measured their understanding of the target
ideas.
Variables for HLM Analysis

Multilevel Analysis and Curriculum Effectiveness 13
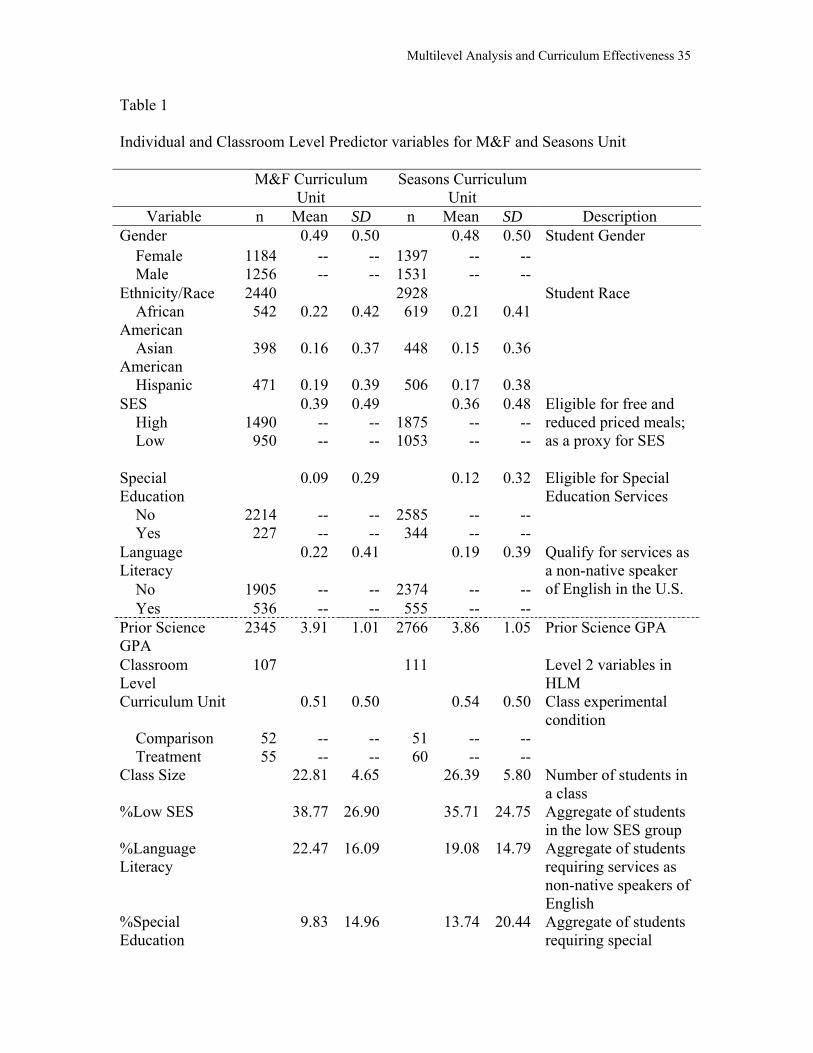
Independent variables. Table 1 lists the individual level variables as well as the
classroom level variables that were employed in the HLM analyses for both M&F and
Seasons studies. All individual level variables, except prior science GPA, were
dichotomous. Table 1 presents the coding of all the variables used in the analyses. SES
and language literacy status were converted to form three level variables into
dichotomous variables (Never = 0 and Prior-Now = 1). Three dummy variables were
created for ethnicity/race (African American was coded 1, others = 0; Asian American =
1, others = 0; Hispanic = 1, others = 0) and White was used as a reference group. ‘White’
was used as a reference group because this group was the largest ethnic/race group in the
school district. Students’ prior science GPA comprised of students’ average science
grades from the two terms prior to the study, in the same year. Grades are awarded on a
five point scale with A = 5 and F = 0. For example, a student with a B in the first quarter
and an A in the second quarter would have a prior science GPA 4.5.
Classroom level variables consisted of aggregated individual level variables (i.e.,
percentages), curriculum unit coded as a dichotomous variable (Treatment = 1,
Comparison = 0), and class size (number of students in each class). These aggregated
variables were the only ones available given the SCALE-uP database, but seem
appropriate for this initial exploration of classroom context.
[Insert Table 1 about here please]
Dependent variable. Gain scores were used as the dependent variable. That is,
pretest scores from the SCALE-uP developed concept assessments (Pyke & Ochsendorf,
2006) were subtracted from posttest scores from the same assessments to yield a measure
of learning for individual students. The assessments are composed of selected and

Multilevel Analysis and Curriculum Effectiveness 14
constructed response items, designed for ease of use in a diverse classroom settings,
using language and illustrations that allow them to be read and understood by a maximum
number of grade 6 (M&F) and grade 7 (Seasons) students. Both the Motion and Forces
and Seasons assessments are narrowly focused curriculum independent assessments,
aligned content standards found in Benchmarks for Science Literacy (AAAS, 1993). The
Motion and Forces assessment consists of 10 items (6 constructed responses and 4
selected responses), that require understanding of forces and motion. The Seasons
assessment consists of 15 items (10 constructed responses and 5 selected responses) that
require understanding of the reasons for Seasons.
HLM as the Multilevel Analysis Technique
Hierarchical linear modeling (HLM) was used to analyze multilevel effects on
outcomes. In the current analyses, both student- and classroom-level sources of
variability in outcomes are simultaneously accounted for by specifying a two-level
hierarchical model to obtain the best estimates of treatment effects. Student demographic
variables (e.g., SES, gender) are modeled at the individual level and fixed at the
classroom level, treating them as covariates to the treatment effect. As fixed, they were
predicted only by an intercept (for comprehensive procedures on HLM analysis, see
Raudenbush & Bryk, 2002). Classroom level controls/covariates (e.g., percentages of
low-SES, language literacy status, African American, etc.) were entered to help reduce
the unexplained variance attributed to the classroom in the outcomes. This technique
helps examine the direct effects of treatment as well as the covariates, modeling both at
the individual and classroom level simultaneously on the outcome variable.
Multilevel Analysis and Curriculum Effectiveness 15
The program HLM, version 6.0.1 (Raudenbusch, Bryk, Cheong, & Congdon,
2004) was employed for data analyses. SPSS, version 12.0.1 was used to enter the
SCALE-uP data to obtain composite variables, and to create the SSM (sufficient statistics
matrix) file for HLM analysis. All the continuous variables at level 1 and level 2 modeled
in this analyses were converted to z-scores (M = 0, SD = 1). The categorical variables
were dummy coded as 0 and 1.
HLM analyses had three stages for this study. The first stage was a fully
unconditional model. According to Raudenbush and Bryk (2002), the fully unconditional
model is the simplest multilevel model and contains no predictor variables from any
level. The fully unconditional model is used to estimate how much variation is attributed
to the classroom level and the individual level. The proportion of variance in the
dependent variable that is found at the classroom level is revealed. According to Lee
(2000), if the proportion of variance that exists at a higher level of aggregation
(classroom level over student level in this case) is more than 10% of the total variance in
the outcome, then it is necessary to consider a multilevel analysis. The analyses in this
paper used these guidelines. The second stage of HLM employed is referred to here as
the final fitted model, the “intercept as outcomes model,” as indicated by Raudenbush
and Bryk (2002).
Effect sizes (ES) are presented as standard deviation (SD) units calculated from
HLM coefficients (ES = coefficient/between-classroom SD). For example, a curriculum
unit coefficient (.24) is divided by the classroom level SD in the unconditional model
(.40) for an ES of .60 (Lee & Loeb, 2000). Because the present multilevel analyses focus
on between-classroom differences, ES results are calculated with the classroom level SD

Multilevel Analysis and Curriculum Effectiveness 16
units, which is the SD of the classroom means. The third and final stage of the HLM
employed a cross-level interaction, that is, an interaction between classroom level
curriculum unit and individual level student demographic variables. Both intercept and
individual level demographic variables were modeled as outcomes in a classroom level
“slopes as outcomes” HLM model.
Results and Discussion
Results from HLM Analysis of First Year of M&F and Seasons Implementation Data Table 1 presents sample sizes and average student and classroom level
demographics. The diversity of classroom characteristics can be seen by observing the
means at the classroom level. The variables are presented in their original metric in the
descriptive analyses.
The results of the fully unconditional HLM analyses are presented in Table 2. The
unconditional model for M&F indicates that the proportion of variance in the individual
gain scores attributed to systematic classroom effects is 16%. The proportion of variance
in the gain score that exists at the individual level is 84%. For M&F it can be concluded
that most of the variance exists between students (84%) (within classrooms) and a
smaller proportion of variance (16%) exists between classrooms. Because the variance at
the higher level is greater than 10%, a multilevel analysis was justified in both cases.
Also included in Table 2 is the classroom SD, which is the SD of the classroom means,
used for ES calculations and reliability, which shows that the student gain scores has an
acceptable lambda reliability. Reliability is concerned with the reliability of group mean
scores (class mean scores) on the outcome (student gain scores).
[Insert Table 2 about here please]
Multilevel Analysis and Curriculum Effectiveness 17
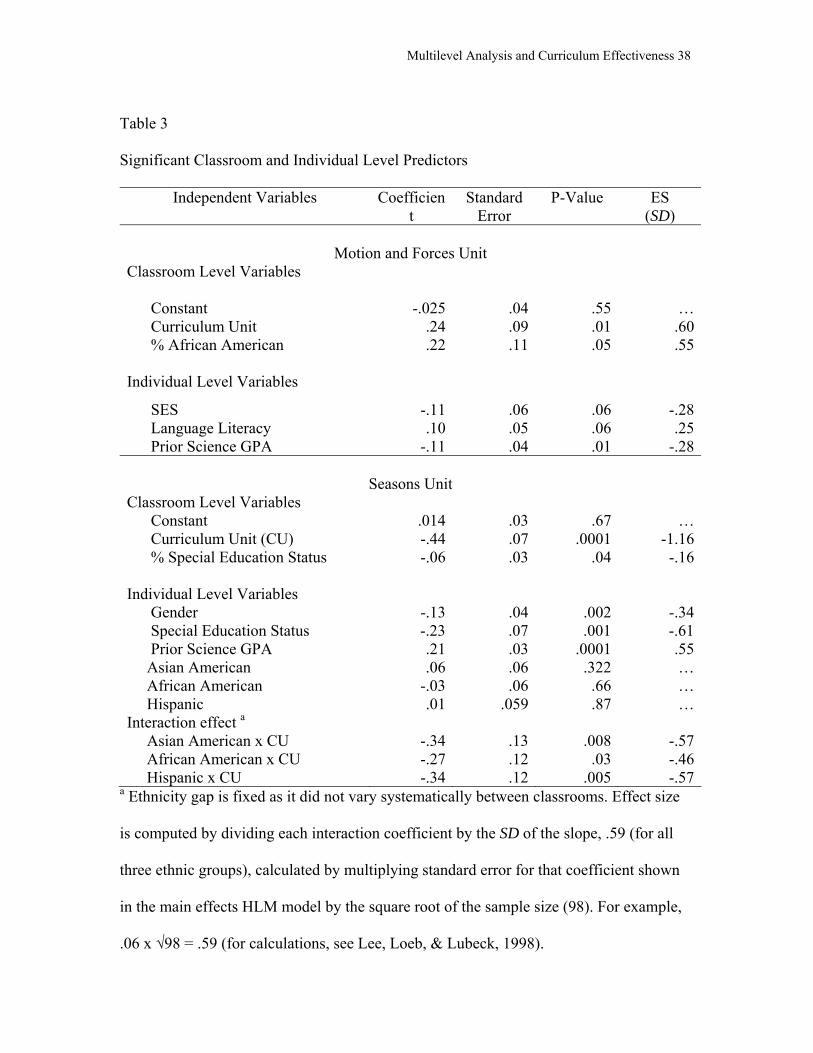
Table 3 presents only statistically significant classroom context and individual
level predictors of student gain scores for M&F and Seasons. Other measures of
classroom context and individual level variables were not statistically significant and are
not presented in Table 3. There was no significant interaction between curriculum units
and individual level demographic variables in M&F data. However, there were
significant cross-level interactions between ethnic/race variables and curriculum units in
the Seasons data.
[Insert Table 3 about here]
Classroom level predictors. M&F will be used as an example to explain/elaborate
on the significant findings of HLM analysis. Two classroom context variables,
curriculum unit and percentage of African American students, had a significant positive
influence on student gain scores. Controlling for other variables in the model, classroom
treatment unit was positively significantly related to the gain score (ES = .60 SD, p<.01).
In other words, students in treatment classrooms were estimated to score 0.60 SD gain
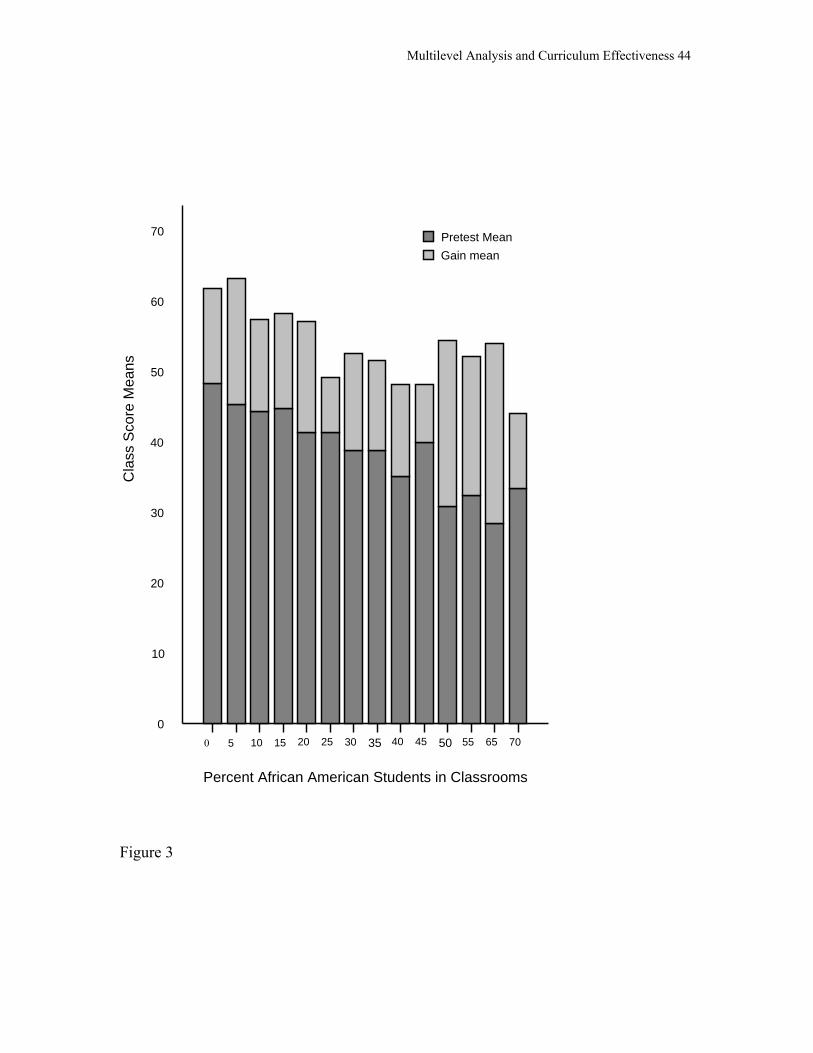
points higher than students in comparison classrooms. Percentage of African American
students in a classroom was related to students’ gain score (ES = 0.55 SD, p<.05). That is,
students in classrooms with a greater percentage of African American students were
estimated to score .55 SD gain points higher than in other classrooms. Further exploratory
analysis revealed that students in both treatment and comparison classrooms containing a
high percentage of African Americans had lower pretest scores (Figure 3).
[Insert Figure 3 about here please]
The percentage of African American students in classrooms ranged from 0-70%
with an average of 22%. There was only one classroom with 70% African American

Multilevel Analysis and Curriculum Effectiveness 18
students with class size of 20 students. A typical classroom with an average of 22%
African American students had class size of 22-27.
Individual level predictors. Controlling for other variables in the HLM model,
SES had a significant negative effect on student gain scores (ES = -.28 SD, p<.06). Low
SES students were estimated to score .28 SD gain points lower than high SES. Language
literacy was marginally significant to gain score (ES = 0.25 SD, p<.06). In other words,
students in language literacy services were estimated to score .25 SD gain points higher
than students who did not require language literacy services. Students’ prior science GPA
was significantly negatively related to gain score (ES = -.28 SD, p<.01). Students who
had a higher prior science GPA scored .28 SD gain points lower than the other students. It
is possible that the students with low prior science GPA come into the classroom with
less knowledge on the unit on M&F and it could be possible that the unit helped increase
their knowledge, thereby increasing student learning in both treatment and comparison
groups. The magnitude3 of effects for classroom level variables was larger than the
individual level variables for M&F curriculum unit. The magnitude of effects for
individual level variables was small to moderate (see Figure 4).
[Insert Figure 4 about here]
Applying HLM and ANCOVA in Curriculum Evaluation Studies
A major difference between the two analyses techniques is the use of multiple
analytic levels for nested (hierarchical) data. ANCOVA uses single level analysis,
whereas HLM is multilevel. One of the purposes of this paper was to compare and
contrast the HLM results with ANCOVA analyses. Multilevel analysis has been
suggested as an alternative to ANCOVA when data are nested. The implications of
Multilevel Analysis and Curriculum Effectiveness 19
results for overall effectiveness of each curriculum unit were the same using both types of
analysis (single level vs. multi level). However, HLM analysis led to different
interpretations of the units’ effects on students by revealing larger effect sizes, significant
classroom level variability, and significant individual and classroom context variables.
The following section provides a detailed account of the contrast between the ANCOVA
and HLM analyses and findings.
Constructing Variables in ANCOVA and HLM
ANCOVA and HLM analyses were applied to similar research questions for both
M&F and Seasons studies: that is, questions about treatment unit effectiveness, and
equity in effects of treatment. However, the conventions of each analysis led to different
formulations of the variables, which obscure direct comparisons. The first critical
difference is in the dependent variable; ANCOVA used posttests with pretest covariates,
whereas HLM used gain scores. Maris (1998) states that if baseline scores are used to
group students, then an ANCOVA approach on posttest scores is preferred. Although, in
the SCALE-uP research design, pretest scores were not used to group students, it was
expected that a matched pair, quasi-experimental design would produce similar pretest
results. In fact, that was the case with no significant differences found in mean pretest
scores for treatment and comparison conditions. Studies have indicated that t-test on the
differences or an ANCOVA partialling out the initial scores is appropriate (for details,
see Wright, 2005). In the study of interactions of pre-existing demographic differences
and the treatment condition, ANCOVA analysis on posttest scores becomes less tenable,
based on the argument above. In such cases, gain score analyses provide a viable
alternative and have been the variable of choice in multilevel analyses (e.g., Lee, 2000;

Multilevel Analysis and Curriculum Effectiveness 20
Odden, Borman, & Fermanich, 2004). However, measurement of change literature
demonstrates the prevalence of the lack of reliability of the difference scores (Cronbach,
& Furby, 1970; Rogosa, & Willett, 1983). Raw gain scores formed by subtracting pretest
scores from posttest scores lead to fallacious conclusions. This is because such scores are
systematically related to any random error of measurement (Cronbach, & Furby, 1970).
There are pragmatic differences in the coding of independent variables as well. In
ANCOVA, gender, special education status and curriculum units were dichotomous
variables. SES and language literacy consisted of three values (never, prior, and now).
Ethnicity/race consisted of four values (African American, Asian American, Hispanic,
and White). Like ANCOVA, HLM analysis used students’ demographic variables, at
student level. Unlike in the ANCOVA analyses, the three values (never, prior, now) on
SES and language literacy were collapsed to form dichotomous variables. Prior- and
now-FARMS were collapsed to form low-SES; and Prior- and now-ESOL were collapsed
to form students requiring language literacy. Ethnicity/race was dummy coded to form
three variables (African American, Asian American, and Hispanic students) and White
was used as a reference group. In addition, HLM also used students’ prior science GPA
as an independent variable that was not included in the ANCOVA model.
M&F Findings: ANCOVA and HLM
Table 4 shows the differences in findings using ANCOVA and HLM analyses for
the M&F unit.
[Insert Table 4 about here please]
Curriculum Effectiveness for M&F. Similar findings were discovered for the
curriculum unit variable using both ANCOVA and HLM approaches. Both analyses
Multilevel Analysis and Curriculum Effectiveness 21
showed that students in the treatment condition scored higher than students in the
comparison condition for M&F. However, multilevel analysis revealed a larger ES with
HLM. The ES increased from .10 (ANCOVA) based on posttest scores to .60 (HLM)
based on gain scores. As can be seen in Figure 1, there are wide variations in the pretest
scores of treatment and comparison groups. The posttest means for the treatment group
are mostly concentrated on the left side.
ANCOVA yielded a significant interaction between curriculum units and some of
the demographic variables for M&F. Treatment were effective for students who were
White, high SES, never in special education, and never in language literacy groups. In
other words, treatment was not as effective for the underserved portion of the population,
although on average students’ scores improved pre- to post-test using the new materials.
However, in the HLM analysis, there was no significant interaction between curriculum
units and individual demographic variables. A possible reason could be that the
multilevel analysis yielded a more precise result, as it takes into account the possible
variations of the effects among varied classroom contexts. HLM also uses both individual
and classroom level variables as controls. ANCOVA results indicated a significant main
effect for gender. Male students scored higher on the posttest achievement than female
students. HLM analysis revealed main effects for language literacy and SES. Students
who required language literacy services gained more points than students who did not
require language literacy services. Students in high SES group gained more than students
in the low SES group. Prior science GPA was not used in the ANCOVA analysis (Table
4). In the HLM analysis, the only classroom-context variable that was positive and
significant was percentage of African American students in a classroom.

Multilevel Analysis and Curriculum Effectiveness 22
Seasons Findings: ANCOVA and HLM
Table 5 shows the differences in findings using ANCOVA and HLM analyses for
the Seasons unit.
[Insert Table 5 about here please]
Curriculum Effectiveness for Seasons. Similar findings were discovered for
curriculum unit variable using both ANCOVA and HLM approaches. Both methods
showed that students in the Seasons treatment condition scored lower than students in the
comparison condition. However, multilevel analysis revealed a larger ES. The ES
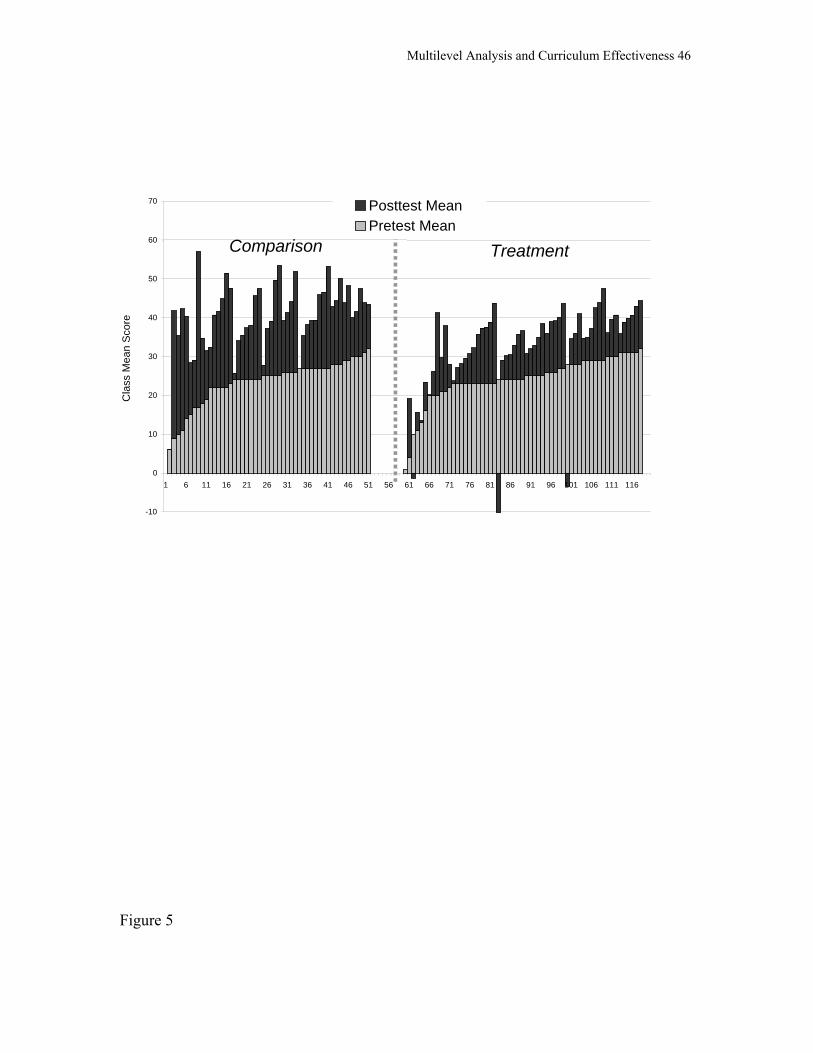
increased from -.36 (ANCOVA) to -1.16 (HLM). As seen in Figure 5, students in
comparison classrooms had greater mean pretest scores compared to treatment
classrooms. Posttest means were also greater for comparison classrooms than for
treatment.
[insert Figure 5 about here]
For Seasons, ANCOVA analysis yielded a significant interaction between
curriculum units and special education status. Students not eligible for special education
services scored higher at posttest than students eligible for special education in the
comparison condition. For HLM analyses there was a significant interaction between
ethnic/race group and curriculum units. ANCOVA results indicated a significant main
effect for language literacy and SES. Students in high SES group and students who did
not require language literacy scored higher on posttest than students in the low SES group
or students requiring language literacy services. Asian American and White students
achieved more than African American and Hispanic students. In HLM analysis, students’
gender and special education status had significant influence on gain scores: for Seasons,

Multilevel Analysis and Curriculum Effectiveness 23
male students had greater gains than female students. Students not eligible for special
education services gained more than students in the special education status. Students’
prior science GPA yielded a significant positive effect on gain score in HLM. This
variable was not used in the ANCOVA analysis (see Table 5). The only significant
classroom-context variable was the percentage of special education students. Classrooms
with higher percentage of special education students showed lower gain scores.
Summary
Though similar results are reported by ANCOVA and HLM for effectiveness of
curriculum units, different outcome variables were used (posttest scores for ANCOVA
vs. gain scores for HLM). Even though the curriculum unit variable using ANCOVA
yielded the same result as HLM, there were differences in effect sizes between the two
approaches. For the M&F unit, the ES increased from .10 (ANCOVA) to .60 (HLM). For
the Seasons curriculum, the ES increased from -.36 (ANCOVA) to -1.16 (HLM). We
also conducted ANOVA analysis on gain to examine whether the difference in results,
especially for the curriculum unit was due to the different outcomes used; the ANOVA
results indicated an ES of .14 for M&F and -.42 for Seasons. These effect sizes were not
much different from ES from ANCOVA. As indicated by Raudenbush & Bryk (1988)
HLM effect size estimates will not be always larger than the individual level estimates; in
some cases it will be smaller. However, the HLM analyses provides a more precise effect
size as it uses simultaneously both individual and classroom level variables as controls.
Also, HLM helps the researcher measure and examine the effects of the intervention on
individual students’ learning, while accounting for possible variation of the effects among
varied classroom context. Even though there are many advantages of using HLM, the
Multilevel Analysis and Curriculum Effectiveness 24
SCALE-uP researchers found it difficult to communicate the HLM findings to the
stakeholders who are the school and district personnel who are not trained in
sophisticated statistical methodology. Consistent results for the overall significance and
direction of the effects of the units did not suggest an advantage for HLM over
ANCOVA for evaluative decisions and prescriptions for scaling-up the units. Both
analyses suggested that curriculum effects are complicated by various factors. The one
advantage of HLM was that it highlighted the moderating role of classroom context
effects and that researchers should be concerned with classroom-based composition,
status, and instructional variables as they implement and study new curriculum.
Conclusions and Future Research
This paper explores HLM analyses to determine simultaneous individual level and
classroom context effects for two science curriculum units on student learning. This
paper also presents results of two different statistical methodologies, HLM and
ANCOVA. Each methodology yielded similar findings in terms of statistical significance
of effects attributed to curriculum unit differences. Because there is no well-known
formula for empirically comparing the calculated effect sizes from HLM and ANCOVA,
interpreting the differences is left to standards set in the literature that suggest the HLM
effects reported here are large (Lee & Loeb, 2000; Rosenthal & Rosnow, 1984) and the
ANCOVA effects are more moderate to small (Cohen, 1988). However, without more
mathematical comparisons of effect sizes, the authors do not claim that one approach is
better than the other based on the magnitude of the effects calculated and standards set
for each analyses type. We do conclude that because HLM results do provide more
precise estimations of effects, as it controls for variables at individual level and classroom
Multilevel Analysis and Curriculum Effectiveness 25
levels, the pattern in results is perhaps a better indication of the complexity of a
curriculum’s effects. Because the goal of this paper was to examine classroom-context
effects to obtain a precise ES estimates for curriculum evaluation research, HLM does
seem to be a useful tool. The noteworthy fact that 16% and 14% (M&F and Seasons,
respectively) of the variance in the outcome was attributed between classrooms supports
the need to attend more directly to measurement and analyses of classroom contextual
factors in curriculum evaluation research. Future research need to report the variance
explained by the full model which was beyond the scope of this paper.
Elaborating on the need for more research, this work also shows that secondary
data analyses may not be a good substitute for studies intentionally designed to test
multilevel hypotheses. In the present HLM analysis, the few classroom context variables
used were derived from individual level variables rather than as measured variables
determined a priori according to a prescribed theoretical model. A model with a plan for
nested measures would have collected classroom/school context data and not necessitated
computation of these variables. Adding variables such as classroom resources, teacher
characteristics, etc., might account better for variations in student outcomes. However,
given the limitations in the current analyses, we conclude that the advantages of using
HLM outweigh the limitations of secondary analysis when data are nested. Researchers
and evaluators of curriculum effectiveness studies should not feel they have to make a
choice between the individual versus contextual level of analysis. Given a reason,
theoretical or empirical, to suggest multilevel hypotheses, HLM conceptually and
structurally addresses a nested data structure. HLM also allows modeling of cross-level
interactions. For example, it permits asking questions about how a treatment enacted at

Multilevel Analysis and Curriculum Effectiveness 26
the classroom level interacts with student backgrounds and learning. In a single level
analysis, if classroom context influences the relationships between students’
characteristics and their outcomes, it is likely that the data will violate the assumption of
homogeneity of regression required for the analysis of covariance (cf. Kirk, 1982, Chap.
14; Winer, 1971, Chap. 10). In such a case, a single-level approach is indefensible
because it leads to invalid inference about treatment effects (Raudenbush & Bryk, 1988,
p.433).
In more general terms, hierarchical, or nested, data structures are common
throughout many social science and other research fields. This paper highlighted the
utility of a relatively new statistical analytic methodology, HLM, which is most pertinent
for conducting studies of multilevel effects in an educational context. The emergence of
HLM and its proven utility here support the conclusion that it is not appropriate to ignore
classroom contexts in studies where students are nested within dynamic classroom
settings. The HLM results presented here demonstrate that classroom context can have a
major influence on students’ outcome measures. Researchers studying classroom/school
contexts or using nested data structures need to be aware of these issues and ideally
should think about how to work with them as they design the experiment, something that
SCALE-uP did not do at the outset of the study. Using a 3-level analysis, including
school level variables, may provide an even better model than the 2-level model
employed here. School level could not be modeled for this study because the number of
schools was limited to only ten; to model school level analysis, Kreft (1996) recommends
a minimum of 30 schools.
Multilevel Analysis and Curriculum Effectiveness 27
Extensive future research is needed to determine under what conditions HLM is
the best analytic method to use and when it might yield improved results on existing data
over ANCOVA analyses. Exploring prior individual studies through meta-analysis
comparing the findings of different analytic techniques may increase insight into the best
practice uses of hierarchical and single level techniques. Future research should begin to
catalog and index individual and classroom context factors that contribute to student
learning, creating a warrant for using multilevel analytic techniques.
Finally, implications for researchers and evaluators are that they ought to plan at
the outset of a study how they will structure their study to include nested variables, and
which variables will be included based on a theory, or conceptual framework. Research
planning with HLM in mind can facilitate data collection at different levels, especially
higher levels (e.g., classroom, school, district, etc.). A three level HLM model may better
capture important within- and between- classroom, teacher or school influences and could
be used to better understand curriculum effects on student learning.

Multilevel Analysis and Curriculum Effectiveness 28
References
Aitkin, M., Anderson, D., & Hinde, J. (1981) Statistical modeling of data on teaching styles. Journal of the Royal Statistical Society, Series A, 144 (4), 419-461.
Aitkin, M. & Longford, N. (1986) Statistical modeling issues in school effectiveness
studies. Journal of Royal Statistical Society:A, 149, 1-43. American Association for the Advancement of Science (1993) Benchmarks for Science
Literacy. New York: Oxford University Press. American Association for the Advancement of Science (2001) AAAS Science Textbooks
Conference. [Computer software]. Washington, DC: AAAS. American Psychological Association (2001) Publication manual of the American
Psychological Association (5th ed.). Washington DC: Author. Anderman, E.M., Yoon, K. S., Roeser, R. W., & Blumenfeld, P. (1995, March) Learning to value Mathematics: Individual differences and classroom effects. Paper presented at the annual meeting of the Society for Research in Child
Development. Bembry, K. L., & Schumacker, R. E. (2003, April) Investigating classroom effectiveness
measure over time. Paper presented at the Annual meeting of the American Educational Research Association. San Diego, California.
Cohen, J. (1988) Statistical power analysis for the behavioral sciences (2nd ed.).
Hillsdale, NJ: Lawrence Erlbaum Associates. Cook, T.D. (2002). Randomized experiments in educational policy research: A critical
examination of the reasons the educational evaluation community has offered for not doing them. Educational Evaluation and Policy Analysis, 24(3), 175-199.
Cronbach, L. J., & Furby, L. (1970). We should measure “change” –or should we? Psychological Bulletin, 74 (1), 68-80. Goldstein, H. (1997) Methods in school effectiveness research. School Effectiveness and School Improvement, 8, 369-395. Harvard Smithsonian Center for Astrophysics (2001) ARIES-Exploring Motion and
Forces: Speed, Acceleration, and Friction. Watertown, MA: Charlesbridge Publishing
Kirk, R. E. (1982) Experimental design: Procedures for the behavioral sciences (2nd ed.). Belmont, CA: Brooks/Cole.
Multilevel Analysis and Curriculum Effectiveness 29
Kreft, I. G. G. (1996) Are multilevel techniques necessary? An overview, including simulation studies. Unpublished manuscript, California State University, Los
Angeles, CA. Lawrence Hall of Science (LHS) (2000). Great Explorations in Math and Science
(GEMS): The real reasons for Seasons: Sun-Earth connections, Berkeley, CA: The Regents of the University of California at Berkeley.
Lederman, N.G., & Flick, L.B. (2005) Beware of the unit of analysis: It may be you!!
School Science and Mathematics, 105 (8), 381-383. Lee, V. E. (2000) Using Hierarchical Linear Modeling to study social contexts: The case
of school effects. Educational Psychologist, 35 (2), 125-141.
Lee, V. E., Loeb, S., & Lubeck, S. (1998) Contextual effects of prekindergarten classrooms for disadvantaged children on cognitive development: The case of chapter 1. Child Development, 69 (2), 479-494. Lee, V. E., & Loeb, S. (2000) School size in Chicago elementary schools: Effects on
teachers’ attitudes and students’ achievement. American Educational Research Journal, 37 (1), 3-31.
Lynch, S., Kuipers, J., Pyke, C., & Szesze, M. (2005). Examining the effects of a highly rated science curriculum unit on diverse populations: Results from a planning grant. Journal of Research in Science Teaching, 42 (8), 912-946. Lynch, S., Taymans, J., Watson, W., Ochsendorf, R., Pyke, C., & Szesze, M. (2007). Effectiveness of a highly-rated science curriculum unit for students with disabilities in general education classrooms. Exceptional Children, 73 (2), 202- 223. Maris, E. (1998) Covariance adjustment versus gain scores-Revisited. Psychological
Methods, 3 (3), 309-327. Marks, H. M. (2000) Student engagement in instructional activity: Patterns in the elementary, middle, and high school years. American Educational Research Journal, 37 (1), 153-184. McDonald, S.-K., Keesler, V. A., Kauffman, N. J., & Schneider, B. (2006) Scaling-Up
Exemplary Interventions. Educational Researcher, 35 (3), 15-22. Nye, B., Hedges, L. V., & Konstantopoulos, S. (1999) The long-term effects of small
classes: A five-year follow-up of the Tennessee class size experiment. Educational Evaluation and Policy Analysis, 21 (2), 127-142.
Nye, B., Hedges, L. V., & Konstantopoulos, S. (2002) Do low-achieving students benefit
Multilevel Analysis and Curriculum Effectiveness 30
more form small classes? Evidence from the Tennessee class size experiment. Educational Evaluation and Policy Analysis, 24 (3), 201-217.
Nye, B., Hedges, L. V., & Konstantopoulos, S. (2004) Do minorities experience larger
benefits from small classes? The Journal of Educational Research, 98 (2), 94-100. Odden, A., Borman, G., & Fermanich, M. (2004) Assessing teacher, classroom, and
school effects, including fiscal effects. Peabody Journal of Education, 79 (4), 4- 32.
O'Donnell, C., Watson, W., Pyke, C., Lynch, S. (2006, April) Using the Project 2061 Curriculum Analysis to understand the results of a quasi-experimental curriculum unit evaluation of Seasons. Paper presented at the Annual Meeting of the National Association for Research in Science Teaching, San Francisco, CA.
Ochsendorf, R., Lynch, S., & Pyke, C. (2006) Evaluating a science curriculum unit: Learning through the process. Manuscript in preparation.
Pyke, C., Lynch, S., Kuipers, J., Szesze, M., & Watson, W. (2004).Implementation study of The Real Reasons for Seasons (2003-2004): SCALE-uP Report No. 4. Washington, DC: George Washington University, SCALE-uP.
Pyke, C., Lynch, S., Kuipers, J., Szesze, M., & Watson, W. (2004). Implementation study of Exploring Motion and Forces (2003-2004): SCALE-uP Report No. 5. Washington, DC: George Washington University, SCALE-uP.
Pyke, C., & Ochsendorf, R. (2006, April) Concept assessment in curriculum unit evaluation. Paper presented at the Annual Meeting of the American Educational Research Association, San Francisco, CA. Raudenbush, S. W., Bryk, A. S., Cheong, Y. F., & Congdon, R. T. (2004) HLM:
Hierarchical Linear and Nonlinear Modeling, Chicago: Scientific Software International, Inc.
Raudenbush, S. W., Bryk, A. S. (2002) Hierarchical Linear Models: Applications and
data analysis methods (2nd ed.). Thousand Okas, CA: Sage Publications.
Raudenbush, S. W. & Bryk, A.S. (1988) Methodological advances in studying effects of classrooms and schools on student learning. Review of Research in Education, 1988-1989 edition, 15, 423-476.
Rogosa, D. R., & Willett, J. B. (1983). Demonstrating the reliability of the difference score in the measurement of change. Journal of Educational Measurement, 20 (4), 335-343. Rosenthal, R., & Rosnow, R. L. (1984) Essentials of behavioral research: Methods and
Multilevel Analysis and Curriculum Effectiveness 31
data analysis. New York: McGraw Hill. Rowe, K. J., Hill, P. W. & Holmes-Smith, P. (1995) Methodological issues in educational performance and school effectiveness research: a discussion with worked examples. Australian Journal of Education, 39, 217-248. Rowe, K. J., & Hill, P. W. (1998) Modeling educational effectiveness in classrooms: The
use of multi-level structural equations to model student’s progress. Educational Research and Evaluation, 4 (4), 307-347.
State of Michigan. (1993) Chemistry That Applies, Lansing, MI: Author. Subedi, B. R. (2003) Factors influencing high school student achievement in Nepal. International Education Journal, 4 (2), 98-107. Winer, B. J. (1971) Statistical principles in experimental design. New York: McGraw Hill. Wrigth, D. B. (2005) Comparing groups in a before-after design: When t test and
ANCOVA produce different results. British Journal of Educational Psychology, 1-13. On WWW at http://www.sussex.ac.uk/Users/danw/pdf/draftlord.pdf. Accessed on March 5, 2005.
Multilevel Analysis and Curriculum Effectiveness 32
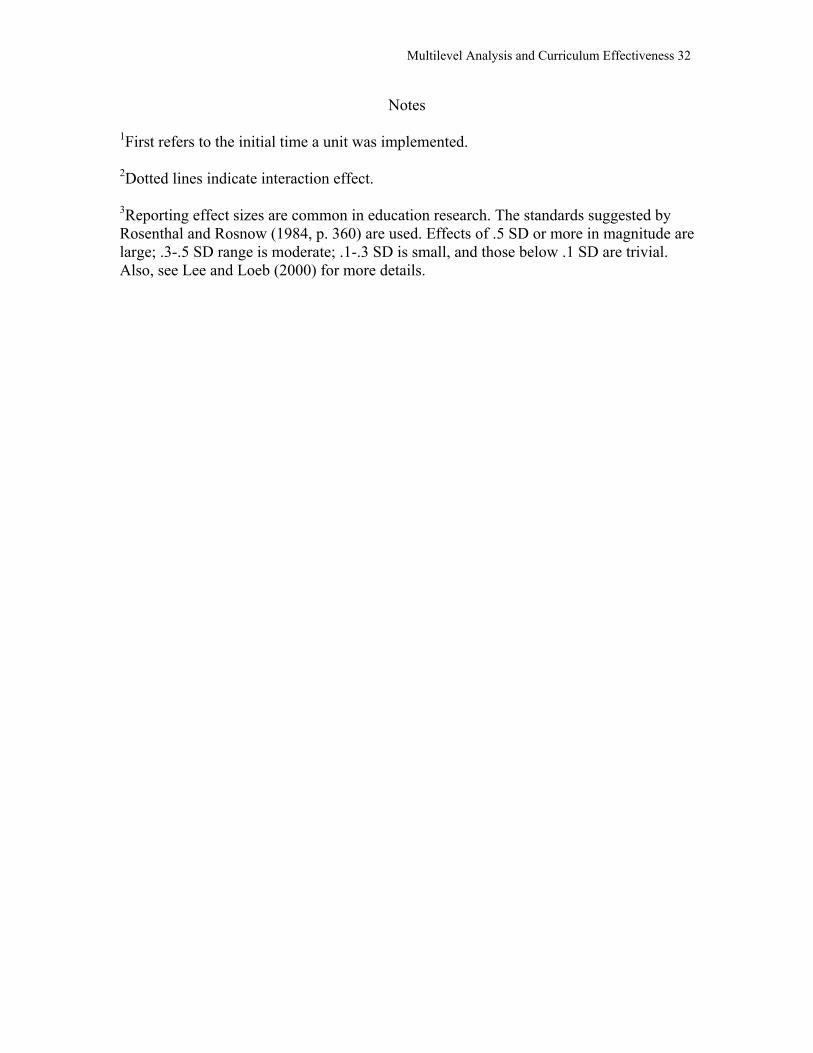
Notes 1First refers to the initial time a unit was implemented. 2Dotted lines indicate interaction effect. 3Reporting effect sizes are common in education research. The standards suggested by Rosenthal and Rosnow (1984, p. 360) are used. Effects of .5 SD or more in magnitude are large; .3-.5 SD range is moderate; .1-.3 SD is small, and those below .1 SD are trivial. Also, see Lee and Loeb (2000) for more details.

Multilevel Analysis and Curriculum Effectiveness 33
Appendix A Curriculum effect sizes for all levels of Independent Variables for the Motions and Forces Assessment. __________________________________________________________________ Variable n d 95% CI FB FW __________________________________________________________________ Gender 8.36* Male 1108 0.12 0.00 to 0.24 4.69 Female 1064 0.08 -0.04 to 0.20 1.99 Ethnicity 29.28* African American 486 -0.04 -0.22 to 0.14 0.30 Asian American 354 0.17 -0.04 to 0.38 2.97 Hispanic 394 -0.10 -0.30 to 0.10 1.11 White 938 0.21 0.08 to 0.34 12.90* FARMS 48.87* Never 1349 0.23 0.12 to 0.34 21.76* Prior 248 -0.08 -0.33 to 0.17 0.45 Now 575 -0.10 -0.26 to 0.06 1.73 ESOL 32.19* Never 1717 0.12 0.02 to 0.22 7.14 Prior 309 -0.16 -0.38 to 0.06 1.03 Now 146 0.26 -0.07 to 0.59 3.04 SPED 21.80* No 1977 0.13 -0.04 to 0.22 9.77* Now 195 -0.20 -0.47 to 0.07 2.28 __________________________________________________________________ Note. d = Cohen’s d effect size; CI = Confidence Interval; FB = test of between group differences; FW = test of within group differences (treatment vs. comparison). *p < .05. Data from Pyke, C., Lynch, S., Kuipers, J., Szesze, M., & Watson, W. (2004 b) available at http://www.gwu.edu/~scale-up/

Multilevel Analysis and Curriculum Effectiveness 34
Appendix B Curriculum effect sizes for all levels of Independent Variables for RSA. __________________________________________________________________ Variable n d 95% CI FB FW __________________________________________________________________ Gender 1.24 Male 1241 -0.36 -0.39 to -0.29 51.86 Female 1128 -0.38 -0.44 to -0.32 58.28 Ethnicity 44.94* African American 482 -0.34 -0.43 to -0.25 20.09 Asian American 369 -0.51 -0.61 to -0.41 35.94 Hispanic 407 -0.44 -0.53 to -0.35 31.31 White 1111 -0.27 -0.33 to -0.21 31.85 FARMS 74.28* Never 1556 -0.34 -0.39 to -0.29 69.92 Prior 282 -0.38 -0.49 to -0.27 15.52 Now 531 -0.44 -0.52 to -0.36 39.22 ESOL 20.13* Never 1929 -0.36 -0.40 to -0.32 91.67 Prior 314 -0.39 -0.50 to -0.28 17.34 Now 126 -0.38 -0.55 to -0.21 6.64 SPED 65.38* No 2090 -0.38 -0.42 to -0.34 114.95* Now 279 -0.06 -0.18 to +0.06 0.34 __________________________________________________________________ Note. d = Cohen’s d effect size; CI = Confidence Interval; FB = test of between group differences; FW = test of within group differences (treatment vs. comparison). *p < .05. Data from Data from Pyke, C., Lynch, S., Kuipers, J., Szesze, M., & Watson, W. (2004 a) available at http://www.gwu.edu/~scale-up/
Multilevel Analysis and Curriculum Effectiveness 35
Table 1 Individual and Classroom Level Predictor variables for M&F and Seasons Unit M&F Curriculum
Unit Seasons Curriculum
Unit
Variable n Mean SD n Mean SD Description Gender 0.49 0.50 0.48 0.50 Student Gender Female 1184 -- -- 1397 -- -- Male 1256 -- -- 1531 -- -- Ethnicity/Race 2440 2928 Student Race African American
542 0.22 0.42 619 0.21 0.41
Asian American
398 0.16 0.37 448 0.15 0.36
Hispanic 471 0.19 0.39 506 0.17 0.38 SES 0.39 0.49 0.36 0.48 High 1490 -- -- 1875 -- -- Low 950 -- -- 1053 -- --
Eligible for free and reduced priced meals; as a proxy for SES
Special Education
0.09 0.29 0.12 0.32
No 2214 -- -- 2585 -- -- Yes 227 -- -- 344 -- --
Eligible for Special Education Services
Language Literacy
0.22 0.41 0.19 0.39
No 1905 -- -- 2374 -- -- Yes 536 -- -- 555 -- --
Qualify for services as a non-native speaker of English in the U.S.
Prior Science GPA
2345 3.91 1.01 2766 3.86 1.05 Prior Science GPA
Classroom Level
107 111 Level 2 variables in HLM
Curriculum Unit 0.51 0.50 0.54 0.50 Class experimental condition
Comparison 52 -- -- 51 -- -- Treatment 55 -- -- 60 -- -- Class Size 22.81 4.65 26.39 5.80 Number of students in
a class %Low SES 38.77 26.90 35.71 24.75 Aggregate of students
in the low SES group %Language Literacy
22.47 16.09 19.08 14.79 Aggregate of students requiring services as non-native speakers of English
%Special Education
9.83 14.96 13.74 20.44 Aggregate of students requiring special
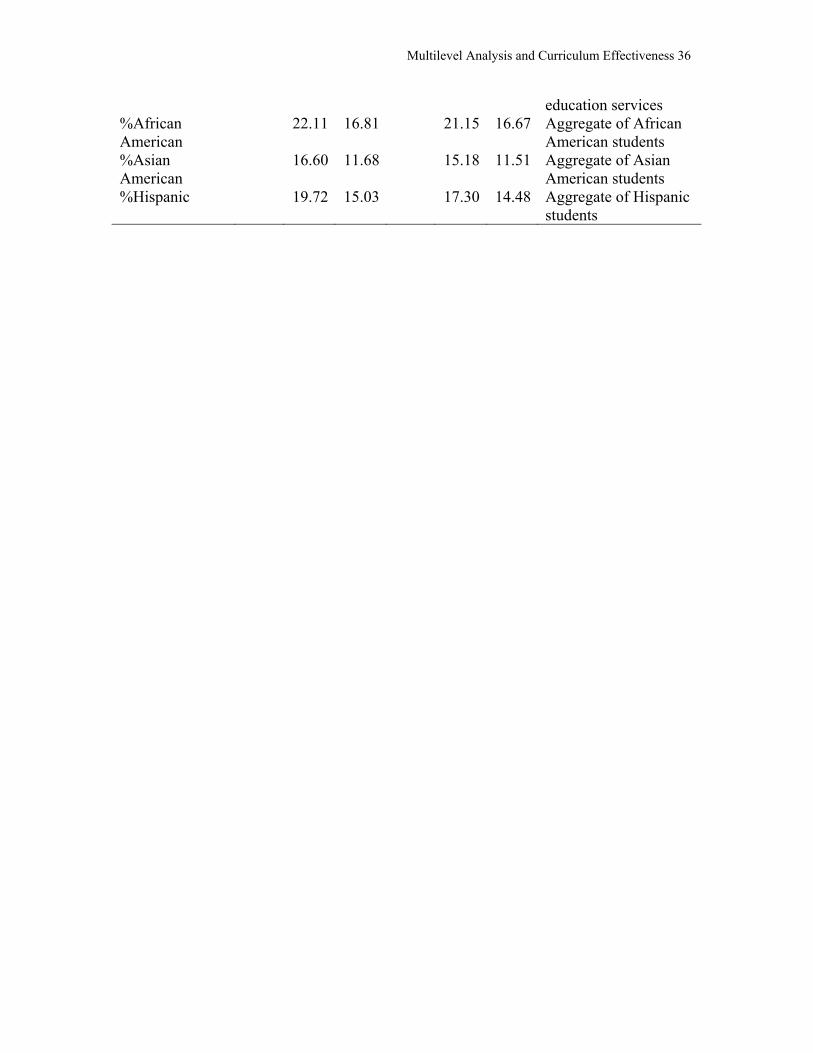
Multilevel Analysis and Curriculum Effectiveness 36
education services %African American
22.11 16.81 21.15 16.67 Aggregate of African American students
%Asian American
16.60 11.68 15.18 11.51 Aggregate of Asian American students
%Hispanic 19.72 15.03 17.30 14.48 Aggregate of Hispanic students

Multilevel Analysis and Curriculum Effectiveness 37
Table 2
Fully Unconditional HLM Model for M&F and Seasons Units
DV: Student Gain Scores
M&F Seasons
Within-classroom variance (sigma squared) .84 .86 Between-classroom variance (tau) .16 .14 Between-classroom SD .40 .38 Reliability (lambda) .78 .76 Intraclass correlationa .16 .14 aThe intraclass correlation is the proportion of total variance in the outcome that lies systematically between classrooms. It is computed as follows: ICC = tau/(tau + sigma squared).
Multilevel Analysis and Curriculum Effectiveness 38
Table 3
Significant Classroom and Individual Level Predictors
Independent Variables Coefficient
Standard Error
P-Value ES (SD)
Motion and Forces Unit
Classroom Level Variables
Constant -.025 .04 .55 … Curriculum Unit .24 .09 .01 .60 % African American
.22 .11 .05 .55
Individual Level Variables
SES -.11 .06 .06 -.28 Language Literacy .10 .05 .06 .25 Prior Science GPA -.11 .04 .01 -.28
Seasons Unit
Classroom Level Variables Constant .014 .03 .67 … Curriculum Unit (CU) -.44 .07 .0001 -1.16 % Special Education Status
-.06 .03 .04 -.16
Individual Level Variables Gender -.13 .04 .002 -.34 Special Education Status -.23 .07 .001 -.61 Prior Science GPA .21 .03 .0001 .55 Asian American .06 .06 .322 … African American -.03 .06 .66 … Hispanic .01 .059 .87 …Interaction effect a Asian American x CU -.34 .13 .008 -.57 African American x CU -.27 .12 .03 -.46 Hispanic x CU -.34 .12 .005 -.57
a Ethnicity gap is fixed as it did not vary systematically between classrooms. Effect size
is computed by dividing each interaction coefficient by the SD of the slope, .59 (for all
three ethnic groups), calculated by multiplying standard error for that coefficient shown
in the main effects HLM model by the square root of the sample size (98). For example,
.06 x √98 = .59 (for calculations, see Lee, Loeb, & Lubeck, 1998).

Multilevel Analysis and Curriculum Effectiveness 39
Table 4. Findings between ANCOVA and HLM analyses: M&F
Effects Variables ANCOVA (posttest) HLM (gain scores)
Individual Level Gender Males > Females - Ethnicity Interaction - SES Interaction High > Low SES Special Education Status Interaction - Language Literacy No > Yes Yes > No Prior Science GPA NA High GPA => Low Gain Curriculum Unit Treat > Comp NA Classroom level Curriculum Unit NA Treat > Comp Class size NA - %Low SES NA - %Language Literacy NA - %Special Education NA - %African American NA High % => Higher Gain %Asian American NA - %Hispanic NA - %White NA -

Multilevel Analysis and Curriculum Effectiveness 40
Table 5. Findings between ANCOVA and HLM analyses: Seasons
Effects Variables ANCOVA (posttest) HLM (gain scores)
Individual Level Gender - Males > Females Ethnicity Asian American
&White > Af. Am & Hispanic
Interaction
SES High > Low SES - Special Education Status Interaction No > Yes Language Literacy No > Yes - Prior Science GPA NA Low GPA => Low Gain Curriculum Unit Comp > Treat NA Classroom Level Curriculum Unit NA Comp > Treat Class size NA - %Low SES NA - %Language Literacy NA - %Special Education NA High % => Lower Gain %African American NA - %Asian American NA - %Hispanic NA - %White NA -

Multilevel Analysis and Curriculum Effectiveness 41
Figure Captions Figure 1. Class Mean Scores for M&F Figure 2. Individual and Classroom Level Factors that Influences Student Gain Scores Figure 3. Variability in Gain Score Means for African American Students Figure 4. Factors that Influence Student Gain Scores in M&F in First Year of Implementation Figure 5. Class Mean Scores for Seasons

Multilevel Analysis and Curriculum Effectiveness 42
Figure 1
-10
0
10
20
30
40
50
60
70
80
90
1 5 9 13 17 21 25 29 33 37 41 45 49 53 57 61 65 69 73 77 81 85 89 93 97 101 105 109 113
Cla
ss M
ean
Sco
re
Posttest MeanPretest Mean
TreatmentComparison
Multilevel Analysis and Curriculum Effectiveness 43
Figure 2
StudentGain
Scores
Classroom
Level
Individual Level
Aggregate Individual Factors
Other Classroom Factors
Individual Factors
Multilevel Analysis and Curriculum Effectiveness 44
Figure 3
0 5 10 15 20 25 30 35 40 45 50 55 65 70
Percent African American Students in Classrooms
0
10
20
30
40
50
60
70 Pretest MeanGain mean
C
lass
Sco
re M
eans

Multilevel Analysis and Curriculum Effectiveness 45
Figure 4
Classroom Level
Individual Level
CurriculumUnit
SES
Lang. Literacy
%African
Prior Sc. GPA
.60 .55
-.28
.25
-.28
StudentGain
Scores
Multilevel Analysis and Curriculum Effectiveness 46
Figure 5
-10
0
10
20
30
40
50
60
70
1 6 11 16 21 26 31 36 41 46 51 56 61 66 71 76 81 86 91 96 101 106 111 116
Posttest MeanPretest Mean
TreatmentComparison
Cla
ss M
ean
Sco
re

Multilevel Analysis and Curriculum Effectiveness 47
Top Related