


Languages
Pages
Legal


EUR 23560 EN - 2008
Validation of an Analytical Method toDetermine the Content of T-2 and HT-2
Toxins in Cereals and Compound AnimalFeed by Immunoaffinity Column Clean-up
and GC-MS
RESULTS OF THE COLLABORATIVE STUDY
A. BREIDBACH, V. POVILAITYTE, C. MISCHKE, I. DONCHEVA, H. van EGMOND, J. STROKA

The mission of the IRMM is to promote a common and reliable European measurement system in support of EU policies. European Commission Joint Research Centre Institute for Reference Materials and Measurements Contact information Address: Retieseweg 111, 2440 Geel, Belgium E-mail: [email protected] Tel.: +32 14 571 205 Fax: +32 14 571 783 http://irmm.jrc.ec.europa.eu/ http://www.jrc.ec.europa.eu/ Legal Notice Neither the European Commission nor any person acting on behalf of the Commission is responsible for the use which might be made of this publication.
Europe Direct is a service to help you find answers to your questions about the European Union
Freephone number (*):
00 800 6 7 8 9 10 11
(*) Certain mobile telephone operators do not allow access to 00 800 numbers or these calls may be billed.
A great deal of additional information on the European Union is available on the Internet. It can be accessed through the Europa server http://europa.eu/ EUR 23560 EN ISBN 978-92-79-10532-6 ISSN 1018-5593 DOI 10.2787/93811 Luxembourg: Office for Official Publications of the European Communities © European Communities, 2008 Reproduction is authorised provided the source is acknowledged Printed in Belgium

VALIDATION OF AN ANALYTICAL METHOD
to
Determine the Content of T-2 and HT-2 toxins in Cereals and Compound Animal Feed
by
Immunoaffinity Column Clean-up and GC-MS
RESULTS OF THE COLLABORATIVE STUDY
A. BREIDBACH1, V. POVILAITYTE1, C. MISCHKE1, I. DONCHEVA1, H. van EGMOND2, J. STROKA1
1European Commission, Joint Research Centre, Institute for Reference Materials and Measurements, Geel, Belgium 2 National Institute for Public Health & the Environment, Bilthoven, the Netherlands

2
Contents
Section Page
Abstract............................................................................................................................3 Introduction .....................................................................................................................4 Materials and methods ..................................................................................................5 Test materials for the collaborative study........................................................................5 Homogeneity of the Test Materials and In-House Method Performance........................7 Statistical evaluation:.......................................................................................................9 Design of the collaborative study ..................................................................................10 Results of the collaborative study and Discussion ........................................................13 Conclusions ...................................................................................................................25 References: ...................................................................................................................26 Annex I-VI..……..…………………………………………………………………… 27

3
Abstract
A method for the determination of T-2 toxin and HT-2 toxin in cereals and compound
animal feed was validated by collaborative study.
In short, the method is as follows: A test portion of a sample is extracted with a
mixture of methanol/water (80/20, v/v). This raw extract is then diluted, filtered, and
applied to an immunoaffinity column. After washing and elution with acetonitrile the
eluate is evaporated to dryness. T-2 and HT-2 toxins in the dry residue are then
derivatised with N-methyl-N-trimethylsilyl-trifluoroacetamid (MSTFA)/
trimethylchlorosilane (TMCS) (99/1, v/v), injected into a gas chromatograph, and
detected and quantified by mass spectrometry.
Fourteen laboratories from ten different countries were selected to participate in
the collaborative study. They received six different test materials as blind duplicates.
The test materials consisted of a blank cereal mix, two cereal mixes naturally
contaminated with T-2 and HT-2 toxins at different levels, a blank compound animal
feed, and two compound animal feeds naturally contaminated with T-2 and HT-2
toxins at different levels. Furthermore, two blank cereal mixes and two blank
compound animal feeds together with specific spiking solutions were provided for
recovery determination. The sum of the mass fractions of T-2 & HT-2 toxins after
spiking were 50 µg/kg in the cereal mix, and 75 µg/kg in the compound animal feed.
Reported apparent recoveries in the cereal mix ranged from 59 to 143% for the
sum of T-2 & HT-2 toxins with a mean value of 105%. Reproducibility relative
standard deviations (RSDR) for the cereal matrix were 30% at a natural contamination
level of ca. 25 µg/kg, 21% at ca. 87 µg/kg, and 27% for the spiked material at 50
µg/kg. For compound animal feed the recovery values ranged from 87 to 145% with
113% for the mean value. The RSDR values were 25% at a natural contamination level
of ca. 92 µg/kg, 19% at ca. 125 µg/kg, and 16% for the spiked material at 75 µg/kg.
The Horwitz ratios (HorRat) ranged from 0.7 to 1.4.
European Commission Regulation 401/2006 [1] lays down method
performance criteria for the control of foodstuffs only. Even though the validated
method applies to cereals and compound feed it meets all of those criteria. Therefore it
is suited for official feed control.

4
Introduction
The A-type trichothecenes T-2 toxin (4β,15-Diacetoxy-3α-hydroxy-8α-(3-
methylbutyryloxy)-12,13-epoxytrichothec-9-ene, CAS No: 21259-20-1) and HT-2
toxin (15-Acetoxy-3α,4β-dihydroxy-8α-(3-methylbutyryloxy)-12,13-epoxytrichothec-
9-ene, CAS No: 26934-87-2) present a non-negligible risk for humans and animals,
because of their high toxicity and their prevalent occurrence in cereals. Therefore they
have come into focus of competent food and feed authorities in the EU and they have
been part of an exposure assessment study in 2003 [2]. In addition, T-2 and HT-2
toxins are planned to be regulated in the EU for human food, whereas only guidance
values may be established for T-2 and HT-2 toxins in products intended for animal
feeding [3]. The exposure assessment revealed that there was a lack of suitable
methodology for the reliable determination of T-2 and HT-2 to make enforcement of
regulations possible. Regulation 401/2006 lays down performance criteria for such
methodology in foodstuffs [1].
Different methods for the determination of T-2/ HT-2 in cereals have been
published. Biselli et al. [4] used LC/MS/MS with a MycoSep® clean-up to detect
several mycotoxins including T-2/ HT-2. Only wheat flour was studied and recoveries
were 71% for T-2 and 54% for HT-2 with a RSD of 3% for both. A HPLC-FLD
method has been described by Visconti et al. [5] involving immunoaffinity clean-up.
Recoveries were reported for pure wheat, maize or barley samples with a range of 70
to 100% and RSDs below 8%. Eskola et al. [6] and Jestoi et al. [7] used a MycoSep®
clean-up with GC/MS to determine several mycotoxins including T-2 and HT-2. The
method was validated with a mixture of wheat, rye and barley and the reported
recoveries were around 100% with RSDs between 4 and 10%. But oat, which seems to
be the cereal most affected with T-2/ HT-2 contamination, was not studied in any of
the above mentioned studies.

5
We decided to develop a method based on immunoaffinity clean-up, because of
its superior purification selectivity compared to other solid-phase clean-ups, and
GC/EI-MS, because of its high chromatographic resolution, fast run times, robust
ionisation characteristics and selectivity in single ion monitoring mode. The matrices
studied were mixtures including all common cereals like oat, wheat, barley, rice, and
maize, as well as soy, and other common ingredients found in compound animal feed.
The method was subjected to an interlaboratory validation trial according to the
Guidelines for Collaborative Study Procedures To Validate Characteristics of a
method of Analysis [10], so as to derive performance characteristics and to evaluate its
suitability to be used for official purposes.
Materials and methods
Test materials for the collaborative study
For this study various types of cereals and brands of compound animal feed were
purchased from local stores. After confirmation that these raw materials did not contain
detectable amounts of T-2 or HT-2 toxins using an initial version of the described
method they were milled and mixed as described below. The so obtained blank
materials were again tested for the presence of T-2 and HT-2 toxins. Tables 1 and 2
describe the composition of those blank mixes.
To obtain naturally contaminated test materials, the blank materials were
blended with different amounts of highly contaminated oat. (see Table 1 & 2).
Table 1: Composition of cereal mix test materials
Test Material Ingredient Amount (kg)Wheat 5 Rice 3
Maize 5 Soy 3
Barley 2
Blank
Oat 2 Blank mix 2 High Contam. oat 1 Blank mix 3 Medium Contam. oat 1

6
Full grains were first milled with a Romer RAS® mill prior to blending. All
other materials were blended directly in a modified rotating-drum mixer for 30
minutes. After blending the whole lot was milled with a Retsch centrifugal mill (Model
ZM 100) with a sieve of 3 mm. This milled material was again mixed in the rotating-
drum mixer for 30 minutes and milled, for a second time, down to a particle size of < 1
mm in the centrifugal mill. Then the material was mixed again in the rotating-drum
mixer for 2 – 3 hours and milled once more to a final particle size of < 0.5 mm.
Subsequently the materials were filled into 50 mL polyethylene (PE) containers at
approx. 30 g each. The containers were kept at –18° C until analysis for homogeneity
or dispatch to the participating laboratories.
Table 2: Composition of compound animal feed test materials
Test Material Ingredient Amount (kg) Composition
Pig feed 5 Peas, roasted soy, wheat, rye,
manioc, cabbage, maize, animal adipose, salt, lime
Chicken feed 3 Cereals, oil containing seeds, minerals, mussels, oils & fats
Rabbit feed 5 Different cereals & seeds,
herbal by-products, vegetables, minerals
Maize 2 Oat 3 Soy 1
Blank
Barley 1 Blank mix 3 (see: “blank”)
Contam. oat 2 High Alfalfa 1
Blank mix 2 (see: “blank”) Contam. oat 1
Horse feed 1 Oat, barley, flour pellets, maize, fibres, peas, molasse, oil
Horse feed 1 Barley, oat, flour pellets, maize flakes, oil, alfalfa
Low
Rabbit feed 1 Different cereals & seeds,
herbal by-products, vegetables, minerals

7
Homogeneity of the Test Materials and In-House Method Performance
For homogeneity testing, one tenth of all containers were selected from each batch
during packing and subjected to the GC/MS method under study.
The selection was done such that out of the series of the first ten containers one
was selected randomly and then every tenth container thereafter, e.g. container 3, 13,
23,…, and so on until 10% of all containers were selected. After thorough mixing the
content of each selected container was split into two equal parts and analysed.
Analysis of Variance (ANOVA) was used to compute within-container and
between-container mean sum-of-squares for the two analytes and their sum at each
contamination level in the two materials. Homogeneity of the packaged material was
accepted when a F-Test of those two mean sum-of-squares resulted in a probability p
of larger than 0.1. This α error of falsely rejecting possible homogeneity was chosen
with 10 % to keep the β error of falsely accepting homogeneity small.
Furthermore, the overall means for the two analytes and their sum at each
contamination level and its associated relative standard deviation under repeatability
conditions (RSDr) were also computed. Table 3 lists the results for the two
contamination levels of the two different matrices which were prepared.
Calibration data were acquired on three different days at 10 different levels
from 0 – 50 ng/µL in the injection solution for T-2 and 0 – 100 ng/µL for HT-2. A
calibration function, and the minimum detectable level (MDL) were then computed as
outlined in section "Statistical evaluation". The calibration data for T-2 showed a slight
negative curvature best explained by a 2nd degree polynomial. The calibration data of
HT-2, because of higher variability, could be explained well by a 1st degree
polynomial. The calculated MDLs [ng] were 0.4 and 1.0 for T-2 and HT-2,
respectively. That means, if 0.4 ng of T-2, or 1.0 ng of HT-2, were eluted from the IAC
column, assuming complete derivatization, one could be 95% confident that a
detectable peak would result.

8
Apparent recoveries were determined by spiking a blank material with the two
toxins and subjecting the spiked material to the GC/MS method under study. The
determined mass fractions were then compared to the added mass fractions. Since
preliminary experiments with a food matrix at three different mass fraction levels
(three preparations, duplicate injections) showed no indication for a concentration
dependency of the apparent recoveries for either T-2 (p=0.3) or HT-2 (p=0.6) it was
decided to determine apparent recoveries only at one mass fraction for each of the two
matrices. Those mass fractions were chosen such that they might reflect relevant
contamination scenarios. Table 4 lists those results.
Acceptable performance criteria as set forth in European legislation [1] are
RSDr values smaller than 40% for HT-2 mass fractions of 100 – 200 µg/kg and T-2
mass fractions of 50 – 250 µg/kg, and recoveries in the range of 60 – 130 per cent.
Whereas these criteria refer to collaborative study performance, within-laboratory
performance characteristics should also fulfil these criteria, of course. The recovery
percentages found were all within the range of acceptance except for compound animal
feed spiked with HT-2 at a level of 50 µg/kg (141 %). Given the fact that the
performance criteria for recovery are valid for much higher mass fractions of HT-2
(100-200 µg/kg), this slight exceedance was considered acceptable.
Table 3: Results of the homogeneity test and relative standard deviation under
repeatability conditions (RSDr)
Toxin Material1 Level MEAN RSDr N p low 7.7 15 10 0.97 Cereal1 high 18.7 7 10 0.25 low 10.5 6 20 0.46
T-2 Animal
feed high 38.4 11 10 0.23 low 16.4 9 10 0.98 Cereal1 high 34.5 11 10 0.39 low 47.4 9 20 0.20
HT-2 Animal
feed high 84.3 11 10 0.38 low 24.0 10 10 1.00 Cereal1 high 53.2 9 10 0.36 low 57.9 8 20 0.20
Sum T-2/HT-2 Animal
feed high 122.6 10 10 0.29 1- Homogeneity of the cereal materials was tested with an early version of the proposed method without internal standard, VICAM IAC columns , and Tri-SIL-TBT as derivatization reagent

9
Table 4: Results of the recovery experiments, showing the added and the determined mass fractions of the respective toxins in µg/kg, the recovery in per cent, and the number of measurements
Toxin Material Added Determined % N
Cereal 17 17.7 104 4 T-2
Animal feed 25 25.2 101 4
Cereal 33 37.7 114 4 HT-2
Animal feed 50 70.5 141 4
Cereal 50 55.5 111 4 Sum T-2/HT-2 Animal
feed 75 95.7 128 4
Statistical evaluation
Calculations of the precision parameters were done according to Youden & Steiner [8]
and are detailed below:
The square root of the within-laboratory mean sum-of-squares (MS0) was taken
as estimate of the repeatability standard deviation.
0MSsr = (1)
The laboratory related variance was calculated as the difference of the between-
laboratory mean sum-of-squares (MSL) and MS0 divided by the number of replications
per laboratory (n=2).
nMSMS
s LL
02 −= (2)
Finally the reproducibility standard deviation was calculated from the residual
and the laboratory variances.
22rLR sss += (3)
Relative standard deviations (RSD) were calculated as standard deviation times
100 divided by the mean value:
xsRSD 100*
= (4)

10
Repeatability and reproducibility were calculated by multiplying the respective
standard deviation with 2.8 which gives roughly a 95% confidence at two replications:
rsr *8.2= (5)
RsR *8.2= (6)
The precision parameters were calculated using the EXCEL macro
CLSTD.XLT (V3.6) [9].
Based on ISO guide 11843 Part 2 calibration functions for data with non-
constant variance were calculated with iteratively re-weighted least square. The
formulas were extended to calibration functions including a 2nd degree term. Minimum
detectable levels (MDL) were then calculated from the estimated calibration and
variance functions.
Design of the collaborative study
The design was based on the "Guidelines for Collaborative Study Procedures to
Validate Characteristics of a Method of Analysis" [10].
The participants were selected from a list of interested parties and a total of 14
laboratories from ten different countries were chosen to participate in this collaborative
trial (Figure1).
B
D
DKFIH
IE
N
NL
SE
UK
Figure 1: Distribution of the selected participants by country for the inter-laboratory comparison.

11
The participants represented governmental (64%), industrial (22%), and
academic (14%) food control laboratories. Among these were seven National
Reference Laboratories (NRL) for Mycotoxins appointed by European Union Member
States.
All participants received cereal and animal feed samples. One selected
laboratory returned the samples because of unavailability of a GC/MS system, and
three selected laboratories received samples but were unable to conclude the analyses.
Subsequently those laboratories were excluded from the evaluation. Table 5 lists the
names and addresses of the laboratories which reported results and were included in
the evaluation.
Table 5: List of included laboratories in alphabetical order
Participant Institution Address
Ingrid Bujara SGS Germany GmbH, Laboratory Hamburg
Weidenbaumsweg 137, D-21035 Hamburg, Germany
Duncan Campbell West Yorkshire Analytical Services
PO Box 11, Nepshaw Lane South, Morley, LS27 0UQ,
Leeds, England
Per-Erik Clasen
National Veterinary Institute, Department of Feed and Food
Hygiene- Toxicology, Chemistry and Microbiology
Ullevallsveien, 68, 0454 Oslo, Norway
Jozsef Dömsödi National Institute for Agricultural
Quality Control, Central Laboratory
Remeny u. 42, H-1144 Budapest, Hungary
Marika Jestoi Finnish Food Safety Authority (Evira)
Mustialankatu 3, FIN-00790 Helsinki, Finland
John Keegan Public Analyst's Laboratory Sir Patrick Dun's Lower Grand Canal Street, Dublin 2, Ireland
Horst Klaffke
Bundesinstitut für Risikobewertung (Federal
institute for risk assessment) - BfR
Thielallee 88-92, D-14195 Berlin, Germany
Peter Maynard Kent Scientific Services 8 Abbey Wood Road, Kings Hill,
ME19 6YT, West Malling, England
Alexey Solyakov National Veterinary Institute, Department of Animal Feed SE-75189 Uppsala, Sweden
Wim A. Traag RIKILT-Instituut voor Voedselveiligheid
Bornsesteeg 45, 6700 AE Wageningen, The Netherlands

12
For the collaborative trial each participant received:
1. 12 containers of coded samples for determination of T-2/ HT-2 toxins mass
fractions
2. 4 containers of samples for spiking identified as “Spike C” and “Spike A”
3. One ampoule identified as “T-2/HT-2 toxins standard in acetonitrile” (for
calibration)
4. One ampoule identified as “Spike C solution in acetonitrile”
5. One ampoule identified as “Spike A solution in acetonitrile”
6. One ampoule identified as “ISTD solution in acetonitrile”
7. One ampoule identified as “TMS reagent”
8. 18 immunoaffinity columns for T-2/HT-2 toxins
9. One copy of the collaborative study method (see Annex III)
10. One copy of the spiking protocol (see Annex IV)
11. Report form (see Annex V)
12. Questionnaire (see annex VI)
The 12 sample containers contained blind duplicates of either blank, low, or highly
contaminated cereal (see Table 1) or blank, low, or highly contaminated animal feed
(see Table 2). Each of the 12 materials was to be prepared once and measured twice by
each laboratory. For recovery determinations two blank materials, either cereal or
animal feed, were provided to be spiked in duplicate with the respective spiking
solution.

13
Results of the collaborative study and Discussion
As it is foreseen to regulate the maximum levels of the sum of the two type A
trichothecenes T-2 and HT-2 detailed results are only reported for the summed-up
mass fractions uncorrected for recovery. The results for the individual toxins can be
found in Annex I.
Animal feed
Tables 6 lists the summed-up mass fractions of the reported values for T-2 and HT-2
toxins by laboratory, each row representing one laboratory identified by the codes used
for reporting, and the columns representing the different materials. Cells show mass
fractions as reported. Where no value was reported the cell is empty, n.d. indicates not
detected (for computational purposes this was taken as zero). A gray shading indicates
exclusion from the statistical evaluation, light gray for non-compliance, dark gray for
being an outlying result (Grubbs and/or Cochran test). Non-compliance was
established when a laboratory deviated from the protocol at points considered to be
crucial, or when no or only one result per duplicate material was reported.
Table 6: Sum parameter (T-2 & HT-2 toxins) in animal feed
Lab ID
Blank [µg/kg] Low [µg/kg] High [µg/kg] Spike
[µg/kg] App.
Recovery [%]
9 12.0 15.4 93.5 97.0 101.2 117.6 102.1 95.6 118 109 61 15.9 13.7 78.6 74.6 121.8 120.4 99.5 97.2 113 110 72 24.4 27.1 127.9 119.8 141.7 144.4 98.5 132.1 97 142 73 23.0 28.5 75.0 100.5 209.0 188.0 244 216
119 14.5 14.5 87.5 85.6 125.8 115.8 91.3 91.8 102 103 501 40.6 22.1 136.9 131.0 159.1 175.0 502 n.d. n.d. 88.0 95.0 127.0 112.0 109.0 104.0 145 139 503 0.0 0.0 105.4 95.6 144.6 122.3 0.0 196.5 0 262 504 17.9 15.5 67.6 78.0 90.9 83.3 89.9 81.6 98 87 505 20.4 20.2 57.8 55.2 115.0 133.3 104.6 101.7 112 109
Empty cell – no value reported; n.d. – not detected; Spike – nominal value 75 µg/kg; light gray – non-compliant; dark gray
– outlying result
Table 7 lists the performance parameters of the tested method for animal feed. The
mean of the reported results for the blank material indicates a contamination of 14.6
µg/kg for the sum of the two analytes. However, the associated relative reproducibility
standard deviation of 65% indicates that this value cannot be quantified with sufficient

14
confidence. When looking at the results of the individual toxins in Annex I it can be
seen that most of it is contributed by HT-2 toxin (mean HT-2 toxin mass fraction: 10.8
µg/kg, RSDR HT-2 toxin: 73 %).
Table 7: Performance parameters for the sum of T-2 & HT-2 toxins in the animal feed Level Mean N nc outl. n r sr RSDr R sR RSDR HoRmod
Blank 14.6 10 0 1 9 5.09 1.82 12 26.7 9.52 65 3.0
Low 92.5 10 0 0 10 20.22 7.22 8 66.0 23.6 25 1.2
High 125.1 10 1 0 9 27.57 9.85 8 64.9 23.2 19 0.8
App. Recovery at 75 µg/kg 113 10 2 1 7 35.8 12.8 11 50.2 17.9 16 0.7
Legend: Mean –mean mass fraction [µg/kg] or mean percentage recovery; N – number of labs; nc – non-compliant laboratories; outl. – outlying laboratories; n – number of laboratories used for statistics; r – repeatability [µg/kg], sr – repeatability standard deviation [µg/kg], RSDr – relative standard deviation under repeatability conditions [%]; R, sR, RSDR– the respective values for reproducibility, HoRmod – the HorRat value for reproducibility modified after Thompson [11]
Since for recovery determination the blank material was spiked the reported
values for the spike have been corrected for the values reported in the blank material.
The resulting mean apparent recovery is then 113 % for animal feed. Considering the
repeatability of ca. 36 % it must be pointed out this is statistically not different from
100 %. The modified Horwitz ratios of 1.2 and 0.8 for the low and high contaminated
materials, respectively, demonstrate acceptable performance. The apparent recovery
and the values for the relative standard deviations of repeatability and reproducibility
are well below limits for food control set forth in [1].
Cereals
All the results for the cereal mix are listed in Table 8 for which the same
conventions apply as for Table 6.

15
Table 8: Sum parameter (T-2 & HT-2 toxins) in cereal mix Lab ID
Blank [µg/kg]
Low [µg/kg] High [µg/kg] Spike
[µg/kg] App.
Recovery [%]
9 4.0 17.8 21.8 89.3 89.3 63.2 58.4 118 109 61 24.1 18.1 45.7 57.4 31.4 63 72 10.0 9.6 30.9 30.8 109.4 110.9 69.9 73.3 120 127 73 82.5 89.0 64.5 57.5 224.0 174.5 124.0 110.0 77 49
119 7.0 4.7 19.7 19.2 79.4 80.5 56.0 50.5 100 89 501 19.3 9.6 34.5 29.4 96.5 111.4 74.8 69.1 121 109 502 n.d. n.d. 34.0 34.0 81.0 87.0 67.0 67.0 134 134 503 0.0 0.0 18.5 14.4 91.5 90.7 62.0 71.4 124 143 504 7.0 11.5 20.0 14.0 91.4 48.3 44.8 38.7 71 59 505 11.4 11.5 31.2 33.1 84.5 86.7 56.2 69.9 90 117
Empty cell – no value reported; n.d. – not detected; Spike – nominal value 50 µg/kg; light gray – non-compliant; dark gray
– outlying result
Table 9: Performance parameters for the sum of T-2 & HT-2 toxins in the cereal mix Level Mean N nc outl. n r sr RSDr R sR RSDR HoRmod
Blank 7.3 10 2 1 7 8.18 2.92 40 16.7 5.95 82 3.7
Low 24.7 10 0 1 9 7.65 2.73 11 21.1 7.55 30 1.4
High 87.0 10 0 2 8 14.08 5.03 6 50.2 17.9 21 0.9
App. Recovery at 50 µg/kg 105 10 1 0 9 32.5 11.6 11 78.0 27.9 27 1.2
Legend: Mean –mean mass fraction [µg/kg] or mean percentage for recovery; N – number of labs; nc – non-compliant laboratories; outl. – outlying laboratories; n – number of laboratories used for statistics; r – repeatability [µg/kg], sr – repeatability standard deviation [µg/kg], RSDr – relative standard deviation under repeatability conditions [%]; R, sR, RSDR– the respective values for reproducibility, HoRmod – the HorRat value for reproducibility modified after Thompson [11]
Table 9 lists the performance parameters of the tested method for the cereal mix.
Again, as for the animal feed blank material, the mean of the reported results indicates
a contamination of 7.3 µg/kg with an associated relative reproducibility standard
deviation of 82 %. This means no reliable quantification is possible for this
contamination. The mean apparent recovery after correction for the blank results is 105
% (no statistical difference to 100%). The performance for the low and high
contaminated materials is acceptable (HoRmod 1.4 and 0.9, respectively).
Graphical representations
When plotting the first replicate result of a laboratory versus the second so-called
Youden plots are created. They display in one glance repeatability (closeness of points
to the identity line) and reproducibility (tightness of the cloud of points). Figures 2 to 5
show the Youden plots for the sum of T-2 and HT-2 toxins for the blank, the two
naturally contaminated, and the spiked animal feed material. For the blank, the two

16
naturally contaminated, and the spiked cereal mix figures 6 to 9 show the respective
Youden plots. The Youden plots for the individual toxins are shown in Annex II.
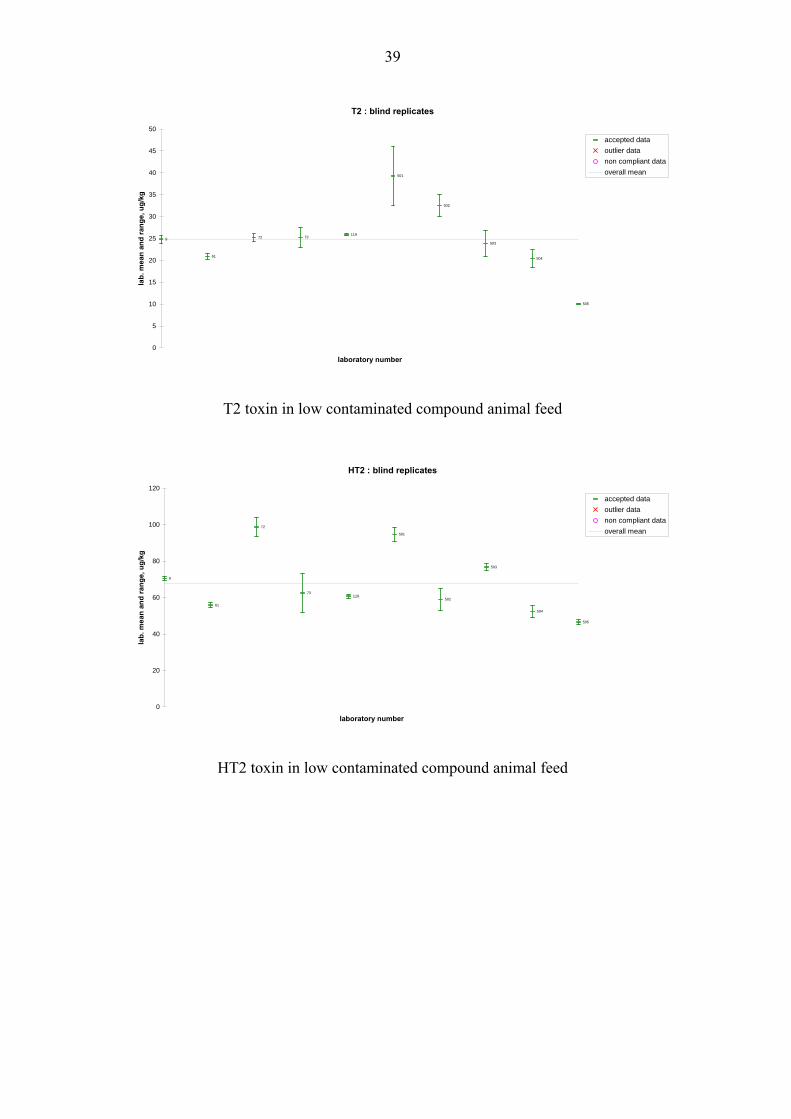
Mean & range plots are a second way of displaying the data. Here the mean
value for each laboratory and its range are plotted compared to the overall mean value.
This kind of plot allows the quick identification of an individual laboratory's bias
compared to the mean value. Figures 10 to 13 show the mean & range plots for the
sum of T-2 and HT-2 toxins for the animal feed materials, and figures 14 to 17 for the
cereal mix materials. The other mean & range plots can be found in Annex II.
Sum T2/HT2 : blind replicates
505
504
503502
119
73
72
61
9
501, c
0
5
10
15
20
25
30
35
40
45
0 5 10 15 20 25 30 35 40 45
Rep 1, ug/kg
Rep
2,
ug/k
g
accepted dataoutlier datanon compliant data45° line
Figure 2: Youden plot of the sum of T-2 and HT-2 toxins for the blank animal feed
material
Sum T2/HT2 : blind replicates
505
504
503502
501
119
73
72
61
9
0
20
40
60
80
100
120
140
160
0 20 40 60 80 100 120 140 160
Rep 1, ug/kg
Rep
2,
ug/k
g
accepted dataoutlier datanon compliant data45° line
Figure 3: Youden plot of the sum of T-2 and HT-2 toxins for the low contaminated
animal feed material
17
Sum T2/HT2 : blind replicates
505
504
503
502
501
119
72
619
73, nc0
20
40
60
80
100
120
140
160
180
200
0 20 40 60 80 100 120 140 160 180
Rep 1, ug/kg
Rep
2,
ug/k
gaccepted dataoutlier datanon compliant data45° line
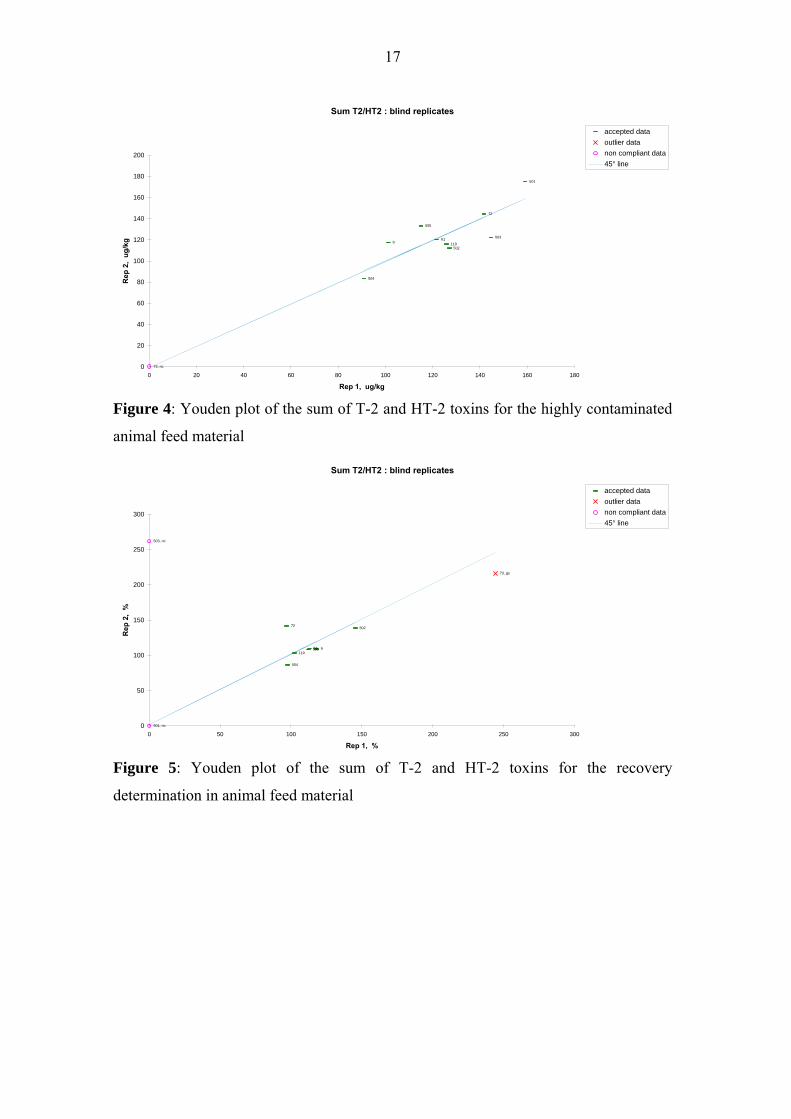
Figure 4: Youden plot of the sum of T-2 and HT-2 toxins for the highly contaminated
animal feed material
Sum T2/HT2 : blind replicates
505
504
502
119
72
61 9
73, gs
503, nc
501, nc0
50
100
150
200
250
300
0 50 100 150 200 250 300
Rep 1, %
Rep
2,
%
accepted dataoutlier datanon compliant data45° line
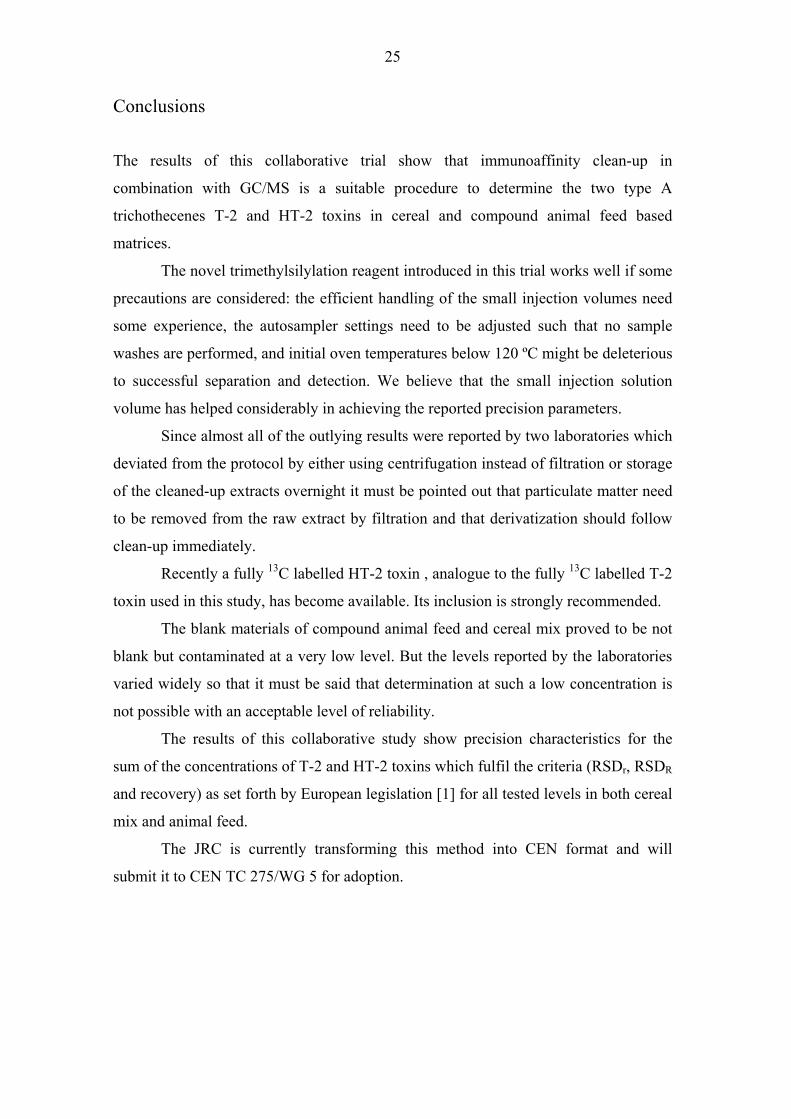
Figure 5: Youden plot of the sum of T-2 and HT-2 toxins for the recovery
determination in animal feed material

18
Sum T2/HT2 : blind replicates
505504
503502
501
119
72
73, gs
61,nc 9,nc0
10
20
30
40
50
60
70
80
90
100
0 10 20 30 40 50 60 70 80 90
Rep 1, ug/kg
Rep
2,
ug/k
gaccepted dataoutlier datanon compliant data45° line
Figure 6: Youden plot of the sum of T-2 and HT-2 toxins for the blank cereal mix
material
Sum T2/HT2 : blind replicates
505
504503
502
501
119
72
61
9
73, gs
0
10
20
30
40
50
60
70
0 10 20 30 40 50 60 70
Rep 1, ug/kg
Rep
2,
ug/k
g
accepted dataoutlier datanon compliant data45° line
Figure 7: Youden plot of the sum of T-2 and HT-2 toxins for the low contaminated
cereal mix material

19
Sum T2/HT2 : blind replicates
505503
502
501
119
72
61
9
504, c
73, c
0
50
100
150
200
250
0 50 100 150 200 250
Rep 1, ug/kg
Rep
2,
ug/k
gaccepted dataoutlier datanon compliant data45° line
Figure 8: Youden plot of the sum of T-2 and HT-2 toxins for the highly contaminated
cereal mix material
Sum T2/HT2 : blind replicates
9
72
73
119
501
502
503
504
505
61, nc
0
20
40
60
80
100
120
140
160
0 20 40 60 80 100 120 140 160
Rep 1, %
Rep
2,
%
accepted dataoutlier datanon compliant data45° line
Figure 9: Youden plot of the sum of T-2 and HT-2 toxins for the recovery
determination in the cereal mix material

20
Sum T2/HT2 : blind replicates
505
504
503502
119
7372
619
501, c
0
5
10
15
20
25
30
35
40
45
laboratory number
lab.
mea
n an
d ra
nge,
ug/
kgaccepted dataoutlier datanon compliant dataoverall mean
Figure 10: Mean & range plots of the sum of T-2 and HT-2 toxins for the blank animal
feed material
Sum T2/HT2 : blind replicates
505
504
503
502
501
11973
72
61
9
0
20
40
60
80
100
120
140
160
laboratory number
lab.
mea
n an
d ra
nge,
ug/
kg
accepted dataoutlier datanon compliant dataoverall mean
Figure 11: Mean & range plots of the sum of T-2 and HT-2 toxins for the low
contaminated animal feed material

21
Sum T2/HT2 : blind replicates
505
504
503
502
501
119
72
61
9
73, nc73, nc0
20
40
60
80
100
120
140
160
180
200
laboratory number
lab.
mea
n an
d ra
nge,
ug/
kgaccepted dataoutlier datanon compliant dataoverall mean
Figure 12: Mean & range plots of the sum of T-2 and HT-2 toxins for the highly
contaminated animal feed material
Sum T2/HT2 : blind replicates
505
504
502
119
72619
501, nc
73, gs
501, nc
503, nc
0
50
100
150
200
250
300
laboratory number
lab.
mea
n an
d ra
nge,
%
accepted dataoutlier datanon compliant dataoverall mean
Figure 13: Mean & range plots of the sum of T-2 and HT-2 toxins for the recovery
determination in animal feed material

22
Sum T2/HT2 : blind replicates
72
119
501
502 503
504505
61,nc
73, gs
61,nc
9,nc
0
10
20
30
40
50
60
70
80
90
100
laboratory number
lab.
mea
n an
d ra
nge,
ug/
kgaccepted dataoutlier datanon compliant dataoverall mean
Figure 14: Mean & range plot of the sum of T-2 and HT-2 toxins for the blank cereal
mix material
Sum T2/HT2 : blind replicates
961
72
119
501
502
503 504
505
73, gs
0
10
20
30
40
50
60
70
laboratory number
lab.
mea
n an
d ra
nge,
ug/
kg
accepted dataoutlier datanon compliant dataoverall mean
Figure 15: Mean & range plot of the sum of T-2 and HT-2 toxins for the low
contaminated cereal mix material

23
Sum T2/HT2 : blind replicates
9
61
72
119
501
502
503505
73, c
504, c
0
50
100
150
200
250
laboratory number
lab.
mea
n an
d ra
nge,
ug/
kgaccepted dataoutlier datanon compliant dataoverall mean
Figure 16: Mean & range plot of the sum of T-2 and HT-2 toxins for the highly
contaminated cereal mix material
Sum T2/HT2 : blind replicates
9
72
73
119
501
502 503
504
505
61, nc
0
20
40
60
80
100
120
140
160
laboratory number
lab.
mea
n an
d ra
nge,
%
accepted dataoutlier datanon compliant dataoverall mean
Figure 17: Mean & range plot of the sum of T-2 and HT-2 toxins for the recovery
determination in the cereal mix material

24
Comments from collaborative trial participants
The questionnaire, which was sent along with materials and reagents, was filled in and
returned by all 10 laboratories. Below are some of the answers given:
The question whether there was a deviation from the protocol was answered
with "Yes" by seven labs, with "No" by one and two labs did not give an answer. Two
labs which answered "Yes" also reported outlying results. One of those is Laboratory
73 which deviated by using a more polar column (DB1701), a temperature program
starting at 80 ºC, and centrifugation instead of filtration to remove particulate matter
from the raw extract. The other is Laboratory 501 which deviated by storing the IAC
cleaned-up extracts overnight before proceeding with the method.
A third lab which reported outlying results did not answer whether it deviated
from the protocol.
The question whether a similar method was being used before was answered
with "Yes" by only three labs and with "No" by the other seven. A second question
whether there was familiarity with the procedures used in the protocol was answered
with "Yes" by seven labs and with "No" by the other three. Laboratories 61 and 501
were neither using similar methodology nor familiar with the procedures.
The question whether there were criticism or suggestions was answered with
"Yes" by nine labs and the tenth lab did not answer. One criticism was that a method
just for T-2 & HT-2 toxins was impractical. Another point that was raised was the lack
of a familiarization opportunity like extra materials and IAC columns. One lab
criticized the small injection solution volume. All other comments were related to the
method protocol and its lack of details in some areas.
Concerning the low volume of the injection solution: We realize that the
handling of such small volumes needs practice but we also see the small volume,
which leads to a higher concentration of the analytes in the injection solution, as the
strength of the novel derivatisation procedure.
25
Conclusions
The results of this collaborative trial show that immunoaffinity clean-up in
combination with GC/MS is a suitable procedure to determine the two type A
trichothecenes T-2 and HT-2 toxins in cereal and compound animal feed based
matrices.
The novel trimethylsilylation reagent introduced in this trial works well if some
precautions are considered: the efficient handling of the small injection volumes need
some experience, the autosampler settings need to be adjusted such that no sample
washes are performed, and initial oven temperatures below 120 ºC might be deleterious
to successful separation and detection. We believe that the small injection solution
volume has helped considerably in achieving the reported precision parameters.
Since almost all of the outlying results were reported by two laboratories which
deviated from the protocol by either using centrifugation instead of filtration or storage
of the cleaned-up extracts overnight it must be pointed out that particulate matter need
to be removed from the raw extract by filtration and that derivatization should follow
clean-up immediately.
Recently a fully 13C labelled HT-2 toxin , analogue to the fully 13C labelled T-2
toxin used in this study, has become available. Its inclusion is strongly recommended.
The blank materials of compound animal feed and cereal mix proved to be not
blank but contaminated at a very low level. But the levels reported by the laboratories
varied widely so that it must be said that determination at such a low concentration is
not possible with an acceptable level of reliability.
The results of this collaborative study show precision characteristics for the
sum of the concentrations of T-2 and HT-2 toxins which fulfil the criteria (RSDr, RSDR
and recovery) as set forth by European legislation [1] for all tested levels in both cereal
mix and animal feed.
The JRC is currently transforming this method into CEN format and will
submit it to CEN TC 275/WG 5 for adoption.

26
References:
1. Regulation (EC) No 401/2006, E. Commission, Editor. 2006. 2. Gareis, M., et al., SCOOP TASK 3.2.10: Collection of occurence data of
fusarium toxins in food and assessment of dietary intake by the population of EU Member States. 2003, European Commission: Brussels, Belgium. p. 1-10.
3. Verstraete, F., Decision-making process and overview of recent and future European Union legislation on mycotoxins in food and feed, in The mycotoxin fact book, D. Barug, et al., Editors. 2006, Wageningen Academic Publishers: Wageningen. p. 51-79.
4. Biselli, S., et al., Analysis of Fusarium Toxins using LC/MS–MS: Application to Various Food and Feed Matrices. LC-GC Europe Special Edition: Recent Applications in LC-MS, 2004. 17(11a): p. 25-31.
5. Visconti, A., et al., Analysis of T-2 and HT-2 toxins in cereal grains by immunoaffinity clean-up and liquid chromatography with fluorescence detection. J Chromatogr A, 2005. 1075(1-2): p. 151-158.
6. Eskola, M., P. Parikka, and A. Rizzo, Trichothecenes, ochratoxin A and zearalenone contamination and Fusarium infection in Finnish cereal samples in 1998. Food Additives & Contaminants, 2001. 18(8): p. 707-718.
7. Jestoi, M., A. Ritieni, and A. Rizzo, Analysis of the Fusarium Mycotoxins Fusaproliferin and Trichothecenes in Grains Using Gas Chromatography-Mass Spectrometry. J Agric Food Chem, 2004. 52(6): p. 1464-1469.
8. Youden, W.J. and E.H. Steiner, Statistical manual of the AOAC. 1975: AOAC International.
9. Mathieson, K., CLSTD.XLT. 1998. p. Microsoft EXCEL template with macro collection.
10. Appendix D: Guidelines for Collaborative Study Procedures To Validate Characteristics of a method of Analysis, in J AOAC Int. 2002.
11. Thompson, M., Recent trends in inter-laboratory precision at ppb and sub-ppb concentrations in relation to fitness for purpose criteria in proficiency testing. Analyst, 2000. 125: p. 385-386.

27
Annex I: Table 1: Reported results for T-2 toxin in animal feed
Lab ID
Blank [µg/kg] Low [µg/kg] High [µg/kg] Spike
[µg/kg] App.
Recovery [%]
9 2.0 2.0 23.9 25.7 29.7 32.4 28.8 26.2 107 97 61 3.0 2.2 21.6 20.2 32.3 34.4 29.2 29.5 106 107 72 1.8 2.9 24.2 26.2 29.0 29.6 23.4 27.8 84 102 73 8.0 23.0 27.5 52.5 42.5 178 138 119 2.8 2.6 25.6 26.1 35.8 32.9 27.0 26.5 97 95 501 16.7 5.5 46.1 32.5 69.8 34.7 502 n.d. n.d. 35.0 30.0 44.0 40.0 37.0 34.0 148 136 503 0.0 0.0 26.7 21.0 36.8 31.3 0.0 53.7 0 215 504 5.8 5.8 18.4 22.4 23.3 21.5 25.5 25.0 79 77 505 3.2 3.8 10.0 10.0 26.0 27.6 24.9 24.2 86 83
Empty cell – no value reported; n.d. – not detected; Spike – nominal value 25 µg/kg; light gray – non-compliant; dark gray
– outlying result
Table 2: Reported results for HT-2 toxin in animal feed
Lab ID
Blank [µg/kg] Low [µg/kg] High [µg/kg] Spike
[µg/kg] App.
Recovery [%]
9 10.0 13.3 69.6 71.3 71.4 85.1 73.4 69.3 123 115 61 12.9 11.5 57.0 54.5 89.5 86.0 70.3 67.7 116 111 72 22.6 24.1 103.7 93.6 112.7 114.8 75.1 104.4 104 162 73 15.0 28.5 52.0 73.0 156.5 145.5 270 248 119 11.7 11.9 61.9 59.5 90.0 82.9 64.3 65.3 105 107 501 23.9 16.6 90.8 98.5 89.3 140.3 502 n.d. n.d. 53.0 65.0 83.0 72.0 72.0 70.0 144 140 503 0.0 0.0 78.7 74.6 107.8 90.9 0.0 142.8 0 286 504 12.1 9.7 49.2 55.6 67.6 61.8 64.4 56.6 107 91 505 17.2 16.3 47.8 45.2 89.1 105.7 79.7 77.5 126 121
Empty cell – no value reported; n.d. – not detected; Spike – nominal value 50 µg/kg; light gray – non-compliant; dark gray
– outlying result

28
Table 3: Performance parameters for the two toxins in animal feed
Mean N nc outl. n r sr RSDr R sR RSDR HoRmod
Blank 2.4 10 1 1 8 1.08 0.39 16 5.30 1.89 80 3.6
Low 24.8 10 0 0 10 10.64 3.80 15 22.7 8.10 33 1.5
High 31.7 10 1 1 8 5.96 2.13 7 16.9 6.03 19 0.9 T-2
App. Recovery at 25 µg/kg 100 10 2 1 7 17.89 6.39 6 59.9 21.4 21 1.0
Blank 10.8 10 0 2 8 3.28 1.17 11 22.1 7.88 73 3.3
Low 67.7 10 0 0 10 17.98 6.42 9 50.6 18.1 27 1.2
High 88.1 10 1 1 8 21.80 7.79 9 45.4 16.2 18 0.8 HT-2
App. Recovery at 50 µg/kg 120 10 2 1 7 46.1 16.5 14 52.9 18.9 16 0.7
Legend: Mean –mean mass fraction [µg/kg] or mean percentage; N – number of labs; nc – non-compliant laboratories; outl. – outlying laboratories; n – number of laboratories used for statistics; r – repeatability [µg/kg], sr – repeatability standard deviation [µg/kg], RSDr – relative standard deviation under repeatability conditions [%]; R, sR, RSDR– the respective values for reproducibility, HoRmod – the HorRat value for reproducibility modified after Thompson [11]
Table 4: Reported results for T-2 toxin in cereal mix
Lab ID
Blank [µg/kg] Low
[µg/kg] High [µg/kg] Spike
[µg/kg] App.
Recovery [%]
9 1.2 4.5 4.9 24.9 28.1 18.0 19.1 99 105 61 11.0 8.6 23.0 20.0 21.9 129 72 1.4 1.4 4.9 5.5 24.8 26.1 18.3 18.0 99 97 73 1.0 4.0 4.5 29.5 31.5 19.0 17.5 106 97 119 2.8 2.1 5.7 5.8 25.2 24.3 18.7 18.9 96 97 501 15.2 5.8 16.0 9.5 24.4 32.0 19.6 20.6 54 59 502 n.d. n.d. 14.0 13.0 33.0 32.0 26.0 27.0 153 159 503 0.0 0.0 0.0 0.0 22.5 22.7 14.3 18.4 84 108 504 2.4 4.8 10.8 4.4 21.6 22.0 13.0 12.3 55 51 505 2.9 3.2 5.9 6.5 22.0 22.0 16.7 18.5 80 91
Empty cell – no value reported; n.d. – not detected; Spike – nominal value 17 µg/kg; light gray – non-compliant; dark
gray – outlying result

29
Table 5: Reported results for HT-2 toxin in cereal mix
Lab ID
Blank [µg/kg]
Low [µg/kg] High [µg/kg] Spike
[µg/kg] App.
Recovery [%]
9 2.9 2.7 13.3 16.9 64.4 61.3 45.2 39.3 129 111 61 13.1 9.5 22.8 37.5 9.5 29 72 8.6 8.2 26.0 25.4 84.6 84.8 51.5 55.4 131 142 73 81.5 89.0 60.5 53.0 194.5 143.0 105.0 92.5 60 22 119 4.2 2.6 14.0 13.4 54.2 56.2 37.3 31.6 103 85 501 4.1 3.8 18.5 19.9 72.1 79.4 55.2 48.5 155 135 502 n.d. n.d. 20.0 21.0 48.0 55.0 41.0 40.0 124 121 503 0.0 0.0 18.5 14.4 68.9 68.0 47.7 52.9 145 160 504 4.6 6.7 9.2 9.6 69.8 26.3 31.8 26.4 79 63 505 8.5 8.3 25.3 26.5 62.5 64.7 39.5 51.4 94 130
Empty cell – no value reported; n.d. – not detected; Spike – nominal value 33 µg/kg; light gray – non-compliant; dark
gray – outlying result
Table 6: Performance parameters for the two toxins in cereal mix
Mean N nc outl. n r sr RSDr R sR RSDR HoRmod
Blank 1.7 10 3 1 6 2.02 0.72 41 4.54 1.62 93 4.2
Low 7.0 10 0 0 10 5.98 2.13 31 12.2 4.36 63 2.8
High 25.3 10 0 1 9 3.43 1.22 5 11.3 4.05 16 0.7 T-2
App. Recovery at 50 µg/kg 94 10 1 0 9 20 7.16 8 84.7 30.3 32 1.5
Blank 4.1 10 1 1 8 1.90 0.68 17 9.26 3.31 81 3.7
Low 17.5 10 0 1 9 4.57 1.63 9 16.7 5.98 34 1.6
High 61.5 10 0 2 8 12.89 4.60 7 47.3 16.9 27 1.2 HT-2
App. Recovery at 50 µg/kg 111 10 1 0 9 43.9 15.7 14 106 38.0 34 1.6
Legend: Mean –mean mass fraction [µg/kg] or mean percentage for recovery; N – number of labs; nc – non-compliant laboratories; outl. – outlying laboratories; n – number of laboratories used for statistics; r – repeatability [µg/kg], sr – repeatability standard deviation [µg/kg], RSDr – relative standard deviation under repeatability conditions [%]; R, sR, RSDR– the respective values for reproducibility, HoRmod – the HorRat value for reproducibility modified after Thompson [11]

30
Annex II: Youden plots:
T2 : blind replicates
505
504
503502
11972
619
501, c
73, nc0
2
4
6
8
10
12
14
16
18
0 2 4 6 8 10 12 14 16 18
Rep 1, ug/kg
Rep
2,
ug/k
g
accepted dataoutlier datanon compliant data45° line
T2 toxin in blank compound animal feed
HT2 : blind replicates
505
504
503502
119
72
61
9
501, c
73, c
0
5
10
15
20
25
30
0 5 10 15 20 25 30
Rep 1, ug/kg
Rep
2,
ug/k
g
accepted dataoutlier datanon compliant data45° line
HT2 toxin in blank compound animal feed

31
T2 : blind replicates
505
504503
502
501
11973
72
61
9
0
5
10
15
20
25
30
35
40
45
50
0 5 10 15 20 25 30 35 40 45 50
Rep 1, ug/kg
Rep
2,
ug/k
gaccepted dataoutlier datanon compliant data45° line
T2 toxin in low contaminated compound animal feed
HT2 : blind replicates
505
504
503
502
501
119
73
72
61
9
0
20
40
60
80
100
120
0 20 40 60 80 100 120
Rep 1, ug/kg
Rep
2,
ug/k
g
accepted dataoutlier datanon compliant data45° line
HT2 toxin in low contaminated compound animal feed

32
T2 : blind replicates
505
504
503
502
119
72
619
501, c
73, nc0
10
20
30
40
50
60
70
80
0 10 20 30 40 50 60 70 80
Rep 1, ug/kg
Rep
2,
ug/k
gaccepted dataoutlier datanon compliant data45° line
T2 toxin in highly contaminated compound animal feed
HT2 : blind replicates
505
504
503
502
119
72
619
501, c
73, nc0
20
40
60
80
100
120
140
160
0 20 40 60 80 100 120
Rep 1, ug/kg
Rep
2,
ug/k
g
accepted dataoutlier datanon compliant data45° line
HT2 toxin in highly contaminated compound animal feed

33
T2 : blind replicates
505504
502
11972
61
9
73, c
503, nc
501, nc0
50
100
150
200
250
0 20 40 60 80 100 120 140 160 180 200
Rep 1, %
Rep
2,
%accepted dataoutlier datanon compliant data45° line
T2 toxin in spiked blank compound animal feed
HT2 : blind replicates
505
504
502
119
72
619
73, gs
503, nc
501, nc0
50
100
150
200
250
300
0 50 100 150 200 250 300
Rep 1, %
Rep
2,
%
accepted dataoutlier datanon compliant data45° line
HT2 toxin in spiked blank compound animal feed

34
T2 : blind replicates
505
504
503502
119
72
501, c
73, nc61, nc 9, nc0
2
4
6
8
10
12
14
16
18
0 2 4 6 8 10 12 14 16
Rep 1, ug/kg
Rep
2,
ug/k
gaccepted dataoutlier datanon compliant data45° line
T2 toxin in blank cereal mix
HT2 : blind replicates
505504
503502
501119
72
9
73, c
61, nc0
10
20
30
40
50
60
70
80
90
100
0 10 20 30 40 50 60 70 80 90
Rep 1, ug/kg
Rep
2,
ug/k
g
accepted dataoutlier datanon compliant data45° line
HT2 toxin in blank cereal mix

35
T2 : blind replicates
505504503
502
119
73
72
61
9
501, c
0
5
10
15
20
25
30
35
0 5 10 15 20 25 30 35
Rep 1, ug/kg
Rep
2,
ug/k
gaccepted dataoutlier datanon compliant data45° line
T2 toxin in highly contaminated cereal mix
HT2 : blind replicates
505503
502
501
119
72
61
9
504, c
73, gs
0
50
100
150
200
250
0 50 100 150 200 250
Rep 1, ug/kg
Rep
2,
ug/k
g
accepted dataoutlier datanon compliant data45° line
HT2 toxin in highly contaminated cereal mix

36
T2 : blind replicates
505
504
503
502
501
119
73
72
61
9
0
2
4
6
8
10
12
14
16
0 2 4 6 8 10 12 14 16 18
Rep 1, ug/kg
Rep
2,
ug/k
gaccepted dataoutlier datanon compliant data45° line
T2 toxin in low contaminated cereal mix
HT2 : blind replicates
505
504
503
502501
119
72
61
9
73, gs
0
10
20
30
40
50
60
70
0 10 20 30 40 50 60 70
Rep 1, ug/kg
Rep
2,
ug/k
g
accepted dataoutlier datanon compliant data45° line
HT2 toxin in low contaminated cereal mix

37
T2 : blind replicates
9
72 73119
501
502
503
504
505
61, nc
0
20
40
60
80
100
120
140
160
180
0 20 40 60 80 100 120 140 160 180
Rep 1, %
Rep
2,
%accepted dataoutlier datanon compliant data45° line
T2 toxin in spiked blank cereal mix
HT2 : blind replicates
9
72
73
119
501
502
503
504
505
61, nc
0
20
40
60
80
100
120
140
160
180
0 20 40 60 80 100 120 140 160 180
Rep 1, %
Rep
2,
%
accepted dataoutlier datanon compliant data45° line
HT2 toxin in spiked blank cereal mix

38
Mean & Range plots:
T2 : blind replicates
505
504
503502
11972
61
9
501, c
73, nc
0
2
4
6
8
10
12
14
16
18
laboratory number
lab.
mea
n an
d ra
nge,
ug/
kg
accepted dataoutlier datanon compliant dataoverall mean
T2 toxin in blank compound animal feed
HT2 : blind replicates
505
504
503502
119
72
619
501, c
73, c
0
5
10
15
20
25
30
laboratory number
lab.
mea
n an
d ra
nge,
ug/
kg
accepted dataoutlier datanon compliant dataoverall mean
HT2 toxin in blank compound animal feed
39
T2 : blind replicates
505
504
503
502
501
1197372
61
9
0
5
10
15
20
25
30
35
40
45
50
laboratory number
lab.
mea
n an
d ra
nge,
ug/
kgaccepted dataoutlier datanon compliant dataoverall mean
T2 toxin in low contaminated compound animal feed
HT2 : blind replicates
505
504
503
502
501
11973
72
61
9
0
20
40
60
80
100
120
laboratory number
lab.
mea
n an
d ra
nge,
ug/
kg
accepted dataoutlier datanon compliant dataoverall mean
HT2 toxin in low contaminated compound animal feed

40
T2 : blind replicates
505
504
503
502
119
72
61
9
501, c
73, nc73, nc0
10
20
30
40
50
60
70
80
laboratory number
lab.
mea
n an
d ra
nge,
ug/
kgaccepted dataoutlier datanon compliant dataoverall mean
T2 toxin in highly contaminated compound animal feed
HT2 : blind replicates
505
504
503
502
119
72
61
9
501, c
73, nc73, nc0
20
40
60
80
100
120
140
160
laboratory number
lab.
mea
n an
d ra
nge,
ug/
kg
accepted dataoutlier datanon compliant dataoverall mean
HT2 toxin in highly contaminated compound animal feed

41
T2 : blind replicates
505504
502
11972
619
501, nc
73, c
501, nc
503, nc
0
50
100
150
200
250
laboratory number
lab.
mea
n an
d ra
nge,
%accepted dataoutlier datanon compliant dataoverall mean
T2 toxin in spiked blank compound animal feed
HT2 : blind replicates
505
504
502
119
72
619
501, nc
73, gs
501, nc
503, nc
0
50
100
150
200
250
300
laboratory number
lab.
mea
n an
d ra
nge,
%
accepted dataoutlier datanon compliant dataoverall mean
HT2 toxin in spiked blank compound animal feed

42
T2 : blind replicates
72
119
502 503
504
505
61, nc
501, c
73, nc
61, nc
9, nc
0
2
4
6
8
10
12
14
16
laboratory number
lab.
mea
n an
d ra
nge,
ug/
kgaccepted dataoutlier datanon compliant dataoverall mean
T2 toxin in blank cereal mix
HT2 : blind replicates
9
72
119 501
502 503
504505
61, nc
73, c
61, nc0
10
20
30
40
50
60
70
80
90
100
laboratory number
lab.
mea
n an
d ra
nge,
ug/
kg
accepted dataoutlier datanon compliant dataoverall mean
HT2 toxin in blank cereal mix

43
T2 : blind replicates
9
61
72
73
119
502
503504 505
501, c
0
5
10
15
20
25
30
35
laboratory number
lab.
mea
n an
d ra
nge,
ug/
kgaccepted dataoutlier datanon compliant dataoverall mean
T2 toxin in highly contaminated cereal mix
HT2 : blind replicates
9
61
72
119
501
502
503505
73, gs
504, c
0
50
100
150
200
250
laboratory number
lab.
mea
n an
d ra
nge,
ug/
kg
accepted dataoutlier datanon compliant dataoverall mean
HT2 toxin in highly contaminated cereal mix

44
T2 : blind replicates
9
61
72
73
119
501
502
503
504
505
0
2
4
6
8
10
12
14
16
18
laboratory number
lab.
mea
n an
d ra
nge,
ug/
kgaccepted dataoutlier datanon compliant dataoverall mean
T2 toxin in low contaminated cereal mix
HT2 : blind replicates
9
61
72
119
501502
503
504
505
73, gs
0
10
20
30
40
50
60
70
laboratory number
lab.
mea
n an
d ra
nge,
ug/
kg
accepted dataoutlier datanon compliant dataoverall mean
HT2 toxin in low contaminated cereal mix

45
T2 : blind replicates
972
73
119
501
502
503
504
505
61, nc
0
20
40
60
80
100
120
140
160
180
laboratory number
lab.
mea
n an
d ra
nge,
%accepted dataoutlier datanon compliant dataoverall mean
T2 toxin in spiked blank cereal mix
HT2 : blind replicates
9
72
73
119
501
502
503
504
505
61, nc
0
20
40
60
80
100
120
140
160
180
laboratory number
lab.
mea
n an
d ra
nge,
%
accepted dataoutlier datanon compliant dataoverall mean
HT2 toxin in spiked blank cereal mix


Retieseweg 111, B-2440 Geel - Belgium. Telephone: (32-14) 571 211. http://irmm.jrc.ec.europa.eu Telephone: direct line (32-14) 57 12 83. Fax: (32-14) 57 13 43
E-mail: [email protected]
EUROPEAN COMMISSION DIRECTORATE-GENERALJOINT RESEARCH CENTRE Institute for Reference Materials and MeasurementsCommunity Reference Laboratory for Mycotoxins
Foodstuffs – Determination of T-2 and HT-2 toxins in
cereals, baby food and animal feed – GC/MS method
with immunoaffinity clean-up AA

Page 2 of 13
Contents
1. SCOPE .................................................................................................................................................4
2. PRINCIPLE.........................................................................................................................................4
3. APPARATUS ......................................................................................................................................4
4. REAGENTS AND MATERIALS......................................................................................................6
5. PROCEDURE .....................................................................................................................................8
6. SPIKING PROCEDURE .................................................................................................................10
7. MEASUREMENTS: .........................................................................................................................10
8. DETERMINATION OF CONCENTRATIONS............................................................................12
9. APPENDIX A:...................................................................................................................................13

Page 3 of 13
Foreword
THIS IS A STUDY OF THE METHOD, NOT OF THE LABORATORY. THE
METHOD MUST BE FOLLOWED AS CLOSELY AS PRACTICABLE, AND
ANY DEVIATIONS FROM THE METHOD AS DESCRIBED, NO MATTER
HOW TRIVIAL THEY MAY SEEM, MUST BE NOTED ON THE REPORT
FORM.
WARNING — The use of this protocol can involve hazardous materials, operations
and equipment. This protocol does not purport to address all the safety problems
associated with its use. It is the responsibility of the user of this protocol to establish
appropriate safety and health practices and determine the applicability of
regulatory limitations prior to use.
WARNING – trichothecenes are highly toxic. Gloves and safety glasses should be
worn at all time and all standard and sample preparation stages should be carried
out in a fume cupboard.
NOTE — Care should be taken to avoid contact of organic solvents (standard
solutions, reagents, extracts) with plastics, like pipet tips, containers, etc., as much
as possible. Constituents of the plastics, f.i. plasticizers, might dissolve in the organic
solvent and cause increased background and additional peaks during the GC/MS
run.

Page 4 of 13
1. SCOPE
This protocol specifies a candidate method for the determination of T-2 and HT-2 in
cereals, baby food and animal feed using gas-chromatography with mass spectrometric
detection. This candidate method will be validated for the determination of T-2 and HT-2
via the analysis of naturally contaminated and spiked samples of cereals, baby food,
and/or of animal feed at levels starting from 2 ng/g for the individual toxins or 10 ng/g
for the sum of both toxins.
2. PRINCIPLE
T-2 and HT-2 are extracted from cereal, baby food, and animal feed with a
methanol/water solution. The extract is cleaned up using immunoaffinity columns (IAC).
T-2 and HT-2 are eluted from IAC using acetonitrile, which is evaporated to dryness.
The dry residue is derivatized using a trimethylsilyl reagent. T-2 and HT-2 are
quantitatively assessed by gas chromatography (GC)/ mass spectrometry (MS).
3. APPARATUS
Usual laboratory equipment and, in particular, the following:
3.1. Conical flasks
250 mL capacity with screw caps
3.2. Flask shaker
3.3. Bulb pipettes
2 mL (Class AS, ± 0.01 mL)
10 mL (Class AS, ± 0.02 mL)
20 mL (Class AS, ± 0.02 mL)
100 mL (Class AS, ± 0.08 mL)

Page 5 of 13
3.4. Heating block with nitrogen gas supply or centrifugal vacuum
evaporator
3.5. Vortex mixer
3.6. Analytical balance (d= 0.01g)
3.7. Folded filter paper (f.i. Whatman 113V 18.5 cm)
3.8. Glass micro fibre filter (f.i. Whatman GF/A 15 cm)
3.9. GC/MS instrumentation, comprising the following:
3.9.1. GC: capable of splitless injections onto capillary columns, f.i. Agilent GC
6890N
3.9.2. Autosampler: capable of injecting sufficient volumes of injection
solution with sufficient repeatability
3.9.3. MS: with electron impact ionization, capable of measuring the ions
described in 7.2 with sufficient repeatability, f.i. Agilent MSD 5973N with
EI
3.9.4. Chromatographic column: capable of baseline separation of T-2 and
HT-2 – The following column has shown to be suitable for this separation:
DB-5MS, 30 m x 0.25 mm I.D. x 0.25 µm film thickness
3.10. Glass filter funnel, f.i. 11 cm O.D.
3.11. Autosampler vials of 2.0-2.5 mL with crimp caps
3.12. Conical inserts for autosampler vials (3.11) for small volumes
3.13. Reservoirs for immunoaffinity columns
20-50 mL capacity with adapter for connection to top of immunoaffinity columns

Page 6 of 13
3.14. Volumetric flasks
20 mL (Class A, ± 0.04mL)
3.15. Gastight Hamilton syringes
100, 250, 500 and 1000 µL capacity
3.16. Support rack for immunoaffinity columns (12 mm O.D.)
4. REAGENTS AND MATERIALS
During the analysis, unless otherwise stated, use only solvents and reagents of
recognized analytical grade and only distilled water or water of grade 1 as defined in
EN ISO 3696. Solvents shall be of HPLC or better quality.
4.1. Double distilled or deionized water
4.2. Methanol
4.3. Extraction solvent
Mix 80 parts methanol (4.2) with 20 parts of water (4.1, v/v).
4.4. Methanol solution (16 %)
Mix 10 parts of extraction solvent (4.3) with 40 parts of water (4.1, v/v).
4.5. Acetonitrile
4.6. Dichloromethane
4.7. TMS reagent
5 mL N-methyl-N-trimethylsilyl-trifluoroacetamide (MSTFA)/ Trimethylchloro-
silane (TMCS) (99/1, v/v) are provided labelled as "TMS reagent". After opening
transfer and store reagent in glass container with gas-tight, Teflon-lined cap.

Page 7 of 13
4.8. ISTD solution
5 mL of a solution of 250 ng/mL 13C24-T-2 toxin (Biopure, Tulln, Austria) in
acetonitrile (4.5) is provided labelled as "ISTD solution in acetonitrile". After
opening transfer and store solution in glass container with gas-tight, Teflon-lined
cap.
4.9. T-2/ HT-2 stock solution
10 mL of a mixed standard solution of T-2 and HT-2 toxin in acetonitrile (4.5) at
100 and 200 ng/mL, respectively, are provided, labelled with "T-2/HT-2 standard
in acetonitrile". After opening transfer and store solution in glass container with
gas-tight, Teflon-lined cap.
4.10. T-2/ HT-2 diluted solution for calibration
To a 20 mL volumetric flask (3.14) add 2.0 mL of the T-2/ HT-2 stock solution
(4.9) using a 2 mL bulb pipette (3.3) and make up to 20.0 mL with acetonitrile
(4.5). This will result in a diluted solution with 10 and 20 ng/mL of T-2 and HT-
2, respectively.
4.11. Calibration solutions
Using Hamilton syringes (3.15), to 6 autosampler vials (3.11) add:
Vial T-2/ HT-2 stock
solution (4.9)
[µL]
T-2/ HT-2 diluted
solution (4.10)
[µL]
ISTD
solution (4.8)
[µL]
Amount (T-2/
HT-2)
[ng]
1 100 100 1/ 2
2 500 100 5/ 10
3 200 100 20/ 40
4 350 100 35/ 70
5 500 100 50/ 100
6 100 Reagent blank
This will create 5 levels of calibration solutions containing 1, 5, 20, 35, and 50 ng
T-2, and 2, 10, 40, 70, and 100 ng HT-2 plus a reagent blank.

Page 8 of 13
4.12. Spiking solution
You are provided with two vials containing 3 mL each of spiking solutions of
unknown T-2 and HT-2 concentrations in acetonitrile (4.5) labelled as "Spike C
solution in acetonitrile" and one of either "Spike A solution in acetonitrile" or "
Spike B solution in acetonitrile".
4.13. Test samples
Eight naturally contaminated and four blind blank samples in coded plastic
containers and four blank samples, labelled "Spike C" and one of either "Spike
A" or "Spike B", are provided.
4.14. Immunoaffinity columns with antibodies specific to T-2 and HT-2
18 EASI-EXTRACT T-2 & HT2 columns are provided (R-BIOPHARM RHÔNE
LTD, Glasgow, Scotland G20 0SP)
5. PROCEDURE
5.1. Extraction of T-2 and HT-2
Weigh, to the nearest 0.1 g, 25.0 g of the test sample and 1.0 g of sodium chloride
into a 250 mL conical flask (3.1), add 100.0 mL of extraction solvent (4.3), cap and
shake vigorously by hand, so that the material disperses evenly. Then put on a flask
shaker (3.2) for 30 min. The material should be mixed well without collecting in the
top of the flask.
Allow the sample to settle after shaking. Prepare a filter funnel (3.10) and filter paper
(3.7). Filter the extracted sample into a 250 mL conical flask (3.1). To 10.0 mL of
filtrate add 40.0 ml of water (4.1) and mix. Filter the diluted extract through a glass
microfibre filter (3.8) and collect the filtrate.
5.2. Clean up
Take an immunoaffinity column (IAC, 4.14) and attach a reservoir (3.13), do not
empty storage solution from column. To the reservoir add 5 ml of the 16 % methanol

Page 9 of 13
solution (4.4), 100 µL of the ISTD solution (4.8, using a 100 µL gastight Hamilton
syringe (3.15), and 10.0 mL of the diluted, filtered extract (5.1, equivalent to 0.5 g
sample). Mix carefully and allow everything to pass slowly through the column.
Preferably this is driven by gravity without application of any positive or negative
pressure (vacuum). The result will be a flow rate of about one drop per second.
After the extract has passed completely through the IAC, wash with 10 ml of 16 %
methanol solution (4.4) in order to avoid precipitation of extract constituents in the
IAC sepharose gel. Then wash with 20 mL of water (4.1).
Using a large syringe, or something similar, with an appropriate adaptor to fit the
IAC, pass air through the IAC in order to expel excess water. Then place an
autosampler vial (3.11) under the IAC and elute with 0.75 mL of acetonitrile (4.5),
collecting the eluate with the purified toxins. After all of the acetonitrile (4.5) has
passed through the column, wait for approximately one minute. Then add another
0.75 mL of acetonitrile (4.5) and continue to collect the eluate in the same vial.
Carefully pass air through the column in order to collect most of the applied
acetonitrile (4.5).
5.3. Derivatization for gas chromatography:
Evaporate the eluted extract (5.2) or the calibration solutions (4.11) to dryness. This
can be done either with a centrifugal vaccum evaporator or under a gentle stream of
nitrogen at 50 �C in a heating block (3.4). To ensure that the evaporated samples are
absolutely free of water for derivatisation add some dichloromethane (4.6) to the
visually dry vials and dry again.
To the dry residue add 50 �L of MSTFA/TMCS (99/1, v/v), cap vial and shake on
vortex mixer for 30 seconds, making sure the lower part of the vial is thoroughly
washed with the reagent. The reagent is moisture sensitive so the capping should
be done immediately. Incubate at room temperature for 30 minutes and transfer
solution with a glass Pasteur pipet to an autosampler vial (3.11) with conical insert
(3.12) for GC/MS analysis. Again, because of the moisture sensitivity this should
be done as quickly as possible to minimize contact with ambient air.

Page 10 of 13
6. SPIKING PROCEDURE
To 25.0 g of spiking material add 1.0 mL of the respective spiking solution (see also
attached "Spiking Protocol"). Let stand for one hour before proceeding with the
sample extraction (5.1).
7. MEASUREMENTS:
7.1. GC operating conditions
Using the equipment outlined in 3.9.1, the following conditions have proven to
produce adequate separation:
� Injection volume: 1 �L with injection port at 250 �C;
� Injection mode: pulsed splitless with a 160 kPa pulse for 1 min (regular splitless
will work with appropriate adjustment of the initial temperature hold time);
� GC oven conditions: initial temperature 140 �C for 1 min, 60 �C/ min to 250 �C,
10 �C/ min to 300 �C and hold for 3 min;
� Carrier gas: helium at a constant flow of 1.2 mL/min;
� Attention: There is a substance co-eluting with HT-2 that might generate a
significant m/z 185 signal. Care should be taken to optimize the separation
to achieve baseline separation of this substance from HT-2. With the stated
conditions this was possible (see attached chromatograms).
7.2. MS operating conditions
� GC/MS: SIM mode with electron impact ionization using the following ions:
185, 350, 436 m/z for T-2, 185, 347, 466 m/z for HT-2, and 365, 455 m/z for 13C24-T-2 (ISTD).
7.3. Batch (Sequence) composition
Each of the 12 coded test samples and the four spike samples are to be prepared once
and to be injected in duplicate. For each batch (sequence) of samples that is run on
the GC prepare two reagent blanks and two sets of 5 levels of the calibration
solutions (4.11). Inject each preparation of the reagent blank and the calibration

Page 11 of 13
solutions once at the beginning of the batch of samples and again at the end. This
results in four injections, two injections per preparation, of the reagent blank and
each level of the calibration solutions.
7.4. OPTIONAL: In-house standards
If there are in-house standards for T-2 and HT-2 toxins dilute these standards such
that a mixed stock solution of 100 ng/mL T-2 and 200 ng/mL HT-2 in acetonitrile
(4.5) is created, according to 4.9. Then add three times 250 µL of this in-house stock
solution to three autosampler vials (3.11). To each of these three vials also add 100
µL ISTD solution (4.8). Then dry and derivatize as described in 5.3. Run these three
preparations in duplicate with a sample batch.
7.5. Identification criteria
For the reagent blank runs display the extracted ion chromatograms for the ions 365,
and 455 m/z. There should be only one location where peaks line up for both traces.
These peaks represent the ISTD (4.8). Note the retention time.
Next repeat the above with ions 185, 350, and 436 m/z for each of the calibration
runs. At the retention time of the ISTD peaks in all three traces should line up. These
peaks represent T-2. Calculate the on ratios of the peak heights of ion 350 divided by
ion 185, and of ion 436 divided by ion 185.
Next repeat the above with ions 185, 347, and 466 m/z. Close to the already
identified peak of T-2 peaks in all three traces should line up. These peaks represent
HT-2. Note the retention time and calculate the ion ratios of the peak heights of ion
347 divided by ion 185, and ion 466 divided by ion 185.
The retention times and ion ratios of T-2 and HT-2 will be used to identify the
respective substance in the sample chromatograms.
For this display the appropriate extracted ion chromatograms and near the retention
time of the respective substance look for three peaks lining up, f.i. ions 185, 350, and
436 m/z of T-2 and the retention time of T-2. Only if peaks in all three traces line up
and have similar ion ratios as established from the calibration runs of the respective
substance (f.i., 350/185 and 436/185 for T-2) is the peak positively identified. Only
positively identified peaks shall be used for the determination of the concentration.

Page 12 of 13
7.6. Calibration
Using the extracted ion currents for ions (m/z) 436 (T-2), 466 (HT-2), and 455
(ISTD) integrate the peaks representing the respective substances. Divide the peak
areas of T-2 (A436) or HT-2 (A466) by the peak area of the ISTD (A455).
RT-2 = A436/A455 or RHT-2 = A466/A455 (I)
The resulting area ratios (RT-2, RHT-2) of the four injections of the reagent blank and
the 5 levels of calibration solutions are then plotted versus the corresponding
amounts (4.11). The expected calibration plot has a slight curvature to it best
described by a second degree polynomial. But since the quadratic term is small and
for simplicity reasons a simple linear regression of the form
y = b0 + b1x (II)
is to be performed, with y being the area ratio for either T-2 or HT-2, x the respective
amount of T-2 or HT-2, b0 the intercept, and b1 the slope. This is the calibration
function.
8. DETERMINATION OF CONCENTRATIONS
Inverting the calibration function (7.5, II) yields the analysis functions:
1
0
bbyx �
� (III)
Inserting the intercept (b0) and slope (b1) of the calibration function and the area
ratios (y) for either T-2 or HT-2 (7.5, I) of the unknown samples yields the estimated
amounts x for T-2 or HT-2, respectively.
Since the cleaned-up extract represents 0.5 g of the original sample multiplying by
two yields the final concentration estimate CT-2/HT-2 in µg/kg:
CT-2 = 2xT-2 (IV)
CHT-2 = 2xHT-2 (V)
Page 13 of 13
9. Appendix A:
Example chromatograms

File :C:\MSDChem\1\DATA\2006\11 November\20061128\0201002.DOperator : abrAcquired : 28 Nov 2006 9:36 using AcqMethod T2HT2_10KMIN.MInstrument : Instrument #1Sample Name: Animal FeedMisc Info :Vial Number: 2
7.55 7.60 7.65 7.70 7.75 7.80 7.85 7.90 7.950
500
1000
1500
2000
2500
3000
3500
4000
Time-->
Abundance TIC: 0201002.D
7.55 7.60 7.65 7.70 7.75 7.80 7.85 7.90 7.95
100
150
Time-->
Abundance Ion 436.00 (435.70 to 436.70): 0201002.D
7.55 7.60 7.65 7.70 7.75 7.80 7.85 7.90 7.95
200
400
Time-->
Abundance Ion 466.00 (465.70 to 466.70): 0201002.D
7.55 7.60 7.65 7.70 7.75 7.80 7.85 7.90 7.95
200
400
Time-->
Abundance Ion 455.00 (454.70 to 455.70): 0201002.D

File :C:\MSDChem\1\DATA\2006\11 November\20061128\0301003.DOperator : abrAcquired : 28 Nov 2006 9:51 using AcqMethod T2HT2_10KMIN.MInstrument : Instrument #1Sample Name: Calibration solutionMisc Info :Vial Number: 3
7.55 7.60 7.65 7.70 7.75 7.80 7.85 7.90 7.950
1000
2000
3000
4000
5000
6000
7000
8000
Time-->
Abundance TIC: 0301003.D
Unknown
HT-2 T-2
7.55 7.60 7.65 7.70 7.75 7.80 7.85 7.90 7.95
200
400
600
Time-->
Abundance Ion 436.00 (435.70 to 436.70): 0301003.D
T-2
7.55 7.60 7.65 7.70 7.75 7.80 7.85 7.90 7.95
500
1000
Time-->
Abundance Ion 466.00 (465.70 to 466.70): 0301003.D
HT-2
7.55 7.60 7.65 7.70 7.75 7.80 7.85 7.90 7.95
500
Time-->
Abundance Ion 455.00 (454.70 to 455.70): 0301003.D
ISTD


Retieseweg 111, B-2440 Geel - Belgium. Telephone: (32-14) 571 211. http://irmm.jrc.ec.europa.eu Telephone: direct line (32-14) 57 12 83. Fax: (32-14) 57 13 43. E-mail: [email protected]
EUROPEAN COMMISSION DIRECTORATE-GENERAL JOINT RESEARCH CENTRE Institute for Reference Materials and Measurements Community Reference Laboratory for Mycotoxins
Annex IV: Geel, 04. Dec, 2006 AB D(2006)
Spiking Protocol:
In order to calculate the recovery of the method you are supplied with 2 different vials containing 3 mL each of a mixed T-2/ HT-2 standard in acetonitrile
The vial marked with "Spike A solution" has to be used to spike the two samples marked "Spike A".
The vial marked with "Spike C solution" has to be used to spike the two samples marked "Spike C".
Prior to analysis shake all containers vigorously (e.g. with a vortex shaker).
These containers are exclusively reserved for the spiking experiments and MUST NOT be used for direct analysis.
After shaking the spike sample containers weigh, to the nearest 0.1 g, 25.0 g of the blank material into a clean flask and add exactly 1.0 mL of the respective spiking solution (4.12, e.i. "Spike A solution" for "Spike A" sample) using a 1000 µL Hamilton syringe (3.16). Dispense right onto the sample making sure that the spiking solution is evenly distributed across the sample. Do not dispense onto the glass surface of the flask. Gently shake the flask by hand to achieve some mixing. Leave the spiked test sample for at least 1 h before proceeding with the extraction as described in the protocol, section 5.1, paragraph 2.


Annex V:T-2/ HT-2 collaborative trial GC/MS
Laboratory:
Results table:
Sample CodeMean
Concentration T-2
Mean Concentration
HT-2
Mean Concentration
SUMRT Area
436Ratio
350/185Ratio
436/185 RT Area 436
Ratio 350/185
Ratio 436/185 RT Area
466Ratio
347/185Ratio
466/185 RT Area 466
Ratio 347/185
Ratio 466/185 RT Area
455Ratio
455/365 RT Area 455
Ratio 455/365 Remarks
000000000000
Spike A1 0Spike A2 0Spike B1 0Spike B2 0Spike C1 0Spike C2 0
Reagent Blank/Prep 1 0Reagent Blank/Prep 2 0
Cal 1/Prep 1 1 2 3Cal 1/Prep 2 1 2 3Cal 2/Prep 1 5 10 15Cal 2/Prep 2 5 10 15Cal 3/Prep 1 20 40 60Cal 3/Prep 2 20 40 60Cal 4/Prep 1 35 70 105Cal 4/Prep 2 35 70 105Cal 5/Prep 1 50 100 150Cal 5/Prep 2 50 100 150
In-House Standard/Prep 1 25 50 75In-House Standard/Prep 2 25 50 75In-House Standard/Prep 3 25 50 75
Run 1
The column "Mean Concentration SUM" will then show the sum of both concentrations.
Fields for one full calibration are provided in this table. Also at the end fields for the optional in-house standard measurement are provided.
Run 2ISTD
Run 1 Run 1 Run 2Run 2T-2 HT-2
Instructions :
If more calibrations have been performed enter them in the "Additional calibrations" work sheet.
Name of the participant
00X (code of the participant)
In the following four columns for the peak of T-2 enter the retention time (RT, 2 decimals), peak area (integer only) of ion 436 (Area 436), and ion ratios (3 decimals) of ions 350/185 and of ions 436/185, for the first injection of each injection solution .In the next four columns for the peak of T-2 enter the respective data for the second injection of each injection solution.In the next eight columns for the peak of HT-2 enter the respective data for both injections of each injection solution.Finally, in the last six columns for the ISTD peak enter the respective information for both injections of each injection solution.
Please carefully fill in all the requested information. If for a certain reason data is not available leave field empty and make a note in the "Remarks" column. In the column "Sample Code" below enter the codes of the samples you have received.In the columns "Mean Concentration" enter the average of the calculated concentration of the duplicate runs for either T-2 or HT-2 for each of the samples.


Retieseweg 111, B-2440 Geel - Belgium. Telephone: (32-14) 571 211. http://irmm.jrc.ec.europa.eu Telephone: direct line (32-14) 57 12 83. Fax: (32-14) 57 13 43. E-mail: [email protected]
EUROPEAN COMMISSION DIRECTORATE-GENERAL JOINT RESEARCH CENTRE Institute for Reference Materials and Measurements Community Reference Laboratory for Mycotoxins
Annex VI: Geel, 04. Dec, 2006 AB D(2006)
Results Questionnaire for the T-2/HT-2 Collaborative Study
Name of the participant
00X (code of the participant)
PLEASE ANSWER THESE QUESTIONS AND USING THE SUBJECT LINE "T-2/ HT-2 trial" SEND THEM TO:
CRL on Mycotoxins
European Commission
DG Joint Research Centre
Institute for Reference Materials and Measurements
Retieseweg 111, B-2440 Geel, Belgium
Fax No: +32-14-571343
Email: [email protected]
AFTER YOU HAVE SUBMITTED YOUR RESULTS.

Page 2 of 6
General comments on the method:
1. Did you already use a similar method for the determination of T-2/ HT-2 including immunoaffinity clean-up or solid phase extraction and GC/MS detection?
Yes No
If yes, please state source:
2. Have you been familiar with the procedures used in this method?
Yes No
If no, please specify briefly which procedures were unfamiliar to you:
3. Was the method description adequate?
Yes No
4. What criticisms and/or suggestions could you make concerning the method and/or its performance? (Please attach additional sheets if necessary).

Page 3 of 6
Specific remarks about execution of the method:
5. What type of shaker was used for the initial extraction of materials?
Side-to-side Wrist action Rotational
Other please specify:
Type/Manufacturer:
6. Did you encounter any problems during filtration (e.g. low flow rate)?
Yes No
If yes, please state the exact problem and for which sample(s) this occurred (include codes):
7. What procedure was used for sample application to the IAC?
Gravity Vacuum
Other please specify:
8. Did you encounter problems during application of the extract to the IAC (e.g. slow flow rate, discolouration of immunoaffinity gel)?
Yes No
If yes, please state the exact problem and for which sample(s) this occurred (include codes).

Page 4 of 6
9. What was the average run time for sample application to the IAC
minutes
10. Did you encounter any problems during evaporation?
Yes No
If yes, please state the exact problem and for which sample(s) this occurred (include codes):
11. What evaporation system was used?
Vacuum centrifuge Heating block with N2
Other please specify:
12. How long were the samples dried for?
minutes
13. Specify manufacturer and model of the gas chromatography system used:
14. Specify manufacturer and model of the mass spectrometer used:

Page 5 of 6
15. Specify specifications (Manufacturer, Name, Dimensions) of the GC column used:
16. Specify GC parameters: Injection volume in μL:
Injector temperature [ºC]:
Injection mode (split, splitless, or pulsed modes thereof):
Temperature program [ºC]:
Transfer line temperature [ºC]:
Head pressure (if constant pressure mode) or flow rate (if constant flow):
Carrier gas:
17. Specify MS parameters (if applicable): Ion source temperature [ºC]:
Ionization energy [eV]:
Scan speed [scans/s]:
18. Specify whether peaks were integrated valley-to-valley or using a horizontal baseline:
Valley-to-Valley Horizontal baseline

Page 6 of 6
19. If manual integration was used, specify the samples and peaks affected and the reasons why:
20. Was any data smoothing applied before integration?
Yes No
If yes, please specify name of the algorithm:
21. Describe any deviation from the protocol other than what has been mentioned above:
Please supply copies of all chromatograms obtained (similar layout as the chromatograms in the appendix of the method protocol) and detailed calculations.
Thank you for completing this questionnaire.

European Commission EUR 23560 EN – Joint Research Centre – Institute for Reference Materials and Measurements Title: Validation of an Analytical Method to Determine the Content of T-2 and HT-2 toxinx in Cereals and Compound Animal Feed by Immunoaffinity Column Clean-up and GC-MS Author(s): A. Breidbach, V. Povilaityte, C. Mischke, I. Doncheva, H. van Egmond, J. Stroka Luxembourg: Office for Official Publications of the European Communities 2008 – 78 pp. –21 x 29.7 cm EUR – Scientific and Technical Research series – ISSN 1018-5593 ISBN 978-92-79-10532-6 DOI 10.2787/93811 Abstract A method for the determination of T-2 toxin and HT-2 toxin in cereals and compound animal feed was validated by collaborative study.
In short, the method is as follows: A test portion of a sample is extracted with a mixture of methanol/water (80/20, v/v). This raw extract is then diluted, filtered, and applied to an immunoaffinity column. After washing and elution with acetonitrile the eluate is evaporated to dryness. T-2 and HT-2 toxins in the dry residue are then derivatised with N-methyl-N-trimethylsilyl-trifluoroacetamid (MSTFA)/ trimethylchlorosilane (TMCS) (99/1, v/v), injected into a gas chromatograph, and detected and quantified by mass spectrometry.
Fourteen laboratories from ten different countries were selected to participate in the collaborative study. They received six different test materials as blind duplicates. The test materials consisted of a blank cereal mix, two cereal mixes naturally contaminated with T-2 and HT-2 toxins at different levels, a blank compound animal feed, and two compound animal feeds naturally contaminated with T-2 and HT-2 toxins at different levels. Furthermore, two blank cereal mixes and two blank compound animal feeds together with specific spiking solutions were provided for recovery determination. The sum of the mass fractions of T-2 & HT-2 toxins after spiking were 50 µg/kg in the cereal mix, and 75 µg/kg in the compound animal feed.
Reported apparent recoveries in the cereal mix ranged from 59 to 143% for the sum of T-2 & HT-2 toxins with a mean value of 105%. Reproducibility relative standard deviations (RSDR) for the cereal matrix were 30% at a natural contamination level of ca. 25 µg/kg, 21% at ca. 87 µg/kg, and 27% for the spiked material at 50 µg/kg. For compound animal feed the recovery values ranged from 87 to 145% with 113% for the mean value. The RSDR values were 25% at a natural contamination level of ca. 92 µg/kg, 19% at ca. 125 µg/kg, and 16% for the spiked material at 75 µg/kg. The Horwitz ratios (HorRat) ranged from 0.7 to 1.4.
European Commission Regulation 401/2006 [1] lays down method performance criteria for the control of foodstuffs only. Even though the validated method applies to cereals and compound feed it meets all of those criteria. Therefore it is suited for official feed control.


How to obtain EU publications Our priced publications are available from EU Bookshop (http://bookshop.europa.eu), where you can place an order with the sales agent of your choice. The Publications Office has a worldwide network of sales agents. You can obtain their contact details by sending a fax to (352) 29 29-42758.

The mission of the JRC is to provide customer-driven scientific and technical support for the conception, development, implementation and monitoring of EU policies. As a service of the European Commission, the JRC functions as a reference centre of science and technology for the Union. Close to the policy-making process, it serves the common interest of the Member States, while being independent of special interests, whether private or national.
LA
-NA
-23560-EN-C
Top Related