


Languages
Pages
Legal


6th International Conference on Integration of Renewables and DER
Kyoto, Japan
11/18/2014
Using Hosting Capacity Methodology to
Develop Simplified Screens for New Solar PV
Interconnections
Jeff Smith, Matt Rylander
EPRI
Robert Broderick
Sandia National Laboratory
Barry Mather
NREL

2 © 2014 Electric Power Research Institute, Inc. All rights reserved.
Developing New Screening Methods CPUC/EPRI/DOE Project
• Objective
– Develop improved screen that streamlines process without over/underestimating PV impacts
• Approach
– Characterize 8000+ feeders in California for
– Clustering analysis to select 15 feeders
– Perform detailed hosting capacity assessments to determine range of impacts and issues
– Develop improved screens
– Modeling and field validation
• Project Team
– EPRI, Sandia, NREL, PG&E, SDG&E, SCE, ITRON
• Ongoing effort
– Results available 2014/2015
Hosting capacity
Detailed modeling
Clustering
Improved
Screening
Methods
3 © 2014 Electric Power Research Institute, Inc. All rights reserved.
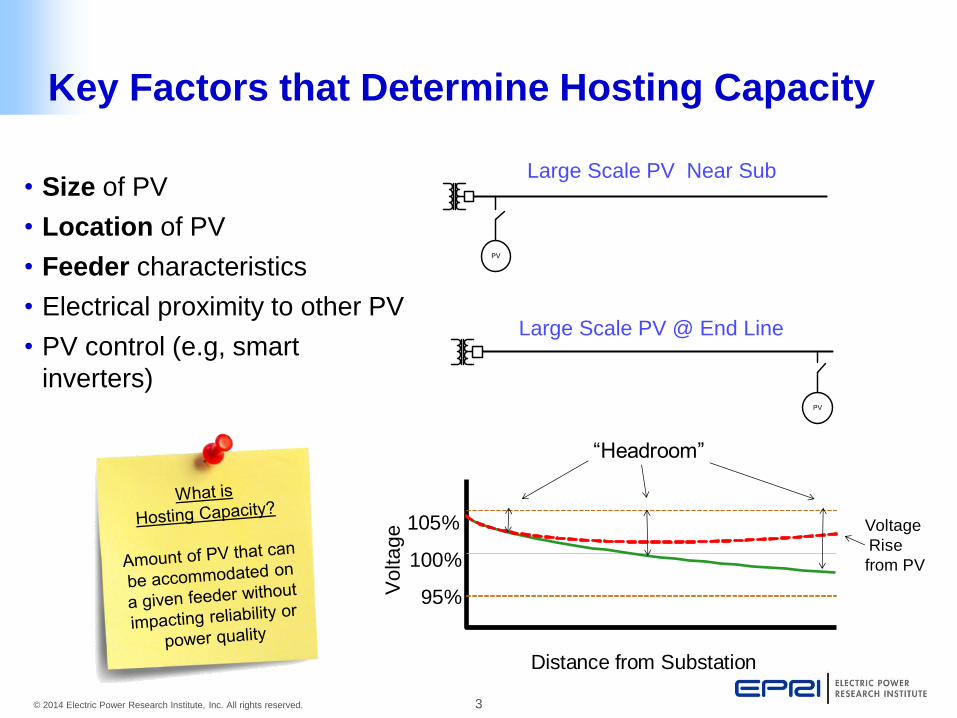
Key Factors that Determine Hosting Capacity
PV
PV
Large Scale PV Near Sub
Large Scale PV @ End Line
• Size of PV
• Location of PV
• Feeder characteristics
• Electrical proximity to other PV
• PV control (e.g, smart
inverters)
105%
100%
95%
Distance from Substation
Vo
lta
ge Voltage
Rise
from PV
“Headroom”

4 © 2014 Electric Power Research Institute, Inc. All rights reserved.
Feeder Hosting Capacity: A Brief Primer
Baseline – No PV
PV Penetration 1
PV Penetration 2
PV Penetration 3
Beyond…
Increase Penetration
Levels Until Violations
Occur
• voltage
• protection
• power quality
• thermal
PV Systems
Process is
repeated
100’s of times
to capture
many
possible
scenarios

5 © 2014 Electric Power Research Institute, Inc. All rights reserved.
Hosting Capacity Illustration of Overvoltage Results
2500 cases shown
Each point = highest primary voltage
ANSI voltage limit
Ma
xim
um
Fe
ed
er
Vo
lta
ge
s (p
u)
Increasing penetration (kW)
Minimum Hosting Capacity
Maximum Hosting Capacity
Total PV:
540 kW
Total PV:
1173 kW Voltage violation
No observable violations regardless of
size/location
Possible violations based upon size/location
Observable violations occur regardless of
size/location
6 © 2014 Electric Power Research Institute, Inc. All rights reserved.
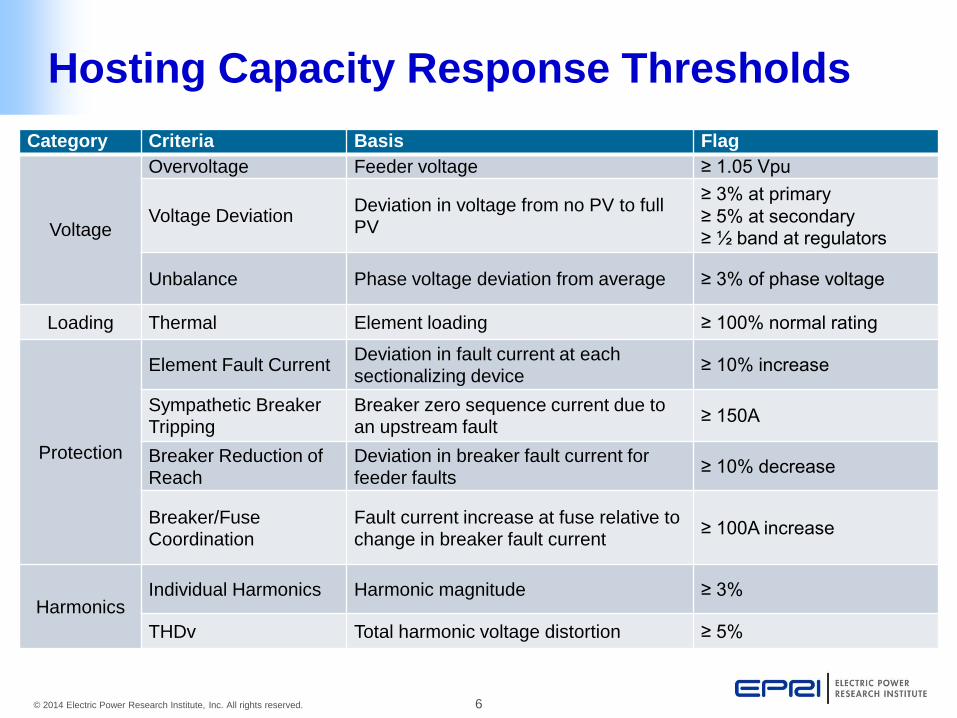
Hosting Capacity Response Thresholds
Category Criteria Basis Flag
Voltage
Overvoltage Feeder voltage ≥ 1.05 Vpu
Voltage Deviation Deviation in voltage from no PV to full PV
≥ 3% at primary
≥ 5% at secondary ≥ ½ band at regulators
Unbalance Phase voltage deviation from average ≥ 3% of phase voltage
Loading Thermal Element loading ≥ 100% normal rating
Protection
Element Fault Current Deviation in fault current at each sectionalizing device
≥ 10% increase
Sympathetic Breaker Tripping
Breaker zero sequence current due to an upstream fault
≥ 150A
Breaker Reduction of Reach
Deviation in breaker fault current for feeder faults
≥ 10% decrease
Breaker/Fuse Coordination
Fault current increase at fuse relative to change in breaker fault current
≥ 100A increase
Harmonics Individual Harmonics Harmonic magnitude ≥ 3%
THDv Total harmonic voltage distortion ≥ 5%
7 © 2014 Electric Power Research Institute, Inc. All rights reserved.
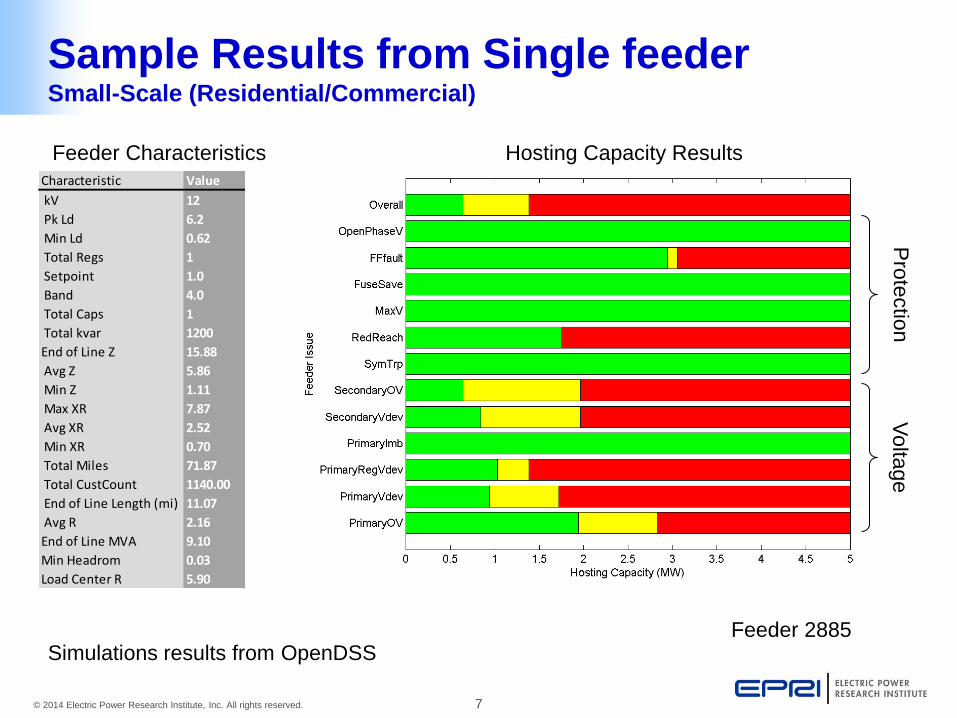
Sample Results from Single feeder Small-Scale (Residential/Commercial)
Characteristic Value
kV 12
Pk Ld 6.2
Min Ld 0.62
Total Regs 1
Setpoint 1.0
Band 4.0
Total Caps 1
Total kvar 1200
End of Line Z 15.88
Avg Z 5.86
Min Z 1.11
Max XR 7.87
Avg XR 2.52
Min XR 0.70
Total Miles 71.87
Total CustCount 1140.00
End of Line Length (mi) 11.07
Avg R 2.16
End of Line MVA 9.10
Min Headrom 0.03
Load Center R 5.90
Feeder Characteristics Hosting Capacity Results
Feeder 2885
Pro
tectio
n
Volta
ge
Simulations results from OpenDSS

8 © 2014 Electric Power Research Institute, Inc. All rights reserved.
Residential/Commercial Rooftop PV Overview of Results from 10 California Feeders
SDG&E
PG&E
Feeder 440 Feeder 683 Feeder 631 Feeder 296 Feeder 404
Feeder 888 Feeder 1354 Feeder 2885 Feeder 281 Feeder 2093

9 © 2014 Electric Power Research Institute, Inc. All rights reserved.
Detailed Hosting Capacity Analysis Question: Can load be used to predict hosting capacity?
0
0.5
1
1.5
2
2.5
3
3.5
0 2 4 6 8 10 12 14 16 18
Min
imu
m H
ost
ing
Cap
acit
y (M
W)
Peak Load (MW)
Answer: Not without knowledge
of other feeder characteristics
No correlation between hosting
capacity and peak load
10 © 2014 Electric Power Research Institute, Inc. All rights reserved.
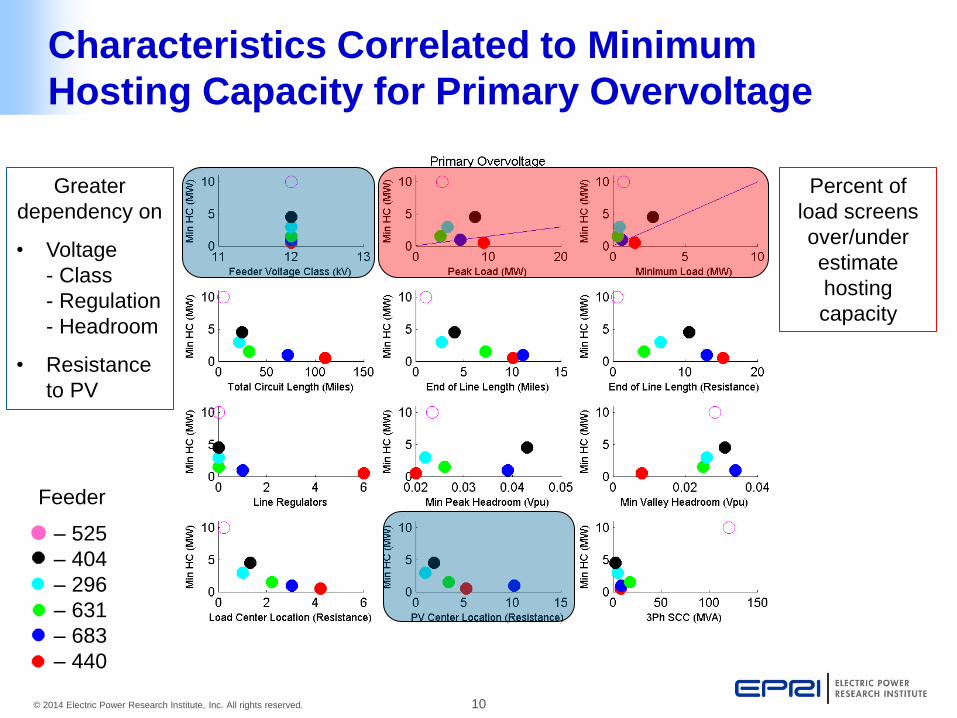
Characteristics Correlated to Minimum
Hosting Capacity for Primary Overvoltage
Percent of
load screens
over/under
estimate
hosting
capacity
Greater
dependency on
• Voltage
- Class
- Regulation
- Headroom
• Resistance
to PV
– 525
– 404
– 296
– 631
– 683
– 440
Feeder

11 © 2014 Electric Power Research Institute, Inc. All rights reserved.
Summary
• Alternative screening methods are needed
• Improved methods can be developed that efficiently and effectively screen new interconnection requests
• From the trends in hosting capacity results, new screening techniques can be developed
• Improved screening likely to be based upon
– Topological data
• Static data (voltage class/regulation approach, end of line length, total feeder length, etc.), and/or
– Feeder response
• Voltage and protection response
• Using commercial tools (CYME, SynerGEE, Milsoft, etc)
• Next steps

12 © 2014 Electric Power Research Institute, Inc. All rights reserved.
Project Team

13 © 2014 Electric Power Research Institute, Inc. All rights reserved.
Questions
Contact:
Jeff Smith
Manager, Power System Studies
EPRI
Top Related