


Languages
Pages
Legal


Using an outside view of project risk for
realistic risk and capability assessments
Alexander Budzier, DPhil
Fellow in Management Practice
Saïd Business School, University of Oxford

Our Research Insights Helped Us to Understand the
Root Causes of Issues and Develop Long-Lasting Solutions
3
Symptoms
Root
causes
Issue Fix
Cost overruns,
schedule delays,
benefit shortfalls
Fixed price contact,
risk sharing, sticks &
carrots
Causes Unknown geology,
scope changes etc.
Reactive risk
management
• Optimism and
political bias
• Culture, mindsets
and behaviors
Predict & provide
Predict & prevent
▪ Long-lasting solutions need to
understand and address real
causes and their root causes
▪ Quick fixes only offer limited help
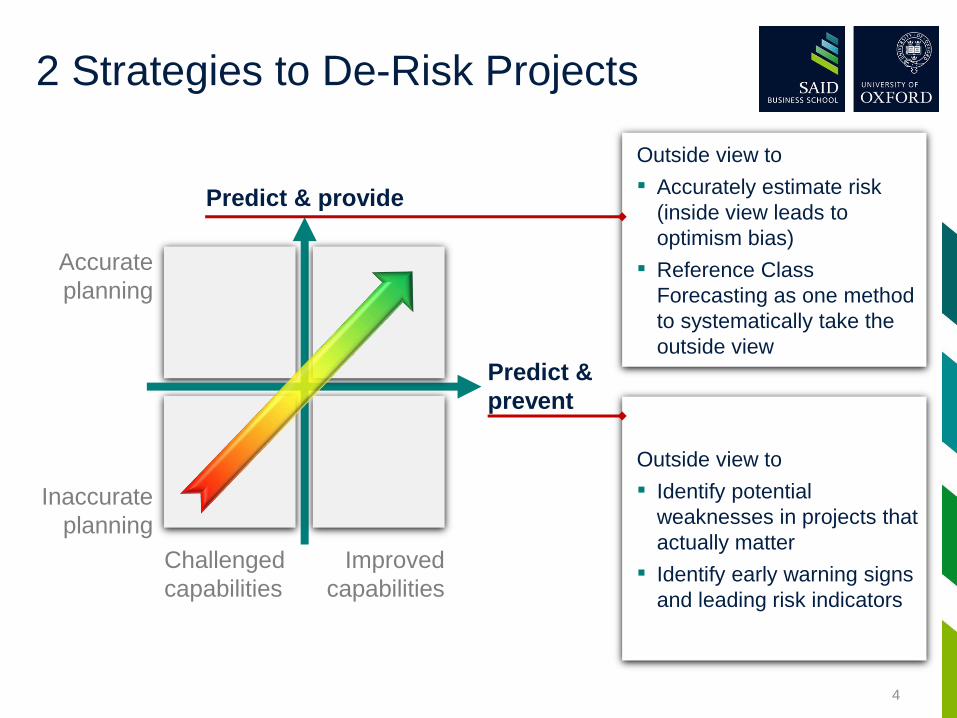
2 Strategies to De-Risk Projects
4
Accurate
planning
Outside view to
▪ Accurately estimate risk
(inside view leads to
optimism bias)
▪ Reference Class
Forecasting as one method
to systematically take the
outside view
Outside view to
▪ Identify potential
weaknesses in projects that
actually matter
▪ Identify early warning signs
and leading risk indicators
Challenged
capabilities
Inaccurate
planning
Improved
capabilities
Predict & provide
Predict &
prevent

The 3 Steps of RCF
1. Identify relevant reference class of past, similar
projects
2. Establish probability distribution for the selected
reference class
3. Compare specific project with distribution, in order to
establish most likely outcome
5© Bent Flyvbjerg

* The p-value of statistical tests indicates the strength of the evidence, if p < 0.05 the test is significant – here indicating that there is strong statistical evidence that these project types are different from HSR
Source: Oxford Database, August 2015 (Sample of n=361 projects)6
Statistical analysis of risk profile• Risk profile characterized by distribution of cost risk in reference classes
• Peak = P50 risk• Tail = Risks > P50
Building a Reference Class

7
• Bottom-up QRA estimates the
35% contingency to be a P90
• P90 = 9 out of 10 projects would
not exceed this envelope
• RCF shows that 35% contingency
is equivalent to P66
Building a Reference Class for HS2

8
• HS2: 35% contingency = P66
• P90 (conservative estimate) = 120%
• P95 (very conservative estimate) = 152%
Building a Reference Class for HS2

Comparing the Inside View OBC with
the Outside View RCF Estimate
9
2
1
Regress most likely estimate
toward median of reference class1
Expand estimate of tail risk to
to tail of the reference class 2

Increased Design Certainty Should (in Theory)
Reduce Cost Uncertainty
10
Project cycle
SBC OBC FBC Tender Construction Completion
Final cost
Increased design
certainty
Reduced cost
uncertainty

Different Reference Classes for Different
Points of the Estimate
11
Strategic Business Case
Outline Business Case
Full Business Case
Contract Control Totals(total value of contracts)
-10%
0%
10%
20%
30%
40%
50%
60%
70%
80%
90%
100%
110%
120%
130%
140%
20 25 30 35 40 45 50 55 60 65 70 75 80
Co
st R
isk
Level of Certainty of the Estimate (P Value)
• 35% contingency covers cost risk
exposure of
• SBC: P63
• OBC/FBC: P66
• Contract control totals: P77
35%

Key Concern is the Tail Risk in the
Reference Class Forecast
-70%
-60%
-50%
-40%
-30%
-20%
-10%
0%
10%
20%
30%
40%
50%
60%
70%
80%
90%
100%
110%
120%
130%
140%
150%
0 10 20 30 40 50 60 70 80 90 100
Con
ting
en
cy n
eed
ed
P-value
12
35%
• Key concern is tail risk, when
risks start to grow
exponentially with increasing
uncertainty
• Tail of the RCF begins at P66
• 1 in 3 projects in reference
class had cost overruns >
35%

Example of HSR Project in the Tail
• NSB Nuremberg-Ingolstadt, Germany
• First proposed 1973, planning started 1991, decision to build 1994
• Construction start 2000
• Opening 2006
• Estimated cost: 2.3 bn EUR (YoE); estimated opening 2003
• Length 77.4 km incl. 15 km in tunnels, 82 viaducts
• Cost overrun of +133%
• Reasons for cost overrun• Geological problems in tunneling sections; hydrology problems along the alignment
• Changed security concept after the Eschede accident in 1998
• Increased environmental impact mitigation cost
• Underground archeological remains
• Unanticipated inflation
• Late design submission of pre-fab track bed
• Cost savings: not upgrading several station and using instead of upgrading existing track,
change of tunneling method
• Cost for interest payments
• Issues with integrating the HSR line into operational railway meant that travel time
savings were only achieved for end-to-end journeys, no clear concepts for tact
times, critique of abandoning same platform connections
• 2010 travel speed reduced from 300 km/h to 160 km/h due to quality issues with
the rubber mats in the track bed
13

Characteristics of Projects Exceeding
Contingency
14
Area Description HS2 Response
Design Late design changes due to external
demands
Hybrid Bill process controls scope
Funding Problems with funding causing
changes to profile. Including
excessive interest payments.
Agreed funding profile up front and
funding mechanisms including
necessary insurance strategy.
Amplification Problems on critical path escalate
rapidly without ‘damping’
Designing schedule to create higher
confidence at critical points eg end of
pre-construction. Early contractor
involvement in design
Integration Failing to appreciate and understand
scale of integration required to deliver
Structure of contracts. Assurance
approach. Technical specification and
assurance
Quality Problems with quality of work
completed
Assurance design. Hand over points
control.
Archaeology Significant volumes of archaeology
and geology issues
An allowance made and base is case
is towards the worst case
Inflation Inflation greater than expected Specific recognition and approach to
this issue.

Front-End Capability Maturity Model
15
5. Master BuilderLeadership
3. Reference Class Forecasting
1. Benchmarking
2. Due Diligence
4. Black Swan Management
▪ Projects planned with an inside view only
▪ Optimism bottom-up in estimates unchecked
▪ No internal capability to challenge cost and schedule forecast of contractors
▪ No capability to identify ‘low balled’ bids
▪ No understanding of the uncertainty of estimates
▪ Wide range of capabilities with few pockets of excellence
▪ Careful balance between individual and organisational capabilities
▪ High-powered experts lack understanding of way of working
▪ Lack of empowerment of experts (stifled by process)
▪ No culture of excellence but a culture of heroes
▪ No systematic approach to taking the outside view
▪ Variability between projects’ and sub-projects’ ability to reduce bias
▪ Ignorance of unknown-unknowns
▪ Incentives to de-risk projects and safeguard contingencies not aligned in supply chains
▪ Slow management information leads to predictable surprises
▪ Biased and narrow management reporting deaf to weak signals
▪ Overly complex projects (social, political and time complexity) with management of symptoms not causes (ie sources of uncertainty and complexity)
▪ Tight coupling and interactive complexity make project fragile
▪ Is the project conducting internal and external benchmarks?
▪ What level of realism does this show?
▪ Have lessons learned been incorporated?
▪ How is the procurement strategy and early contractor involvement structured?
▪ What are the incentives for forecasters?
▪ Is probabilistic forecasting used consistently?
▪ Has the project taken a systematic view to compare itself to other projects?
▪ How mature is the risk management (if any) and other PM disciplines to manage the front-end process?
▪ Has the project analysed its sources of complexity?
▪ Have complexities been actively managed or mitigated?
▪ How compressed is the schedule?
▪ How confident is the project in the capability of its leaders?
▪ How mature are the PM processes?
▪ Do the project and supply chain share understanding of success factors?

Risk Maturity Level
16
Maturity
Level
Area Problem factors Potential response (examples)
1 Bench
marking
Inside view only with optimism bias unchecked
Programme of learning from others.Benchmarking against other projects, industries and sectors
2 Due
diligence
No challenge to cost, schedule forecasts of contractors. Minimal understanding of uncertainty in estimate
Internal assessments of costs, schedules.Separate estimating from contractors
3 Reference
Class
Forecasting
No systematic outside view. Variability between projects and subprojects ability to align and reduce bias. Ignorance of ‘unknown unknowns’; lack of exploration.
Systematic and ongoing Reference Class Forecasting across different aspects of programme.Exploration of scenarios to understand ‘unknown unknowns’.Understand characteristics of tail
4 Black Swan
(predictable
surprises)
Slow management information communication. Management of symptoms not causes. Tight coupled system. Overly complex
Quick, clean, independent management information reportingAmplification of weak signals.Recognise complex scenarios and break down
5 Leadership High powered experts lack understanding of how to work effectively. No culture of excellence rather one of heroes. Lack of empowerment of experts
Identify necessary pockets of excellence and encourage culture. Continuous learning.Focus on ways of workingLeadership engage in scenario planningIncrease reliance on ‘qualitative’(needs more development)

Summary: Risk Management is about
Building Confidence not Certainty
17
Accurate
planning
Outside view taken to
▪ Establish de-biased view of
risk
▪ Engage with funder to
move away from P95
perceptions
Outside view taken to
▪ Learn systematically and
quickly from others
▪ Work on project capabilities
through maturity framework
thinking
▪ Stress importance of
improving planning and not
only construction phase
Challenged
capabilities
Inaccurate
planning
Improved
capabilities
Predict & provide
Predict &
prevent
Top Related