


Languages
Pages
Legal

UPM INTERIM REPORT Q1 2018
Jussi PesonenPresident and CEO
26 April 2018
| © UPM2
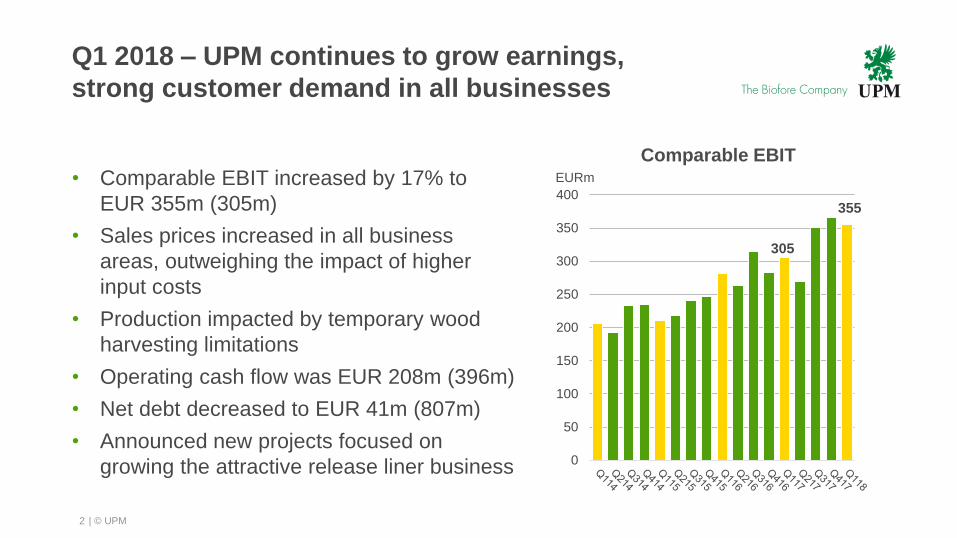
Q1 2018 – UPM continues to grow earnings,
strong customer demand in all businesses
• Comparable EBIT increased by 17% to
EUR 355m (305m)
• Sales prices increased in all business
areas, outweighing the impact of higher
input costs
• Production impacted by temporary wood
harvesting limitations
• Operating cash flow was EUR 208m (396m)
• Net debt decreased to EUR 41m (807m)
• Announced new projects focused on
growing the attractive release liner business 0
50
100
150
200
250
300
350
400
EURm
Comparable EBIT
355
305

| © UPM3
Q1 2018 – Commercially a successful quarter,
operationally left room for improvement
UPM PLYWOOD
• Good demand, deliveries +4%
• Price increases offset the variable cost
increases
UPM COMMUNICATION PAPERS
• Deliveries -4%
• Price increases offset most of the
variable cost increases
UPM RAFLATAC
• Good demand, deliveries -4%
• Price increases restored unit margins
after 12 months of input cost increases
UPM ENERGY
• Electricity deliveries +15%
• Higher electricity market prices
• Hydropower generation at a good level
UPM BIOREFINING
• Good market demand. Pulp deliveries -7%,
production impacted by temporary wood
harvesting limitations
• Pulp prices significantly higher
UPM SPECIALTY PAPERS
• Good market demand, deliveries -3%,
mix improvement
• Price increases offset most of the
variable cost increases

| © UPM
Comparable EBIT by business area
4
0
2,5
5
7,5
10
12,5
0
10
20
30
40
50
0
5
10
15
20
25
30
0
40
80
120
160
200
0
10
20
30
40
50
60
0
20
40
60
80
100
120
0
2,5
5
7,5
10
12,5
0
10
20
30
40
50
-2
0
2
4
6
8
10
12
-20
0
20
40
60
80
100
120
0
4
8
12
16
20
0
5
10
15
20
25
EURm % of salesUPM Specialty Papers EURm % of sales
UPM Communication Papers
EURm % of salesUPM Plywood
EURm % of sales
UPM Raflatac
EURm % of salesUPM EnergyEURm % of salesUPM Biorefining

| © UPM
0
100
200
300
400
500
600
Q1/17 Q1/18
Comparable EBIT in Q1 2018 vs. Q1 2017
Raflatac
Specialty
Papers
Other
operations
and
eliminations
Energy
Biorefining
Communication
Papers
Plywood
0
100
200
300
400
500
600
Q1/17 Q1/18
EURm
Prices
Variable
costs
Fixed
costs
Deliveries
EURm
30512.3%
35514.1%
Currency,
net
impact
Depr.,
forests,plantations
5
30512.3%
35514.1%
Improvement in Biorefining and Energy,
input cost mitigation in the other businesses
Increased prices in all businesses
Higher input costs and unfavourable currencies
Production impacted by wood harvesting limitations
| © UPM6
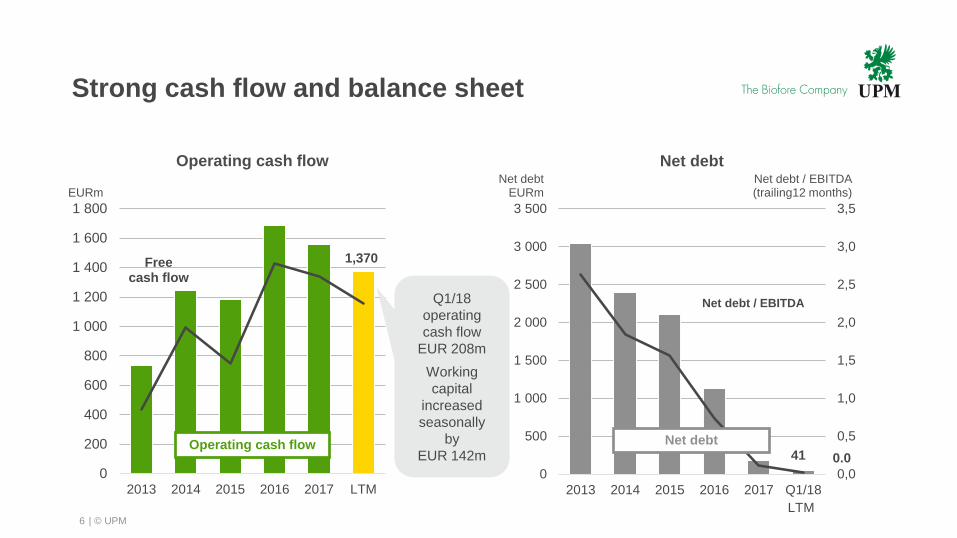
Strong cash flow and balance sheet
0,0
0,5
1,0
1,5
2,0
2,5
3,0
3,5
0
500
1 000
1 500
2 000
2 500
3 000
3 500
2013 2014 2015 2016 2017 Q1/18
Net debt / EBITDA(trailing12 months)
Net debt
Net debt / EBITDA
0.0
0
200
400
600
800
1 000
1 200
1 400
1 600
1 800
2013 2014 2015 2016 2017 LTM
Operating cash flow Net debt
41
1,370
Net debtEURm
Free cash flow
Operating cash flow
EURm
LTM
Q1/18
operating
cash flow
EUR 208m
Working
capital
increased
seasonally
by
EUR 142m

| © UPM7
Outlook for 2018
• UPM reached record earnings in 2017 and its comparable EBIT is expected to
increase further in 2018 compared with 2017.
• The fundamentals for UPM businesses in 2018 continue to be favourable. Healthy
demand growth is expected to continue for most UPM businesses in 2018, while
demand decline is expected to continue for UPM Communication Papers. Sales
prices are expected to be higher in UPM businesses in 2018 compared with 2017.
• Input costs are expected to be higher in 2018 compared with 2017. In order to
mitigate this, UPM will continue to implement measures to reduce fixed and
variable costs. 2018 has started with less favourable currency exchange rates
than 2017.
• Q2 2018 results will be impacted by significant maintenance activity, especially in
UPM Biorefining.

| © UPM8
Timing of significant maintenance shutdowns
Maintenance shutdowns have an impact on
• Maintenance costs
• Production volumes
• Operational efficiency
Excluding the impact of larger maintenance
shutdowns, there is a seasonal pattern in
UPM’s fixed costs
• Q1, Q3 fixed costs below annual average
• Q2, Q4 fixed costs above annual average
Timing Unit
Q2 17 Pietarsaari pulp mill
Olkiluoto nuclear power plant
Q4 17 Kymi pulp mill
Q2 18 Fray Bentos pulp mill
Kaukas pulp mill
Lappeenranta biorefinery turnaround
Olkiluoto nuclear power plant
Q4 18 Pietarsaari pulp mill
Significant maintenance shutdowns
in 2017 and 2018

| © UPM9
UPM’s current investment portfolio for
earnings growth
Focused growth projects
• Kaukas pulp mill expansion, +30kt in Q2 2018, Finland
• Raflatac speciality label expansion, in Q4 2018, Finland
• Chudovo plywood mill expansion, +155k m3 in Q3 2019, Russia
• Jämsänkoski release liner expansion, +40kt in Q4 2018, Finland
• Nordland PM2 conversion to release liner, +110kt in Q4 2019, Germany
• Changshu release liner expansion, +40kt in Q1 2020, China

| © UPM10
UPM’s current investment portfolio for
earnings growth
Transformative prospects
• Possible new pulp mill, Uruguay
– Second preparation phase is proceeding.
The permitting processes for the mill, rail
and port, as well as rail tendering have
started as agreed.
• Biomolecules businesses
– Basic engineering work regarding a
potential industrial-scale biochemicals
refinery, Germany
– Exploring next steps in biofuels,
environmental impact study in Kotka,
Finland

| © UPM11
Second preparation phase for the potential
new pulp mill in Uruguay proceeding
• Labour protocols, regulation
• Investment regimes
• Regional planning and development
• Energy and complementary items
• Mill permitting, pre-engineering
• Rail permitting, tendering, start construction
• Port permitting, tendering, concession
• Roads
Phase ICompleted in Q4/17
Phase IIExpected to take 1.5-2 years
Phase III
Discussions with the
Government of Uruguay
Prerequisites for a possible
pulp mill investment
Investment project
Development of
infrastructure
Main items in preparation phase II:
Investment agreement signed in
Q4/17
Permitting
Pre-engineering
Development of
infrastructure
Necessary conditions
Potential UPM
investment decision

| © UPM12
Summary
• Customer demand is strong and sales prices increased in all
business areas in Q1 2018
• Q1 2018 comparable EBIT grew by 17%, driven by strong
business performance
• Comparable EBIT is expected to increase in 2018 compared
with 2017
• Next focused growth projects announced in the attractive
release liner business
• Transformative prospects in Uruguay and in biomolecules
businesses are proceeding

WELCOME TO UPM’S CAPITAL MARKETS DAY!
London 31 May 2018
30 May dinner with a keynote speech bythe Chairman of the Board
31 May presentations and discussion with the CEO and the UPM management team
Register by email: [email protected]
More information: www.upm.com/Investors
LIMITLESS OPPORTUNITIES OF BIOECONOMY


| © UPM
Current operations Uruguay prospect
Establishing a competitive operating platform
in Uruguay – we are now in preparation phase II
• Plantation base
in West Uruguay
• Fray Bentos pulp mill
1.3 million tonnes
• ~100 km of river barging
for outbound logistics
• Sea port in Nueva Palmira
loading half vessels
• Ocean vessels to pulp markets
• Plantation base in Central
and North Eastern Uruguay
• Potential new pulp mill about
2 million tonnes, on-site
investment estimate EUR 2bn
• Railway with high technical
standards
• Deep sea port in Montevideo
loading full vessels
• Ocean vessels to pulp markets
15
| © UPM16
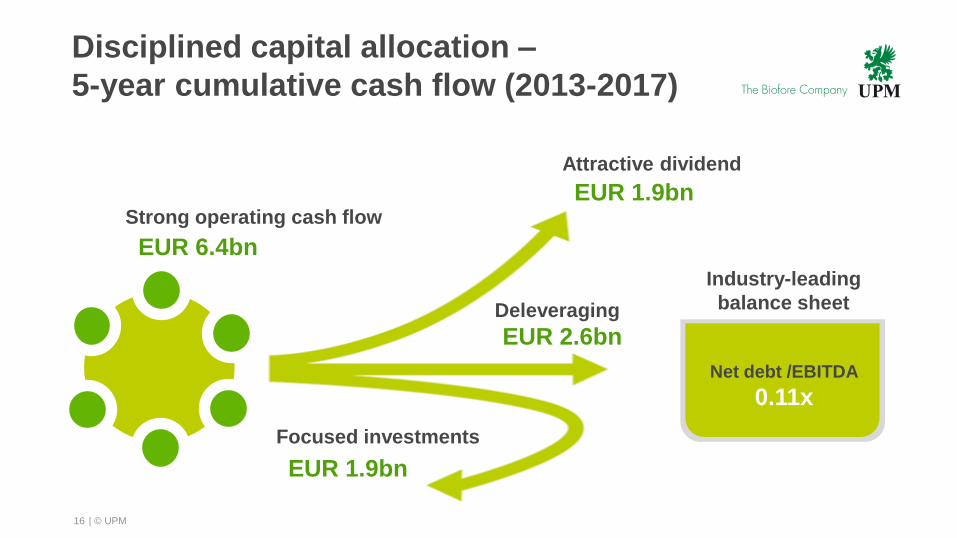
Disciplined capital allocation –
5-year cumulative cash flow (2013-2017)
Industry-leading
balance sheet
Net debt /EBITDA
0.11x
EUR 6.4bn
Deleveraging
Strong operating cash flow
Attractive dividend
Focused investments
EUR 1.9bn
EUR 2.6bn
EUR 1.9bn

| © UPM17
Illustrative capital allocation(* for next 5 years,
assuming the Uruguay pulp mill investment
Industry-leading
balance sheet
Net debt /EBITDA
< 2x
Attractive dividend
EUR ~3-4bn
Performance focus
Strong cash flow
High return
investments
EUR ~3-4bnMaintain headroom
(* This is not a forecast
| © UPM
0
2
4
6
8
10
12
14
16
18
20
22
24
26
28
30ROCE %
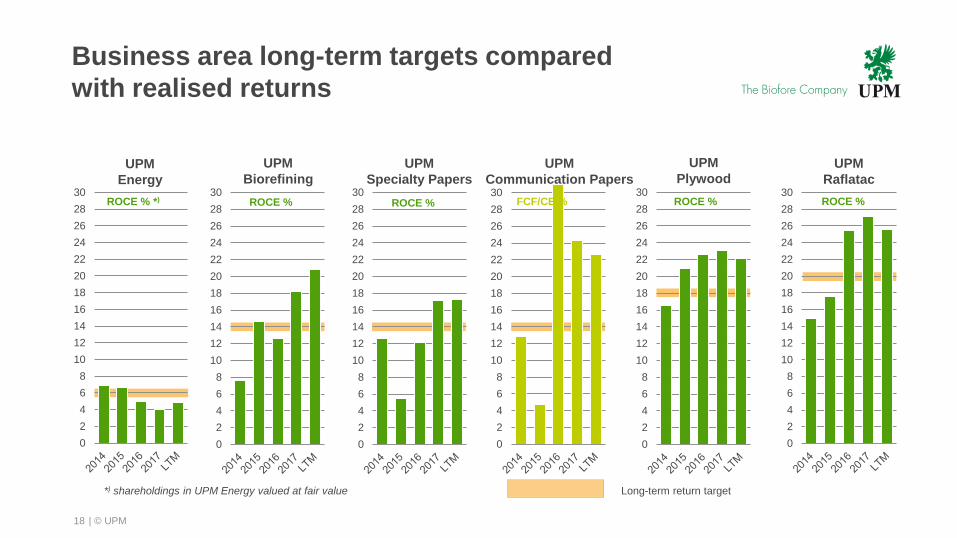
18
Business area long-term targets compared
with realised returns
0
2
4
6
8
10
12
14
16
18
20
22
24
26
28
30ROCE % *)
0
2
4
6
8
10
12
14
16
18
20
22
24
26
28
30ROCE %
0
2
4
6
8
10
12
14
16
18
20
22
24
26
28
30
0
2
4
6
8
10
12
14
16
18
20
22
24
26
28
30ROCE %
0
2
4
6
8
10
12
14
16
18
20
22
24
26
28
30ROCE %
*) shareholdings in UPM Energy valued at fair value Long-term return target
UPM
Specialty Papers
UPM
Communication Papers
UPM
PlywoodUPM
Raflatac
UPM
Energy
UPM
Biorefining
FCF/CE %

| © UPM
0,0
0,5
1,0
1,5
2,0
2,5
3,0
0
750
1 500
2 250
3 000
3 750
4 500
2013 2014 2015 2016 2017 Q1/18
Net debtEURm
Net debt/EBITDA
(x)
Net debt and leverage
Policy: ≤ 2x
19
Group financial performance
0
200
400
600
800
1 000
1 200
1 400
1 600
2013 2014 2015 2016 2017 LTM
EURm
Comparable figures for 2014 – 2018,
excluding special items for earlier years
Comparable EBIT
0
2
4
6
8
10
12
14
2013 2014 2015 2016 2017 LTM
% Comparable ROE
Target: 10%Target: EBIT growth
LTM

| © UPM
Low investment needs in existing assets allow
growth projects with modest total capex
0
200
400
600
800
1 000
1 200
2009 2010 2011 2012 2013 2014 2015 2016 2017 2018E
Depreciation
EURm
Operational investments
Capital expenditure
Strategic investments
Uruguay
acquisition
Estimate
303
Myllykoski
acquisition
20
350

| © UPM21
UPM’s main currency exposures
• Key currency exposures USD, GBP and JPY
• Policy to hedge an average of 50% of the estimated
net currency cash flow for the next 12 months
Estimated annual foreign currency net cash flow, before hedging
USD GBP JPY Others
EURm 700 360 180 260

| © UPM
Maturity profile and liquidity
Maturity profile of outstanding debt Committed credit facilities’ maturities EURm EURm
Liquidity
Liquidity on 31 March 2018 was EUR 1.1bn(cash and unused credit facilities)
Bilateral committed credit facilities EUR 522 million for general financing purposes
Committed credit facilities
0
200
400
600
0
200
400
600
22

| © UPM23
UPM Biorefining
Demand-supply drivers of pulp market
Short term Long term
Demand
Supply
Re- and
destocking of
inventories
New mill
starts
Debottleneck
investments
Maintenance
stoppages
Production
issues
Population growth
Urbanisation
Middle class expansion
Aging demography
E-commerce
Availability of
competitive
mill locations
Plantations, sustainable
wood raw material
Water availability
Infrastructure
Decline of
graphic paper
production and
scarcity
of recycled fibre
Capacity
closures
Conversions
End use
demand
Sustainable,
renewable and
recyclable
Food product safety
Replacing plastics
Regulation
and product
standards
e.g. RCP

| © UPM
UPM Biorefining
Chemical pulp market prices
24
300
400
500
600
700
800
900
1000
EUR/tonne
BHKP, Europe, EUR NBSK, Europe, EUR
BHKP, China, EUR NBSK, China, EUR
Sources: FOEX Indexes Ltd, ECB
Pulp market prices, USDPulp market prices, EUR
300
400
500
600
700
800
900
1000
1100
1200
USD/tonne
BHKP, Europe NBSK, Europe
BHKP, China NBSK, China
| © UPM25
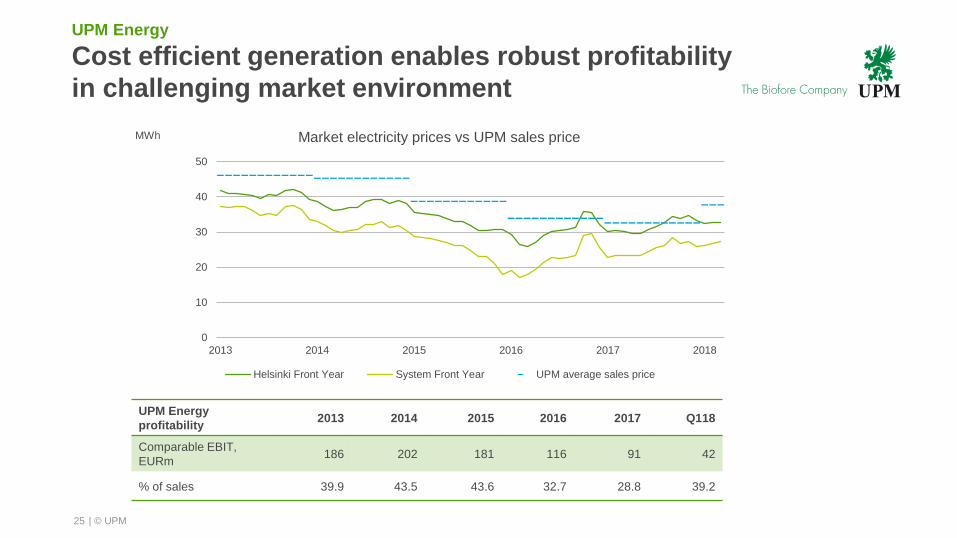
UPM Energy
profitability2013 2014 2015 2016 2017 Q118
Comparable EBIT,
EURm186 202 181 116 91 42
% of sales 39.9 43.5 43.6 32.7 28.8 39.2
0
10
20
30
40
50
2013 2014 2015 2016 2017 2018
MWh Market electricity prices vs UPM sales price
Helsinki Front Year System Front Year UPM average sales price
UPM Energy
Cost efficient generation enables robust profitability
in challenging market environment

| © UPM
400
500
600
700
800
900
1000
News SC LWC
WFC WFU
26
UPM Communication Papers
Graphic paper prices
EUR/t
EuropeUSD/t USD/t
ChinaNorth America
Sources: PPI, RISI
600
700
800
900
1000
1100
1200
1300
WFC r (100% chemical pulp)
Uncoated Woodfree Reels (100% chemicalpulp)
500
600
700
800
900
1000
1100
News SC LWC
WFC WFU

| © UPM27
UPM Communication Papers
Paper price vs. cash cost of marginal cost producer
2004 2005 2006 2007 2008 2009 2010 2011 2012 2013 2014 2015 2016 2017 2018
EUR/t
Sources: PPI, RISI, Pöyry
Cash cost of a marginal producer
Price
Top Related