


Languages
Pages
Legal


1 Mason County PIC Update 3/7/14
Update Report for Mason County PIC Program March 7, 2014
Prepared by:
Squaxin Island Tribe- Erica Marbet
Mason County Public Health- Stephanie Kenny, Debbie Riley, Cindy Waite
Mason County Conservation District- Erik Hagan
WSU Extension- Bob Simmons
For:
Mary Knackstedt
Washington State Department of Health
Introduction ................................................................................................................................................................. 2
Background .................................................................................................................................................................. 2
Mason County Water Data .......................................................................................................................................... 6
General .................................................................................................................................................................... 6
Areas and Sites Selected for Sampling .................................................................................................................... 7
Tier I Ambient ...................................................................................................................................................... 7
Tier II Ambient- .................................................................................................................................................... 9
McLane Cove .................................................................................................................................................... 9
North Bay ....................................................................................................................................................... 12
Oakland Bay/Hammersly Shoreline ............................................................................................................... 15
Upland Investigations .................................................................................................................................... 17
Chapman Cove ................................................................................................................................................... 18
Squaxin Island Tribe Water Data ............................................................................................................................... 22
Mason County On-Site Septic System Program ......................................................................................................... 27
WSU Extension Activities ........................................................................................................................................... 29
Mason Conservation District Activities ...................................................................................................................... 31
Review of 2013 and Expectations for 2014 ............................................................................................................... 32
References ................................................................................................................................................................. 33
Appendix 1. Maps of Status of Shellfish Growing Areas ............................................................................................ 34
Appendix 2- Quality Control ...................................................................................................................................... 38

2 Mason County PIC Update 3/7/14
Introduction South Puget Sound waters in Mason County have received polluted freshwater input from various sources for
decades. This report will focus on the last decade and more specifically the last two years efforts to decrease
pollution with an EPA Pollution Inventory and Correction (PIC) grant. Washington State Department of Health
Shellfish Program marine water quality sampling stations have shown high levels of fecal coliform bacteria at
certain sampling stations in the Oakland Bay and North Bay areas, and this has led to closures of portions of both
bays (Appendix 1. Maps of Status of Shellfish Growing Areas). Consequently Oakland Bay and North Bay, and also
McLane Cove, became the focus of sampling, outreach, and enforcement for a PIC grant spanning May 2012 to
December 2014. This has been a collaborative effort between Mason County Public Health (MCPH), the Squaxin
Island Tribe (SIT), the Mason Conservation District (MCD), Washington State University Extension (WSU).
In the first year and a half of the grant period, much of the water quality sampling has been done (Figure 1).
Mason County employees sampled much of the Oakland Bay shoreline, Uncle Johns Creek, Sunset Road, around
the City of Shelton, and Mclane Cove. Squaxin Island Tribal employees assisted the County and also continued
the Tribe’s own ambient sampling at the mouths of large creeks that enter Puget Sound in their usual and
accustomed hunting and fishing areas. Areas with high bacterial counts have been identified, and County water
quality staff have submitted those areas of concern to the on-site septic system program staff and to MCD. The
County has held ongoing meetings to foster communication between all entities involved in this process. Also
WSU has completed public outreach in various forms. All of these efforts will be described in detail below.
Background Mason County Public Health has been monitoring water quality periodically, when grant funding allowed, for 25
years. They have worked in a variety of different areas, depending on the grant. The Squaxin Island Tribe began in
2004 to sample almost monthly at the mouths of streams in South Puget Sound in their usual and accustomed
fishing areas (Figure 1). In the Tribe’s quality assurance project plan (Konovsky 2009), they use national shellfish
sanitation standards (geometric mean < 14 bacterial colonies per 100 ml and 90th percentile < 43 colonies), even
though those standards are for marine waters. According to those standards, freshwater entering Puget Sound
shows elevated levels of bacteria (
3 Mason County PIC Update 3/7/14
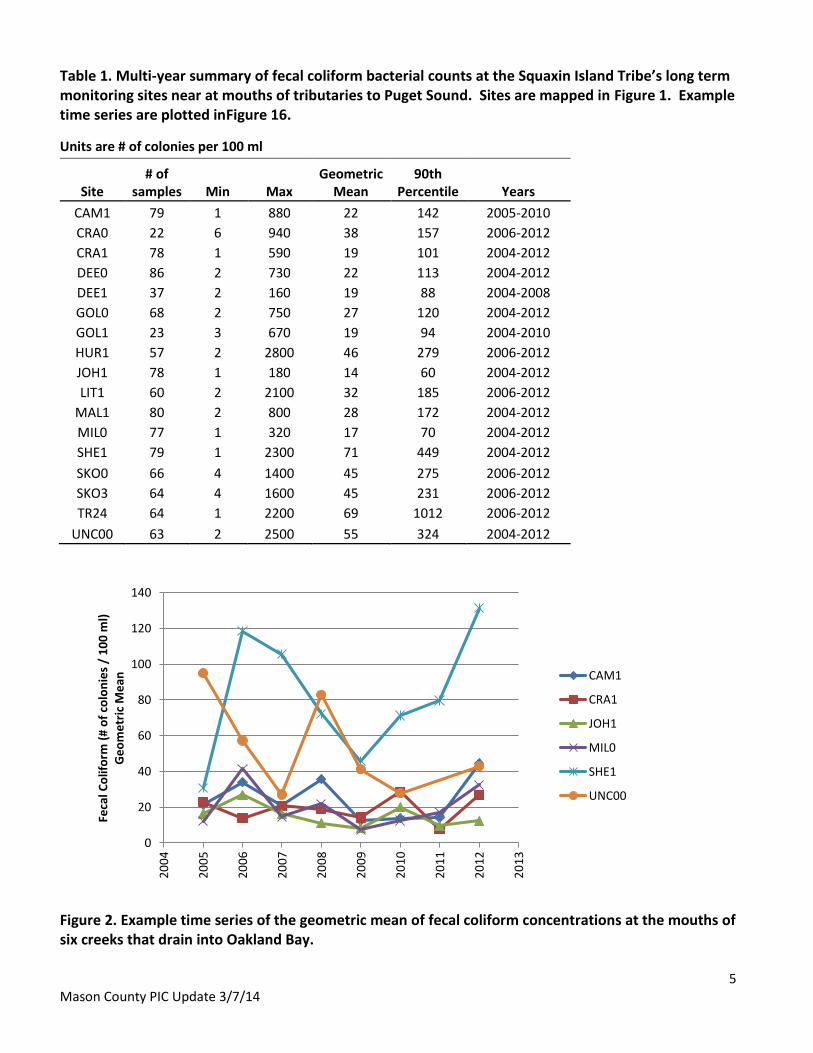
Table 1). There are no consistent visual trends in geometric means over the years (Figure 2).
Under coordination of the Oakland Bay Clean Water District, Mason County and multiple entities made a
concerted effort, since 2007, to clean up Oakland Bay (Kenny 2012). This included outreach efforts, a fecal
coliform TMDL, farm plans, land acquisitions, and major upgrades to the Shelton area’s sewage treatment
facilities. A stormwater task force was assembled and made recommendations, but the County has not yet
adopted those. Some shellfish beds in Oakland Bay were reopened by 2012, but others remain closed (Appendix
1. Maps of Status of Shellfish Growing Areas).

4 Mason County PIC Update 3/7/14
Figure 1. Monitoring sites to date within the 2014 PIC program for Mason County and the Squaxin Island Tribe (SIT).
5 Mason County PIC Update 3/7/14
Table 1. Multi-year summary of fecal coliform bacterial counts at the Squaxin Island Tribe’s long term monitoring sites near at mouths of tributaries to Puget Sound. Sites are mapped in Figure 1. Example time series are plotted inFigure 16.
Units are # of colonies per 100 ml
Site # of
samples Min Max Geometric
Mean 90th
Percentile Years
CAM1 79 1 880 22 142 2005-2010
CRA0 22 6 940 38 157 2006-2012
CRA1 78 1 590 19 101 2004-2012
DEE0 86 2 730 22 113 2004-2012
DEE1 37 2 160 19 88 2004-2008
GOL0 68 2 750 27 120 2004-2012
GOL1 23 3 670 19 94 2004-2010
HUR1 57 2 2800 46 279 2006-2012
JOH1 78 1 180 14 60 2004-2012
LIT1 60 2 2100 32 185 2006-2012
MAL1 80 2 800 28 172 2004-2012
MIL0 77 1 320 17 70 2004-2012
SHE1 79 1 2300 71 449 2004-2012
SKO0 66 4 1400 45 275 2006-2012
SKO3 64 4 1600 45 231 2006-2012
TR24 64 1 2200 69 1012 2006-2012
UNC00 63 2 2500 55 324 2004-2012
Figure 2. Example time series of the geometric mean of fecal coliform concentrations at the mouths of six creeks that drain into Oakland Bay.
0
20
40
60
80
100
120
140
20
04
20
05
20
06
20
07
20
08
20
09
20
10
20
11
20
12
20
13
Feca
l Co
lifo
rm (
# o
f co
lon
ies
/ 1
00
ml)
Ge
om
etr
ic M
ean CAM1
CRA1
JOH1
MIL0
SHE1
UNC00

6 Mason County PIC Update 3/7/14
Mason County Water Data Prepared by Stephanie Kenny
General
The water quality goal established in the QAPP is the state marine water quality standard. This standard is normally applied to the mouths of tributaries. The comparable fresh water standard is WAC 173-201a-200(2)(b). This standard should be applied to samples not influenced by marine waters. The standard applied to Oakland Bay shoreline sampling is a modification of Mason County Water Quality Standard Operating Procedures adopted in the Oakland Bay Marine Recovery Area QAPP.
Table 2. Water Quality Standards for Fecal Coliforms (FC) referenced in this grant.
Marine Standard
Source- QAPP and WAC173-201a-210 (2)(b)
Fecal coliform organism levels must not exceed a geometric mean value of 14 colonies/100 mL, and not have more than 10 percent of all samples (or any single sample when less than ten sample points exist) obtained for calculating the geometric mean value exceeding 43 colonies /100 mL.
Fresh Water Standard
Source-WAC173-201a-200 (2)(b)
Fecal coliform organism levels must not exceed a geometric mean value of 100 colonies/100 mL, with not more than 10 percent of all samples (or any single sample when less than ten sample points exist) obtained for calculating the geometric mean value exceeding 200 colonies/100 mL.
Oakland Bay Shoreline Standard
Source- Oakland Bay Marine Recovery Area QAPP
Discharges with values greater than or equal to 200 FC/100mL will be considered high priority for FC confirmation sampling. Discharges with values greater than 100 FC/100mL will be considered medium priority.
The fresh water rather than marine water quality standard has been chosen as the standard to apply in reviewing
the data. The areas in the grant where the marine sampling standard could be applied are some of the ambient
sites, and some of the Chapman Cove and McLane Cove sites. Roughly a quarter of the Mason County ambient
sites and two thirds of the McLane Cove sites are under marine influence at high tide, but since the samples are
taken flowing off the land during a lower tidal stage, the fresh water standard seemed most applicable. The
shoreline samples are also taken flowing off land. They are tested for salinity in cases such as beach seeps when
it is not clear whether the water originates on land and diffuses down through layers of the beach to surface
again lower on the beach, or whether the origin is marine water draining out of the top layer of gravel, mud or
sand.

7 Mason County PIC Update 3/7/14
Areas and Sites Selected for Sampling
Tier I Ambient
The goal of long term ambient monitoring is to track changes in water quality over a long period of time due to
changes of use and development in the area. The sites selected as part of this grant were chosen because they
were not part of the Squaxin ambient sampling, and because each is a significant drainage in a sensitive area or
has/had some development in the area. Sampling started in March 2013 and will continue to the end of the
grant. By the end of 2013 eighty-three samples have been collected. Ambient sites 60, 61, 63, NB-004, NB-022,
and NB-023 were included in the North Bay data set to keep data from the same geographical area together
(Table 3, Figure 3). No site is above the geometric mean and RAU1 is the only site above the 10% standard. The
site drains a wooded area, with a farm and light development above
Table 3. Fecal coliform results (# of colonies per 100 mL water) for ambient sites.
Sam
ple
Sit
e
3/2
6/2
01
3
4/9
/20
13
4/1
0/2
01
3
6/3
/20
13
6/5
/20
13
6/1
8/2
01
3
7/2
3/2
01
3
8/5
/20
13
8/6
/20
13
9/1
6/2
01
3
9/3
0/2
01
3
10
/1/2
01
3
11
/13
/20
13
11
/25
/20
13
Geo
met
ric
Mea
n
Co
un
t
19 1 5 22 33 85 60 150 220 9 110 30 10
TL-001 1 3 28 14 180 92 55 87 23 8 21 10
RAU1 1 5 72 470 240 160 43 6
PBW1 1 1 2 15 45 32 250 4 2 8 9
LYN1 26 20 76 130 18 33 12 170 9 16 31 10
DER1 6 32 43 140 320 92 53 80 49 58 9
PP-003 36 17 12 67 43 105 87 52 140 7 40 10
PP-001 5 77 4 32 31 39 14 52 1 1 12 10
PP-002 1 1 43 17 31 23 80 20 20 14 9

8 Mason County PIC Update 3/7/14
Figure 3. Tier 1 ambient sample sites 2013.
9 Mason County PIC Update 3/7/14
Tier II Ambient-
As the grant was originally written, Tier II ambient was shorter term sampling focused on a specific area. The
grant calls for monthly sampling until a roughly accurate picture of water quality is developed in the area.
McLane Cove
The first area sampled was McLane Cove (Figure 4). It was sampled from January 2013 to September
2013 (Table 4). Flow data was also collected, and loading rates were calculated (Table 5). A minimum of 5
samples were collected as an initial assessment, and sites with some elevated sample results, or other
issues, were continued until 10 samples or more were taken per site. An upland investigation may also be
warranted. A total of 67 samples were collected.
No site in McLane Cove exceeds the geometric mean. Two sites exceeded the 10% standard, CI-002 and
CI-010. The only source of pollution in the CI-002 drainage is wildlife. CI-010 may have potential for farm
influence, but access to the properties in question hasn’t been obtained. Mason Conservation District
and Mason County Public Health have planned a joint field trip to the area to pool knowledge and discuss
future action needed.
Educational/outreach work done in the area to this point is a preliminary letter sent to area residents
before sampling started. Now that sampling has been completed, the plan is to follow up with a water
quality report card for the area from Washington State University and some septic Operation and
Maintenance incentives. Rebates will be given for operation and maintenance or pumping, and risers
and/or effluent filters. Letters will be sent out informing the property owners in the area of the rebate
program.

10 Mason County PIC Update 3/7/14
Figure 4. McLane Cove sample sites 2013.

11 Mason County PIC Update 3/7/14
Table 4. Fecal coliform results (# of colonies per 100 mL water) for McLane Cove Sites Sa
mp
le S
ites
1/2
2/2
01
3
2/1
9/2
01
3
3/2
1/2
01
3
4/2
3/2
01
3
5/2
0/2
01
3
5/2
1/2
01
3
6/4
/20
13
6/5
/20
13
7/1
/20
13
7/2
/20
13
8/1
9/2
01
3
9/1
7/2
01
3
Geo
met
ric
Mea
n
Co
un
t
CI-001 20 20 1
CI-002 1 1 5 1 230 390 170 55 64 19 9
CI-003 2 2 1 1 12 170 9 5 5 8
CI-004 1 1 10 1 1 1 1 6
CI-005 36 1 6 2
CI-006 1 5 6 2 2 29 6 4 7
CI-008 1 1 1
CI-009 1 16 1 3 32 7 59 37 8 8
CI-010 59 12 120 15 240 390 325 100 89 8
CI-011 16 16 1
CI-012 52 57 3 21 3
CI-013 1 1 36 7 65 40 17 18 11 8
CI-014 3 5 1 8 11 4 5
Table 5. Flow measurements and fecal coliform loading rates for McLane Cove sites, 2013.
Site Date Flow (cf/s)
Fecal Coliform (cfu/100
mL) Loading
(CFU/day)
CI-002 7/2/2013 0.32 170 13311082
CI-002 8/19/2013 0.03 55 403737
CI-003 7/2/2013 0.0053 9 11672
CI-003 8/19/2013 0.0018 50 22022
CI-006 7/2/2013 2 29 14191962
CI-006 8/19/2013 0.28 6 411078
CI-010 5/20/2013 0.13 240 7634297
CI-010 6/5/2013 0.08 390 7634297
CI-010 7/2/2013 0.03 325 2385718
CI-010 8/19/2013 0.07 100 1712823
CI-013 5/20/2013 0.32 65 5089531
CI-013 6/5/2013 0.08 40 783005
CI-013 7/2/2013 0.06 17 249583
12 Mason County PIC Update 3/7/14
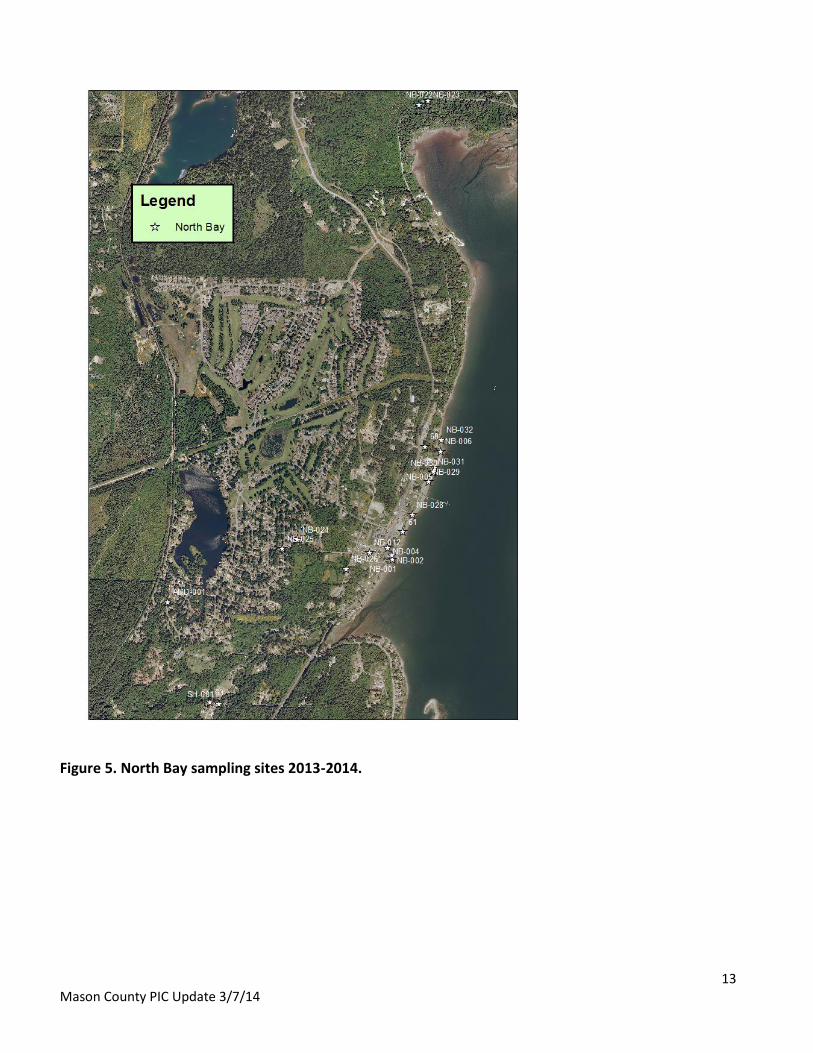
North Bay
North Bay is the second area of focus for Tier II (Figure 5). Preliminary sampling started in September of 2013.
The sampling sites were finalized in December 2013. Sampling will continue through the end of the grant. Fifty
seven samples were collected in the North Bay area by the end of 2013 (Table 6).
The North Bay area was selected to be part of shorter term Tier II grant work because of known water quality
problems in the area that have limited shellfish harvesting. The area was sewered along the water several years
ago and some improvements in water quality have been seen. However, there is a considerable amount of
development in the area, with the small town of Allyn right next to the shellfish harvesting area, so potential
contamination sources are many. Potential bacteriological sources include septic systems in the upland area, pet
waste, and urban wildlife. Stormwater and impervious surfaces add to the problem, though in terms of transport
rather than as a source of bacteriological pollution.
Since full scale Tier II sampling for the area was finalized in December 2013, a full discussion of the sample results
will occur in a later report. Work planned as follow up to the initial sampling includes dye testing and education.
Education will consist of an Environmental Health Specialist canvassing the downtown Allyn area to educate each
property owner or renter on water quality issues particular to their property. Education for business owners will
include information about garbage storage to discourage urban wildlife, whereas the education for residents may
include information about picking up pet waste and landscaping to retain and infiltrate stormwater on their
properties. Proper care of septic systems will be addressed when relevant to the property and properties that
need additional follow up will be tracked.
13 Mason County PIC Update 3/7/14
Figure 5. North Bay sampling sites 2013-2014.
14 Mason County PIC Update 3/7/14
Table 6. Fecal coliform results (# of colonies per 100 ml of water) for North Bay Sites.
Sam
ple
Sit
e
4/1
0/2
01
3
6/3
/20
13
6/5
/20
13
6/1
8/2
01
3
6/2
4/2
01
3
7/2
3/2
01
3
8/6
/20
13
9/1
6/2
01
3
9/1
7/2
01
3
9/3
0/2
01
3
10
/1/2
01
3
11
/13
/20
13
11
/25
/20
13
12
/2/2
01
3
Geo
met
ric
Mea
n
Co
un
t
61 220 11 800 260 910 32 69 139 7
60 110 12 28 20 40 190 680 59 8 50 9
63 83 83 1
AND-001 56 56 1
NB-001 1 1 1
NB-002 5 2 3 2
NB-004 420 96 700 1500 27 6 2 75 7
NB-005 35 35 1
NB-006 5 5 1
NB-012 370 520 439 2
NB-022 29 65 37 72 31 180 40 7 41 8
NB-023 22 185 580 72 180 110 71 8 81 8
NB-024 21 21 1
NB-025 13 13 1
NB-026 410 410 1
NB-028 1 1 1
NB-029 1 1 1
NB-030 33 33 1
NB-031 1 1 1
NB-032 1 1 1
SH-001 30 30 1
15 Mason County PIC Update 3/7/14
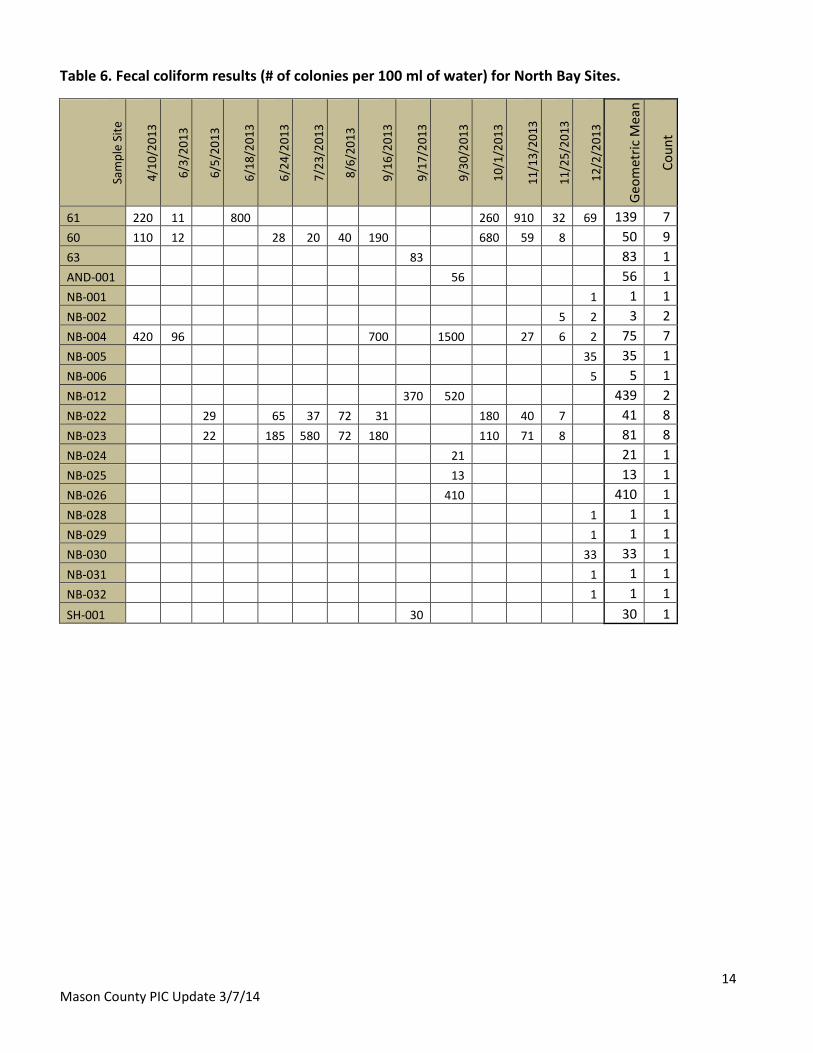
Oakland Bay/Hammersly Shoreline
Hammersley Inlet was not originally part of the sampling plan for the grant, but was included after
Steering Committee discussions determined it to be the type of work the grant should support. This is a
continuation of the Oakland Bay Clean Water District shoreline sampling supported under other grant
funding that has ended. The goal of this sampling plan is to survey one-third of the Oakland Bay Clean
Water District shoreline every year and to sample all the culverts, bulkhead drains, natural drainages and
rapidly flowing seeps in the survey area. Because the number of sample sites is so large, the goal for
number of samples per site is smaller than in the above areas. The goal is to sample at least twice at
each sample site: once in wet weather and once in dry weather. The sampling timeline: the middle
section, which is from Bayshore Golf Course to Walker Park road on the south side of Oakland Bay and a
corresponding section on the north side, was sampled through another grant in 2012; the Hammersley
section of Oakland Bay shoreline was sampled in 2013; and the northernmost section will be sampled in
2014. One hundred ninety-nine shoreline samples were taken in 2013. Due to the large number of sites,
only the sites with high FC results are shown in the map and table below. Surveys of the sites with high
results began at the beginning of 2014. The sites with high results are surveyed for water quality
problems and issues addressed either through education or dye traces, if necessary.
Figure 6. Hammersly Inlet sites with high fecal coliform bacterial counts.

16 Mason County PIC Update 3/7/14
Table 7. Hammersly Inlet shoreline sites with high fecal coliform counts.
Site Date Result (fc/100mL) Date
Result (fc/100mL)
BOB-104 3/25/2013 300
BOB-105 3/25/2013 200
BOB-118 4/22/2013 36 10/18/2013 380
BOB-125 5/8/2013 1300
BOB-135 5/8/2013 215 5/22/2013 20
BOB-136 5/22/2013 800 10/15/2013 150
BOB-139 5/22/2013 120 10/15/2013 47
BOB-141 5/22/2013 310 10/16/2013 95
BOB-149 6/19/2013 43 10/16/2013 200
BOB-157 5/22/2013 800
BOB-158 5/22/2013 400
OBP-002 8/28/2013 170 12/16/2013 11
OBP-005 8/28/2013 170 12/16/2013 1
OBP-010 9/3/2013 420
OBP-013 9/3/2013 65 12/17/2013 100
OBP-022 9/4/2013 350 12/17/2013 11
OBP-023 9/4/2013 140 12/17/2013 20
OBP-029 9/4/2013 260 12/18/2013 1
OBP-033 9/4/2013 125 12/18/2013 2
OBP-034 9/18/2013 120 12/18/2013 1
OBP-035 9/18/2013 130 12/18/2013 16
OBP-036 9/18/2013 89 12/18/2013 1
OBS-007 8/14/2013 565 12/4/2013 16
OBS-012 8/13/2013 210 12/3/2013 1300
OBS-019 7/31/2013 690 12/3/2013 dry
OBS-022 12/3/2013 110
OBS-023 8/14/2013 160 12/4/2013 2
OBS-034 8/14/2013 180 12/16/2013 720
OBS-035 8/14/2013 170 12/16/2013 15
OBS-036 8/28/2013 180 12/16/2013 56
OBS-040 8/28/2013 780 12/16/2013 9
OBS-041 8/28/2013 250 12/16/2013 4
OBS-046 8/13/2013 180 12/3/2013 430
OBV-006 6/19/2013 170 10/28/2013 915
OBV-011 6/19/2013 145 10/28/2013 1
OBV-012 6/24/2013 1900 10/28/2013 dry
OBV-015 6/24/2013 300 10/28/2013 dry
OBV-017 6/24/2013 290 10/28/2013 dry
OBV-022 7/22/2013 130 10/28/2013 8
OBV-039 7/22/2013 1600 10/29/2013 2
17 Mason County PIC Update 3/7/14
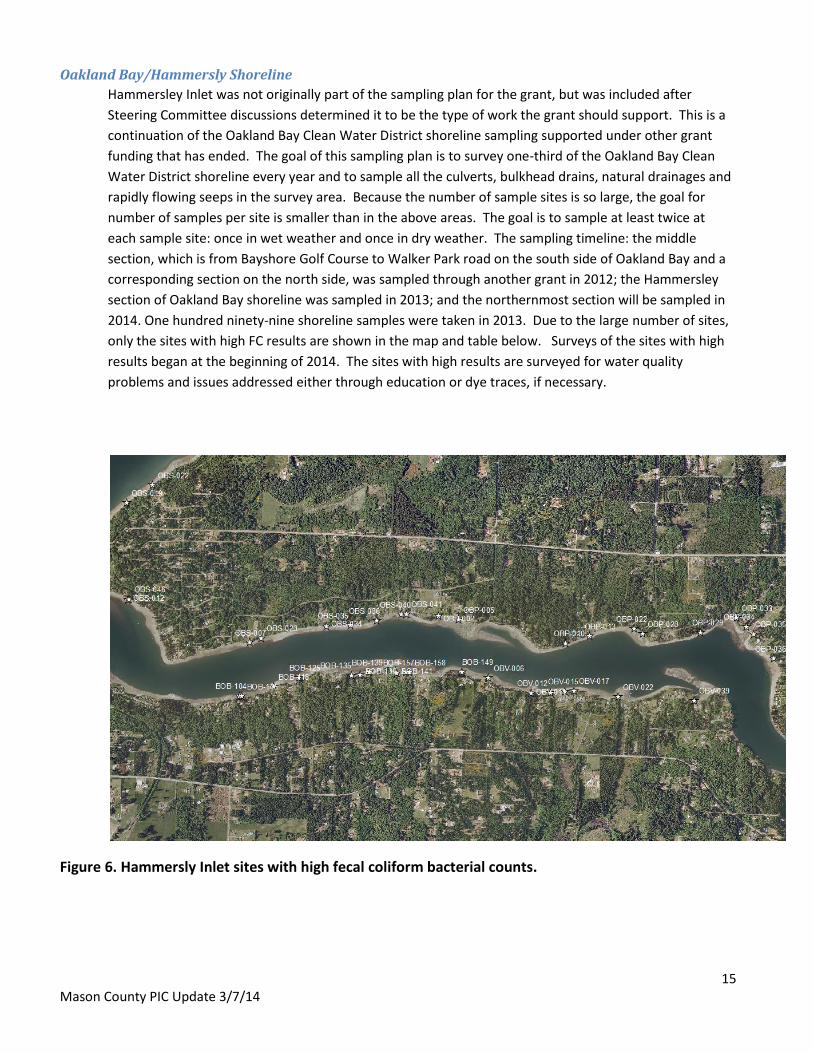
Upland Investigations
Upland sampling consisted of upland work in the Oakland Bay shoreline area. One goal of the sampling
was to assess urban surface water pollution entering Shelton Harbor (part of Oakland Bay). Sites above
and below downtown Shelton development are tested. This is also a continuation of Oakland Bay Clean
Water District sampling; the sites were sampled in 2008 under a different grant. The Shelton Wastewater
Treatment Plant has been working under a variety of grants to reduce inflow/infiltration into the
drainage basins. Resampling the area after basin improvements may add to understanding of how sewer
inflow/infiltration affected surface water quality in downtown Shelton. Another focus area was a farm in
a sensitive upland area. One hundred nineteen samples were taken.
Figure 7. Upland investigative sites in Mason County.

18 Mason County PIC Update 3/7/14
Table 8. Fecal coliform results (# of colonies per 100 ml) at upland investigative sites.
Sam
ple
Sit
es
12
/27
/20
12
4/1
0/2
01
3
5/1
3/2
01
3
5/2
9/2
01
3
6/1
1/2
01
3
7/9
/20
13
9/1
0/2
01
3
9/2
4/2
01
3
10
/22
/20
13
11
/19
/20
13
12
/10
/20
13
12
/11
/20
13
Geo
met
ric
Mea
n
Co
un
t
SHE-001 37 28 15 9 200 320 100 34 81 23 47 10
SHE-002 1100 37 80 52 110 44 88 7 69 18 60 10
SHE-004 440 9 20 29 26 180 88 92 120 7 49 10
SHE-005 91 3 53 21 32 84 51 14 12 2 21 10
SHE-006 2 29 4 17 220 660 12 45 4 22 9
SHE-007 33 100 36 80 33 56 11 75 3 33 9
SHE-011 150 150 1
SHE-012 39 150 36 43 59 78 10 130 12 44 9
SHE-013 39 20 110 43 56 27 61 7 140 19 38 10
SHE-014 27 270 5 33 3
SHE-016 19 59 57 44 16 49 8 92 34 8
OBC-045 10 10 1
OBC-024 10 1 3 2
OBC-014 10 470 570 570 370 800 1100 160 12 9 156 10
OBC-081 20 220 100 280 640 91 82 10 33 83 9
OBC-086 88 130 2600 650 410 8 12 2 79 8
Chapman Cove
Chapman Cove was a separate task amended to the grant in 2012. Sampling started in October 2012 and
will continue to the end of the grant in a modified form. In March 2013, sampling results were assessed.
Sites with low FC results were dropped and sites with high results were continued. Upland investigations
for sites with elevated counts were done and additional sites added when warranted. Sites that are
normally part of the Chapman Cove upland’s trend tracking under previous grants were also continued.
Two-hundred and sixty-three samples were taken at 26 sites. As a result of the sampling, the Mason
Conservation District has been asked by Mason County to contact two of the farms in the area. This work
is preliminary to some additional contacts to be made.

19 Mason County PIC Update 3/7/14
Figure 8. Chapman Cove investigative sites 2012-2013.

20 Mason County PIC Update 3/7/14
Table 9. Fecal coliform results (# of colonies per 100 ml) at Chapman Cove, 2012-2013. Sa
mp
le s
ite
10
/29
/20
12
11
/6/2
01
2
11
/13
/20
12
11
/26
/12
12
/03
/12
12
/10
/20
12
12
/27
/20
12
1/1
4/2
01
3
1/2
3/2
01
3
1/2
8/2
01
3
2/1
1/2
01
3
2/1
9/2
01
3
2/2
5/2
01
3
3/2
1/2
01
3
3/2
7/2
01
3
4/2
2/2
01
3
4/2
5/2
01
3
5/7
/20
13
5/2
1/2
01
3
6/4
/20
13
6/1
7/2
01
3
7/1
/20
13
7/1
7/2
01
3
7/2
2/2
01
3
7/2
4/2
01
3
8/5
/20
13
8/2
0/2
01
3
9/4
/20
13
9/5
/20
13
9/3
0/2
01
3
10
/15
/20
13
12
/11
/20
13
Geo
met
ric
Mea
n
Co
un
t
OBY-045 23 460 3 1 2 1 2 9 6 8
OBY-054 360 15 3 5 1 1 1 4 5 8
OBY-055 590 280 26 170 14 33 14 31 7 260 260 460 84 150 350 1000 102 16
OBY-057 62 85 3 8 5 4 1 33 10 8
OBY-058 1300 230 31 76 96 140 83 47 41 33 120 55 61 1100 106 14
OBY-059 2 240 19 590 440 540 780 720 440 190 9
OBY-062 10 10 1
OBY-065 10 10 1
OBY-088 92 31 3 5 2 2 1 5 6 8
OBY-089 11 55 18 19 29 550 35 150 500 145 65 10
OBY-090 21 15 32 24 1800 12 180 890 73 8
OBY-091 280 55 17 49 1100 107 5
OBY-092 1 23 180 31 100 48 820 1300 480 490 104 10
UJC-017 290 30 38 9 142 7 10 5 15 17 16 33 19 33 13 20 7 96 180 68 130 14 28 22
UJC-023 250 10 69 14 17 5 10 7 5 25 10 24 65 120 55 28 13 10 21 18
UJC-024 310 10 100 20 65 18 15 9 16 27 370 37 11
UJC-025 23 10 23 14 31 9 3 27 1 27 3 10 11
UJC-026 180 80 38 23 45 33 52 36 36 23 7 1100 68 230 74 32 350 560 480 77 19
UJC-033 490 92 26 45 10 63 43 21 19 260 130 35 330 92 570 102 1000 870 100 18
UJC-038 210 90 160 57 43 21 15 32 24 1 34 10
UJC-043 210 38 6 28 11 55 18 19 340 36 9
UJC-045 38 3 37 12 72 28 24 270 30 8
UJC-046 22 17 6 2 8 4
UJC-047 38 31 11 1 4 2 12 6 7 8
UJC-056 290 62 46 100 9 27 4 25 10 65 190 51 130 56 170 49 460 680 63 18
UJC-057 62 85 6 14 1 20 29 48 18 8

21 Mason County PIC Update 3/7/14
Mason County had been monitoring fecal coliform trends in the Uncle John Creek area and has
seen improving water quality. The geometric mean for Uncle John Creek sites was separated
out for 2013 because this grant’s QAPP caused us to switch to a different method of testing for
fecal coliform. The previous method was multiple tube fermentation, and the current method is
membrane filtration. It is inappropriate to include 2013 data in with other years. Next year we
will be able to compare 2013 and 2014 on the same graph.
Figure 9. Fecal coliform results from five sites, moving from the mouth of Uncle Johns Creek upstream (UJC-17 up to UJC-038) in 2009-2011. Lab method was multiple tube fermentation.
Figure 10. Geometric mean of fecal coliform counts from the same five sites as in Figure 9 in 2013. Lab method is membrane filtration.
0
20
40
60
80
100
120
UJC-017 UJC-023 UJC-024 UJC-025 UJC-038
Feca
l Co
lifo
rm/
10
0 m
L w
ate
r
Sample Site
2009
2010
2011
0
5
10
15
20
25
30
35
UJC-017 UJC-023 UJC-024 UJC-025 UJC-038
Ge
om
etr
ic m
ean
of
feca
l co
lifo
rm p
er
10
0 m
L
22 Mason County PIC Update 3/7/14
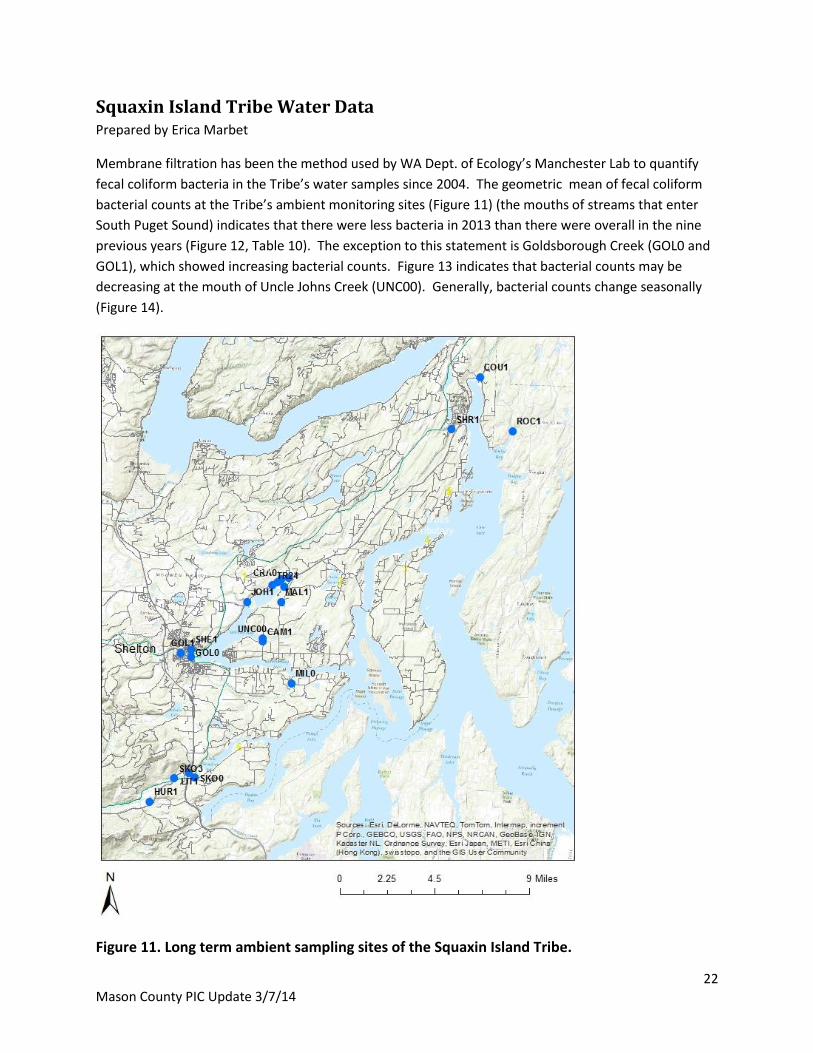
Squaxin Island Tribe Water Data Prepared by Erica Marbet
Membrane filtration has been the method used by WA Dept. of Ecology’s Manchester Lab to quantify
fecal coliform bacteria in the Tribe’s water samples since 2004. The geometric mean of fecal coliform
bacterial counts at the Tribe’s ambient monitoring sites (Figure 11) (the mouths of streams that enter
South Puget Sound) indicates that there were less bacteria in 2013 than there were overall in the nine
previous years (Figure 12, Table 10). The exception to this statement is Goldsborough Creek (GOL0 and
GOL1), which showed increasing bacterial counts. Figure 13 indicates that bacterial counts may be
decreasing at the mouth of Uncle Johns Creek (UNC00). Generally, bacterial counts change seasonally
(Figure 14).
Figure 11. Long term ambient sampling sites of the Squaxin Island Tribe.

23 Mason County PIC Update 3/7/14
Figure 12. Fecal coliform results from the Squaxin Island Tribe's monitoring sites at the mouths of streams that enter South Puget Sound. See Figure 1 for site map.
0
10
20
30
40
50
60
70
80
CAM1 CRA0 DEE0 GOL0 GOL1 HUR1 LIT1 MAL1 MIL0 SHE1 SKO0 SKO3 TR24 UNC00
Ge
om
etr
ic M
ean
of
# co
lon
ies
/ 1
00
ml F
eca
l C
olif
orm
Site ID
2004-2012
2013

24 Mason County PIC Update 3/7/14
Table 10. Fecal coliform results from the Squaxin Island Tribe's monitoring sites at the mouths of streams that enter South Puget Sound. See Figure 1 for site map.
2013 Only
2004-2012 2013 2004-2012 2013
Site # of
Samples Min Max Geometric
Mean Geometric
Mean
90th Percentile
90th Percentile
CAM1 9 2 57 22 15 142 54
CRA0 9 1 100 38 12 157 85
DEE0 9 4 200 22 21 113 102
GOL0 17 6 150 27 29 120 100
GOL1 16 5 140 19 32 94 115
HUR1 9 1 44 46 12 279 72
LIT1 9 1 80 32 10 185 94
MAL1 9 2 290 28 17 172 131
MIL0 9 6 29 17 12 70 25
SHE1 15 7 1100 71 63 449 340
SKO0 9 9 60 45 26 275 56
SKO3 9 7 180 45 28 231 108
TR24 9 3 240 69 25 1012 261
UNC00 13 5 130 55 21 324 72

25 Mason County PIC Update 3/7/14
Figure 13. The mouth of Uncle Johns Creek (UNC00). Time series of fecal coliform counts of individual samples, 2004-2013.
1
10
100
1000
10000
1/1
4/0
4
9/2
0/0
4
5/2
8/0
5
2/2
/06
10
/10
/06
6/1
7/0
7
2/2
2/0
8
10
/29
/08
7/6
/09
3/1
3/1
0
11
/18
/10
7/2
6/1
1
4/1
/12
12
/7/1
2
8/1
4/1
3
4/21
/14
12
/27
/14
Feca
l Co
lifo
rm (
# o
f co
lon
ies
per
10
0 m
l)Vertical Axis is logarithmic
PIC sampling

26 Mason County PIC Update 3/7/14
Figure 14. Seasonal changes in fecal coliform bacterial counts at select monitoring sites of the Squaxin Island Tribe.
0
1
10
100
10001
1/1
3/1
1
1/1
2/1
2
3/1
2/1
2
5/1
1/1
2
7/1
0/1
2
9/8
/12
11
/7/1
2
1/6
/13
3/7
/13
5/6
/13
7/5
/13
9/3
/13
11
/2/1
3
1/1
/14
3/2
/14
Dai
ly P
reci
pit
atio
n (
in)
Feca
l Co
lifo
rm (
# o
f co
lon
ies
per
10
0 m
l)CAM1 MIL0 SHE0 UNC00 DEE0
Vertical Axis is logarithmic scale.

27 Mason County PIC Update 3/7/14
Mason County On-Site Septic System Program Prepared by Cindy Waite
The Mason County On-Site Septic System program (OSS) is a continuous program, but many of its
projects are funded by grants. Figure 15 shows systems in the Oakland Bay area. Prior to this PIC grant,
the OSS program had been searching for and compiling records of all septic systems in the county into a
database. One of the ways that they do that is by requiring all pumpers and operations and
maintenance specialists in the county to enter a service event report into the database. Here are some
of the details:
There are 25500 septic systems in the county.
The OSS program has “truthed” 90% of these systems. This means that they at least have an as-
built description of the system, and their records are scanned and available online.
In the OSS database, information about each system includes the year it was installed, the type
of system, and distance from a shoreline.
The OSS program identifies a lot of septic system issues through reports from home sales,
maintenance, and owners ordering repairs from system designers. The designers turn in an
application to the county for every repair.
With another grant, the OSS program carries out every door direct mailing in targeted areas. They
contact every homeowner once and then again a year later. In the mailing flyer, homeowners get a
reminder that their system needs maintenance, information on pumpers, inspectors, and specialists,
and septic system workshops. Proprietary septic systems that require annual maintenance will receive
additional mailings.
The OSS program has used this PIC grant to target all neighbor-to-neighbor sewage complaints and to
investigate hot spots that are triggered by high fecal coliform counts in the water sampling program.
The OSS program’s response plan for a hot spot is as follows:
Stephanie Kenny creates a hot spot folder with a map, fecal coliform readings, drainage ditch
information, and records from the county website.
OSS program staff send letters to all homeowners on the hot spot list and tries to schedule
sanitary surveys. Then they will try to determine if the problem is a septic system, farm
activities, adjacent properties, or wildlife…
As of 2/21/2014, OSS had 43 hot spots to investigate, 17 first notice letters sent, 7 blind site
visits, and two responses(one home is vacant and for sale-one agreed to a dye trace this
summer when they are there.
Homeowners in Mason County are generally responsive to contact from county staff about their septic
systems. They will fix their septic system problems. Cindy Waite, from the OSS program, has only had
to post a property for non-occupancy four times in her sixteen years on the job. Currently two premises
in Oakland Bay are posted. One is slated for repair, and the other was vacated. The county does have a
problem with RV’s dumping waste into ditches. This became more of an issue after the beginning of the

28 Mason County PIC Update 3/7/14
economic recession in 2008. If an RV owner rebuffs the county staff, then staff visit the him/her again
accompanied by the sheriff.
Figure 15. Oakland Bay area On-Site Septic System program’s tracking of septic systems. This map was generated from the website below. WA State Dept. of Health has not yet brought all areas of Mason County into the map.
https://test-fortress.wa.gov/doh/eh/maps/viewer/index.html?config=config_mraview.xml

29 Mason County PIC Update 3/7/14
WSU Extension Activities Prepared by Bob Simmons
Mason NEP PIC Program Outreach 2013
o Taylor Shellfish Seed Sales, Taylor Shellfish Company; May 25, June 22, July 20, August 17, 2013
Direct Outreach to Shoreline property owners
o Mason Area Fair, Mason Fair Grounds; July 26-28, 2013
Direct Outreach to Shoreline property owners
o Septic Sense Workshops; April-JUne, 2013- In Shelton, Hoodsport, and Belfair (Fall workshops did not
garner enough interest)
o OysterFest, Mason Fair Grounds; October 5&6, 2013
Direct Outreach to Shoreline property owners
o KMAS Radio Show: February 18, 2013 8:30 – 9 am. Discussed shoreline issues in Mason County, promoted the Shore Stewards Program as well as
the March 1st Shoreline Forum.
o Direct mailing to 160 postcard mailer returnees who indicated interest in learning more about the Shore Stewards Program: February 2013
o Shoreline Forum (in collaboration with FutureWise): March 1, 2013, Mary Theler Community Center, Belfair. Approximately 75 people participated.
Speakers covered Shoreline habitat and restoration issues, shellfish issues, shoreline
geology and hardening, Native American tribal uses, as well as an overview of Shoreline
Master Program.

30 Mason County PIC Update 3/7/14
o Earth Day on Oakland Bay: April 21, 2013, Oakland Bay Historical Park Approximately 400 people attended the family friendly event which featured a historical tour, Bird Walk, Native Plant Walk, Live Music and cooking with Xinh. The WSU booth had information regarding the water quality and Shore Stewards.
o Shore Stewards Newsletter. Sent out monthly with highlights, updates, schedule and contact information for SMP.
A specific article on the Mason County Shoreline Master Program Update was provided in the June edition. Indirect emailing to 644 people.
July 2013 – Featured an article on shoreline armoring, with direct references to the SMP, as well as the update process.
August 2013 – Featured an article on Salmon and habitat needs, references were provided regarding the SMP Update.
September 2013 – Featured an article on promoting Native Plants in home landscapes, references were provided regarding the SMP Update.
October 2013 – Featured an article on considerations for winterizing on the shorelines.
November 2013 – Provided Green Holiday tips, as well as information about controlling/removing English Ivy and contact information for a shoreline assessment by the Conservation District.
December 2013 – Featured an article about contaminants in Puget Sound related to what goes down our drains, emphasizing that many contaminants make their way to waterways in this way, even through septic systems.
o October 4-6, 2014, Outreach was provided at Kid’s Day at Oysterfest, as well as at Oysterfest. At Oysterfest the outreach focused on increasing public awareness of the Shoreline Master Program, and that it was currently in the process of being updated, as well as recruitment of Shore Stewards.
o Mason Life Article November 15, 2013, a front page feature that highlighted the Shore Stewards program, as well as the Kennedy Creek Salmon run which depends on healthy shorelines.
o Shore Steward recruitment efforts boosted the number of stewards from 415 to 574 in 2013, a 38% increase from 2012. A web-based evaluation was conducted among Shore Stewards participants in August 2013, where they were asked how much they had changed their behavior (no change, some change or major change) in each of the ten Shore Stewards guidelines. The majority (90.2%) of respondents had made at least one change and almost half (47.5%) had made at least one major change. The majority of respondents (62.3%) had made five or more changes. Specific data is available on request.
31 Mason County PIC Update 3/7/14
Mason Conservation District Activities MCD PIC Report 2013
Prepared by:
Erik Hagan, Small Farms Specialist
Mason Conservation District has been actively involved in working within the framework of the Mason
County PIC program for mitigating water quality and fish habitat concerns in Mason County. Through the
PIC Advisory Committee, we have been focusing efforts within the Oakland Bay Watershed. Mason
Conservation District staff working on these efforts include; Small Farm Specialist, Natural Resource
Planners, Engineering and Survey Staff and Environmental Specialist. Activities of these staff include;
Technical Assistance with individual parcel owners, Farmland Inventory Development with priority
ranking criteria, Conservation Farm Plan development, and implementation of identified needed Best
Management Practices. Erik Hagan, MCD’s Small Farm’s Specialist, is funded .5 FTE for efforts that relate
specifically to agricultural impacts on natural resources in Mason County and has represented MCD for
the Mason County PIC program since Spring of 2013.
In 2013, MCD staff identified and initiated cooperation with 5 landowners whose operations directly
impact the Oakland Bay Watershed. 25 BMP’s will be implemented by the summer of 2015 on all of
these parcels. These BMP’s will specifically address agricultural water quality impacts and enhancement
of riparian habitat/buffers along riparian and agricultural drainage systems. We estimate that 15-20% of
the costs for implementation will be requested from the PIC program.
In 2014, MCD will continue their efforts in collaborating with area agricultural producers that have been
identified either through marine water quality assessment (DOH) or through the development of the
Farm Inventory ranking criteria for drainage system focus. This farmland inventory will rank drainages
within the county based on livestock access and proximity to surface water and windshield surveys of
livestock numbers and current site conditions/infrastructure, etc. A ranking criteria is being developed
to inform of “Very High” to “Low” prioritization of drainage systems to help guide a multi-scale approach
to outreach and mitigation efforts in the county. This drainage priority, based on the farm inventory, will
be shared with PIC program stakeholders for seeking collaborative approaches to mitigation.
As per discussions amongst the PIC advisory committee, MCD staff will be prioritizing Chapman Cove
and have begun coordinated efforts with Stephanie Kenney of Mason Public Health and Erica Marbet of
the Squaxin Tribe. We have identified 3 landowners within the Chapman Cover drainage system and
begun efforts towards cooperation.
Recently, MCD staff has already identified a need for additional PIC funding opportunities in areas
outside of the Oakland Bay Watershed. We have begun technical assistance and conservation farm
planning for a number of new landowners requiring cost-share assistance to implement much needed
BMP’s for water quality and riparian buffer enhancement on agricultural lands that influence; Little
Skookum Inlet, Pickering Passage, North Bay, Annas Bay and Lynch Cove.
32 Mason County PIC Update 3/7/14
Review of 2013 and Expectations for 2014 Ambient Long Term Monitoring- This monitoring did not trigger any need for follow up work
that the chosen long term sample sites. The will be revisited again.
Mclane Cove- Two sites had elevated fecal coliform counts, but otherwise this area was fairly
clean. The first was downstream of undeveloped property, and the only source of pollution
would have been wildlife. The second site may have been influenced by a farm. MCD and
MCPH will visit the area together to decide what to do next. A letter has been sent to residents
in the area. In 2014, a water quality report card and a septic system maintenance letter will be
sent to residents in this area. Rebates will be offered for maintenance, pumping, risers and/or
effluent filters.
North Bay- Preliminary sampling has been done, with fecal coliform counts on the south end of
the town of Allyn. Further sampling will be used to narrow down the sources of pollution.
Expected sources are: legacy septic systems in areas that have recent sewer hook-ups, current
septic systems, pet waste, and urban wildlife. MCPH follow up includes dye testing and
education. Education will consist of an environmental health specialist canvassing the
downtown Allyn area to educate each property owner or renter on water quality issues
particular to their property. Education for business owners will include information about
garbage storage to discourage urban wildlife, whereas the education for residents may include
information about picking up pet waste and landscaping to retain and infiltrate stormwater on
their properties. Proper care of septic systems will be addressed when relevant to the property
and properties that need additional follow up will be tracked.
Oakland Bay/ Hammersley Shoreline- One third of this shoreline is sampled every year. The
Bayshore to Walker Park section was sampled in 2012 with a different grant. The Hammersley
section was sampled in 2013 with this PIC grant. Forty-one sites had high fecal coliform counts.
MCPH will survey these sites for water quality problems in 2014, and they will address problems
with education and/or dye traces, if necessary. The northernmost section of Oakland Bay will be
sampled in 2014.
Upland- Some sites in Shelton and in the north part of Oakland Bay had high fecal coliform
counts. Surface water contributions to the sites in north Oakland Bay will be identified, and
corrections pursued by MCPH and MCD in 2014. With regard to Shelton surface waters, the City
of Shelton is mid-way through a $37 million project of repairing and replacing sewage basins in
multiple neighborhoods. These changes will curtail leakage of sewage to surface waters.
Meanwhile, MCPH continues to sample to look for changes.
Chapman Cove- Farms and residences on Uncle Johns Creek and the Sunset Road have long
been a focus of MCPH and MCD. Some of their first efforts, all the way back to the late 1990’s,
provoked angry responses from residents. Since then, they have periodically revisited these
areas and facilitated septic system repairs and farm plans. One resident terminated his cattle
business and pulled cows from his property in the past couple years. At another residence, the
adult daughter of a long-time resident has entered into working with MCD. Small improvements
in water quality have been achieved. The Tribe’s long term monitoring shows lower fecal
coliform counts at the mouth of Uncle Johns Creek in 2013. Still, Chapman Cove remains only

33 Mason County PIC Update 3/7/14
“conditionally approved” for shellfish harvest. On MCPH’s request, MCD has initiated contact
with two farms in the area, with reasonable responses. Both MCPH and MCD will continue to
investigate and to contact more landowners. All stakeholders are aware that this area is of
critical importance. All understand that, by the end of the summer 2014, landowners who do
not respond at all to MCPH or the MCD will be put on a short list for referral to Derek Rocket at
WA. Dept. of Ecology. This is so Mr. Rocket has time to contact them in the last months of 2014.
In conclusion, while water sampling will continue in 2014, landowner outreach, education, and
enforcement will be the focus, especially in North Bay, Chapman Cove, and problem areas identified by
Hammersley Inlet shoreline sampling.
References Kenny, Stephanie. March 2012. 2011 annual report on the activities of Mason County Public Health and
Human Services in Oakland Bay
Konovsky, John. August 2009. Squaxin Island Tribe shellfish early warning system quality assurance
project plan.

34 Mason County PIC Update 3/7/14
Appendix 1. Maps of Status of Shellfish Growing Areas
Figure 16. Oakland Bay Area- WA State Department of Health, marine sampling stations and status of shellfish growing areas at the end of 2013.

35 Mason County PIC Update 3/7/14

36 Mason County PIC Update 3/7/14
Figure 17. North Bay Area- WA State Department of Health, marine sampling stations and status of shellfish growing areas at the end of 2013.

37 Mason County PIC Update 3/7/14
Figure 18. Mclane Cove (Stations 57 and 58)- WA State Department of Health, marine sampling stations and status of shellfish growing areas at the end of 2013.

38 Mason County PIC Update 3/7/14
Appendix 2- Quality Control
Quality control is referenced to the Tribe’s 2009 Quality Assurance Project Plan (QAPP) (Konovsky 2009).
Quality control goals are 1 blank per sample event and 10% duplicates. In 2012, we started working
under the Squaxin QAPP. Blanks and duplicates were not taken at that time, per discussion with the
Tribe. In 2013, when project management changed at the Tribe, Mason County started taking blanks
and duplicates on their own initiative in order to align with the QAPP. We didn’t meet the QC goals in
2013, though we were not far off in duplicates. The missed target for duplicates can be attributed to a
couple of factors; one major factor is when a sampling run didn’t have sample sites with flows large
enough to take samples simultaneously. Another factor is running low on bottles due to additional
investigative sampling during a run; carrying additional bottles on each run will help in the future.
Mason County recently discussed quality control expectations for 2014 with the Tribe; this will also help
since we are now sure of the expectations.
Quality Control Data
Year #samples Duplicates Blanks sample runs
2012 105 0 0 8
2013 690 53 45 66
Quality Control Results for 2013
Parameter QC results QC goal
DUPLICATES 1/13
samples 1/10 samples
BLANKS
1/1.5 sample
runs 1 blank/ sample run
Top Related