


Languages
Pages
Legal


Update on
DEP Septic Tank
Research Activities
October 20, 2017

Info Covered
• Wekiva area homeowner’s septic tank study
• Ichetucknee experimental drainfield
• Apopka experimental drainfield
10/25/2017 2

Wekiva Study
10/25/2017 3
-typical gravity system

Key Activities
• Homeowner septic tank study• Homeowner meeting (March 2015)
• Screening and selection of 11 study sites (June 2015)
• Site instrumentation (July-August 2015)
• Monitoring period, bi-monthly sampling (September 2015-October 2016)
10/25/2017 4

Wekiva Homeowner Study Objectives
The results of the study help us better understand:• Attenuation and leaching of nitrogen from existing septic
systems into the soil and potentially to ground water
• Other sources of nitrogen in residential areas
• Conditions that may influence nitrogen attenuation in the Wekiva area
• Influence of septic tank pumping on treatment
10/25/2017 5
10/25/2017 6
Site ID CityNo.
residentsDrainfield repair/replacement
history Maintenance info Fertilizer use Soil
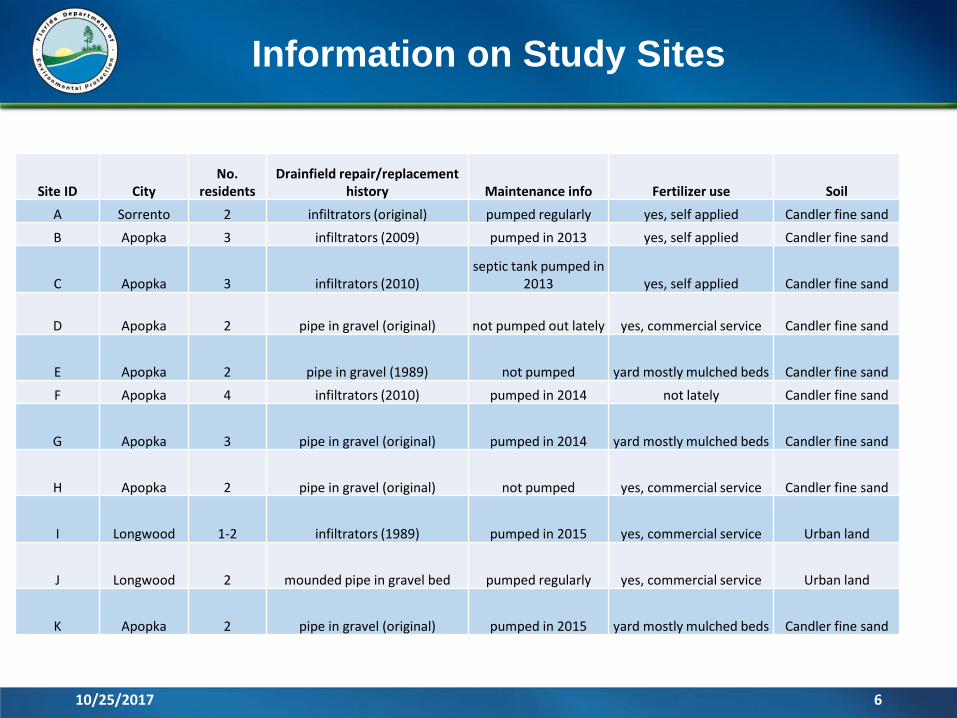
A Sorrento 2 infiltrators (original) pumped regularly yes, self applied Candler fine sand
B Apopka 3 infiltrators (2009) pumped in 2013 yes, self applied Candler fine sand
C Apopka 3 infiltrators (2010)septic tank pumped in
2013 yes, self applied Candler fine sand
D Apopka 2 pipe in gravel (original) not pumped out lately yes, commercial service Candler fine sand
E Apopka 2 pipe in gravel (1989) not pumped yard mostly mulched beds Candler fine sand
F Apopka 4 infiltrators (2010) pumped in 2014 not lately Candler fine sand
G Apopka 3 pipe in gravel (original) pumped in 2014 yard mostly mulched beds Candler fine sand
H Apopka 2 pipe in gravel (original) not pumped yes, commercial service Candler fine sand
I Longwood 1-2 infiltrators (1989) pumped in 2015 yes, commercial service Urban land
J Longwood 2 mounded pipe in gravel bed pumped regularly yes, commercial service Urban land
K Apopka 2 pipe in gravel (original) pumped in 2015 yard mostly mulched beds Candler fine sand
Information on Study Sites

10/25/2017 7
11 Study Site Locations

10/25/2017 8
Types of drainfields in study
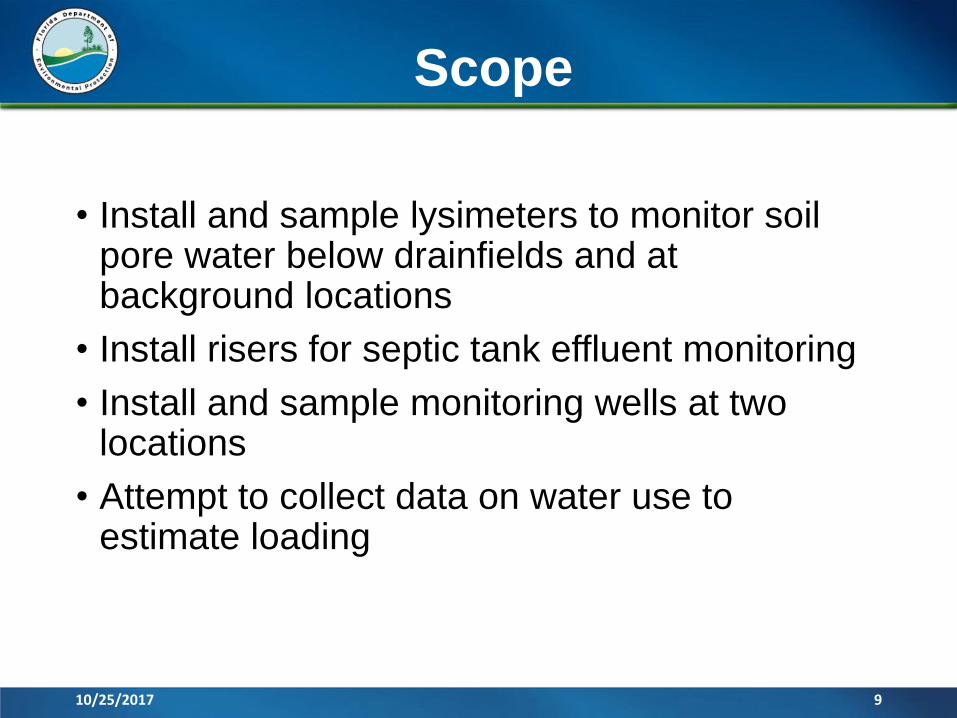
Scope
• Install and sample lysimeters to monitor soil pore water below drainfields and at background locations
• Install risers for septic tank effluent monitoring
• Install and sample monitoring wells at two locations
• Attempt to collect data on water use to estimate loading
10/25/2017 9

Soil Pore Water Monitoring

10/25/2017 11
Lysimeter Installation

Septic Tank Effluent Sampling
Septic tank effluent samples collected bimonthly at 8 sites.Results in mg/L.


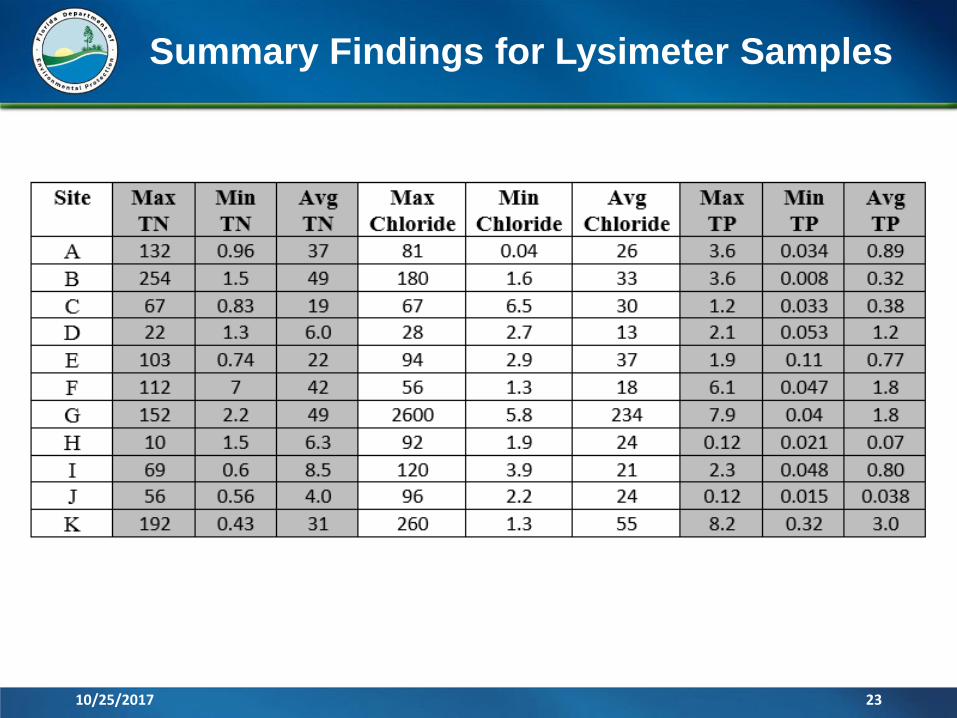
Summary Findings for Lysimeter Samples
10/25/2017 23

Results from some of the sites where TN was mostly from
drainfields during some portion of the monitoring period are
summarized below.
• At Site E, 39 % of nitrogen was reduced with 10% due to
dilution.
• At Site G, 42 to 46 % of nitrogen was reduced in shallow and
deep lysimeters with no dilution.
• At Site J where there is a shallow water table, 35 % of the
nitrogen was reduced in a shallow well with no dilution.
• At Site K, 44 % of nitrogen was reduced with no dilution.
Using data from multiple sites, it appears that attenuation of
N by means other than dilution is about 42 % (based on
assumed TN/Cl relationship)
Information about drainfield-related
N attenuation

10/25/2017 25
Soil Attenuation Modeling

STUMOD runs for study sites
10/25/2017 26
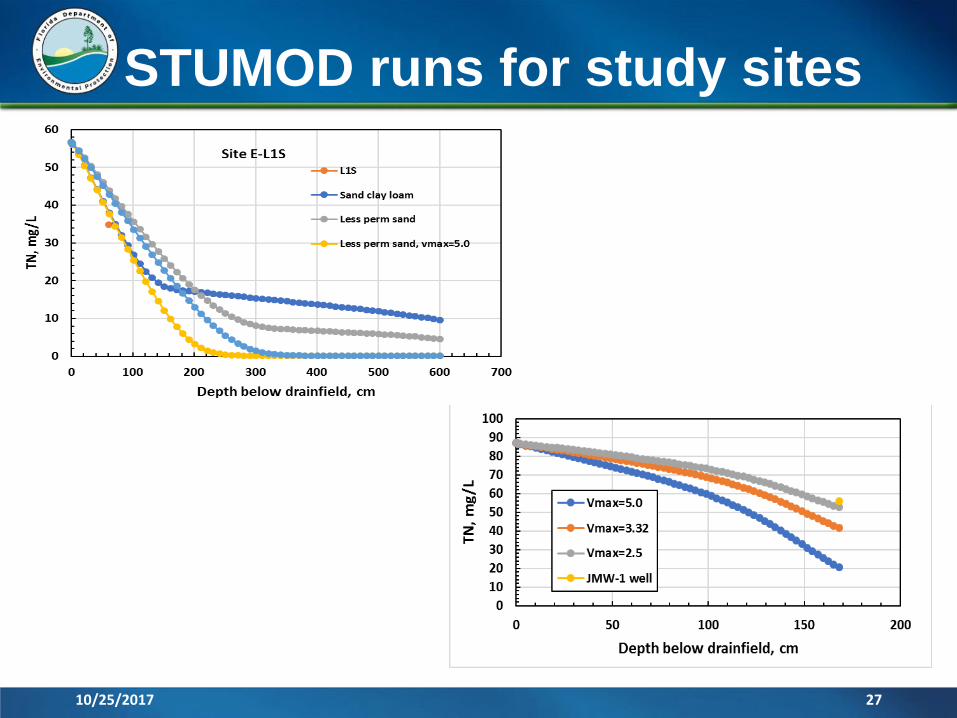
STUMOD runs for study sites
10/25/2017 27

Potential application of STUMOD on regional scale
10/25/2017 28

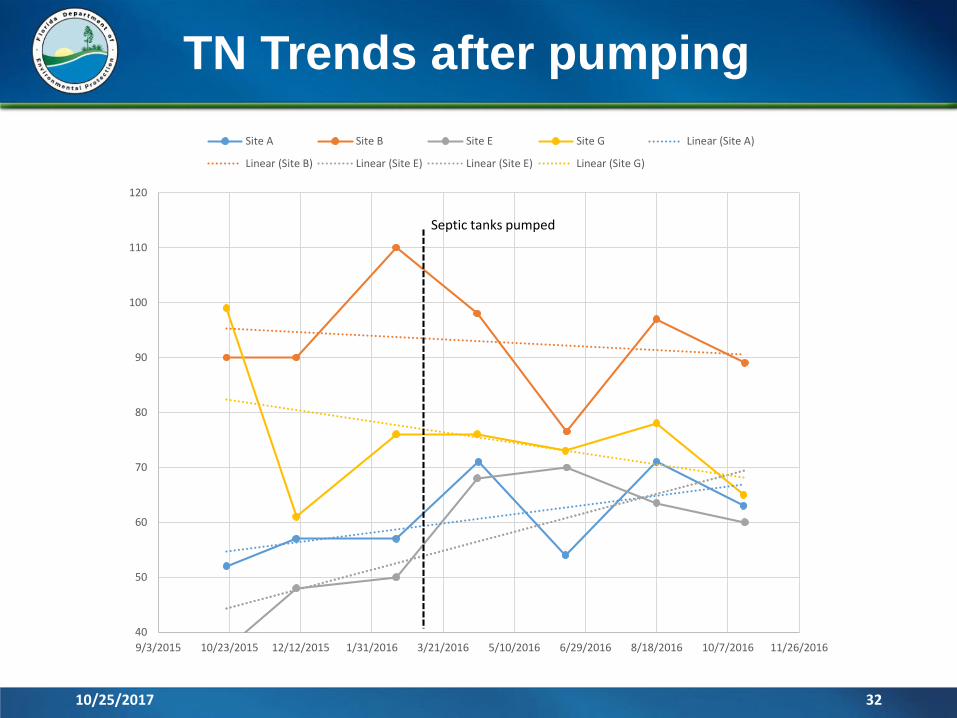
Septic Tank Effluent and Influence of Pumping
• Midway through the study, 4 septic tanks were pumped. Others left as control.
• Septic tanks at sites A, B, E and G were pumped in March 2016, between February and April monitoring events
10/25/2017 29


General statistics for all sites
10/25/2017 32
TN Trends after pumping
40
50
60
70
80
90
100
110
120
9/3/2015 10/23/2015 12/12/2015 1/31/2016 3/21/2016 5/10/2016 6/29/2016 8/18/2016 10/7/2016 11/26/2016
Site A Site B Site E Site G Linear (Site A)
Linear (Site B) Linear (Site E) Linear (Site E) Linear (Site G)
Septic tanks pumped

Ichetucknee Drainfield Study
• Intentionally low-tech, low cost design (added approximately $300 to the cost of a new drainfield)
• Ichetucknee Springs State Park manager’s house
• With DOH construction and operating permits, and under a Memorandum of Understanding
• Installed a second drainfield underlain by wood chips
• Installed monitoring system and monitored
• Put in the ground in March 2014 and septic tank effluent diverted to new system

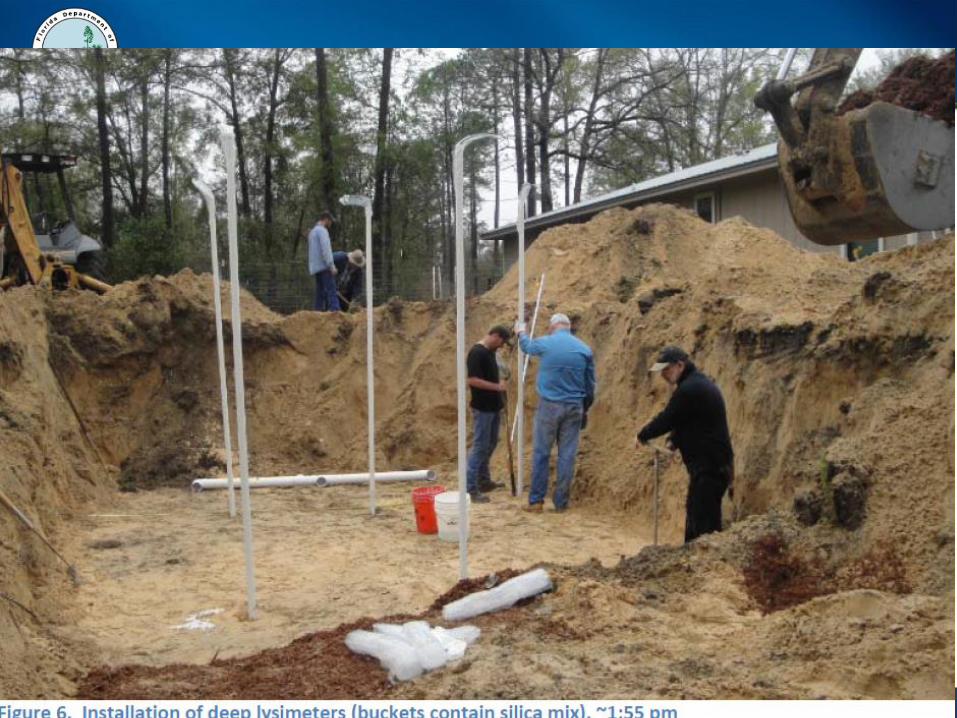


Soil pore water sampling using lysimeters


Monitoring includes
• Pore water from lysimeters set above and below the mulch layer
• Shallow ground water from beneath the drainfield
• Septic tank effluent
• Water level in a shallow piezometer to measure mounding

Plan view
10/25/2017 41

Cross section
10/25/2017 42

Shallow Lysimeter Data
10/25/2017 43
0
50
100
150
200
6/10 12/27 7/15 1/31 8/18 3/6 9/22
Shallow Lysimeters - Chloride mg/L
L-1S L-2S L-3S L-4S
L-5S(2) L-6S STE1
0
20
40
60
80
100
120
6/10 12/27 7/15 1/31 8/18 3/6 9/22
Shallow Lysimeters - Total Nitrogen mg/L
L-1S L-2S L-3S L-4S
L-5S(2) L-6S STE1

Deep lysimeter data
10/25/2017 44
0
20
40
60
80
100
120
140
160
180
9/18 12/27 4/6 7/15 10/23 1/31 5/10 8/18 11/26 3/6 6/14 9/22
Deep Lysimeters - Chloride mg/L
L-1D(2) L-2D L-3D(2) L-4D(2) L-5D
L-6D L-7D L-8D STE1
0
20
40
60
80
100
120
140
9/18 12/27 4/6 7/15 10/23 1/31 5/10 8/18 11/26 3/6 6/14 9/22
Deep Lysimeters - Total Nitrogen mg/L
L-1D(2) L-2D L-3D(2)
L-4D(2) L-5D L-6D

Groundwater monitoring
• Water table at about 20-24 ft below land surface
• Two wells installed between infiltrator rows
• Beneath active drainfield nitrate ranged from 18 to 26 mg/L over the past year, increasing from original background concentration of 3.3 mg/L
10/25/2017 45

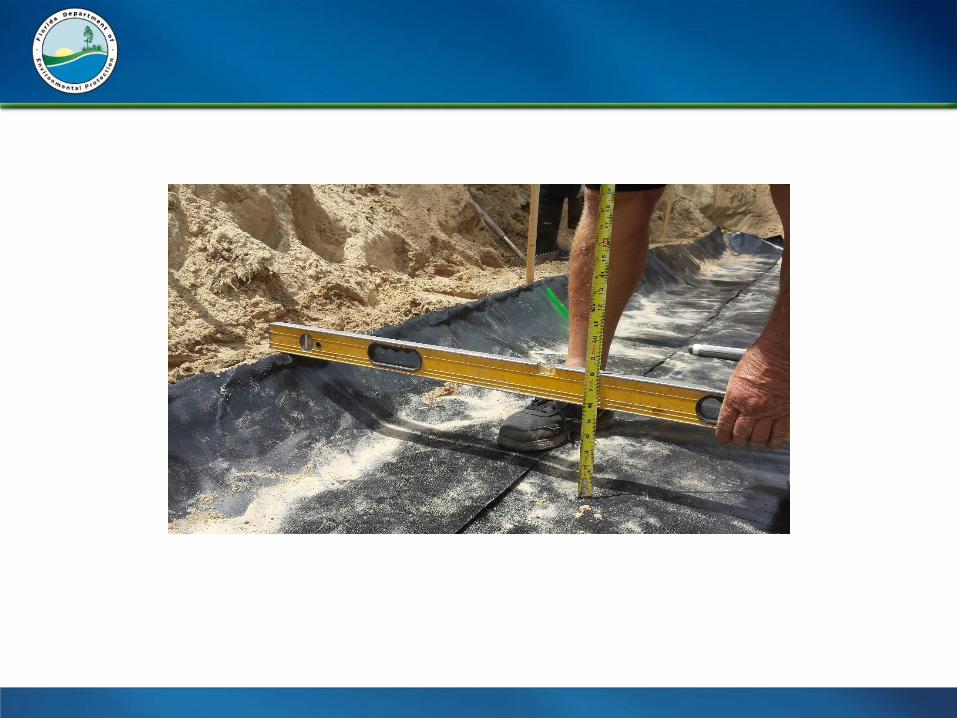
Evaluating subsidence
10/25/2017 46

Evaluating mulch condition
10/25/2017 47

Apopka Lined Drainfield Site
• Experimental drainfield• Passive drainfield with mulch on liner
• Recycled wood mulch
• No pump
• Installed August 2016
• Monthly monitoring for 1 year followed by quarterly monitoring
10/25/2017 48


10/25/2017 55

10/25/2017 56

Shallow Lysimeter Results for First Year
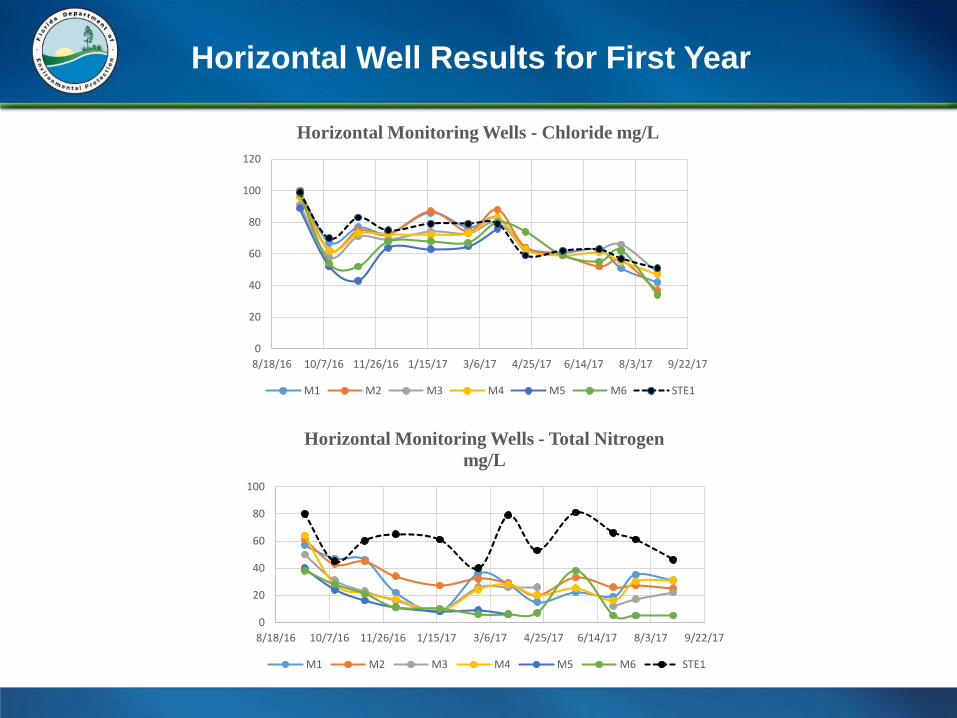
Horizontal Well Results for First Year
0
20
40
60
80
100
120
8/18/16 10/7/16 11/26/16 1/15/17 3/6/17 4/25/17 6/14/17 8/3/17 9/22/17
Horizontal Monitoring Wells - Chloride mg/L
M1 M2 M3 M4 M5 M6 STE1
0
20
40
60
80
100
8/18/16 10/7/16 11/26/16 1/15/17 3/6/17 4/25/17 6/14/17 8/3/17 9/22/17
Horizontal Monitoring Wells - Total Nitrogen
mg/L
M1 M2 M3 M4 M5 M6 STE1

Deep Lysimeter Results for First Year

Groundwater Monitoring
• One well adjacent to active end of drainfield
• Nitrate increased from 3.5 mg/L pre-installation to 6.0 mg/L one year later
• Depth to groundwater about 30 feet below land surface
10/25/2017 60

10/25/2017 61
Questions?
Top Related