


Languages
Pages
Legal


University of Huddersfield Repository
Mistry, Dharmit
Mechanistic studies of some chemical and biochemical reactions
Original Citation
Mistry, Dharmit (2014) Mechanistic studies of some chemical and biochemical reactions. Doctoral thesis, University of Huddersfield.
This version is available at http://eprints.hud.ac.uk/id/eprint/23444/
The University Repository is a digital collection of the research output of theUniversity, available on Open Access. Copyright and Moral Rights for the itemson this site are retained by the individual author and/or other copyright owners.Users may access full items free of charge; copies of full text items generallycan be reproduced, displayed or performed and given to third parties in anyformat or medium for personal research or study, educational or notforprofitpurposes without prior permission or charge, provided:
• The authors, title and full bibliographic details is credited in any copy;• A hyperlink and/or URL is included for the original metadata page; and• The content is not changed in any way.
For more information, including our policy and submission procedure, pleasecontact the Repository Team at: [email protected].
http://eprints.hud.ac.uk/

MECHANISTIC STUDIES OF SOME CHEMICAL
AND BIOCHEMICAL REACTIONS
DHARMIT MISTRY
A thesis submitted to the University of Huddersfield in partial fulfilment of the requirements
for the degree of Doctor of Philosophy
The University of Huddersfield
Submission date: February 2014

i
Abstract
Three aspects of chemical and biochemical reactions were investigated.
1. The relative reactivities of pyrophosphate (phosphorus(V)) and pyro-di-H-
phosphonate (phosphorus(III)) and its derivatives have been analysed at various pHs. The
hydrolysis rate of pyro-di-H-phosphonate (PP(III)) was found to be higher than
pyrophosphate at all pHs. Using ITC and NMR, pyrophosphate showed metal-ion
complexing abilities whereas pyro-di-H-phosphonate showed weak or no complexing to
metal-ions, although the rate of hydrolysis at pH 7 slightly increased compared to the
spontaneous hydrolysis of PP(III). The enzymatic hydrolysis of pyrophosphate, which is
thought to occur via MgPP(V)2-
, occurs efficiently and is close to being diffusion controlled.
Pyro-di-H-phosphonate on the other hand does not act as a substrate or as an inhibitor of
pyrophosphatase.
2. Dichloromethane (DCM) is an alkylating agent for pyridine, producing methylene
bis-pyridinium dication (MDP) upon refluxing the solution. The kinetics and mechanism of
hydrolysis of methylene bis-pyridinium dication have been studied. Below pH 7 MDP is
extremely stable and hydrolysis is first-order in hydroxide-ion. Above pH 9 an unusual
intermediate is formed on hydrolysis which has a chromophore at 366 nm in water and its
formation is second-order in hydroxide-ion. The carbon acidity of the central methylene
group was also investigated kinetically using H/D exchange and the pKa was surprisingly high
at 21.2 at 25oC (I = 1.0 M).
3. Isothermal titration calorimetry (ITC) is a technique mainly used by biochemists to
obtain a range of physical and thermodynamic properties of a reaction. Analysing the data
can become difficult when investigating complex reactions involving more than one step, for
instance metal-ions binding to an enzyme. In this work models have been developed to
simulate sequential reactions. These were used to simulate experimental ITC data for metal-
ions: Zn2+
, Co2+
and Cd2+
complexing to the active sites of BcII, a metallo β-lactamase
responsible for antibiotic resistance, providing additional information on the mechanism by
which this enzyme acts to deactivate β-lactam antibiotics. The simulations suggest that BcII
has two very similar binding affinities to metal-ions which are filled sequentially.

ii
Acknowledgements
First and foremost I would like to thank my supervisors, Professor Michael I Page
and Professor David R Brown. It has been an honour to be your student and I appreciate the
time and effort you have taken to supervise and encourage me through this research, it has
been of enormous value.
I thank Innovative Physical Organic Solutions (IPOS), for providing the funding for this
research and having available top of the range analytical equipment. All the members of
IPOS have contributed to my personal and professional time as part of the group. I am
especially grateful for the experimental and theoretical help given by Dr Nicholas T Powles
and Dr Matthew J Stirling. I also thank the members of the research group especially
Professor John H Atherton, Dr Haifeng Sun, Victoria L Sutcliffe and Joseph M Griffin for
their useful conversations.
To the members of my research office, past and present, they know who they are. Thank you
for always being there, you have made this truly unforgettable.
I thank Professor Robert A Cryan (VC) for taking the time and effort out of his busy schedule
to help with the mathematics and solutions to the isothermal titration calorimetry modelling
equations.
I would also like to thank Professor Christian Damblon (university of Liege, Belgium) for
providing the plasmid containing the gene for the β-lactamase strain we used in this work.
I also thank Dr Neil McLay for his work and help with the NMR.

iii
Table of contents
Abstract ...................................................................................................................................... i
Acknowledgements ...................................................................................................................ii
Table of contents .................................................................................................................... iii
Abbreviations ........................................................................................................................ viii
Chapter 1 – PHOSPHATES AND H-PHOSPHONATES .................... 1
1 Introduction ...................................................................................................... 1
1.1 Background .................................................................................................... 2
1.1.1 Phosphate esters within DNA ........................................................................ 2
1.1.2 Phosphorylating agents .................................................................................. 3
1.1.3 H-phosphonates.............................................................................................. 6
1.1.4 P-H Exchange ................................................................................................ 7
1.1.5 pKa of phosphorus acids ............................................................................... 10
1.1.6 Mechanism of hydrolysis of phosphate esters ............................................. 12
1.1.6.1 Associative mechanism ................................................................................ 12
1.1.6.2 Dissociative mechanism ............................................................................... 13
1.1.6.3 Concerted mechanism .................................................................................. 13
1.1.7 The mechanisms of hydrolysis and reactivity of phosphate esters .............. 14
1.1.7.1 Mono-ester Hydrolysis ................................................................................. 14
1.1.7.2 Di-ester hydrolysis ....................................................................................... 18
1.1.8 Hydrolysis of the P-O-P bond ...................................................................... 20
1.1.9 Metal coordinated hydrolysis ....................................................................... 22
1.1.10 Enzymatic Hydrolysis of phosphate esters .................................................. 25
1.1.10.1 Non-specific phosphatase – Alkaline phosphatase....................................... 26
1.1.10.2 Alkaline pyrophosphatase ............................................................................ 27
1.1.10.3 Acid phosphatases ........................................................................................ 29
1.1.10.4 Phosphoprotein phosphatases ....................................................................... 30
1.1.10.5 Substrate specific/similar phosphatases ....................................................... 31

iv
1.1.11 Heats of hydrolysis of phosphates ............................................................... 32
1.1.12 Aim .............................................................................................................. 34
1.2 Experimental ................................................................................................ 35
1.2.1 Materials ...................................................................................................... 35
1.2.2 Kinetics/pKa ................................................................................................. 35
1.2.2.1 Enzyme kinetics ........................................................................................... 37
1.2.3 Metal-ion complexing .................................................................................. 37
1.2.4 Heats of hydrolysis ...................................................................................... 38
1.3 Results and discussion ................................................................................. 40
1.3.1 Pyro-di-H-phosphonate identification.......................................................... 40
1.3.2 pKa of pyro-di-H-phosphonate (III) and ethyl-H-phosphonate .................... 42
1.3.3 pH-rate profiles for the hydrolysis of PP(III) and PP(V) ............................. 45
1.3.3.1 PP(III) hydrolysis ......................................................................................... 47
1.3.3.2 PP(V) hydrolysis .......................................................................................... 51
1.3.3.3 Mixed P(III.V) .............................................................................................. 54
1.3.4 Hydrolysis of other P(III) derivatives .......................................................... 56
1.3.5 Mechanisms of hydrolysis of PP(III) and PP(V) ......................................... 58
1.3.6 Metal coordination to PP(III) and PP(V) ..................................................... 60
1.3.7 Hydrolytic effect of metal-ions on pyro-di-H-phosphonate......................... 64
1.3.8 Hydrolysis of PP(V) and PP(III) by pyrophosphatase ................................. 66
1.3.9 Pyro-di-H-phosphonate as a potential inhibitor of pyrophosphatase ........... 68
1.3.10 Heats of hydrolysis of PP(V) and PP(III) .................................................... 69
1.4 Conclusion ................................................................................................... 75
Chapter 2 – METHYLENE BIS-PYRIDINIUM DICATION ........... 76
2 Background..................................................................................................... 76
2.1 Properties of pyridine and dichloromethane (DCM)/methylene chloride .... 76
2.1.1 Alkylation of pyridine .................................................................................. 77
2.1.2 Salts of pyridine and their preparation ......................................................... 78
2.1.2.1 N-alkyl pyridinium salts ............................................................................... 79

v
2.1.2.2 Zincke procedure .......................................................................................... 79
2.1.2.3 N-acyl pyridinium salts ................................................................................ 80
2.1.2.4 N-trityl pyridinium salts ............................................................................... 80
2.1.2.5 Paraquat ........................................................................................................ 81
2.1.2.6 Pyridinium salts from pyrylium salts ........................................................... 81
2.1.2.7 Bis-pyridinium salts ..................................................................................... 82
2.1.3 Application of pyridinium compounds ........................................................ 83
2.1.4 Preparation of Methylenebis-pyridinium ..................................................... 85
2.1.5 Crystal structures of Methylenebis-pyridinium ........................................... 87
2.1.6 Reactivity of pyridinium compounds ........................................................... 88
2.1.7 Hydrolysis of pyridinium compounds.......................................................... 89
2.1.8 Ring opening reactions ................................................................................ 93
2.1.9 Acidity ......................................................................................................... 98
2.1.9.1 Brønsted-Lowry acid-base model ................................................................ 98
2.1.9.2 Carbon acidity .............................................................................................. 99
2.1.9.3 Enzyme catalysed proton transfer .............................................................. 101
2.2 Experimental .............................................................................................. 102
2.2.1 Materials .................................................................................................... 102
2.2.2 General methods ........................................................................................ 102
2.2.3 Kinetic measurements ................................................................................ 103
2.2.4 Aim ............................................................................................................ 104
2.3 Results and Discussion .............................................................................. 105
2.3.1 Structural properties of MDP ..................................................................... 105
2.3.1.1 1H and
13C NMR ......................................................................................... 105
2.3.1.2 Mass spectrum of MDP .............................................................................. 109
2.3.2 Hydrolysis of MDP between pH 9 and 14 ................................................. 110
2.3.2.1 Kinetics ...................................................................................................... 110
2.3.3 Hydrolysis products ................................................................................... 113
2.3.4 Intermediate identification ......................................................................... 116

vi
2.3.5 Mechanism of hydrolysis ........................................................................... 119
2.3.6 Hydrolysis products of MDP below pH 9 .................................................. 120
2.3.7 Summary .................................................................................................... 122
2.3.7.1 Overall pH-rate profile ............................................................................... 122
2.3.8 D-exchange ................................................................................................ 124
2.3.8.1 Methylene D-exchange .............................................................................. 126
2.3.8.2 Deuterium exchange of MDP ring protons ................................................ 131
2.3.9 Conclusion ................................................................................................. 134
Chapter 3 – β-LACTAMASES ............................................................ 135
3 History .......................................................................................................... 135
3.1 Antibiotics and bacteria ............................................................................. 137
3.1.1 Peptidoglycan layer biosynthesis ............................................................... 138
3.1.2 Penicillin mode of action ........................................................................... 139
3.1.3 Antibiotic resistance ................................................................................... 140
3.1.3.1 Transformation ........................................................................................... 141
3.1.3.2 Transduction ............................................................................................... 141
3.1.3.3 Conjugation ................................................................................................ 141
3.1.4 Mechanisms of antibacterial resistance ...................................................... 142
3.1.4.1 Efflux pumps .............................................................................................. 142
3.1.4.2 Target modification and pathway alteration ............................................... 142
3.1.4.3 Chemical modification ............................................................................... 142
3.1.5 β-Lactamases ............................................................................................. 143
3.1.6 Serine β-Lactamases .................................................................................. 145
3.1.6.1 Class A β-Lactamases ................................................................................ 145
3.1.6.2 Class C β-Lactamases ................................................................................. 146
3.1.6.3 Class D β-Lactamases ................................................................................ 147
3.1.7 Metallo β-Lactamases ................................................................................ 148
3.1.7.1 Class B β-Lactamases ................................................................................. 148
3.1.7.2 Structure of metallo β-lactamases .............................................................. 149

vii
3.1.7.3 Why Zinc? .................................................................................................. 151
3.1.8 Metallo hydrolysis mechanisms ................................................................. 152
3.1.9 Binding of metal-ions to enzymes ............................................................. 154
3.1.9.1 Microscopic and Macroscopic Binding ...................................................... 155
3.1.10 Cooperativity.............................................................................................. 156
3.1.11 Calorimetry ................................................................................................ 159
3.1.12 Power compensation calorimeter ............................................................... 159
3.1.13 ITC output .................................................................................................. 160
3.1.14 Calculating the binding constant Kb and other parameters ........................ 162
3.1.15 Calibration of the ITC ................................................................................ 164
3.1.16 Subtraction of heats of dilution .................................................................. 164
3.1.17 Aim ............................................................................................................ 165
3.2 Results and discussion ............................................................................... 166
3.2.1 Single binding site, formation of the mononuclear enzyme ...................... 166
3.2.2 Binuclear binding model with the formation of both EM and EM2
(Sequential binding). .................................................................................. 171
3.2.3 Binuclear binding model without the formation of the mononuclear species
EM (‘concerted’, positively cooperative binding). .................................... 173
3.2.4 Comparison of the sequential and concerted models ................................. 178
3.2.5 Comparison of differential heat isotherms with respect to different binding
constants and enthalpies using the sequential model. ................................ 187
3.2.6 Metal-ion binding to BcII .......................................................................... 191
3.2.7 Conclusion ................................................................................................. 204
Chapter 4 – PUBLISHED PAPERS ................................................... 205
Chapter 5 – REFERENCES ................................................................ 206

viii
Abbreviations
A Adenine
ADP Adenosine diphosphate
ala Alanine
AMP Adenosine monophosphate
Arg Arginine
Asn Asparagine
Asp Aspartate
atm Atmospheres
ATP Adenosine triphosphate
βlg Brønsted leaving group
C or cys Cytosine
CA Carbonic anhydrase
cAMP Cyclic adenosoine monophosphate
CAPS N-cyclohexyl-3-aminopropanesulfonic acid
CPC Cetylpyridinium chloride
D2O Deuterium oxide
Da Daltons
DCM Dichloromethane/methylene chloride
DEPT-135 Distortionless Enhancement by Polarization Transfer 135o
DMAP Dimethyl amino pyridine
DMD Duchenne muscular dystrophy

ix
DMF Dimethylformamide
DMSO Dimethylsulfoxide
DNA Deoxyribonucleic acid
E.coli Escherichia coli
ESI Electron spray ionisation
FID Flame ionization detection
G Guanine
ΔGo Standard Gibbs free energy
G-6-Pase Glucose-6-phosphtase
GC Gas chromatography
GC-MS Gas chromatography Mass-spectrometry
Gln Glutamine
ΔH Enthalpy
ΔHobs Observed enthalpy
HCl Hydrochloric acid
HEPES 4-(2-hydroxyethyl)-1-piperazineethanesulfonic acid
His Histidine
HSQC Heteronuclear single quantum coherence
Hz Hertz
I Ionic strength
IP Inositol phosphate
ITC Isothermal titration calorimetry
J Joules

x
K Kelvin
Kb Binding constant
kcat First order rate constant for the breakdown of ES
KCl Potassium chloride
Kd Dissociation constant
KIE kinetic isotope effect
Km The Michaelis constant (the substrate concentration at which the reaction rate
is half of Vmax)
λmax Lamda max
Leu Leucine
m/z Mass/charge
MBL Metallo beta-lactamase
MDP 1,1-bispyridinium dication
MHz Mega Hertz
MOPS 3-(N-morpholino)propanesulfonic acid
MS-QQQ Triple quadrupole mass spectrometer
NAG N-acetylglucosamine
NAM N-acetylmuramic acid
NMR Nuclear magnetic resonance
NOE Nuclear Overhauser effect
oC Degrees Celsius
Pa Pascals
PCr Creatine phosphate

xi
pD Negative logarithm of deuterium ion concentration
phe Phenylalanine
pKa Negative logarithm of acid dissociation constant
pm Picometers
pNPP p-nitrophenol phosphate
PP(III) Pyro-di-H-phosphonate
PP(III.V) Isohypophosphate
PP(V) Pyrophosphate
PPase Pyrophosphatase
ppm Parts per million
PPM Phosphoprotein phosphatase M
PPP Phosphoprotein phosphatase P
psi Pressure per square inch
PTP Protein tyrosine phosphatases
Q Heat
RNA Ribonucleic acid
SN(ANRORC) Addition of nucleophile, ring opening and ring closure
SN1 Nucleophilic Substitution 1
SN2 Nucleophilic Substitution 2
SNAr-AE Nucleophilic aromatic substitution addition-elimination
SNAr-EA Nucleophilic aromatic substitution elimination-addition
T Thymine
TSP Sodium trimethylsilylpropionate

xii
UV-Vis Ultra violet and visible
Vmax Maximal rate of the enzyme catalysed reaction
ZPE Zero-point energy

1
Chapter 1 – PHOSPHATES AND H-PHOSPHONATES
1 Introduction
Biological phosphate esters have many roles and underpin most life processes such as
the storage and manifestation of genetic information, energy transduction, signalling,
regulation, differentiation, compartmentalisation, substrate modification to facilitate chemical
reactions and as structural components1. These properties are the major reason why
phosphates and their derivatives are studied.

2
1.1 Background
1.1.1 Phosphate esters within DNA
Deoxyribonucleic acid, DNA is present in all life forms, animal and plant. It is the
template for the production of proteins via ribonucleic acid (RNA). Genetic information is
encoded as a sequence of nucleotides, which contain one of four bases that are derivatives of
pyrimidine, thymine (T) and cytosine (C) or purines, adenine (A) and guanine (G). One of
these bases is attached to a sugar, either ribose or deoxyribose which also contains phosphate
groups (Scheme 1.1)2.
N
NNH
N
NH2
NH
NNH
N
O
NH2
N
NH
NH2
O
NH
NH
O
O
H3C
NH
NH
O
O
Cytosine (C) Thymine (T) Uracil (U)Only present in RNA
Adenine (A) Guanine (G)
Purines
Pyrimidines
O
RO
O
Base
DNA, R = HRNA, R = OH
Base =
P
O
O-
O
Scheme 1.1 Base, sugar and phosphate group to form a nucleotide which composes DNA and
RNA.
The nucleotides are joined by a 3ˈ-5ˈ phosphodiester bond which provides the extremely
stable sugar-phosphate backbone of DNA2. The phosphate ester backbone has an estimated
half-life of 31 million years for its spontaneous water hydrolysis1 yet RNA which contains a
hydroxyl group at position 2 of the ribose unit is significantly less, due to transesterification
and hydrolysis which cleaves the phosphate di-ester backbone (Scheme 1.2) i.e. 2ˈ-OH
attacks the 3ˈ-P-O bond3.

3
O
OHO
HO
Base
PO O-
O
OHO
O
Base
PO
O-
O-
O
OO
HO
Base
P
O O-
O
OHO
HO
Base
PO
O-
O-
+
H2O
O
OHO
HO
Base
PO
O-
O-
Scheme 1.2 Transesterification of RNA4.
DNA is a double stranded helix which is stabilised by the opposing strand by hydrogen bond
and other intermolecular interactions. In 1953 Watson and Crick proposed the structure for
DNA which consisted of two complementary strands which run anti-parallel to each other.
Adenine pairs with thymine and guanine pairs with cytosine whereas in RNA, uracil binds to
adenine and is usually single stranded2. In addition to providing a stable backbone to DNA
the phosphate groups provide an area for solvation as the hydrophobic base pairs are
contained within the centre of the helix.
Nucleosides (base + sugar) adenosine, thymidine, cytidine and uridine are phosphorylated at
the 5ˈ-position of the ribose sugar unit by their respective kinase and additional phosphates
can be added to form nucleoside diphosphates and triphosphates such as adenosine
triphosphate (ATP)5.
1.1.2 Phosphorylating agents
Phosphorylation involves the addition of a phosphate group generally to a protein
and occurs in many key processes such as signalling and regulation of proteins. In living
organisms, phosphorylation is catalysed by enzymes such as kinases and dephosporylation by
phosphatases both of which are used widely for the generation, distribution and application of
free energy by the manipulation of phosphoric acid anhydrides and its esters. The most
common phosphorylating agent is adenosine triphosphate (ATP) (Scheme 1.3) which is the
major energy currency in living systems6.

4
ATP is an adenine base which is attached to a D-ribose sugar via a N-glycosidic bond, to
which phosphate groups are attached at the 5ˈ-position via ester linkages7. There are three
phosphate groups present in ATP and the closest phosphorus to the ribose ring is referred to
as alpha (α), the next beta (β) and finally gamma (γ).
N
NN
N
NH2
O
OHOH
OPO
O-
O
POP
O
-O
O-
O
O-
Scheme 1.3 Adenosine triphosphate (ATP)4.
Phosphate group transfers are also involved in oligonucleotide synthesis which is a useful
technique for DNA sequencing and anti-sense therapies to treat diseases such as Alzheimer’s,
cancer and duchenne muscular dystrophy (DMD). The method for solid-state oligonucleotide
synthesis involves a solid support resin and the 3ˈ-hydroxyl group of the first nucleoside base
is directly bound to an insoluble support such as silica, glass beads or a polystyrene derivative
resin via a succinyl link.
Generally the substrate alcohol (5ˈ-OH) displaces a good leaving group such as chloride,
triazolate or diallylphosphate. One method of phosphorylation but not used that often
anymore, involves direct reaction with phosphoryl chloride in the presence of a base (Scheme
1.4)8.
ROH + POCl3 PO(OR)Cl2-HCl
Scheme 1.4 Alcohol reacting with phosphoryl chloride to produce a phosphate mono-ester9.
There are several examples of phosphorylating agents such as anhydrides, mono- and di-
esters. Tetra-esters of pyrophosphoric acid, mixed anhydrides or a di-ester e.g.
phosphorochloridic acid can be used as phosphorylating agents in the presence of a base10
.
α β γ
5
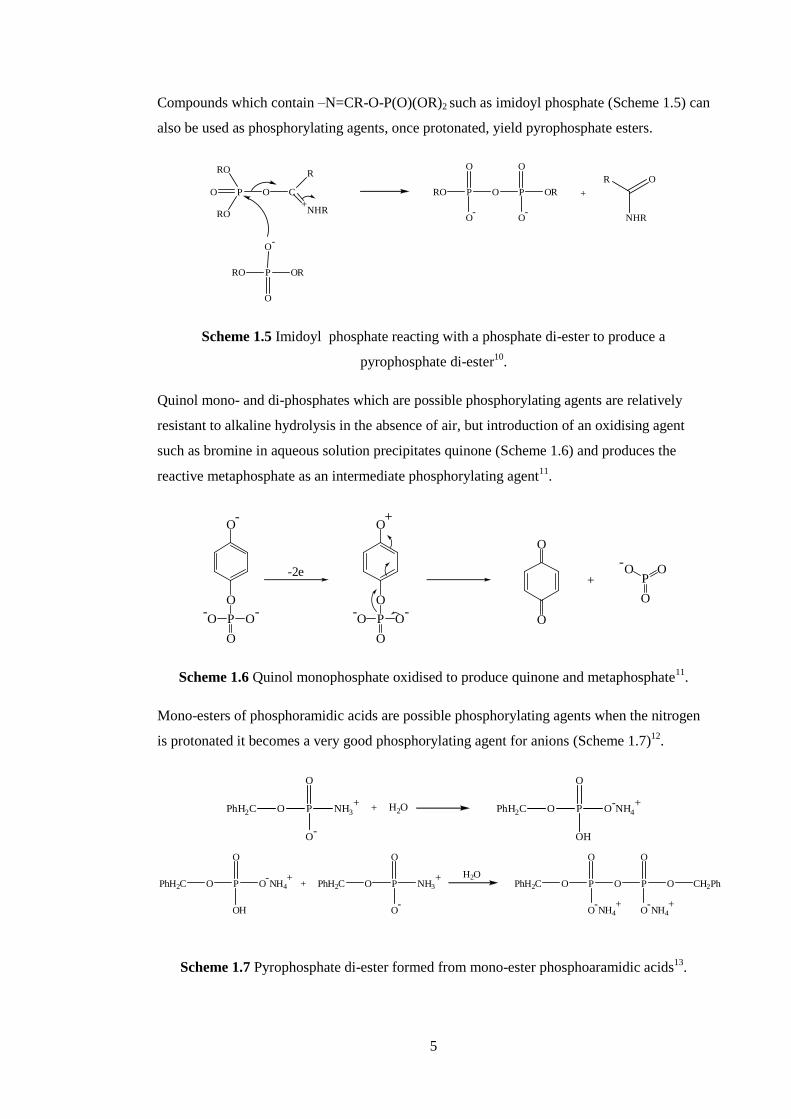
Compounds which contain –N=CR-O-P(O)(OR)2 such as imidoyl phosphate (Scheme 1.5) can
also be used as phosphorylating agents, once protonated, yield pyrophosphate esters.
P O C
R
+NHR
RO
RO
P
O-
RO OR
O
O P
O
RO O
O-
P
O
O-
OR +
OR
NHR
Scheme 1.5 Imidoyl phosphate reacting with a phosphate di-ester to produce a
pyrophosphate di-ester10
.
Quinol mono- and di-phosphates which are possible phosphorylating agents are relatively
resistant to alkaline hydrolysis in the absence of air, but introduction of an oxidising agent
such as bromine in aqueous solution precipitates quinone (Scheme 1.6) and produces the
reactive metaphosphate as an intermediate phosphorylating agent11
.
O
P
O
-O O
-
O-
-2e
O
P
O
-O O
-
O+
P
O
-O O
O
O
+
Scheme 1.6 Quinol monophosphate oxidised to produce quinone and metaphosphate11
.
Mono-esters of phosphoramidic acids are possible phosphorylating agents when the nitrogen
is protonated it becomes a very good phosphorylating agent for anions (Scheme 1.7)12
.
PO
O
O-
NH3+
PhH2C + H2O PO
O
OH
O-NH4
+PhH2C
PO
O
OH
O-NH4
+PhH2C PO
O
O-
NH3+
PhH2C+H2O
PO
O
O-NH4
+
OPhH2C P
O
O
O-NH4
+
CH2Ph
Scheme 1.7 Pyrophosphate di-ester formed from mono-ester phosphoaramidic acids13
.

6
1.1.3 H-phosphonates
H-phosphonates and their derivatives have many applications in a wide variety of
areas such as agriculture, medicine and the pharmaceutical industry. The agricultural industry
is the largest consumer of H-phosphonates which uses them as fungicides, herbicides and
plant growth regulators14
.
H-phosphonate chemistry involves the parent molecule, phosphorous acid which is also
referred to as phosphonic acid (H3PO3). Phosphorous acid has two pKas of 1.07 and 6.58 and
is slightly more acidic than phosphoric acid which has pKas of 2.12, 7.21 and 12.3215
. There
are two tautomeric forms of phosphorous acid and its derivatives in solution, the tetra-
coordinated H-phosphonate or the tri-coordinated phosphite which both bear the phosphorus
atom in the +3 oxidation state (Scheme 1.8)16
.
HO
P
O
OH
H
HO
P
OH
OH
Tetra-coordinatedH-phosphonate
Tri-coordinatedPhosphite
Scheme 1.8 Equilibrium between the tetra-coordinated and tri-coordinated phosphorous
species16
.
It has now accepted that H-phosphonates exist predominantly as the tetra-coordinated species
and not the tri-coordinated species which was initially believed16
.
Using 31
P{H} NMR as an analytical technique, di-esters of H-phosphonates usually show
signals in the region of 0-15 ppm14
and some phosphorous compounds such as di-esters of
pyro-H-phosphonates have negative chemical shift usually between 0 and -10 ppm,
characteristic of the tetra-coordinated phosphorus atom17
. It has been suggested that the tetra-
coordinate phosphorous species undergoes tautomerisation as shown in Scheme 1.8 yet there
is no evidence within the NMR spectrum that the tri-coordinated species exists (signals
usually in the 130 ppm region)14
.

7
1.1.4 P-H Exchange
Phosphorous acid contains three hydrogens, two oxygen bonded and one directly
bonded to phosphorus. The two oxygen bound hydrogens exchange rapidly in D2O. On the
other hand, data supporting the deuterium exchange of the hydrogen directly bonded to the
phosphorus for deuterium is inconclusive18
. The acid catalysed P-H exchange with deuterium
and oxidation under acidic conditions with iodine were studied for di-methyl, di-ethyl and di-
n-propyl-H-phosphonate19
. Proton NMR was used to determine the kinetics of P-H/P-D
exchange which followed first-order kinetics with respect to H-phosphonate for both
exchange and oxidation. The acid catalysed (kH) and acid-independent rate constants (kw) for
exchange are provided in Table 1.1 for the different H-phosphonates.
Compound Exchange Oxidation
kH / M-1
s-1
kw / s-1
kH / M-1
s-1
kw / s-1
Dimethyl H-
phosphonate
1.1 x 10⁻³
1.3 x 10⁻⁴
5.3 x 10⁻⁴
2.3 x 10⁻⁵
Diethyl H-
phosphonate
1.0 x 10⁻³
3.3 x 10⁻⁵
4.2 x 10⁻⁴
6.7 x 10⁻⁶
Di-n-propyl H-
phosphonate
9.7 x 10⁻⁴
1.2 x 10⁻⁴
4.2 x 10⁻⁴
3.3 x 10⁻⁶
Table 1.1 Rate constants for the deuterium exchange and oxidation of H-phosphonate19
.
The oxidation rate of di-alkyl H-phosphonates with iodine was independent of iodine
concentration above a certain ratio of iodine to di-alkyl H-phosphonate. Under acidic
conditions the rate law for oxidation (Equation 1.1) was the same as that for the exchange rate
for deuterium indicating the rate-determining step is the same for both reactions.
Rate of exchange/oxidation = kH [H+] [H-phosphonate] + kw [H-phosphonate]
Equation 1.1
The proposed scheme for the acid catalysed exchange and oxidation involves initial
protonation of the phosphoryl group followed by formation of a phosphite (tri-coordinated,
possessing a lone pair on the phosphorus atom) which is believed to be very reactive. The tri-
coordinated phosphite under excess oxidising agent, is oxidised to the phosphate or in the
absence of oxidising agent reverts to the D-phosphonate accepting a proton via a suitable
donor (Scheme 1.9)20
.

8
P
O
RO
H
OR P+
OH
RO
H
OR
P
RO OH
OR
P
O
RO
D
ORP
O
RO
O-
OR
k1 H+
k-1
H-phosphonate
k2
-H+
D2OExchange
I2/H2OOxidation
Fast Fast
Phosphite
Scheme 1.9 Mechanism of deuterium exchange or oxidation of the directly bound hydrogen
of H-phosphonate20
.
Oxidation of H-phosphonates by halogens such as iodine are subject to base catalysis which
also produces the phosphite as a reactive intermediate. Increasing the basicity of the base
increases the kinetic isotope effect as shown in Table 1.221
.
Base pKa kH/kD
CH3COO- 4.8 1.01
HPO42-
7.2 1.65
NH3 9.6 1.84
CO32-
10.3 2.76
Table 1.2 Kinetic isotope effects for the base catalysed oxidation of diethyl H-phosphonate
by iodine21
.
The expected primary kinetic isotope effect for breaking the P-H bond in the rate-limiting step
is approximately 5.6 which may be obtained by having a base with a pKa equal or greater than
diethyl-H-phosphonate of 14.621, 22
. The presence of a significant kinetic isotope effect by the
different buffer bases indicates the rate-determining step is the removal of the P-H proton.

9
The mechanism associated with the observations must involve slow deprotonation of the P-H
bond to produce the phosphite, which would then produce D-phosphonate or phosphate di-
ester (Scheme 1.10)23
.
The rate law associated with the base catalysed deuterium exchange and oxidation is equal to
the rate of formation of the phosphite where the acid independent rate can be regarded as
negligible and therefore rate becomes:
Rate of formation of phosphite = k1 [H-phosphonate] [Base]
Equation 1.2
Westheimer observed that a small proportion of diethyl H-phosphonate existed as the tri-
coordinated phosphite in alkaline solutions (Scheme 1.10)22
.
P
O
RO
H
OR P
O
RO
D
OR
P
O
RO
O-
OR
Slowk1
k-1
k1 is the rate determining step
H-phosphonate
FastOxidation
D2O
Exchange
Fast
B-
P
RO O-
OR
Phosphite
BD+
Scheme 1.10 Mechanism of oxidation and P-H/D exchange of dialkyl H-phosphonate by
base23
.

10
1.1.5 pKa of phosphorus acids
Phosphorus compounds, containing P-OH groups, are capable of losing protons in an
aqueous environment. Many phosphorus derivatives used within living systems have at least
one pKa, the most common of which is phosphoric acid which has three dissociable protons
with pKa1 = 2.12, pKa2 = 7.21 and pKa3 = 12.3224
(Scheme 1.11). The two readily dissociable
protons of phosphorous acid have pKas of 1.07 and 6.5824
(Scheme 1.12). The pKa of the P-H
in H-phosphonate di-anion has been estimated to be approximately 3825
. Dependent on the
pH of the solution the fraction of the various species changes as shown by the speciation plots
for phosphoric acid and phosphorous acid (Figure 1.1 and Figure 1.2, respectively).
P
O
OH
OH
HO P
O
OH
OH
-O-H+ -H+
P
O
OH
O-
-O-H+
P
O
O-
O-
-O
pKa1 = 2.12 pKa2 = 7.21 pKa3 = 12.32
Scheme 1.11 Deprotonation of phosphoric acid.
-2 0 2 4 6 8 10 12 14
0.0
0.2
0.4
0.6
0.8
1.0
Fra
ctio
n o
f phosp
hori
c ac
id s
pec
ies
pH
P(V)
P(V)-
P(V)2-
P(V)3-
Figure 1.1 Speciation plot of the different anionic species (H3PO4 – PO43-
) of phosphoric acid
as a function of pH.

11
P
O
OH
H
HO P
O
OH
H
-O
-H+ -H+
P
O
O-
H
-O
pKa1
= 1.07 pKa2
= 6.58
-H+
P
O-
-O O
-
pKa3 = 38
Scheme 1.12 Deprotonation of phosphorous acid.
-2 0 2 4 6 8 10 12 14
0.0
0.2
0.4
0.6
0.8
1.0
Fra
ctio
n o
f phosp
horo
us
acid
spec
ies
pH
P(III)
P(III)-
P(III)2-
Figure 1.2 Speciation plot of the different species (H3PO3 – PO32-
) of phosphorous acid.
A summary of pKa values of some phosphoric and phosphorous compounds are shown in
Table 1.3.

12
Phosphates
Acid pKa1 pKa2 pKa3 pKa4
Phosphoric 2.12 7.21 12.32
Methyl phosphate 1.54 6.31
Ethyl phosphate 1.60 6.62
Pyrophosphoric 0.9 2.0 6.6 9.4
H-phosphonates
Phosphorous 1.07 6.58
Ethyl H-Phosphonate 0.81
Table 1.3 pKa summary of phosphates and H-phosphonates at 25oC
24.
1.1.6 Mechanism of hydrolysis of phosphate esters
Phosphate ester formation and/or cleavage of the P-O bond are of crucial importance
in biological systems, including phosphorylation, control of secondary messengers and
protein regulation26
. The rates of hydrolysis of phosphate esters are complicated by the
overall charge on the compound which may be for example, neutral, mono-anionic, di-anionic
etc27, 28
. Phosphate esters may be cleaved by one of three mechanisms which have been
extensively studied: associative, dissociative or concerted pathways.
1.1.6.1 Associative mechanism
The associative mechanism for the hydrolysis of phosphate esters involves an
addition-elimination designated AN + DN. The first step involves the nucleophile attacking the
phosphorus atom, to generate a penta-coordinate phosphorane intermediate, which expels the
leaving group in the second step (Scheme 1.13)29, 30
.
P
O
-O
O-
OR P
O-
Nu OR
-O O
-
Nu-
P
O
-O
O-
Nu + RO-
Phosphorane intermediate
Scheme 1.13 AN + DN mechanism which generates a penta-coordinate phosphorane
intermediate30
.

13
1.1.6.2 Dissociative mechanism
The dissociative mechanism (DN + AN) is similar to a SN1 mechanism where a planar
metaphosphate intermediate is formed (PO3-) in the rate-limiting step usually for the
hydrolysis of phosphate mono-esters30
. The highly reactive intermediate is attacked at either
side by the nucleophile to form the product (Scheme 1.14)26, 29, 30
.
P
O
-O
O-
OR P
O
O O
-
Metaphosphate intermediate
P
O
-O
O-
Nu + RO-Nu
-
Scheme 1.14 DN + AN mechanism which generates metaphosphate intermediate (PO3-)
30.
1.1.6.3 Concerted mechanism
The concerted mechanism (ANDN or SN2(P)) can be thought of as a combination of
the associative and dissociative mechanisms31
. The ANDN mechanism involves nucleophile
attack on the phosphorus centre and the leaving group departs in a single step without the
formation of an intermediate (Scheme 1.15)26, 29, 30
.
P
O
-O
O-
OR P
O-
Nu OR
-O O-
Nu-
P
O
-O
O-
Nu + RO-
Scheme 1.15 ANDN mechanism which is involves concerted bond formation/dissociation
30.
The three mechanisms can be illustrated by a More-O’Ferrell-Jencks scheme (Scheme 1.16).
The reactants are depicted in the lower left hand corner and the products in the upper right
hand corner29, 30
. The x-axis represents the extent of bond cleavage of the phosphorus leaving
group bond and the y-axis represents the extent of bond formation by the incoming
nucleophile.

14
P-OLg Bond Cleavage
P-N
uB
ond
Form
atio
n
P
O
-O OLg
O-
P
O
O O
-
Metaphosphate intermediate
+ LgO-
P
O-
-O
OLg
O-
Nu P
O
Nu O-
O-
+ LgO-
Phosphorane intermediate
+Nu-
+Nu-
P
O-
-O
OLg
O-
Nu
Conc
erte
d(A
ND N
)
Associative (AN + DN)
Dissociative (DN + AN)
Scheme 1.16 More-O’Ferrell-Jencks plot showing the three different mechanisms involved in
phosphate hydrolysis29, 30
.
1.1.7 The mechanisms of hydrolysis and reactivity of phosphate
esters
1.1.7.1 Mono-ester Hydrolysis
Phosphate esters are of considerable interest as they are of great biological
importance. Mono substituted phosphate esters are capable of losing two protons depending
on the dissociation constant and pH; hydrolysis could involve the undissociated acid, mono-
anion, di-anion or a mixture of species.
Generally phosphate mono-esters in strongly acidic media, one may expect the major reactive
species to be the neutral acid. An acid catalysed hydrolysis may also be observed by the
addition of a hydrogen-ion usually to the phosphoryl oxygen and may be more reactive than
the neutral acid. At high pH, where the dominant species may be the di-anion and hydroxide-
ion attack would be made less favourable due to electrostatic repulsion.

15
An example of a simple but well studied phosphate mono-ester is methyl phosphate.
Hydrolysis of methyl phosphate in acid is very slow - at pH 0 at 100oC it shows an observed
first-order rate constant (kobs) = 5.09 x 10⁻⁶
s-1
which increases as the acid concentration
increases suggesting an acid catalysed reaction of the neutral species27, 32
. Using isotopically
labelled water (18
O) in these acidic conditions shows both C-O and P-O bond fission occurs
most likely through an associative mechanism28
. If protonation of the methyl oxygen occurs
and precedes via carbon-oxygen fission the mechanism may be formulated as in Scheme 1.17.
P
O
OH
OHO+
Me
H
P
O
OH
OHHO
H2O
+ MeOH + H+
Scheme 1.17 Hydrolysis mechanism of methyl phosphate involving C-O bond cleavage to
produce phosphoric acid and methanol32
.
The reaction involving phosphorus-oxygen bond fission involves by nucleophilic attack on
the phosphorus atom (Scheme 1.18):
P
O
OH
OHO+
Me
H
P
O
HO OH
MeOH
H2O
OH2H3PO4 + MeOH
Scheme 1.18 Hydrolysis mechanism of methyl phosphate involving P-O bond cleavage to
produce phosphoric acid and methanol27, 32
.
Another mechanistic interpretation of the acid catalysed hydrolysis of mono-methyl
phosphate involves protonation of the phosphoryl oxygen shown in Scheme 1.19.
P
+OH
O OH
OH
Me
H2O
P
+OH
O OH
OH
Me
H2O
H3PO4 + MeOH + H+
Scheme 1.19 Acid catalysed hydrolysis of methyl phosphate which involves C-O and P-O
bond fission27
.

16
Increasing the pH changes the neutral methyl phosphate species to the mono-anionic species,
at pH 1.54 where 50% exists as the mono-anion, but at pH 4, methyl phosphate exists wholly
as the mono-anion32
. The rate of hydrolysis of the mono-anion is unexpectedly fast and one
may expect the undissociated acid to be the most reactive species (neutral, mono-anion, di-
anion) in solution as additional negative charges would inhibit nucleophilic attack by water.
A rate maximum is observed at pH 4.17 at 100oC for methyl phosphate mono-anion
32 (Figure
1.3) and of other simple mono-esters33
. If the hydroxyl group transfers a proton to the leaving
alkoxy group via a metaphosphate intermediate, an alcohol would be formed and dissociation
would be a more favourable process than addition-elimination, associative mechanism27
.
Isotopically labelled 18
O showed that hydrolysis proceeds via P-O bond fission32
. A Brønsted
plot of log k for the mono-anion against pKa for different leaving groups can indicate the
charge distribution in the transition state. A plot for aryl and alkyl phosphates showed a
linear response with a slope of -0.3 indicating little negative charge on the alkoxy or aryloxy
group in the transition state. If there was a large amount of negative charge on the R-O
residue in the transition state a greater slope would be observed and the rate of hydrolysis of
the phosphate mono-anion would show a large dependence on the substituent27
.
0 2 4 6 8
0
5
10
15
20
k 0 x
10
6 (
s-1)
pHlog CH+
Figure 1.3 pH-rate profile of the hydrolysis of methyl phosphate at 100oC
27.

17
Two mechanisms have been proposed to account for the hydrolysis of the phosphate ester
mono-anion. The proton may be directly transferred (Scheme 1.20) or by way of a six
membered cyclic transition state, involving water (Scheme 1.21)30, 32
.
P
-O
O O
O
Me
HP
O O
O-
MeOH+H2O
H2PO4-
Scheme 1.20 Hydrolysis of methyl phosphate anion which involves proton transfer to
generate the metaphosphate intermediate and methanol.
P
-O
O O
O
Me
H
P
O O
O-
H
O HMeOH+
H2OH2PO4
-
Scheme 1.21 Hydrolysis of methyl phosphate anion which involves a water molecule to
generate the metaphosphate intermediate and methanol30, 32
.
As mentioned above the most reactive species of alkyl (CH3 etc) and aryl (phenyl and p-nitro
phenyl)34
phosphates after the acid catalysed neutral species is the mono-anion which shows a
rate maximum at pH 4 (Figure 1.3) and requires proton transfer to the leaving group and is
essential for the reaction via a dissociative mechanism35
.
Methyl phosphate di-anion is only slowly hydrolysed at high pH, but if the leaving group
contains a strongly electron withdrawing substituent, as in some acyl or nitrophenyl
phosphates, the di-anion also be reactive and may be even more reactive than the mono-anion.
Hydrolysis of the mono-anion of 2,4-dinitrophenyl phosphate is approximately 30 times
slower than the di-anion at 25oC
35. The phosphate ester di-anion is faster than the mono-anion
when the pKa of the conjugate acid of the leaving group phenol is less than 5; the hydrolysis
of 2-chloro-4-nitrophenyl phosphate is almost pH independent (pKa of phenol = 5.45) as both
the mono- and di-anions hydrolyse at the same rate33
.
This high reactivity can be accounted by a dissociative mechanism giving a metaphosphate
intermediate (Scheme 1.22) as the rate of hydrolysis of a series of mono-ester di-anions is
very sensitive to the pKa of the leaving group (Brønsted βlg = -1.23)33
.

18
P
-O
-O
O
OAr
P
O O
O
ArO-
+H2O
H2PO4-
Scheme 1.22 Hydrolysis of an aryl phosphate ester di-anion to form a metaphosphate
intermediate33
.
1.1.7.2 Di-ester hydrolysis
Phosphate di-esters are generally very stable towards hydrolysis. The hydrolysis of
di-methyl phosphate as a function of pH is significantly different to that of mono-methyl
phosphate. Mono-methyl phosphate shows a hydrolysis rate maximum at pH 4.17 where the
major reactive species is the mono-anion but the reactivity of the di-methyl mono-anion is
low at pH’s where the mono-anion concentration also dominates. Decreasing the pH converts
the mono-anionic species to the neutral species and in solutions which are not more acidic
than pH 0 the only substrate involved in hydrolysis is the neutral species. Hydrolysis using
isotopically labelled water (18
O) at pH 1.24 where the major reactive species is the neutral
dimethyl phosphate as the substrate, the reaction proceeds mainly through C-O bond fission
(78%) and a small amount via P-O bond fission in a concerted mechanism. Both processes
are shown in Scheme 1.23.
P
O
O OMe
OH
Me
H2O
P
O
HO OMe
OH
+ MeOH P
O
O OMe
OH
Me
H2O
Scheme 1.23 Hydrolysis of undissociated di-methyl phosphate at low pH which involves C-O
and P-O bond fission to form methyl phosphate and methanol36
.
The rate of hydrolysis of di-benzyl phosphate was investigated by Westheimer in 1954 who
found that the di-ester anion at 75.6oC and an ionic strength of 1.0 M has a very slow
hydrolysis rate constant = 4.17 x 10⁻⁸
s-1
and the neutral species = 3.17 x 10⁻⁵
s-1
37
.
The acid catalysed hydrolysis of di-methyl phosphate may involve protonation on either the
phosphoryl oxygen or the methoxy oxygen with both C-O and P-O bond cleavage occurring
by nucleophilic attack by a water molecule on the carbon or phosphorus atom of the conjugate
acid36
(Scheme 1.24).

19
P
OH+
O OMe
OH
Me
H2O
P
O
HO OMe
OH
+ MeOH P
O
MeO O+
OHH2O
Me
H+ H+
Scheme 1.24 Acid catalysed hydrolysis of di-methyl phosphate which involves C-O and P-O
bond fission to form methyl phosphate and methanol36
.
Dialkyl phosphates are not readily hydrolysed under basic conditions. Westheimer et al.
investigated the hydrolysis of di-methyl phosphate in strongly basic conditions at high
temperature. The major mechanism of base-catalysed hydrolysis involved C-O bond fission
compared to P-O bond fission as shown by using isotopically labelled solvent38
(Scheme
1.25).
P
O
-O
OMe
OMe P
O
-O
OMe
O-
P
O
-O
OMe
O
HO-
Me
HO-
+ MeOH
Scheme 1.25 Hydroxide-ion catalysed hydrolysis of di-methyl phosphate which involves both
C-O and P-O bond cleavage38
.
Kirby in 1970 investigated the hydrolysis of a series of diaryl phosphate anions; for example
diphenyl phosphate at 100oC at pH 10 remained unchanged after 5 hours and the half-life of
bis-p-nitrophenyl phosphate at pH 3-4 and at 100oC is unchanged after more than 4 months.
The hydrolysis of bis-2,4-dinitrophenyl phosphate, bis-4-nitrophenyl phosphate and bis-3-
nitrophenyl phosphate was investigated over a wide pH range and it was found that between
pH 2 and 6 the rate of hydrolysis of 2,4-dinitrophenyl phosphate is pH independent and at low
and high pH there is an acid and base catalysed reaction of all three compounds39
.
A free-energy relationship plot between the first-order rate constants for a series of diaryl
phosphate anions at 100oC and at 1.0 M ionic strength against the pKa of the leaving group
conjugate acid gives a slope of -0.97 which suggests that the leaving group carries significant
negative charge in the transition state compatible with almost complete P-O bond fission from
the pentacovalent intermediate39
(Scheme 1.26).

20
P
O
-O
OAr
OAr
P
O
-O
OH
OAr+-OAr
H2O
P
OAr
H2O+
OAr
-O O
-
P
OAr
HO OAr
HO O-
P
OAr
HO OAr
HO O-
Scheme 1.26 The proposed mechanism of hydrolysis of di-aryl phosphate mono-anion39
.
Phosphate triesters are not naturally occurring substances and therefore not discussed in detail
although, they are usually manufactured, for use as insecticides and were used as neurotoxins
in World War II40
.
1.1.8 Hydrolysis of the P-O-P bond
Phosphate esters and condensed phosphates (phosphate anhydrides) which contain a
P-O-P bond are also subject to hydrolysis. The pH of the solution greatly influences the
hydrolytic rate of simple condensed phosphates such as pyrophosphate to give the
corresponding phosphate.
The stability of the P-O-P bond of condensed phosphates at neutral pH and at room
temperature is in the order of magnitude of years41
. At higher temperatures e.g. 100oC
pyrophosphate hydrolyses in water to give two mole equivalents of phosphoric acid (Scheme
1.27) is near completion within a few hours42
.
Many hydrolytic studies of pyrophosphate have been carried out but traditional analytical
methods such as phosphate identification using molybdenum blue are not adequate to measure
the stability and hydrolysis of pyrophosphate and polyphosphates 42-45
.
H4P2O7 H2O+ 2 H3PO4
Scheme 1.27 Hydrolysis of pyrophosphate which produces two moles of phosphoric acid.

21
Pyrophosphoric acid has four dissociable protons and the anionic state is sensitive to pH. In
highly acidic (1-2 M HCl) conditions the majority of pyrophosphate exits as the undissociated
form (H4P2O7) but increasing the pH changes the species through four anionic states from
H4P2O7 to P2O74-
and in alkaline solutions pyrophosphate tetra-anion is very stable due to
electrostatic repulsion of the hydroxide-ion.
Unsymmetrical pyrophosphate di-esters are difficult to isolate probably because they are very
unstable and hydrolyse rapidly in water. The hydrolysis of P1,P1-diethyl pyrophosphate is pH
dependent and above pH 6 diethyl pyrophosphate exists as the di-anion (Scheme 1.28, ii) and
hydrolyses rapidly with a first-order rate constant = 1.15 x 10⁻³
s-1
,whereas the mono-anion
below pH 6 hydrolyses (Scheme 1.28, i) more slowly with a first-order rate constant = 3.0 x
10-5
s-1 46
. The mechanism of hydrolysis resembles that of phosphate mono-esters where a
metaphosphate intermediate is formed which is shown in Scheme 1.28.
P
O
RO
OR
O P
O
OH
O-
P
OH+
RO
OR
O P
O
O-
O- Fast
P
O
RO
OR
OH + P
O
O O-
FastHO P
O
OH
O-
P
O
RO
OR
O P
O
O-
O- Slow
P
O
RO
OR
O-
+ P
O
O O-
FastHO P
O
OH
O-
i
iiH2O
H2O
Scheme 1.28 Hydrolysis of an unsymmetrical pyrophosphate (P1,P1-diethyl pyrophosphate)
mono-anion and di-anion via a metaphosphate intermediate46
.
It is interesting to note that the di-anion hydrolyses faster than the mono-anion, which is the
opposite of what is observed for alkyl phosphates and pyrophosphate mono-esters. This rate
reversal is dependent on the pKa of the leaving group and a strong acid such as di-ethyl
phosphate is a good leaving group46
.

22
1.1.9 Metal coordinated hydrolysis
Phosphates undergo a variety of reactions associated with proteins and metals.
Metal-ions are assumed to increase hydrolysis by neutralising charge on the substrate,
transition state or both47
. Divalent metal-ions catalyse the hydrolysis of acyl phosphates,
Briggs, Satchell and White studied the hydrolysis of acetyl phosphate catalysed by four
divalent metal-ions Mg2+
, Ca2+
, Sr2+
and Ba2+
which had some catalytic effect on the rates of
hydrolysis at pH 8.45, I = 0.6 M at 25oC
48. The rate of hydrolysis at the same pH, ionic
strength and temperature without the divalent metal (k0) was 1.1 x 10⁻⁵
s-1
but the addition of
Mg2+
, Ca2+
, Sr2+
and Ba2+
provided second-order rate constants (kmetal2+
) = 9.6 x 10⁻⁴
, 7.3 x 10-
4, 2.4 x 10
-4 and 7.0 x 10
-5 M
-1 s
-1 respectively
48 and the intercepts show background
hydrolysis without metal ions (Figure 1.4).
Figure 1.4 Plot of kobs against metal concentration for Mg2+
, Ca2+
, Sr2+
and Br2+
, the solid line
represent a linear fit to the data providing a second-order rate constant48
.
The pH independent hydrolysis of acetyl phosphate without metal-ions above pH 6 where the
di-anion dominates involves P-O bond cleavage (via a dissociative mechanism) but at higher
pH involves C-O bond fission as the hydroxide-ion preferentially attacks the carbonyl atom.
In the presence of metal-ions such as Mg2+
the hydrolysis of acetyl phosphate is much more

23
sensitive to pH and attack of water (Scheme 1.29, i) and hydroxide-ion (Scheme 1.29, ii)
occurring via the cleavage of the C-O bond to form acetate and phosphate ions.
The metal-ion coordinates to the phosphate oxygens presumably convert it into a better
leaving group48
.
C
O
Me
O
P
O
O-
O-
H2O, M2+
C
O
Me
O
P
O
O-
O-
O
HH
M2+
C
O
Me OH+ P
O
OH
O--
O i
C
O
Me
O
P
O
O-
O-
OH-, M2+
C
O
Me
O
P
O
O-
O-
O-
H
M2+
C
O
Me O- + P
O
OH
O--
O ii
Scheme 1.29 Spontaneous hydrolysis of acetyl phosphate (i) and hydrolysis involving
hydroxide-ion (ii) both aided by a metal di-cation48
.
Another example of metal-ions promoting hydrolysis of phosphates is when phosphate esters
(Scheme 1.30) which are bound to di-nuclear metal complexes such as Co(III) which may be
similar in structure to some enzyme catalytic sites49, 50
.
Co3+
O-
N
N
NOH-
H-
O
Co3+
O-
N
N
N
P
O O
P
O
P
O Ad
O O- O O-
Scheme 1.30 A cobalt bi-nuclear complex providing charge neutralisation of the phosphate
oxygens and an internal nucleophile50
.
In aqueous solution, hydrolysis occurs by cleaving the P-O bond forming ADP and a
phosphate bridging the two Co(III) centres50
. A specific base catalysed reaction was observed
in basic solution with a second-order rate constant = 0.027 M-1
s-1
at 25oC and at 1.0 M ionic

24
strength (KCl). Using 31
P NMR, a solution of the phosphate bound complex (Scheme 1.30) at
pH 8 and at ambient temperature remained unchanged for a month50
.
Between pH 8.1 and 10 and maintaining the ionic strength at 1.0 M, magnesium complexes to
the ATP moiety (Scheme 1.31) which increases the hydroxide catalysed hydrolysis giving a
second-order rate constant = 80 M-1
s-1
which is 3 x 10³ times faster than the magnesium
uncomplexed hydrolysis.50
Co3+
O-
N
N
NOH-
H-
O
Co3+
O-
N
N
N
P
O O
P O
PO Ad
O
O-
O
O-Mg2+
OH2
H2O
H2O
Scheme 1.31 The binuclear complex of ATP coordinated to a magnesium-ion which
promotes hydrolysis via an associative mechanism50
.
The mechanism for biological phosphoryl transfer involving metal-ion cofactors are usually
based on the metal-ions being able to stabilise the transition state. However ATP hydrolysis
involves a dissociative mechanism where the bond to the ADP leaving group is broken before
the attacking water molecule and interaction of the magnesium would have a larger catalytic
effect if it interacted with the leaving group of the α and β phosphates and not the β and γ
phosphates as observed (although in Scheme 1.31 it is shown that the magnesium-ion is
interacting with the α-phosphate too)50
.
The coordination of magnesium to ATP does not affect the mechanism of hydrolysis as a βlg
of -1.1 indicates a large negative charge has developed in the transition state and therefore the
P-O bond is largely broken. It was initially proposed that the coordination of magnesium may
change the hydrolysis mechanism from dissociative to associative51
.

25
There have been several proposals to explain the role of metal-ions in aiding hydrolysis:
The first emphasises the formation of a cyclic intermediate by the metal-ion and the
phosphate di-anion which presumably neutralises some of the negative charge which may
facilitate nucleophilic attack on phosphorus52
(Scheme 1.32).
P
O
O-
ORO-
M2+
Scheme 1.32 Metal-ion coordinating to a phosphate mono-ester di-anion which may aid
hydrolysis by ring strain or charge neutralisation.
The second is making phosphate a better leaving group52
(Scheme 1.33).
P
O
O P
O
O
O-
O
O-
P
O
RO
OR
M2+
Nu-
Scheme 1.33 Metal-ion neutralising negative charges on phosphate which makes it a better
leaving group.
1.1.10 Enzymatic Hydrolysis of phosphate esters
Phosphate esters have a variety of biological uses. Phosphate mono-esters can occur
as alkyl phosphates and sugar phosphates whereas phosphate di-esters occur in the backbone
of DNA and RNA and form phospholipid membranes of cells.
Phosphoryl transfer is of great importance in biochemistry and allows many reactions which
are too slow or thermodynamically unfavourable to occur. These reactions are needed for
energy balance and cellular control.
Many reactions involve cleavage of phosphoric mono-esters/anhydrides which give rise to
large free chemical energy driving a reaction to completion.

26
Enzymatic cleavage of phosphate esters is carried out by a family of phosphatases which have
been classified by William P Taylor and Theodore S Widlanski53
. There are three major
groups (Figure 1.5) of phosphatases which are based on substrate preference. The first class
comprises of non-specific substrates which are subdivided dependent on pH, i.e. the most
suitable/optimum operating conditions such as alkaline and acid phosphatases. The second
class known as phosphoprotein phosphatases cleave phosphorylated proteins, this group
includes phosphoserine, phosphoserine/threonine phosphatases, phosphotyrosine
phosphatases and duel specificity phosphatases.
The final class includes enzymes which hydrolyse specific substrates or structurally similar
substrates such as glucose-6-phosphate53, 54
.
Figure 1.5 The three groups of phosphatases dependent on substrate specificity.
1.1.10.1 Non-specific phosphatase – Alkaline phosphatase
E.coli phosphatase is the most studied alkaline phosphatase and preferentially
catalyses phosphate mono-esters although some members of the alkaline phosphatase
superfamily hydrolyse phosphate di-esters55, 56
. Previous studies have shown that at low pH
the enzyme dissociates into subunits followed by conformational change which can be
reverted dependent on pH, temperature and metal concentration57, 58
. The active site of E.coli
alkaline phosphatase contains two Zn2+
ions and an Mg2+
ion which are required for enzyme
activity with normal pH operating conditions around pH 855
. The active site transition state
for the hydrolysis of a phosphate monoester is shown in Scheme 1.34, where the charge is
stabilised by the metal-ions.
Non specific Phosphoprotein Small molecule
specific
Alkaline Acid Phospho
Tyr
Duel
Specific
Phospho
Ser/Thr
Typical substrates:
Glucose-6-phosphate
Fructose-1,6-
bisphosphate
Inositol phosphate

27
O-
O-
Asp51
O-
O-
Asp369
N
NH
His370
-O O-
Asp327
N NH
His412
N
NH
His331
Zn2+ Zn2+
P
O-
O- O-
ORO-
N H
Ser102
Mg2+
Arg166
N NH
H
H H
O
HH
Scheme 1.34 E.coli Pase active site transition state when catalysing the hydrolysis of
phosphate mono-esters56
.
1.1.10.2 Alkaline pyrophosphatase
Yeast pyrophosphatase from Saccharomyces cerevisiae and pyrophosphatase from
Escherichia coli belong to the family of alkaline phosphatases which require three or four
metal-ions to catalyse the non-specific hydrolysis of phosphate mono-esters.
Alkaline pyrophosphatases catalyses the hydrolysis of pyrophosphate tetra-anion to two
equivalents of phosphate generally in the pH region of 6-1059
(Scheme 1.35).
P
O
O P
O
O-
O-
O-
-O
H2OP
O
OH
O-
-O2
Scheme 1.35 Pyrophosphate terta-anion hydrolysing to two equivalents of phosphoric acid.
E.coli PPase is the most studied pyrophosphatase (PPase) and is similar to yeast PPase both
essentially are near perfect catalysts, with a kcat/Km = 3 x 10⁷ M
-1 s
-1 60. The active site
contains four magnesium-ions termed Mg1-Mg4 which are required for catalytic hydrolysis
of pyrophosphate. Two magnesium-ions fill site Mg1 and Mg2, of higher and lower affinity
respectively, before the substrate complexes and Mg3 and Mg4 sites are filled in the enzyme
substrate complex61, 62
. There are 13 polar residues within the active site which interact
directly or via a water molecule with the four magnesium-ions and two of the phosphorus
oxygen atoms of pyrophosphate63
.

28
The major coordination residues are Mg1 and Mg2 bridged by a water molecule (Figure 1.6,
magenta), Asp70 and pyrophosphate while Mg3 is coordinated to pyrophosphatase Asp97 and
Asp120 and Mg4 is coordinated Glu31 as well as the pyrophosphate moiety. In addition to the
amino acid residues which coordinate the magnesium-ions, 9 water residues also coordinate
to complete the octahedral coordination of the magnesium-ions. Also Lys29, Lys142 and Arg43
are coordinated to the substrate via electrostatic interaction and an important amino acid
residue Asp67 acts as a general base to deprotonate the bridging water molecule which would
predominantly act as a nucleophile64, 65
(Scheme 1.36).
Figure 1.6 X-ray crystal structure of the active site of E.coli PPase with the bridging water
molecule shown in magenta64
.
P
O-
O-
O
O
P
O-
O-
O
Mg32+
Mg22+
Mg42+
O
Asp67
-O
O
Mg12+
H
H
Scheme 1.36 Possible mechanism of pyrophosphate hydrolysis by E.coli PPase initially
involving deprotonation of water by a general base64
.

29
1.1.10.3 Acid phosphatases
Acid phosphatases are enzymes which hydrolase small phosphate monoesters under
acidic conditions66
. Purple acid phosphatases are an example which fit into this category
although they may overlap into others and are able to catalyse the hydrolysis of phosphoric
esters and anhydrides such as ATP in the pH region of 4 to 7. Purple acid phosphatases
usually contain two metal-ions one of which is Fe(III) and the second could be Zn(II), Mn(II)
or even another iron-ion67
.
N
HN
His232 Zn2+
HN
NHis268
Asp164O
OAsp
135
O
O
Fe N NH
His325
-OH O
O
P
O
ORONH2
Asn201 O
Tyr167
N
HN
His232 Zn2+
HN
NHis268
Asp164O
OAsp135
O
O
Fe N NH
His325
O O
O
P
O
ONH2
Asn201 O
Tyr167
-ROH
N
HN
His232 Zn2+
HN
NHis268
Asp164O
OAsp
135
O
O
Fe N NH
His325
O
O
P
O
ONH2
Asn201 O
Tyr167O
-H2O
N
HN
His232 Zn2+
HN
NHis268
Asp164O
OAsp135
O
O
Fe N NH
His325
O
-O P
O
O
NH2
Asn201 O
Tyr167
O-
H2O
OH-
Scheme 1.37 Proposed mechanism of purple acid phosphatases (PAP), where a hydroxide-ion
bridging the two metal-ions attacks the phosphorus centre or a non-coordinated hydroxide-ion
attacks initially then the phosphate is release on exchange with two water molecules which
also reform the bridging hydroxide-ion68
.

30
1.1.10.4 Phosphoprotein phosphatases
Protein phosphatases are represented by three distinct gene families. Two of these
families, phosphoprotein phosphatase P (PPP) and phosphoprotein phosphatase M (PPM)
dephosphorylate phosphoserine and phosphothreonine residues, whilst protein tyrosine
phosphatases (PTP) dephosphorylate phosphotyrosine residues. The largest family which
dephosphorylate serine/threonine amino acid residues are metallo enzymes and hydrolysis
uses a metal activated nucleophilic water molecule69
.
The major protein serine/threonine phosphatase activity in vivo is accounted for by PP1,
PP2A and PP2B which are part of the PPP family together with PP2C of the PPM family.
The three members of the PPP family share a common catalytic domain of 280 amino acid
residues and therefore highly conserved70
. The catalytic subunit of PP1 (Figure 1.7) adopts an
α/β fold with a β sandwich wedged between two α domains71
. Conserved amino acid residues
(three histidines, two aspartic acids and an asparagine) coordinate two metal-ions. The two
metal-ions Fe2+
(or Fe3+
) and Mn2+
are present in protein which has been expressed in E.coli
but other metal-ions such as two Mn2+
ions can occupy both sites71
.
One water molecule is bridged by the two metal-ions which contribute to the octahedral
hexacoordinate geometry. The mechanism of phosphate ester hydrolysis involves direct
nucleophilic attack on the phosphorus atom by metal-bound hydroxide-ion and the leaving
group is protonated by the imidazolium side chain of His12572
(Figure 1.7).
Figure 1.7 Active site of E.coli PP1phosphatase72
.

31
1.1.10.5 Substrate specific/similar phosphatases
One of the most important enzymes in metabolism is glucose-6-phosphatase (G-6-
Pase), which is mainly found in the kidneys and liver. Excess glucose is stored as glycogen.
Gluconeogenesis and glycogenolysis produce glucose-6-phosphate which can be released into
the bloodstream once the phosphate group has been cleaved by glucose-6-phosphatase thus
playing a major role in blood glucose homoeostasis73
. The active site of G-6-Pase is on the
lumen side of the endoplasmic reticulum and is highly conserved in mammalian cells74
. It
contains many histidine residues, His9, His52, His179, His197, His252, His307 and His35375
. It was
discovered, by point mutations at those positions, that the majority of the histidine residues do
not play an essential role in the hydrolysis of glucose-6-phosphate but altering His179
abolished enzyme activity. Other key residues within the active site including G-6-Pase
Lys76, Arg83, Arg170 and His119 take part in catalysis and point mutation of these residues also
abolishes enzyme activity76
.
The mechanism of action on G-6-P (Scheme 1.38) is initiated by His176 providing nucleophilic
attack on the phosphorus centre forming a phospho-histidine enzyme intermediate. His119H+
acts as a general acid enabling the cleavage of the P-O bond to produce free glucose. Water
then attacks the phospho-intermediate which is stabilised by hydrogen bonding to Arg83 and
Arg170, proton transfer via His119 dissociates the phosphate leaving group from the active
site75
.
Scheme 1.38 Mechanism of Glucose-6-Phosphate hydrolysis by glucose-6-phosphatase75
.

32
1.1.11 Heats of hydrolysis of phosphates
Most chemical or biological reactions are associated with a physical change,
generally heat is either taken in from the surroundings or released. The enthalpy change
accompanying these reactions is usually measured at 1 bar (1.00 x 10⁵ Pa) and at a specified
temperature of 298.15 K. The change in enthalpy (ΔH) can either be exothermic, where heat
is given out during the reaction and defined by a negative ΔH or a positive ΔH which
corresponds to heat being absorbed from the surroundings and referred to as endothermic.
Nature has adopted a way to harness chemical energy by splitting or hydrolysing high energy
compounds to provide energy for biological work. The enzymatic cleavages of P-O bonds
within phosphate anhydrides are very exothermic under physiological conditions. Examples
of high energy phosphate esters are creatine phosphate, phosphoenolpyruvate and 1,3-
bisphosphoglycerate (Scheme 1.39) but the most common biological energy currency is
ATP77
(Scheme 1.3).
N
O
HO
NH
HN P
O
OH
OH
O
OH
OP
O
HO
OH O
O P
O
OH
OH
HO
OPHO
OH
O
i ii iii
Scheme 1.39 Creatine phosphate (i), phosphoenolpyruvate (ii) and 1,3-bisphosphoglycerate
(iii) with the bond which is cleaved in red77
.
ATP and the compounds shown in Scheme 1.39 commonly take part in phosphorylation
reactions which drive reactions forward which would be otherwise energetically
unfavourable. Typically the free energy change ΔGo is an indication to whether a reaction
would be spontaneous as indicated by a negative ΔGo or unfavourable by a positive ΔG
o. The
standard Gibbs free energies of hydrolysis of ATP, ADP, AMP and pyrophosphate are given
in Table 1.4:
Reaction ΔGo
hydrolysis (kJ mol-1
)
-32
-45
-13
-29
Table 1.4 Gibbs free energies of hydrolysis for phosphate anhydrides4.

33
Although the heats of hydrolysis gives no direct indication of the corresponding free energy
change, they may provide some indication to whether it could be used as a phosphorylating
agent. In approximately 12 M sulphuric acid the heat of hydrolysis of the neutral
pyrophosphate is -17.8 kJ mol-1
whilst at neutral pH (pH 7.2, catalysed by pyrophosphatase
from baker’s yeast at 29oC) the heat of hydrolysis of sodium pyrophosphate is -37.4 kJ mol
-1
which is more than double then that of the neutral species78, 79
. Ging and obtained a heat of
hydrolysis (pH 7.2, 0.1 M ionic strength at 25oC) of -30.6 kJ mol
-1 for pyrophosphate whilst in
phosphate buffer at pH 7.3 ΔH = -24.3 kJ mol-1
78
.
An inevitable problem associated with the evolution of the heat of hydrolysis of
pyrophosphate is the ionisation states of the reactants and the products, which obviously vary
with pH.
An example of P-O bond cleavage which produces a large exothermic heat upon hydrolysis is
p-nitrophenyl phosphate (pNPP). Dephosphorylation of p-nitrophenyl phosphate at pH 9.6
and at 29oC produced a ΔH = -19.0 kJ mol
-1 79
. A few years later Sturtevant investigated the
enthalpy of hydrolysis of pNPP and found it to be -26.3 kJ mol-1
over a pH range of 3.6-5.8
using acetate buffers at 25oC
80.
Another example where P-O bond cleavage is of great importance is in the hydrolysis of
creatine phosphate which is a key step in muscle contraction. The hydrolysis of creatine
phosphate (PCr) occurs in muscle cells and can be represented by Scheme 1.40:
PCr2- Cr + HPO42-
H2O
Scheme 1.40 Creatine phosphate hydrolysing to creatine and phosphoric acid81
.
The hydrolysis of creatine phosphate is catalysed by acid or by alkaline phosphatase and the
enthalpy of hydrolysis at 37oC is -41.0 kJ mol
-1 and -43.2 kJ mol
-1 respectively
81. In vivo the
reaction is accompanied by proton transfer and release/binding of Mg2+
from PCr to
phosphate and the heat accompanying these factors at pH 7, 1 x 10⁻³
M magnesium is -35 kJ
mol-1
which is slightly lower than other values of -38 kJ mol-1
and -40 kJ mol-1
obtained by
Woledge and Carlson and Siger respectively82, 83
.

34
1.1.12 Aim
The aims of this project involve the investigation and comparison of physical and
thermodynamic properties of phosphorous(III) and phosphoric(V) acid derivatives.
Phosphoric compounds are widely used in chemistry and biochemistry, and phosphoric
anhydrides are widely hydrolysed in many biochemical processes. In particular, this work
investigates the acidities of dissociable hydrogens in phosphorous(III) and phosphoric(V)
compounds and their relative hydrolytic reactivities which are very dependent on the ionic
species present in solution. Another aspect of this work involves metal coordination and
enzymatic hydrolysis of phosphorus (III and V) derivatives. As phosphorus anhydrides are
well known high energy currency compounds, the heats of hydrolysis of P(III) and P(V) were
also studied.

35
1.2 Experimental
1.2.1 Materials
Pyro-di-H-phosphonate (PP(III)) - samples of PP(III) were initially and kindly
provided by T. Kee (University of Leeds) and prepared by dissolving phosphorous acid (16.4
g) and sodium hydroxide (8.0 g) in 100 ml water. The water was removed under reduced
pressure. The resulting mixture was heated in a tube furnace with N2 flowing through at
200°C for three days, the analytical details are discussed in the results and discussion (section
1.3). Diethyl pyro-di-H-phosphonate and H-phosphonate monoethyl esters were prepared as
previously described and were analytically pure17
. H-phosphonate di-ethyl ester (>99%), E.
coli pyrophosphatase (lyophilized powder ≥90%, ≥800 units per mg protein) and tetra sodium
pyrophosphate decahydrate were purchased from Sigma.
1.2.2 Kinetics/pKa
Ionic strength of solutions were maintained using KCl. Reactions monitored by
31P{H} NMR at 25°C used a 500 MHz Bruker Avance I, and a D2O insert was used for a lock
signal and diphenylphosphate as an internal standard.
Where auto-titration was used to follow reactions these were carried out using a Metrohm 859
instrument. Auto-titration: a jacketed titration vessel aspirated with N2 was used to maintain a
constant temperature. The vessel was charged with 50 ml HCl or NaOH at I = 1.0 M and
titrated with an appropriate solution to maintain the pH. The titration was initiated by addition
of 1.0 mmole PP(III) to the vessel.
Effect of Mg2+
on the hydrolysis of PP(III): samples were run in 0.8 M MOPS buffer at pH 7
and 1.0 M ionic strength containing 10% D2O for a D2O lock and 20 mM diphenylphosphate
as an internal standard. Magnesium concentrations were varied by the addition of 0.001 M,
0.005 M and 0.01 M magnesium chloride (MgCl2), to 37.6 mM PP(III).
E.coli Pyrophosphatase (PPase) catalysed reactions were followed using VP-ITC: the enzyme
(1 × 10⁻⁹
M) was prepared in 20 mM HEPES buffer pH 8.40 or 20 mM MOPS buffer at pH
7.55, with 3 mM magnesium chloride. 10 mM PP(V) in the same buffer, excluding PPase and
magnesium chloride was used to initiate the reaction to give a final concentration of 0.0411
mM or 0.0211 mM, I = 0.1 M at 25°C. Both solutions were degassed for 15 minutes to
prevent bubble formation during the experiment. The same experiment was repeated but with
the addition of 1 mM PP(III) as a potential inhibitor.

36
Using the ITC data, the total heat generated by the reaction can be given be Equation 1.3
where Q is heat and t is time.
∫
Equation 1.3
The velocity (dP/dt) can be given by Equation 1.4.
(
[ ( )]
∫
)
Equation 1.4
dQ/dt (which is power) represents the difference between the baseline and the heat released at
any time, t, so the concentration of PP(V) at any time, t, ([PP(V)]t) can be represented by
multiplying [PP(V)]i by the integrated area for a specific injection at time, t, which is divided
by the total integral of the well, Equation 1.5 which was used to obtain a plot of [PP(V)]
against time84, 85
.
[ ( )] [ ( )] ( ∫
∫
)
Equation 1.5
The pKa of PP(III) and ethyl-H-phosphonate was monitored by 31
P{H} NMR which contained
an insert of diphenylphosphate in MOPS buffer, pH 7, I = 1.0 M as an external standard.
PP(III) was analysed at 1.0 M ionic strength at a given pH with concentrations of PP(III) in
solution ranging from 2.63 mM – 12.78 mM and ethyl H-phosphonate from 2.90 – 10.50 mM
below pH 3. The pH of each solution was taken before the addition of PP(III) or ethyl-H-
phosphonate and after to ensure the pH had not changed during analysis.

37
1.2.2.1 Enzyme kinetics
Michaelis-Menten kinetic constants kcat, Km and kcat/Km were obtained by Equation
1.6 and its derivations.
E + S ES E + Pk1 kcat
k -1
Km
k2
[ ][ ]
[ ]
Equation 1.6
Below saturation, when [S] << Km the curve was fitted to a simple first-order rate law to
obtain the pseudo first-order rate constants kobs, which were independent of substrate
concentration and first-order in enzyme concentration. Above saturation, when [S] >> Km the
profile was fit to a zero-order rate law to provide Vmax for the reaction, (= kcat[E]).
The catalytic efficiency of the enzyme kcat/Km was obtained by dividing kobs by the initial
enzyme concentration; kcat was obtained by dividing Vmax by the initial enzyme concentration.
1.2.3 Metal-ion complexing
General - metal-ion complexing studies using ITC were performed on a VP-ITC
Microcal instrument at 25oC using a cell volume of 1.8 ml (V0 = active volume 1.4194 ml)
and solutions were degassed to prevent bubble formation for 15 minutes. The reference cell
was filled with ultra-pure water (18.2 MΩ.cm at 25oC) throughout all experiments.
PP(V):
Magnesium complexing to pyrophosphate was conducted by adding different equivalents of
magnesium-ion to a 10 mM solution (1.0 x 10⁻⁴
moles in 10 ml water) of sodium
pyrophosphate decahydrate. Magnesium equivalents of 0, 0.5, 1 and 2 were added to the 10
ml pyrophosphate solution which all contained diphenyl phosphate as an internal standard and
the pH was monitored by adding HCl or NaOH accordingly. 10.12 mg of MgCl2.6H2O was
added for 0.5 equivalent of Mg2+
then an additional 10.16 mg of Mg2+
was added to give
1equivalent of metal-ion and 2 equivalents by an additional of 20.71 mg of Mg2+
. The
complexing at each equivalent was monitored using 31
P {H} NMR at 25oC.

38
Residual metals within the buffer solutions were removed using Chelex 100. Isotherms using
ITC were obtained by the titration of 21.0 mM magnesium (syringe, 10 µl injections) into
0.56 mM PP(V) (cell). Both solutions within the syringe and cell were at pH 8.40 buffered by
25 mM HEPES and at I = 0.1 M.
The instrument parameters for the ITC experiments were:
Number of injections: 29, reference power: 10 µcal/sec, initial delay: 300 sec, stirring speed:
307 rpm,volume of injectant: 10 µl, duration: 20 sec, spacing: 180 sec, filter period: 2 sec.
PP(III):
Magnesium complexing to pyrophosphate was conducted by adding different equivalents of
magnesium-ion to a 10 mM solution (1.0 x 10⁻⁴
moles in 10 ml water) of sodium pyro-di-H-
phosphonate. Magnesium equivalents of 0, 0.5, 1 and 2 were added to the 10 ml sodium
pyro-di-H-phosphonate solution which all contained diphenyl phosphate as an internal
standard and the pH was maintained by added HCl or NaOH accordingly. 10.32 mg of
MgCl2.6H2O was added for 0.5 equivalent of Mg2+
then an additional 10.10 mg of Mg2+
was
added to give 1equivalent of metal-ion and 2 equivalents by an additional of 21.05 mg Mg2+
.
The complexing at each equivalent was monitored using 31
P {H} NMR at 25oC.
Residual metals within the buffer solutions were removed using Chelex 100. Isotherms using
ITC were obtained by the addition of 20 mM magnesium- or calcium-ions (syringe, 10 µl
injections) titrated into 0.50 mM PP(III). Both solutions within the syringe and cell were
buffered using 30 mM MES, 0.1 M Ionic strength at pH 6.00.
The instrument parameters for the ITC experiments were:
Number of injections: 29, reference Power: 10 µcal/sec, initial delay: 200 sec, stirring speed:
307 rpm, volume of injectant: 10 µl, duration: 20 sec, spacing: 250 sec, filter period: 2 sec.
1.2.4 Heats of hydrolysis
Experiments were performed on a VP-ITC Microcal instrument at 25oC using the
same general procedures as in 1.2.3. The addition (single injection method) of 10.05 mM
PP(III) (syringe, 5µl injections, pH 7) into sodium hydroxide at pH 13 and at pH 13.5 at 25oC,
ionic strength 1.0 M. The heat of dilution was subtracted from the hydrolysis of PP(III).
The instrument parameters for the ITC experiments were:
Number of injections: 3, reference power: 30 µcal/sec, initial delay: 300 sec, stirring speed:
307 rpm, volume of injectant: 5 µl, duration: 10 sec, spacing: 2000 sec, filter period: 2 sec.

39
The heat of hydrolysis for PP(V) was conducted with 10 mM of pyrophosphate drawn into
the syringe whilst the cell contained 3 mM MgCl2 and 1 x 10⁻⁹
M E.coli pyrophosphatase.
Both the syringe and cell also contained 20 mM buffer at pH 8.40 or 7.50, 0.1 M ionic
strength and the heat of dilution was subtracted from the isotherm.
The instrument parameters for the ITC experiments were:
Number of injections: 3, reference power: 15 µcal/sec, initial delay: 300 sec, stirring speed:
307 rpm, volume of injectant: 3 µl, duration: 6 sec, spacing: 1500 sec, filter period: 2 sec.
The enthalpy associated with the any reaction occurring in the sample cell can be represented
by Equation 1.785
.
[ ] ∫
( )
Equation 1.7
The observed enthalpy is then subtracted from the heat of dilution to give the enthalpy
associated with the specific reaction (which would include any buffer
protonations/deprotonations etc).

40
1.3 Results and discussion
1.3.1 Pyro-di-H-phosphonate identification
Samples of pyro-di-H-phosphonate (PP(III)) as the di-sodium salt were provided by
T. Kee (University of Leeds) and prepared as stated within the experimental section. The
reaction involves the dehydration of phosphorous acid as shown in Scheme 1.41.
P
HO
H
OH
O
P
HO
H
O-Na
+
O
P+
Na-O
H
O
O
P
H
O-Na
+
O
2NaOH
Scheme 1.41 Preparation of PP(III), firstly by treatment with sodium hydroxide to preparing
the mono-sodium salt which is heated to give the product as the di-sodium salt.
Pyro-di-H-phosphonate is a chemically symmetrical compound which could either be
magnetically equivalent or non-equivalent. The P nuclei (spin =1/2) are well separated from
the proton nuclei and can be assigned as A and X of PP(III) di-anion in D2O. The 31
P NMR
(Figure 1.8) shows two apparent triplets separated by 666 Hz, this large coupling constant of
JP1H1 = JP2H2 is from the P-H bond. The ‘triplets’ are not true first-order couplings as the
coupling constants are unequal 7.97 ± 0.03 Hz and 9.28 ± 0.03 Hz. They presumably reflect
three bond coupling between P and the adjacent H and between the two P’s. The two P’s are
magnetically non-equivalent because the coupling of P1 to H1 is different from that of P2 to
H1. The P1 to P2 coupling is similar, but not identical, to that for P1 to H2 giving rise to an
apparent triplet which in reality is probably a doublet of doublets (Figure 1.9) which could
possibly be resolved on a high frequency NMR, this system can be referred to as an AA’ XX’
coupling system.
P1-O
H1
O
O
P2
H2
O-
O
Scheme 1.42 Pyro-di-H-phosphonate di-anion.

41
Figure 1.8 31
P NMR of Pyro-di-H-phosphonate di-anion in D2O at 161.97 MHz.
Figure 1.9 Splitting tree diagram of the coupling constants of pyro-di-H-phosphonate.
J = 666 Hz
J = 9.31
Hz
J = 7.94
Hz
J = 9.26
Hz
J = 8.00
Hz

42
1.3.2 pKa of pyro-di-H-phosphonate (III) and ethyl-H-phosphonate
The pKas of the four dissociable protons of pyrophosphate are known24
but not of the
two dissociable protons in pyro-di-H-phosphonate. The decoupled 31
P{H} NMR of PP(III)
di-anion in H2O shows an invariant chemical shift from pH 2 to 13.5 indicating that the pKas
are below 2 and that the dominant species over the majority of this pH range is the di-anion
PP(III)2-
. But below pH 2 the chemical shift does change (Figure 1.10) but PP(III)
unfortunately undergoes acid catalysis at low pH which makes difficult to measure the
chemical shift below pH 0.6.
0.0 0.5 1.0 1.5 2.0 2.5 3.0
4.85
4.90
4.95
5.00
5.05
5.10
Chem
ical
shif
t (-
ppm
)
pH
Figure 1.10 Decoupled 31
P{H} NMR chemical shift of PP(III) in H2O against pH (I = 1.0 M,
25oC) with external reference to diphenyl phosphate.
Assuming that the observed data is sigmoidal in character, it can be fitted to a pKa of 0.44 ±
0.1 which is indicated by the solid line. This is assumed to be the second pKa of pyro-di-H-
phosphonate as above pH 2 it exists as the di-anion. The first pKa may be very similar or
lower than the second even though a limiting chemical shift has not been determined below
pH 0.6.

43
The 31
P NMR spectrum of an analogous P(III) compound ethyl-H-phosphonate (EtO
PH(O)OH) was measured as a function of pH (Figure 1.11) but a limiting chemical shift could
also not been determined.
0 2 4 6 8 10
6.0
6.2
6.4
6.6
6.8
7.0
7.2
7.4
7.6
Chem
ical
Shif
t (p
pm
)
pH
Figure 1.11 Decoupled 31
P{H} NMR chemical shift of ethyl-H-phosphonate in H2O against
pH at I = 1.0 M, 25oC with external reference to diphenyl phosphate.
Again assuming a sigmoidal chemical shift as a function of pH, a pKa of 0.47 ± 0.01 was
obtained. Ethyl phosphate has a pKa of 1.6086
, which is thus higher than that of ethyl-H-
phosphonate. The first pKa of phosphoric acid is 2.12 which is also higher than that of
phosphorous acid, 1.0724
and a calculated value of 0.925
. It thus appears that phosphorous
P(III) derivatives, as their H-phosphonates, are more acidic than the corresponding
phosphoric P(V) compounds. Carroll and Mesmer studied isohypophosphate which contains
both a P(III) and P(V) oxidation state bridged by an oxygen (Scheme 1.43). Interestingly, the
first pKa was estimated to be 0.6 followed by experimental determined of 1.67 and 6.26 for
pKa2 and pKa3 87
. A summary of the pKas of various P(III) and P(V) acids is shown in Table
1.5.

44
P
O
HO
OH
O P
O
OH
H
PP(III.V)
Scheme 1.43 Isohypophosphate, hybrid phosphorus anhydride which contains one
phosphorus in a P(III) oxidation and the other in a P(V) oxidation state.
Acid pKa1 pKa2 pKa3 pKa4
Phosphorous (H-
phosphonic)
1.07 6.58
Phosphoric 2.12 7.21 12.32
Ethyl-H-phosphonate* 0.47
Ethyl phosphate 1.60 6.62
Pyro-di-H-phosphonic* ≤ 0.44 0.44
Pyrophosphoric 0.9 2.0 6.6 9.4
Isohypophosphate 0.6 1.67 6.26
Table 1.5 Summary of pKas of phosphorous and phosphate acids at 25oC (* I = 1.0 M).

45
1.3.3 pH-rate profiles for the hydrolysis of PP(III) and PP(V)
The rates of hydrolysis of pyro-di-H-phosphonate PP(III) and pyrophosphate PP(V)
(Scheme 1.44) are expected to change significantly with pH as their anionic state and
reactivities vary.
P
O
HO
H
O P
H
O
OH + H2O HO P
H
O
OH2
P
O
HO
OH
O P
OH
O
OH + H2O HO P
OH
O
OH2
Pyro-di-H-phosphonate (PP(III))
Pyrophosphate (PP(V))
Scheme 1.44 Hydrolysis of pyro-di-H-phosphonate (PP(III)) and pyrophosphate (PP(V)).
pH-rate profiles are useful for determining any acid and base dependent and pH independent
hydrolysis and the rate laws for ionising reactants. The rates of hydrolysis of pyrophosphate
and pyro-di-H-phosphonate were determined by 31
P {H} NMR and auto-titration at a range of
pHs using hydrochloric acid, sodium hydroxide and different buffers under pseudo first-order
conditions at constant pH, ionic strength I = 1.0 M and temperature 25oC.
The observed pseudo first-order rate constants (kobs) at different buffer concentrations at
constant pH were extrapolated back to give a buffer independent rate constant. For example,
without extrapolation to zero buffer concentration at higher pH the observed rate constant, if
general base catalysed, could be a combination of the buffer([B]), hydroxide concentration
([OH-]) and the independent rate constant (k0) (Equation 1.8).
[ ] [ ]
Equation 1.8
The pseudo first-order rate constant (kobs) measured at constant pH and buffer ratio but with
different buffer concentrations allows a plot of kobs against [B], which provides, from the
intercept, the buffer independent rate constant k0 + kOH (Equation 1.9) and , from the slope, kB.
[ ] [ ]
Equation 1.9

46
This is the case for the hydrolysis of PP(III), where, for example, at pH 8.0 the observed first
order rate constant is dependent on the concentration of the buffer used to maintain constant
pH (Figure 1.12)
0.00 0.05 0.10 0.15 0.20 0.25 0.30
0.0
5.0x10⁻⁸
1.0x10⁻⁷
1.5x10⁻⁷
2.0x10⁻⁷
2.5x10⁻⁷
3.0x10⁻⁷
3.5x10⁻⁷
k obs (
s-1)
Buffer Concentration (M)
Figure 1.12 Plot of the observed pseudo first-order rate constants for the hydrolysis of PP(III)
as a function of MOPS buffer concentration at pH 8.0 at I = 1.0 M (KCl) and 25oC.
However, when the reactants, such as PP(V) and PP(III) can ionise over the pH range studied,
the pH rate profile may also indicate the relative reactivities of the various ionic states. A plot
of the log of the pseudo first-order rate constants obtained at different pHs, independent of
buffer concentration, against pH for the hydrolysis of pyro-di-H-phosphonate (PP(III)) and
pyrophosphate (PP(V)) reflects the different ionic species present and their relative
reactivities (Figure 1.13).

47
0 2 4 6 8 10 12 14
-12
-11
-10
-9
-8
-7
-6
-5
-4
-3
-2
-1
0
log
10 (
k obs)
pH
Figure 1.13 pH rate-profile for the hydrolysis of PP(III) (+) and PP(V) (×) at 25°C.
PP(III) is more reactive then PP(V) at all pHs and unlike PP(V) the hydrolysis of PP(III)
shows a hydroxide-ion catalysed reaction at high pH. The rate of hydrolysis of
pyrophosphate PP(V) steadily decreases with increasing pH as shown in Figure 1.13 - the rate
constants for the tri- and tetra-anion are calculated from a recent report from measurements at
high temperatures but extrapolated to 25oC
84 but those for the neutral, mono- and di-anionic
species are from our 31
P NMR observations.
1.3.3.1 PP(III) hydrolysis
The observed pseudo first-order rate constant for the hydrolysis of PP(III) between
pH 2 and 4 shows a first-order dependence on [H+] where the dominate species in solution is
the di-anion (PP(III)2-
). Below pH 2 this changes to a second-order dependence on [H+]
which is more clearly shown by the enlarged area between pH 0 and 4 (Figure 1.14) and by
the changes in values of kobs /[H+] as a function of pH (Figure 1.15).
Between pH 5 and 8 there is a pH independent term for the hydrolysis of the PP(III) di-anion
which is then followed by a first-order dependence on hydroxide-ion at high pH. Thus the
observed rate law is given in Equation 1.10 where k1, k2, k0 and kOH refer to the rate constants
for the hydrolysis of PP(III) di-anion, the major species over the pH range studied, so k1 refers
to the reaction with PP(III) di-anion and [H+]
2 or its kinetic equivalent, k2 is that which is first-
order in H+ concentration, k0 is the pH independent hydrolysis and kOH is the second-order rate
constant for the hydroxide catalysed hydrolysis of PP(III)2-
.

48
[ ( ) ] [ ] [
] [ ]
Equation 1.10
The pH-rate profile at low pH does not indicate any signs of levelling off of the pseudo first-
order rate constant or a reversion to a first-order dependence on [H+] which may be expected
if the PP(III) mono-anion or undissociated acid became the significant species in solution.
The rate constants for the kinetic term k1 and k2 can also be obtained from the slope and
intercept of a plot of kobs/[H+] against [H
+] which are 1.77 x 10
-1 M
-2 s
-1 and 1.10 x 10
-2 M
-1 s
-1
respectively (Figure 1.15). The first two terms in the rate law, k1 and k2 have kinetically
equivalent expressions. For example the k1 term could represent the spontaneous hydrolysis
of the neutral PP(III), or the acid catalysed hydrolysis of the PP(III) mono-anion and the k2
term could reflect either the spontaneous hydrolysis of the mono anionic species or even
hydroxide-ion attack upon the neutral species, although the calculated rate constant for the
latter k2.K1.K2/Kw is greater than that of a diffusion controlled rate and therefore can be
excluded.
k1 2.00 x 10⁻¹
(*2.05 x 10⁻¹
) (M-2
s-1
)
k2 9.40 x 10⁻³
(*8.32 x 10⁻³
) (M-1
s-1
)
k0 1.20 x 10⁻⁷
(*1.20 x 10⁻⁷
) (s-1
)
kOH 1.35 x 10⁻¹
(*1.45 x 10⁻¹
) (M-1
s-1
)
Table 1.6 Rate constants for the hydrolysis of PP(III)2-
at 25oC and I = 1.0 M (* obtained
using Excel Solver to minimise the sum of the squared residuals).
The calculation of the rate constants for these kinetically equivalent mechanisms requires a
knowledge of the two pKa’s of PP(III). The estimated value of pKa2 = 0.44 i.e. Ka2 = 0.36 M
is subject to error and there is no simple way to estimate pKa1. Nonetheless it is a worthwhile
exercise to enable a comparison with the PP(V) analogues. The third-order rate constant k1 is
kinetically equivalent to the spontaneous hydrolysis of the undissociated acid with a first-
order rate constant equal to k1.Ka1.Ka2. Based on the pH dependence of the 31
P {H} NMR
chemical shifts (Figure 1.10) and the pH-rate profile (Figure 1.13) the product Ka1.Ka2 is >10-
1. The calculated rate constant for the hydrolysis of the undissociated PP(III) is thus > 0.073
s-1
. Presumably, the undissociated PP(III) is much more reactive than its mono- and di-anions
so that between pH 1 and 2 it is the reactive hydrolytic species even though its concentration
is small and falls off with a second-order dependence on [H+]. Similarly, between about pH 2
and 5 where the rate of hydrolysis shows a first-order dependence on [H+] and the rate law is

49
dominated by the k2 term in (Equation 1.10), hydrolysis is probably occurring through the
mono-anion of PP(III) even though, again, the dominant species in solution is the di-anion.
The calculated first-order rate constant for the hydrolysis of the mono-anion PP(III)- is given
by k2.Ka2 = 3.41 x 10⁻³
s-1
. The rate constant for the spontaneous hydrolysis of the PP(III) di-
anion is 1.20 x 10⁻⁷
s-1
, so the relative hydrolytic reactivities of the neutral, anionic and di-
anionic PP(III) are approximately: 6 x 10⁵ : 3 x 10
4 : 1.0, respectively. The rates of hydrolysis
of the neutral and mono-anionic PP(III) differ by a factor of 20 and presumably both involve
nucleophilic attack by water in a concerted mechanism (SN2(P)) (Scheme 1.45) or a
associative mechanism involving a penta-coordinate intermediate on the more electrophilic
neutral P centre although they require the expulsion of different leaving groups, the H-
phosphonate mono- and di-anions, respectively (Scheme 1.45).
P
O
HO
H
O P
O
OH
H
H2O
P
O
HO
H
O P
O
O-
H
H2O
P
O
-O
H
O P
O
O-
H
H2O
PP(III) PP(III)- PP(III)2-
Scheme 1.45 Possible mechanism for the spontaneous hydrolysis of each PP(III) species.
0 1 2 3 4
-6
-5
-4
-3
-2
-1
0
log
10 (
kobs)
pH
Figure 1.14 pH-rate profile enlarged from Figure 1.13 to show the change from first-order
dependence on H+ (dashed line is a continuation of a first-order dependence on H
+) to second-
order dependence on H+.

50
0.00 0.05 0.10 0.15 0.20 0.25
0.0
1.0x10⁻²
2.0x10⁻²
3.0x10⁻²
4.0x10⁻²
5.0x10⁻²
k obs/[
H+]
[H+]
Figure 1.15 Plot of observed pseudo first-order rate constants divided by the hydrogen ion
concentration against hydrogen ion concentration between pH 0.66 and 1.6, showing the
second-order dependence on hydrogen ion concentration. The rate constant k2 which is first-
order in [H+] is given by the intercept. The third-order rate constant, k1 which is second-order
in hydrogen ion concentration was obtained from the slope.
There have been other studies of the hydrolysis of PP(III) using analytical techniques other
than 31
P NMR. For example Mesmer and Carroll studied the hydrolysis of PP(III) at 30oC
(Figure 1.16), but only reported a hydrogen-ion and hydroxide-ion catalysed reaction.
However, a re-analysis of their data in acidic media shows that the hydrolysis of PP(III) does
not follow a first-order dependence on H+, concentration which is demonstrated by the
variation their first-order rate constants (kobs) from 5.17 x 10⁻³
s-1
to 0.21 s-1
as hydrogen ion
concentration from 0.0975 M to 0.975 M, respectively88
. A plot of log kobs against pH
actually gives a slope = 1.56. Under basic conditions they found a first-order dependence of
the rate of the hydrolysis of PP(III)2-
on hydroxide-ion concentration and an average second-
order rate constant (kOH-) = 0.31 M-1
s-1
at 30oC, compared with our value of 0.135 M
-1 s
-1 at
25oC
88.

51
0 2 4 6 8 10 12 14
-7
-6
-5
-4
-3
-2
-1
0
log k
obs (
s-1)
pH
Figure 1.16 pH-rate profile constructed from the data of Mesmer and Carroll for the
hydrolysis of PP(III) at 30oC
88.
1.3.3.2 PP(V) hydrolysis
In contrast to those for the hydrolysis of PP(III), the observed pseudo first-order rate
constants for the hydrolysis of PP(V) continue to decrease with increasing pH (Figure 1.13) as
the state of ionisation increases and PP(V) forms anions of increasingly lower reactivity.
The known pKa values (0.79 (I = 1.0 M), 1.72 (I = 1.0 M), 6.6 and 9.4) of PP(V)24, 89
and the
rate constants obtained in this work over the pH range -2 – 4 (Table 1.7) have been used to
generate the overall pH-rate-profile (Figure 1.13) using the overall rate-law for PP(V)
(Equation 1.11). The rate constants for the tri- and tetra-anions of PP(V) are taken from the
recent literature obtained by extrapolation from determinations at elevated temperatures84
(Figure 1.17) and are compatible with other reports45, 90, 91
.
[ ( )][ ] [ ( )] [ ( )
] [ ( ) ] [ ( )
]
[ ( ) ]
Equation 1.11

52
kH 1.30 x 10⁻⁵
(*1.33 x 10⁻⁵
) (M-1
s-1
)
k0 (I = 1.0 M) 1.00 x 10⁻⁷
(s-1
)
k1- (I = 1.0 M) 7.00 x 10⁻⁸
(s-1
)
k2- (I = 1.0 M) 3.50 x 10⁻⁸
(*3.59 x 10⁻⁸
) (s-1
)
k3- 1.07 x 10⁻⁹
(s-1
) ^
k4- 8.59 x 10⁻¹³
(s-1
) ^
Table 1.7 Rate constants for the hydrolysis of PP(V) at 25oC. k0 and k1- have been estimated
due to the lack of experimental data points. (* obtained using Excel Solver to minimise the
sum of the squared residuals), (^ from 84
).
There is no base-catalysed hydrolysis observed in the hydrolysis of the PP(V) anions in
alkaline solutions. This is unlike the behaviour of di-anionic PP(III) species which, despite its
negative charges, does undergo a hydroxide-ion catalysed hydrolysis and, consequently
PP(III) is much more reactive than PP(V) at high pH.
There are kinetically equivalent processes for the hydrolysis of PP(V). For example, if the
reported rate constant for the spontaneous hydrolysis of PP(V) tri-anion84
actually reflects the
kinetically equivalent hydroxide-ion catalysed hydrolysis of the di-anion, then the
corresponding second-order rate constant would be Ka3.k3-/Kw = 1.7 x 10⁻³
M-1
s-1
which can be
compared with kOH for PP(III)2-
= 1.35 x 10⁻¹
M-1
s-1
.
The hydrolysis of pyro-di-H-phosphonate is 79 fold higher compared with pyrophosphate, so
the hydrolysis of the PP(V) tri-anion probably does occur through a mechanism involving
hydroxide-ion attack on the di-anion.
Little work has been done regarding the hydrolysis of pyrophosphate around room
temperatures due to its slow hydrolysis rate. Willard, Kim and Sullivan in 1984 published
kinetic data on the hydrolysis of ammonium pyrophosphate at 25oC. At pH 4-6 where the
major species is the di-anion, for which a k2- rate constant of approximately 2.00 x 10⁻⁸
s-1
can
be obtained which is in reasonable agreement with the results we obtained at 25oC
43 (Table
1.7).
The hydrolysis of PP(V) has been investigated by several researchers under acidic and basic
conditions at high temperature and their reported rate constants (Table 1.8).

53
Contributor Osterheld Campbell and
Kilpatrick
McGilvery and
Crowther
Temp (oC) 60.0 59.9 65.5
Ionic Strength (M) 0.44 0.15
Rate constants (s-1
)
H5P2O7+ ≥ 1.92
H4P2O7 6.17 x 10⁻⁴
3.83 x 10⁻³
H3P2O7- 4.00 x 10
-4 2.00 x 10
-4 7.33 x 10
-4
H2P2O72-
1.87 x 10⁻⁴
1.59 x 10⁻⁴
2.83 x 10⁻⁴
HP2O73-
6.00 x 10⁻⁶
5.25 x 10⁻⁵
P2O74-
4.67 x 10⁻⁶
Table 1.8 Summary of rate constants for the different anionic species of PP(V) at high
temperature44
.
Figure 1.17 Arrhenius plot of pyrophosphate, ο represent the hydrolysis of H2P2O72-
at pH 5
and P2O74-
in 1 M KOH (▲) and 2 M KOH (Δ). The dashed line represents HP2O73- 84
.

54
1.3.3.3 Mixed P(III.V)
Interestingly a study carried out by Carroll and Mesmer in 1967 had examined the
hydrolysis of isohypophosphate a compound which contains phosphorus atoms in P(III) and
P(V) oxidation states which are bridged by oxygen (Figure 1.18).
This compound contains three dissociable protons, the first pKa1 was estimated to be 0.6
which is most likely to be of the P(III) phosphorus atom as the dissociable protons of PP(III)
are more acidic than those of P(V). The second (pKa2) and third (pKa3) were determined by
titration to be 1.67 and 6.26, respectively at 25oC
87.
The hydrolysis of isohypophosphate between pH 0.4 and 4.5 could be described by the rate
law:
[ ( ) ][ ] [ ( )
][ ]
Equation 1.12
0 1 2 3 4 5
-7
-6
-5
-4
-3
-2
log k
obs (
s-1)
pH
Figure 1.18 pH rate-profile for the hydrolysis of PP(III.V) at 25oC
87.
Between pH 2 and 4.5, the dominant species is the di-anion and although the observed first-
order rate constants were not extrapolated to zero buffer concentration, it is observed that the
rate of hydrolysis is first-order in hydrogen-ion concentration with a rate constant of 9.0 x 10⁻³
M-1
s-1
, which is kinetically equivalent to the spontaneous hydrolysis of the mono-anion (k2-
.Ka2) (Figure 1.18). Between pH 0.42 and 1.14 the dominant species is the mono-anion and
the rate changes to a second-order dependence in hydrogen ion with a rate constant

55
(kH) = 0.22 M-2
s-1
, which is kinetically equivalent to the acid catalysed hydrolysis of the
undisscocated acid (k1-.Ka1) (slope =1.65). If the first of pKa is 0.6, as estimated one would
expect the pseudo first-order rate constant to level off or revert back to a first-order
dependence on [H+], at pH < 0.6. In comparison to the hydrolysis of PP(III) mono-anion, the
mixed PP(III.V) has a slower rate of hydrolysis by 18 fold, which would be expected as the
rate of hydrolysis of pyrophosphate mono-anion is much lower than PP(III) and PP(III.V).
The rate constants for the hydrolysis of PP(III), PP(V) and PP(III.V) all at 25oC are
summarised in Table 1.9.
Species Pyrophosphate
PP(V)
Pyro-di-H-
phosphonate
PP(III)
Isohypophosphate
PP(III.V)
Acid catalysed 1.30 x 10⁻⁵
M-1
s-1
- 5.5 x 10⁻²
M-1
s-1
Neutral 1.00 x 10⁻⁷
s-1
7.3 x 10⁻²
s-1
-
Mono-anion 7.00 x 10⁻⁸
s-1
3.41 x 10⁻³
s-1
1.92 x 10⁻⁴
s-1
Di-anion 3.50 x 10⁻⁸
s-1
1.20 x 10⁻⁷
s-1
-
Tri-anion 1.07 x 10⁻⁹
s-1
- -
Tetra-anion 8.59 x 10⁻¹³
s-1
- -
Table 1.9 Summary of rate constants for the hydrolysis of PP(III), PP(V) and PP(III.V) at
25oC.

56
1.3.4 Hydrolysis of other P(III) derivatives
The hydrolysis of diethyl pyro-di-H-phosphonate and diethyl H-phosphonate were
studied as neither have dissociable protons to complicate the kinetics. They both produce the
same mono-ester intermediate which can be hydrolysed further (Scheme 1.46).
EtO
P
H
OEt
O
EtO
P
H
O-
O
+ EtOH-O
P
H
O-
O
+ EtOH
EtO
P
H
O
O
P
O
H
OEt-O
P
O
H
OEt
2H2O
H2O H2O
H2O
Scheme 1.46 Hydrolysis of diethyl pyro-di-H-phosphonate and diethyl-H-phosphonate.
The hydrolysis rate of di-ethyl pyro-di-H-phosphonate at pH 7 was too fast to measure by
31P{H} NMR and is therefore > 0.1 s
-1 92.
Determined by 31
P NMR, di-ethyl H-phosphonate shows an acid catalysed hydrolysis to give
ethyl H-phosphonate and ethanol with a second-order rate constant kH+ = 1.21 x 10⁻⁴
M-1
s-1
at
25oC (I = 1.0 M). It also shows a hydroxide-ion catalysed hydrolysis with a second-order rate
constant kOH-= 81.3 M-1
s-1
at 25oC (I = 1.0 M) which was obtained from the observed pseudo
first-order rate constants, extrapolated to zero buffer concentration, at constant pH’s.
Ethyl H-phosphonate also shows an acid catalysed rate of hydrolysis kH+ = 6.90 x 10⁻⁶
M-1
s-1
which is 18x slower than that for diethyl H-phosphonate, and a hydroxide-ion catalysed
hydrolysis with a second-order hydrolysis rate kOH- = 1.55 x 10⁻⁵
M-1
s-1
, which is 5 x 10⁶ less
than that for diethyl H-phosphonate due to the additional negative charge repulsing the
negatively charged nucleophile. The acid catalysed hydrolysis of ethyl H-phosphonate mono-
anion is kinetically equivalent to the hydrolysis of the neutral ethyl H-phosphonate and,
assuming the pKa of ethyl H-phosphonate is approximately 0, the corresponding first-order
rate constant would be 6.90 x 10⁻⁶
s-1
.
Using the above rate data, a Brønsted plot can be obtained for the calculated rate constants for
the spontaneous hydrolysis of (HO)P(O)H-X (Table 1.10) by plotting log k0 against pKa of the
leaving group (XH).

57
X pKa XH k0 (s-1
)
H2PO3 1.1 > 0.073
HPO3- 6.6 3.41 x 10
-3
EtO 15.9 6.90 x 10⁻⁶
Table 1.10 Summary of the estimated kinetic data calculated for the spontaneous pH
independent hydrolysis of H-phosphonate derivatives (HO)P(O)H-X at 25oC.
0 2 4 6 8 10 12 14 16 18
-5
-4
-3
-2
-1
log k
0 (
s-1)
pKa
Figure 1.19 Brønsted plot for the spontaneous pH independent hydrolysis of H-phosphonate
derivatives (HO)P(O)H-X at 25oC as a function of the pKa of the leaving group XH.
Although only based on a three point Brønsted plot (Figure 1.19) it does cover a pKa range of
14 and is linear giving a βlg = -0.27. This indicates that there is little or no P-O bond cleavage
in the transition state with a small development of charge on the oxygen relative to the
reactant which is consistent of a rate limiting formation of a trigonal bipyramidal intermediate
(Scheme 1.47).
-O
P
H
Lg
O
H2O
Scheme 1.47 Trigonal bipyramidal intermediate indicates little charge and bond cleavage in
the transition state.
P
O
HO X
H

58
A summary of the kinetic data for the hydrolysis of H-phosphonates is given in Table 1.11:
Table 1.11 Summary of rate constants for different H-phosphonates (* hydroxide catalysed
rate constant) at 25oC, I = 1.0 M.
1.3.5 Mechanisms of hydrolysis of PP(III) and PP(V)
Pyro-di-H-phosphonate di-anion is the major species in water above pH 2. The pH-
rate profile clearly shows a pH independent rate of hydrolysis from pH 4-8 and a reaction
involving hydroxide-ion above pH 8 (Scheme 1.48, i, ii). It is likely that an associative
mechanism is involved in the hydrolysis of PP(III) which involves the formation of a penta-
coordinate phosphorane intermediate as there is small charge development in the transition
state indicating little P-O bond cleavage (Figure 1.19).
P
O
-O
H
O P
O
-O
H
OHP
O
H
O-
H2O
P
O-
O+
H
O P
O
H
O-
H
H -O
2
P
O
-O
H
O P
O
-O
H
O-
P
O
H
O-
HO-
P
O-
HO
H
O P
O
H
O-
-O
2
i
ii
Scheme 1.48 Hydrolysis mechanism of PP(III) by water (i) and hydroxide (ii).
P
O
ORO
H
R'
R’
RO
-Et P
O
H
OH
P
O
H
OEt
P
O
H
O-
OH 6.90 x 10
-6 s
-1 > 7.3 x 10
-2 s
-1 - 3.41 x 10
-3 s
-1
EtO *81.3 M
-1 s
-1 - > 0.1 s
-1 -
O-
*1.55 x 10⁻⁵
M-1
s-1
3.41 x 10
-3 s
-1 -
1.20 x 10⁻⁷
s-1
*1.35 x 10-1
M-1
s-1

59
The second-order rate constant for the hydroxide-ion hydrolysis of PP(III) di-anion kOH is 106,
fold greater than that for k0 the pH independent rate constant.
It is most likely that the undissociated and mono-anion of pyrophosphate PP(V) hydrolyse via
an associative mechanism as an additional negative charge would be required to form the
meta-phosphate intermediate93
. There is a possibility that the di-anion can hydrolyse through
a dissociative mechanism as long as the second dissociation occurs on the same phosphorus
(Scheme 1.49)
P
O
-O O
OH
P
O
OH
OH
P
O
-O O
OH
P
O
O-
OH
P
O
-O O
O-
P
O
OH
OH
Ka = 1 x 10⁻² M K = 2.4 x 10⁻⁷
Scheme 1.49 Dissociation of a proton to form the pyrophosphate di-anion.
The equilibrium between the PP(V) di-anion with negative charges on different P-O’s and the
di-anion with them on the same P can be estimated as about 2.4 x 10⁻⁷
by analogy to the
difference in the pKa’s of ethyl phosphate. So a rough estimate of the rate of hydrolysis
PP(V)2-
with both negative charges on the same P is = 0.15 s-1
(k2 = 3.50 x 10⁻⁸
/2.4 x 10-7
).
An additional factor in-favour of the dissociative mechanism involves the departure of a good
leaving group which has a pKa of 2 (Scheme 1.50).
P
O
-O
O-
O P
O
OH
OH P
O
O O
-
Metaphosphate intermediate
-O P
O
OH
OHH2O
2
Scheme 1.50 A possible mechanism for pyrophosphate di-anion hydrolysing via a
dissociative mechanism to yield phosphoric acid.
Pyrophosphate tri-anion may also hydrolyse via a dissociative mechanism although the
leaving group is not as acidic. The hydrolysis of the tetra-anion involves the expulsion of a
basic phosphate di-anion and a dissociative mechanism is still possible as the kinetically
equivalent mechanism of hydroxide-ion attack on the tri-anion is electrostatically
unfavourable.

60
1.3.6 Metal coordination to PP(III) and PP(V)
Many enzymes require one or more metal-ion(s) to aid hydrolysis and
transesterification of phosphate esters. Although metal-ion binding has been studied
extensively for pyrophosphate, there have been few reports on metal-ion coordination to pyro-
di-H-phosphonate. The natural substrate of pyrophosphatase is pyrophosphate where metal-
ions aid hydrolysis by facilitating the formation of a nucleophile and neutralising the negative
charge on pyrophosphate. For pyrophosphatase to catalyse the hydrolysis of pyro-di-H-
phosphonate, presumably the latter must be able to coordinate divalent cations such as
magnesium. Isothermal titration calorimetry (ITC) shows that magnesium complexes 1:1
with pyrophosphate at pH 8.40 at 25oC (Figure 1.20). The majority of pyrophosphate at pH
8.40 exists as the tri-anion (~90%) and only ~9% as the tetra-anion. It is believed that the
major species, magnesium pyrophosphate complex is the di-anion, MgPP2-
with magnesium
complexed to the tetra-anion which is thought to the true substrate of pyrophosphatase in
solution84
. The complexing of magnesium-ion to pyrophosphate tri-anion must therefore
ionise by subsequently lowering the pKa of the final hydroxyl group (Scheme 1.51).
0 1 2 3 4 5 6 7 8 9
0
2
4
0
5
10
15
200 10 20 30 40 50 60 70 80 90 100
Time (min)
µca
l/se
c
Molar Ratio
kca
l/m
ole
of
inje
ctan
t
Figure 1.20 ITC isotherm of magnesium (21 mM) complexing with pyrophosphate (0.56
mM) buffered by HEPES at pH 8.40, I = 0.1 M and 25oC.

61
ITC provides the binding constant (Kb) = 1.64 x 10⁴ M
-1 and an enthalpy (ΔHobs) of
complexation = 13.9 kJ mol-1
. The binding constant is in reasonable agreement with the
literature binding constant (Kb) of 2.0 x 10⁴ M
-1 for the MgPP
2-complex
84. Given the
thermodynamically favourable binding of Mg2+
to PP(V) one may expect the binding to show
an exothermic change, but clearly the isotherm shows a large endothermic reaction. The
endothermic heat observed is probably due to neutralisation by the buffer of the proton
released by Mg2+
binding to PP(V)3-
(Scheme 1.51), and desolvation of the water molecules
which are coordinated to the magnesium-ion upon binding with pyrophosphate.
The titration of 8.5 equivalents of magnesium into pyrophosphate did not show any further
complexation or precipitation.
P
O
-O
O-
O P
O-
OH
O
P
O
-O
O-
O P
O-
O-
O
pKa < 9.4
Mg2+ Mg2+
+ H+P
O
-O
O-
O P
O-
OH
O
+ Mg2+Kb
Scheme 1.51 Pyrophosphate tri-anion complexing with magnesium-ion and dissociation of
the final proton which contributes to the overall enthalpy of complexation.
The enthalpy of association between A- of the HEPES buffer and H
+ to form HA is -21.01 kJ
mol-1
94
which can be subtracted from the observed ITC enthalpy providing a enthalpy of
magnesium complexation to pyrophosphate tri-anion of 34.88 kJ mol-1
at pH 8.40.
31P NMR was used to confirm the ITC data which also showed that titrating different
equivalents of magnesium-ion (0.5, 1 and 2) complexed with pyrophosphate (10 mM) in a
1:1 ratio without precipitation but on addition of 2 mole equivalents of magnesium, a white
precipitate was formed. An NMR of the clear solution (Figure 1.21, purple) once the
precipitate had settled confirmed all the pyrophosphate had complexed with magnesium.

62
Figure 1.21 31
P {H} NMR of Pyrophosphate before the addition of Mg2+
(blue) and after the
addition of 0.5 (red), 1 (green) molar equivalents of Mg2+
at pH 8.40 and 25oC with reference
to diphenyl phosphate.
For comparison, the possible magnesium complexing with PP(III) was investigated, using
ITC, in water at pH 6 where pyro-di-H-phosphonate exits primarily as the di-anion. The
isotherm (Figure 1.22) shows no signs of a sigmoidal trace associated with a binding event
involving a heat change. This indicates no or very weak binding to PP(III) even after 9 mole
equivalents of magnesium-ion were added.
0 2 4 6 8 10
0.00
0.01
0.02
0.03
0.04
0.05
0.06
0.0
0.1
0.2
0.3
0.4
0.5
0 10 20 30 40 50 60 70 80 90 100 110 120 130
Time (min)
µca
l/se
c
Molar Ratio
kca
l/m
ole
of
inje
ctan
t
Figure 1.22 ITC isotherm titrating magnesium (20 mM) against pyro-di-H-phsophonate (0.5
mM) buffered by MES at pH 6.00, I = 0.1 M and 25oC
-5.5 -6.0 -6.5 -7.0 -7.5 -8.0 -8.5 -9.0 ppmScale: 0.2003 ppm/cm, 40.56 Hz/cm
1 eq. Mg2+
0.5 eq. Mg2+
No Mg2+
ISTD P
O
O P
O
-O
O-
O-
O-
Mg2+

63
31P NMR showed, upon addition of 2 mole equivalents of magnesium (Figure 1.23, purple),
the NMR chemical shift did not alter significantly compared to the solution containing no
magnesium, confirming little or no complexing.
Figure 1.2331
P{H} NMR of Pyro-H-phosphonate before the addition of Mg2+
(blue) and after
the addition of 0.5 (red), 1 (green) and 2 (purple) molar equivalents of Mg2+
at pH 8.40 and
25oC with reference to diphenyl phosphate.
Calcium ions were also titrated against PP(III) at pH 6 (Figure 1.24) which also showed no
binding event no greater than the heats of dilution.
0 2 4 6 8 10
-0.005
0.000
0.005
0.010
0.015
0.020
0.025
0.030
0.035
0.00
0.05
0.10
0.15
0.20
0.25
0.30
0.35
0 20 40 60 80 100 120
Time (min)
µca
l/se
c
Molar Ratio
kca
l/m
ole
of
inje
ctan
t
Figure 1.24 ITC isotherm of calcium (20 mM) complexing with pyro-di-H-phsophonate (0.5
mM) buffered by MES at, pH 6.00, I = 0.1 M and 25oC.
-5.0 -5.5 -6.0 -6.5 -7.0 -7.5 -8.0 -8.5 -9.0 ppmScale: 0.2086 ppm/cm, 42.22 Hz/cm
ISTD P
O
O P
O
H
O-
O-
H
Mg2+

64
The weaker binding of PP(III)2-
to metal-ions compared with PP(V)3-
/PP(V)4-
is presumably
due to the weaker basicity of PP(III)2-
and less charge density (pKa of PP(III) - < 0.5)
compared with that of PP(V)3-
(pKa of PP(V)2-
= 6.6).
1.3.7 Hydrolytic effect of metal-ions on pyro-di-H-phosphonate
The hydrolysis of pyrophosphate is enzymatically catalysed by pyrophosphatase,
where the enzyme uses more than one magnesium-ion to aid catalysis. ATP is also a
substrate for this enzyme but studies have shown that bivalent metal-ions catalyse the non-
enzymatic transfer of phosphate from ATP to acceptors such as orthophosphate. When
orthophosphate is the phosphate acceptor, it yields pyrophosphate as the product95
.
In order for pyrophosphatase to catalyse the hydrolysis of pyro-di-H-phosphonate presumably
it must be able to complex magnesium-ion, as the enzyme complexes magnesium-ion to the
natural substrate pyrophosphate. Although the addition of Mg2+
to PP(III)2-
showed no
observable binding, using 31
P {H} NMR and ITC, it does increase the rate of hydrolysis
giving of PP(III)2-
(Figure 1.25) a second-order rate constant of 2.20 x 10⁻⁵
M-1
s-1
at pH 7 (I =
1.0 M).
0.000 0.002 0.004 0.006 0.008 0.010
0.0
1.0x10⁻⁷
2.0x10⁻⁷
3.0x10⁻⁷
4.0x10⁻⁷
k obs (
s-1)
MgCl2 (M)
Figure 1.25 Pseudo first-order rate constants for the hydrolysis of PP(III)2-
against MgCl2
concentration at pH 7, I = 1.0 M at 25oC.

65
Ueda and Sasaki have investigated the effect of metal-ions on the hydrolysis of pyro-di-H-
phosphonate at pH 4.6. A variety of metal-ions, including Mg2+
, showed no significant
increase in the rate of hydrolysis of PP(III). The only exception was the addition of 0.5 mM
Cu2+
, which increased the rate by 3 fold96
.
If it is assumed that Mg2+
catalysis is due to initial complexation of Mg2+
to PP(III) di-anion
followed by nucleophilic attack by water and that metal-ion binding has a weak association
constant of <10-2
, then the calculated rate constant for water attack on this complex is > 2 x
10-3
s-1
which is 4-orders of magnitude greater than that for the uncomplexed PP(III) di-anion.
The Mg2+
catalysed hydrolysis of PP(V) at neutral pH is assumed84
to be that of the tetra-
anion, i.e. the overall di-anionic MgPP2-
is the reactive species with an estimated rate
constant at 25oC of 2.8 x 10
-10 s
-1, three orders of magnitude greater than that of PP(V)
4-.
The process of phosphorylation and dephosphorylation that occur by associative type
mechanisms usually have a penta-coordinate trigonal-bipyramidal geometry in the transition
state, whereas in the case of the dissociative pathway it effectively involves a trigonal planar
metaphosphate anionic species, PO3−
. The 3 orders of magnitude rate enhancement of the
hydrolysis of PP(V) by Mg2+
is presumably due to the metal-ion binding to the tetra-anion
and so neutralising some of the negative charge and facilitating nucleophilic attack by water.
However, the hydrolysis of phosphate mono-esters proceeding through the dissociative
pathway is not sensitive to the presence of Mg2+
ions in aqueous solution97
. Although metal-
ion coordination may enhance the electrophilicity of the phosphorus (Scheme 1.52) it will
disfavour electron-donation from the non-bridging oxygens thus reducing their ability to
assist in expelling the leaving group. Similarly, Mg2+
only enhances the rate of hydrolysis of
ATP4-
by 3-fold and binds preferentially between the β and γ phosphates, making the di-
anionic γ phosphate less effective at expelling the ADP leaving group, but it does not
facilitate an alternative associative pathway51
. An associative transition state can be sensitive
to stabilization by Mg2+
ions if coordination occurs to the leaving group50
.
P
O
H
O-
O P
O
H
O-
H2O
Mg2+
Scheme 1.52 Possible complexation of magnesium-ion to PP(III) which increases the rate of
reaction.

66
1.3.8 Hydrolysis of PP(V) and PP(III) by pyrophosphatase
In primitive biological systems pyro-di-H-phosphonate or pyrophosphate may have
acted as phosphoryl group donors98
. In modern day organisms enzyme-catalysed hydrolysis
is an important part of metabolism to remove PP(V) that is generated by biosynthetic reaction,
yet on the other hand increasing phosphate levels can cause abnormal growth as in
hypophosphatemia and rickets in children99
.
The pyrophosphatase catalysed hydrolysis of PP(V) was monitored by ITC as it provides a
sensitive continuous assay compared to 31
P {H} NMR where PP(V) has limited solubility in
the presence of magnesium-ion.
ITC can be used to follow the kinetics of an enzyme catalysed reaction because the amount of
heat released is directly proportional to the amount of substrate that has reacted. The
instrument output reflects the energy required to balance the heat generated by the reaction to
maintain constant temperature (Figure 1.26). The initial positive spike probably represents
the endothermic heat of injection/ dilution and magnesium-ion complexation to PP(V) as
described earlier. The exothermic hydrolysis reaction gives a negative displacement from the
baseline and as substrate is consumed, the rate at which heat is generated decreases and the
output trace returns to the baseline.
0 100 200 300 400 500 600
-4
-2
0
2
4
6
8
dQ/dt
µcal/
s
Time (s)
Figure 1.26 ITC trace of the enzymatic hydrolysis of pyrophosphate (PP(V)) with 1 × 10⁻⁹
M
E. coli PPase, 3 mM MgCl2, initiated with PP(V) to give a final concentration of 4.11 × 10⁻⁵
M at 25°C. The endothermic peak represents the heat of dilution and magnesium-ion
complexation, followed by PP(V) consumption until the heat generated with respect to time
(dQ/dt = power) returns to the baseline.

67
Using Equation 1.5, a plot of PP(V) concentration against time (Figure 1.27) was used to
obtain the Michaelis-Menten kinetic parameters kcat and kcat/Km. kcat was obtained by dividing
Vmax by the enzyme concentration and the second-order rate constant kcat/Km was obtained by
dividing kobs by enzyme concentration.
0 100 200 300 400
0.0
1.0x10⁻⁵
2.0x10⁻⁵
3.0x10⁻⁵
4.0x10⁻⁵
PP
(V)
conce
ntr
atio
n (
M)
Time (s)
Figure 1.27 ITC trace converted to concentration of the enzymatic hydrolysis of
pyrophosphate (PP(V)) with 1 × 10⁻⁹
M E. coli PPase at pH 8.40.
The kcat values measured for PP(V) at 25oC at pH 8.40 and 7.55 were 208 s
-1 and 82 s
-1,
respectively. This is in good agreement with a value of kcat = 290 s-1
at pH 8.4084
. The
second-order rate constant for the enzyme catalysed hydrolysis kcat/Km = 3.68 x 10⁷ M
-1 s
-1 and
2.89 x 10⁷ M
-1 s
-1, again at 25
oC and, pH 8.40 and 7.55, respectively, and are very close to
being diffusion-controlled enzymes which are characterised by having rate constants in the
order of 108 M
-1 s
-1 100.
As PP(III) has a very similar structure to PP(V) and it was thought possible that it may act as
a substrate of pyrophosphatase and so, its hydrolysis was investigated using 31
P {H} NMR
and ITC but neither method showed any observable reaction. Using pyrophosphatase from
E.coli (2 x 10⁻⁷
M) there was no discernible rate difference from the background hydrolysis of
PP(III) at pH 7.55 (300 mM buffer, 50 mM Mg2+
, I = 1.0 M), indicating that PP(III) is not a
substrate and that kcat/Km is < 6 M-1
s-1
. This lack of reactivity may be due to PP(III) showing
no significant binding to Mg2+
and/or having insufficient negative charge to bind to the
positively charged active site of PPase.

68
PP(V) binds to the active site of E.coli PPase (Figure 1.28) through direct coordination of four
magnesium-ions and three positively charged residues Lys142, Lys29 and Arg43. Shielding of
the negatively charged oxygen atoms on pyrophosphate by magnesium and amino acid
residues increases the electrophilcity of the phosphorus centre facilitating nucleophilic attack
for hydrolysis.
P
O
P O
O O
O O
Mg
Mg
Mg
O
H
O
H
HHN
NH
+HN
Arg43
H2+
NLys142
H
+H2N
Lys29
Mg
Figure 1.28 Active site of E.coli PPase coordinated to the natural substrate pyrophosphate64
.
1.3.9 Pyro-di-H-phosphonate as a potential inhibitor of
pyrophosphatase
Although PP(III) is not an efficient substrate of E.Coli PPase, it may act as an
inhibitor of the enzyme. Again using ITC, the cell contained 1 × 10⁻⁹
M E.coli PPase, 3 mM
MgCl2 and 1 mM PP(III). The reaction was initiated by the addition of PP(V) to give a final
concentration of 4.11 × 10⁻⁵
M at 25 °C and pH 8.40 and 7.55. The kinetic parameters in the
presence of PP(III) did show a small decrease compared with those in the absence of PP(III):
at pH 8.40 kcat = 152 s-1
, kcat/Km = 3.00 x 10⁷ M
-1 s
-1 which represents a 27 % and 18 %
decrease in kcat and kcat/Km respectively. At pH 7.55 kcat = 60 s-1
, kcat/Km = 2.48 x 10⁷ M
-1 s
-1
this is a 26 % and 12 % decrease in kcat and kcat/Km respectively. It is not possible to assign
any significant inhibition of pyrophosphatase by PP(III) from these changes.

69
1.3.10 Heats of hydrolysis of PP(V) and PP(III)
The heat of hydrolysis of the P-O-P bond of pyrophosphate which is the product of
hydrolysis of ATP has been investigated at high temperatures as at all pHs the reaction is too
slow to be monitored calorimetrically. To overcome this problem, it has also been measured
using an enzyme to catalyse hydrolysis. It was of interest to compare the heats of hydrolysis
of PP(V) and PP(III).
The enthalpy of hydrolysis of pyrophosphate by pyrophosphatase was determined using ITC.
As pyrophosphate has four dissociable protons with pKas of 0.9, 2.0, 6.6 and 9.4 at 25oC the
enthalpy of hydrolysis is pH dependent as different ionic species exist in solution. When
pyrophosphate is hydrolysed, two mole equivalents of phosphoric acid are produced which
have pKas of 2.15, 7.21 and 12.35 at 25oC. At a fixed pH, there may thus be a change in the
overall charge of the reactants and products as hydrolysis occurs, liberating or absorbing
protons (Scheme 1.53).
P
O
-O
O-
O P
O-
OH
O
P
O
-O
O-
O P
O-
O-
O
pKa < 9.4
Mg2+ Mg2+
+ H+
Scheme 1.53 Pyrophosphate tri-anion coordinating with magnesium-ion which consequently
lowers the final pKa of PP(V).
Deprotonation or protonation by the buffer would then also contribute to the observed
enthalpy of hydrolysis (n). Consequently ΔHobs can be expressed as:
( )
Equation 1.13
To eliminate the enthalpy contribution by the buffer, the hydrolysis of pyrophosphate was
conducted in a series of buffers at constant pH 8.40 (Table 1.12) and 7.50 (Table 1.13) and
ionic strength (I = 0.1 M) at 25oC. The heat of hydrolysis of PP(V) was conducted using a
single injection ITC method. Prior to injection the syringe contained 10 mM PP(V) and the
cell contained 3 mM MgCl2 and 1 x 10⁻⁹
M E.coli PPase. Both solutions were buffered either
at pH 8.40 or 7.50 and I = 0.1 M. The heat of dilution and any other interactions were
subtracted by using the same method described without the enzyme being present in the cell.

70
0 50 100 150 200 250 300 350
-2.5
-2.0
-1.5
-1.0
-0.5
0.0
0.5
µca
l/s
Time (s)
Figure 1.29 ITC trace of the enzymatic hydrolysis of pyrophosphate (PP(V)) with 1 × 10⁻⁹
M
E. coli PPase, 3 mM MgCl2, initiated with PP(V) to give a final concentration of 2.11 × 10⁻⁵
M at 25°C in 20 mM tricine, pH 8.40. The endothermic peak represents the heat of
complexation of Mg2+
buffer effects and dilution followed by PP(V) consumption until the
heat generated with respect to time (dQ/dt = power) returns to the baseline.
It is usually assumed that the substrate for PPase is the magnesium ion complex of the PP(V)4-
tetra-anion in which case formally there should be no protons released on hydrolysis of PP(V)
to two phosphate di-anions catalysed by the enzyme, in contrast to that expected for the
hydrolysis of the PP(V)3-
tri-anion at pH 8.4 (Scheme 1.54). Experimentally it was found that
actually there is a small dependence on the heats of hydrolysis on the buffer used to maintain
constant pH (Table 1.12). A plot of ΔHobs against ΔHbuffer ionisation (Figure 1.30) is apparently
linear and formally provides the number of protons reacting with the buffer from the slope
which is -0.2. The intercept provides the true enthalpy of hydrolysis of MgPP(V)2-
which is
-27.1 ± 0.2 kJ mol-1
.
It seems probable that this apparent dependence on pH represents error, in which case the
enthalpy of hydrolysis of MgPP(V)2-
= -32.6 ± 1.8 kJ mol-1
, the average ΔHobs.
P
O
-O
O-
O P
OH
O-
O
P
O
-O
OH
pH 8.40+ H+
O- B
BH+
H2O2
Scheme 1.54 Hydrolytic reaction of pyrophosphate tri-anion which liberates a proton, which
is picked up by the buffer.

71
Buffer ΔHobs (kJ mol-1
) ΔHbuffer ionisation 94
(kJ mol-1
)
HEPES -30.75 21.01
Tricine -32.81 31.97
TAPS -34.35 41.49
Table 1.12 Enthalpies for the hydrolysis (ΔHobs) of pyrophosphate (really MgPP(V)2-
) at pH
8.40, I = 0.1 M and 25oC in different buffers obtained using the PPase catalysed reaction, with
the respective enthalpy of ionisation (ΔHbuffer ionisation) for the specific buffer.
20 25 30 35 40 45
-34
-33
-32
-31
H
obs (
kJ
mol-1
)
Hbuffer ionisation
(kJ mol-1
)
Figure 1.30 ΔHobs against ΔHbuffer ionisation for the hydrolysis of pyrophosphate by
pyrophosphatase at pH 8.40 (I = 0.1 M) and 25oC.
The hydrolysis was also conducted with similar buffers at pH 7.50 where pyrophosphate
(Table 1.13) still exits as the tri-anion at approximately 88% in solution and approximately
11% as the di-anion. As before the actual substrate is MgPP(V)2-
which is presumably
formed rapidly and any heat changes in its formation are included in the initial endothermic
spike (in HEPES buffer) at the beginning of the ITC output. However, in this case at pH 7.5
the hydrolysis of pyrophosphate yields phosphate as a mixture of mono-anion (~34%) and di-
anion (~61%). In this case formally hydroxide-ion is released upon hydrolysis and so
compensated by ionisation of the buffer. Interestingly, in contrast to the data at pH 8.40,
ΔHobs decreases as ΔHbuffer ionisation increases giving an apparent positive dependence of ΔHobs

72
against ΔHbuffer ionisation with a slope of 0.2 indicative of no significant buffer protonation have
occurred during the hydrolysis of pyrophosphate (Figure 1.31).
The ‘true’ enthalpy of hydrolysis of MgPP(V)2-
at pH 7.5 from the intercept is -33.5 ± 0.5 kJ
mol-1
, whereas the average ΔHobs = -28.0 ± 2.2 kJ mol-1
. Ging and Sturtevant obtained an
enthalpy of -30.6 kJ mol-1
for the hydrolysis of pyrophosphate by yeast pyrophosphatase at
pH 7.2, 0.1 M ionic strength and 25oC
78.
Buffer ΔHobs (kJ mol-1
) ΔHbuffer ionisation 94, 101
(kJ mol-1
)
HEPES -29.91 21.01
Tricine -28.44 31.97
Tris -25.53 47.53
Table 1.13 The dependence of the observed enthalpies for the hydrolysis (ΔHobs) of
pyrophosphate at pH 7.50, I = 0.1 M and 25oC on the nature of the buffer.
20 25 30 35 40 45 50
-32
-31
-30
-29
-28
-27
-26
-25
H
obs (
kJ
mol-1
)
Hbuffer ionisation
(kJ mol-1
)
Figure 1.31 ΔHobs against ΔHbuffer ionisation for the hydrolysis of pyrophosphate by
pyrophosphatase at pH 7.50 (I = 0.1 M) and 25oC.

73
As PP(III) is not a substrate for PPase it was also hydrolysed in basic solutions at 25oC which
showed a significantly exothermic reaction of -112.9 ± 9.3 kJ mol-1
of the di-anion (Figure
1.32). The heat of hydrolysis of PP(III)2-
in basic conditions is not dependent on the
hydroxide-ion concentration and can be represented by Scheme 1.55, where the ionisation of
the final pKa of phosphorous acid is captured by excess hydroxide-ion to produce water.
Therefore the true enthalpy of hydrolysis of PP(III)2-
at pH 8.40 is -1.1 kJ mol-1
(PP(III) =
obs – 2Hion(H2O)), as the enthalpy of water ionisation at 25oC is 55.9 kJ mol
-1 102.
P
O
-O
H
O P
O
H
O- H2O
HPP(III)
P
O
O-
H
-O + 2 H
+ 2 OH-
2 H2O2
Scheme 1.55 Pyro-di-H-phosphate di-anion hydrolysing to form phosphorous acid di-anion
and water.
0 20 40 60 80 100
-14
-12
-10
-8
-6
-4
-2
0
2
µca
l/se
c
Time (min)
Figure 1.32 Three 5µl injections of PP(III)2-
(syringe stock was 10.05 mM) into 0.1M NaOH,
I = 1.0 M at 25oC.

74
Also, if the ΔHobs for the hydrolysis of MgPP2-
is corrected for the initial heat of complexation
the ‘true’ enthalpy of hydrolysis of pyrophosphate tetra-anion (HPP(V)4-) is 0.9 kJ mol-1
(Scheme 1.56) which is significantly different to an approximate value of -14.7 kJ mol-1 103
.
PP(V)3- PP(V)4- + H+H
1= 1.4 kJ mol-1
MgPP(V)2-
H2
= 34.9 kJ mol-1
Mg2+
H2O
H3
= 33.5 kJ mol-1
H3
=H2
- H1
2 P(V)2-
MgPP(V)2-
PP(V)4-
H3 H
obs
Hpp(V)4-
Hpp(V)4-
= H3
+ -Hobs
Mg2+
+ H+
Mg2+
Mg2+
Scheme 1.56 Hydrolysis of pyrophosphate tetra-anion via the substrate of pyrophosphatase,
MgPP(V)2-
.
At pH 8.40, the hydrolysis of pyrophosphate tetra-anion is 0.9 kJ mol-1
whilst the hydrolysis
of pyro-di-H-phosphoante di-anion is slightly more exothermic with a value of -1.1 kJ mol-1
.
Although the enthalpy of hydrolysis of both of these compounds requires further investigation
it is possible to conclude that PP(III) could be a potential phosphorylating agent.

75
1.4 Conclusion
The hydrolysis of PP(III) and PP(V) are a complex function of pH. The rate of
hydrolysis of PP(V) decreases steadily with increasing pH as the ionic species change. The
hydrolysis of PP(III)2-
which is the major species in solution is much more reactive than
PP(V) at all pHs with a second-order dependence in [H+] between pHs 0.6 and 2, kinetically
representing the hydrolysis of the undissociated acid with a rate constant of 7.3 x 10⁻²
s-1
.
The hydrolysis changes to a first-order dependence in hydrogen-ion concentration between
pH 2 and 4 which could be kinetically represented by the mono-anionic species with a rate
constant of 3.41 x 10⁻³
s-1
. The rate then becomes pH independent between pHs 5 and 8
corresponding to the spontaneous hydrolysis of PP(III) with a rate constant of 1.20 x 10⁻⁷
s-1
.
Unlike PP(V), PP(III) shows a hydroxide-ion hydrolysed reaction with a rate constant of 1.35
x 10-1
M-1
s-1
. The pKa of P(III) derivatives compared to P(V) appear to be more acidic with a
reasonable pKa2 estimate of 0.44 ± 0.1for PP(III) and a pKa for ethyl H-phosphonate of 0.47 ±
0.01. A Brønsted plot for the spontaneous hydrolysis of H-phosphonate derivatives signifies
little charge development or no P-O cleavage to the leaving group in the transition state
consistent with the formation of a trigonal-bipyrimidal intermediate and hydrolysis occurring
via a associative (AN + DN) mechanism compared to a dissociative mechanism (DN + AN) for
the hydrolysis of PP(V) di-, tri- and tetra-anion.
In addition to the hydrolytic studies the complexing abilities of PP(V) and PP(III) were
analysed which showed that pyrophosphate tri-anion complex one equivalent of magnesium-
ion with a binding constant of 1.64 x 10⁴ M
-1 unlike PP(III) which shows negligible
complexing ability with magnesium-ion. Although ITC and NMR showed no strong
interaction between PP(III) and magnesium-ion a rate enhancement was observed with
respect to the hydrolysis at pH 7 with a second-order rate constant of 2.20 x 10⁻⁵
M-1
s-1
.
The enzyme which catalyses the hydrolysis of pyrophosphate, pyrophosphatase does not
catalyse the hydrolysis of PP(III) nor does it act as an inhibitor to the natural substrate
pyrophosphate. This inability for pyrophosphatase to catalyse the hydrolysis of PP(III) is
likely to be due to the positively charged amino acid residues unable to neutralise the negative
charge which is usually present on pyrophosphate.
The enthalpy of hydrolysis of pyrophosphate tri-anion catalysed by pyrophosphatase is in
reasonable agreement with literature data, although the enthalpy of pyrophosphate tetra-anion
(0.9 kJ mol-1
) and pyro-di-H-phosphonate (-1.1 kJ mol-1
) require further investigation.

76
Chapter 2 – METHYLENE BIS-PYRIDINIUM DICATION
2 Background
2.1 Properties of pyridine and dichloromethane (DCM)/methylene
chloride
Pyridine (C5H5N) is a 6-membered heterocyclic (Scheme 2.1) compound similar to
benzene. It is an essential skeletal feature of pyridoxal phosphate an electron sink for
elimination and transamination reactions due to resonance stabilisation. The electron
withdrawing properties of the nitrogen enable pyridine to undergo nucleophilic
addition/substitution reactions more readily than electrophilic addition/substitution reactions
as carbons 2, 4 and 6 are strongly deactivated towards electrophiles (E+). This is partly
because most electrophilic substation reactions are done under acidic conditions to form a
pyridinium ion.
The carbons and the nitrogen are sp2 hybridised forming σ bonds with neighbouring atoms.
The nitrogen atom possesses a lone pair of electrons which are not required as part of the
aromatic π system (Scheme 2.1) allowing it to act as a weak base with a pKa of 5.23 at 25oC
for its conjugate acid24
. Pyridine can also act as a nucleophile able to donate the pair of
electrons on nitrogen to electrophiles creating pyridinium salts.

77
N
N
Scheme 2.1 Dashed line in pyridine represents the resonance throughout the molecule by the
π-electron orbitals. The nitrogen contains a sp2 lone pair of electrons shown by dark grey
orbital.
DCM (CH2Cl2) is a volatile organic solvent and is a popular choice of solvent by chemists
due to its low boiling point, density, polarity and relatively moderate toxicity but it is
generally disregarded that DCM and chloroform are not inert and can act as alkylating
agents104
.
2.1.1 Alkylation of pyridine
The salt formation between pyridine and alkyl halides results from nucleophilic
substitution. The Menshutkin reaction, named after the Russian chemist Nikolai Menshutkin,
converts tertiary amines including pyridine to quaternary ammonium salts with an alkyl halide
by a SN2 type mechanism where both bond breaking/making occur in the transition state
(Scheme 2.2).
N
H
XH
HN
H
X
H HN
+
CH3
X-
Scheme 2.2 Reaction of an alkyl halide with pyridine to form methyl pyridinium.
Studies of the effect of substituted pyridines on the N-alkylation of methyl iodide concluded
that in the transition state, the bond from the alkyl group carbon to the pyridine is
approximately 30% developed and that the bond to the leaving group is highly charged or
polarised implying some positive charge development on the central carbon105
(Scheme 2.3).

78
N
H
X
H H
0.3+
0.4+
0.7-
+
Scheme 2.3 Example of possible charge development on central carbon.
This statement is true when there is little steric hindrance or strong solvent hydrogen bonding,
but a year later Kevill concluded that little charge would be present on the α-carbon and that
the actual charge separation would depend on the reactants and the type of solvent106
.
In general reacting alkyl halides, such as methyl iodide or benzyl bromide, with pyridine
forms the N-alkyl pyridinium salts which are useful reagents in organic synthesis and in the
synthesis of many drugs. Due to their reactivity they may have potential toxic/mutagenic
properties within humans as they readily react with nucleophiles within the body. Some
pyridinium salts fluoresce and the use of pyridine derivatives may be used to detect low levels
of alkylating agents in solution107
(Scheme 2.4).
N
N+
Me
I-MeI
CH3CN or Acetone
Scheme 2.4 Pyridinium compound which exhibits π-fluorescence once alkylated with methyl
iodide107
.
2.1.2 Salts of pyridine and their preparation
Pyridinium salts are of great interest with cationic surfactants providing many
applications in industry and a variety of medical applications108
. Quaternisation of pyridine is
relatively easy but can become more complex with ring substitution on pyridine.

79
2.1.2.1 N-alkyl pyridinium salts
Methylation of pyridine is relatively straightforward yielding N-methyl pyridinium
(Scheme 2.5) which is carried out by mixing pyridine and methyl iodide in absolute ethanol,
recrystallised in absolute ethanol to produce white crystals109
. A simpler method involves no
solvents and the addition of pyridine with excess alkyl halide or alkyl sulphate at 150oC for 2
hours produces the desired product dependent on the size of the alkyl halide110
.
N+
X-
N
+ MeX
Scheme 2.5 Alkylation of pyridine with methyl halide to form methyl pyridinium109
.
2.1.2.2 Zincke procedure
In 1903-1905 Zincke reported the preparation of pyridinium salts, starting with
pyridine and 2,4-dinitro-chlorobenzene produced the N-arylated pyridinium salt which are
known as Zincke salts111
. The addition of a primary amine to the Zincke salt produces a ring
opened intermediate, presumed to be a glutaconaldehyde derivative, red in colour at room
temperature; heating the mixture resulted in cyclisation to give the N-alkyl pyridinium salt112
(Scheme 2.6).
N+
DNP
Cl- + RNH2 N
DNP
NHRNH
DNP
+NHR N
DNP
NHR
N
DNP
RHNN+
R
Cl-
-H+
H
H+ -H
+
H+
N
R
H
HN
DNP
Scheme 2.6 Formation of an alkyl pyridinium salt which is brought about by ring opening of
the Zincke salt112
.

80
2.1.2.3 N-acyl pyridinium salts
A pyridine derivative, dimethyl amino pyridine (DMAP) can be combined with an
acyl halide to produce a reactive N-acyl pyridinium salt but in contact with H2O or alcohol it
undergoes hydrolysis giving the corresponding ester and protonated pyridine species (Scheme
2.7).
C
O
R X
+
N
NMe2
N+
NMe2
COR
N+
NMe2
H
R'OH+ RCOOR'
X-
X-
Scheme 2.7 N-acylation of DMAP110
.
2.1.2.4 N-trityl pyridinium salts
Tritylation with pyridine on the nitrogen also occurs, but with larger sterically
hindered substituents such as triphenylmethyl chloride, the reaction requires increased
temperatures (60-70oC) and pressures (4000-5000 atm) for 12-15 hours in which a white
precipitate is formed113
(Scheme 2.8).
N
+ Ph3C-Cl
N+
Ph
Ph
Ph
Cl-
Scheme 2.8 Addition of a large substituent such as triphenyl to pyridine113
.

81
2.1.2.5 Paraquat
1,1'-Dimethyl-4,4'-bipyridinium dichloride has the trade name Paraquat (Scheme 2.9),
which is one of the largest selling herbicides manufactured initially by ICI Chemicals and is
still widely used today. Pyridine in reaction with sodium in liquid ammonia produces 4,4'-
bipyridyl in which, after further treatment with CH3Cl, produces Paraquat114
.
N
2 N N
N+
N+
Na/NH3, O2
CH3Cl
Cl-
Cl-
Scheme 2.9 Synthesis of Paraquat114
.
2.1.2.6 Pyridinium salts from pyrylium salts
Pyrylium salts react with primary amines to form pyridinium salts as another example
of a reaction proceeding through opening of the aromatic ring. The α-position of the
pyrylium salts is usually attacked by the primary amine forming intermediate i (Scheme 2.10)
and in the presence of excess base usually in a ratio of 1:2 pyrylium:amine or triethylamine as
an external catalyst leads to 2-amino-tetrahydropyran115
. The ketodieneamine intermediate
sometimes requires a little acid to form the pyridinium salt, although some unwanted products
may also form such as vinyl amides or anilines115
.

82
O
RNH2
O
+NH2R
B
O
NHRBH
+
ORHN
H
-H2O
H+
N+
R
H H
i
Scheme 2.10 Preparation of pyridinium salts from pyrylium salts115
.
2.1.2.7 Bis-pyridinium salts
The dibromide salt of 1,1'-(ethane) dipyridinium was formed by refluxing 1,2-
dibromoethane (ethylene dibromide), pyridine and dimethylformamide. Within 2 hours a
precipitate formed which was washed with diethyl ether and dried (Scheme 2.11)116
.
N+
Br-
N
+ (CH2Br)2
N+
Br-
Scheme 2.11 Preparation of 1,1’-(ethane) dipyridinium dibromide116
.

83
2.1.3 Application of pyridinium compounds
A series of cationic sulphonamides have been developed for inhibiting carbonic
anhydrase (CA), a zinc metallo enzyme. The main role of the enzyme is to provide
homeostasis of water within the body but there have been connections between the enzyme
and cancer115
. There are some carbonic anhydrase isoforms which are only present in
cancerous cell and the drug acetazolamide (Scheme 2.12), an inhibitor of carbonic anhydrase
functions as a growth regulator in anticancer therapies. A series of pyridinium derivatives
(Scheme 2.12) show nanomolar affinities towards CA II and IV and in addition they
distinguish between membrane-bound versus cytosolic isozymes and therefore the use of
classical inhibitors such as acetazolamide and pyridinium derivatives may provide selective
cancer treatment115
.
NN
SAcHN SO2NH2
N+
N N
S S
O
O
NH2
R2R3
R4
R6
Scheme 2.12 Classical carbonic anhydrase sulfonamides inhibitors, acetazolamide (left) and a
pyridinium derivative (right)115
.
Pyridinium salts also have an important role in providing cationic surfactants for use as
corrosion inhibitors of ferrous materials in acidic media, textile softeners, antistatic agents and
the use in the petroleum industry as additives. Cationic surfactants have a minimum of one
hydrophobic group usually a long chained alkyl group, which is directly bonded to the
positively charged nitrogen atom110
.
Cetylpyridinium chloride (CPC) (Scheme 2.13) has been used in mouthwashes and
toothpastes as studies have shown that CPC prevents plaque production and gingivitis by
penetrating the bacterial cell membrane causing leakage/inhibition of cell
components/membrane117
.
Cl-
N+
Scheme 2.13 Cetylpyridinium chloride (CPC), used in a variety of dental hygiene products.

84
A few pyridinium salts have been shown to be useful conductors in lithium-ions in batteries.
1-Butyl-4-methyl pyridinium tetrafluoroborate and 1-butyl-3-methyl imidazolium
tertrafluroroborate (Scheme 2.14) or hexafluorophosphate in organic solvents such as
butyrolactone or acetonitrile together with a lithium salt such as LiBF4, provide low viscosity
and high conductivity and making them an improved contender since the first lithium-ion
battery commercialised by Sony in 1990110, 118
.
N+
N+
N
BF4-
BF4-
Scheme 2.141-butyl-4-methyl pyridinium tetrafluoroborate (left) and 1-butyl-3-methyl
imidazolium tertrafluroroborate (right).
The medical industries are always on the search for new non-toxic, broad spectrum, safe
antimicrobial sprays and disinfectants. Pyridinium salts have shown antimicrobial activity
when used at the recommended concentrations with no odour or toxicity. The mode of action
is dependent on various factors; and includes the salt being adsorbed or absorbed onto or into
the cells membrane and causing the cell structure to alter, lyse or more commonly to halt or
decrease a biochemical process such as respiration and glycolysis but more often they inhibit
oxidative systems. Increasing the alkyl chain of alkylpyridinium salts usually increases the
antimicrobial activity but is also dependent on additional groups and the substitution position
on the pyridine ring. A bis-pyridinium compound, N,N’-hexamethylenebis-(4-carbamoyl-1-
alkylpyridinium bromide) was analysed for antimalarial activity compared to quinine and
chloroquine, the N1 alkyl moiety was altered and the highest activity was approximately 10
times more effective than quinine and half as effective as chloroquine110, 119
.
Ionic liquids are excellent reaction media due to their broad solvating ability, chemical
stability, non-flammability and good thermal properties which make them safer than
conventional solvents but not all ionic liquids have these ideal properties120, 121
.

85
Bittner et al. investigated the physical properties of a series of pyridinium ionic liquids,
physical properties such as density, viscosity and surface tension were measured as a function
of temperature at atmospheric pressure. It was found that lengthening the alkyl chain, reduces
density and surface tension but the viscosity increases121
.
Cellulose is a bio-renewable material which has many applications in clothing, paper,
polymer and the paint industry. Due to the high molecular weight of linear glucose polymer
chains typically being 400-1000 units, cellulose is insoluble in water and many organic
solvents122
. In 1934 Graenacher used N-ethylpyridinium chloride to dissolve cellulose but it
was not used as it was treated as novel and of little practical use123
. Two ionic liquids
although not pyridinium based compounds, dissolve cellulose without derivatisation which
are 1-butyl-3-methylimidazolium chloride (BMIMCl) and 1-allyl-3-methylimidazolium
chloride (AMIMCl)123
but pyridinium salts with co-solvents DMSO or DMF have been used
for dissolution and derivitisation of cellulose124
.
2.1.4 Preparation of Methylenebis-pyridinium
Baer and Prescott in 1896 were the first to prepare 1,1-bispyridinium dication (MDP)
by the addition of pyridine to methylene iodide (Scheme 2.15). Various methods of
preparation were used but on refluxing the components in alcohol, yellow crystals appeared
on cooling. Once purified in 50% hot ethanol the fine crystals were soluble in water, and
sparingly soluble in methanol and hot ethanol; but insoluble in cold ethanol, ether, chloroform
and benzene125
. In 1986 Almarzoqi et al. investigated different amines with di (chloro-,
bromo- and iodo) methane, where it was found that the products were either a mixture of the
mono- and di-substituted salt or one or the other. Tertiary amines such as triethylamine and
diethylmethylamine produced only the mono-substituted chloromethane but pyridine
substituted twice with dichloromethane to give methylenebis-pyridinium126
. Another method
for the preparation of MDP involves reaction of ω, ω-dibromoacetophenone and pyridine in
ethanol to produce MDP and ethyl benzoate127
. This presumably occurs by nucleophilic
attack of ethanol on the carbonyl group of ω, ω-dibromoacetophenone which also implies the
expulsion of the MDP carbanion (which forms part of this investigation) (Scheme 2.16). The
1H NMR of the bridging CH2 is strongly downfield due to being between two positively
charged pyridine molecules with a chemical shift of 7.5 ppm in D2O126
.

86
N+
N+
+
N
2 X-
CH2X2 N+ H2
C X
X-
Scheme 2.15 Method of preparation of methylene bispyridinium by Almarzoqi126
.
O
H
BrBr
O
H
Pyr+
+Pyr
Pyridine
2 X-
EtOH
HO
H
Pyr+
+Pyr
2 X-
N+
N++
O OEt
2 X-
OEt
Scheme 2.16 Method of preparation of methylene bispyridinium by Krohnke127
.
The type of halogen attached to CH2 has a dramatic effect on the rate of MDP production.
The reactivity of the dihalomethane occurs in the order of CH2I2 > CH2Br2 > CH2Cl2, di-
iodomethane having the greatest reactivity at low temperature and the least reactive CH2Cl2
requiring increased temperature and pressure for reaction to occur126
.

87
2.1.5 Crystal structures of Methylenebis-pyridinium
The first crystal structure of MDP was by Brudgam in 1986128
but recently the MDP
dichloride (C11H12N22+
.2Cl-.H2O) crystal structure was published as a monohydrate. The
structure adopts a butterfly conformation (Figure 2.1) and does not show any unusual bond
angles with the NCN of 110o and HCH 108
o and the CH2-N bond length of 147 pm
129.
Figure 2.1 Crystal structure of MDP adopting the butterfly conformation129
.
Other salts of MDP have been produced such as methylene bispyridinium
tertrachloroplatinate as organic-inorganic materials which are of interest to supra-molecular
chemists and material scientists. Hybrid salts of MDP were made by treating it with the
appropriate metal dichloride (ZnCl2 or CdCl2) in aqueous solution at room temperature
(Figure 2.2)130
. The salts are soluble in water but not in organic solvents. The parent
structure and the hybrid salts are similar, both still consisting of the methylene attached to two
positively charged nitrogen atoms of pyridine adopting a butterfly conformation which is
roughly tetrahedral and the counter-ion ZnCl42-
is nearly tetrahedral with bond angles of
113.8o and 105.9
o (Cl-Zn-Cl) and for CdCl4
2- (Cl-Cd-Cl) 110.7
o and 104.3
o130.

88
Figure 2.2 Crystal structures of N, N’-methylenedipyridinium tetrachlorozincate(II) (i) and
N,N’-methylenedipyridinium tetrachlorocadmate (II) (ii)130
.
2.1.6 Reactivity of pyridinium compounds
Ring substituted N-pyridinium salts undergo a variety of reactions ranging from ring
substitution reactions to hydrolysis and they undergo nucleophilic substitution reactions much
easier than the corresponding N-oxides which are more reactive than the corresponding
substituted pyridine. A series of 4-substituted N-methyl pyridinium salts react readily with
sodium hydroxide in water at constant ionic strength, where the 4 position either contained F,
Cl, Br, I, OCH3. 4-methoxypyridine and 4-chloropyridine are very unreactive towards
nucleophilic substitution by hydroxide131
. For example 4-methoxypyridine shows no reaction
after 43 days at 25oC which may be due to the expected intermediate not being able to support
additional negative charge (Scheme 2.17)131
. The 4-substituted N-methyl pyridinium salts are
approximately a million fold more reactive than the corresponding 4-substituted pyridines.
N
HO X
Scheme 2.17 Intermediate unable to support negative charge131
.
With 4-methoxy N-methyl pyridinium salt under certain conditions, the methyl groups at the
N and O positions are susceptible to nucleophilic attack either forming 4-methoxypyridine or
N-methyl-4-pyridone131
. Nucleophilic substitution on the ring presumably occurs through the
neutral intermediate adduct (Scheme 2.18) with the fluoride being the most reactive and the
iodide and methoxide being the least reactive at the 4-position131
.
i ii

89
N
HO X
N+
X
NN+
OH O
-H+
OH-
Scheme 2.18 Displacement of a halide by hydroxide forming a pyridone.
2.1.7 Hydrolysis of pyridinium compounds
Kosower and Patton investigated the alkaline hydrolysis of N-alkyl cyanopyridinium
ions, the products of which are sensitive to the position of the cyano group on the ring. When
the cyano group is at positions 2 or 4 of the pyridinium ring, attack by hydroxide-ion
produces the corresponding pyridone by displacement of cyanide ion and
carbamidopyridinium ion (Scheme 2.19, i, ii and Scheme 2.20), whereas 3-cyano pyridinium
ion produces 3-carbamidopyridinium ion and the ring-opened 4-cyano-5-methylamino-2,4-
pentadienal (Scheme 2.20, iii)132
N+
CN N+
CONH2
+
N O
+ CN-OH
-
N+
N+
+
N
+ CN-OH
-
CONH2 O
N+
N+
+
NH O
OH-
CN
CN CONH2NC
i
ii
iii
Scheme 2.19 Methyl pyridinium substituted with CN at different positions on the ring,
reaction with hydroxide-ion produces the respective pyridone (i, ii) but substitution at position
3 produces a ring opened aldehyde (iii)132
.

90
The mechanism of forming pyridone and carbamidopyridinium ion for when the cyano group
is attached at the 2 position of the pyridinium ring is shown in Scheme 2.20.
N+
CN
N+
CONH2
+
N O
+
OH-
OH-
N+
C
OH
N-
H2O
N OH
+CN
N O-
CN
OH-
OH-
CN-
Scheme 2.20 Formation of pyridone and carbamidopyridinium ion at position 2 of the
pyridinium ring132
.

91
Olofson and Zimmerman in 1967 reported the hydrolysis of 1,1'-(phenylmethylene)
bispyridinium. Refluxing the pyridinium salt in water produced 2 equivalents of pyridine
along with benzaldehyde133
. In the presence of alkali, a solid precipitated intermediate
(Scheme 2.21, i) was produced which was pale in colour and stable under N2, in the dark and
refrigerated. Returning this solid to basic solution forms benzaldehyde and a second
equivalent of pyridine133
.
N+
N+
H
N+
N
H
N
N
C6H5 H
O H
O
H
+
i
OH-
+N
C6H5 H
O
H
O
C6H5H
NH2
O
H
HN OH
N
-H2O
Scheme 2.21 Hydrolysis of 1,1'-(phenylmethylene) bispyridinium forming two equivalents
of pyridine and benzyaldehyde133
.

92
Fernandez et al. investigated the reaction of hydroxide with a range of 1,ω-bis (2-
bromopyridinium) alkanes, where the centres had a varying number of methylene groups.
Five different methylene variants were used and the reaction with hydroxide produced the
1,ω-bis (2-pyridone)-alkane134
.
The reactions of the different methylene variants were monitored using a spectrophotometric
method with hydroxide-ion which showed an isobestic point at 288 nm. Kinetic data obtained
by monitoring the course of the reaction at 277 or 296 nm showed biphasic consecutive first-
order reactions134
. The pathway included fast attack of OH- which yielded a mono reacted
pyridone, followed by a slow OH- attack on the intermediate giving the bispyridone product
(Scheme 2.22).
The reaction at different pHs provided a set of rate constants for the two steps in the reaction,
a plot of log k against pH (10.3-13) showed that k1 and k2 were both first-order in hydroxide
concentration134
.
N+
R
N+
2 X-
Br Br
-OH
(Fast)N
R
N+
O Br
-OH
(Slow)
N
R
N
O O
X-
Scheme 2.22 Hydroxide-ion attack of 1,ω-bis (2-bromopyridinium) alkanes to produce the
bispyridone product134
.

93
2.1.8 Ring opening reactions
Nucleophilic reactions with pyridine have been studied since the end of 19th century.
The most popular reaction is the Zincke-Konig reaction or the cleavage of quaternary pyridine
rings by amines135
.
The first reported behaviour of ring-opening was of 1-(2,4-dinitrophenyl) pyridinium chloride
(Scheme 2.23, i) discovered by Zincke et al. This compound is stable in acid and at neutral
pH but decomposes at 150oC upon heating to form pyridine and 2,4-dinitrophenol.
Hydrolysis at higher pH produces a red coloured compound initially unknown in structure but
later work revealed a ring opened derivative of 1-(2,4-dinitrophenyl) pyridinium chloride
(Scheme 2.23, ii-iv)136
.
NO2
NO2
N+
NO2
NO2
NH O
NO2
NO2
N OH
NO2
NO2
N O-
Na+
i ii iii iv
Keto Enol
Cl-
Scheme 2.231-(2,4-dinitrophenyl) pyridinium salt (i) to produce potential ring opened
coloured compounds (ii-iv)136
.
Approximately 70 years later the reaction order of 2,4-dinitrophenyl pyridinium chloride with
hydroxide-ion was found to be a maximum of 2 in hydroxide-ion in 50-90% aqueous ethanol
but decreased with increasing OH- ion and ethanol concentration
137.

94
At a similar time, in 1904 Konig showed that the addition of pyridine and cyanogen bromide
produced N-cyanopyridinium ion136
. This pyridinium salt was reacted with aniline which
produced dinitroaniline and glutacondialdehyde dianil, (di-imine) but the reaction with
hydroxide was not studied. The production of the glutaconaldehyde from many N-substituted
pyridinium ions proved quite common but some reactions were inhibited by steric hinderance
and electronegative substituents and even successful reactions have a tendency to recyclise to
a pyridinium derivative136
.
A similar compound, pyridinium sulfonic acid was studied by Baumgarten in 1926, which
was prepared by the addition of sulphur trioxide (SO3) and chlorosulphuric acid with
pyridine136
. Addition of strong sodium hydroxide (5 M) produced an intermediate yellow in
colour which was isolated (Scheme 2.24). Further treatment with hydroxide produced the
final product glutaconaldehyde which was red/brown in colour. The reaction between
pyridinium sulfonic acid and aniline produces glutaconic dialdehyde dianil, (the di-imine)136
.
N+
SO3-
N
SO3-
Na+
OH
HN
SO3-
Na+
OH
N
SO3-
Na+
O-
Na+
NaOH
NaOH
NaOH
H2O
O-
Na+O
+ NH2-SO
3--Na
+
Scheme 2.24 Ring opening of pyridinium sulfonic acid by hydroxide to form
glutaconaldehyde136
.

95
In 1965 Eisenthal and Katritzky studied the ring opening of N-methoxypyridinium
perchlorate by hydroxide although N-alkoxypyridinium salts were initially investigated by
Ochiai et al. in 1944 which showed that in the presence of hydroxide the salt produces
pyridine and an aldehyde (Scheme 2.25)138
.
N+
O
H H
R
-OH
N
+ RCHO
Scheme 2.25 N-methyloxypyridinium hydrolysis producing pyridine and an aldehyde138
.
Spectrophotometric kinetic evidence of N-methoxypyridinium perchlorate showed an
absorbance at 343 nm in alkaline solution and attributed to the glutaconic aldehyde enolate
(Scheme 2.26). The sodium enolate of glutaconic dialdehyde has a λmax at 365 nm.
Substituting the C=O by C=NH shifts the λmax downfield about 35 nm but the addition of a
methoxy group changes λmax by 22 nm, presumably due to inductive effects. A plot of log
initial rate against log concentration of hydroxide-ion showed a straight line with a second-
order dependence on hydroxide-ion138
.
N+
O
H H
H
-OH
N
O
H H
H
OH
H
-OH
N-
O
H H
H
ON
O
H H
H
O-Na
+
Scheme 2.26 Ring opening of N-methyloxypyridinium to form a sodium enolate138
.

96
In 1966 Johnson and Rumon synthesised 1-(N,N-dimethyl-carbamoyl) pyridinium (Scheme
2.27) which, when treated with hydroxide, is capable of following different mechanistic
pathways dependent on pH. At a pH below 10, 1-(N,N-dimethyl-carbamoyl) pyridinium
hydrolyses to give pyridine and dimethylcarbamic acid but above pH 10 an unstable
intermediate is formed (Scheme 2.27)139
. Further investigation of the intermediate
demonstrated that it is capable of decomposing by two pathways; the intermediate was
prepared and dissolved in aqueous solutions of varying pH. The predominant pathway above
pH 13.5 yields glutacondialdehyde and 1,1-dimethylurea but between pH 8-13 the
predominant pathway yields pyridine and dimethylamine139
.
N+
O
NMe2
N
+
O
Me2N OH
+ Cl-
N
O NMe2
HOHN
HON
<pH 10 -OH
-OH
pH 8-13
OHO
+
O
NH2Me2N
+ Me2NH
> pH 13.5
Scheme 2.27 Pathways for the hydrolysis of 1-(N, N-dimethyl-carbamoyl) pyridinium by
hydroxide dependent on pH139
.
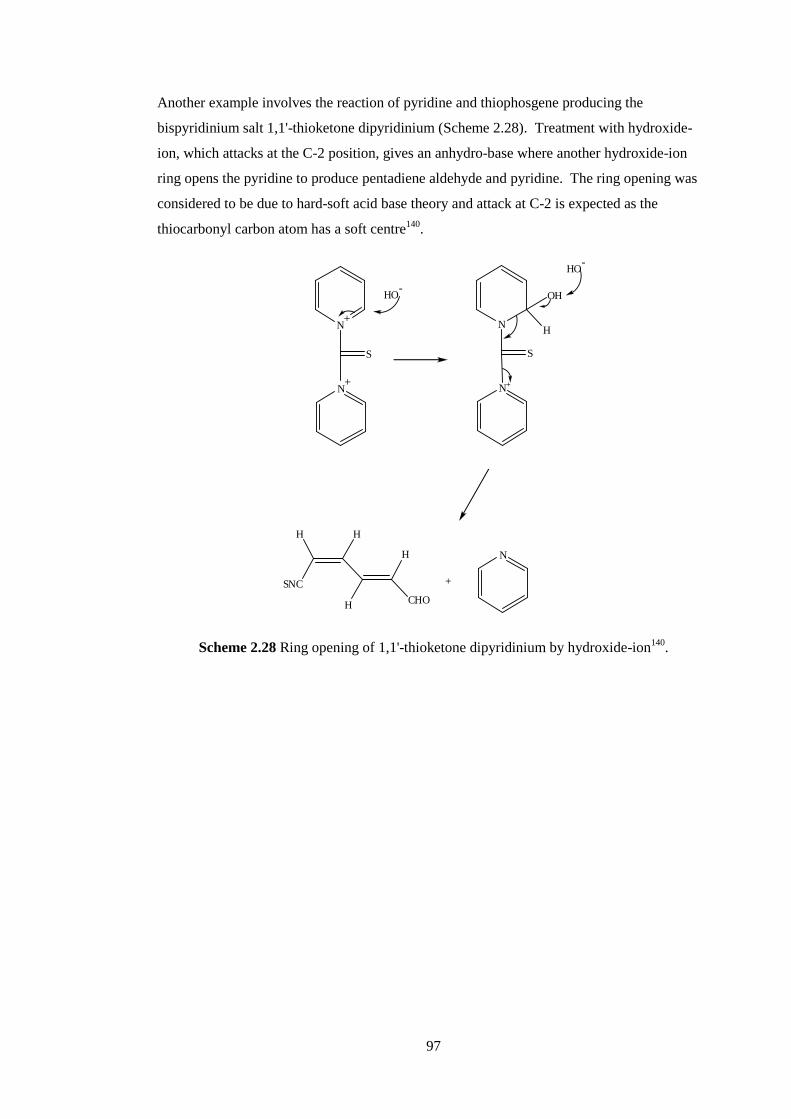
97
Another example involves the reaction of pyridine and thiophosgene producing the
bispyridinium salt 1,1'-thioketone dipyridinium (Scheme 2.28). Treatment with hydroxide-
ion, which attacks at the C-2 position, gives an anhydro-base where another hydroxide-ion
ring opens the pyridine to produce pentadiene aldehyde and pyridine. The ring opening was
considered to be due to hard-soft acid base theory and attack at C-2 is expected as the
thiocarbonyl carbon atom has a soft centre140
.
N+
S
N+
N
S
N+
OH
H
HO-
HO-
N
+
CHO
SNC
H
H
H
H
Scheme 2.28 Ring opening of 1,1'-thioketone dipyridinium by hydroxide-ion140
.

98
2.1.9 Acidity
2.1.9.1 Brønsted-Lowry acid-base model
In 1923 a Danish chemist, Johannes Brønsted, and Thomas Lowry, an English
chemist, defined acids and bases. Brønsted-Lowry defined that an acid is a species which
donates a proton whereas a base is a proton acceptor (Scheme 2.29).
Scheme 2.29 Deprotonation of a general acid.
When the acid donates its proton the species formed is known as the conjugate base (A-) and
the proton acceptor is known as the conjugate acid (BH). Compounds which are able to
donate or accept a proton are known as amphoteric, examples include H2O.
In addition to the Brønsted-Lowry definition, Gilbert N. Lewis also defines acids and bases
further where Lewis acids are electron pair acceptors and a Lewis bases is an electron pair
donors where protons are not necessarily involved in the reaction.
A compounds pKa is a measure of how acidic a given proton is within a compound. Scheme
2.30 shows the deprotonation of a carbon acid to its corresponding conjugate base (a
carbanion) in water. The equilibrium constant Ka is the relative stability of the conjugate base
and the acid but more commonly the negative logarithm is taken giving the pKa enabling
comparison of acids easier. The pKa in a given solvent is predominantly determined by
resonance and inductive effects and if a compound is deprotonated and contains atoms which
are electronegative, the charge ends up on the most electronegative atom as the lone pair is
most tightly held providing the most stable conjugate base (Scheme 2.30).
C
C
O
H
C
C-
O
C
C
O-
Ka+ H
+
Scheme 2.30 Deprotonation of a ketone providing a keto-enol stabilised resonance structure.

99
2.1.9.2 Carbon acidity
Compound’s containing a C-H bond are capable of losing a proton to form a
carbanion. Strong carbon acids generally have pKas in the range of 0-14 and the two main
factors controlling acidity are resonance stabilisation of the conjugate base and inductive
effects. These types of compounds which are able to stabilise the negative charge usually
contain oxygen, nitrogen or sulphur which in turn, allows charge transfer from the carbanion
to an electronegative atom. Nitro groups are strongly electron attracting and therefore the
negative charge on nitro carbanions is mostly transferred to the oxygens from the carbon
(Scheme 2.31, i). Carbonyl and sulfonic groups are also effective at transferring the negative
charge from the carbanion (Scheme 2.31, ii, iii)141
.
C-
N+
O
O-
C N+
O-
O-
C-
C
O
R
C C
O-
R
C-
S
O
O
R C S
O-
O
R C S
O
O-
R
i
ii
iii
Scheme 2.31 Transfer of negative charge from carbon to electron withdrawing groups.
Carbanion stability can often be predicted from electronegativity or s character content of the
orbitals involved in charge delocalisation. Hybridisation of the carbon is also an important
factor determining the acidity of a compound, which increases as more s character is observed
by the acidic atom and follows the trend sp3 < sp
2 < sp (Scheme 2.32). In alkynes, 50% s
character is observed compared to only 25% in sp3 bonds and the electrons associated with
high s character increase the electronegativity of the carbon, making sp carbons more acidic
compared to sp3 142
.

100
C C HH C C
H
H
H H
H
H
CH2=CH2
Scheme 2.32 Acidity of carbon acids is dependent on hybridisation with the most acidic being
acetylene (pKa 24) followed by ethene (pKa 44)143
and the least acidic being ethane (pKa
50.6)144
.
Pyridinium carbon acids are also of great interest as ketimines, which are formed by the
addition of 5ˈ-pyridoxamine phosphate to α-ketoacids, are intermediates of enzyme catalysed
transamination reactions. The α-carbon of the intermediate undergoes proton transfer which
is activated by the pyridinium ring (Scheme 2.33)145
.
N+
H
2-O3PO
O-
N+
R
O-
O
H
H H
N+
H
2-O3PO
O-
N+
R
O-
O
H H
N+
H
2-O3PO
O-
N+
R
O-
O
H H
H
Scheme 2.33 Proton transfer mechanism of 5ˈ-pyridoxamine phosphate145
.

101
The first α-proton pKa of the methylene group within 4-(aminomethyl) pyridinium (Scheme
2.34, i) is between 17 and 19 in water at 25oC (I = 1.0 M) although it was thought to be a
relatively strong carbon acid due to the strong electron withdrawing α-pyridinium and α-
iminium groups. High carbon acidity has also been reported for malononitrile (Scheme 2.34,
ii) and dimethyl malonate (Scheme 2.34, iii) which have pKas of 11.2 and 13.3 respectively145
.
N+
D
HH
ND3+
N N
O
O O
O
H H
H H
i ii iii
Scheme 2.34 4-(aminomethyl) pyridinium (i), malononitrile (ii) and dimethyl malonate (iii).
2.1.9.3 Enzyme catalysed proton transfer
Deprotonation of substrates by enzymes which have catalytic efficiency constants
(kcat/Km) near diffusion ~108 are difficult to monitor. One method of deprotonation of 2-
phosphoglycerate trianion by the enzyme enolase at the weakly α-carbon proton is by the
utilisation of two divalent metal-ions to neutralise the highly negatively charged substrate146
.
Although the enolase superfamily are not very substrate specific, this general feature lies
within the active site to which the substrate coordinates to the metal-ion and amino acid
residues such as glu and lys to labilise the α-proton of the bound carboxylate anion (Scheme
2.35).
O-
H OHH
HO
O
P
O-
O-
O
Mg2+ Mg
2+
Lys-NH2
O-
H OHH
O
O-
P
O-
O-
O
Mg2+ Mg
2+
Lys-NH3+
HOOC-Glu
O-
H2C
O
O
P
O-
O-
O
Mg2+ Mg
2+
Lys-NH3+
-OOC-GluH2O
Scheme 2.35 Deprotonation mechanism of 2-phospho-D-glycerate by enolase147.

102
2.2 Experimental
2.2.1 Materials
1,1′-Methylenebis-pyridinium dichloride (MDP) was prepared by the addition of 130
ml DCM (2035.79 mmoles) to 30 ml pyridine (372.40 mmoles) which was then refluxed at
60oC until a solid precipitate was formed. The precipitate was filtered and any remaining
pyridine was removed by washing with excess DCM.
1H NMR (500 MHz, D2O) 9.38 ± 0.03ppm (dd, J2,3 = 5.55 Hz, J2,4 = 1.25 Hz, 4H), 8.85 ± 0.01
(tt, J4,3 = 7.90Hz, J4,2 = 1.28Hz, 2H), 8.33 ± 0.02 (m, 4H) and 7.47 ± 0.03 (s, 2H).
13C NMR (500 MHz, D2O) 149.89 ± 0.09 ppm (C4), 145.15 ± 0.06 ppm (C2/6), 129.55 ppm ±
0.05 (C3/5), 78.0 ± 0.05 ppm (methylene).
ESI (+) for M2+
(C11H12N2) found m/z = 86.0503 whilst the exact mass calculated using
Masshunter software is 86.0495.
Sodium deuteroxide (30 wt%, 99+% D), deuterium chloride (37 wt%, 99+%D) and deuterium
oxide (99.9% D) were from Aldrich. All other organic and inorganic chemicals were AnalaR
grade and were used without further purification.
2.2.2 General methods
Phosphate, CAPS and borate buffers were prepared by dissolving the acid form and
KCl in D2O followed by the addition of NaOD to give the desired acid/base ratio at total I =
1.0 M (KCl). Solution pH was determined at 25°C using a Jenway 3510 pH meter equipped
with a Mettler InLab Ultra-Micro electrode. Values of pD were obtained by adding 0.40 to
the observed reading of the pH meter148
. The concentration of deuteroxide-ion at any pD was
calculated using Equation 2.1, where Kw= 10−14.87
is the ion product of D2O at 25°C148
.
[ ]
Equation 2.1
1H NMR spectra at 500 MHz were recorded in D2O at 25°C using a Bruker Avance 500 NMR
spectrometer. Chemical shifts are reported relative to TSP (sodium trimethylsilylpropionate
2,2,3,3-d4 ((CH3)3 SiCD2CD2CO2-Na
+)) at 0.00 ppm and sodium acetate was used as an
internal standard.

103
UV-Vis spectra were acquired using a Cary 4000, equipped with a 12 compartment cell block
thermostatically maintained by using a peltier system.
An Agilent 7890A GC equipped with flame ionization detection (FID) or MS-QQQ. The
column used was an Agilent HP-5 with dimensions 30 m x 0.25 mm x 0.25 µm. The inlet
temperature was set at 250°C, with an injection volume of 1µl and split ratio of 50:1. The
carrier gas was helium at a constant pressure of 16.1 psi and flow rate of 1.5 ml/min. The
oven temperature was initially 45°C, holding for 2 minutes, before increasing the temperature
at a ramping rate of 20°C/min. The final oven temperature was 320°C which was held for 2
minutes.
2.2.3 Kinetic measurements
All reactions were carried out in H2O or D2O at 25°C. The rate of hydrolysis of MDP
was studied by injecting a stock solution of MDP (10 mM in H2O) into a buffered solution, I
= 0.1 M giving 1 x 10⁻⁴
M MDP and measuring the change in UV absorbance at 366 nm as a
function of time. The biphasic change in absorbance was dissected into pseudo first-order
rate constants for the formation and breakdown of the intermediate using Origin Labs
software. The deuterium exchange reactions of MDP were followed by 1H NMR and were
initiated by mixing MDP into 1.0 M, 0.1 M DCl or buffered D2O solutions at an ionic strength
of 1.0 M (KCl) to give a final substrate concentrations ranging from 19.85-21.22 mM. The
pD of the reaction mixture was closely monitored and was found to be constant to within 0.05
pD units during the time the isotope exchange reaction was followed by 1H NMR analysis at
25oC.
The exchange for deuterium of the methylene proton of MDP in D2O buffered at pD 7.20 and
10.0 were followed by monitoring the disappearance of the singlet at 7.47 ± 0.03 ppm and the
appearance of a poorly resolved triplet at 7.46 ± 0.03 ppm due to the α-CHD group of the
product by 1H NMR spectroscopy. The exchange for deuterium of the aromatic protons of
MDP in D2O buffered solutions at pD 7.20-10.0 were followed by the 1H NMR using either
C4 or C3/5 protons of the pyridinium ring.
To monitor the formation of pyridine by GC, 10.1 mM MDP was added to a 300 mM CAPS
buffer at pH 10.0, I = 0.1 M, 25oC with methoxybenzene at 5 mM as an internal standard. At
intervals, 1 ml of this solution was added to 2 ml DCM, the layers were shaken to ensure
maximum transfer of organic materials into the methylene chloride layer. The layers were
left to separate and the DCM layer was analysed for pyridine.

104
2.2.4 Aim
The aim of this project involves investigation into the kinetics of hydrolysis and
mechanism of MDP and secondly to determine the acidity of the central methylene group.

105
2.3 Results and Discussion
2.3.1 Structural properties of MDP
2.3.1.1 1H and
13C NMR
The 1H NMR spectrum of MDP in D2O showed the expected signals of the
pyridinium ring at 9.38 ± 0.03 (C2/6), 8.85 ± 0.01 (C4) and 8.33 ± 0.02 ppm (C3/5) and at high
chemical shift the bridging CH2 singlet at 7.47 ± 0.03 ppm. This unusually high chemical
shift for a CH2 group is due to it being situated between two positively charged nitrogen
atoms, it was also observed that the chemical shifts change slightly dependent on the buffer
used to maintain the pH. The splitting pattern of the pyridinium ring protons are first-order
with the C2/6 protons being a doublet of doublets (J2,3 = 5.55 Hz, J2,4 = 1.25 Hz, 4H), C4 proton
being a triplet of triplets, (J4,3 = 7.90 Hz, J4,2 = 1.28 Hz, 2H), C3/5 protons appear as a
multiplet,(4H) and the bridging CH2 is a singlet (2H) (Figure 2.3).
Figure 2.3 1H NMR of MDP at pD 7.20 (I = 1.0 M), 25
oC in phosphate buffer.
7.57.67.77.87.98.08.18.28.38.48.58.68.78.88.99.09.19.29.39.49.5 ppm
7.4932
8.3219
8.3253
8.3322
8.3357
8.3375
8.3513
8.8350
8.8375
8.8400
8.8508
8.8533
8.8557
8.8666
8.8691
8.8715
9.3829
9.3854
9.3887
9.3965
9.3990
0.4
7
0.9
2
0.4
5
0.9
5
8.85 ppm
8.35 ppm
9.40 ppm

106
In addition to the 1H NMR, a
13C DEPT-135 confirmed the presence of the methylene group
between two positively charged nitrogen atoms at 78.0 ppm (Figure 2.4).
Figure 2.4 13
C DEPT-135 of MDP at pD 7.20 (I = 1.0 M), 25oC in phosphate buffer.
The 13
C NMR clearly shows the pyridinium carbons and the bridging CH2 carbon but not of
the ratio one may expect (1:2:2:1). This phenomenon is due proton decoupled carbon-13
spectra which is known as Nuclear Overhauser Effect (NOE). This is observed when one
nuclei is irradiated at its resonance frequency which causes the detected nuclei to be more
intense or weaker than usual149
.
To correlate protons with their respective carbons a heteronuclear single quantum coherence
(HSQC) spectrum was run which (Figure 2.5) indicated the high methylene proton at 7.49
ppm is connected to the carbon at 78.0 ppm. The proton situated within the pyridinium ring
at C2/6 next to the nitrogen atom has the highest 1H downfield signal at 9.39 ppm, but the C2/6
has the second highest carbon chemical shift at 145.15 ppm. The highest carbon chemical
shift is C4 of the pyridinium ring at 149.89 ppm whilst C3/5 has the lowest proton and carbon
chemical shift at 8.33 and 129.55 ppm, respectively.
210 200 190 180 170 160 150 140 130 120 110 100 90 80 70 60 50 40 30 20 10 0 ppm
78.00
129.55
145.15
149.89

107
Figure 2.5 HSQC spectra of MDP in D2O at 25oC.
For free pyridine itself, 1H NMR (Figure 2.6) shows that the α-protons (C2/6) are most electron
deficient are the highest downfield signals, the second lowest field signal is the ɣ-proton (C4)
and the most upfield signal being of the β-protons (C3/5). The ɣ-proton has a lower field
signal compared with the β-protons due to inductive and resonance effects from the electron
withdrawing nitrogen, as the resonance structures indicate partial positive charges on carbons
C2/6 and C4 (Scheme 2.36) which is also concordant with the 13
C NMR spectrum.
N N N N N+
+
+
Scheme 2.36 Resonance structures of pyridine indicating partial positive charges of carbons
2, 4 and 6.
ppm
7.07.58.08.59.09.510.0 ppm
70
80
90
100
110
120
130
140
150

108
Figure 2.6 Pyridine in D2O at pD 9.4 at 25oC.
A summary of the 1H and
13C chemical shifts of MDP and pyridine are shown in Table 2.1.
1H /
13C MDP chemical
shift (ppm)
Pyridine
chemical shift
(ppm)
H/C2/6 9.38 (145.15) 8.53 (148.55)
H/C3/5 8.33 (129.55) 7.47 (124.43)
H/C4 8.85 (149.89) 7.89 (137.64)
Methylene
(CH2)
7.47 (78.00)
Table 2.1 Summary of 1H and
13C NMR chemical shifts of MDP and pyridine at 25
oC.
7.47.57.67.77.87.98.08.18.28.38.48.58.68.7 ppm
7.4534
7.4564
7.4622
7.4652
7.4688
7.4717
7.4778
7.4807
7.8675
7.8711
7.8747
7.8830
7.8865
7.8901
7.8984
7.9020
7.9055
8.5276
8.5363
8.5396
0.9
7
0.4
8
1.0
0
ppm
7.90 ppm
ppm

109
2.3.1.2 Mass spectrum of MDP
A mass spectrum of MDP (Mr = 172.10 (minus anion counter ions)) was taken using
electron spray ionisation (ESI) in positive mode where a mass corresponding to half the
molecular weight of MDP was observed at m/z = 86.0503 as there are two positive charges
(z) on the molecule (Figure 2.7).
Figure 2.7 ESI mass spectrum corresponding to MDP.

110
2.3.2 Hydrolysis of MDP between pH 9 and 14
2.3.2.1 Kinetics
The UV-Vis spectrum of MDP in water is compatible with a recent publication and
shows a maximum absorbance at 258 nm (Figure 2.8)150
. At high pH, using 0.02 M CAPS
buffer solutions at 0.1 M ionic strength at pHs 9.5, 10, 10.5 and 11.0 a reaction occurred as
indicated by the appearance of a chromophore at 366 nm yet between pH 12-14 there was no
observable chromophore at 366 nm. This absorbance changes with time and reaches a
maximum and then decreases indicative of the formation of an unstable intermediate (Scheme
2.37).
200 300 400 500 600 700 800
0.0
0.2
0.4
0.6
0.8
1.0
AB
S
Wavelength (nm)
Figure 2.8 UV-VIS spectrum of MDP at 25oC (1.0 x 10
-4 M) in water.
MDP I Pk1 k2
Scheme 2.37 Proposed kinetic pathway for the hydrolysis of MDP.
The observed consecutive first-order rate constants associated with this biphasic behaviour
were determined as a function of pH. The consecutive reaction was fitted in terms of the
intermediate and the concentration of the intermediate at any time (t) is given by Equation
2.2.

111
[ ]
{ ( ) ( ) }[ ]
Equation 2.2
The pseudo first-order rate constant k1 corresponds to the first phase and appearance of the
chromophore I, is shown by Figure 2.9. A plot of log k1 against pH (slope = 1.8) shows a
second-order dependence (Figure 2.10) on the concentration of hydroxide-ion (as [OH-] = 10
(pH-pKa)) giving a third-order rate constant = 5.47 x 10
4 M
-2 s
-1 whereas that for the second
phase and disappearance of the intermediate k2 is pH independent = 6.0 x 10⁻⁵
s-1
.
0 5 10 15 20 25
0.0
0.1
0.2
0.3
0.4
0.5
0.6
0.7
0.8
AB
S
Time (Hours)
Figure 2.9 Change in absorbance at 366 nm with time for the hydrolysis of MDP (1.0 x 10⁻⁴
M) at pH 10.0 (0.02 M CAPS buffer) I = 0.1 M (KCl) at 25oC. The continuous line shows the
model of Scheme 2.37 fit to data.
The pseudo first-order rate constants were not extrapolated to zero buffer concentration by
altering the buffer concentration as there was no significant buffer catalysis. The total
concentration of CAPS buffer was constant throughout the pH range and at constant ionic
strength.

112
9.4 9.6 9.8 10.0 10.2 10.4 10.6 10.8 11.0 11.2
-4.0
-3.5
-3.0
-2.5
-2.0
-1.5
-1.0
log k
1obs
pH
Figure 2.10 Plot of log k1 against pH for the appearance of a chromophore at 366 nm at I =
0.1 M and at 25oC.
In addition to hydrolysis of MDP in water, the UV-Vis kinetic data of the hydrolysis of MDP
in D2O was slightly faster than that in H2O (kOD > kOH). It is most likely that a solvent isotope
effect has occurred as previous data showed that acid and base catalysed reactions proceeded
more rapidly in D2O than in H2O by an order of 1.3-3.0 as acids are weaker in D2O than H2O
(pKwD2O > pKwH2O), which makes (OD-) a stronger base than (OH
-)
151.
Solvent effects are difficult to interpret as they can be a result of many factors:
(i) Water and deuterium oxide have different solvation properties.
(ii) A primary kinetic isotope effect is observed if an O-H or an O-D bond is broken
in the rate determining step.
Isotopic substitution generally has no significant effect on the qualitative chemical reactivity
of a given process, but a difference in the rate of isotopically substituted reactants is
sometimes observed; this is known as the kinetic isotope effect (KIE)151
. The lowest
quantised vibrational state of a bond is its zero-point energy (ZPE), and the heavier the atom,
the lower the zero-point energy. This is due to a lower frequency of vibration as ZPE = ½
hcω (h = Plank’s constant (6.6 x 10⁻³⁴
J s-1
), c = speed of light, ω = angular frequency) and is
clearly shown by the difference between 1H and
2H (D) in the potential energy diagram
(Figure 2.11)151
.

113
Figure 2.11 Reaction coordinate diagram for the difference in activation energy for C-H and
C-D bond151
.
2.3.3 Hydrolysis products
Hydrolysis at pD 10 in D2O yields pyridine on the disappearance of MDP as shown
by 1H NMR signals at 8.53 ppm (C2/6) which appears to be a doublet (d, J2,3 = 8.40 Hz, 2H).
The peak at 7.88 ppm (C4) is a triplet (t, J4,3 = 7.70 Hz, 1H) and a multiplet at 7.47 ppm (C3/5)
(m, 2H) (Figure 2.12). Using sodium acetate as an internal standard, the changes in signal
intensities with time were used to determine the pseudo first-order rate constants for the
disappearance of MDP and the appearance of pyridine. Those for the latter were biphasic
compatible with a stepwise formation of pyridine. This was also confirmed by monitoring the
formation of pyridine by GC (Figure 2.13).

114
Figure 2.12 MDP hydrolysing to form pyridine at pD 10, I = 1.0 M and 25oC after 2.2 hours.
0 2 4 6 8 10 12
0
5
10
15
20
25
Pyri
din
e (m
M)
Time (Hours)
Figure 2.13 Change in concentration of pyridine with time for the hydrolysis of MDP (1.01 x
10-2
M) at pH 10.0 (0.3 M CAPS buffer) I = 0.1 M (KCl) at 25oC. The continuous line
represents a first-order fit to 1 mole equivalent of pyridine.
7.47.57.67.77.87.98.08.18.28.38.48.58.68.78.88.99.09.19.29.39.49.59.6 ppm
7.4553
7.4572
7.4666
7.4701
7.4819
7.8727
7.8880
7.9035
8.3072
8.3211
8.3347
8.5284
8.5372
8.8370
8.8527
8.8684
9.3390
9.3520
0.2
1
0.1
0
0.7
2
0.1
9
0.3
6
0.5
5

115
A borate buffered solution at pH 9 containing MDP was heated to accelerate the reaction
towards completion and monitored by 1H and
13C NMR. The
1H NMR clearly showed the
production of pyridine (8.53 ppm, dd, J2,3 = 4.35 Hz, J2,4 = 1.60 Hz, 2H), (7.89 ppm, tt, J4,3 =
7.73 Hz, J4,2 = 1.75 Hz, 1H), (7.47 ppm, m, 2H). A 13
C spectrum showed the presence of an
unknown species underneath the water signal at 4.8 ppm, a HSQC confirmed a masked
carbon compound under the H2O 1H spectrum at 81.99 ppm (Figure 2.14) and a
13C DEPT-
135 confirmed it to be a CH2.
Figure 2.14 HSQC of the hydrolysed MDP forming pyridine and the unknown compound in
pH 9 borate buffer, I = 1.0 M at 25oC.
The possibility of formaldehyde forming from the hydrolysis of MDP is relatively high and an
identical buffered solution containing formaldehyde (without MDP) resulted in the 13
C
chemical shift at 82.00 ppm and a 13
C DEPT-135 confirmed the signal to be a CH2 confirming
formaldehyde hydrate (Figure 2.15).
ppm
1.01.52.02.53.03.54.04.55.05.56.06.57.07.58.08.59.09.5 ppm
200
180
160
140
120
100
80
60
40
20

116
Figure 2.15 HSQC of the formaldehyde in pH 9 borate buffer, I = 1.0 M at 25oC.
2.3.4 Intermediate identification
The hydrolysis of MDP showed a maximum UV-Vis absorption at 366 nm which was
shown in Figure 2.9. Investigation of this chromophore was carried out with a solution of
MDP (22 mM) in 1 ml CAPS buffer pH 10, which was incubated at 25°C for 30 minutes
corresponding to the maximum formation of the chromophore after which 2 ml DCM was
added to the solution. The organic layer was separated from the aqueous layer and showed a
UV-Vis absorption at 330 nm (Figure 2.16), presumably corresponding to the intermediate
seen in water with a λmax = 366 nm. There is also an absorption at 252 nm corresponding to
free pyridine. Using a ε = 2000 l.mol.cm-1
for pyridine at 252 nm and an absorbance of 0.503
indicated that 5 mM (1 mole equivalent) of pyridine had been released, assuming the majority
of pyridine had transferred into the DCM which is dependent on its partition coefficient. A
similar compound to MDP which could resemble an intermediate is N-methylpyridinium
chloride, the UV-Vis spectrum at pH 10 showed a chromophore at 258 nm and not 366 nm
which eliminates N-methylpyridinium as a possible intermediate (Figure 2.17). In addition to
the UV-Vis data a GC-MS showed an m-1= 108 corresponding to the mass of the
intermediate (Figure 2.18).
ppm
12345678910 ppm
220
200
180
160
140
120
100
80
60
40
20

117
200 300 400 500
0
1
2
3
4
AB
S
Wavelength (nm)
Figure 2.16 UV-VIS spectrum at 25oC of MDP (22.0 x 10
-3 M) in CAPS buffer pH 10 and
then extracted into DCM after 30 minutes.
200 300 400 500 600 700 800
0.0
0.1
0.2
0.3
0.4
0.5
0.6
0.7
0.8
0.9
1.0
AB
S
Wavelength (nm)
Figure 2.17 UV-VIS spectrum at 25oC of N-methylpyridinium (1.0 x 10
-4 M) in 0.02 M
CAPS buffer pH 10.

118
Figure 2.18 MS from GC peak showing the formation of the intermediate m-1 = 108.

119
2.3.5 Mechanism of hydrolysis
A reaction scheme compatible with these observations is shown in Scheme 2.38. It is
known that some substitution reactions of pyridines and azines proceed by initial nucleophilic
addition to the ring to form a 1:1 σ-adduct via a nucleophilic aromatic substitution addition-
elimination (SNAr-AE) or a nucleophilic aromatic substitution elimination-addition (SNAr-
EA) mechanism135
. It also appears that some substitution reactions previously thought to
occur by an aryne-type mechanism actually involve ring opening of the 1:1 σ-adduct followed
by ring closure commonly known as the Addition of Nucleophile, Ring Opening and Ring
Closure (SN(ANRORC)) mechanism which was first observed mechanistically by Van der
Plas135, 152
.
The first step within the SN(ANRORC) mechanism involves addition of a nucleophile at the
C2 position producing the 1:1 σ-adduct, although it may be sterically inhibited by having large
substituents on the ring152
. The proposed species then undergoes ring-opening and expulsion
of the first pyridine to generate the conjugated unsaturated imino-aldehyde I which is the
chromophore observed at 366 nm. The unsaturated iminno-aldehyde undergoes ring closure
to produce the second molar equivalent of pyridine and formaldehyde Scheme 2.38. At high
pH the chromophore is not observed as the intermediate is in resonance between the imine
and immonium ion (Scheme 2.39 i, ii) and hydroxide attacks quicker than the rate of
formation of the intermediate (k5).
N+ N+H2C N N+
H2C
HO H
N N+H2C
-O H
N NCH2
OH
+NH2N
OH
+ CH2O
-OH
H2O
I
k1
k-1
k2
k-3k3
k4
-OH
k-2
OH-
k5N
H2C
O-
OH
H
Scheme 2.38 Hydrolytic mechanism of MDP at high pH.
N CH2
O
H
i
N+ CH2
O-
ii
H
Scheme 2.39 Resonance between the imine and the immonium ion.

120
2.3.6 Hydrolysis products of MDP below pH 9
The chromophore at 366 nm was not observed below pH 9 but the reactions of MDP
at lower pH/pD could be monitored in D2O by the changes in the 1H and
13C NMR spectra.
Under pseudo first-order conditions in 1.0 M and 0.1 M DCl at 25oC MDP remained
unchanged after 4 weeks and at 50oC after 2 weeks which shows remarkable stability of MDP
dication in solution.
After 2.4 weeks of MDP incubation at 25oC at pD 8.0 (I = 1.0 M) the
1H NMR signals of
MDP at 9.40 ppm (C2/6) (dd, J2,3 = 6.90 Hz, J2,4 = 1.25 Hz), 8.85 ppm (C4) (dt, J4,3 = 7.88 Hz,
J4,2 = 1.5 Hz, 2H) and 8.33 ppm (C3/5) (d, J4,3 = 7.90 Hz, 4H) hydrolyse to show the
appearance of pyridine at 8.55 (C2,6) (dd, J2,3 = 4.35 Hz, J2,4 = 1.63 Hz), 7.92 (C4) (dt, J4,3 =
7.70 Hz, J4,2 = 1.6 Hz, 1H) and 7.47 (C3,5) ppm (m, 2H). The signals at 9.01 ppm (C2/6) (d, J2,3
= 6.45 Hz), 8.63 ppm (C4) (dt, J4,3 = 7.85 Hz, J4,2 = 1.43 Hz, 1H) and 8.14 (C3/5) (t, J3,4 = 5.73
Hz, 2H) ppm are compatible with the formation of N-hydroxymethyl pyridinium-ion (Scheme
2.40) although the hydroxymethyl group was not visable due to it being deuterated (Figure
2.19) and splitting is lost due to other protons being exchanged with deuterium in MDP,
pyridine and N-hydroxymethyl pyridinium.
MDP N+ CH2OH +
N
Scheme 2.40 Formation of N-hydroxymethyl pyridinium-ion from the hydrolysis MDP at low
pH/pD.
A HSQC spectrum correlated the protons of N-hydroxymethyl pyridinium ion to its respective
carbon which showed that the compound is hybrid between MDP and pyridine as shown by
the Figure 2.20.

121
Figure 2.19 1H spectrum of the hydrolysis of MDP to form pyridine and N-hydroxymethyl
pyridinium-ion at pD 8.0 (I = 1.0 M) at 25oC after 2.4 weeks.
Figure 2.20 HSQC hydrolysis of MDP at pD 8.0 (I = 1.0 M) at 25oC after 2.4 weeks.
7.57.67.77.87.98.08.18.28.38.48.58.68.78.88.99.09.19.29.39.49.5 ppm
7.4886
7.4918
7.4957
7.5004
7.5041
7.5072
7.5111
7.5159
7.9082
7.9114
7.9147
7.9236
7.9270
7.9302
7.9423
7.9455
8.1330
8.1433
8.1559
8.3258
8.3322
8.3358
8.3377
8.3416
8.3481
8.3512
8.5425
8.5457
8.5493
8.5544
8.5577
8.6130
8.6156
8.6186
8.6287
8.6313
8.6343
8.6441
8.6470
8.6500
8.8362
8.8393
8.8520
8.8550
8.8678
8.8708
9.0047
9.0056
9.0069
9.0107
9.0171
9.0185
9.3922
9.3946
9.3970
9.4007
9.4058
9.4084
0.2
1
0.1
0
0.2
5
0.4
8
0.1
1
0.1
2
0.2
4
0.1
4
0.1
3
ppm
7.27.47.67.88.08.28.48.68.89.09.29.49.6 ppm
120
125
130
135
140
145
150
155

122
2.3.7 Summary
2.3.7.1 Overall pH-rate profile
The pseudo first-order rate constants obtained using the analytical techniques above
were used to produce a pH-rate profile (log kobs against pH) for the hydrolysis of MDP (Figure
2.21).
5 6 7 8 9 10 11
-9
-8
-7
-6
-5
-4
-3
-2
-1
0
k1 (Apperance of intermediate)
k2 (Loss of intermediate)
k2 (Loss of MDP or apperance of pyr)
log k
obs (
s-1)
pH
Figure 2.21 pH-rate profile of the hydrolysis of MDP which show the two different pathways.
Below pH 9 the pathway is first-order (○ and ◑, k2) and above pH 9 is second-order (■, k1).
The pH-rate profile shows three different events which take place over a pH range of 6-11.
Below pH 9 the pH-rate profile of k2 shows a first-order linear dependence on hydroxide-ion
concentration but above pH 9 becomes the rate becomes pH independent. The hydrolysis rate
constant, k1 shows a second-order dependence in hydroxide-ion concentration and assuming
the reaction pathway given in Scheme 2.41 a steady state approximation can be used
(Equation 2.3).
MDP Mk2 OH-k1 OH-
k-1
P
Scheme 2.41 Proposed degradation pathway of MDP.

123
[ ]
[ ][
] [ ][ ] [ ]
[ ][ ] [
][ ] [ ]
Equation 2.3
Solving for [M] using Equation 2.3 leads to the rate law:
[ ] [
][ ]
[ ]
[ ]
[
][ ]
[ ]
[
] [ ]
[ ]
Equation 2.4
Therefore if k-1 >> k2[OH-] in Scheme 2.42,
[ ]
[
] making k2 the
rate limiting step and the observed rate second-order in hydroxide-ion concentration. At high
[OH-], if k2[OH
-] >> k-1,the [
] i.e. a first-order dependence on hydroxide-ion
concentration, there could be a change in rate limiting step to k1. At lower [OH-] (< pH 9) the
rate of MDP disappearance or appearance of pyridine is first-order in hydroxide-ion
concentration and corresponds to a change in mechanism to give N-hydroxymethyl
pyridinium (Scheme 2.42).
N+
N+H2
C N N+H2
C
HO H
N N+H2
C
-O H
N NCH2
OH
+NH2N
OH
+ CH2O
-OH
H2O
I
k1
k-1
k2
k-3 k3
k4
-OHk-2
OH-
k5N
H2
C
O-
OH
N
N+
HOD2C
+
N + CD2O
OD-
M
H
Scheme 2.42 Proposed mechanism of hydrolysis of MDP.

124
2.3.8 D-exchange
A compound’s pKa is an important physicochemical property and its determination
for strong acids/weak bases is relatively easy between the pH regions of 2-10. Conventional
methods for determining the pKa of a compound include UV-Vis spectroscopy, providing the
compound contains a chromophore, and NMR spectroscopy, but potentiometric titration has
been the standard method for many years.
Many carbon acids have very high pKa values and an alternative to the above methods
involves a measurement of a kinetic pKa. The acidity constant (Ka) is the ratio of rate
constants of the forward (kf, M-1
s-1
) and reverse (kr, s-1
) directions of an equilibrium process
(Scheme 2.43).
HA H+
+ A-
kf
kr
Scheme 2.43 Deprotonation of a simple acid.
A technique to calculate the forward rate constant is by using isotopic exchange techniques
which can be followed by mass spectrometry or NMR. Commonly a proton is replaced by a
deuterium atom although this process can be investigated in reverse. Deuterium oxide is
usually present in excess compared with the non-deuterated carbon acid or compound of
interest. In basic solution, deprotonation occurs when a deuteroxide ion removes a proton
producing HOD and the carbanion which is then captured by a deuteron153, 154
. For example, a
carbonyl compound yields an enolate anion and if k2 (D2O) > k-1 (HOD) then the rate of
deuteration corresponds to the rate of the formation of the carbanion (Scheme 2.44).
-OD
-
DO
DO
H
H
HR
O
H
HR
O
D
H
HR
k1 (OD-)
k-1 (HOD)
k2 (D2O)
Scheme 2.44 Deprotonation of a carbon acid by deuterium oxide-ion154
.

125
In water, carbon acids may undergo deprotonation by the solvent (Scheme 2.45, i), by a buffer
base (Scheme 2.45, ii), or by hydroxide ion (Scheme 2.45, iii). In general it is expected that
the stronger a carbon acid is the more likely it is that deprotonation will occur by solvent or
by buffer rather than by hydroxide ion at lower pHs.
C H
C H
C H
+
+
+
H2O
B
-OH
kw
kH [H+]
kB
kBH [BH+]
kOH
kH2O
C-
C-
C-
+
+
+
H3O+
BH+
H2O
i
ii
iii
Scheme 2.45 Deprotonation of the carbon acid by the solvent, buffer base or hydroxide-ion.
Conversely, weak carbon acids, particularly those giving charge localised carbanions and
subject to internal return in the initially formed ion-pair, may only show observable
deprotonation by strong bases such as hydroxide-ions154
. Once deprotonation occurs by the
solvent, buffer or hydroxide-ion when k2 > k-1 an INT-H carbanion intermediate is formed.
The reaction can then proceed either by regenerating the initial carbon acid and base, (k-1) or
can exchange the BH with BD within the bulk solvent to form INT-D which then would form
the C-D bond of the carbon acid (Scheme 2.46)155
.
C H + B-
k1
k-1
C-
H B
INT-H
k2
k-2
C-
D B
INT-D
C D + B-
Scheme 2.46 Deprotonation of a carbon acid stabilised by internal return mechanism155
.

126
2.3.8.1 Methylene D-exchange
It was anticipated that the central methylene of 1,1′-methylenebis-pyridinium dication
(MDP) would be a moderately strong carbon acid as ionisation yields what appears to be a
fairly stable carbanion ylide (Figure 2.22).
The rate of exchange for deuterium of the methylene of 1,1′-methylenebis-pyridinium
dication (MDP) in buffered D2O (pD 7.20–10) at 25 °C and I = 1.0 M (KCl) was followed by
1H NMR spectroscopy at 500 MHz. Deuterium exchange results in the disappearance of the
singlet at 7.47 ± 0.03 ppm due to the CH2 group of the substrate and the appearance of a
poorly resolved upfield-shifted triplet at 7.46 ± 0.03 ppm due to the CHD group of the
initially-formed mono-deuterated product. The loss of the methylene signal, which required
deconvoluting, followed first-order kinetics and the associated first-order rate constants kobsd
(s−1
) were determined at pD 7.20-10.0, maintained at various phosphate and CAPS buffer
concentrations at I = 1.0 M.
Figure 2.22 Methylene peak of MDP in phosphate buffer after 2 days at pD 7.2 at 25oC (I =
1.0 M).
There was a small amount of buffer catalysis of the D-exchange reaction and the observed
pseudo-first-order rate constants kobsd (s−1
) were plotted against the buffer concentration to
give the buffer independent rate constant kint (s−1
) at zero buffer concentration (Equation 2.5).
A plot of kint against the deuteroxide-ion concentration [OD−], calculated from Equation 2.6
where pKw = 14.87156
is linear and the slope of which gives the second-order rate constant for
exchange of the methylene proton of MDP catalysed by OD− kOD = 297.1 ± 23.1 dm
3 mol
−1 s
−1
(Figure 2.23).
7.4407.4457.4507.4557.4607.4657.4707.4757.4807.4857.4907.4957.5007.5057.510 ppm
7.4663
7.4699
7.4740
7.4796
0.5
5

127
[ ] [ ]
Equation 2.5
[ ]
Equation 2.6
Furthermore, the intercept was indistinguishable from zero, indicating an insignificant, pD
independent, water catalysed D-exchange reaction. This was confirmed by there being no
detectable D-exchange of MDP in 1.0 M and 0.1 M DCl/D2O at 25°C after 7.5 weeks,
indicating that the rate constant kw (Scheme 2.45, i) for the spontaneous deprotonation of
MDP is < 4.38 x 10⁻⁹
s−1
, assuming less than 2% exchange.
0.0 2.0x10⁻⁶
4.0x10⁻⁶
6.0x10⁻⁶
8.0x10⁻⁶
1.0x10⁻⁵
1.2x10⁻⁵
1.4x10⁻⁵
0.0
1.0x10⁻³
2.0x10⁻³
3.0x10⁻³
4.0x10⁻³
-8.0 -7.5 -7.0 -6.5 -6.0 -5.5 -5.0 -4.5
-5.5
-5.0
-4.5
-4.0
-3.5
-3.0
-2.5
-2.0
k int (
s-1)
[-OD]
log k
int (
s-1)
log [-OD]
Figure 2.23 Plot of kint against deuteroxide-ion concentration to give a second-order rate
constant for the CH2 exchange of MDP and a log-log plot (below).
The fact that there is no detectable spontaneous deprotonation of MDP (Scheme 2.45, i)
indicates that its pKa must be > 17 as the equilibrium constant for ionisation is the ratio of the
deprotonation rate < 4.38 x 10⁻⁹
s−1
to the protonation rate of the carbanion by D+ which is
expected157
to be near diffusion controlled kD ≈ 109 M
-1 s
−1. The buffer catalysed
deprotonation of MDP by DPO42−
and CAPS in D2O can also be used to estimate the pKa of
MDP from the rate constants for its deprotonation by a buffer base (Scheme 2.45, ii) to give
the free carbanion (kB) and for the reverse protonation of the carbanion by the conjugate acid
of this base (kBH) according to Equation 2.7, where pKBH is the pKa of the buffer base.

128
( )
Equation 2.7
The second-order rate constant for the deprotonation of MDP by DPO42−
in D2O is kB = 4.86 ×
10−6
M−1
s−1
, and it can be assumed that the rate constant for HPO42−
in H2O would be very
similar because the kinetic solvent isotope effect for this type of reaction is close to unity.
Combining this value of kB with the upper limit of kBH ≈ 109 M
−1 s
−1 for the diffusion-limited
reverse protonation of the carbanion by H2PO4− and the value pKBH = 6.5 for H2PO4
− in H2O
(I = 1.0M)158
gives pKa = 20.8 for the methylene ionisation of MDP in H2O. The data using
CAPS buffer (pKa = 10.15 in H2O, I = 1.0 M) give kB = 3.36 × 10⁻³
M−1
s−1
, from which a
similar calculation yields pKa = 21.6, giving a mean value of 21.2. The maximum value of
the rate of reprotonation of the carbanion by water (limited by solvent reorganisation) is 1011
s−1
, which can be combined with the observed second-order rate constant for exchange of the
methylene proton of MDP catalysed by DO− (kOD = 297 M
−1 s
−1; Scheme 2.45, iii) to give an
MDP carbon acid pKa of ≤ 22.5, in reasonable agreement with that obtained from the buffer-
catalysed rate constants.
To compare MDP with N-methyl pyridinium, the rates of D-exchange in 0.1 M and 1 M
NaOD/D2O (I = 1.0M) under pseudo first-order conditions at 25oC was determined. The
1H
NMR showed the methyl group of N-methyl pyridinium as a singlet at 4.41 ppm. A broad
triplet (Figure 2.24) was observed after 1 week confirming that one proton had exchanged
with a deuteron forming CH2D (Scheme 2.47). The deuterium exchange rate of a single
hydrogen for deuteron of the methyl group was obtained by deconvoluting the singlet at 4.41
ppm.

129
Figure 2.24 Methyl group of N-methylpyridinium becoming CH2D in 1.0 M NaOD/D2O
solution at 25oC after 1week.
N+
CH3
N+
CH2D
Scheme 2.47 N-methylpyridinium becoming CH2D.
The appearance of another set of signals in 1.0 M NaOD/D2O solution appeared after 4.7
weeks (Figure 2.25). A quintet up-field from the triplet is the most likely to be associated
with a second proton being exchanged for deuterium, as no signals would appear if all three
protons exchanged for deuterium to form CD3 in a 1H NMR.
4.364.374.384.394.404.414.424.434.444.45 ppm
4.3920
4.3960
4.4001
4.4101
8.5
3

130
Figure 2.25 Methyl group of N-methylpyridinium becoming CD2H in 1.0 M D2O/NaOD at
25oC after 4.7 weeks.
The second-order rate constant for deprotonation of N-methylpyridinium ion to form CH2D
(Scheme 2.48, iii) by deuteroxide ion at 25 °C (kOD = 4.74 × 10⁻⁷
M−1
s−1
) is much smaller
than that for MDP. The calculation of the pKa of N-methylpyridinium ion from this value
requires knowledge of the rate constant kH2O for the reverse reaction, the protonation of the
carbanion by solvent water (Scheme 2.45, iii). If the pKa of N-methylpyridinium ion is >25, it
is likely159
that kH2O ≈ 1010
s−1
, giving an estimated pKa of 30.3 for N-methylpyridinium ion in
water, again assuming no significant isotope effect and using pKw = 14.0156
. Deuterium
exchange of the methyl hydrogens of tetramethylammonium ion is not observed in 1.0 M
deuteroxide solution over several weeks160
, which may indicate that the zwitterionic ylidic
conjugate base of N-methylpyridinium ion is relatively stabilized by the aromatic pyridinium
ring compared with that of Me4N+ or that Me4N
+ is additionally stabilized.
H
H3N+ CO2Me
H
H
Me3N+ CO2Me
HN+
CH3
ii iiii
Scheme 2.48 Methyl pyridinium (i), N-protonated glycine methyl ester (ii) and N-quaternary
cationic methyl glycine ester (iii).
4.344.354.364.374.384.394.404.414.424.434.444.45 ppm
4.3745
4.3784
4.3824
4.3866
4.3923
4.3965
4.4006
4.4106
4.3
8

131
The value kB = 4.86 × 10⁻⁶
M−1
s−1
for deprotonation of MDP by DPO42−
is ca. 10-fold larger
than the value kB = 5.6 × 10⁻⁷
M−1
s−1
for carbon deprotonation of N-protonated glycine
methyl ester (Scheme 2.48, ii) by the same base; for N-protonated glycine methyl ester the
carbon acid pKa in water is 21.0161
. The second-order rate constant kOD = 297 M−1
s−1
for
deprotonation of MDP by deuteroxide-ion can be compared with those for some monocationic
carbon acids. The kOD values for deprotonation of N-protonated glycine methyl ester and the
quaternary cation (Scheme 2.48, iii) are 6.0 and 570 M−1
s−1
, respectively145
. The kinetic
acidities for the carbon ionization of N-protonated glycine methyl ester and (Scheme 2.48, iii)
in water are pKa = 18.0 and 21.0, respectively145
.
The unusual stability of the central methylene which is attached to two hetero-atoms must
bring about the stability and slow hydrolysis rates of MDP. This behaviour has been reported
in XCH2Y systems where X and Y are first-row substituents such as N, O and F162
. The
anomeric effect which may have contributing factors such as no bond resonance and negative
hyperconjugation have been associated with this phenomenon, Brockway had observed that
CF bonds are shorter (60 pm) when going from CH3F to CF4 and that di-fluorinated species
are much more stable than mono-fluorinated carbon species163
. This shortening had
strengthened the bond which involves double bond-no bond resonance (Scheme 2.49).
F C F
H
H
F- C F+
H
H
+F C F-
H
H
Scheme 2.49 Hyperconjugation of CH2F2162
.
In addition to the bond shortening of the anomeric effect, electrostatic interactions C--N
+ and
C+-F
- shorten bonds although the H2C-N bond length in MDP of 147 pm is not significantly
different from the 146-148 pm seen in N-methylpyridinium ions164, 165
.
2.3.8.2 Deuterium exchange of MDP ring protons
Previous work has shown that protons of N-heterocyclic compounds can exchange
with deuterium which may be aided by the presence of acid and base166
. Pyridine protons
exchange with deuterium under harsh conditions (10% NaOD, 200oC) at positions 2 and 6
whereas activated derivatives such as pyridine N-oxide, 3-chloropyridine and 3,5-
dichrolopyrine have been described to exchange under milder conditions. Under these
conditions exchange at positions 2 and 6 occurs fastest, followed by positions 3 and 5 with
position 4 being the least susceptible to H/D exchange. 167, 168
.

132
A similar compound to one of the precursors within the reaction Scheme 2.50 is N-
methylpyridinium which has shown rapid exchange of hydrogen by deuterium at positions 2
and 6 at 75oC (I = 1.0 M)
154.
In addition to the methylene protons exchanging for deuterium in MDP the pyridinium ring
protons at positions 2 and 6 also exchange for deuterium in solutions of D2O. The rate of this
was determined in buffered D2O (pD 7.20–10) at 25°C and I = 1.0 M (KCl) and followed by
1H NMR spectroscopy at 500 MHz either by using protons C3/5, C4 of the pyridinium ring as a
reference. There was negligible buffer catalysis of the D-exchange reaction (Equation 2.5)
and a plot of the log of the observed first-order rate constants against pD were linear and of
slope near unity (Figure 2.26), indicative of a rate first-order in deuteroxide-ion concentration
with a second-order rate constant kOD = 2.84 M−1
s−1
.
7.0 7.5 8.0 8.5 9.0 9.5 10.0
-8.0
-7.5
-7.0
-6.5
-6.0
-5.5
-5.0
-4.5
-4.0
log k
obs (
s-1)
pD
Figure 2.26 Plot of log kobs against pD for the H/D exchange at position 2 and 6 of the
pyridinium ring of MDP at 25oC (I = 1.0 M).
This value at 25°C is about two orders of magnitude greater than that for the similar reaction
of N-phenylpyridinium-ion, kOD = 5.4 x 10⁻²
M−1
s−1
at 50°C, and about 10-fold greater than
that for N-methylpyridinium ion at 75°C154
. The exchange of the pyridinium ion ring protons
probably occurs through the intermediate formation of a zwitterion (Scheme 2.50).

133
N+ N+H2C N+ N+
H-
C N+ N+D2C
C-
N+ N+D2CN+ N+
D2C
D
D
D
D
-OD D2O
-OD
D2O
Scheme 2.50 Deuteration of the methylene group and of C2/6 of the pyridinium ring.
134
2.3.9 Conclusion
Although 1,1′-methylenebis(pyridinium) dication (MDP) has two formal positively
charged substituents attached to a central carbon, it is remarkably stable to hydrolysis at low
pH (<7). It undergoes a complex series of reactions that vary with pH. Below pH 7 there is a
very slow degradation (e.g., at pH 7 and 25°C it has a half-life of about 10 weeks) that is first-
order in hydroxide-ion, liberates only one equivalent of pyridine, and forms N-
(hydroxymethyl) pyridinium ion.
Above pH 9 there is a change in the reaction pathway, with expulsion of one of the pyridines
and the formation of an unsaturated iminoaldehyde intermediate which is observed at 366 nm
in water by UV-Vis between pH 9-12. This intermediate is formed by an ANRORC-type
mechanism that involves opening the other pyridine ring. This intermediate subsequently
undergoes ring closure back to pyridine with formation of formaldehyde hydrate. The rate of
the first phase is second-order in hydroxide-ion, while the second is pH-independent.
Deuterium exchange of the central methylene in D2O is faster than the breakdown of MDP
and is predominantly OD–-catalysed with a small amount of buffer catalysis. The estimated
pKa of MDP dication in H2O is unexpectedly high at 21.2 at 25°C and I = 1.0 M (KCl),
compared with an estimated value of 30.3 for the monocationic N-methylpyridinium ion.
Deuterium exchange also occurs at the 2 and 6 positions of the pyridinium rings, but at a
lower rate that is first-order in deuteroxide-ion and only competitive with the breakdown of
MDP below pD 11.

135
Chapter 3 – β-LACTAMASES
3 History
At St. Mary’s Hospital, London, in 1928, Sir Alexander Fleming noticed partial lysis
of colonies of Staphylococci on a plate which had been contaminated by Penicillium notatum.
Attempts at separating the active substance were abandoned as it was unstable, but in 1940, E.
Chain and H. Florey were able to isolate the crude active substance, penicillin. It was used
for a preliminary clinical trial in 1941, and represented a turning point in the struggle against
pathogenic bacteria169
.

136
The β-lactam ring (Figure 3.1) within penicillin was not accepted as part of the chemical
structure until an x-ray crystallographic image was produced in 1943170
.
NH
R
O
Figure 3.1 β-lactam ring.
All β-lactam antibiotics contain a β-lactam ring but are classified dependent on the ring
structure attached to the β-lactam ring (Scheme 3.1)170
.
These include penams (1) which contain thiazolidine rings such as those found in penicillins,
cephems (2) containing thiazine rings, cephamycins (3), oxacephems (4) and penems (5)
containing thiazole rings. Oxapenams (6) which contain oxazolidine rings such as clavulanic
acid, carbapenems (7), nocardicins (8), monobactams (9) are compounds which have no ring
fused to the ring and ɣ-lactams such as lactivicin (10) (Scheme 3.1).
N
SRCONH
O
COOH
N
RCONH
O
S
X
COOH
N
RCONH
O
S
X
COOH
OCH3
N
RCONH
O
O
X
COOH
N
SRCONH
O
COOH
R
N
O
O
COOH
CH2OH
N
O
COOH
SCH2CH2NH2
CH
H3C
HO
N
RCONH
O SO3H
N
RCONH
O
COOH
OH
(1) (2) (3)
(4) (5) (6)
(7) (8) (9)
N
O
O
RCONH
O
O
HOOC
(10)
Scheme 3.1 Some β-lactam antibiotics (1-9)170
.

137
3.1 Antibiotics and bacteria
Antibiotics can be bactericidal or bacteriostatic and work by interfering with
intracellular functions which may be endogenous or exogenous. When targeting any invasive
agent such as bacteria (prokaryotes) within humans (eukaryotes), the larger the difference
between the two types, of cell the greater the selectivity that can be achieved, thus reducing
damage to prokaryotic cells.
Common targets for bacterial cells are cell metabolism inhibition, inhibition of protein
synthesis, inhibition of the cell wall and inhibition of transcription and replication.
β-Lactams inhibit cell wall synthesis causing bacterial lyses due to changes in osmotic
potential, but a slight difference in the cell wall structure of Gram-negative bacteria makes β-
lactam antibiotics less effective towards them compared with Gram-positive bacteria (Figure
3.2).
Figure 3.2 Gram-positive bacterial cell wall.

138
The Gram-positive bacterial cell wall (Figure 3.2) contains multiple layers of murein
(peptidoglycan) which is also present in Gram-negative bacteria, sandwiched between the
inner and outer lipid bilayers, but in addition there is a lipopolysaccharide layer which proves
to be a better barrier against antibiotics (Figure 3.3).
Figure 3.3 Gram-negative bacterial cell wall.
3.1.1 Peptidoglycan layer biosynthesis
Biosynthesis of peptidoglycan begins in the cytoplasm using N-acetylglucosamine-1-
phosphate and uridine triphosphate (UTP) forming UDP-N-acetylglucosamine which is
catalysed by a transferase enzyme. The nucleotide reacts with a phosphoenolpyruvate which
undergoes reduction to form UDP-N-acetyl muramic acid which is an amino acid derivative
only found in the peptidogylcan cell walls171
.
L-Alanine is added to the carboxyl group of UDP-N-acetyl muramic acid followed by D-
glutamic acid then either L-lysine or meso-diaminopimelic acid which is completed with the
addition of the dipeptide, D-alanyl-D-alanine (D-ala-D-ala)171
.
The UDP-N-acetyl muramic pentapeptide is translocated to a lipid carrier (bactoprenol)
located in the cytoplasmic membrane where N-acetylglucosamine (NAG) is transferred to the
complex to form bactoprenol-N-acetylglucosamine-N-acetylmuramic acid-penta-peptide.
This complex moves across the membrane to lie on the outside of the cell172
.

139
Adjacent glycan strands are cross linked to form the rigid cell wall. The enzyme
transpeptidase contains a serine residue to cleave the terminal D-alanine residue forming an
acyl-enzyme intermediate. The cross-linking peptide deacylates the intermediate by
nucleophillic attack which in Gram-negative bacteria occurs via the γ-amino group of lysine
but in Gram-positive bacteria via the ε-amino group of lysine which bridges five glycine
residues across the glycan stands.
3.1.2 Penicillin mode of action
Penicillin and cephalosporins inactivate the transpeptidase enzyme which is
responsible for the cross-linking of the cell wall. The structure of penicillin (Figure 3.4,
black) and cephalosporins resemble that of D-ala-D-ala side chain (Figure 3.4, blue) which is
cleaved to form a stable acyl-enzyme intermediate sterically hindering subsequent
nucleophillic attack173
.
N
HN
O
S
H
O
OH
R
O HN
HN
O
O
OH
O
Figure 3.4 Superimposed D-ala-D-ala with penicillin.
HN
COO-
CH3
CH3RCONH
-OO-Enz
CH3RCONH
ONH-Peptide
CH3RCONH
O
Aminolysis of acyl-enzyme intermediate
NH2-Peptide
Enz-OHTranspeptidase
+H
2N
COO-
CH3
i
N
COO-
RCONH
-O
Enz-O
S
Enz-OHTranspeptidase
HN
COO-
RCONH
O
S
O-Enz
Stable acyl-enzyme,reaction inhibited ii
Enz-O
HN
COO-
CH3
CH3RCONH
O
Enz-OH
N
COO-
RCONH
O
S
Enz-OH
Scheme 3.2 Transpeptidase reaction of D-ala-D-ala (i) compared to penicillin (ii).

140
In both mechanisms the first step involves a serine residue attacking a carbonyl group to form
an acyl-enzyme intermediate. Formation of the cross linked cell wall involves attack of a
NH2-peptide on the acyl-enzyme intermediate to form the rigid cell wall and the enzyme is
released (Scheme 3.2, i). Penicillin however attaches to the enzyme within the active site as
the acyl-enzyme which sterically hinders the incoming peptide and prevents release of the
enzyme (Scheme 3.2, ii).
3.1.3 Antibiotic resistance
Without doubt antibiotics have been the most successful drugs deployed over the past
100 years, but over prescribing by physicians, veterinarians and use within agriculture have
caused microbes to develop mechanisms to resist the action of β-lactam antibiotics. Many
resistant elements are readily passed on both vertically and horizontally from one bacteria to
another and with affordable global travel, resistance is inevitably able to spread through
microbial populations across the world174
.
There are many mechanisms which confer resistance but the most common is the ability of
bacteria to produce β-lactamase enzymes which rapidly catalyse the hydrolysis of the β-
lactam.
A recent metallo-β-lactamase, New Delhi metallo-β-lactamase (NDM-1) was first found in
Klebsiella pneumonia in 2008 when a Swedish resident visited India. The gene for the
enzyme was increasingly found in E.coli, a major cause of diarrhoea due to inadequate
sanitation and environmental contamination with faecal matter. The transfer of these resistant
genes is mainly responsible for increased antibiotic resistant infections175
.
Vertical gene transfer involves transfer of genetic information from generation to generation
i.e. from parent to offspring during replication whilst horizontal gene transfer involves genetic
information to be passed one bacterium to another by transformation, transduction or
conjugation176
.

141
3.1.3.1 Transformation
Transformation is the ability of a bacterial cell to take-up genetic information usually
DNA on lysis of another organism and incooperate the naked DNA into its own genome or
plasmid (Figure 3.5)176, 177
.
Figure 3.5 Mechanism of bacterial transformation177
.
3.1.3.2 Transduction
Transduction involves the introduction of exogenous DNA into a bacterial cell by a
bacterial phage (usually a virus), once injected, the DNA can incorporate itself into the
chromosomal DNA (Figure 3.6)176, 177
.
Figure 3.6 Mechanism of transduction by a bacteriophage177
.
3.1.3.3 Conjugation
Conjugation is the last method of horizontal gene transfer which bacteria may use to
transfer genetic information. The F factor (fertility factor) is a sequence of DNA which
enables the cell to act as a donor during conjugation. This F factor can be taken-up from an
independent replicating plasmid or is already in the chromosomal DNA, if the bacterium
contains this F factor they are known as F+ and those who lack the factor are F
-. The F
+
bacterial cells produce sex pili which bind to the recipient’s cell forming a cytoplasmic
mating bridge where genetic information such as transposons (genetic information which can
change position within a genome) can be transferred to a plasmid (Figure 3.7)176
.

142
Figure 3.7 Conjugation mechanism of genetic information transfer177
.
3.1.4 Mechanisms of antibacterial resistance
Mechanisms which microbes have evolved include efflux pumps (or decreased entry),
target modification and chemical modification174
.
3.1.4.1 Efflux pumps
Protein pumps within the membrane actively pump out the antibiotic faster than it can
diffuse and accumulate in the cell to a therapeutic level. The bacteria may also change/alter
the cytoplasmic membrane permeability to the drug lowering the total concentration within
the cell174
.
3.1.4.2 Target modification and pathway alteration
A bacterial cell may alter its target active site where usually the antibiotic would bind
but a slight change in conformation or amino acid residues would render the antibiotic
inactive and the target modification may be by chance i.e. a single point mutation178
.
3.1.4.3 Chemical modification
The most efficient means of chemical modification is with the use of a catalyst such
as an enzyme. β-Lactamases are secreted into the periplasm (Gram-negative) and outer
membrane (Gram-positive) and hydrolytically deactivates the β-lactam ring. The β-lactam
ring is readily opened rendering the antibiotic inactive179
.

143
3.1.5 β-Lactamases
β-Lactamases are the most common cause of bacterial resistance to β-lactam
antibiotics. Benzylpenicillin (penicillin G) was the first compound used for clinical use which
was effective against Gram-positive bacteria but after only three years resistance was
observed180
.
Bush-Jacoby-Medeiros in 1995 devised a classification through groups 1 to 4 (Table 3.1)
based on substrate and inhibitor profiles but the more popular Ambler classification divides β-
lactamases into four distinctive groups dependent on their amino acid sequences A, B, C and
D (Figure 3.8)181
.
Figure 3.8 Ambler classification system181
.
β-lactamases
Serine
Class B
(Metallo)
Class A
Class C
Class D
Unnamed
Subclass B3
Subclass B1
Subclass B2
Hydrolyses β-
lactam
antibiotics
No homology,
different mechanism
of hydrolysis
Structural homology,
no sequence
homology
Sequence homology

144
Ambler
Classification
Bush-Jacoby-
Medeiros Class
Substrates Representative
enzymes
A 2a Penicillins PC1
2b Penicillins, Cephalosporins TEM-1, TEM2,
SIV-1
2be Penicillins, Cephalosporins,
Monobactams
TEM-3, SIV-2,
VEB-1
2br Penicillins TEM-30, SHV-10
2c Penicillins PSE-1, CARB-3
2e Cephalosporins CepA
2f Penicillins, Cephalosporins,
Carbapenems
KPC-2, IMI-1,
SME-1
B 3 β-lactams including
carbapenems
CcrA, IMP-1,
BcII, IND-1
C 1 Cephalosporins MIR-1, FOX-1
D 2d Penicillins, Cloxacillin OXA-1, OXA-10
Table 3.1 Classification of the Bush-Jacoby-Medeiros and Ambler scheme182
.
The Bush-Jacoby-Medeiros class also has a fourth group (group 4) which does not appear in
the Ambler classification, the enzymes of this class may be included in an existing
classification as they have not be well characterised such as Pseudomonas cepacia182
.

145
3.1.6 Serine β-Lactamases
3.1.6.1 Class A β-Lactamases
Class A β-lactamases use an active-site serine to hydrolyse the β-lactam ring of
antibiotics. This class was the first to be identified in bacteria just after the clinical
introduction of penicillin. The first plasmid mediated β-lactamase was identified in E.coli in
1963 (reported in 1965) and has been characterised as penicillinases as they are good at
hydrolysing penicillin and ampicillin183, 184
.
N
S
HNR
O
H
COO-O
k1
k-1
k2
k3
HN
NHO
CH2
Ser
H
-OOC Glu166
N
S
HNR
O
H
COO-O-
NH
NH
O
CH2
Ser
HOOC Glu166
HN
S
HNR
O
H
COO-O
NH
NH
O
Ser-OOC Glu166
OH H
HN
S
HNR
O
H
COO-O
NH
NH
O-
Ser
-OOC Glu166CH2
OH
Scheme 3.3 Serine β-lactamase hydrolysis mechanism185
.

146
The mechanism of serine β-lactamases involves the formation of an acyl enzyme. The
cleavage of the β-lactam requires several proton transfer steps, but the identity of the general
acid-base catalyst(s) is controversial185
. Scheme 3.3 shows the first step involves acylation, a
Glu166 acts to deprotonate the serine hydroxyl to aid nucleophilic attack on the carbonyl group
of the β-lactam ring. The C-N bond is cleaved by the formation of the double bond oxygen
and deacylation occurs with the aid water being deprotonated by the general base to
regenerate the enzyme and release the inactive β-lactam.
3.1.6.2 Class C β-Lactamases
The second most common class of β-lactamase is class C which are also serine
enzymes and historically known as cephalosporinases as they prefer cephalosporins as a
substrate although they have high hydrolytic activity towards penicillins too (Table 3.2)186
.
β-Lactams to which resistance is conferred
Ambler Class
(Bush-Jacoby-
Medeiros Class)
Enzyme Primary Secondary
A (2b) Penicillinase Penicillins, early
cephalosporins
β-lactamase inhibitor
combinations
A (2be) Extended-spectrum
β-lactamase
Penicillins,
cephalosporins,
monobactams
None
A (2f) Carbapenemase All current β-lactams None
B (3) Metallo β-lactamase All current β-lactams
except monobactams
None
C (1) Cephalosporinase Penicillins,
cephalosporins
Carbapenems and
monobactams
D (2d) Cloxacillinase Penicillins, Oxacillin
and cloxacillin
None
D (2df) Carbapenemase Carbapenems and β-
lactams
None
Table 3.2 The different classes of β-lactamases and their preferred substrate187
.

147
Amongst this class of enzymes, the most common is, AmpC and they are usually found in
Enterobacteriaceae (a large family of Gram-negative bacteria) as chromosomal enzymes
which are usually present at basal levels but higher levels are produced once induced by the
presence of clavulanic acid (inhibitor of serine β-lactamases) or amoxicillin188
. Plasmid-
encoded AmpC is capable of transferring across species by conjugation184
.
3.1.6.3 Class D β-Lactamases
This class of β-lactamases are also serine enzymes and share the general hydrolytic
mechanism of the Ambler classification enzymes A and C and are known as oxacillinases or
OXAs. They differ from other serine β-lactamases because of their lack of amino acid
comparison and usually are not inhibited by clavulanic acid189
, bactam (except OXA-29) and
sulbactam whereas the hydrolytic activity can be inhibited by sodium chloride, 100 mM
sodium chloride completely inactivates most class D β-lactamases. The mechanism is not
fully understood but has been related to the Tyr residue at position 144, as mutation to Phe
prevents sodium chloride inhibition190
. Class D β-lactamases are often found in
Acinetobactor baumannii, Pseudomonas aeruginosa, Escherichia coli and K. pneumoniae191
.

148
3.1.7 Metallo β-Lactamases
3.1.7.1 Class B β-Lactamases
This class of bacterial enzymes hydrolyse the β-lactam ring with the help of a metal
cofactor which is zinc in its natural form and are known as metallo β-lactamases (MBL). In
1966, Sabath and Abraham discovered the first MBL in the Gram-positive bacteria Bacillus
cereus192
. In the last 20 years several pathogenic strains have developed MBL-mediated
resistance which has been spread by horizontal transfer, involving both plasmid and integron-
borne genetic elements193
.
The metallo family is divided into subclasses B1, B2 and B3 (Figure 3.8) which was devised
by Rasmussen and Bush where the enzymes are grouped according to amino acid sequence
and substrate profile.
Subclass B1 is the largest of the three groups and contains four comprehensively studied β-
lactamases, BcII (Bacillus cereus), CcrA (Bacteroides fragilis), BlaB (Chryseobacterium
meningosepticum) and IMP-1 (Pseudomonas aeruginosa) which show broad spectrum
activity against penicillins, cephalosporins and carbapenems.193, 194
This subclass of enzymes
requires one or two zinc-ions at the active site and they catalyse the hydrolysis of many β-
lactam compounds which include some which inhibit serine β-lactamases such as clavulanic
acid and tazobactam.
Subclass B2 which contains CphA from Aeromonas hydrophila, ImiS and AsbM1 from
Areomonas spp. and Sfh-I from Serratia fonticola. This group of enzymes are efficient at
hydrolysing carbapenems but poor against penicillins and cephalosporins.195, 196
This class
consists of mono-zinc enzymes and the binding of the second zinc-ion usually inhibits
enzyme activity.
Subclass B3, the least studied of the three groups include L1 from Stenotroptromonas
maltophilia and FEZ-1 from Legionella gormanii hydrolyse numerous β-lactam antibiotics
like that of subclass B1, although B3 enzymes differ greatly in their amino acid sequence and
structure compared to B1 and B2. FEZ-1 has much lower catalytic rate constants (kcat)
towards penicillins compared to L1 (the first enzyme to be subclassed as B3) but greater
values towards cephalosporins.193, 197

149
3.1.7.2 Structure of metallo β-lactamases
Despite the low sequence similarity between the various MBLs, the tertiary structure
is very similar where they all exhibit the αβ/βα sandwich structure composed of two β-sheets
at the core and five α-helices on the external faces198
. In all known structures, the active site
is located at the edge of the ββ sandwich in a shallow groove potentially binding two zinc-
ions199
.
Figure 3.9 Adapted ribbon representations of the three subclasses; (a) BcII, (b) CphA and (c)
FEZ-1. Helices represented in blue, strands in green and loops in grey199
.
Four residues among all metallo subclasses are strictly conserved which involve the
coordination of metal-ion(s) and are His118, Asp120, His196 and His263, other residues are also
involved in binding but these vary (Table 3.3).180
Subclass Zn1 Ligands Zn2 Ligands
B1 His116 His118 His196 Asp120 Cys221 His263
B2 Asn116 His118 His196 Asp120 Cys221 His263
B3 His/Gln116 His118 His196 Asp120 His121 His263
Table 3.3 Zinc ligands of class B β-Lactamases180
.
The first metallo β-lactamase enzyme known as BcII which required metal-ions for activity
was isolated from bacteria Bacillus cereus. Two strains of bacteria Bacillus cereus 569/H/9
and Bacillus cereus 5/B/6 both produce the metallo enzyme and only differ by 17 amino acids
which are not part of the metal-active site coordination of the enzyme200
.

150
Both enzymes have two sites to which the metal can bind known as sites 1 and 2, at site 1 also
known as the histdine site, zinc is tetrahedrally coordinated by the imidazoles of three
histidine residues (His116, His118 and His196) and a water molecule (Wat1)201, 202
. At site 2 or
the cysteine site His263, Asp120, Cys221 and one water pentacoordinate (trigonal bipyramidally
coordinated) the metal, with water usually as the fifth ligand which, in the case of water, is
referred to as the apical water or Wat2 (Figure 3.10) 202, 203
.
Figure 3.10 Atomic model of the active site of BcII203, 204
.
CphA (wild type) a class B2 enzyme consists of 227 amino acids with a calculated molecular
mass of 25.2KDa205
and has the capability of binding two zinc-ions but is only active in the
mono-zinc form as binding the second zinc-ion inhibits the enzyme in a non-competitive
manner196, 206
. A long α3 helix (Arg140-Leu161) is located near the active site groove which
provides a hydrophobic wall which explains the narrow activity profile of the enzyme207
.
Initially it was thought that the first zinc bound to site 1 containing Asn116, His118 and His196
but X-ray crystallography has shown that the first zinc is located in the cysteine site/site 2
which has ligands Asp120, Cys221 and His263 and not the histidine site208
.

151
3.1.7.3 Why Zinc?
Zinc the second most abundant first row transition metal in biology and is the choice
metal for many enzymes209
. Unlike some transition metals such as V2+
, Cr2+
, Ni2+
, Fe2+
and
others zinc contains a filled d orbital (d10
) and does not participate in redox reactions210
. The
zinc2+
-ion in metallo enzymes can in-turn adopt four-, five- or six-coordinate geometries
(Figure 3.11) as the energy barrier is relatively small for conversion199
. Many zinc metallo
enzymes have the binding geometry of a slightly distorted tetrahedron with the metal centre(s)
coordinating to three or four protein side chains.
Tetrahedral Trigonal Bipyramidal Octahedral
Figure 3.11 Zinc ligand geometry.
A combination of variable coordination geometries, rapid ligand exchange, Lewis acidity,
intermediate hard-soft behaviour and strong binding with substrates allows zinc to be
involved in a wide range of hydrolysis reactions209
. Some class B metallo β-lactamases such
as BcII have di-nuclear active sites present for activity and rapid exchange for kinetically
labile zinc-bound water is an important feature in these classes of hydrolases209
.

152
3.1.8 Metallo hydrolysis mechanisms
The mechanism of hydrolysis compared to serine active site β-lactamases is
considerably different, Scheme 3.4 shows one of the first proposed mechanisms by Bounaga
et al in 1998 for BcII where a zinc-ion is used to catalyse the hydrolysis of the β-lactam ring.
Initially water that is bound to the zinc-ion, acting as a Lewis acid lowers the pKa of the water
facilitating nucleophilic attack on the carbonyl centre forming a tetrahedral intermediate
which is also stabilised by the zinc-ion. Asp120 acts as a general base to deprotonate the
tetrahedral intermediate and subsequently it can act as a general acid to donate a proton to the
β-lactam nitrogen facilitating C-N bond cleavage, followed by enzyme dissociation211
.
N
S
HNR
O
H
COO-O
2+ZnHis196
His118His
116
OH-
k1
k-1 N
S
HNR
O
H
COO-O-
2+ZnHis196
His118His
116
O
H
-O
Asp120
O
k2
N
S
HNR
O
H
COO-O-
2+ZnHis196
His118His
116
O-
O
Asp120
O
H
k3HN
S
HNR
O
H
COO-O
2+ZnHis196
His118His
116
O-
-O
Asp120
O
Scheme 3.4 Mono-zinc β-lactamase hydrolysis mechanism211
.

153
In contrast to the mono-zinc mechanism which is the main mode of hydrolysis of subclass B2
β-lactamases Scheme 3.5 uses a di-zinc-ion to catalyse the hydrolysis of the β-lactam ring
where the two zinc-ions are bridged by a hydroxide-ion which is used to attack the carbonyl
centre of the β-lactam ring generating a negatively charged tetrahedral intermediate which is
stabilised by positively charged residues. The C-N bond is then cleaved as a proton is
transferred to the amide nitrogen by Wat2 which then is able to become the bridged
hydroxide-ion Wat1, the product finally undergoes displacement from the enzyme193
.
N
S
HNR
O
H
COO-O
2+ZnHis196
His118His116
Zn2+
HOH
Asp120
His263
Cys221
OH-
N
S
HNR
O
H
COO-O
-
2+ZnHis196
His118His116
Zn2+
HOH
Asp120
His263
Cys221
O
HN
S
HNR
O
H
COO-O
2+ZnHis196
His118His116
Zn2+
HO-
Asp120
His263
Cys221
OH
H2O
Scheme 3.5 Di-zinc β-lactamase hydrolysis mechanism193
.

154
3.1.9 Binding of metal-ions to enzymes
Metal-ions are essential to many life processes; many enzymes require metal-ions for
their activity. Understanding the properties of enzymes by acquiring data from 3D structures,
biochemical properties and kinetics and mechanism require studies into the binding of metal-
ions to the active site of the enzyme212
.
For any metallo-protein the affinity of the metal-ion (M) for the enzyme (E) is a key
requirement for its biological activity and is defined by the dissociation constant (Kd)
(Equation 3.1)212
:
E + M EMKb
Scheme 3.6 Simple 1:1 complexing between E and M to for EM.
[ ][ ]
[ ]
Equation 3.1
The binding constant (Kb) is simply 1/Kd (Equation 3.2).
[ ]
[ ][ ]
Equation 3.2
Under in vitro conditions binding of metal-ions to protein surfaces often have a Kd ≥ 10-6
M
whereas metal-ion binding to enzyme active sites often have a higher affinity as high metal-
ion concentrations in vitro would by toxic to many cells212
.
Dependent on experimental techniques, the variation often seen in binding constants for a
particular enzyme may reflect a few parameters which should be kept under control. For
example, the class B β-lactamases, BcII which has reported binding constants for Kb1 (first
zinc binding) and Kb2 (second zinc binding) range from 1.7 x 10⁹ M
-1 to 8.3 x 10
3 M
-1 and 6.7
x 108 M
-1 to 41.7 M
-1, respectively. These discrepancies are most likely due to inadequate pH
control, buffer-metal interactions, secondary interactions with proteins or contaminates in
solution and incorrect interpretation and processing of experimental data200
. Subgroup B2
enzyme, CphA exists mainly as the mono-zinc enzyme and full catalytic activity is obtained
with a binding constant for the first zinc-ion ≤5 x 10⁷ M
-1 and 2.2 x 10
4 M
-1 for the second
zinc-ion, which shows that the second zinc is less tightly bound (negative cooperativity) to the
active site of the enzyme196, 213
.

155
3.1.9.1 Microscopic and Macroscopic Binding
A microscopic binding scheme is necessary when there is more than one binding
process which can be clearly distinguished. As shown be Scheme 3.7 an enzyme (E) which
contains two binding sites (1 and 2), the first metal-ion (M) can bind to site 1 of the enzyme,
the microscopic binding constant characterised by K1 or M can bind to site 2 which is
characterised by the microscopic binding constant K2. The second M can occupy the empty
site either by microscopic equilibrium constants K3 or K4. The macroscopic binding constant
for populating the enzyme with one M can be given by Equation 3.3 and the second
macroscopic binding constant by Equation 3.4, as some analytical methods such as ITC are
unable to measure the microscopic binding constants214
.
[ ]
[ ][ ]
Equation 3.3
[ ]
[ ][ ]
Equation 3.4
K1
Kb2
K2 K4
K3
M
M
M
M
M
1
M1
2
M
2
M
EMKb1
Scheme 3.7 Macroscopic and microscopic binding of an enzyme which contains two binding
sites214
.

156
3.1.10 Cooperativity
Cooperativity has been well known to occur in enzymes which have multiple binding
sites or domains. There are two types of cooperativity, positive, where the affinity for the
first binding site increases subsequent ligand(s) binding. Negative cooperativity is where the
binding affinity for the next ligand is decreased when the first site is already occupied. The
most common example of cooperativity is the binding of oxygen to haemoglobin, where the
four binding sites are gradually increased in oxygen affinity as each oxygen binds215
.
A consequence of cooperativity in proteins is that there is often a change in conformation. A
β-lactamase which showed a slight conformational change on titration with zinc-ion
compared to the apo-enzyme was CphA from A. hydrophila, observed using circular
dichroism and fluorescence emission. Treatment of the enzyme with increasing
concentrations of urea showed that the di-zinc enzyme is much more stable than the mono-
zinc enzyme to thermal and urea denaturation216
. For many enzymes, zinc, or the native
metal-ion, is required to correctly fold the protein to its active structure.
The presence of metallo-β-lactamases in their physiological conditions does raise questions to
the available concentrations of zinc in their natural habitat because of the range of binding
constants of the mono- and bi-nuclear species. Production of metallo β-lactamases in the
laboratory usually occurs by over expression in E.coli and, during purification excess zinc is
used to fold and stabilise the protein into the active form of the enzyme. Removal of zinc to
form the apo-enzyme would be monitored to ensure little of negligible concentrations of zinc
remained in solution prior to titrating zinc216
.
Bacillus cereus 569/H/9 β-lactamase BcII is an enzyme where the metal-ion to protein
stoichiometry remains controversial, it has been proposed that under physiological conditions
β-lactamase catalyses its substrate aided by one zinc-ion. The mononuclear form of BcII has
been shown to be catalytically active as the first detailed crystal structure199, 201
.
Using stop-flow, the kinetics of metal binding has been monitored by observing the metal-
ion-induced fluorescence changes of the protein. The association rate constants for binding of
the second zinc-ion were two orders of magnitude lower than that of the first metal-ion
therefore suggesting that negative cooperativity was occurring216
.

157
Mass spectrometry has been used to identify the different masses corresponding to the apo-,
mono- and di-enzyme. At pH 7 three different masses were observed at different [Zn]/[E]
ratios, the apo-enzyme has a Mr = 24,961 ± 2 Da which was the dominant species before zinc
addition. The di-zinc species, which is 128 Da (Mr = 25,089 ± 2 Da) higher compared to the
apo-enzyme, predominates at [Zn]/[E] ≥2. Although the mono-zinc species appears with an
intermediate mass Mr = 25,025 ± 2 Da throughout the titration, its relative abundance remains
below 20%. It was suggested positive cooperativity occurs such that binding at the first zinc
site increases the affinity at the second site or the affinity for the second zinc site is much
greater than the first200
.
To assess the binding nature and cooperativity of BcII an identical experiment with cadmium
as the ligand was used. NMR and PAC (perturbed angular correction) spectrometries were
used to confirm the MS data which indicated that the process is non-cooperative and the
dominate species is the mono-cadmium enzyme in the presence of 1 molar equivalent of
cadmium200
.
Isothermal titration calorimetry (ITC) has also been used to assess the binding of zinc to the
apo-BcII at 30oC in MOPS buffer, pH 7.06 which showed an apparent single binding event
with a stoichiometric ratio of 1.9 indicating the two binding sites have very similar binding
constants or the second binding constant is much greater than the first collapsing the binding
event into a single observable event, or the first stronger binding site gives the same heat as
the second weaker binding site (Figure 3.12). The association constant was determined by
fitting the data to a single binding event where Kb was found to be 3.3 x 10⁷ M
-1 202.

158
Figure 3.12 ITC trace for the titration of zinc-ion into BcII in 25 mM MOPS, I = 0.25 M, pH
7.06 at 30oC
202.

159
3.1.11 Calorimetry
Calorimetric measurements can be performed in three different ways: temperature
change, heat conduction and power compensation, also known as isothermal217
.
In a temperature change instrument, heat is evolved or consumed by the reaction within the
calorimeter resulting in a change in the temperature in the measuring cell as a function of
time217
.
With heat conduction measurements, the cell is passively maintained at a constant
temperature which is controlled be sensors and heat sinks. As the reaction produces heat, a
small voltage is applied which is proportional to the very small ΔT that is developed across
the heat flow sensors217
.
Power compensation calorimeters will be discussed in detail in this chapter.
ITC is the current method of choice when characterising binding and thermodynamic
properties of chemical and biological systems. Although ITC dates back over 40 years,
instruments have been developed and smaller volumes of samples now provide accurate
thermodynamic and binding information218
.
3.1.12 Power compensation calorimeter
The power compensation calorimeter used within this work is the VP-ITC which is
manufactured by GE-Healthcare (previously known as MicroCal). Modern instruments such
as the VP-ITC work in an energy compensation mode where the sample cell and the reference
cell are maintained at a constant temperature (isothermal) relative to the adiabatic jacket
(Figure 3.13). The sample cell and the reference cell are identical which are composed of
sensitive heat conducting material such as hasteloy or gold219
.

160
Figure 3.13 Typical isothermal titration calorimeter which shows zero temperature difference
between the reference and sample cell.
In a typical ITC experiment the sample cell is filled with a macromolecule (which will be
referred to as the enzyme (E)) and the syringe with the ligand/metal-ion (referred to as the
titrant), the reference cell contains ultrapure water or buffer. Prior to any aliquots of the
metal-ion being injected into the sample cell, the differential power is stabilised. As aliquots
of titrant are titrated into the sample cell, each injection yields a deflection in relative power
versus time as the instrument compensates for the heat which is evolved or absorbed220
.
If heat is generated by the reaction (exothermic) ΔT increases and the feedback loop responds
by reducing the power to the heaters around the sample cell to restore ΔT to 0 therefore a
negative deflection from the baseline is observed in a power versus time plot. For an
endothermic reaction this is opposite. After each titration the temperature difference between
the sample cell and the reference cell returns back to zero221
.
3.1.13 ITC output
The raw output of the ITC is a power versus time plot. Each injection is represented
by a peak in a negative direction from baseline (Figure 3.14) or positive direction from
baseline. The area under each peak is integrated to obtain the heat per injection which is
plotted against molar ratio (added titrant/enzyme)222
.

161
-0.5 0.0 0.5 1.0 1.5 2.0 2.5 3.0 3.5 4.0
-8
-6
-4
-2
0
-25
-20
-15
-10
-5
0
0 50 100 150 200 250 300 350 400 450 500
Time (min)
µca
l/se
c
Raw Data
Molar Ratio
kca
l/m
ole
of
inje
ctan
t
Integrated Data
Figure 3.14 ITC output, raw data (top), integrated data (bottom).
The integrated isotherm provides three crucial parameters, firstly the enthalpy of all the
reactions (ΔHobs) occurring within the cell is obtained from the first few injections. As
additional titrant is added and equilibrium is reached, the reaction heat falls until no more
enzyme reacts with the metal-ion and only the heats of dilution are observed. The
stoichiometry can be obtained from the intercept or inflection point of the reaction and the
binding constant (Kb) from the slope (Figure 3.14), the steeper the slope the greater the
binding constant.
ΔHobs
stoichiometry (n)
Slope determines
the Kb

162
3.1.14 Calculating the binding constant Kb and other parameters
The position of the equilibrium is dependent on the binding constant Kb, where Kb is
the concentration of products over reactants, shown in a simple 1:1 ratio reaction (Equation
3.5).
E + M EMKb
Scheme 3.8 Simple 1:1 complexing to form EM.
[ ]
[ ][ ]
Equation 3.5
Once the binding constant is calculated the Gibbs free energy (Equation 3.6) is related to Kb
where R is the gas constant (8.314 J mol-1
) and T is the absolute temperature (K).
Equation 3.6
MicroCal software is provided with the VP-ITC to be used as the data analysis program for
the raw ITC data. It integrates the area under each peak and the heat which is obtained per
injection is plotted against the molar ratio. The Kb, enthalpy and stoichiometry are determined
by applying non-linear least square fitting and therefore indirectly obtaining the Gibb’s Free
energy and the entropy of the reaction (Equation 3.7).
Equation 3.7
ΔG = Standard Gibbs free energy (kJ mol-1
)
ΔS = Entropy (kJ mol-1
K-1
)
ΔH = Enthalpy (kJ mol-1
)
T = Absolute temperature (K)

163
The heat is directly proportional to the extent of binding and as the enzyme is saturated by the
titrant, the heat per injection decreases until no more binding occurs, the total heat (Q) within
the active sample volume (V0) is governed by Equation 3.8 where EM is the concentration of
enzyme bound to the metal-ion, ΔH is the enthalpy of binding and Ei is the initial enzyme
concentration.
[ ][ ]
Equation 3.8
The initial concentrations of enzyme and metal-ion are an important factor as the binding
isotherm is characterised by a unitless parameter c (Equation 3.9) also known as the Wiseman
parameter, which is the binding constant (Kb),the initial concentration of enzyme ([E]i) and
the stoichiometry (n)223
:
[ ]
Equation 3.9
For accurate determination of the very high binding constant (Kb) the optimum c values are
between 10-100 and those <1 and >1000 are excluded224
.
Those c values >1000 the binding constant is not resolved well as the transition is very sharp
to the end point or equivalence point (saturation may be obtained in a single injection) and
those c values <1 loose sigmoidal shape becoming nearly linear causing the equivalence
point hard to determine (Figure 3.15)219
.
0.0 0.5 1.0 1.5 2.0
0.0
0.5
1.0
c = 0.1
c = 1
c = 4
c = 40
kca
l/m
ole
of
inje
ctan
t
Molar Ratio
Ho
c = 500
Figure 3.15 How the c value affects Kb219
.

164
3.1.15 Calibration of the ITC
The VP-ITC was calibrated (y-axis) once a month using the specific onboard
software, this is achieved by dissipating a known power through a resistive heater located on
the cell wall which then adjusts the software for differential power. The calibration power
was 1 µcal/sec, pulse duration was 300 sec and the spacing was 600 sec. The reported error
in deflection or energy was less than 1%.
3.1.16 Subtraction of heats of dilution
The heats of dilution are those which are seen after full saturation of the enzyme and
additional titrations show heat which are from the titrant adding into the cell. These heats are
removed from each of the titration peaks either by the subtraction after each experiment or by
a separate background titration which does not incorporate the enzyme.

165
3.1.17 Aim
The aim of this project is firstly to develop a model for simulating ITC data based on
two metal-ions binding to an enzyme by a ‘concerted’ (direct formation of EM2 with no
formation of EM) and a simple sequential mechanism and, secondly, use these binding
models to interpret experimental ITC data for metal-ions binding to apo-BcII. Reference will
also be made to the MicroCal software available with the ITC instrumentation.
The model which will be considered is shown in Scheme 3.9:
E + M EM EM2
MKb1 Kb2
Scheme 3.9 Scheme to show the formation of the mononuclear species EM and the di-nuclear
EM2.
In extreme cases:
When Kb1 >> Kb2, a truly sequential binding event is observed and all the metal (M) is bound
to the enzyme (E) in the form of EM up to one equivalent of M, then excess metal (M) forms
EM2.
When Kb1 = Kb2, both EM and EM2 are formed with less than 1 equivalent of metal-ion.
A ‘concerted’ binding event is observed when Kb2 >> Kb1 and only EM2 is formed even with
less than 1 equivalent of metal-ion added and so there is no EM produced.
Between these extreme cases, there may be intermediate ones showing mixed behaviour.

166
3.2 Results and discussion
3.2.1 Single binding site, formation of the mononuclear enzyme
The simplest model used to simulate ITC data involves one enzyme binding site (E)
and one metal-ion (M), complexing to form EM. The commercial system (by MicroCal and
others) is available for this system but, as part of this project the single binding site model was
developed and checked against the commercial software. The equilibrium characterised by
this 1:1 complexing has an association constant (Kb) (Equation 3.10).
E + M EMKb
[ ]
[ ][ ]
Equation 3.10
The initial concentrations of enzyme (Ei) in the analyte solution in the calorimetric cell and
metal (Mi) in the titrant solution are critical to ensuring accurate thermodynamic and
stoichiometric values. The titration is carried out in defined steps and the heat released or
absorbed is measured after each injection of titrant into the sample cell. The object is to
predict the concentration of EM produced in the cell with each injection. From this, with a
suitable value of ΔH the heat against added titrant profile can be calculated.
The equilibrium constant (Kb) for the equilibrium concentration of EM produced after the first
injection can be defined by Equation 3.11 with respect to the initial concentrations of enzyme
[E]i and metal-ion [M]i in Equation 3.10.
[ ]
([ ] [ ])([ ] [ ])
Equation 3.11
For subsequent injections the concentration of E and M (Equation 3.10) are calculated from
the remaining concentrations of enzyme and metal in the cell, this equation is a quadratic in
terms of [EM] (Equation 3.12).
[ ] [ ] [ ] [ ] [ ] [ ] [ ] [ ]
Equation 3.12

167
The quadratic equation is easily solved for EM (Equation 3.13)
√
Equation 3.13
Where:
[ ]
The increase in [EM] as the titration proceeds can be converted to a heat output using a
suitable value for ΔH. The heat can be converted to a differential heat (heat per mole of
injectant) and plotted against the molar ratio of added metal to enzyme concentration.
The solution to the quadratic equation yields two roots where only one root is relevant - the
concentrations of EM cannot exceed the initial concentrations of enzyme and metal for any
injection.
From the concentration of EM produced for the first injection of metal-ion titrated, the moles
of EM formed (ΔNEM) is given by Equation 3.14 where [EM] is the concentration of product
of the first injection, V0 is the active cell volume (V0 = 1.4194 ml) and ΔV is the injection
volume.
[ ] ( )
Equation 3.14
For additional injections (i) of metal, the moles of EM (ΔNEM i) formed can be calculated
using Equation 3.15.
[ ] ( ) ([ ] )
Equation 3.15

168
The heat (Q) in terms of kcal mol-1
of injectant for any injection i, can be calculated using
Equation 3.16 where ΔNEMi is the moles of EM formed of the ith injection, ΔH is the observed
enthalpy, ΔV is the injection volume for each injection into the cell and Mi is the initial metal
concentration in the syringe.
(
)
Equation 3.16
A problem associated with consecutive injections into the sample cell causes volume to be
driven out of the cell into a reservoir which does not contribute to additional titrations which
are not picked up by the thermocouples (Figure 3.16).
Figure 3.16 Schematic showing how an injection causes volume to be driven out of the active
volume (V0) into the overflow cell.
This constantly alters the concentrations of enzyme and metal-ion prior to the next injection
which is accounted for by Equation 3.17-Equation 3.19.
Equation 3.17
Equation 3.18

169
[ ] [ ] [ ] [ ]
[ ] ([ ] ) ([ ] ) [ ] [ ]
[ ] ([ ] ) ([ ] ) [ ] [ ]
Equation 3.19
Assuming the reaction between the metal-ion and enzyme occurs faster than the volume
driven out of the cell, Equation 3.17 is the dilution factor used to calculate the concentration
of metal-ion (DfM) for a single injection into the active volume of the cell. The metal-ion
concentration for the first injection is given by Equation 3.19 ([M]1), the second by Equation
3.19 ([M]2) and subsequent metal-ion concentrations is given by Equation 3.19 ([M]i).
Dilution factor DfE (Equation 3.18) calculates the concentration of enzyme for each injection
i.e. the first injection by Equation 3.18 ([E]1), the second by Equation 3.18 ([E]2) and
subsequent concentrations using Equation 3.18 ([E]i) within the active cell volume (V0).
A system which exhibits the typical 1:1 stoichiometry is barium-ion complexing to 18-crown-
6-ether (Scheme 3.10) for which the parameters the number of metal-ions bound per crown
ether, n = 1.00, Kb = 5900 M-1
and ΔH = -7.4 kcal mol-1
were generated using the MicroCal
model (Figure 3.17 and Figure 3.18).
O
O
O
O
O
O
Ba2+
Scheme 3.10 Complex between barium ion and 18-crown-6-ether.

170
-0.5 0.0 0.5 1.0 1.5 2.0 2.5 3.0 3.5 4.0
-8
-6
-4
-2
0
-25
-20
-15
-10
-5
0
0 50 100 150 200 250 300 350 400 450 500
Time (min)
µca
l/se
c
Raw Data
Molar Ratio
kca
l/m
ole
of
inje
ctan
t
Integrated Data
Figure 3.17 ITC titration of 50 mM barium chloride into 3 mM 18-crown-6-ether
experimental isotherm at 25oC.
0.0 0.5 1.0 1.5 2.0 2.5 3.0 3.5 4.0
-8
-7
-6
-5
-4
-3
-2
-1
0
1
Kca
l/m
ole
of
inje
ctan
t
Molar Ratio
Figure 3.18 Experimental isotherm of 50 mM barium chloride into 3 mM 18-crown-6-ether
(black) with theoretical fits by MicroCal model (white line) and our simulated model
(orange).

171
Exactly the same curve was generated using our single binding site model developed here to
form a mononuclear 1:1 complex as the MicroCal model. The experimental data (Figure
3.18, black) was simulated using our single binding model (Figure 3.18, orange) using the
parameters which were calculated by MicroCal (as our model does not contain a fitting
algorithm). It is assumed that these superimposable fits confirm that our methodology is
robust. The calculated parameters (Figure 3.18, white) are in agreement with literature data at
25oC for the 1:1 complex between barium-ion and 18-crown-6-ether where n = 0.97, Kb =
5610 M-1
and ΔH = -7.5 kcal mol-1 225
.
3.2.2 Binuclear binding model with the formation of both EM and
EM2 (Sequential binding).
Formation of the binuclear enzyme EM2 may occur in two sequential steps. First the
metal-ion binds to the apo-enzyme to form the mononuclear enzyme EM and subsequently
this binds more metal-ion to give the binuclear enzyme EM2. At equilibrium, the fractions of
the enzyme species existing as E, EM and EM2 are functions of the two binding constants Kb1
and Kb2 and the concentrations of E, M and EM.
The sequential binding of metal-ions can be represented by Scheme 3.11. Large variations of
zinc-ion affinity Kb1 and Kb2 values have been reported for BcII and have either indicated
positive cooperativity where the second metal-ion binds more strongly than the first or
negative cooperativty, where the second metal-ion binds more weakly than the first. The two
association constants (Kb1 and Kb2) are given by Equation 3.20 and Equation 3.21.
When Kb1 >> Kb2, the addition of metal-ion to the apo-enzyme will convert it all to EM, so
with a molar ratio (M:E) of 1:1only the mono-nuclear enzyme EM will be present – the first
binding site is filled completely before the second site is populated
E + M EM EM2
MKb1 Kb2
Scheme 3.11 Sequential binding model forming both EM and EM2.

172
[ ]
[ ][ ]
Equation 3.20
[ ]
[ ][ ]
Equation 3.21
The two equations were treated independently to obtain the concentrations of EM and EM2.
For a single injection of metal-ion into the cell containing the enzyme, in the first step to form
EM the system was allowed to equilibrate to give concentrations of E, EM and M. These
concentrations were then used in the second modelling step to form EM2 and allowed to come
to equilibrium. The concentrations of EM and EM2 at equilibrium were established in an
iterative process until there was negligible change in metal-ion (M) concentration (10-17
M) in
Equation 3.20 and Equation 3.21. The concentrations of E, M, EM and EM2 for each
injection were fed back into Equation 3.20 and Equation 3.21 to calculate the binding
constants Kb1 and Kb2.
For each injection, as before the change in the concentrations of EM (ΔNEMi) and EM2
(ΔNEM2i) are calculated. These two values are then converted to heat outputs, based on the
two ΔH values used for the two formation reactions (Equation 3.22). Note that, in the first
equation (QEMi), the heat depends on the amount of EM formed. Some of the EM present
before the injection is converted into EM2 at the same time, the overall amount of EM formed
is the change in EM concentration ( ) plus the amount of EM that is simultaneously
converted to EM2 (i.e. ) the overall heat output is calculated for the ith injection,
QTotali. This is converted to a differential heat with respect to the added metal-ion.
( )
Equation 3.22

173
The total heat for the ith injection is given by Equation 3.23:
Equation 3.23
The heat for the ith injection can be represented in terms of differential heat per mole of
metal-ion added (Equation 3.24).
Equation 3.24
3.2.3 Binuclear binding model without the formation of the
mononuclear species EM (‘concerted’, positively cooperative
binding).
Just to reiterate, cooperativity in the formation of binuclear enzymes can either be
positive where binding of the first metal-ion enhances the binding of the second metal-ion or
negative where binding of the second metal-ion binds less tightly to the enzyme than the first
metal-ion.
The enzyme of interest in this work is the metallo-β-lactamase from Bacillus cereus (BcII)
which is a non-pathogenic strain of bacteria which has β-lactam resistance. BcII has two
metal-ion binding sites to which the natural ligand zinc is capable of binding. Work by
Jacquin et al. in 2009 suggested that BcII 569/H/9 binds zinc in a positively cooperative
manner and the di-anion is the only relevant form for catalysis200
. It is proposed to investigate
this by ITC but an appropriate model is needed to allow for strong cooperativity.
Cooperative binding is characterised by Scheme 3.12 when Kb2 >> Kb1 and in this extreme
case intermediate EM is not formed in significant quantities and the binding equilibrium
constant (Kb) can then be represented by Equation 3.25.

174
E + M EM EM2
MKb1 Kb2
If Kb2 >> Kb1 the above equilibrium is reduced to a single binding event:
E + 2 M EM2
Kb
Scheme 3.12 Sequential binding of metal-ion to enzyme which contains two binding sites
which is reduced to one event when Kb2 >> Kb1.
[ ]
[ ][ ]
Equation 3.25
If this is the situation, the equilibrium constant (Kb) for the concentration of EM2 produced
after the first injection can be defined by Equation 3.26 with respect to the initial
concentrations of enzyme [E]i and metal-ion [M]i. The initial concentration of the enzyme
(Ei) is that in the analyte solution in the calorimetric cell and that of the metal-ion (Mi) is that
added from the titrant solution.
[ ]
([ ] [ ])([ ] [ ])
Equation 3.26
Both binding sites are filled even when there is less than 1 equivalent of metal-ion to the
enzyme, so that the only species present are E and EM2. For subsequent injections the
concentration of E and M (Equation 3.25) are calculated from the remaining concentrations of
enzyme and metal in the cell, this equation is a cubic in terms of [EM2] (Equation 3.27).
( )[ ] ([ ] [ ] )[ ]
( [ ] [ ] [ ] )[ ] [ ] [ ]
Equation 3.27

175
The roots (Equation 3.28) of the cubic equation (Equation 3.27) for the concentration of EM2
for each injection were solved analytically using Derive 6 which is a mathematical system
used for processing algebraic variables, functions etc.
√
(
(
√ )
)
√
(
(
√ )
)
√
(
(
√ )
)
Equation 3.28
Where:
( [ ] [ ]
[ ] [ ] ( [ ] )[ ] ([ ]
))
( [ ] [ ] [ ] [ ]
)
( [ ]
[ ] [ ] [ ]
)
The cubic expression has three roots, but the root which has a physical meaning (i.e. not
imaginary) was obtained using a branched statement as the correct root for EM2 lies between
0 and Mi/2 and cannot be greater than the initial concentration of enzyme and metal for a
given injection. The dilution equations (Equation 3.17-Equation 3.19) were incorporated and
the differential heats/kcal/mole of injectant was calculated using Equation 3.16 with respect to
EM2.

176
Titration curves of different binding constants were simulated with initial enzyme (Ei) and
metal (Mi) concentrations of 1.8 x 10⁻⁵
M and 3.6 x 10⁻⁴
M respectively and a metal increment
volume (ΔV) of 1.0 x 10⁻⁵
L (Figure 3.19).
0 1 2 3 4
0.0
0.1
0.2
0.3
0.4
0.5
0.6
0.7
0.8
0.9
1.0
109
1010
1011
1012
1013
1014
F
ract
ion o
f en
zym
e as
EM
2
Molar Ratio (M:E)
Figure 3.19 Simulated fraction of enzyme bound to metal-ion as EM2 as a function of molar
ratio (metal added/enzyme) at different binding constants Kb= 109 to 10
14 M
-2. Using initial
enzyme (Ei) and metal (Mi) concentrations of 1.8 x 10⁻⁵
M and 3.6 x 10⁻⁴
M respectively and a
metal increment volume (ΔV) of 1.0 x 10⁻⁵
L
Figure 3.19 shows how the binding constant alters the profile of the fraction of enzyme bound
to metal-ion as a function of molar ratio (M:E). At a high binding constant 1012
to 1014
M-2
the fraction of enzyme bound to the metal as EM2 is near completion with a slope of 0.50 as a
function the molar ratio (M:E). The enzyme is fully saturated as EM2 at a molar ratio of about
2 for binding constants of 1014
and 1013
M-2
, but a binding constant of 1012
M-2
requires a little
more metal-ion with 99% saturation occurring at 2.5 molar equivalents. Even with what
appears to be a high binding constant of 1011
M-2
there is a decreasing amount of the enzyme
bound to the metal-ion to form EM2. At a 1:1 (M:E) molar ratio there is 42% of enzyme
bound as EM2 and 58% free enzyme. At a molar ratio of 2:1 (M:E) 81% of the enzyme exists
as EM2 yet 19% still remains as E. Substantial saturation of the enzyme (> 90%) starts to
occur at 3.5 equivalents of total metal-ion added. Further reducing the binding constant to
1010
M-2
starts to show an initial downward curvature at low metal:enzyme ratio which may
be slightly surprising with this ‘high’ binding constant, only 31% of the enzyme exists as EM2

177
at a molar ratio of 1:1 (M:E) and at a molar ratio of 2:1 (M:E) 63% of enzyme exists as EM2,
complete saturation (> 99%) requires more than 4 molar equivalents of metal-ion. A binding
constant of 109 M
-2 shows a definite sigmoidal shape graph with an increasing concave line
until a molar ratio of 1 after which the fraction of EM2 becomes linear up until a molar ratio
of 2. At molar ratios of 1:1 and 2:1 (M:E) only 14% and 35% of enzyme exists as EM2,
respectively. Even after 4 molar equivalents of metal-ion have been added, only 70% of the
enzyme exists as EM2 when the binding constant is 109 M
-2. Some examples of the fraction of
enzyme bound to the metal as EM2 as a function of the molar ratio (M:E) and various binding
constants are given in Table 3.4.
The initial increasing concave behaviour at low binding constants is surprising and could arise
because at the beginning of the titration, the concentration of metal-ion added to the sample
cell is low but as the concentration of the metal-ion is squared in the denominator of the
equation for equilibrium (Equation 3.25) it makes the effective concentration of metal-ion
even smaller therefore very low concentrations of EM2 form. This also accounts for the
apparent low fractions of conversion to EM2 despite what appear to be large binding
constants.
Kb % EM2
1:1 (M:E) molar ratio 2:1(M:E) molar ratio
1014
49 97
1013
48 95
1012
47 90
1011
42 81
1010
31 63
109 14 35
Table 3.4 Percentage of the enzyme existing as EM2 at different binding constants at molar
ratios (M:E) of 1:1 and 2:1.
The data in Figure 3.20 was transformed to differential heats per mole of injectant using an
enthalpy ΔH = 10.0 kcal mol-1
per mole of product EM2 formed. As two moles of metal-ion
are required for each mole of EM2 formed, 5.0 kcal mol-1
would be the maximum heat
released per mole of metal-ion injectant if all the metal complexed with the enzyme to form
EM2. This is shown with a very high binding constant of 1014
M-2
even at a molar ratio of less
than 2:1. A binding constant of 1013
M-2
initially shows a kink where the enthalpy of binding
is lower than the maximum, compatible with less than full conversion of the added metal-ion
to EM2. As the binding constant is decreased the binding enthalpy decreases which is shown
clearly by binding constant 1011
and 1012
M-2
and the initial values increase then decrease

178
again as decreasing fraction of enzyme is converted toEM2 with increasing added metal-ion as
equilibrium is approached.
The initial increase in binding enthalpy, as explained previously using Figure 3.19 must be
due to the formation of very low concentrations of EM2 due to the initial low concentration of
metal-ion within the sample cell.
0 1 2 3 4
0
1
2
3
4
5 109
1010
1011
1012
1013
1014
Dif
fere
nti
al h
eats
/kca
l/m
ole
of
inje
ctan
t
Molar Ratio (M:E)
Figure 3.20 Simulation of the differential heats per kcal per mole of injectant metal-ion as a
function of molar ratio (M:E) at different binding constants.
3.2.4 Comparison of the sequential and concerted models
Before considering the simulation of experimental ITC data, the sequential and
concerted models were compared using various binding constant ratios (Kb2/Kb1) termed α
(Equation 3.29)215
. The fraction of enzyme existing as either EM or EM2 and the total
fraction of both species (EM+EM2), θ, Equation 3.30) were plotted against molar ratio (M:E)
at α = 10,000, 1000, 100, 10 and 1, 0.1 and 0.01.
Equation 3.29

179
and:
[ ] [ ]
Equation 3.30
The resulting plots of the fraction of enzyme bound as EM and EM2 are then converted to
differential heat outputs using a trial ΔH value of 5.0 kcal mol-1
for both EM and EM2 in the
sequential binding model. Using an initial enzyme concentration (Ei) in the cell (1.4194 ml)
of 1.8 x 10⁻⁵
M and injecting 1.0 x 10⁻⁵
l of titrant metal-ion concentration of 3.6 x 10⁻⁴
M for
a total of 29 injections provides simulation plots from Figure 3.21-Figure 3.27.
Equivalent plots are shown for the concerted binding event simulation of
using the same heat (i.e.ΔH = 10.0 kcal mol-1
for the overall reaction) for comparison. In
Figure 3.21-Figure 3.25 for the sequential model, Kb1 is kept at 105 M
-1 and Kb2 is altered to
achieve different plots for α except when Kb1 is greater than Kb2, which is shown in Figure
3.26 and Figure 3.27.
An α value of 10,000 (Figure 3.21) shows that the fraction of EM (black line) present in
solution is negligible compared to the fraction of enzyme bound as EM2 (red line) which is
consistent with the concerted binding model (direct formation to EM2). The maximum
enthalpy of 5.0 kcal mol-1
is produced initially as all of the metal-ion added is converted to
EM2 without significant formation of EM. At α = 1000 (Figure 3.22), a similar fraction of
EM2 is formed again with negligible concentrations of the mono-enzyme and the total heat
per mole of product is 5.0 kcal mol-1
.

180
α = 10,000
0.0
0.2
0.4
0.6
0.8
1.0
0 1 2 3 4
0
1
2
3
4
5
F
ract
ion o
f en
zym
e bound a
s E
M o
r E
M2
EM (Sequential)
EM2 (Sequential)
Concerted
D
iffe
renti
al h
eats
/kca
l/m
ole
of
inje
ctan
t
Molar Ratio (M:E)
Sequential
Concerted
Figure 3.21 Fraction of EM (▬), EM2 (▬) and θ (▬) against molar ratio (M:E) for the
sequential binding model using Kb1 = 105 M
-1 and Kb2 = 10
9 M
-1 (α = 10,000), but are in fact
indistinguishable from the concerted model (▬) using a Kb = 1014
M-2
. The bottom graph
shows the differential heats per kcal per mole of injectant against molar ratio for the
sequential (▬) and concerted (▬) models.

181
α = 1000
0.0
0.2
0.4
0.6
0.8
1.0
0 1 2 3 4
0
1
2
3
4
5
Fra
ctio
n o
f en
zym
e b
ou
nd
as
EM
or
EM
2
EM (Sequential)
EM2 (Sequential)
Concerted
Dif
fere
nti
al h
eats
/Kca
l/m
ole
of
inje
ctan
t
Molar Ratio (M:E)
Sequential
Concerted
Figure 3.22 Fraction of EM (▬), EM2 (▬) and θ (▬) against molar ratio (M:E) for the
sequential binding model using Kb1 = 105 M
-1 and Kb2 = 10
8 M
-1 (α = 1000). The concerted
model (▬) is shown using a Kb = 1013
M-2
. The smaller graph shows the differential heats per
kcal per mole of injectant against molar ratio for the sequential (▬) and concerted (▬)
models.

182
α = 100
When α is reduced to 100 (Figure 3.23) a difference appears between the concerted and the
sequential model. For the latter, at a molar ratio of 1:1 (M:E) there is 5% EM (black line) and
45% EM2 (red line) formed and at a molar ratio of 2:1 (M:E) there is 3% EM and 88% EM2.
The concerted model (magenta line) at molar ratios of 1:1 and 2:1 (M:E) shows 47% and 91%
of the enzyme is as EM2, respectively. Conversion to EM2 in the sequential model (red line)
is lower than in the concerted model but in addition there is significant EM produced even up
to a molar ratio of almost 3:1. Consequently, the total fraction of enzyme converted to
metallo enzyme species at a fixed molar ratio (M:E) is greater in the sequential than in the
concerted model.
A very striking feature of the differential enthalpies plot is that in both models, the differential
heat is relatively low at the beginning of the reaction which shows up as a ˈkinkˈ in the plot.
0.0
0.2
0.4
0.6
0.8
1.0
0 1 2 3 4
0
1
2
3
4
5
Fra
ctio
n o
f en
zym
e b
ou
nd
as
EM
or
EM
2
EM (Sequential)
EM2 (Sequential)
Concerted
Dif
fere
nti
al h
eats
/kca
l/m
ole
of
inje
ctan
t
Molar Ratio (M:E)
Seqential
Concerted
Figure 3.23 Fraction of EM (▬), EM2 (▬) and θ (▬) against molar ratio (M:E) for the
sequential model using Kb1 = 105 M
-1 and Kb2 = 10
7 M
-1 (α = 100). The concerted model (▬)
is shown using a Kb = 1012
M-2
. The bottom graph shows the differential heats per kcal per
mole of injectant against molar ratio for the sequential (▬) and concerted (▬) models.

183
When α = 10 then as expected, there is a large difference between two models because the
sequential model predicts a relatively high EM concentration at molar ratios of 1:1 and 2:1
(M:E) of 14% and 11%, respectively, until a molar ratio of metal to enzyme of 3:1. The
percentage of EM2 at molar ratios 1:1 and 2:1 (M:E) in the sequential and concerted model
are 35, 74 and 42 and 81%, respectively. Again, the total fraction of enzyme converted at a
fixed molar ratio (M:E) is greater in the sequential than in the concerted model.
α = 10
0.0
0.2
0.4
0.6
0.8
1.0
0 1 2 3 4
0
1
2
3
4
5
Fra
ctio
n o
f en
zym
e bound a
s E
M o
r E
M2
EM (Sequential)
EM2 (Sequential)
Concerted
Dif
fere
nti
al h
eats
/kca
l/m
ole
of
inje
ctan
t
Molar Ratio (M:E)
Sequential
Concerted
Figure 3.24 Fraction of EM (▬), EM2 (▬) and θ (▬) against molar ratio for the sequential
model using Kb1 = 105 M
-1 and Kb2 = 10
6 M
-1 (α = 10). The concerted model (▬) shown using
a Kb = 1011
M-2
. The bottom graph shows the differential heats per kcal per mole of injectant
against molar ratio for the sequential (▬) and concerted (▬) models.

184
A α = 1, using Kb1 = 105 M
-1 and Kb2 = 10
5 M
-1, shows that both EM and EM2 are produced in
the sequential model at least up to molar ratios (M:E) of 4:1. At low metal-ion concentrations
the fraction of EM2 in the sequential process (red line) shows a ˈconcaveˈ feature until a molar
ratio (M:E) of 1.5:1 where the fraction of EM is at a maximum (33%). At a molar ratio of
2:1 (M:E) 32% of the enzyme exists as EM and 44% as EM2. Saturation at this relatively low
overall binding constant (1010
M-2
) requires high concentrations of metal-ion. The concerted
model shows a completely different profile compared to the sequential model with 31% of the
enzyme as EM2 at a M:E of 1:1 and at a molar ratio of 2:1 (M:E) 63%. This difference
between the two models is reflected in the differential heats.
α = 1
0.0
0.2
0.4
0.6
0.8
1.0
0 1 2 3 4
0.0
0.5
1.0
1.5
2.0
2.5
3.0
3.5
Fra
ctio
n o
f en
zym
e b
ou
nd
as
EM
or
EM
2
EM (Sequential)
EM2 (Sequential)
Concerted
Dif
fere
nti
al h
eats
/kca
l/m
ole
of
inje
ctan
t
Molar Ratio
Sequential
Concerted
Figure 3.25 Fraction of EM (▬), EM2 (▬) and θ (▬) against molar ratio for the sequential
model using Kb1 = 105 M
-1 and Kb2 = 10
5 M
-1 (α = 1). The concerted model (▬) is shown
using a Kb = 1010
M-2
. The bottom graph shows the differential heats per kcal per mole of
injectant against molar ratio for the sequential (▬) and concerted (▬) models.

185
In the case where the first binding constant is greater than the second, Kb1 > Kb2 i.e. α < 1,
formation of the mononuclear enzyme is favoured over that of the binuclear enzyme. At α =
0.1 and at a molar ratio of 1:1 (M:E) 60% of the enzyme exists as EM and 13% as EM2 in the
sequential model compared to 42% EM2 in the concerted model. At a molar ratio of 2:1
(M:E) in the sequential model 48% and 47% of the enzyme exists as EM and EM2,
respectively whereas in the concerted model there is 81% EM2. The overall fraction, θ in the
sequential model is higher than that of the fraction existing as EM2 in the concerted model
which indicates the stability of the mononuclear species is favoured over that of the binuclear
enzyme.
α = 0.1
0.0
0.2
0.4
0.6
0.8
1.0
0 1 2 3 4
0
1
2
3
4
5
EM (Sequential)
EM2 (Sequential)
Concerted
Fra
cti
on
of
en
zy
me b
ou
nd
as
EM
or
EM
2
Dif
fere
nti
al
heats
/kcal/
mo
le o
f in
jecta
nt
Molar Ratio (M:E)
Sequential
Concerted
Figure 3.26 Fraction of EM (▬), EM2 (▬) and θ (▬) against molar ratio for the sequential
model using Kb1 = 106 M
-1 and Kb2 = 10
5 M
-1 (α = 0.1). The concerted model (▬) is shown
using a Kb = 1011
M-2
. The bottom graph shows the differential heats per kcal per mole of
injectant against molar ratio for the sequential (▬) and concerted (▬) models.

186
When α = 0.01 using Kb1 = 108 M
-1 and Kb2 = 10
6 M
-1 the formation of the mononuclear
complex is the dominant species at a molar ratio of 1:1 (M:E) with 83% in the form of EM
and only 7% as EM2 and only when the molar ratio is > 1, is the fraction of EM2 significant in
the sequential model. At a molar ratio of 2:1 (M:E) 22% of the enzyme exists as EM and
78% as EM2 in the sequential model. As shown previously the concerted model at Kb = 1014
M-2
predicts a total conversion of metal-ion to EM2 even at molar ratios (M:E) below 1. The
overall fraction of the enzyme that has reacted, (θ, (EM+EM2/Ei)) in the sequential model is
greater than the fraction of enzyme as EM2 in the concerted model at all molar ratios.
A single binding event is produced when the enthalpy of the two binding site are the same or
very similar although Kb1 > Kb2.
α = 0.01
0.0
0.2
0.4
0.6
0.8
1.0
0 1 2 3 4
0
1
2
3
4
5
Fra
cti
on
of
en
zy
me b
ou
nd
as
EM
or
EM
2
EM (Sequential)
EM2 (Sequential)
Concerted
Dif
fere
nti
al
heats
/kcal/
mo
le o
f in
jecta
nt
Molar Ratio (M:E)
Sequential
Concerted
Figure 3.27 Fraction of EM (▬), EM2 (▬) and θ (▬) against molar ratio for the sequential
model using Kb1 = 108 M
-1 and Kb2 = 10
6 M
-1 (α = 0.01). The concerted model (▬) is shown
using a Kb = 1014
M-2
. The bottom graph shows the differential heats per kcal per mole of
injectant against molar ratio for the sequential (▬) and concerted (▬) models.

187
3.2.5 Comparison of differential heat isotherms with respect to
different binding constants and enthalpies using the sequential
model.
This section involves comparing different enthalpies at α values of 0.02, 0.1, 1, 10
and 50 using the sequential model. At α = 1 (Kb1 = Kb2 = 106 M
-1) when ΔH1 is kept constant
at 5.0 kcal mol-1
and ΔH2 is gradually decreased an upwards concave kink is produced as
expected, as the first enthalpy is having a greater effect than the second enthalpy on the
overall profile. When ΔH1 is lower than ΔH2 (kept at 5.0 kcal mol-1
), the enthalpy starts off at
the given ΔH1 value, which gradually increases which decreases again as metal-ion is added.
α = 1
0 1 2 3 4
0
1
2
3
4
5
Dif
fere
nti
al h
eats
/kca
l/m
ole
of
inje
ctan
t
Molar Ratio (M:E)
H1 = H
2 = 5.0 kcal mol
-1
H1 = 5.0, H
2 = 4.0 kcal mol
-1
H1 = 5.0, H
2 = 2.5 kcal mol
-1
H1 = 5.0, H
2 = 1.0 kcal mol
-1
H1 = 1.0, H
2 = 5.0 kcal mol
-1
H1 = 2.5, H
2 = 5.0 kcal mol
-1
H1 = 4.0, H
2 = 5.0 kcal mol
-1
Figure 3.28 Kb1 = Kb2 = 106 M
-1 (α = 1) at different ΔH1 and ΔH2 values, shown as
differential heats per kcal per mole of injectant against molar ratio (M:E).

188
When α = 0.1 i.e. Kb1 = 107 M
-1 and Kb2 = 10
6 M
-1 (Figure 3.29) and when the first enthalpy is
greater than the second, again a similar effect is seen in the differential heats per kcal per
mole of injectant plot against molar ratio (M:E). When ΔH1 is 5.0 kcal mol-1
and ΔH2 is 2.5
kcal mol-1
the difference of 2.5 kcal mol-1
is observed as a kink in the plot at a molar ratio of
about 1.75 which is less profound when there is a difference between ΔH1 and ΔH2 of 4.0 kcal
mol-1
(▬). When ΔH1 is smaller than ΔH2, the enthalpy gradually increases which decreases
as all the enzyme in the cell becomes saturated.
α = 0.1
0 1 2 3 4
0
1
2
3
4
5
Dif
fere
nti
al h
eats
/kca
l/m
ole
of
inje
ctan
t
Molar Ratio (M:E)
H1 = H
2 = 5.0 kcal mol
-1
H1 = 5.0, H
2 = 4.0 kcal mol
-1
H1 = 5.0, H
2 = 2.5 kcal mol
-1
H1 = 5.0, H
2 = 1.0 kcal mol
-1
H1 = 1.0, H
2 = 5.0 kcal mol
-1
H1 = 2.5, H
2 = 5.0 kcal mol
-1
H1 = 4.0, H
2 = 5.0 kcal mol
-1
Figure 3.29 Kb1 = 107 M
-1 and Kb2 = 10
6 M
-1 (α = 0.1) at different ΔH1 and ΔH2 values, shown
as differential heats per kcal per mole of injectant against molar ratio (M:E).
When Kb1 is 50 times higher than Kb2 a similar curve is observed to Figure 3.29 when ΔH2 is
kept constant at 5.0 kcal mol-1
and ΔH1 is decreased. When ΔH1 is kept at 5.0 kcal mol-1
and
ΔH2 is changed the kink becomes more pronounced to where the second enthalpy has a major
contribution to the overall profile. A difference of 1.0 kcal mol-1
is clearly seen compared to
Figure 3.29 and is even more apparent with a larger difference between the two ΔH values.

189
α = 0.02
0 1 2 3 4
0
1
2
3
4
5
Dif
fere
nti
al h
eats
/kca
l/m
ole
of
inje
ctan
t
Molar Ratio (M:E)
H1 = H
2 = 5.0 kcal mol
-1
H1 = 5.0, H
2 = 4.0 kcal mol
-1
H1 = 5.0, H
2 = 2.5 kcal mol
-1
H1 = 5.0, H
2 = 1.0 kcal mol
-1
H1 = 1.0, H
2 = 5.0 kcal mol
-1
H1 = 2.5, H
2 = 5.0 kcal mol
-1
H1 = 4.0, H
2 = 5.0 kcal mol
-1
Figure 3.30 Kb1 = 5 x 10⁷ M
-1 and Kb2 = 10
6 M
-1 (α = 0.02) at different ΔH1 and ΔH2 values,
shown as differential heats per kcal per mole of injectant against molar ratio (M:E).
When Kb2 is greater than Kb1 (α = 10 and 50) and the enthalpies are the same, a single binding
event is observed. When ΔH1 is constant at 5.0 kcal mol-1
and ΔH2 is decreased, similar to
when α = 1, a upwards concave kink is produced yet when the second enthalpy is constant at
5.0 kcal mol-1
and ΔH1 is changed initially up to approximately a molar ratio (M:E) of 0.5 a
sharp concave downwards kink is observed which gradually increases due to the higher
second enthalpy value which then diminishes as the enzyme becomes saturated. If the
binding constant is increased by 5 fold as shown in Figure 3.32, the first enthalpy has a
slightly larger contribution to the profile as the initial kink up to a molar ratio of 0.5 is less
than when Kb1 = 106 M
-1 and Kb2 = 10
7 M
-1 (Figure 3.31).

190
α = 10
0 1 2 3 4
0
1
2
3
4
5
Dif
fere
nti
al h
eats
/kca
l/m
ole
of
inje
ctan
t
Molar Ratio (M:E)
H1 = H
2 = 5.0 kcal mol
-1
H1 = 5.0, H
2 = 4.0 kcal mol
-1
H1 = 5.0, H
2 = 2.5 kcal mol
-1
H1 = 5.0, H
2 = 1.0 kcal mol
-1
H1 = 1.0, H
2 = 5.0 kcal mol
-1
H1 = 2.5, H
2 = 5.0 kcal mol
-1
H1 = 4.0, H
2 = 5.0 kcal mol
-1
Figure 3.31 Kb1 = 106 M
-1 and Kb2 = 10
7 M
-1 (α = 10) at different ΔH1 and ΔH2 values, shown
as differential heats per kcal per mole of injectant against molar ratio (M:E).
α = 50
0 1 2 3 4
0
1
2
3
4
5
Dif
fere
nti
al h
eats
/kca
l/m
ole
of
inje
ctan
t
Molar Ratio (M:E)
H1 = H
2 = 5.0 kcal mol
-1
H1 = 5.0, H
2 = 4.0 kcal mol
-1
H1 = 5.0, H
2 = 2.5 kcal mol
-1
H1 = 5.0, H
2 = 1.0 kcal mol
-1
H1 = 1.0, H
2 = 5.0 kcal mol
-1
H1 = 2.5, H
2 = 5.0 kcal mol
-1
H1 = 4.0, H
2 = 5.0 kcal mol
-1
Figure 3.32 Kb1 = 106 M
-1 and Kb2 = 5 x 10
7 M
-1 (α = 50) at different ΔH1 and ΔH2 values,
shown as differential heats per kcal per mole of injectant against molar ratio (M:E).

191
3.2.6 Metal-ion binding to BcII
Before analysing the experimental ITC data, it is worth mentioning the fitting models
which MicroCal have available with the VP-ITC217
.
The first model involves n number of non-interacting but equivalent sites. This model is used
for a simple n:1 (M:E) ratio systems or when the binding sites are the same. This fitting
model only provides one binding constant (Kb) and enthalpy (ΔH, per mole of injectant). If
there are several binding sites on a molecule i.e. 2, the single Kb value would refer to one of
the sites, therefore Kb must be squared and the enthalpy multiplied by two.
The second binding model has independent non-interacting sites and a fit provides, if n = 2,
Kb1 and ΔH1 for the first binding site and Kb2 and ΔH2 for the second binding site.
The final MicroCal model, sequential binding, is the same as our sequential model developed
here, dependent on the relevant values of Kb1 and Kb2, EM and EM2 are possible. If the
number of binding sites on the enzyme is two, the fitting system consists of two binding
constants (Kb1 and Kb2) and two enthalpies (ΔH1 and ΔH2). This model can be difficult to
distinguish compared to the independent non-interacting sites and may require other
techniques to confirm the experimental data.
These various modelling schemes were applied to the experimental data in which various
metal-ions were titrated against apo-BcII at a fixed pH maintained by different buffers, most
of which had been previously carried out in our laboratory by Hasina Motara.
The titration of zinc-ion into apo-BcII showed that above pH 6.80 (in MES buffer) two zinc-
ions bind per enzyme molecule and the ITC output appeared to indicate a single binding
event. The various modelling schemes described herein were applied to this data to try to
distinguish between cooperative binding, which would definitely appear as a single event, and
sequential binding which just happens to appear as a single binding event.
The first attempt to simulate the titration data was based on two independent but equivalent
sites per enzyme molecule provided by MicroCal. This is shown in Figure 3.33 and a best fit
in terms of the binding constant for each site Kb is 2.0 ± (0.4) x 106 M
-1 and an enthalpy ΔHobs
of 2.6 ± 0.7 kcal mol-1
per mole of injectant for the formation of both EM and EM2.
However, it is likely that the two sites in BcII are not equivalent as they involve different
binding sites/ligands.

192
Furthermore, there is the possibility of positive cooperativity in binding the two metal-ions.
Using ITC to detect cooperativity can be difficult especially when two or more binding site
have very similar binding constants or similar enthalpies of association.
0.0 0.5 1.0 1.5 2.0 2.5 3.0 3.5 4.0 4.5
0
2
-0.05
0.00
0.05
0.10
0.15
0.20
0.25
0.30
0.35
0 10 20 30 40 50 60 70 80 90
Time (min)
µca
l/se
c
Molar Ratio (M:E)
kcal
/mol
e of
inj
ecta
nt
Figure 3.33 Isotherm of ZnSO4 solution (3.6 x 10⁻⁴
M) titrated into apo-BcII solution (1.8 x
10-5
M) in MES buffer at pH 6.80 at 25oC. The single line is calculated assuming two
independent but equivalent sites per enzyme molecule.
The ITC trace was also simulated using a model in which the two sites are not equivalent.
The experimental data was fitted to a sequential binding model using MicroCal software. The
number of sites was fixed at two and the parameters Kb1 = 4.33 ± (3.5) x 106 M
-1, ΔH1 = 2.7 ±
0.07 kcal mol-1
, Kb2 = 8.85 ± (1.7) x 105 M
-1 and ΔH2 = 2.9 ± 0.1 kcal mol
-1 were obtained
from the simulation.
The simulation using the MicroCal program is shown in Figure 3.34 (○) compared to the
experimental data (■). The value for the initial enzyme concentration used in the program
was slightly changed in order to obtain a stoichiometric ratio of exactly 2. In order to
compare the sequential model developed in this work with the MicroCal model, these same
values for Kb1, ΔH1, Kb2 and ΔH2 were used. The resultant plot is shown as the solid red line
in Figure 3.34 and is in excellent agreement with the MicroCal model for sequential binding.
The two models provide similar results in terms of the first binding constant and enthalpy. As
expected the second binding constant (Kb2 = 8.85 ± (1.7) x 105 M
-1) and enthalpy (ΔH2 = 2.9 ±

193
0.1 kcal mol-1
) would be different from the independent but equivalent model (Kb = 2.0 ±
(0.4) x 106 M
-1 and ΔH = 2.6 ± 0.7 kcal mol
-1). The difference is not great and could
represent error in the experimental data/fit or that the second binding site of BcII is slightly
different to the first.
The individual species concentrations could be calculated which shows that a significant
concentration of the mono-zinc species is formed during the titration (Figure 3.34, bottom).
0.0
0.5
1.0
1.5
2.0
2.5
3.0
0 1 2 3 4 5
0.0
0.2
0.4
0.6
0.8
1.0
D
iffe
ren
tial
hea
ts/k
cal/
mo
le o
f in
ject
ant
Experimental data
Microcal sequential fit
Sequential simulation
Fraction of EM
Fraction of EM2
Fraction free enzyme
Fra
ctio
n o
f en
zym
e b
ou
nd
as
EM
or
EM
2
Molar Ratio (M:E)
Figure 3.34 Isotherm of ZnSO4 solution (3.6 x 10⁻⁴
M) titrated into apo-BcII solution (1.5 x
10-5
M) in MES buffer at pH 6.80 at 25oC fitted to MicroCals sequential model (○), our
sequential simulation (▬). The bottom graphs show the fraction of enzyme bound as either
EM (▬), EM2 (▬) or free enzyme (▬) using the sequential model.
Also shown in Figure 3.34 is the fraction of the enzyme bound as the mononuclear EM and
the binuclear EM2 as the ratio of M:E changes. At 1:1 ratio of M:E, 50% of the enzyme is
present as EM and 25% as EM2 i.e. 25% is still free apo-enzyme. As the ratio increases to 2:1
(M:E) the proportion of EM2 increases to 70% and that of EM decreases to 22% (8% free apo-
enzyme).

194
An attempt was made to simulate the experimental results based on a positive cooperative
model i.e. ˈconcertedˈ, without forming EM. To do this a binding constant
Kb of 3.83 x 10¹²
M-2
(as the product of the two bind constants Kb1.Kb2) and the combined ΔH
of 5.6 kcal mol-1
were used (Figure 3.35 (▬)).
Many attempts were made to simulate the experimental data by varying Kb and ΔH but it is
clear that a concerted model is not appropriate for this system.
0 1 2 3 4 5
0.0
0.5
1.0
1.5
2.0
2.5
3.0
Dif
fere
nti
al h
eats
/kca
l/m
ole
of
inje
ctan
t
Experimental data
Microcal sequential fit
Sequential simulation
Concerted simulation
Molar Ratio
Figure 3.35 Isotherm of ZnSO4 solution (3.6 x 10⁻⁴
M) titrated into apo-BcII solution (1.5 x
10-5
M) in MES buffer at pH 6.80 at 25oC fitted to MicroCals sequential model (○), our
sequential simulation (▬) and the concerted model (▬) for the formation of EM2.
A summary of the simulated binding constants for the two non-interacting but equivalent and
the sequential model are shown in Table 3.5 for zinc-ion at pH 6.80.
MicroCal Two non-
interacting but equivalent
sites
MicroCal/our sequential model
Kb
(M-1
)
ΔHobs
(kcal mol-1
)
Kb1
(M-1
)
ΔH1
(kcal mol-1
)
Kb2
(M-1
)
ΔH2
(kcal mol-1
)
2.0 ± (0.4)
x 106
2.6 ± 0.7 4.33 ± (3.5)
x 106
2.7 ± 0.07 8.85 ± (1.7)
x 105
2.9 ± 0.1
Table 3.5 Summary of binding constants and enthalpies using the non-interacting but
equivalent model and the sequential model for ZnSO4 titrated into apo-BcII in MES buffer at
pH 6.80 at 25oC.

195
Another example where BcII exhibits a stoichiometric ratio of 2 from ITC experiments with
respect to zinc-ion per enzyme is in cacodylate buffer at pH 6.35, 25oC. The ITC
experimental data shown in Figure 3.36 was firstly fitted using the MicroCal single binding
model (two independent and equivalent binding processes). This gives a binding constant Kb
of 2.3 ± (0.3) x 106 M
-1 and an enthalpy (ΔHobs) of 6.2 ± 1.9 kcal mol
-1, for the formation of
both EM and EM2.
Figure 3.36 ITC output for ZnSO4 solution (3.6 x 10⁻⁴
M) titrated into apoBcII solution (1.8 x
10-5
M) in cacodylate buffer at pH 6.35 at 25oC.
The second simulation used the MicroCal sequential model where the molar ratio was fixed at
two. This model is shown in Figure 3.37 and the best fit parameters for Kb1 = 1.37 ± (1.1) x
107 M
-1, ΔH1 = 5.8 ± 0.07 kcal mol
-1, Kb2 = 5.14 (± 0.55) x 10
5 M
-1 and ΔH2 = 6.7 ± 0.1 kcal
mol-1
. Again these values were used in our model for a sequential process simply to check
whether our model corresponded to MicroCals model. Exactly the same profile as the
MicroCal model was produced. The values obtained from the sequential fit are slightly
different compared to the single non-equivalent but identical model, this difference is most
likely due to the goodness of the fit. Also shown again is the fraction of EM and the EM2 as
the molar ratio of M:E changes. At a ratio of 1:1, there is 69% of EM and 14% of EM2. At a
2:1 M to E ratio there is 64% EM2 and 27% of EM.

196
0
1
2
3
4
5
6
0 1 2 3 4 5
0.0
0.2
0.4
0.6
0.8
1.0
Dif
fere
nti
al h
eats
/kca
l/m
ole
of
inje
ctan
t Experimental data
MicroCal Sequential fit
Sequential simulation
Fraction of EM
Fraction of EM2
Fraction of free enzyme
Fra
ctio
n o
f en
zym
e bound a
s E
M o
r E
M2
Molar Ratio (M:E)
Figure 3.37 Isotherm of ZnSO4 solution (3.6 x 10⁻⁴
M) titrated into apo-BcII solution (1.7 x
10-5
M) in cacodylate buffer at pH 6.35 at 25oC fitted to MicroCals sequential model (○) and
our sequential simulation (▬). The bottom graph show the fraction of enzyme either bound as
EM (▬), EM2 (▬) or free enzyme (▬) for the sequential model.
A simulation of the data assuming a positive cooperative binding model i.e. concerted
formation of EM2 with no detectable formation of EM using our cubic equation, used the
product of the two binding constants and the sum of the two separate enthalpies (Figure 3.38,
(▬)). The simulation showed that a binding constant of 7.02 x 10¹²
M-2
was too steep and
produced slightly more heat upon the metal complexing to enzyme to form EM2. Reducing
the binding constant by 10 fold (Figure 3.38, (▬)) produces less heat as expected but the
shape of the curve still does not reflect the experimental data and again many attempts were
made to fit the experimental data by varying Kb and ΔH, but were unsuccessful.

197
0 1 2 3 4 5
0
1
2
3
4
5
6
Experimental data
MicroCal Sequential fit
Sequential simulation
Concerted simulation
Concerted simulation (K = 1011
M-2)
Dif
fere
nti
al h
eats
/kca
l/m
ole
of
inje
ctan
t
Molar Ratio (M:E)
Figure 3.38 Isotherm of ZnSO4 solution (3.6 x 10⁻⁴
M) titrated into apo-BcII solution (1.7 x
10-5
M) in cacodylate buffer at pH 6.35 at 25oC fitted to MicroCals sequential model (○),
sequential simulation (▬) and concerted simulation (▬ , ▬).
A summary of the simulated binding constants for the two non-interacting but equivalent and
the sequential model are shown in Table 3.6 for zinc-ion at pH 6.35.
MicroCal Two non-
interacting but equivalent
sites
MicroCal/our sequential model
Kb
(M-1
)
ΔHobs
(kcal mol-1
)
Kb1
(M-1
)
ΔH1
(kcal mol-1
)
Kb2
(M-1
)
ΔH2
(kcal mol-1
)
2.3 ± (0.3)
x 106
6.2 ± 1.9 1.37 ± (1.1)
x 107
5.8 ± 0.07 5.14 (± 0.55)
x 105
6.7 ± 0.1
Table 3.6 Summary of binding constants and enthalpies using the non-interacting but
equivalent model and the sequential model for ZnSO4 titrated into apo-BcII in cacodylate
buffer at pH 6.35 at 25oC.

198
Cobalt complexing with apo-BcII results in a similar ITC trace in which it is not easy to
identify two discrete binding events. It is clear however that the ultimate stoichiometry of
cobalt:enzyme complex is 2:1. The experimental data was first fitted to MicroCals single
binding model where there are two independent but equivalent binding sites on each enzyme
molecule, which gave a binding constant (Kb) of 2.49 ± (0.4) x 106 M
-1 and a ΔHobs of 15.6 ±
2.9 kcal mol-1
for the formation of both EM and EM2.
0.0 0.5 1.0 1.5 2.0 2.5 3.0 3.5
-2
0
2
4
6
8
10
12
14
16
18
0.0
0.5
1.0
1.5
2.0
0 10 20 30 40 50 60 70 80 90 100 110
Time (min)
µca
l/se
c
Molar Ratio (M:E)
kca
l/m
ole
of
inje
ctan
t
Figure 3.39 ITC output for CoCl2 solution (3.6 x 10⁻⁴
M) titrated into apoBcII solution (1.8 x
10-5
M) in cacodylate buffer at pH 6.80 at 25oC.
The second simulation assuming two sites which bind metal-ions sequentially using the
MicroCal software gave Kb1 = 8.97 ± (1.3) x 105 M
-1, ΔH1 = 16.8 ± 0.3 kcal mol
-1, Kb2 = 1.70
± (1.3) x 106 M
-1 and ΔH2 = 14.1 ± 0.3 kcal mol
-1 (Figure 3.39 (○)). Again the difference
between the single non-equivalent but identical model and the sequential model is very small,
the theoretical fit for both models are good but there is less error in the enthalpies for the
sequential model. A simulation using the model developed in this work based on the
sequential model gave an identical ITC trace to that from the MicroCal (Figure 3.40). At 1:1
ratio of Co2+
, BcII corresponds to 25% of EM and 35% of EM2 but increasing the ratio to 2:1
gives 11% EM and 75% EM2.

199
0
2
4
6
8
10
12
14
16
18
0 1 2 3 4
0.0
0.2
0.4
0.6
0.8
1.0
D
iffe
renti
al h
etas
/kca
l/m
ole
of
inje
ctan
t Experimental data
Microcal sequential fit
Sequential simulation
F
ract
ion o
f en
zym
e bound a
s E
M o
r E
M2 Fraction of EM
Fraction of EM2
Fraction of free enzyme
Molar Ratio
Figure 3.40 Isotherm of CoCl2 solution (3.6 x 10⁻⁴
M) titrated into apo-BcII solution (2.2 x
10-5
M) in cacodylate buffer at pH 6.80 at 25oC fitted to MicroCals sequential model (○) and
our sequential simulation (▬). The bottom graphs show the fraction of enzyme bound as
either EM (▬), EM2 (▬) or free enzyme (▬) using the sequential model.

200
A final attempt to simulate the experimental data using our concerted binding model
assuming positive cooperativity with no formation of EM proved to be unsuccessful as shown
by one of the simulations in Figure 3.41 (▬) using Kb = 1.5 x 10¹²
M-2
and an enthalpy (ΔH)
= 30.9 kcal mol-1
.
0.0 0.5 1.0 1.5 2.0 2.5 3.0 3.5 4.0
-2
0
2
4
6
8
10
12
14
16
18
Experimental data
Microcal sequential fit
Sequential simulation
Concerted simulation
Dif
fere
nti
al h
etas
/kca
l/m
ole
of
inje
ctan
t
Molar Ratio
Figure 3.41 Isotherm of CoCl2 solution (3.6 x 10⁻⁴
M) titrated into apo-BcII solution (2.2 x
10-5
M) in cacodylate buffer at pH 6.80 at 25oC fitted to MicroCals sequential model (○),
sequential simulation (▬) and concerted simulation (▬).
A summary of the simulated binding constants for the two non-interacting but equivalent and
the sequential model are shown in Table 3.7 for cobalt-ion at pH 6.80.
MicroCal Two non-
interacting but equivalent
sites
MicroCal/our sequential model
Kb
(M-1
)
ΔHobs
(kcal mol-1
)
Kb1
(M-1
)
ΔH1
(kcal mol-1
)
Kb2
(M-1
)
ΔH2
(kcal mol-1
)
2.49 ± (0.4)
x 106
15.5 ± 2.9 8.97 ± (1.3)
x 105
16.8 ± 0.3 1.70 ± (1.3) x
106
14.1 ± 0.3
Table 3.7 Summary of binding constants and enthalpies using the non-interacting but
equivalent model and the sequential model for CoCl2 titrated into apo-BcII in cacodylate
buffer at pH 6.80 at 25oC

201
A completely different profile is observed at pH 7.20 for the titration of cadmium-ion to apo-
BcII (Figure 3.42), the isotherm shows two distinctive binding events. Binding of cadmium-
ion occurs non-cooperatively and independently, the enzyme binds the first cadmium-ion and
then the second cadmium-ion.
0.0 0.5 1.0 1.5 2.0 2.5 3.0 3.5
-14
-12
-10
-8
-6
-4
-2
0
-1.6
-1.4
-1.2
-1.0
-0.8
-0.6
-0.4
-0.2
0.0
0.20 10 20 30 40 50 60 70
Time (min)
µca
l/se
c
Molar Ratio (M:E)
kcal
/mol
e of
inje
ctan
t
Figure 3.42 ITC output for CdCl2 solution (3.6x10⁻⁴
M) titrated into apoBcII solution (1.8 x
10-5
M) in HEPES buffer at pH 7.20 at 25oC
The experimental data was fit to the MicroCal two independent non-interacting sites which
produced Kb1 = 3.65 x 10⁸ M
-1, ΔH1 = -12.4 kcal mol
-1, Kb2 = 5.29 x 10
6 M
-1 and ΔH2 = -4.8
kcal mol-1
. It may be difficult to distinguish between completely independent or slightly
interacting; an attempt was made to simulate the experimental data to the sequential model
(Figure 3.43). The MicroCal sequential fit produced Kb1 = 5.23 (± 6.1) x 108 M
-1, ΔH1 = -
12.3 ± 0.3kcal mol-1
, Kb2 = 1.35 (± 1.6) x 107 M
-1 and ΔH2 = -3.7 ± 0.4 kcal mol
-1.

202
-14
-12
-10
-8
-6
-4
-2
0
0.0 0.5 1.0 1.5 2.0 2.5 3.0 3.5
0.0
0.2
0.4
0.6
0.8
1.0
Experimental data
MicroCal sequential fit
Sequential simulation D
iffe
renti
al h
eats
/kca
l/m
ole
of
inje
ctan
t
Fra
ctio
n o
f en
zym
e bound a
s E
M o
r E
M2
Fraction of EM
Fraction of EM2
Fraction of free enzyme
Molar Ratio (M:E)
Figure 3.43 Isotherm of CdCl2 solution (3.6 x 10⁻⁴
M) titrated into apo-BcII solution (1.8 x
10-5
M) in HEPES buffer at pH 7.20 at 25oC fitted to MicroCals sequential model (○) and our
sequential simulation (▬). The bottom graphs show the fraction of enzyme bound as either
EM (▬), EM2 (▬) or free enzyme (▬) using the sequential model.
A summary of the simulated binding constants for the two non-interacting but equivalent and
the sequential model are shown in Table 3.8 for cobalt-ion at pH 7.20.
MicroCal Two independent non-interacting
sites
MicroCal/our sequential model
Kb1
(M-1
)
ΔH1
(kcal
mol-1
)
Kb2
(M-1
)
ΔH2
(kcal
mol-1
)
Kb1
(M-1
)
ΔH1
(kcal
mol-1
)
Kb2
(M-1
)
ΔH2
(kcal
mol-1
)
3.65
x 108
-12.4 5.29
x 106
-4.8 5.23
(± 6.1)
x 108
-12.3
± 0.3
1.35
(± 1.6)
x 107
-3.7
± 0.4
Table 3.8 Summary of binding constants and enthalpies using the two independent non-
interacting model and the sequential model for CdCl2 titrated into apo-BcII in HEPES buffer
at pH 7.20 at 25oC.

203
Metal, buffer, pH
MicroCal Two non-interacting but
equivalent sites MicroCal/our sequential model
Kb (M-1
) ΔHobs (kcal mol-1
) Kb1 (M-1
) ΔH1 (kcal mol-1
) Kb2 (M-1
) ΔH2 (kcal mol-1
)
ZnSO4, MES, pH 6.80 2.0 ± (0.4) x 106 2.6 ± 0.7 4.33 ± (3.5) x 10
6 2.7 ± 0.07 8.85 ± (1.7) x 10
5 2.9 ± 0.1
ZnSO4, cacodylate, pH 6.35 2.3 ± (0.3) x 106 6.2 ± 1.9 1.37 ± (1.1) x 10
7 5.8 ± 0.07 5.14 (± 0.55) x 10
5 6.7 ± 0.1
CoCl2, cacodylate, pH 6.80 2.49 ± (0.4) x 106 15.5 ± 2.9 8.97 ± (1.3) x 10
5 16.8 ± 0.3 1.70 ± (1.3) x 10
6 14.1 ± 0.3
Table 3.9 Summary of the binding constants and enthalpies for the three isotherms which show a single binding event fitted to MicroCals two non-interacting
but equivalent model and MicroCals/our sequential model.
Fitting the different models to experimental data has shown that investigating positive cooperativity is difficult. Titrating metal-ions such as zinc and cobalt,
a single binding event is observed and simulating the curves using MicroCals non-interacting but equivalent sites does fit the data with binding constants
ranging from 2.0 x 10⁶ – 2.5 x 10
6 M
-1 therefore the overall binding constant for the two sites of BcII range from 4.0 x 10
12 – 6.25 x 10
12 M
-2. Using the
sequential model the first binding constant (Kb1) varies much more from 9.0 x 10⁵ – 1.4 x 10
7 M
-1 and the second binding constant (Kb2) from 5.1 x 10
5 – 1.7 x
106 M
-1. The overall binding constant for BcII using the sequential model range from 1.5 x 10
12 – 7.0 x 10
12 M
-1, this is a larger range than the non-interacting
but equivalent binding model but between the two models the values are in the same order of magnitude. It is likely that BcII has different binding constants
as the two sites contain different amino acids. Many attempts were made at fitting the experimental data to our positively cooperative (concerted) model by
using various values of Kb and ΔH, but were unsuccessful, which suggests that BcII binds metal-ions in a sequential manner producing both EM and EM2 as
metal-ion is titrated.

204
3.2.7 Conclusion
We have been able to develop and confirm the commercial MicroCal software is
capable of determining simple 1:1, sequential and independent but not interacting reactions
between metal-ion and enzyme or host-guest chemistry. A striking feature of the positively
cooperative (concerted) model without any formation of the intermediate EM is at ‘low’
binding constants such as 1010
M-2
where a slight concave character is observed when plotting
the fraction of enzyme as EM2 against molar ratio (M:E). This feature is transferred to the
differential heats plot against molar ratio (M:E) and is most likely due to low concentrations
of EM2 being formed as the metal-ion concentrations in the cell within the initial stages of the
titration are very low. The sequential model on the other hand is capable of forming both
EM and EM2 dependent on the relative values of the two binding constants. Comparing our
sequential and positively concerted model, the two simulations clearly demonstrate that the
sequential model converges into a positively cooperative model when Kb2 >> Kb1 and when α
≥ 100. When α is below 100, the fraction of enzyme existing as EM dominates and the
overall fraction of enzyme as either species (EM+EM2) is greater in the sequential simulation
then the fraction of EM2 in the concerted model, which may indicate the overall stability of
the mononuclear species is more stable than the binuclear species.
The two models were used in conjunction with the MicroCal sequential simulation to re-
analyse the experimental data of titrating metal-ions such as zinc and cobalt into BcII
solution, which provide a single binding event with a stoichiometric ratio of 2. Using the
MicroCal sequential model, the binding constants Kb1 and Kb2 were obtained with their
relevant enthalpies dependent on the buffer used. The values suggest slight negative
cooperativity between the two binding sites or it is possible that the two sites are independent
and identical. The overall binding constants for the two sites are within experimental error
using either the independent but identical model or the sequential model. Although initially
suggesting that BcII only binds metal-ions in a positively cooperative event, the ITC data
does not fit a positively concerted model and therefore can be considered a sequential
processes with the two sites have similar binding constants within error or slight negative
cooperativity upon binding of the second metal-ion. The isotherm of cadmium complexing
with apo-BcII shows two distinct events and can be simulated with either the sequential
model or independent non-interacting sites model. Both models fit the experimental data but
the independent non-interacting model does fit better than the sequential model, which
suggests when apo-BcII complexes with cadmium, it does via an independent non-interacting
process.

205
Chapter 4 – PUBLISHED PAPERS
‘The relative hydrolytic reactivities of pyrophosphites and pyrophosphates’
D. Mistry and N. Powles, Organic & Biomolecular Chemistry, 2013, 11, 5727-5733.
‘Unusual Stability and Carbon Acidity of a Dicationic Carbon Species’
D. Mistry, N. Powles and M. I. Page, The Journal of Organic Chemistry, 2013, 78,
10732-10736.
'pH and Basicity of Ligands Control the Binding of Metal-ions to B.cereus B1 β-
Lactamase'
H. Motara, D. Mistry, D. R. Brown, R. A. Cryan and M. I. Page, Chemical Science,
2014, DOI: 10.1039/C4SC00601A.

206
Chapter 5 – REFERENCES
1. M. W. Bowler, M. J. Cliff, J. P. Waltho and G. M. Blackburn, New Journal of
Chemistry, 2010, 34, 784-794.
2. J. D. Watson and F. H. C. Crick, Cold Spring Harbor Symposia on Quantitative
Biology, 1953, 18, 123-131.
3. S. Mikkola, E. Stenman, K. Nurmi, E. Yousefi-Salakdeh, R. Stromberg and H.
Lonnberg, Journal of the Chemical Society, Perkin Transactions 2, 1999, 1619-1626.
4. R. H. Horton, Principles of Biochemistry, 4th ed.,International edn., Pearson Prentice
Hall, Upper Saddle River, N.J, London, 2006.
5. Z. Shabarova and A. Bogdanov, in Advanced Organic Chemistry of Nucleic Acids,
Wiley-VCH Verlag GmbH, Editon edn., 2007, pp. 1-32.
6. M. A. Pasek, T. P. Kee, D. E. Bryant, A. A. Pavlov and J. I. Lunine, Angewandte
Chemie International Edition, 2008, 47, 7918-7920.
7. J. Sutton, Biology, Macmillan Publishers Limited, 1998.
8. A. P. H. J. J. Zuckerman, ed., Inorganic Reactions and Methods, The Formation of
Bonds to Group VIB (O, S, Se, Te, Po) Elements, Part 1, John Wiley & Sons, 2009.
9. W. Gerrard, M. J. D. Isaacs, G. Machell, K. B. Smith and P. L. Wyvill, Journal of the
Chemical Society (Resumed), 1953, 1920-1926.
10. S. A. Todd, Proceedings of the National Academy of Sciences, 1959, 45, 1389-1397.
11. V. M. Clark, G. W. Kirby and A. Todd, Nature, 1958, 181, 1650-1652.
12. V. M. Clark, G. W. Kirby and A. Todd, Journal of the Chemical Society (Resumed),
1957, 1497-1501.
13. Z. Shabarova and A. Bogdanov, in Advanced Organic Chemistry of Nucleic Acids,
Wiley-VCH Verlag GmbH, Editon edn., 2007, pp. 93-180.
14. K. D. Troev, in Chemistry and Application of H-Phosphonates, Elsevier Science Ltd,
Amsterdam, Editon edn., 2006, pp. 1-291.
15. H. A. Sober and W. P. Jencks, Handbook of Biochemistry ed, Chemical Rubber Co.,
Cleveland, OH, 1968.
16. A. Kraszewski, Pure and Applied Chemistry, 2007, 79, 2217-2227.
17. N. Powles, J. Atherton and M. I. Page, Organic & Biomolecular Chemistry, 2012, 10,
5940-5947.
18. R. B. Martin, Journal of the American Chemical Society, 1959, 81, 1574-1576.
19. Z. Luz and B. Silver, Journal of the American Chemical Society, 1961, 83, 4518-
4521.
20. B. Silver and Z. Luz, Journal of the American Chemical Society, 1962, 84, 1091-
1095.
21. E. S. Lewis and L. G. Spears, Journal of the American Chemical Society, 1985, 107,
3918-3921.
22. F. H. Westheimer, S. Huang and F. Covitz, Journal of the American Chemical
Society, 1988, 110, 181-185.
23. R. N. Mehrotra, European Chemical Bulletin, 2013, 2, 758-776.
24. W. P. Jencks and J. Regenstein, in Handbook of Biochemistry and Molecular Biology,
Fourth Edition, CRC Press, Editon edn., 2010, pp. 595-635.
25. J. P. Guthrie, Canadian Journal of Chemistry, 1979, 57, 236-239.
26. S. C. L. Kamerlin and J. Wilkie, Organic & Biomolecular Chemistry, 2007, 5, 2098-
2108.
27. C. A. Bunton, Journal of Chemical Education, 1968, 45, 21.
28. J. Florián and A. Warshel, The Journal of Physical Chemistry B, 1998, 102, 719-734.
29. A. C. Hengge and I. Onyido, Current Organic Chemistry, 2005, 9, 61-74.
30. J. K. Lassila, J. G. Zalatan and D. Herschlag, Annual Review of Biochemistry, 2011,
80, 669-702.
31. A. J. Kirby, M. Medeiros, J. R. Mora, P. S. M. Oliveira, A. Amer, N. H. Williams and
F. Nome, The Journal of Organic Chemistry, 2013, 78, 1343-1353.

207
32. C. A. Bunton, D. R. Llewellyn, K. G. Oldham and C. A. Vernon, Journal of the
Chemical Society (Resumed), 1958, 3574-3587.
33. A. J. Kirby and A. G. Varvoglis, Journal of the American Chemical Society, 1967, 89,
415-423.
34. P. W. C. Barnard, C. A. Bunton, D. Kellerman, M. M. Mhala, B. Silver, C. A. Vernon
and V. A. Welch, Journal of the Chemical Society B: Physical Organic, 1966, 227-
235.
35. C. A. Bunton and S. J. Farber, The Journal of Organic Chemistry, 1969, 34, 767-772.
36. C. Bunton, M. Mhala, K. Oldham and C. Vernon, Journal of the Chemical Society
(Resumed), 1960, 3293-3301.
37. J. Kumamoto and F. H. Westheimer, Journal of the American Chemical Society,
1955, 77, 2515-2518.
38. N. H. Williams and P. Wyman, Chemical Communications, 2001, 1268-1269.
39. A. J. Kirby and M. Younas, Journal of the Chemical Society B: Physical Organic,
1970, 510-513.
40. N. Tarrat, Journal of Molecular Structure: THEOCHEM, 2010, 941, 56-60.
41. E. Karl-Kroupa, C. F. Callis and E. Seifter, Industrial & Engineering Chemistry,
1957, 49, 2061-2062.
42. G. A. Abbott, Journal of the American Chemical Society, 1909, 31, 763-770.
43. J. W. Williard, Y. K. Kim and J. M. Sullivan, Journal of Chemical & Engineering
Data, 1984, 29, 436-438.
44. R. K. Osterheld, The Journal of Physical Chemistry, 1958, 62, 1133-1135.
45. J. D. McGilvery and J. P. Crowther, Canadian Journal of Chemistry, 1954, 32, 174-
185.
46. D. L. Miller and T. Ukena, Journal of the American Chemical Society, 1969, 91,
3050-3053.
47. E. Mayaan, K. Range and D. York, J Biol Inorg Chem, 2004, 9, 807-817.
48. P. J. Briggs, D. P. N. Satchell and G. F. White, Journal of the Chemical Society B:
Physical Organic, 1970, 1008-1012.
49. N. H. Williams, A.-M. Lebuis and J. Chin, Journal of the American Chemical
Society, 1999, 121, 3341-3348.
50. N. H. Williams, Journal of the American Chemical Society, 2000, 122, 12023-12024.
51. S. J. Admiraal and D. Herschlag, Chemistry & Biology, 1995, 2, 729-739.
52. C. H. Oestreich and M. M. Jones, Biochemistry, 1967, 6, 1515-1519.
53. W. P. Taylor and T. S. Widlanski, Chemistry & Biology, 1995, 2, 713-718.
54. T. S. Widlanski and W. Taylor, in Comprehensive Natural Products Chemistry, eds.
S. D. Barton, K. Nakanishi and O. Meth-Cohn, Pergamon, Oxford, Editon edn., 1999,
pp. 139-162.
55. L. Sun, D. C. Martin and E. R. Kantrowitz, Biochemistry, 1999, 38, 2842-2848.
56. J. G. Zalatan, T. D. Fenn, A. T. Brunger and D. Herschlag, Biochemistry, 2006, 45,
9788-9803.
57. M. L. Applebury and J. E. Coleman, Journal of Biological Chemistry, 1969, 244,
308-318.
58. J. A. Reynolds and M. J. Schlesinger, Biochemistry, 1967, 6, 3552-3559.
59. T. Salminen, J. Kaepylae, P. Heikinheimo, J. Kankare, A. Goldman, J. Heinonen, A.
A. Baykov, B. S. Cooperman and R. Lahti, Biochemistry, 1995, 34, 782-791.
60. E. H. Harutyunyan, I. P. Kuranova, B. K. Vainshtein, W. E. Höhne, V. S. Lamzin, Z.
Dauter, A. V. Teplyakov and K. S. Wilson, European Journal of Biochemistry, 1996,
239, 220-228.
61. S. Avaeva, O. Grigorjeva, V. Mitkevich, V. Sklyankina and S. Varfolomeyev, FEBS
Letters, 1999, 464, 169-173.
62. T. Sitnik, J. Vainonen, E. Rodina, T. Nazarova, S. Kurilova, N. Vorobyeva and S.
Avaeva, IUBMB Life, 2003, 55, 37-41.
63. T. Hyytiä, P. Halonen, A. Salminen, A. Goldman, R. Lahti and B. S. Cooperman,
Biochemistry, 2001, 40, 4645-4653.

208
64. L. Yang, R.-Z. Liao, J.-G. Yu and R.-Z. Liu, The Journal of Physical Chemistry B,
2009, 113, 6505-6510.
65. T. Kajander, J. Kellosalo and A. Goldman, FEBS Letters, 2013, 587, 1863-1869.
66. S. Muniyan, N. Chaturvedi, J. Dwyer, C. LaGrange, W. Chaney and M.-F. Lin,
International Journal of Molecular Sciences, 2013, 14, 10438-10464.
67. T. Klabunde, N. Sträter, R. Fröhlich, H. Witzel and B. Krebs, Journal of Molecular
Biology, 1996, 259, 737-748.
68. G. Schenk, N. Mitić, G. R. Hanson and P. Comba, Coordination Chemistry Reviews,
2013, 257, 473-482.
69. D. Barford, A. K. Das and M.-P. Egloff, Annual Review of Biophysics and
Biomolecular Structure, 1998, 27, 133-164.
70. D. Barford, in Handbook of Cell Signaling (Second Edition), Academic Press, San
Diego, Editon edn., 2010, pp. 677-681.
71. Y. Shi, Cell, 2009, 139, 468-484.
72. J. Sanvoisin and D. Gani, Bioorganic & Medicinal Chemistry Letters, 2001, 11, 471-
474.
73. E. van Schaftingen and I. Gerin, Biochemical Journal, 2002, 362, 513-532.
74. A. Burchell, Kidney International 1996, 49, 953-958.
75. A. Ghosh, J.-J. Shieh, C.-J. Pan, M.-S. Sun and J. Y. Chou, Journal of Biological
Chemistry, 2002, 277, 32837-32842.
76. J.-J. Shieh, M. Terzioglu, H. Hiraiwa, J. Marsh, C.-J. Pan, L.-Y. Chen and J. Y. Chou,
Journal of Biological Chemistry, 2002, 277, 5047-5053.
77. A. Peet, Marks' Basic Medical Biochemistry, Fourth Ed. edn., Lippincott Williams &
Wilkins, Baltimore, 2012.
78. N. S. Ging and J. M. Sturtevant, Journal of the American Chemical Society, 1954, 76,
2087-2091.
79. P. Ohlmeyer and R. Shatas, Archives of Biochemistry and Biophysics, 1952, 36, 411-
420.
80. J. M. Sturtevant, Journal of the American Chemical Society, 1955, 77, 255-258.
81. R. C. Woledge and P. J. Reilly, Biophysical Journal, 1988, 54, 97-104.
82. R. C. Woledge, Progress in Biophysics and Molecular Biology, 1971, 22, 37-74.
83. F. D. Carlson, The Journal of general physiology, 1960, 44, 33-60.
84. R. B. Stockbridge and R. Wolfenden, Journal of Biological Chemistry, 2011, 286,
18538-18546.
85. M. J. Todd and J. Gomez, Analytical Biochemistry, 2001, 296, 179-187.
86. W. D. Kumler and J. J. Eiler, Journal of the American Chemical Society, 1943, 65,
2355-2361.
87. R. L. Carroll and R. E. Mesmer, Inorganic Chemistry, 1967, 6, 1137-1142.
88. R. E. Mesmer and R. L. Carroll, Journal of the American Chemical Society, 1966, 88,
1381-1387.
89. R. P. Mitra, H. C. Malhotra and D. V. S. Jain, Transactions of the Faraday Society,
1966, 62, 167-172.
90. J. P. Crowther and A. E. R. Westman, Canadian Journal of Chemistry, 1954, 32, 42-
48.
91. M. Kawabe, O. Ohashi and I. Yamaguchi, Bulletin of the Chemical Society of Japan,
1970, 43, 3705-3710.
92. N. T. Powles, PhD Thesis,University of Huddersfield, 2005.
93. M. Watanabe, S. Sato and H. Saito, Bulletin of the Chemical Society of Japan, 1976,
49, 2474-2478.
94. H. Fukada and K. Takahashi, Proteins: Structure, Function, and Bioinformatics,
1998, 33, 159-166.
95. M. Tetas and J. M. Lowenstein, Biochemistry, 1963, 2, 350-357.
96. S. Ueda and Y. Sasaki, Bulletin of the Chemical Society of Japan, 1971, 44, 1972-
1973.

209
97. I. E. Catrina and A. C. Hengge, Journal of the American Chemical Society, 1999,
121, 2156-2163.
98. D. E. Bryant, D. Greenfield, R. D. Walshaw, B. R. G. Johnson, B. Herschy, C. Smith,
M. A. Pasek, R. Telford, I. Scowen, T. Munshi, H. G. M. Edwards, C. R. Cousins, I.
A. Crawford and T. P. Kee, Geochimica et Cosmochimica Acta, 2013, 109, 90-112.
99. A. J. Felsenfeld and B. S. Levine, American Journal of Kidney Diseases : The
Official Journal of the National Kidney Foundation, 2012, 60, 655-661.
100. M. E. Stroppolo, M. Falconi, A. M. Caccuri and A. Desideri, Cellular and Molecular
Life Sciences 2001, 58, 1451-1460.
101. R. N. Goldberg, N. Kishore and R. M. Lennen, Journal of Physical and Chemical
Reference Data, 2002, 31, 231-370.
102. K. S. Pitzer, Journal of the American Chemical Society, 1937, 59, 2365-2371.
103. C.-h. Wu, R. J. Witnosky, P. George and R. J. Rutman, Journal of the American
Chemical Society, 1967, 89, 1987-1991.
104. J. E. Mills, C. A. Maryanoff, R. M. Cosgrove, L. Scott and D. F. McComsey, Organic
Preparations and Procedures International, 1984, 16, 97-114.
105. E. M. Arnett and R. Reich, Journal of the American Chemical Society, 1980, 102,
5892-5902.
106. D. N. Kevill, Journal of the Chemical Society, Chemical Communications, 1981, 421-
422.
107. W. Chen, S. A. Elfeky, Y. Nonne, L. Male, K. Ahmed, C. Amiable, P. Axe, S.
Yamada, T. D. James, S. D. Bull and J. S. Fossey, Chemical Communications, 2011,
47, 253-255.
108. J. Marek, P. Stodulka, J. Cabal, O. Soukup, M. Pohanka, J. Korabecny, K. Musilek
and K. Kuca, Molecules, 2010, 15, 1967-1972.
109. E. M. Kosower, Journal of the American Chemical Society, 1955, 77, 3883-3885.
110. P. Madaan and V. K. Tyagi, Journal of Oleo Science, 2008, 57, 197-215.
111. C. D. Vanderwal, The Journal of Organic Chemistry, 2011, 76, 9555-9567.
112. T. M. Nguyen, M. d. R. Sanchez-Salvatori, J.-C. Wypych and C. Marazano, The
Journal of Organic Chemistry, 2007, 72, 5916-5919.
113. Y. Okamoto and Y. Shimakawa, The Journal of Organic Chemistry, 1970, 35, 3752-
3756.
114. P. C. Kearney and D. D. Kaufman, Herbicides: Chemistry, Degradation and Mode of
Action, Marcel Dekker, New York, 1967.
115. J. R. Casey, P. E. Morgan, D. Vullo, A. Scozzafava, A. Mastrolorenzo and C. T.
Supuran, Journal of Medicinal Chemistry, 2004, 47, 2337-2347.
116. M. Gholizadeh, B. Maleki, M. Pourayoubi, M. Kia and B. Notash, Acta
Crystallographica Section E, 2011, 67, o1614-o1615.
117. A. Albert-Kiszely, B. E. Pjetursson, G. E. Salvi, J. Witt, A. Hamilton, G. R. Persson
and N. P. Lang, Journal of Clinical Periodontology, 2007, 34, 658-667.
118. M. Diaw, A. Chagnes, B. Carré, P. Willmann and D. Lemordant, Journal of Power
Sources, 2005, 146, 682-684.
119. K. Fujimoto, D. Morisaki, M. Yoshida, T. Namba, K. Hye-Sook, Y. Wataya, H.
Kourai, H. Kakuta and K. Sasaki, Bioorganic & Medicinal Chemistry Letters, 2006,
16, 2758-2760.
120. J. R. Harjani, R. D. Singer, M. T. Garcia and P. J. Scammells, Green Chemistry,
2009, 11, 83-90.
121. B. Bittner, R. J. Wrobel and E. Milchert, The Journal of Chemical Thermodynamics,
2012, 55, 159-165.
122. R. P. Swatloski, S. K. Spear, J. D. Holbrey and R. D. Rogers, Journal of the
American Chemical Society, 2002, 124, 4974-4975.
123. S. Zhu, Y. Wu, Q. Chen, Z. Yu, C. Wang, S. Jin, Y. Ding and G. Wu, Green
Chemistry, 2006, 8, 325-327.
124. M. Gericke, P. Fardim and T. Heinze, Molecules, 2012, 17, 7458-7502.

210
125. S. H. Baer and A. B. Prescott, Journal of the American Chemical Society, 1896, 18,
988-989.
126. B. Almarzoqi, A. V. George and N. S. Isaacs, Tetrahedron, 1986, 42, 601-607.
127. F. Kröhnke, Chemische Berichte, 1950, 83, 50-59.
128. I. Brudgam and H. Hartl, Acta Crystallographica Section C, 1986, 42, 866-868.
129. W.-Z. Fu, W.-J. Wang, Y.-Y. Niu and S. W. Ng, Acta Crystallographica Section E,
2010, 66, o1211.
130. M. Al-Ktaifani and M. Rukiah, Chem. Pap., 2011, 65, 469-476.
131. M. H. O'Leary and R. W. Stach, The Journal of Organic Chemistry, 1972, 37, 1491-
1493.
132. E. M. Kosower and J. W. Patton, Tetrahedron, 1966, 22, 2081-2093.
133. R. A. Olofson and D. M. Zimmerman, Journal of the American Chemical Society,
1967, 89, 5057-5059.
134. C. Fernandez, V. G. Toscano, H. Chaimovich, M. J. Politi and N. Hioka, Journal of
Physical Organic Chemistry, 1998, 11, 25-30.
135. A. N. Kost, S. P. Gromov and R. S. Sagitullin, Tetrahedron, 1981, 37, 3423-3454.
136. E. Klingsberg, The Chemistry of Heterocyclic Compounds, Pyridine and Its
Derivatives Part 2, Interscience Publishers, New York, 1961.
137. J. Kavalek, J. Polanský and V. Štěrba, Collection of Czechoslovak Chemical
Communications, 1974, 39, 1049-1060.
138. R. Eisenthal and A. R. Katritzky, Tetrahedron, 1965, 21, 2205-2213.
139. S. L. Johnson and K. A. Rumon, Tetrahedron Letters, 1966, 7, 1721-1726.
140. F. T. Boyle and R. Hull, Journal of the Chemical Society, Perkin Transactions 1,
1974, 1541-1546.
141. R. G. Pearson and R. L. Dillon, Journal of the American Chemical Society, 1953, 75,
2439-2443.
142. F. A. Carey and R. J. Sundberg, Advanced Organic Chemistry: Part A: Structure and
Mechanisms, Springer, 2007.
143. E. V. Anslyn and D. A. Dougherty, Modern Physical Organic Chemistry, University
Science, 2006.
144. J. P. Richard, G. Williams and J. Gao, Journal of the American Chemical Society,
1999, 121, 715-726.
145. J. Crugeiras, A. Rios, T. L. Amyes and J. P. Richard, Organic & Biomolecular
Chemistry, 2005, 3, 2145-2149.
146. J. P. Richard and T. L. Amyes, Current Opinion in Chemical Biology, 2001, 5, 626-
633.
147. P. A. Sims, A. L. Menefee, T. M. Larsen, S. O. Mansoorabadi and G. H. Reed,
Journal of Molecular Biology, 2006, 355, 422-431.
148. S. W. Benson, Angewandte Chemie International Edition in English, 1978, 17, 812-
819.
149. D.H.Williams and I. Fleming, Spectroscopic methods in organic chemistry, 5th edn.,
McGraw-Hill, England, 1996.
150. A. B. Rudine, M. G. Walter and C. C. Wamser, The Journal of Organic Chemistry,
2010, 75, 4292-4295.
151. K. B. Wiberg, Chemical Reviews, 1955, 55, 713-743.
152. H. C. Van der Plas, Accounts of Chemical Research, 1978, 11, 462-468.
153. J. A. Zoltewicz and C. L. Smith, Journal of the American Chemical Society, 1967, 89,
3358-3359.
154. J. A. Zoltewicz and L. S. Helmick, Journal of the American Chemical Society, 1970,
92, 7547-7552.
155. H. F. Koch, W. Tumas and R. Knoll, Journal of the American Chemical Society,
1981, 103, 5423-5429.
156. A. K. Covington, R. A. Robinson and R. G. Bates, The Journal of Physical
Chemistry, 1966, 70, 3820-3824.
157. M. Eigen, Angewandte Chemie International Edition in English, 1964, 3, 1-19.

211
158. J. P. Fox and W. P. Jencks, Journal of the American Chemical Society, 1974, 96,
1436-1449.
159. J. P. Richard, T. L. Amyes and M. M. Toteva, Accounts of Chemical Research, 2001,
34, 981-988.
160. A. Rios, A. C. O'Donoghue, T. L. Amyes and J. P. Richard, Canadian Journal of
Chemistry, 2005, 83, 1536-1542.
161. A. Rios, T. L. Amyes and J. P. Richard, Journal of the American Chemical Society,
2000, 122, 9373-9385.
162. A. E. Reed and P. v. R. Schleyer, Journal of the American Chemical Society, 1987,
109, 7362-7373.
163. S. Hati and D. Datta, The Journal of Organic Chemistry, 1992, 57, 6056-6057.
164. R. Lalancette, W. Furey, J. Costanzo, P. Hemmes and F. Jordan, Acta
Crystallographica Section B: Structural Crystallography and Crystal Chemistry,
1978, 34, 2950-2953.
165. M. N. Kammer, L. V. Koplitz and J. T. Mague, Acta Crystallographica Section E,
2013, 69, o1281.
166. N. Kebede and J. W. Pavlik, Journal of Heterocyclic Chemistry, 1997, 34, 685-686.
167. F. Li, Q. Chen, C.-C. Liu, Y.-H. Wu, X.-P. Liu and G.-F. Yang, Appl Magn Reson,
2012, 42, 169-177.
168. W. W. Paudler and L. S. Helmick, Chemical Communications (London), 1967, 377-
378.
169. R. B. Morin and M. Gorman, Chemistry and Biology of Beta-Lactam Antibiotics,
Academic Press, 1982.
170. M.I.Page, The Chemistry of β-Lactams, 1st Edition edn., Blackie Academic &
Professional, Glasgow, 1992.
171. G. Seltmann and O. Holst, The Bacterial Cell Wall, Springer, New York, 2002.
172. S. Srivastava, Understanding Bacteria, Kluwer Academic Publishers, Dordrecht,
Netherlands, 2003.
173. L. P. Kotra and S. Mobashery, Bulletin de l'Institut Pasteur, 1998, 96, 139-150.
174. G. D. Wright, Chemical Communications, 2011, 47, 4055-4061.
175. G. Bushnell, F. Mitrani-Gold and L. M. Mundy, International Journal of Infectious
Diseases, 2013, e325–e333.
176. W. M. Backer, The World of the Cell, 6th edn., Pearson Education, Inc, San
Francisco, 2006.
177. E. Y. Furuya and F. D. Lowy, Nature Reviews Microbiology, 2006, 4, 36-45.
178. J. Hatcher, R. Dhillon and B. Azadian, Journal of the Intensive Care Society, 2012,
13, 297-303.
179. C. Walsh, Nature, 2000, 406, 775-781.
180. C. Walsh, Antibiotics: actions, origins, resistance, ASM Press, Washington, 2003.
181. B. G. Hall and M. Barlow, Journal of Antimicrobial Chemotherapy, 2005, 55, 1050-
1051.
182. K. Bush and G. A. Jacoby, Antimicrobial Agents and Chemotherapy, 2010, 54, 969-
976.
183. B. G. Hall and M. Barlow, Drug Resistance Updates : Reviews and Commentaries in
Antimicrobial and Anticancer Chemotherapy, 2004, 7, 111-123.
184. S. M. Drawz and R. A. Bonomo, Clinical Microbiology Reviews, 2010, 23, 160-201.
185. A. Matagne, A. Dubus, M. Galleni and J.-M. Frère, Natural Product Reports, 1999,
16, 1-19.
186. C. Fenollar-Ferrer, J. Frau, J. Donoso and F. Muñoz, Theoretical Chemistry Accounts,
2008, 121, 209-218.
187. K. Bush, Critical Care, 2010, 14, 224.
188. G. A. Jacoby, Clinical Microbiology Reviews, 2009, 22, 161-182.
189. P. A. Bradford, Clinical Microbiology Reviews, 2001, 14, 933-951.
190. C. Héritier, L. Poirel, D. Aubert and P. Nordmann, Antimicrobial Agents and
Chemotherapy, 2003, 47, 268-273.

212
191. R. R. Watkins, K. M. Papp-Wallace, S. M. Drawz and R. A. Bonomo, Frontiers in
Microbiology, 2013, 4, 1-8.
192. L. D. Sabath and E. P. Abraham, Biochemical Journal, 1966, 98.
193. M. I. Page and A. Badarau, Bioinorganic chemistry and applications, 2008, 1-14.
194. J. D. Buynak, Biochemical Pharmacology, 2006, 71, 930-940.
195. L. E. Horsfall, G. Garau, B. M. R. Lienard, O. Dideberg, C. J. Schofield, J. M. Frere
and M. Galleni, Antimicrob. Agents Chemother., 2007, 51, 2136-2142.
196. C. Bebrone, Antimicrobial agents and chemotherapy, 2009, 53, 4464-4471.
197. G. Garau, I. Garcia-Saez, C. Bebrone, C. Anne, P. Mercuri, M. Galleni, J.-M. Frere
and O. Dideberg, Antimicrob. Agents Chemother., 2004, 48, 2347-2349.
198. F. K. Majiduddin, I. C. Materon and T. G. Palzkill, International Journal of Medical
Microbiology, 2002, 292, 127-137.
199. C. Bebrone, Biochemical Pharmacology, 2007, 74, 1686-1701.
200. O. Jacquin, D. Balbeur, C. Damblon, P. Marchot, E. De Pauw, G. C. Roberts, J.-M.
Frère and A. Matagne, Journal of Molecular Biology, 2009, 392, 1278-1291.
201. A. Carfi, The EMBO journal, 1995, 14, 4914.
202. A. Badarau and M. Page, Journal of Biological Inorganic Chemistry, 2008, 13, 919-
928.
203. D. de Seny, C. Prosperi-Meys, C. Bebrone, G. M. Rossolini, M. I. Page, P. Noel, J.-
M. Frère and M. Galleni, Biochem. J., 2002, 363, 687-696.
204. R. M. Breece, L. I. Llarrull, M. F. Tioni, A. J. Vila and D. L. Tierney, Journal of
Inorganic Biochemistry, 2012, 111, 182-186.
205. G. Garau, C. Bebrone, C. Anne, M. Galleni, J.-M. Frère and O. Dideberg, Journal of
Molecular Biology, 2005, 345, 785-795.
206. B. M. R. Lienard, G. Garau, L. Horsfall, A. I. Karsisiotis, C. Damblon, P. Lassaux, C.
Papamicael, G. C. K. Roberts, M. Galleni, O. Dideberg, J.-M. Frere and C. J.
Schofield, Organic & Biomolecular Chemistry, 2008, 6, 2282-2294.
207. C. Bebrone, C. Anne, F. Kerff, G. Garau, K. De vriendt, R. Lantin, B. Devreese, J.
Van beeumen, O. Dideberg, J.-M. Frère and M. Galleni, Biochem J, 2008, 414, 151-
159.
208. K. De Vriendt, G. Van Driessche, B. Devreese, C. Bebrone, C. Anne, J. Frère, M.
Galleni and J. Van Beeumen, Journal of The American Society for Mass
Spectrometry, 2006, 17, 180-188.
209. A. Tamilselvi and G. Mugesh, Journal of Biological Inorganic Chemistry, 2008, 13,
1039-1053.
210. K. A. McCall, C.-c. Huang and C. A. Fierke, The Journal of nutrition, 2000, 130,
1437S-1446S.
211. S. Bounaga, A. Laws, M. Galleni and M. Page, Biochemical Journal, 1998, 331, 703-
711.
212. Z. Xiao and A. G. Wedd, Natural Product Reports, 2010, 27, 768-789.
213. M. Hernandez Valladares, A. Felici, G. Weber, H. W. Adolph, M. Zeppezauer, G. M.
Rossolini, G. Amicosante, J.-M. Frère and M. Galleni, Biochemistry, 1997, 36,
11534-11541.
214. J. C. Martinez, J. Murciano-Calles, E. S. Cobos, M. Iglesias-Bexiga, I. Luque and J.
Ruiz-Sanz, Intechopen, 2013, 73-105.
215. C. A. Hunter and H. L. Anderson, Angewandte Chemie International Edition, 2009,
48, 7488-7499.
216. U. Heinz and H.-W. Adolph, Cellular and Molecular Life Sciences, 2004, 61, 2827-
2839.
217. M. W. Freyer and E. A. Lewis, Methods in Cell Biology, 2008, 84, 79-113.
218. J. Tellinghuisen, The Journal of Physical Chemistry B, 2005, 109, 20027-20035.
219. M. M. Pierce, C. Raman and B. T. Nall, Methods, 1999, 19, 213-221.
220. A. L. Feig, Biopolymers, 2007, 87, 293-301.
221. W. B. Turnbull, MicroCal Application Note, 2005, 2-3.

213
222. I. Herrera and M. A. Winnik, The Journal of Physical Chemistry B, 2013, 117, 8659-
8672.
223. N. J. Buurma and I. Haq, Methods, 2007, 42, 162-172.
224. J. Tellinghuisen, Analytical Biochemistry, 2008, 373, 395-397.
225. L. S. Mizoue and J. Tellinghuisen, Biophysical Chemistry, 2004, 110, 15-24.
Top Related