


Languages
Pages
Legal


University of Dundee
DOCTOR OF PHILOSOPHY
Development and evaluation of anti-biofouling nano-composite coatings
Su, Xueju
Award date:2013
Link to publication
General rightsCopyright and moral rights for the publications made accessible in the public portal are retained by the authors and/or other copyright ownersand it is a condition of accessing publications that users recognise and abide by the legal requirements associated with these rights.
• Users may download and print one copy of any publication from the public portal for the purpose of private study or research. • You may not further distribute the material or use it for any profit-making activity or commercial gain • You may freely distribute the URL identifying the publication in the public portal
Take down policyIf you believe that this document breaches copyright please contact us providing details, and we will remove access to the work immediatelyand investigate your claim.
Download date: 30. Nov. 2021

DOCTOR OF PHILOSOPHY
Development and Evaluation of Anti-Biofouling Nano-composite Coatings
Xueju Su
2013
University of Dundee
Conditions for Use and DuplicationCopyright of this work belongs to the author unless otherwise identified in the body of the thesis. It is permittedto use and duplicate this work only for personal and non-commercial research, study or criticism/review. Youmust obtain prior written consent from the author for any other use. Any quotation from this thesis must beacknowledged using the normal academic conventions. It is not permitted to supply the whole or part of thisthesis to any other person or to post the same on any website or other online location without the prior writtenconsent of the author. Contact the Discovery team ([email protected]) with any queries about the useor acknowledgement of this work.

Development and Evaluation of Anti-
Biofouling Nano-composite Coatings
Xueju Su
A Thesis Submitted to University of Dundee, in Fulfilment of the
Requirements for the Degree of Doctor of Philosophy (Ph.D.)
December 2012
Mechanical Engineering and MechatronicsSchool of Engineering, Physics and Mathematics

I
CONTENTS
DECLARATION ............................................................................................................VI
CERTIFICATE ............................................................................................................. VII
ACKNOWLEDGMENTS ...........................................................................................VIII
ABSTRACT....................................................................................................................IX
NOMENCLATURE.........................................................................................................X
LIST OF TABLES ........................................................................................................ XII
LIST OF FIGURES .....................................................................................................XIII
CHAPTER 1 .....................................................................................................................1
INTRODUCTION ............................................................................................................1
1.1 Biofouling Problems in Heat Exchangers ........................................................1
1.2 Biofilm Problems in Medical Devices and Implants ........................................2
1.3 Control of Biofilm Formation ..........................................................................3
CHAPTER 2 .....................................................................................................................5
LITERATURE SURVEY AND BACKGROUND ..........................................................5
2.1 Biofouling in Heat Exchangers ........................................................................5
2.1.1 Effect of Main Parameters on Biofouling ........................................................6
2.1.1.1 Effect of Temperature ..............................................................6
2.1.1.2 Effect of Flow Velocity ………………………….…………. 7
2.1.1.3 Effect of Materials ………………………………………. 7
2.1.1.4 Effect of Surface Morphology ……………….………………. 8
2.1.1.5 Effect of Surface Energy ..........................................................9
2.1.2 Biofouling Control and Removal Techniques ................................12
2.1.2.1 Chemical Techniques ……….. …………………………………..13
2.1.2.2 Mechanical Techniques ……….. ………………………………...16
2.1.2.3 Physical Techniques ……….. …………………………………....17
2.2 Medical Devices-Related Infections …………………………18
2.2.1 Catheter-associated Infections ..........................................................19
2.2.2 Pin Tract Infection ……………………………………20
2.2.3 Surgical Instruments-Related Infections ………………………………….21
2.2.4 Other Devices Related Infections …..…………………………..22
2.2.5 Pathogenesis of Medical Devices and Implants Related Infections ……….22

II
CHAPTER 3 ...................................................................................................................25
AIMS AND OBJECTIVES.............................................................................................25
3.1 Anti-biofouling Coating Techniques ....................................................................25
3.1.1 Toxic Anti-biofouling Coatings ...................................25
3.1.2 Non-Toxic Anti-biofouling Coatings.............................................................26
3.2 Aims and Objectives .............................................................................................27
3.2.1 Development of Novel Anti-bacterial Nanocoatings.....................................27
3.2.2 Evaluation of the Nanocoatings .....................................................................28
3.2.3 Investigation of Anti-bacterial Mechanisms ..................................................28
CHAPTER 4 ...................................................................................................................29
PREPARATION OF Ni-P-POLYMERS AND MODIFIED DLC NANOCOATINGS29
4.1 Electroless Plating Ni-P-Polymers Coatings .......................................................29
4.1.1 Electroless Plating Ni-P Coatings ................................................................29
4.1.2 Electroless Plating Ni-P-PTFE Coatings .....................................................31
4.1.3 Electroless Plating Ni-P-Biocide Polymer Coatings..………………………33
4.1.3.1 Biocide Polymers..…………………………………………………… 34
4.1.3.2 Mechanism of Electroless Plating Ni-P-Polymers………………… 35
4.1.3.3 Pretreatment Procedures of Steel Substrate ………………………… 36
4.1.3.4 Bath Composition of Electroless Plating Ni-P-Polymers ……...…….. 38
4.1.3.5 Deposition Rate ……………………………………………………. ... 40
4.1.4 Electroless Plating Ni-P-Polymer System …………………………. ……..41
4.2 Doped Diamond-like Carbon Coatings …… .......................................................42
4.2.1 An Overview of DLC coatings ......................................................................42
4.2.2 Si-N-Doped DLC Coatings Prepared by Teer Coatings Ltd..........................44
4.2.3 F-Doped DLC Coatings Prepared by CSIRO ................................................46
4.2.4 B and Ti-Doped DLC Coatings Prepared by Tecvac Ltd ..............................47
4.3 SiOx-Like Coatings ...............................................................................................48
4.3.1 An Overview of SiOx-Like Coatings .............................................................48
4.3.2 SiOx-Like Coatings Prepared by Teer Coatings Ltd ......................................49
CHAPTER 5 ...................................................................................................................51
CHARACTERISATION OF COATINGS .....................................................................51
5.1 Morphology of Coatings .......................................................................................51
5.1.1 Atomic Force Microscopy..............................................................................51
5.1.2 Scanning Electron Microscope ......................................................................53

III
5.2 Composition of Coatings ......................................................................................54
5.2.1 Energy-dispersive X-ray spectroscopy ..........................................................54
5.2.2 X-ray Photoelectron Spectroscopy.................................................................55
5.3 Coating Thickness.................................................................................................55
5.4 Contact Angle and Surface Energy .......................................................................57
5.4.1 Contact Angle Measurement..........................................................................57
5.4.2 Calculation of Surface Energy .......................................................................59
5.4.2.1 Owens and Wendt Geometric Mean Approach ......................................60
5.4.2.2 Wu Harmonic Mean Approach ...............................................................61
5.4.2.3 van Oss Acid-Base Approach .................................................................62
5.4.2.4 Equation of State Approach ....................................................................63
5.5 Surface Energy of Coatings ..................................................................................64
CHAPTER 6 ...................................................................................................................68
ADHESION ASSAYS OF BACTERIA AND PROTEINS ...........................................68
6.1 Bacterial Culture ...................................................................................................68
6.1.1 Types of Bacteria ...........................................................................................68
6.1.2 Growth Curve of Bacteria ..............................................................................69
6.1.3 Growth Curve Measurement ..........................................................................71
6.1.4 Contact angle and Surface Energy of Bacteria ..................................73
6.2 Bacterial Adhesion and Removal..........................................................................74
6.2.1 Bacterial Adhesion.........................................................................................74
6.2.2 Bacterial Removal..........................................................................................75
6.3 Methods of Cell Counting.....................................................................................77
6.3.1 Viable Plate Counts Method ..........................................................................77
6.3.2 Microscope Method .......................................................................................78
6.4 Protein Removal Assays .......................................................................................80
CHAPTER 7 ...................................................................................................................82
EXPERIMENTAL RESULTS........................................................................................82
7.1 Ni-P-Biocide Polymer Nanocomposite Coatings..................................................82
7.1.1 Selection of Biocide Polymers .......................................................................82
7.1.2 Ni-P-Biocide Polymers Coatings ………………………………………….85
7.2 Doped Diamond-Like Carbon Coatings ...............................................................88
7.2.1 Si-N-Doped DLC Coatings ............................................................................88
7.2.2 F-Doped DLC Coatings ………………………………………………….92

IV
7.2.3 B-Doped DLC Coatings.................................................................................98
7.2.3.1 Contact time 1 h with P. aeruginosa.......................................................99
7.2.3.2 Contact time 5 h with P. aeruginosa.....................................................104
7.2.3.3 Contact time 18 h with P. aeruginosa...................................................108
7.2.3.4 Effect of Contact Time on P. aeruginosa Adhesion .............................113
7.2.3.5 Contact time 1 h with S. epidermidis ....................................................116
7.2.3.6 Contact time 5 h with S. epidermidis ....................................................118
7.2.3.7 Contact time 18 h with S. epidermidis ..................................................121
7.2.3.8 Effect of Contact Time on S. epidermidis Adhesion.............................124
7.2.4 Ti-Doped DLC Coatings ..............................................................................126
7.2.4.1 Contact time 1 h with E. coli.................................................................127
7.2.4.2 Contact time 5 h with E. coli.................................................................132
7.2.4.3 Effect of Contact Time on E. coli Adhesion .........................................137
7.3 SiOx-like Coatings ..............................................................................................140
7.4 B- and Ti-DLC Coatings for Protein Removal ...................................................145
CHAPTER 8 .................................................................................................................149
MODELLING OF INTERACTION ENERGY............................................................149
8.1 Thermodynamic Approach..................................................................................149
8.2 Extended DLVO Theory .....................................................................150
8.2.1 Lifshitz-van der Waals Interaction...............................................................151
8.2.2 Electrostatic Double-Layer Interaction ........................................................152
8.2.3 Lewis Acid/Base Interaction........................................................................152
8.2.4 Brownian Motion .........................................................................................153
8.3 Work of Adhesion and Extended DLVO Theory ...............................................153
8.4 Modelling Results ...............................................................................................154
8.4.1 Effect of Surface Energy on Total Interaction Energy.................................154
8.4.2 Case Study- Effect of Interaction Energy ....................................................156
8.4.2.1 Ni-P-Biocide Polymer Nanocomposite Coatings .................................157
8.4.2.2 Si-N-doped DLC Coatings....................................................................158
8.4.2.3 F-doped DLC Coatings .........................................................................158
8.4.2.4 B and Ti-doped DLC Coatings .............................................................159
CHAPTER 9 .................................................................................................................161
CONCLUSIONS...........................................................................................................161
9.1 Ni-P-Biocide Polymers Noanocomposie Coatings ............................................161

V
9.2 Doped Diamond-like Carbon Coatings .............................................................162
9.2.1 Si-N-doped DLC Coatings...........................................................................162
9.2.2 F-doped DLC Coatings ................................................................................162
9.2.3 B-doped DLC Coatings................................................................................163
9.2.4 Ti-doped DLC Coatings...............................................................................164
9.3 SiOx-like Coatings ..............................................................................................165
9.4 Bacterial Adhesion Mechanisms.........................................................................165
CHAPTER 10 ...............................................................................................................167
FUTURE WORK..........................................................................................................167
10.1 Anti-biofouling Coatings ..................................................................................167
10.2 Biofouling Adhesion Mechanisms....................................................................167
10.3 Practical Applications of the New Coatings .....................................................167
REFERENCES..............................................................................................................168

VI
DECLARATION
I hereby declare that the following thesis is of my own composition, that it is a true
record of work completed by myself and that it has not previously been accepted for a
higher degree at this University or any other institution of learning.
…………………………..
Xueju Su

VII
CERTIFICATE
I certify that Xueju Su has performed the research described in this thesis under my
supervision and has fulfilled the conditions of the relevant Ordinance and Regulations
of the University of Dundee, so that she is qualified to submit for the Degree of Doctor
of Philosophy.
……………………………
Dr. Qi Zhao
Division of Mechanical & Mechatronics Engineering

VIII
ACKNOWLEDGMENTS
First of all, I would like to express my deepest gratitude to my supervisors Dr. Qi Zhao
and Prof Eric Abel for their kind guidance, encouragement, invaluable suggestions and
financial support throughout my research work. I would like to thank the financial
supports for my project from CSO (CZB/4/441), EU FP7 (BioSurf 232172) and UK
Department of Health (B09-07).
I would like to thank to Laurent Akesso, Xiaoling Zhang, Parnia Navabpour, Dennis
Teer, Teer Coatings Ltd, UK for preparing Si-N-DLC coatings and SiOx-like coatings. I
would like to thank to Dr Avi Bendavid, CSIRO Materials Science and Engineering,
Sydney for preparing F-doped DLC coatings. I would like to thank to Tecvac Ltd, UK
for preparing B-DLC coatings and Ti-DLC coatings. I would like to thank to N.
Noormofidi, E. Kreutzwiesener and C. Slugovc, Institute for Chemistry and Technology
of Materials, Graz University of Technology, Austria for providing a range of biocide
polymers for me to prepare novel Ni-P-PTFE-biocide polymer nanocomposite coatings.
Thanks to David Perrett and Nanda Nayuni, Barts and London School of Medicine,
London for the adhesion assays with brain homogenate. Thanks to Dory Cwikel and
Abraham Marmur, Department of Chemical Engineering, Technion, Israel Institute of
Technology for most stable contact angle analysis.
I would like to thank to the technicians in the Division of Mechanical Engineering at the
University of Dundee for helping me cutting the sample, modifying the chamber and
maintenance of laboratory instruments, and to Mr. Ernie Kuperus and Dr. Gary Callon
for their kind support in my research work. And thanks to the members of my
supervisor’s research group, including Qian Li and Yingwei Qu et al for their help in
bacterial adhesion assays during my PhD study.
Finally, I would like to express my sincere gratitude to my family for their support and
encouragement during my PhD study in UK.
Xueju SU

IX
ABSTRACT The rapid development of the global offshore industry and of amphibious chemical,
steel and power plants leads to more intensive use of natural water resources (sea, river
and lake water) as a cooling medium. However, heat exchangers using the water as a
coolant suffer from biofouling problem, which reduces heat transfer performance
significantly. The cost of cleaning and lost output can be extremely high. The high
incidence of infections caused by the biofilm formation on the surfaces of medical
devices and implants, including catheters and bone fracture fixation pins etc. has a
severe impact on human health and health care costs. An approach to reduce biofouling
or infection rate is the application of a range of different coatings to the surfaces of
equipment. So far the most promising coatings include Ni–P–PTFE coatings and
modified diamond like carbon (DLC) coatings etc. However these coatings need to be
futher improved and optimised in order to get the best anti-biofouling performance.
In this study, a range of novel Ni–P–PTFE-biocide polymer nanocomposite coatings and
modified DLC coatings with B, F, N, Si and Ti were designed and produced using
electroless plating, magnetron sputter ion-plating and plasma enhanced chemical vapour
deposition techniques. The surface properties of the coatings were characterized using
surface analysis facilities, including AFM, EDX, OCA-20, SEM and XPS. These nano-
composite coatings and nano-structured surfaces were evaluated with bacterial strains
that frequently cause heat exchanger biofouling or medical devices-related infections.
The experimental results showed that new Ni–P–PTFE-biocide polymer nanocomposite
coatings reduced bacterial adhesion by 70% and 94% respectively, compared with Ni–
P–PTFE and stainless steel. The experimental results showed that both type and content
of the doped elements in DLC coatings had significant influence on bacterial adhesion.
The new doped DLC coatings, including Si-N-DLC, F-DLC, B-DLC and Ti-DLC
coatings as well as new SiOx-like coatings reduced bacterial adhesion by 60-90%
compared with pure DLC and stainless steel. B and Ti-doped DLC coatings also
reduced residual protein adhesion by 88-95% compared with pure DLC coatings and
stainless steel. In general bacterial adhesion decreased with decreasing total surface
energy or with increasing γ- surface energy of the coatings. The bacterial adhesion
mechanism of the coatings was explained with extended DLVO theory.

X
NOMENCLATURE
Latin Letters
A Hamaker constant, surface area
A131 Hamaker constant between particles 1 across medium 3
A132 Hamaker constant between particle 1 and surface 2 across medium 3
E Voltage, interaction energy
h Coating thickness
H Distance
H0 Minimum equilibrium distance of interaction = 0.157 nm
k Constant
kB Boltzmann constant
r Coating rate
R Microbial radius
t Coating time
T Temperature
U Fluid velocity
V Volume
W Weight
Greek letters
β Constant in Equation of state approach
γAB Polar or acid-base component of surface energy
γd Apolar component of surface energy
γLW Lifshitz-van der Waals component of surface energy
γp Polar component of surface energy
γs Solid surface energy
γsl Solid-liquid interfacial energy
γ - Electron-donating parameter of the acid-base component
γ + Electron-accepting parameter of the acid-base component
ε Permittivity, 6.95×10⁻¹⁰
ε0 Permittivity of vacuum, 8.85×10⁻¹²

XI
εr Relative permittivity or dielectric constant
θ Contact angle
к-1 Double layer thickness
λ Correction length of molecules in a liquid
ζ Zeta potential
ρ Fluid or solid density
µ Fluid viscosity
Abbreviation
AFM Atomic Force Microscope
CFU Colony Forming Units
DLVO Derjaguin – Landau – Verwey – Overbeek
EDXS Energy Dispersive X-ray Spectroscopy
E. coli Escherichia coli
Ni-P-PTFE Nickel-Phosphorus-Polytetrafluoroethylene
P.Aeruginosa Pseudomonas Aeruginosa
PBS Phosphate Buffered Saline
PTFE Polytetrafluoroethylene
rpm revolutions per minute SEM Scanning Electron Microscope
S.aureus Staphylococcus aureus
S.epidermidis Staphylococcus epidermidis
Ti Titanium
TSA Tryptone Soya Agar
TSB Tryptone Soya Broth
XPS X-ray Photoelectron Spectroscopy

XII
LIST OF TABLES
Table 4.1 Pretreatment of steel substrates for electroless plating Ni-P-Polymers ..........36
Table 4.2 Bath composition and operating conditions for electroless Ni-P and Ni-P-
Polymers nano-composite coating ..........................................................................39
Table 4.3 Si-N-doped DLC coatings by Teer Coatings Ltd............................................46
Table 4.4 F -doped DLC coatings by CSIRO .................................................................47
Table 4.5 B and Ti-doped DLC coatings by Tecvac Ltd ................................................48
Table 4.6 Parameters used for the deposition of SiOx-like coatings .............................50
Table 5.1 Si content, the ratio of sp2/sp3 and roughness Ra ...........................................53
Table 5.2 Chemical compositions and content (wt. %) of coatings by EDX .................55
Table 5.3 Atomic composition and thickness of SiOx-like coatings...............................56
Table 5.4 Test liquids and their surface tension components ........................................59
Table 5.5 Contact angle and surface energy components of Ni-P-polymers coatings....65
Table 5.6 Contact angle and surface energy components of Si-N-doped DLC coatings
.................................................................................................................................65
Table 5.7 Contact angle and surface energy components of F doped DLC coatings .....65
Table 5.8 Contact angle and surface energy components of B and Ti-doped DLC
coatings ...................................................................................................................66
Table 5.9 Contact angle and surface energy components of SiOx-like coatings ...........67
Table 6.1 Components of TSB, TSA and PBS ..............................................................69
Table 6.2 Contact Angle and Surface Energy Components of Bacteria ........................74
XIII
LIST OF FIGURES
Fig. 2.1 Relative bacterial adhesion vs surface energy ……………………………..….11
Fig. 2.2 Milk fouling vs surface energy ……………………….…..…………...…....11
Fig. 2.3 Extended Baier curve.........................................................................................12
Fig. 2.4 Attached bacteria vs surface energy ..............................................12
Fig. 2.5 Condenser inlet free from fouling by electrochlorination ..............................14
Fig. 2.6 Condenser heavily fouled after failure of electrochlorination .........................14
Fig. 2.7 Titanium Heat Exchanger ...............................................................................14
Fig. 2.8 Titanium Heat Exchanger without Chlorination Exchanger..............................14
Fig. 2.9 Initial steps in biofilm formation .......................................................................23
Fig. 4.1 The distribution of electroless nickel coating application in industry .............30
Fig 4.2 Chemical structural formula of PTFE.................................................................31
Fig. 4.3 Typical surfactant molecule...............................................................................33
Fig. 4.4 Chemical structures of SM14 and SM20...........................................................34
Fig 4.5 Schematic drawing of eletrocleaning device ......................................................37
Fig 4.6 Schematic drawing of activation device .............................................................38
Fig. 4.7 Elcetroless plating system..................................................................................41
Fig 4.8 Schematic diagram of the apparatus used to deposit Si-doped DLC coatings ...45
Fig 5.1 AFM image of Si-doped DLC (a) Si:1%; (b)Si:2%; (c) Si:3.8% .......................52
Fig. 5.2 Typical SME image of Ni-P-Polymers nanocomposite coating.......................54
Fig. 5.3 Force between atoms or molecules inside and at the phase boundary...............57
Fig. 5.4 Contact angle on solid surface ...........................................................................58
Fig. 5.5 Dataphysics OCA-20 Contact Angle Analyzer ................................................59
Fig. 6.1 Bacterial growth curve ......................................................................................70
Fig. 6.2 (a) P. fluorescens growth curve; (b) Log (CFU/ml) vs OD600...........................71
Fig. 6.3 (a) E. coli growth curve; (b) Log (CFU/ml) vs OD600 .......................................72
Fig. 6.4 (a) P. aeruginosa growth curve; (b) Log (CFU/ml) vs OD600 ...........................72
Fig. 6.5 (a) S. aureus growth curve; (b) Log (CFU/ml) vs OD600 ..................................73
Fig. 6.6 (a) S. epidermidis growth curve; (b) Log (CFU/ml) vs OD600 ..........................73
Fig. 6.7 Dipping Device..................................................................................................76
Fig. 6.8 BX41 Olympus Fluorescence Microscope ........................................................80
Fig. 6.9 Image Analysis by Image Pro Plus Software....................................................80

XIV
Fig. 7.1 Bacterial attachment with Escherichia coli .......................................................83
Fig. 7.2 Bacterial removal with Escherichia coli............................................................84
Fig. 7.3 Bacterial attachment with Staphylococcus aureus.............................................84
Fig. 7.4 Bacterial removal with Staphylococcus aureus .................................................84
Fig. 7.5 Attachment of E. coli on Ni-P-Polymer coatings ..............................................85
Fig. 7.6 Removal of E. coli from Ni-P-Polymer coatings...............................................86
Fig. 7.7 Attachment of S. aureus on Ni-P-Polymer coatings..........................................86
Fig. 7.8 Removal of S. aureus from Ni-P-Polymer coatings ..........................................87
Fig. 7.9 Effect of surface energy of coatings on bacterial adhesion ...............................87
Fig. 7.10 Comparison of formation of pseudomonas fluorescens cells on Si-N-DLC
coatings and on T2 silastic ......................................................................................90
Fig. 7.11 Comparison of removal of pseudomonas fluorescens cells on Si-N-DLC
coatings and on T2 silastic ......................................................................................90
Fig. 7.12 (a) Electron acceptor +Sγ vs bacterial removal for Si-doped DLC coatings; (b)
electron acceptor +Sγ vs bacterial removal for Si-N-doped DLC coatings; (c)
electron donor −Sγ vs bacterial removal for Si-doped DLC coatings; (d) electron
donor −Sγ vs bacterial removal for Si-N-doped DLC coatings ...............................91
Fig. 7.13 Comparison of formation of Pseudomonas fluorescens cells on F-DLC
coatings and on DLC coatings ................................................................................93
Fig. 7.14 Comparison of removal of Pseudomonas fluorescens cells on F-DLC coatings
and on DLC coatings...............................................................................................94
Fig.7.15 Effect of total surface energy of F-DLC coatings on adhesion of Pseudomonas
fluorescens cells ......................................................................................................95
Fig. 7.16 The effect of total surface energy of F-DLC coatings on removal of
Pseudomonas fluorescens cells ...............................................................................95
Fig. 7.17 Comparison of formation of Staphylococcus aureus cells on F-DLC coatings
and on DLC coatings...............................................................................................96
Fig. 7.18 Comparison of removal of Staphylococcus aureus cells on F-DLC coatings
and on DLC coatings...............................................................................................96
Fig. 7.19 Effect of total surface energy of F-DLC coatings on adhesion of
Staphylococcus aureus cells....................................................................................97
Fig. 7.20 The effect of total surface energy of F-DLC coatings on removal of
Staphylococcus aureus cells....................................................................................97

XV
Fig. 7.21 Live and dead P. aeruginosa cells on DLC coating (1 h)................................99
Fig. 7.22 Attachment of P. aeruginosa cells on B-DLC coatings (1 h)........................100
Fig. 7.23 Effect of boron content on the number of live, dead and total P. aeruginosa
cells on B-DLC coatings (1 h) ..............................................................................101
Fig 7.24 Effect of surface energy of B-DLC coatings on the attachment of live, dead and
total P. aeruginosa cells (1 h) ...............................................................................101
Fig. 7.25 Remaining P. aeruginosa cells on B-DLC coatings after dipping process ( 1 h)
...............................................................................................................................102
Fig. 7.26 Effect of Boron content in DLC coatings on the remaining P. aeruginosa cells
(1 h) .......................................................................................................................102
Fig. 7.27 Effect of surface energy of B-DLC coatings on the remaining P. aeruginosa
cells (1 h)...............................................................................................................103
Fig. 7.28 Removal percentage of P. aeruginosa cells from the B-DLC coatings after
dipping process (1 h).............................................................................................104
Fig. 7.29 Attachment of P. aeruginosa cells on B-DLC coatings (5 h)........................105
Fig. 7.30 Effect of boron content on the number of live, dead and total P. aeruginosa
cells on B-DLC coatings (5 h) ..............................................................................105
Fig. 7.31 Effect of surface energy of B-DLC coatings on the attachment of P.
aeruginosa cells (5 h)............................................................................................106
Fig. 7.32 Remaining P. aeruginosa cells on B-DLC coatings after dipping process (5 h)
...............................................................................................................................106
Fig. 7.33 Effect of Boron content in DLC coatings on the remaining P. aeruginosa cells
(5 h) .......................................................................................................................107
Fig. 7.34 Effect of surface energy of B-DLC coatings on the remaining P. aeruginosa
cells (5 h)...............................................................................................................107
Fig. 7.35 Removal percentage of P. aeruginosa cells from B-DLC coatings after
dipping process (5 h).............................................................................................108
Fig. 7.36 Attachment of P. aeruginosa cells on B-DLC coatings (18 h)......................109
Fig. 7.37 Effect of boron content on the number of live, dead and total P. aeruginosa
cells on B-DLC coatings (18 h) ............................................................................109
Fig. 7.38 Effect of surface energy of B-DLC coatings on the attachment of P.
aeruginosa cells (18 h)..........................................................................................110
Fig. 7.39 Remaining P. aeruginosa cells on B-DLC coatings after dipping process (18
h) ...........................................................................................................................111

XVI
Fig. 7.40 Effect of Boron content in DLC coatings on the remaining P. aeruginosa cells
...............................................................................................................................111
Fig 7.41 Effect of surface energy of B-DLC coatings on the remaining P. aeruginosa
cells .......................................................................................................................112
Fig. 7.42 Removal percentage of P. aeruginosa cells from the B-DLC coatings after
dipping process......................................................................................................112
Fig. 7.43 Effect of contact time on the attachment of live (a), dead (b) and total (c) P.
aeruginosa cells on B-DLC coatings……………………………………….113-114
Fig. 7.44 Effect of contact time on the removal of live (a), dead (b) and total (c) P.
aeruginosa cells on B-DLC coatings ....................................................................115
Fig. 7.45 Attachment of S. epidermidis cells on the B-DLC coatings (1 h) .................116
Fig. 7.46 Effect of surface energy of B-DLC coatings on the attachment of live, dead
and total S. epidermidis cells (1 h)........................................................................116
Fig. 7.47 Remaining S. epidermidis cells on the B-DLC coatings after dipping process
(1 h) .......................................................................................................................117
Fig. 7.48 Effect of surface energy of B-DLC coatings on the remaining S. epidermidis
cells (1 h)...............................................................................................................117
Fig. 7.49 Removal percentage of S. epidermidis cells from the B-DLC coatings after
dipping process (1 h).............................................................................................118
Fig. 7.50 Attachment of S. epidermidis cells on the B-DLC coatings (5 h) .................119
Fig. 7.51 Effect of surface energy of B-DLC coatings on the attachment of S.
epidermidis cells (5 h)...........................................................................................119
Fig. 7.52 Remaining S. epidermidis cells on the B-DLC coatings after dipping process
(5 h) .......................................................................................................................120
Fig. 7.53 Effect of surface energy of B-DLC coatings on the remaining S. epidermidis
cells (5 h)...............................................................................................................120
Fig. 7.54 Removal percentage of S. epidermidis cells from the B-DLC coatings after
dipping process (5 h).............................................................................................121
Fig. 7.55 Attachment of S. epidermidis cells on the B-DLC coatings (18 h) ...............122
Fig. 7.56 Effect of surface energy of B-DLC coatings on the attachment of S.
epidermidis cells (18 h).........................................................................................122
Fig. 7.57 Remaining S. epidermidis cells on the B-DLC coatings after dipping process
(18 h) .....................................................................................................................123

XVII
Fig. 7.58 Effect of surface energy of B-DLC coatings on the remaining S. epidermidis
cells (18 h).............................................................................................................123
Fig. 7.59 Removal percentage of S. epidermidis cells from the B-DLC coatings after
dipping process (18 h)...........................................................................................124
Fig. 7.60 Effect of contact time on the attachment of S. epidermidis cells on B-DLC
coatings .................................................................................................................124
Fig. 7.61 Effect of contact time on the removal of S. epidermidis cells on B-DLC
coatings .................................................................................................................125
Fig. 7.62 Attachment of E. coli cells on Ti-DLC coatings (1 h)...................................127
Fig. 7.63 Effect of Titanium content on the attachment of E. coli cells on Ti-DLC
coatings (1 h).........................................................................................................128
Fig. 7.64 Effect of −γ surface energy of Ti-DLC coatings on the attachment of E. coli
cells (1 h)...............................................................................................................129
Fig. 7.65 Effect of Ti content on the ratio of dead/total E. coli cells (1 h) ...................130
Fig. 7.66 Remaining E. coli cells on Ti-DLC coatings after dipping process (1 h)......130
Fig. 7.67 Effect of Ti content in DLC coatings on the remaining E. coli cells.............131
Fig. 7.68 Effect of −γ surface energy of Ti-DLC coatings on the remaining E. coli cells
...............................................................................................................................131
Fig. 7.69 Removal percentage of E. coli cells from Ti-DLC coatings after dipping
process (1 h) ..........................................................................................................132
Fig. 7.70 Attachment of E. coli cells on Ti-DLC coatings (5 h)...................................133
Fig. 7.71 Effect of Ti content on the attachment of E. coli cells on Ti-DLC coatings (5 h)
...............................................................................................................................133
Fig. 7.72 Effect of −γ surface energy of Ti-DLC coatings on the attachment of E. coli
cells (5 h)...............................................................................................................134
Fig. 7.73 Effect of Ti content on the ratio of dead/total E. coli cells (5h) ....................134
Fig. 7.74 Remaining E. coli cells on Ti-DLC coatings after dipping process (5 h)......135
Fig. 7.75 Effect of Ti content in DLC coatings on the remaining E. coli cells (5 h) ..135
Fig. 7.76 Effect of −γ surface energy of Ti-DLC coatings on the remaining E. coli cells
(5 h) .......................................................................................................................136
Fig. 7.77 Removal percentage of E. coli cells from Ti-DLC coatings after dipping
process (5 h) .........................................................................................................137

XVIII
Fig. 7.78 Effect of contact time on the attachment of live (a), dead (b) and total (c) E.
coli cells on Ti-DLC coatings ...............................................................................138
Fig. 7.79 Effect of contact time on the removal of live (a), dead (b) and total (c) E. coli
cells on Ti-DLC coatings ......................................................................................139
Fig. 7.80 Initial attachment of P. fluorescens cells on SiOx-like coatings ...................141
Fig. 7.81 Effect of total surface energy of SiOx-like coatings on the attachment of P.
fluorescens ............................................................................................................141
Fig. 7.82 Removal of P. fluorescens cells from SiOx-like coatings .............................142
Fig. 7.83 Effect of total surface energy of SiOx-like coatings on the removal of P.
fluorescens cells ....................................................................................................142
Fig. 7.84 Initial attachment of P. fluorescens cells on SiOx-like coatings ...................143
Fig. 7.85 Effect of total surface energy of SiOx-like coatings on the attachment of P.
fluorescens ............................................................................................................143
Fig. 7.86 Removal of P. fluorescens cells from SiOx-like coatings .............................144
Fig. 7.87 Effect of total surface energy of SiOx-like coatings on removal of biofilm of P.
fluorescens cells ....................................................................................................144
Fig. 7.88 Protein remaining after cleaning with Decon ................................................146
Fig. 7.89 Effect of boron content in DLC coatings on protein remaining ....................146
Fig. 7.90 Effect of surface energy of B-DLC coatings on protein remaining...............146
Fig. 7.91 Protein remaining on Ti-DLC coatings .........................................................147
Fig. 7.92 Effect of Ti content in DLC coatings on protein remaining ..........................147
Fig. 7.93 Effect of total surface energy of Ti-DLC coatings on protein remaining......148
Fig. 8.1 Effect of surface energy components of substrates on total interaction energy (a)
P. fluorescens, (b) E. coli, (c) P. aeruginosa, (d) S. aureus and (e) S.
epidermidis………………………………………………………………………….155-156
Fig. 8.2 Effect of TOTE132Δ on the attachment of (a) E. coli (b) S. aureus ...................157
Fig. 8.3 Effect of TOTE132Δ on the removal of P. fluorescens ..........................................158
Fig. 8.4 Effect of TOTE132Δ on the attachment (a) and removal (b) of S. aureus ...........159
Fig. 8.5 Effect of TOTE132Δ on the attachment (a) and removal (b) of S. epidermidis .....160

1
CHAPTER 1 INTRODUCTION 1.1 Biofouling Problems in Heat Exchangers
Fouling is generally defined as the accumulation of unwanted materials on the surfaces
of processing equipment (Garret-Price et al 1985). It has been recognised as a nearly
universal problem in design and operation and affects the operation of equipment in
three ways:
1) The fouling layer has a low thermal conductivity. This increases the resistance to
heat transfer and reduces effectiveness of heat exchangers.
2) As deposition occurs, the cross-sectional flow area is reduced, which causes an
increase in the pressure drop across the apparatus. This requires additional
pumping or fan power to maintain the same throughput.
3) Fouling can cause substrate corrosion and erosion, especially in the case of sea
water fouling.
The economic penalty for fouling due to oversized plant, decreased thermal efficiency,
increased pressure drop, additional maintenance and loss of production has been
estimated as about U.S. $1.5 × 10⁹ per year for the U.K., and U.S. $5 × 10¹⁰ per year for
the total industrialised world (Garret-Price et al 1985; Müller-Steinhagen and Zhao,
1997). It was reported that total heat exchanger fouling costs for highly industrialised
countries such as the US and the UK were about 0.25% of the countries’ gross national

2
product (GNP) (Garrett-Price et al.1985; Pritchard 1987; Müller-Steinhagen 2013). For
New Zealand, Steinhagen et al. (1990) found that the fouling costs were 0.15% of the
New Zealand GNP and for China, Xu et al. (2007) reported that the the fouling costs
were 0.169% GDP of China.
The heat exchanger is a device which directs the flow paths in such a way that the two
streams (cold and hot) are brought into thermal contact through a conducting wall while
being kept physically separate. Heat exchangers are designed for heat transfer duties in
which all kinds of natural water resources (sea, river and lake water) are used as cooling
medium.
Biofouling is widespread phenomena in sea water cooling systems. Biofouling is
usually divided into macro-biofouling and microbiofouling (Epstein, 1983):
1) Macrobiofouling: settlement of mussels, tube worms etc. primarily in the
unheated intake system. This is not normally a problem within the heat
exchanger itself, apart from indirect effect such as tube blockage by mussel
shells detached from the intake. Macrobiofouling is a major problem of water-
intake structures, equipment and power-plant piping.
2) Microbiofouling: bacterial biofim is a major problem of heat exchangers.
As micro-biofouling has been recognized as a widespread problem in the design and
operation of processing equipment, especially in heat exchangers, one aim of this study
is to investigate the methods for the control of micro-biofouling or biofouling in heat
exchangers.
1.2 Biofilm Problems in Medical Devices and Implants
The high incidence of infections caused by the use of implanted biomedical devices,
including catheters (Plowman et al, 2001), bone fracture fixation pins (Wassall et al,
1997) and heart valves (Tozzi et al, 2001; Cook et al, 2000) etc. has a severe impact on
human health and health care costs. Current estimates suggest that in the UK
nosocomial infections cost the UK £1.0 billion per year (Plowman R et al. 1999) and
medical devices and implant-associated infections cost the UK £11 million per year
3
(Darouiche 2004). In the United States, nosocomial infections cost the USA $11 billion
per year and at least half of the 2 million cases of nosocomial infections are medical
devices-related infections (Darouiche 2004, 2007, Richards et al. 1999; Jarvis 1996,
McGowan 2001, Schierholz et al. 1998, 2002). As the use of medicals devices and
implants has increased, the device-related infections become a major concern. Another
aim of this study is to investigate the methods for the control of biofilm formation in
medical devices and implants.
1.3 Control of Biofilm Formation
Since bacterial adhesion on the surfaces is a prerequisite for biofouling formation in
heat exchangers or for medical device infection, prevention of bacterial adhesion on the
surfaces will have a major impact in preventing heat exchanger biofouling or medical
devices-related infections. An effective and desired approach to reduce biofouling is to
alter the surface properties of heat exchangers or medical devices by surface coating
techniques and to make it less attractive for the biofouling components, so that they can
be removed easily from the surfaces by flowing fluids.
The most effective method of biofouling control in industrial heat exchangers until now
is the application of anti-biofouling coatings containing biocides such as cuprous oxide
and organo-tin compounds, with properties toxic to biofouling organisms (Ghanem et al,
1982; Kjaer, 1992). The mechanism of surface protection by these coatings or paints
depends upon controlled leaching of the poisonous ingredients. The main disadvantage
is the pollution to the environment. Due to the world-wide legislation, one can assume
that toxic antifouling coatings will eventually disappear completely from the market.
Therefore, non-toxic coatings have attracted more attention. Many attempts have also
been made to reduce biofouling by coating surfaces with silicone or PTFE due to their
non-stick properties. However, the poor thermal conductivity of these polymer coatings
currently inhibits their commercial use for heat exchangers (Müller-Steinhagen and
Zhao, 1997).
An approach to reduce medical devices-related infections is the application of a range of
different coatings to the surfaces of the medical devices and implants, including biocidal
coatings, polymeric coatings based on hydrogels and silicone. In view of increasing

4
bacterial resistance to antibiotics and antiseptics, silver coating may be an effective
strategy to prevent catheter and other medical devices-related infections (Schierholz et
al 1998). However, numerous clinical studies show that the use of silver-coated devices
resulted in non-significant reduction in medical devices-related infections as bacteria
(dead and alive) strongly stick to the silver-coated surfaces (Lai and Fontecchio, 2002;
Thibon et al 2000; Morris et al 1997; Leone et al., 2004). The silver-coated medical
devices are not recommended for widespread use (Thibon et al 2000).
In this study, three new types of anti-biofouling coatings (Ni-P-PTFE-biocide polymers,
doped diamond-like carbon and SiOx-like coatings) with good thermal conductivity and
biocompatibility have been developed and evaluated for the potential applications of
heat exchangers and medical devices/implants.

5
CHAPTER 2 LITERATURE SURVEY AND BACKGROUND
2.1 Biofouling in Heat Exchangers
The rapid development of the global offshore industry and of amphibious chemical,
steel and power plants leads to more intensive use of natural water resources (sea, river
and lake water) as a cooling medium. However, heat exchangers using water as a
coolant suffer from biofouling in the form of biofilm (Koh et al. 1991; Lucas et al. 1996;
Eguia et al. 2007). Biofouling can lead to bio-corrosion of metal, which increases
safety hazards from conventional and nuclear power plants (DiCinto and DeCarolis,
1993; Mussalli and Tsou, 1989). In the US approximately 4% of the failures of power
stations with a capacity >600 MW are caused by biofouling in condensers (Bott 1995).
Because a biofilm is highly hydrated, consisting of 98-99% water, its conductivity is
similar to that of stationary water, but much lower than that of metals (Characklis,
1983). It therefore acts as an insulator, increasing heat transfer resistance, especially in
heat exchangers. Very thin micro-biofouling films can have a significant impact on the
thermal performance of OTEC (Ocean Thermal Energy Conversion) heat exchangers
(Aftring et al. 1978; Berger et al. 1979; Kinelski, 1978; Little and Lavoie 1979).
Biofouling in condenser tubes of power plants alone costs the USA over US$1 billion
annually (Chow 1987; Strauss 1989). The presence of a biofilm on transfer surfaces of
heat exchangers cooled by water reduces the heat transfer rate by 20 to 50% and incurs

6
a global expenditure of over $15 billion per annum to control the problem (Azis et al,
2001). Biofouling not only reduces heat transfer performance significantly, but also
causes considerable pressure drop, calling for higher pumping requirements. For
example, biofouling on a 20- centimetre carbon steel pipe reduced the cross-sectional
area by 52% in 2.5 years (Gaffoglio, 1987). The cost of cleaning and lost output can be
extremely high (Zhao et al, 2005; 2009).
2.1.1 Effect of Main Parameters on Biofouling
2.1.1.1 Effect of Temperature
The temperature at the interface of the water and the surface of the heat exchanger is the
main parameter that affects biofouling. Biological growths have definite temperature
ranges within which they can survive. For marine system, seawater temperature can
change in the range from -2 °C to 28 °C (Yebra et al. 2004). The water temperature has
significant influence on biofouling formation (Kukulka and Devgun 2007 and
Butterworth 2002). In general, the marine biofilm growth rate increases with seawater
temperature increasing until it reaches a maximum value. Experiments by L.Novak
(1981; 1982) were carried out with the Rhine river water in Ludwigshafen, Germany,
and with seawater of the Öresund in Landskorona, Sweden. The biofouling rate reached
a maximum at a mean temperature of approximately 32oC for Rhine water and at
approximately 35-37 oC for sea water. Mott (1991) investigated the effect of cooling
water temperature on biofilm formation and reported that by raising temperature from
30 °C to 35 °C the thickness of biofouling deposit increased by 80%. Melo and Bott
(1997) reported that the optimum temperature for maximum growth of the most bacteria
in cooling water systems was about 40 °C. Ritter and Suitor (1975) showed that
biofouling was severe at temperatures below about 49°C, but became insignificant at
elevated temperatures. Operation in seawater at surface temperatures above 49oC would
be abnormal. Ritter and Suitor (1976) conducted a test at 66oC to determine an upper
limit to biofouling. The result showed that there was no biofouling at the surface
temperature of 66oC. The tests by Ritter and Suitor (1976) further indicated that the
increase in surface temperature of titanium heat exchangers from 38°C to 66oC resulted
in a decrease in biofouling.

7
2.1.1.2 Effect of Flow Velocity
The velocity of the water has a significant influence on biofouling formation. If water
flow velocity is very slow or in stagnant water, biological growths would probably die
of lack of oxygen and nutrients, so a slight velocity is essential for biofouling growth.
But at higher velocities, biological deposits can either be sheared off or they are unable
to attach themselves to the surfaces.
Fouling is usually most widespread in warm conditions and in low velocity (< 1 m/s)
sea water. Above 1 m/s, most fouling organisms have difficulty attaching themselves to
surfaces unless already secured (Powell, 1994). Bott and Miller (2008) showed the
maximum biofilm development occurred at the flow velocities around 1m/s in
aluminium tubes and biofilm growth was faster even in the low nutrient condition.
Titanium and its alloys are non toxic to fouling organisms in seawater and foul heavily
in water flowing at less than 0.22 m/s. Tsai (2005) reported that the biofilm biomass did
not change when flow velocity was increased from 0.2 to 0.4 m/s, but when flow
velocity was further increased to 0.6 m/s, biofilm biomass was reduced significantly due
to shearing stress increasing. Melo and Bott (1997) showed that when the velocity
increased from 0.13 m/s to 0.54 m/s, the density of the dry Pseudomonas fluorescens
biofilm increased from 26 kg/m3 to 76 kg/m3 (dry mass/wet volume). When flow
velocity was over 1 – 1.8 m/s, biofouling deposition in the heat exchanger tubes
decreased with velocity increasing (Nebot et al. 2007). Biofouling did not occur at
ship’s speeds higher than 3m/s (Yebra et al. 2004). In general, biofilm thickness
increases to maximum when flow velocity is around 0.5~1 m/s). When flow velocity is
over 1 m/s, biofilm thickness decreases with velocity increasing. However the pumping
costs and shearing stress to the pipes also increase significantly when flow velocity
increases. The water velocity is dictated by both biofouling considerations and by the
cost of pumping the water through the heat exchangers. In general the flow velocity in
heat exchanger tubes is around 1 – 3 m/s (Kinelski, 1985).
2.1.1.3 Effect of Materials
Marine organisms attach themselves to some metals and alloys more readily than they
do to others. Some metals and alloys containing copper, nickel, zinc or silver are toxic

8
to microorganisms (Fang 2002; Gibert, 1972, 1978, 1982, Griffin, 1978). It has been
demonstrated that the Cu/Ni alloys reduced biofouling growth significantly (Albaugh
1984; Straight et al. 1988; Powell 1994; Mathiyarasu et al. 2002). Copper-based alloys,
including copper-nickel, have very good resistance to biofouling, and this property is
used to advantage. In the case of copper-nickel, it is used to minimise biofouling on
intake screens, sea water pipe work, water boxes, and cladding of pilings and mesh
cages in fish farming and heat exchangers. There was little to distinguish between the
90-10 and 70-30 alloys (Efird 1976; Powell 1985). Copper alloys have good resistance
to micro-biofouling, but they are not totally immune to it. They only remain effective in
heat exchanger for about 3 – 4 months (Powell 1985; Tuthill, 1987). Another problem
for the use of copper-alloys is that they are readily corroded in sea water.
Some metals or alloys (e.g. stainless steel) are not toxic, so biofouling forms on these
surfaces easily (Videla 1994; Sleigh 1987; Greenberg and Itzhak 2005; Palraj and
Venkatachari 2008; Vishwakarma et al. 2009). Titanium can successfully cope with sea
water corrosion, but it tends to be expensive and has poor anti-biofouling properties.
It has also been demonstrated that poly (ethylene glycol) (PEG) was able to resist
bioadhesion (Preiser et al. 1984; Kingshott and Griesser 1999; Kenausis et al. 2000;
Roosjen et al. 2004; Vladkova 2007). Recently the development of antibacterial
polymers with minimal bacterial adhesion has been focused on siloxanes, fluoropolymer
and fluorosiloxanes because they have low surface free energy (Brady and Singer, 2000;
Vladkova 2007). Polymers may have anti-biofouling or fouling-release properties but
they may not be suitable for the applications in heat exchangers due to their low thermal
conductivity.
Currently most scientists are focuing on the development of anti-biofouling coatings on
stainless steels and titanium substratates, but no significant progress has been made.
2.1.1.4 Effect of Surface Morphology
The effect of surface roughness on biofouling adhesion is complex. Some researchers
found that biofouling adhesion was less on smooth surfaces. Bollen et al. (1997) found
9
that the adhesion of micoorganisms increased with surface roughness Ra values
increasing, but if Ra ≤ 0.2 μm it had a negligible effect on microbial adherence. Taylor
et al. (1998) found that bacterial attachement increased with increasing Ra values for Ra
in the range of 0.04~1.24µm. When Ra was in the range of 1.86~7.89µm, it had no
significant effect in bacterial adhesion. Kerr (2000) reported that reducing surface
roughness should reduce biofouling build-up. Pasmore et al. (2001) found that biofilm
coverage of P. aeruginosa increased slighly with surface roughness increasing for Ra in
the range of 0.3 ~ 3.8 μm. Katsikogianni and Missirlis (2004) explained that a rough
surface has a greater surface area and the depressions in the roughened surfaces provide
more favourable sites for colonization. Medilanski et al. (2002) showed that bacterial
adhesion on bare stainless steel was minimal at an average roughness (Ra) of 0.16 μm,
whereas smoother and rougher surfaces led to more retention.
However, some studies showed that the surface roughness had no significant influence
on biofouling (McGuire and Swartzel,1987; Yoon and Lund 1994; Hahnel et al. 2009).
McGuire and Swartzel (1987) tested fouling adhesion on polished stainless steel , rough
stainless steel, teflon and aluminosilicate with corroesponding Ra values of 0.04, 0.41,
1.93 and 2.31μm respectively. They did not find any correlation between fouling
adhesion and Ra values. Yoon and Lund (1994) evaluated fouling adhesion on the
surfaces of teflon, polysiloxane, stainless steel, polished stainless steel and titanium
with Ra values in the range from 0.07~0.60 μm, and did not find any any correlation
between fouling adhesion and Ra values.
A specific micro-topography which decreased the contact area between the material
surface and the microorganism reduced the level of adhesion (Allion et al., 2006; Kesel
and Liedert 2007; Carmen et al. 2006; Bers and Wahl 2004; Scardino et al. 2009; Baum
et al. 2002). A surface with fewer attachment points may reduce the shear force required
for biofouling removal. Unfortunately, the surface pattern techniques are not suitable for
large scale heat exchanger plates and tubes.
2.1.1.5 Effect of Surface Energy
An effective and desired approach to reduce biofouling is to alter the surface properties

10
of the equipment and to make it less attractive for the fouling components, so that they
can be removed easily from the surfaces by flowing water (Zhao et al, 2005). The
surface energy of a solid surface gives a direct measure of intermolecular or interfacial
attractive forces. van Oss et al (1986, 1988, 1994) proposed to divide the total surface
energy of a material ( TOTiγ ) into 3 independent components, Lifshitz-van der Waals
apolar ( LWiγ ), the electron acceptor ( +
iγ ) and the electron donor ( −iγ ):
−++= iiLWi
TOTi γγγγ 2 . Over the past three decades, fouling adhesion to surfaces with
different surface energies has been investigated with the frequent conclusion that
fouling adhesion is less to low energy surfaces and easier to clean because of weaker
binding at the interface (Dexter et al., 1975; van Dijk et al. 1987; Quirynen and Bollen
1995; Hamza et al., 1997; Swain 1998; Tsibouklis et al. 1999; 2000; Forster and Bohnet
1999, 2000). Dexter et al. (1975; 1979) demonstrated the low number of marine bacteria
associated with low-energy substrates and high numbers on high-energy substrates.
Milne and Callow (1985) and Callow et al (2005) also reported fewer bacteria adhering
to a low surface energy material compared to a high surface energy material. Tsou and
Mussalli (1988) evaluated 30 nontoxic coatings and their results indicated that silicon-
based coatings performed satisfactorily. Although these coatings with low surface
energy fouled, the fouling growth was easily removed from them. Hardy and Moss
(1979) reported that biofouling deposits weakly attached to Teflon (PTFE) with low
surface enegy were, compared with those produced on higher surface energy surfaces.
Sipahi et al. (2001) and Aronov et al. (2008) reported that biofouling adhesion strength
increased with the surface energy of the coatings increasing.
However, there are also a number of contrary findings, i.e. that high energy surfaces
have a smaller biofouling tendency than low energy surfaces (Fletcher and Marshall,
1982; Fletcher and Pringle 1985; Brink et al., 1993; Busscher 1992; Pasmore et al.
2001).
Baier et al. (1980, 1981, 1983) first gave a relationship between surface energy and
relative bacterial adhesion. Fig. 2.1, known as the Baier curve, shows this relationship,
and can partially explain the above inconsistent conclusion on the effects of surface
energy on bacterial adhesion. Clearly, there exists an optimum value of the surface
energy (about 25mJ/m2) for which bacterial adhesion is minimal.

11
Fig. 2.1 Relative bacterial adhesion vs surface energy (Baier, 1980)
In addition to biofouling, numerous studies have also demonstrated the existence of the
optimal total surface energy for other type of fouling, such as milk protein fouling (see
Figure 2.2; McGuire and Swartzel,1987) and crystalline fouling (Zhao et al. 2005).
Fig. 2.2 Milk fouling vs surface energy (McGuire and Swartzel, 1987)
Zhao et al. (2002, 2004, 2005, 2007, 2009) explained this phenomena using extended
DLVO theory. Baum et al. (2002) have shown that the pilot whale skin has both
hydrophobic and hydrophilic surfaces. Recently, Zhao et al. (2007) presented an
extended Baier Curve, as shown in Figure 2.3. For the superhydrophobic surface with
extreme low surface energy, a thin layer of air could remain on the surface that inhibits
bacteria reaching the surface; while for the super-hydrophilic surface with extreme high
surface free energy, a thin layer of water remains attached on the surface that also
inhibits bacteria to reach the surface. Zhao et al. (2007) performed bacterial adhesion
experiments and obtained the results similar to the extended Baier Curve (Figure 2.4).
01020304050607080
0 10 20 30 40 50 60
Surface energy [mJ/m2]R
elat
ive
Bio
dhes
ion
0
400
800
1200
1600
0 10 20 30 40 50 60
Surface energy [mJ/m2]
Surf
ace
Load
ing
[µg/
cm²]

12
Fig. 2.3 Extended Baier curve
Fig. 2.4 Attached bacteria vs surface energy (Zhao et al., 2007)
2.1.2 Biofouling Control and Removal Techniques
There are many ways to reduce biofouling both mechanically and chemically. So far no
single countermeasure has been identified to completely control biofouling (Lira et al,
1985, 1990). Over the past 50 years, various measures have been taken to combat the
problem marine biofouling in heat exchangers. These have included careful screening of
sea inlets to prevent larger objects being drawn in and the injection of chlorine and
hypochlorite to either discourage biofouling settlement and growth or remove existing
fouling. If possible, the seawater should be allowed to heat up by an extra 15-25 °C (i.e.
to not less than 40 °C) from time to time thereby killing the offending organisms.
Chemical additives often offer an effective anti-biofouling means; however, processing
changes, mechanical modifications of equipment and other methods available to the
plant should not be overlooked. The application of the techniques mainly depend on the
following factors: 1) accessibility, 2) nature of the microorganisms, 3) hydraulic-thermal
0.00E+001.00E+052.00E+053.00E+054.00E+055.00E+056.00E+057.00E+058.00E+059.00E+05
15 20 25 30 35 40 45 50
Surface energy [mJ/m²]
Atta
ched
bac
teri
a CF
U/cm
²

13
conditions of the process, 4) costs of the treatment, 5) safety standards and 6)
environmental impact (Sriyutha Murthy et al. 2004; Eguia et al. 2008).
2.1.2.1 Chemical Techniques
Chlorination
Chlorination of cooling water has been the most widely used process to control
condenser biofouling. Chlorine injection is the normal method of chemical dosing. It
may be either intermittent (shock dosing), or continuous, or a combination of both,
depending upon the type of biofouling which can be expected.
It is common practice nowadays for chlorination to be effected by a chlorine generator
so as to avoid the potential risks associated with storage of substantial quantities of
liquid or gaseous chlorine (Fuller, 1976, 1979; Boyer and Malherbe, 1979). Large
modern plants generally chlorinate at regular intervals 2-4 times per day for period of
15-30 min/application (Burton, 1979; Lira et al, 1976, 1979). From the experience
gathered, it is believed that an electrochlorination system, capable of producing 0.5 ppm
chlorine, will maintain seawater cooling systems free of fouling, as shown in Figure 2.5
and Figure 2.6 (Shone and Grim, 1986).
In general a chlorination cell consists essentially of two electrodes with seawater
passing between them. Part of the contained salt is converted into sodium hypochlorite
and the resulting solution is metered into the cooling system it is protecting (Campbell
et al, 1979). A titanium heat exchanger complete with a chlorination cell (Figure 2.7)
was installed and seawater pumped through the heat exchanger for four months.
Examination of the heat exchanger after four months showed the heat exchanger to be
as installed, i.e. no fouling. Another test was conducted on the heat exchanger, without
chlorination. Severe fouling was observed after a relatively short period, as shown in
Figure 2.8 (Campbell et al, 1979).

14
Fig. 2.5 Condenser inlet free from fouling by electrochlorination (Shone and Grim, 1986).
Fig. 2.6 Condenser heavily fouled after failure of electrochlorination (Shone and Grim, 1986).
Fig. 2.7 Titanium Heat Exchanger (Campbell et al, 1979)
Fig. 2.8 Titanium Heat Exchanger without Chlorination Exchanger (Campbell et al, 1979)
Continuous chlorination of cooling water with concentration about 0.5 – 1.5 mg/litre as
Cl2 has been the most widely used process to control biofouling (Allonier et al., 1999;
Jenner et al., 1997; Rajagopal et al., 2003; Venugopalan et al. 1997; Eguia et al. 2007).
Direct cooled fossil fuel and nuclear power stations on the coast typically use 30 and 45
m3/s of seawater per 1000 MW (megawatt), respectively (Jenner et al., 1997). The
generation and use of such large amounts of chlorine lead to pollution to the
environment and the formation of halogenated by-products (Allonier et al., 1999).
While trihalomethanes (THMs), which are suspected carcinogens, are the major
compounds formed, other by-products are of concern due to their potential toxicity

15
towards aquatic organisms. Any non-chemical method or less use of chemicals for
inhibiting biofouling will reduce marine pollution significantly (Zhao et al, 2005; 2009).
Other Biocides/Inhibitors
Bacteria can be chemically killed by application of bactericidal compounds termed
biocides at lethal doses. To-date, many kinds of biocides are used to control biofouling
in industrial water systems (Azis et al. 2003; Eguia et al. 2007). For different kinds of
bacteria, it is essential to apply the correct biocides and dosages at the correct frequency.
Denyer (1990) listed the antimicrobial effects of selected water treatment biocides. The
use of biocides is expensive and could lead to pollution of the environment.
Biocides avalable are of the principal types (Denyer, 1990 ; Kaiga et al 1989; Azis et al.
2003; Eguia et al. 2007) :
1) Oxidising agents - the halogens and potassium permanganate:
• chlorine • chlorine dioxide • ozone • bromine • bromine chloride • hydrogen-peroxide • iodine • potassium permanganate
2) Non-Oxidizing biocides
• acrolen • arsenates and arsenites • ammonia and amines • cyano compounds • metals- salts • chlorinated phenolics • organometals • organo-tin ammonium salts • phenols-chlorinated and phenylated
• proprietary formulations • surfactants
3) Hydrolysing agents - acids and alkalis.

16
4) Cell poisons - heavy metals.
5) Protein coagulants- mercury and phenol
6) Surfactants - cationic detergents.
Of the above, types 4, 5 and 6 can be ruled out for an open circuits. Phenol and heavy
metals are forbidden by anti-pollution rules, and the surfactants cause foams. Type 3
would involve such concentrations as to upset pH and promote corrosion in the circuit.
Of the oxidising agents, permanganate is sometimes used in closed fresh water circuits,
but would be too expensive in open circuit.
2.1.2.2 Mechanical Techniques
Micro-mesh filters
The most effective water treatment is to filter out the eggs and larvae of the organisms
to reduce their attachment and settlement in the cooling-water-system piping. Test
results using a 50-micro roundwire filter with backwash capability by water and air
indicated reduced fouling (Mussalli and Tsou, 1989; Torbin and Mussalli, 1979). The
filter may be used to treat small flow systems that can withstand a pressure drop.
Sponge rubber balls
Biofilms in pipelines can be removed by a hard sponge bullet or rotary ball which is
placed inside of a pipe and is propelled through the system in the direction of flow (Bell
et all, 1985). Due to the high water pressure building up behind it, it rotates while
moving, scrubbing off the attached material on its way. A major disadvantage is that the
balls can jam the pipe (Shone and Grim, 1986; Nosetani et al. 1981, 1987, 1988, 1989;
Melo and Bott, 1997)
Tube Inserts
A tube insert is a mechanical device which prevents fouling inside the tubes of heat
exchangers. When the insert rotates due to fluid flow, it scrubs the surface of the tube to
remove fouling (Carlos, 1981)
17
Robots
Several remotely operated underwater robots, developed by Mitsubishi Heavy
Industries of Japan, have been used in Japanese power plants for cleaning water
channels and intake structures. (Mussalli and Tsou, 1989; Torbin and Mussalli, 1979;
Tsou and Mussalli, 1988).
Hydroblasting
Hydroblasting is used in cases where chemical cleaning is unsatisfactory. The advantage
of hydroblasting is that the equipment can be easily inspected after the cleaning
operation is completed to verify that the deposits have been removed. The main
disadvantage of hydroblasting is the time and the cost of pulling and reinstalling the
exchanger bundles. For hydroblasting, high-pressure water or a water-sand slurry is
often effective (Eguia et al. 2008). In general, increasing the water velocity to
approximately 3m/s could eliminate “dead” zones and then impede the attachment of
marine and vegetable organisms, as well as more sophisticated organism such as
molluscs.
2.1.2.3 Physical Techniques
Electromagnetic Method
Kvajic (1978) studied electromagnetic water treatment and fouling of heat exchangers.
However, most systematic investigations of magnetic fouling reduction have not
produced any consistent results.
Ultraviolet Light
This method can be used to treat small volumes of water. Ultraviolet light is very
effective in controlling bacteria. But it is not an effective way to control biofouling
caused by such organisms as mussels and barnacles because they are protected by their
shells. The water must be clear so that ultraviolet rays can penetrate it, and there must
be no dissolved iron, even in trace quantities, since it will absorb ultraviolet light.
Preliminary results have shown that seawater bacteria are significantly different from
the well-documented human bacteria and that the associated kill rates are not as high as
anticipated (Seki et al, 1985, 1986). Initial results have also shown that ultraviolet

18
irradiation subdues marine microbiological growth in the early stages by as much as
95.5 % (Seki et al, 1986).
Acoustic Techniques
The acoustic technique works on the principle of creating an inhospitable environment
in which the species finds it unacceptable to settle and live. Experiments indicate that
asonics (20-60 Hz) and ultrasonics (>20K Hz) can retard biofouling (Tsou and Mussalli,
1988). Work in Hawaii on OTEC heat exchangers showed that ultrasonics retarded
biofouling, but neither killed nor stunned the bacteria in seawater, and the surviving
bacteria eventually attached and colonized in heat exchangers (Takahoshi, 1990).
Thermal Treatment
Thermal recirculation, or heat treatment is a highly effective method of controlling
macrofouling in conduit systems (Mussalli and Tsou, 1989). It does not affect
condenser slime but does control most species of mussels and barnacles (Boyer and
Malherbe, 1979).
Ice Nucleation
Biofilms in heat exchangers can be removed by a process known as ice nucleation
where the heat exchanger is frozen, and ice crystals form between the metal surface and
the attached material (Patent: US4419248). The biofilm is physically dislodged from the
surface. This process is usually repeated more than once to obtain satisfactory results.
2.2 Medical Devices-Related Infections
The high incidence of infections caused by the use of implanted biomedical devices,
including catheters (Plowman er al, 2001), bone fracture fixation pins (Wassall et al,
1997) and heart valves (Tozzi et al, 2001; Cook et al, 2000) etc. has a severe impact on
human health and health care costs. Current estimates suggest that in the UK
nosocomial infections cost the UK £1.0 billion per year (Plowman R et al. 1999) and
medical devices and implant-associated infections cost the UK £11 million per year
(Darouiche 2004). In the United States, nosocomial infections cost the USA $11 billion
per year and at least half of the 2 million cases of nosocomial infections are medical

19
devices-related infections (Darouiche 2004, 2007, Richards et al. 1999; Jarvis 1996,
McGowan 2001, Schierholz et al. 1998, 2002). As the use of medicals devices and
implants has increased, the device-related infections become a major concern.
2.2.1 Catheter-associated Infections
Intravascular catheters and urinary catheters are essential components of modern
medical care. Intravascular catheters or central venous catheters are used to deliver life-
sustaining fluids, such as antimicrobial agents, parenteral nutrition, and blood or blood
products. Urinary catheters are used to drain the bladder. Catheter-related infection
remains a leading cause of nosocomial infection, especially in intensive care units and is
associated with significant patient morbidity and mortality (Brun-Buisson et al., 1987;
Blot et al., 1999; Kite et al., 1999; Sherertz et al., 2000; Öncü et al., 2003).
Central venous catheter-related infection rate is high, accounting for 34% - 40% of
nosocomial infections (Bambauer et al., 1982, 1994; Veenstra et al., 1999). It is
estimated that about 5 million and 200,000 central venous catheters are inserted
annually in the US and UK, respectively. About 3% - 8% of central venous catheters
cause bloodstream infections with the mortality of 12% -25% (Pearson 1996; Darouiche,
2001; O’Grady et al., 2002; Elliott et al., 1992). It is estimated that approximately
80,000 -400,000 cases of catheter-related bloodstream infections occurs in US each year,
leading to between 2,400 and 20,000 deaths (Mermel, 2000; Raad et al., 1996, 2002).
Catheter-associated urinary tract infection is the most common nosocomial infection in
medical intensive care units, with infection rate about 31% - 40% (Richards MJ et al.,
1999; Lai KK et al., 2002). There are more than 30 million bladder catheters used each
year in US, about 7.6 infections per 1000 catheter-days (Darouiche, 2001; Maki et al.,
2001; Saint, 2000). In the UK, catheter-associated urinary tract infections alone account
for up to one third of all hospital-acquired infections and cost the UK health service
£177 million in 798,000 extended bed days each year and result in increased morbidity
and mortality (Plowman er al, 1999, 2001). Long-term catheterisation (more than 30
days) is usually used for the treatment of permanent urinary incontinence (Morris et al,
1997). The risk of catheter-associated infections increases with increasing
catheterisation time and over 90% of patients will develop bacteriuria and infection

20
within 28 days of catheterisation (Choong et al, 2001). Urinary tract infections can lead
to life-threatening conditions (e.g. septicaemia) with an increase in mortality (Lai and
Fontecchio, 2002). Encrustation of catheters is another common complication in the
care of many patients undergoing long-term indwelling bladder catheterisation (Morris
et al, 1997). Under the alkaline conditions, struvite (magnesium ammonium phosphate)
and calcium phosphate crystals precipitate from the urine and agglomerate onto the
catheter surface and its biofilm, forming crystalline biofilm (Jones et al, 2005). These
crystalline deposits are hard and can cause trauma to the urethra and bladder mucosa
during catheter removal (Jones et al, 2005).
2.2.2 Pin Tract Infection
A bone fracture is a medical condition in which a bone is cracked or broken. The basic
goal of fracture fixation is to stabilize the fractured bone, to enable fast healing of the
injured bone, and to return early mobility and full function of the injured extremity.
There are two main types’ surgical techniques of fracture fixation: external and internal
(Pfahler M et al. 1996). External fixation uses a combination of pins, wires, clamps, and
bars or rings to set bone fractures (Karunaker MA et al. 2001; Taljanovic MS et al.
2003, Hunter TB et al. 2001). The internal fixation consists of wires, pins and screws,
plates and intramedullary nails or rods. The majority of internal fixation implants are
currently made of stainless steel and titanium.
External and internal fixations are widely used in patients with skeletal fixation, where
the pins and wires travel through skin and soft tissue into bone. Pin tract infection is
common nosocomial infection. Many means are used to avoid these infections including
accurate nursing care, antiseptic baths, frequent skin cleaning, frequent dressings and
use of ointments and antibiotics. In spite of these preventive methods the results are not
satisfactory and pin tract infections still occur in approximately one third of patients
(Wassall et al 1997; Clasper et al 2001; Darouiche 2001). The rates of pin site infection
range from 11% to 56% were reported (Ahlborg and Josefsson 1999; Antich-Adrover et
al 1997; Gregory et al 1996; Hedin et al 2003; Johnson et al 1990; Mahan J et al., 1991;
Mason et al 2005; Masse A et al., 2000; Maueret et al 2000; McGraw and Lim 1998;
Mostafavi et al. 1997; Parameswaran et al 2003; Patterson 2005; Sims M et al., 2000;

21
Wheelwright and Court-Brown 1992; Yokoyama et al 1998). In the UK, pin tract
infection rates around 37% in external fixation have been reported (Clifford et al 1987;
Gopal et al 2000; Keating et al 1991).
Failure to treat a pin site infection in a timely manner may lead to deeper infection,
loosening of the pin, loss of fixation, or stability of the external fixator and
osteomyelitis. In cases of infection the pin/wire must be removed and at worst the
fixator as well. The pin tract infection phenomena can be classified into three grades: 1)
Irritation or inflammation of the soft tissues and skin; 2) True soft tissue infections; 3)
Bone infection and pin loosening, which can result in persisting osteomyelitis.
2.2.3 Surgical Instruments-Related Infections
An epidemic of a new variant Creutzfeldt-Jakob disease (vCJD) was first described in
the United Kingdom (UK) in 1996 (Will et al, 1996). It was eventually shown that this
epidemic resulted from eating beef from cows infected with Bovine Spongiform
Encephalopathy (BSE) (Collinge et al, 1996). It is now generally believed that these
diseases are caused by an infectious protein called a “prion”. 117 patients in the UK
and 10 patients in other countries who are dying from vCJD have been reported (Deslys
et al, 1997; La et al, 2002). BSE has been reported in cow herds in every country in the
European Union except Sweden, it has also been reported in Switzerland, the Ukraine,
Slovakia, Slovenia, the Azores, Canada, the Czech Republic, Oman, Poland, Israel and
Japan (Bosque et al, 2002). Due to the extremely long incubation periods of these
diseases in humans, it remains entirely possible that a substantial worldwide epidemic
of vCJD will occur over the coming years (Ghani et al, 1999, 2000; Hilton et al, 1998,
2002; Prusiner et al 1990). In the meantime we are faced with the possibility that
significant numbers in other human populations and animal herds may be incubating
prion diseases.
It has been known for a long time that prion disease can be transmitted by surgical
instruments and that cross-infection may occur despite the use of current sterilisation
protocols (Gibbs et al, 1968, 1994; Frosh et al, 2001; Bernoulli et al 1977). It has
already been demonstrated that stainless steel is capable of transmitting prion disease
(Zobeley et al 1999; Flechsig et al 2001). Stainless steel is used in the majority of

22
surgical instruments and there is clear evidence from case reports in humans and animal
models that prion diseases can be transmitted via stainless steel surgical instruments
(Laurenson et al 1999).
The most effective generic approach to prevent vCJD transmission via surgical
instruments is to remove all traces of prions at the washing phase of the
decontamination process. Unfortunately it is very difficult to remove prions completely
from stainless steel surfaces as they are readily and tightly bound to the surfaces
(Zobeley et al 1999). Prions also exhibit unusual resistance to conventional chemical
and physical decontamination methods, and cannot readily be destroyed by
conventional disinfection and sterilization methods (Brown et al 1982, 2000; Ernst and
Race 1993). It has been shown that stainless steel instruments can retain CJD infectivity
even after formaldehyde or sodium hydroxide treatment, and extended periods of
autoclaving have also been shown to be unreliable (Taylor et al 1994; 1996). Surgical
instruments are reused often, and their time in service often exceeds 10 years (Frosh et
al, 2001). Each set of instruments over its lifetime will have come into contact with
many patients, significantly increasing the risk of contamination (Laurenson et al 1999).
2.2.4 Other Devices Related Infections
In addition to the catheter, pins and surgical instruments, prosthetic heart valves, total
artificial hearts, joint replacement or other orthopaedic devices, and dental implants etc.
also have infection problems. For example, prosthetic valve endocarditis remains one of
the most dangerous and life-threatening complications following heart valve
replacement, there are more than 100,000 artificial heart valves are implanted per year
in the US, and the number is increasing (Fang G et al., 1993). Mortality rates of
prosthetic valve endocarditis as high as 75% have been reported (Illingworth BL et al.,
2000). Over 12,000 infections related to joint prostheses per year in the US (Darouiche
RO, 2004).
2.2.5 Pathogenesis of Medical Devices and Implants Related Infections
As these devices are made of inert biomaterials, they are also highly susceptible to
bacterial contamination. Generally, bacteria come from patient’s skin and air or from

23
somewhere in the patient’s body (Gillespie WJ, 1990; Maderazo EG et al., 1988). Bos
R et al. (1999) described the initial steps in the formation of a complex, multispecies
biofilm, as shown in Figure 2.9
Fig.2.9 Initial steps in biofilm formation A: Adsorption of conditioning film components; B: microbial transport and coaggregation; C: reversible adhesion of single organisms and of microbial coaggregates; D: co-adhesion between microbial pairs; E. anchoring or the establishment of firm, irreversible adhesion through exopolymer production; F: growth (Reproduced from Bos R et al., 1999)
The initiation of biofilms on the inert surfaces always begins with the attachment of a
small number of bacterial cells which, under favourable conditions, multiply to form a
biofilm (Gristina, 1987). The initial bacterial adhesion is called reversible adhesion and
it is governed by physico-chemical interactions. It has been demonstrated that the
surface properties of the biomaterials have significantly influence on bacterial adhesion,
such as surface energy and surface chemistry etc. This stage or reversible adhesion is
soon followed by a physical binding of the bacterial cells to the inert surface
(irreversible adhesion) through exopolysaccharides produced by the bacteria. The
multiplication of these adhered cells would lead to the formation of microcolonies and
the development of a mature biofilm, which is resistant to the host’s defence
mechanisms, antibiotics and antiseptic treatments, leading to infection (Bos et al 1999;
Pereni et al 2006). Biofilm formation on the surfaces of medical devices and implants is
A B C
D E F

24
the pathogenesis of the devices-related infections (An et al., 1996, 2000; Fitzgerald
1989; von Eiff et al., 2005).
The devices-related infections cause increased morbidity and mortality (Cook G et al.
2000; Lai KK et al. 2002). For example, for bacteria to cause pin tract infection, they
must first attach and colonize at the skin-device interface, and then advance along the
surface of the pin, causing deep pin tract infection and even posteomyelitis (Wassall et
al 1997; Darouiche 2001). As the “inert” pin surfaces are not well protected by host
defences and by antibiotics treatment, they provide a focal point for infecting pathogens
(Darouiche 2001; Bosetti et al 2002). Therefore prevention of bacterial attachment and
colonization on the device surfaces will have a major impact in reducing the rate of
infections (Darouiche 2001; Bosetti et al 2002). Although the initial adhesion process is
thermodynamically influenced by the characteristics of the bacteria, the inert surface
and the interaction medium, in practice it is only the device surface that can be modified
in order to reduce the bacterial adhesion and infection.

25
CHAPTER 3 AIMS AND OBJECTIVES
3.1 Anti-biofouling Coating Techniques
An effective and desired approach to reduce biofouling is to alter the surface properties
of heat exchangers or medical devices by surface coating techniques and to make it less
attractive for the biofouling components, so that they can be removed easily from the
surfaces by flowing fluids. So far many toxic coatings and non-toxic coatings have been
developed for the control of biofouling using a range of coating techniques, including
chemical plating, physical vapour deposition (PVD) and chemical vapour deposition
(CVD) etc.
3.1.1 Toxic Anti-biofouling Coatings
The most important biocides are cuprous oxide and organo-tin compounds (Kjaer,
1992). These toxic ingredients must leach out or release slowly in the surrounding water.
Although the antifouling coatings offer the “best” solution of the biofouling problem, a
number of disadvantages exist of which three are most important. First, its antifouling
formulations have limited time of effective performance, estimated at 12 months for
copper coatings and 18-30 months for organotin coatings (Kjaer, 1992; Lindner, 1988).
The second disadvantage is the pollution to the environment. This in turn creates

26
pollution problems affecting fish and other living inhabitants of the marine environment.
Environmental concerns are also expressed related to the effects of organotin
compounds from human consumption of contaminated animals. Therefore since 1990,
many countries, including UK, USA, Canada, Japan, Australia and New Zealand have
legislated restrictions on the use of organotin-based antifouling coatings (Kjaer, 1992).
The third disadvantage is the poor thermal conductivity and poor abrasion of the
coatings that inhibit their commercial use in heat exchangers.
In view of increasing bacterial resistance to antibiotics and antiseptics, silver coating
may be an effective strategy to prevent medical devices-related infections (Schierholz et
al 1998). However, numerous clinical studies show that the use of silver-coated devices
resulted in non-significant reduction in medical devices-related infections as bacteria
(dead and alive) strongly stick to the silver-coated surfaces (Thibon et al 2000; Leone et
al., 2004; Cook et al 2000). As a result, the silver-coated sewing cuff (Silzone valve)
was withdrawn from the market on January 2000 (Tozzi et al 2001). The silver-coated
medical devices are not recommended for widespread use (Thibon et al 2000).
3.1.2 Non-Toxic Anti-biofouling Coatings
Due to the world-wide legislation, one can assume that toxic antifouling coatings will
eventually disappear completely from the market. Therefore, non-toxic coatings have
attracted more attention.
Polymer and Metal Nanocomposite Coatings
Many attempts have also been made to reduce fouling by coating surfaces with
polymers (e.g. silicone, PTFE) due to their non-stick properties. However, the poor
thermal conductivity, poor abrasion resistance and poor adhesion to metal substrate of
these polymer coatings currently inhibit their commercial use (Müller-Steinhagen and
Zhao, 1997). In order to overcome the disadvantages of polymer coatings, Zhao et al
(2002, 2004, 2005, 2007) have developed polymer-metal nanocomposite coatings using
electroless plating technique for the control of fouling. Because the electroless Ni–P–
PTFE coatings are metal-based, their thermal conductivity, anti-abrasive property,
mechanical strength and adhesion strength to the substrate are superior to standard

27
PTFE coatings. Zhao et al (2002, 2004) found that Ni–P–PTFE coatings reduced
significantly bacterial adhesion, compared with stainless steel.
Diamond-like carbon coatings
Diamond-like carbon (DLC) coatings have attracted great interest due to their excellent
properties such as excellent thermal conductivity similar to metals, low friction,
extremely smooth surface, hardness, wear resistance and corrosion resistance (Grill,
1993). DLC is also an excellent base coating to be alloyed with different elements. The
amorphous nature of DLC opens the possibility of introducing additional elements, such
as Si, F, N, O and their combinations, into the coating whilst still maintaining the
amorphous phase of the coating (Hauert, 2003). Recently, the incorporation of selective
elements into DLC has been shown to be an effective method to enhance the anti-
fouling and other properties of DLC coatings. The modified DLC coatings are usually
produced by magnetron sputtering techniques or by plasma enhanced chemical vapour
deposition (PECVD) techniques. Zhao et al. (2007, 2010) explored initial bacterial
attachment on silicon-doped DLC coatings and showed that the silicon-doped DLC
coatings reduced bacterial attachment. Numerous studies demonstrated that the heat
transfer surfaces coated with DLC reduced scale adhesion and subsequent scale
formation, compared with untreated titanium and stainless steel surfaces (Müller-
Steinhagen and Zhao, 2000; Bornhorst et al, 1999; Santos et al. 2004). Zhao and Wang
(2005) demonstrated that the fluorinated DLC coatings further significantly reduced
scale adhesion and subsequent scale formation, compared with DLC coatings. Hasebe et
al. (2007) showed that the fluorinated DLC coatings inhibit protein adsorption and
platelet activation. Ishihara et al. (2006) demonstrated that the antibacterial performance
of the pure DLC coatings was improved significantly by the incorporation of fluorine
with Escherichia coli.
3.2 Aims and Objectives 3.2.1 Development of Novel Anti-bacterial Nanocoatings
Ni–P–PTFE coatings seem the one of the best coating techniques for controlling
biofouling. However their anti-biofouling properties could be futher improved by
incorperating biocide polymer nanoparticles into the Ni–P–PTFE coatings. The

28
modified DLC coatings with selected elements have great potential for controlling
biofouling in heat exchangers and for controlling biofilm formation in medical devices
and implants. Howevever the deoped elements and their contents in the DLC coatings
should be optimised in order to get best anti-biofouling formance.
In this study, the electroless plating technique was used to develop novel anti-biofouling
Ni–P–PTFE-Biocide Polymer nanocomposite coatings; Magnetron sputtering and
plasma enhanced chemical vapour deposition (PECVD) techniques were used to
develop new anti-bacterial modified DLC coatings, including Si-N-DLC coatings, B-
DLC coatings, Ti-DLC coatings. A range of new SiOx-like coatings was also developed
and evaluated. A series of coatings with different surface properties such as surface
chemistries and surface energies were designed and produced. The surface properties of
the coatings were characterized using surface analysis facilities, such as AFM, SEM,
XPS and OCA 20 etc.
3.2.2 Evaluation of the Nanocoatings
The nanocomposite coatings were evaluated with bacterial strains that frequently cause
heat exchanger biofouling and medical devices-related infections. Viable plate count
and microscope techniques were used for bacterial adhesion assays.
3.2.3 Investigation of Anti-bacterial Mechanisms
In this study both a thermodynamic approach and the extended DLVO theory were used
to explain the bacterial adhesion mechanism and the bacterial adhesion results on the
nanocomposite coatings.
29
CHAPTER 4 PREPARATION OF Ni–P–POLYMERS AND MODIFIED DLC NANOCOATINGS 4.1 Electroless Plating Ni-P-Polymers Coatings 4.1.1 Electroless Plating Ni-P Coatings
Electroless plating is a process of electrochemical reaction, in which metal ions are
reduced to a metallic coating by reducing agent in solution. Since plating takes place
only on suitable catalytic surfaces without external current source required, it is also
known as autocatalytic plating. The first bright metallic deposits of nickel-phosphorus
(Ni-P) alloys were obtained in 1911 by Breteau (1911). Later Roux (1916) developed
an electroless nickel plating bath. Paal (1931) and Scholder (1931) studied this reaction
in details. In 1946, Brenner and Riddell further developed Ni-P plating process by
using reducing agent hypophosphite, which was patented in 1950 in USA. In 1953,
General Application Transport Company in USA made the first industry line of
electroless plating Ni-P with improved electroless nickel process, which was licensed to
some 25 other companies during the 1960’s and early 1970’s (Duncan, 1995).
The advantages of electroless plating Ni-P technique include (Totlani, 1992):

30
1) Coating thickness is very uniform;
2) No external current are required;
3) Almost any metallic or non-metallic, non-conducting surfaces, including
polymers (plastics), ceramics, glasses can be plated at low temperature (< 90°C).
Those materials which are not catalytic to the reaction can be made catalytic by
suitable sensitizing and nucleation treatments;
4) Coatings have unique chemical, mechanical and physical properties, such as
good hardness, excellent corrosion resistance, electrical conductivity, good wear
and abrasion resistance, low coefficient of friction.
Due to the unique properties of electroless plating Ni-P coatings, they have been applied
in many industries, including chemical, mechanical, food processing and electronic
industries etc. (Bates, 1998; Chitty et al., 1997; Staia et al., 1996). Bates (1998) gave
the ratio of electroless plating Ni-P coating application in industry, as shown in Fig. 4.1
10% 5%
15%
15%10%5%
5%
5%
3%
2%
3%
17%5%
Aeronautic industry
Automobile
Electron PC
Mechanical industry
Petroleum and chemistryengineeringFood
Pump
Plastic
Printing
Nuclear
Electric pow er
Valve
Others
Fig. 4.1 The distribution of electroless nickel coating application in industry
The electroless Ni-P is usually deposited by the catalytic reduction of nickel ions with
sodium hypophosphite in acidic or alkaline baths. The phosphorus content in the Ni-P
coating has significant influence on its chemical and physical properties. For example,
the corrosion resistance of the Ni-P coatings increases with increasing P contents in the

31
coatings (Ploof 2008; Armyanov et al., 1999; Tachev et al., 2001; Martyak et al., 1993).
The hardness of electroless plating Ni-P is generally around 450~600 HV (Vickers
Hardness). The hardness increases to 1000 HV after heat treatment at 300°C - 400°C,
which is much higher than stainless steel (220 HV) or electroplating Cr (800~900 HV)
(Kumar et al., 1996).
4.1.2 Electroless Plating Ni-P-PTFE Coatings
Although electroless nickel coating has been used in many industries, future
modification is required in order to meet special requirements by the incorporation of
solid particles into Ni-P coatings to form Ni-P based nano- or micro-composite coatings.
These composite coatings combine the advantages of the metal matrix and the included
particles (Losiewicz et al., 1999; Shuji et al., 1996). The particles include SiC, WC,
Al2O3, TiO2, Si3N4, MoS2 and PTFE etc (Kerr et al., 2000; Feldstein, 1998; Moonir-
Vaghefi et al., 1997; Nishira et al., 1994; Zhao et al 2002). For example, the
incorporation of SiC particles into Ni-P coating significantly increases the hardness of
the Ni-P coating, i.e. the hardness of the Ni-P-SiC composite coatings is much higher
than that of Ni-P coatings (Apachitei, et al., 1998; Grosjean et al., 1997).
The first composite coating of electroless Ni-P-PTFE was introduced by Tulsi et al. in
1981 (Tulsi et al. 1982, 1983). The incorporation of PTFE particles into the Ni-P matrix
can take advantage of the different properties of Ni-P alloy and PTFE
(polytetrafluoroethylene). PTFE is also known as Teflon with chemical formula as
shown in Fig. 4.2, which was developed by Roy Plunkett of Kinetic Chemicals in New
Jersey in 1938 and registered with the Teflon trademark in 1945 (Plunkett).
Fig 4.2 Chemical structural formula of PTFE
32
PTFE is chemically very inert and has a relatively high melting point (325 °C). Its
coefficient of friction is lower than that of almost any other polymers. Because of its
extremely low surface energy (18.6 mJ/m2), PTFE has excellent non-stick properties
(Hadley and Harland 1987). The resulting properties of electroless Ni-P-PTFE coatings,
such as non-stick, non-galling, anti-adhesive, higher dry lubricity, lower friction, good
wear and good corrosion resistance, have been used successfully in many industries,
automotives, pump, oil pipes, dished valve, shaft bearing, gear, electronics, synthetics,
textile, pneumatics, pharmaceutics and food (Pietsch 2009). A concise review of the
field of Ni-P-PTFE and highlights the importance of process control in obtaining critical
deposit characteristics for a variety of demanding industrial applications were given by
Roberto (1988), Kerrr et al (2000) and Helle and Walsh (1997).
Zhao et al first demonstrated that Ni-P-PTFE coatings have anti-fouling properties,
including water scaling (Zhao etal 2002, 2005) and biofouling (Zhao et al 2004, 2005,
2006). Because electroless Ni-P-PTFE coatings are metal-based, their thermal
conductivity, anti-abrasive property and mechanical strength are superior to standard
PTFE coatings.
PTFE particles readily coagulate and precipitate in the plating solution since PTFE is a
water-repellent material. Due to this agglomerate formation it is difficult to obtain a
uniform dispersion of PTFE particles in a plating bath. This will not only reduce the
PTFE content in the coatings, but also increase the surface roughness as larger PTFE
particles are incorporated (Matsuda et al., 1995; Nishira et al., 1996; Zhao et al 2002).
To produce a better electroless Ni-P-PTFE coating, the PTFE particles must be
uniformly suspended in a plating solution using surfactants (Ger et al., 2002) or
mechanical agitation (Nishira et al., 1996) or ultrasonic agitation (Higahitani et al.,
1993; Nishira et al., 1996) during the electroless plating Ni-P-PTFE process. If the
PTFE particles are not uniformly suspended in a plating solution, they will not able to
uniformly distribute throughout the Ni-P matrix. Areas where less PTFE is incorporated
do not have the same physical and mechanical properties as areas where the PTFE
content is higher (Zhao et al 2002). This influences the mechanical and tribological
(friction, lubrication, bearing and hydrodynamic) properties of the coating, and is a
main problem in many electroless Ni-P-PTFE coatings. Nishira et al. (1996) studied the
effects of agitation methods on the particle size distribution of PTFE aggregates in a

33
plating solution. One of their findings was that an ultrasonic homogenizer was more
effective than mechanical agitation. It would be very desirable if the PTFE particles in
the plating solution could be dispersed uniformly by using surfactants alone (Zhao et al
2002). A surfactant is a chemical whose molecules have a hydrophilic section (water
soluble) and a hydrophobic section (water insoluble), see Fig. 4.3a.
(a) (b)
Fig. 4.3 Typical surfactant molecule
A hydrophobic section of surfactant will absorb onto the PTFE surface. A hydrophilic
section of surfactant will solubilize in aqueous solution and then prohibit PTFE
coagulation and precipitate (Fig. 4.3b). Surfactants usually are classified into cationic,
non-ionic and anionic surfactants. The functions of surfactants used in Ni-P-PTFE
plating solutions include: 1) to make PTFE particles hydrophilic and to suspend them
uniformly in the plating solution; 2) to make the PTFE particles to be charged so that
the particles can move to the substrate and then co-deposit onto the substrate together
with Ni-P (Liu and Zhao 2003). Zhao and Liu (2003) investigated the effect of different
types of surfactants on the suspension of PTFE micro-particles and found that a cationic
surfactant C20H20F23N2O4I (FC-4) performed best.
4.1.3 Electroless Plating Ni-P-Biocide Polymer Coatings
Ni–P–PTFE coatings seem the one of the best coating techniques for controlling
biofouling in heat exchangers and pipelines. However their anti-biofouling properties
could be futher improved by incorperation biocide polymer nanoparticles into the Ni–
P–PTFE coatings. In this study, an electroless plating technique is used to develop
novel anti-biofouling Ni–P–Biocide Polymer and Ni–P–PTFE-Biocide Polymer
nanocomposite coatings.
Hydrophilic
Hydrophobic

34
4.1.3.1 Biocide Polymers
As mentioned above, the conventional toxic anti-biofouling coatings contain anti-
microbial agents and they must release slowly in the surrounding water. The
disadvantages of the toxic coatings include poor durability and the pollution to the
environment.
Recently the Graz University of Technology, Austria has developed a range of new
contact biocide polymers using the Ring Opening Metathesis Polymerisation (ROMP)
synthesis technique (Kreutzwiesner et al, 2010; Ilker et al. 2004). Compared to such
conventional antimicrobial agents, contact biocide polymers have the advantages to be
non-volatile, chemically stable and do not leak degradation products of low molecular
weight into the surrounding. The anti-microbial mechanism of the new contact biocide
polymers is not based on the slow release of biocide into the surrounding, the polymers
are real contact biocides, i.e. they have “contact kill” function (Kreutzwiesner et al,
2010). In this study, the anti-microbial efficiency of 13 different types of biocide
polymers from Graz University of Technology was evaluated with Escherichia coli and
Staphylococcus aureus. It was found that two biocide polymers SM14 and SM20
perform best against bacterial attachment. The chemical structures of SM14 and SM20
are shown in Fig. 4.4 (Su et al, 2011). As a result, four new anti-biofouling Ni-P-biocide
polymers nanocomposite coatings: Ni-P-SM14, Ni-P-PTFE-SM14, Ni-P-SM20 and Ni-
P-PTFE-SM20 were developed. A patent has been filed in 2012 (Su et al 2012).
Fig. 4.4 Chemical structures of SM14 and SM20
OO
HN
350 1 5 0 s t a t .
S M 1 4
O O C 1 2 H 2 5
OO
C12H25
100
Ph
O O
H N
3 0 0 300stat.
S M 2 0
P h O
O C12H25

35
4.1.3.2 Mechanism of Electroless Plating Ni-P-Polymers
Agarwala et al. (2006) suggested that the mechanisms of electroless plating Ni-P could
be due to chemical bonding. Chemical bonding mechanism is divided into
electrochemical bonding mechanism and atomic hydrogen mechanism. The
electrochemical mechanism supposed that hypophosphite ion is catalytically oxidized
and nickel and hydrogen ions are reduced at the catalytic surface (Gutzeit and Crehan
1954; Agarwala et al. 2006). The atomic hydrogen mechanism involves following
reactions (Brenner A et al., 1946; Goldie 1968; Mallory 1979; Agarwala et al. 2006):
(1) Atomic hydrogen generation: The atomic hydrogen, generated by the reaction
of water with hypophosphite, is absorbed at the catalytic surface:
H2PO2- + H2O ⎯⎯⎯ →⎯catalytic HPO3
2- + H+ + 2 [H] (4.1)
(2) Nickel ions reduction: The absorbed atomic hydrogen reduces nickel ions at
the catalytic surface:
Ni2+ + 2[H] → Ni0 + 2H+ (4.2)
The evolution of hydrogen gas, which always accompanies catalytic nickel
reduction, was ascribed to the recombination of two atomic hydrogen atoms:
2 [H] → H2 (4.3)
(3) Phosphorus generation: A secondary reaction between hypophosphite and
atomic hydrogen results in the formation of elemental phosphorus:
H2PO2- + [H] →H2O + OH- + P0 (4.4)
(4) Nickel and phosphorus codeposition: Nickel and phosphorus codeposit on
substrate materials to form Ni-P coatings.
Ni + P → Ni-P (4.5)
(5) Nickel, phosphorus and polymer nanoparticles codeposition:
Ni + P + Polymers (PTFE, SM14 or SM20) → Ni-P-Polymers (4.6)

36
4.1.3.3 Pretreatment Procedures of Steel Substrate
In this study, Ni-P-Polymers (Ni-P, Ni-P-PTFE, Ni-P-SM14, Ni-P-SM20, Ni-P-PTFE-
SM14, Ni-P-PTFE-SM20) were coated on AISI 316 stainless steel sheets of 25mm ×
25mm × 1mm containing Fe 69%, Cr 18%, Ni 10%, Mo 3% with density of 7.96 g/cm3
(Goodfellow Company, UK) at the Biological and Nanomaterials Lab, University of
Dundee. The pre-treatment and coating procedures are listed in Table 4.1.
Table 4.1 Pretreatment of steel substrates for electroless plating Ni-P-Polymers
Procedures Bath composition and operating conditions
Alkaline cleaning NaOH: 20 ~ 35 g/l; Na3PO4: 25 ~ 35 g/l; Na2CO3: 25 ~ 30 g/l; Na2SiO3: 5
~ 10 g/l; 60 ~ 80 °C; 5 ~ 10 min.
Rinsing H2O; room temperature
Electrocleaning NaOH : 20 ~ 35 g/l; Na3PO4: 25 ~ 35 g/l; Na2CO3: 25 ~ 30 g/l; Na2SiO3: 5
~ 10 g/l; room temperature; 2 ~ 3 min; voltage: 5 ~ 7 V.
Rinsing H2O; room temperature
Pickling HCl(30%):H2O=1:1; room temperature, 0.5 ~ 1 min.
Activation NiCl2⋅6H2O: 200 ~ 400 g/l; HCl (30%): 75 ~ 200 ml/l; anode plates: Ni;
current density: 2~3 A/dm2; room temperature; 1~3 min.
Alkaline Cleaning
Alkaline cleaning is to remove oil from substrate surfaces. The composition of alkaline
cleaning solution used in this investigation is given in Table 4.1. After alkaline cleaning,
the samples are rinsed after cleaning in deionised water at room temperature.
Eletrocleaning
The composition of cathodic electrocleaning solution is the same as alkaline cleaning
solution. The samples to be cleaned act as anode and two stainless steel plates act as
cathodes, as shown in Fig 4.5. The cleaning is usually performed under the direct
current voltage: 5 ~ 7 V at room temperature. After cleaning, the samples are rinsed in
deionised water at room temperature. The electrocleaning time is about 5~10 min
depending on the degree of contamination and substrate materials (Zhao et al 2002).

37
Fig 4.5 Schematic drawing of eletrocleaning device
Pickling
Pickling is used to remove oxidized film or rust from the substrate surfaces. The
common pickling solution consists of hydrochloric acid (HCl). In this study, the
pickling solution with HCl 30%: H2O (1:1 in volume) were used. Picking time is
important. If pickling time is too short, oxidized film or rust cannot be removed
completely leading to poor coating quality; if pickling time is too long, the substrates
are subjected to over etching. Pickling time for the stainless steel 316 in this study was 1
min.
Activation
As stainless steel is an inert metal, it is not easy to react with other chemicals. Therefore,
activation is required to make the substrate active, that is, to coat a thin sub-layer of
nickel on the stainless steel substrate using electro plating process with power supply
(Zhao et al 2002). The composition of activation solution used in this investigation is
shown in Table 4.1. The activation was performed under direct current density 2~3
A/dm2 at room temperature for 1~3 min. Two nickel plates and the sample (workpiece)
act as anodes and cathode, respectively as shown in Fig 4.6. After activation, the sample
was rinsed with deionised water at room temperature and then transferred into Ni-P
plating solution immediately for Ni-P-Polymers coatings.
DC Power Supply
Workpiece
Cathode
Anode
Solution
Stainless Steel Plates

38
Fig 4.6 Schematic drawing of activation device
4.1.3.4 Bath Composition of Electroless Plating Ni-P-Polymers
The composition and the electroless plating Ni-P and Ni-P-Polymers conditions used in
this investigation are listed in Table 4.2.
The chemical compositions of electroless plating Ni-P-Polymers solution under acidic
conditions consist of nickel salts, reducing agent, complexing agent and stabilizer,
buffering agent and polymer particles (PTFE, SM14 or SM20).
Nickel Salts
Nickel sulfate (NiSO4·6H2O) is the most widely used for producing high quality Ni-P
based coatings (Zhao et al 2002). NiSO4.6H2O with the molecular mass 262.86 g/mol
was used in this research. In addition, other nickel salts are also available for producing
nickel ions, such as nickel chloride, nickel sulfamate, nickel acetate and nickel
hypophosphite.
Reducing Agent
The reducing agent widely used in Ni-P based plating is sodium hypophosphite
(NaH2PO2.H2O). In this research, sodium hypophosphite was also used.
Activation Solution
DC Power Supply
Workpiece
Ni Plate Ni Plate

39
Table 4.2 Bath composition and operating conditions for electroless Ni-P and Ni-P-Polymers nano-composite coating
Composition Ni-P Ni-P-PTFE Ni-P-SM14
Ni-P-SM20
Ni-P-PTFE-SM14
Ni-P-PTFE-SM20
NiSO4.6H2O (g/l) 15~35 15~35 15~35 15~35
NaH2PO2.H2O (g/l) 20~40 20~40 20~40 20~40
Na3C6H5O7.2H2O (g/l) 10~30 10~30 10~30 10~30
(NH2)2CS (ppm=mg/l) 0~3 0~3 0~3 0~3
CH3COONa (g/l) 15 15 15 15
PTFE (60 wt. %) (ml/l) 0~15 0~15
SM14 or SM20 (g/l) 0~2 0~2
Surfactant (g/l) 0~0.8 0~0.8 0~0.8
Temperature (°C) 80~95 80~95 80~95 80~95
pH 4.5~6.0 4.5~6.0 4.5~6.0 4.5~6.0
Stir 60rpm 60rpm
Complexing Agent
In this study, sodium citrate (Na3C6H5O7·2H2O) was used as complexing agent. There
are three principal functions that complexing agents perform in the electroless plating
Ni-P solutions: 1) To exert a buffering action that prevents the pH of the solution from
decreasing too fast; 2) To prevent the precipitation of nickel salts, e.g., basic salts or
phosphates; 3) To reduce the concentration of free nickel ions. In Ni-P plating process,
Ni-P could precipitate in the bath bottom. If this happens, the surface quality of coating
deteriorates resulting in rough and dark coatings. Moreover, the nickel ion concentration
in the solution also decreases and the bath gets on to the verge of total decomposition.
Complexing agent maintains the nickel in a stable complex until it's needed for plating
(Agarwala et al. 2006).
Stabilizers
After a period of the electroless nickel plating under normal operating conditions, the
bath solution could decompose spontaneously leading to precipitate which consists of
nickel particles and nickel phosphate. Stabilizers are used to control the plating reaction
by absorbing the active precipitates that trigger the subsequent random decomposition

40
of the entire plating bath. Thiourea and Pb are widely used as stabilizers. In this
research, thiourea (NH2)2CS was used as a stabilizer. The stabilizer concentration in the
plating bath is critical. Generally, the range of stabilizer for thiourea is 1-2 mg/l (ppm).
In many cases, when the concentration of thiourea is over 3 ppm, the plating reaction
can be completely inhibited and the quality of coating will be poor such as voids, pits or
skip plating, especially around sharp edges.
Buffering Agents
As hydrogen ion generates in the plating bath during electroless plating Ni-P process,
PH value will decrease with increasing plating time. Buffers are used to minimize pH
change in the plating bath and to keep the solution pH stable. In this study, sodium
acetate (CH3COONa) was used as buffering agent. However if PH decreases to the
correct value, a neutralizer such as ammonia or sodium hydroxide must added to keep
the PH of plating solution to the correct value.
Polymer Particles
A 60% PTFE emulsion from Aldrich with the particle size in the range 0.05 - 0.5 μm,
and particles of SM14 and SM20 (0.2μm) from the Graz University of Technology,
Austria were used. In order to suspend the polymer particles the FC-4 cationic
surfactant (C20H20F23N2O4I) was used. In order to get nano-composite Ni-P-Polymers
coatings, PTFE emulsion was passed through a filter of the pore size 0.2 µm before the
use. Total coating time was about 1 hr with the average coating thickness around 12 μm.
In order to improve adhesion force of Ni-P-Polymers coatings to substrate, a 2 µm Ni-P
sublayer was coated on the stainless steel substrates to form Ni-P/Ni-P-Polymers multi-
layer nanocomposite coatings.
4.1.3.5 Deposition Rate
The deposition rate is defined as the coating thickness, h (µm) divided by coating time t
(hour):
ht
γ = (4.7)
Generally, several parameters affect the deposition rate of Ni-P-Polymers coatings,

41
including the chemical compositions and concentrations of plating bath, pH, operating
temperature etc.
4.1.4 Electroless Plating Ni-P-Polymer System
The elcetroless plating system at the Biological and Nanomaterials Lab, University of
Dundee for preparing Ni-P-Polymers coatings is shown in Fig 4.7.
Fig. 4.7 Elcetroless plating system
The elcetroless plating system consists of the following equipment:
SUB 14 water bath (Grant, UK) was used to maintain a constant water temperature (5 ~
99 °C) with stability ±0.2 °C. It consists of a stainless steel tank with capacity 14 litres,
heaters and temperature sensors mounted underneath the tank. A water bath was used to
keep a stable temperature for electroless plating.
The vacuum filtration system (Millipore Company) consists of a 300ml glass funnel, a
membrane filter, a 1 litre flask and a vacuum pump. The funnel and filter are held by
clamp. The filter is made of PTFE with diameter 47mm and pore size 0.2µm. In this
study it was used to remove impurities and large polymer particles from plating
solutions.
42
SevenEsay pH Meter S20 (Fisher, UK) was used for pH measurements of the electroless
plating solution by immersing its probe into the test solution. The pH range is 0~14, the
temperature is in the range from -5.0 ºC to 105 ºC and the accuracy is 0.01. The buffers
correct can be used three point calibrations to improved accuracy.
ISO-TECH IPS-3610D power supply was used for electrocleaning and activation of
substrates before electroless Ni-P plating. The direct current range is up to 10A and
voltage range is up to 36V, depending on the requirement.
Barnstead EASYpure RoDi laboratory water purification system was used in this study.
For coating preparation, pure water is required. Tap water contains impurities such as
trace amount of ions Ca, Mg, Ni, Cu and Fe etc, which may led to plating solution
decomposition or may have significant adverse effect on coating quality. It combines
Easypure UV and Easypure RO into a single unit with a 6.5 litre internal reservoir. The
flow rate is 800 ml/min. The pure water for bacterial adhesion assays was also produced
using this system.
4.2 Doped Diamond-like Carbon Coatings 4.2.1 An Overview of the DLC Coatings
Diamond-like carbon (DLC) coatings have attracted great interest because of their
properties such as excellent thermal conductivity similar to metals, low friction,
extremely smooth surface, hardness, wear resistance and corrosion resistance (Grill,
1993), which make them suitable for heat exchanger applications. DLC coatings also
have excellent biocompatibility, which are very suitable for the applications in medical
devices and implants (Grill A, 1993; Butter RS et al., 1995; Singh A et al., 2003).
DLC itself does not have particularly good non-stick properties due to its high surface
energy. The amorphous nature of DLC opens the possibility of introducing additional
elements, such as Si, F, N, O and their combinations, into the coating whilst still
maintaining the amorphous phase of the coating (Hauert 2003). A number of
researchers have reported that the incorporation of silicon or nitrogen improves the
properties of DLC coatings (Robertson 2002). It has been demonstrated that the
incorporation of silicon in DLC coatings greatly improved the thermal stability of DLC

43
coatings (Gangophadhyay et al. 1997; Wu and Hon 1999). It was also reported that
silicon-doped DLC coatings had a low friction coefficient (Kim et al. 1999; Lee et al.
1997). Franceschini et al. (1992) showed that the nitrogen-doped DLC coatings reduced
internal stress. Grischke et al (1998) found that the doped DLC coatings with silicon
and oxygen had significant influence on the surface energy of the DLC coatings. Zhao
et al. (2007) showed that the surface energy of DLC coatings reduced significantly by
doping F or Si into DLC coatings. Recently the incorporation of selective elements into
DLC has been shown to be an effective method to alter the surface energy of the DLC
coatings and to enhance the antibiofouling and other properties of DLC coatings. Si-
doped DLC on stainless steel has been used as a protective coating for biocompatible
implants (Okpalugo et al, 2001). Zhao et al. (2007, 2010) showed that the silicon-doped
DLC coatings reduced bacterial attachment significantly compared with pure DLC
coatings. Numerous studies demonstrated that the heat transfer surfaces coated with
fluorine-doped DLC coatings reduced scale adhesion and subsequent scale formation,
compared with DLC coatings, untreated titanium and stainless steel surfaces (Müller-
Steinhagen and Zhao, 2000; Bornhorst et al, 1999; Santos et al. 2004; Zhao and Wang
2005). Hasebe et al. (2007) showed that the fluorinated DLC coatings inhibit protein
adsorption and platelet activation. Ishihara et al. (2006) demonstrated that the
antibacterial performance of the pure DLC coatings was improved significantly by the
incorporation of fluorine with Escherichia coli.
However the optimal contents of the doped elements on bacterial adhesion have not
been investigated yet. There are no studies that explore bacterial adhesion and removal
with boron doped DLC coatings and titanium-doped DLC coatings. There are no
studies that explore removal properties of bacteria and proteins from the doped DLC
coatings with these elements.
In the present study, B, F, N, Si and Ti-doped DLC coatings with a range of proportion
of the doping elements were produced by plasma-enhanced chemical vapour deposition
(PECVD) or by magnetron sputtering in order to investigate the effect of the doped
element contents on the adhesion and removal of bacteria and proteins. DLC coating
manufacture is well established, however there are no standard manufacturing processes
for producing doped DLC coatings and it is still at the experimental stage. The selection
of the doped elements were based on our previous experience on producing non-stick
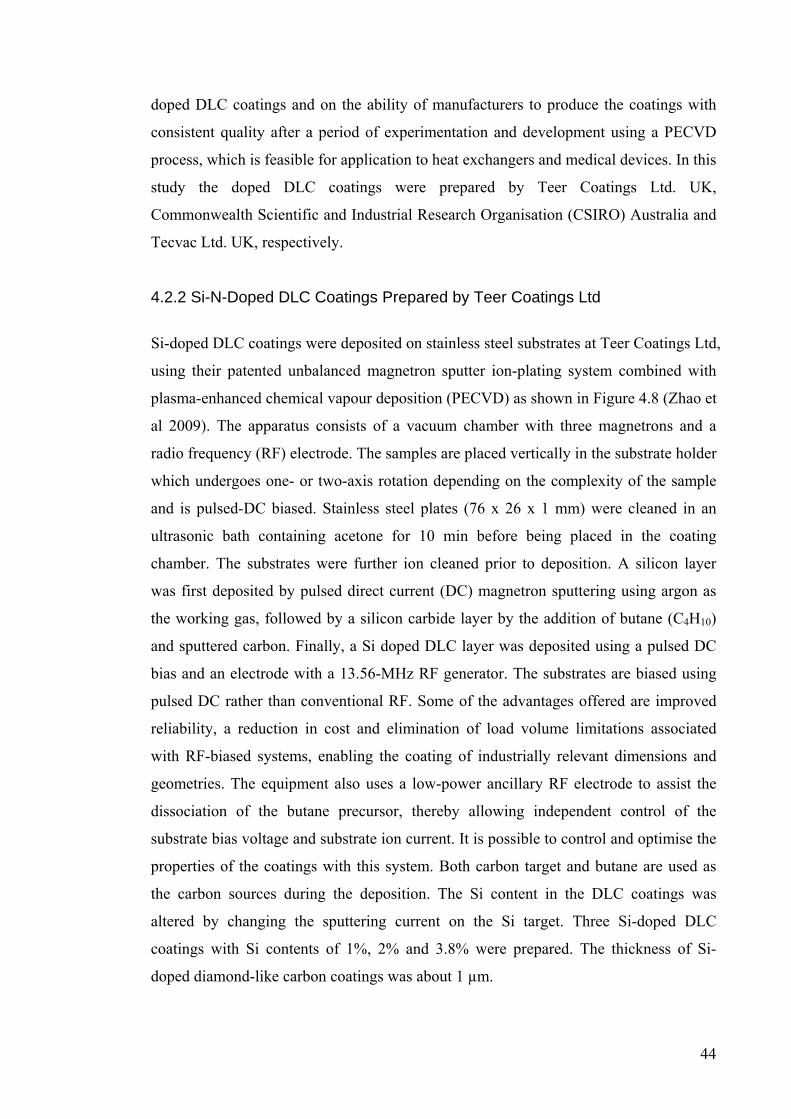
44
doped DLC coatings and on the ability of manufacturers to produce the coatings with
consistent quality after a period of experimentation and development using a PECVD
process, which is feasible for application to heat exchangers and medical devices. In this
study the doped DLC coatings were prepared by Teer Coatings Ltd. UK,
Commonwealth Scientific and Industrial Research Organisation (CSIRO) Australia and
Tecvac Ltd. UK, respectively.
4.2.2 Si-N-Doped DLC Coatings Prepared by Teer Coatings Ltd
Si-doped DLC coatings were deposited on stainless steel substrates at Teer Coatings Ltd,
using their patented unbalanced magnetron sputter ion-plating system combined with
plasma-enhanced chemical vapour deposition (PECVD) as shown in Figure 4.8 (Zhao et
al 2009). The apparatus consists of a vacuum chamber with three magnetrons and a
radio frequency (RF) electrode. The samples are placed vertically in the substrate holder
which undergoes one- or two-axis rotation depending on the complexity of the sample
and is pulsed-DC biased. Stainless steel plates (76 x 26 x 1 mm) were cleaned in an
ultrasonic bath containing acetone for 10 min before being placed in the coating
chamber. The substrates were further ion cleaned prior to deposition. A silicon layer
was first deposited by pulsed direct current (DC) magnetron sputtering using argon as
the working gas, followed by a silicon carbide layer by the addition of butane (C4H10)
and sputtered carbon. Finally, a Si doped DLC layer was deposited using a pulsed DC
bias and an electrode with a 13.56-MHz RF generator. The substrates are biased using
pulsed DC rather than conventional RF. Some of the advantages offered are improved
reliability, a reduction in cost and elimination of load volume limitations associated
with RF-biased systems, enabling the coating of industrially relevant dimensions and
geometries. The equipment also uses a low-power ancillary RF electrode to assist the
dissociation of the butane precursor, thereby allowing independent control of the
substrate bias voltage and substrate ion current. It is possible to control and optimise the
properties of the coatings with this system. Both carbon target and butane are used as
the carbon sources during the deposition. The Si content in the DLC coatings was
altered by changing the sputtering current on the Si target. Three Si-doped DLC
coatings with Si contents of 1%, 2% and 3.8% were prepared. The thickness of Si-
doped diamond-like carbon coatings was about 1 µm.

45
Fig 4.8 Schematic diagram of the apparatus used to deposit Si-doped DLC coatings
showing the two carbon targets (C), Si target (Si), RF electrode, the sample holder,
pulsed-DC bias and two flow control valves for argon (Ar) and butane (C4H10) gases.
In order to investigate the effect of DLC coatings doped with both silicon and nitrogen
on bacterial adhesion and removal, the Si-N-doped DLC coatings at first time were
deposited on stainless steel plates (76 x26 x 1 mm) by radio frequency (13.56 MHz)
PECVD at Teer Coatings Ltd. The deposition system consisted of a plasma reactor
equipped with rotary and turbo molecular pumps with controlled gas supply and
pumping. Acetylene (C2H2), tetramethylsilane (Si(CH3)4), argon (Ar) and nitrogen (N),
were used as process gases. The plates were cleaned in an ultrasonic bath containing
acetone for 10 min. before being placed in the coating chamber. The substrates were
further ion cleaned prior to deposition in argon plasma for 5 min. The Si-N-doped DLC
coatings were deposited using a mixture of C2H2 , Si(CH3)4 and N2 as precursors. Four
Si-N-doped DLC coatings with 0.5%Si-2.2%N; 3.7%Si-2.1%N; 9%Si-2.3%N and
20%Si-2%N were prepared. The coatings compositions are given by atomic percentages.
Table 4.3 lists the name and chemistry of the Si-N-doped DLC coatings produced by
Teer Coatings Ltd.
Ar
C4H10
Pulsed
DC Si
CC
Substrate holder
RF
electrode
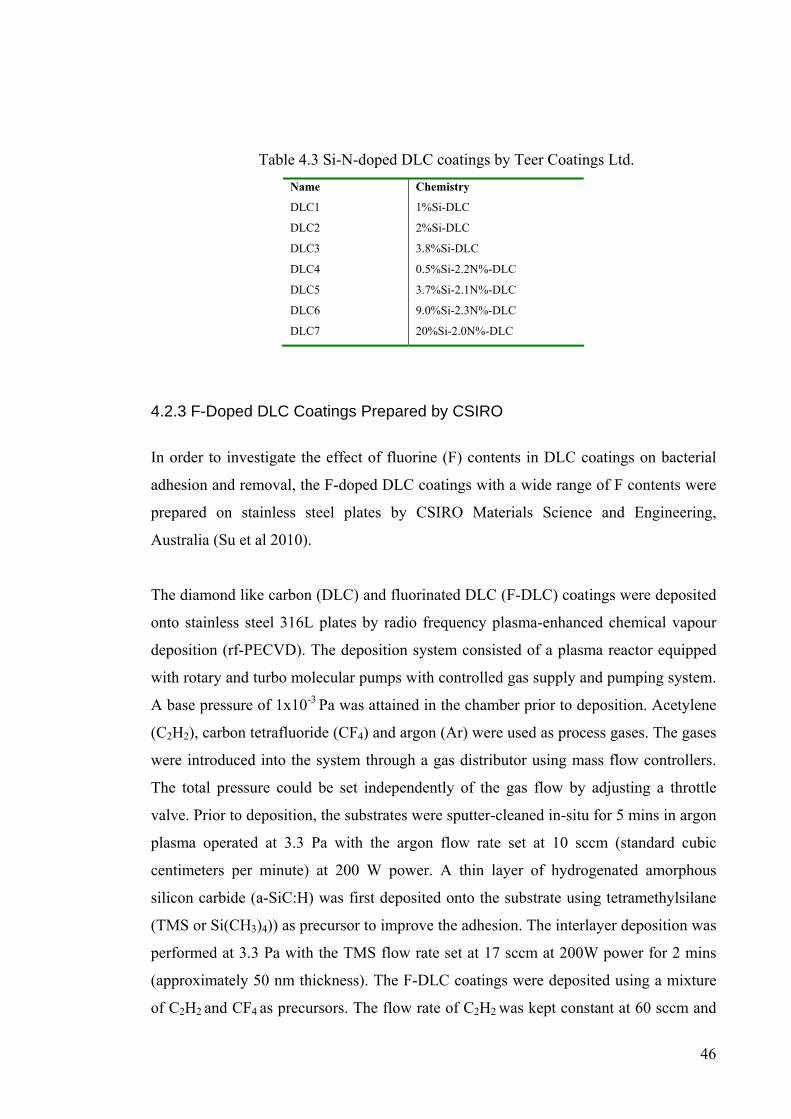
46
Table 4.3 Si-N-doped DLC coatings by Teer Coatings Ltd. Name Chemistry
DLC1 1%Si-DLC
DLC2 2%Si-DLC
DLC3 3.8%Si-DLC
DLC4 0.5%Si-2.2N%-DLC
DLC5 3.7%Si-2.1N%-DLC
DLC6 9.0%Si-2.3N%-DLC
DLC7 20%Si-2.0N%-DLC
4.2.3 F-Doped DLC Coatings Prepared by CSIRO
In order to investigate the effect of fluorine (F) contents in DLC coatings on bacterial
adhesion and removal, the F-doped DLC coatings with a wide range of F contents were
prepared on stainless steel plates by CSIRO Materials Science and Engineering,
Australia (Su et al 2010).
The diamond like carbon (DLC) and fluorinated DLC (F-DLC) coatings were deposited
onto stainless steel 316L plates by radio frequency plasma-enhanced chemical vapour
deposition (rf-PECVD). The deposition system consisted of a plasma reactor equipped
with rotary and turbo molecular pumps with controlled gas supply and pumping system.
A base pressure of 1x10⁻³ Pa was attained in the chamber prior to deposition. Acetylene
(C2H2), carbon tetrafluoride (CF4) and argon (Ar) were used as process gases. The gases
were introduced into the system through a gas distributor using mass flow controllers.
The total pressure could be set independently of the gas flow by adjusting a throttle
valve. Prior to deposition, the substrates were sputter-cleaned in-situ for 5 mins in argon
plasma operated at 3.3 Pa with the argon flow rate set at 10 sccm (standard cubic
centimeters per minute) at 200 W power. A thin layer of hydrogenated amorphous
silicon carbide (a-SiC:H) was first deposited onto the substrate using tetramethylsilane
(TMS or Si(CH3)4)) as precursor to improve the adhesion. The interlayer deposition was
performed at 3.3 Pa with the TMS flow rate set at 17 sccm at 200W power for 2 mins
(approximately 50 nm thickness). The F-DLC coatings were deposited using a mixture
of C2H2 and CF4 as precursors. The flow rate of C2H2 was kept constant at 60 sccm and

47
the flow rate of CF4 was varied between 0 and 90 sccm in order to obtain different
fluorine contents in the films. Three F-doped DLC coatings with F contents of 6.5% ,
20.7% and 39.2% were prepared. The films compositions were given by atomic
percentages. Table 4.4 lists the name and chemistry of the F-doped DLC coatings
produced by CSIRO.
Table 4.4 F -doped DLC coatings by CSIRO. Name Chemistry
DLC 8 DLC
DLC 9 6.5F%F-DLC
DLC 10 20.7%F-DLC
DLC 11 39.2%F-DLC
4.2.4 B and Ti-Doped DLC Coatings Prepared by Tecvac Ltd
The B (boron) doped DLC coatings were prepared by Tecvac Ltd, UK, using their
plasma-enhanced chemical vapour deposition (PECVD) system. The Ti (titanium)
doped DLC coatings were also prepared by a magnetron sputter system consisting of a
Ti target combined with plasma-enhanced chemical vapour deposition (PECVD).
These coatings were mainly used to investigate the protein removal from surgical steels,
supported by UK Department of Health, in addition to bacterial adhesion and removal.
There are serious concerns about the levels of residual protein contamination on surgical
and dental instruments after they have been through the standard cleaning processes,
and the risk of disease transmission (e.g. variant Creutzfeldt-Jakob disease or vCJD)
due to poor cleaning.
Table 4.5 lists the name and chemistry of the B and Ti-doped DLC coatings produced
by Tecvac Ltd.

48
Table 4.5 B and Ti-doped DLC coatings by Tecvac Ltd Name Chemistry
DLC 12 DLC
DLC 13 4.9% B-DLC
DLC 14 7.6%B-DLC
DLC 15 9.5%B-DLC
DLC 16 1.3%Ti-DLC
DLC 17 1.8%Ti-DLC
DLC 18 3.2%Ti-DLC
4.3 SiOx-Like Coatings 4.3.1 An Overview of SiOx-Like Coatings
Nanocomposite siloxane films containing high concentrations of SiOx have been
employed in various ways in the thin film industry due to their good abrasion and
corrosion resistance, electrical insulation and high thermal stability (Akesso et al, 2009).
Rosmaninho et al (2006) demonstrated that silicon dioxide (SiO2) coatings have
potential to reduce milk protein adhesion. However there are no studies that explore the
potential use of SiO2 or SiOx-like coatings in controlling the initial bacterial attachment
and removal. Plasma enhanced chemical vapour deposition, either at low or atmospheric
pressure is a versatile method for depositing such films on a wide range of substrates
and at low temperatures. Unlike SiO2 coatings, the surface chemistry and physical
properties of SiOx-like coatings such as surface energy and topology can be varied in a
wide range, depending on the method of deposition and process parameters: these
properties, especially surface energy are well known to influence the adhesion of
bacteria (Zhao et al, 2007). Teer Coatings Ltd. and University of Dundee first
investigated the potential for such coatings in the control of bacterial adhesion and
removal (Akesso et al, 2009; Navabpour et al, 2010).
SiOx-like coatings are deposited from a mixture of oxygen and hexamethyldisiloxane
(HMDSO or O[Si(CH3)3]2). At low HMDSO to oxygen ratios, the coatings are more

49
silicon-oxide (SiO2) like with higher surface energy and hardness but with lower
potential for anti-biofouling. At high HMDSO to oxygen ratios, however, the coatings
are more SiOx-like with high carbon content and low surface energy and good anti-
biofouling properties. Although better for their anti-biofouling properties, the latter
suffer from poor adhesion to the substrate and have inadequate mechanical properties to
render them useful for many industrial applications. Teer Coatings Ltd. has developed a
hybrid method that can be used for the deposition of coating which involves
simultaneous sputtering from a target and plasma polymerisation of HMDSO/oxygen
mixture (Navabpour et al, 2010). Using this hybrid method, a range of SiOx-like
coatings with improved mechanical properties while maintaining the anti-biofouling
properties are produced. In this work, the potential of such hybrid coatings using silicon
as the sputtered material has been investigated. These SiOx-like coatings with improved
performance have potential for use as coatings in the control of biofouling in
applications such as heat exchangers.
4.3.2 SiOx-Like Coatings Prepared by Teer Coatings Ltd.
HMDSO (≥ 98 %) was supplied by Sigma-Aldrich, acetone (99.5 %) by Hammond
Chemicals Ltd. Oxygen and argon (both 99.999%) were supplied by BOC Edwards.
First group of SiOx-like coatings (see Table 4.6, S1 –S7, S7-1 – S7-3) were deposited
using a Teer Coatings Ltd PECVD deposition system (Akesso et al, 2009). The steel
substrates were ion cleaned in the chamber in order to prepare them for the coating
deposition. The chamber was evacuated to 5.5 x 10⁻⁵ mbar prior to commencing coating
deposition. The reactive gas, at a pressure of 1.8 x 10⁻¹ mbar, comprised O2 and
HMDSO. Plasma was induced by application of 200 W of power to electrode A and
125 W to electrode B. The duration of plasma deposition was varied between 20 and 45
min. At the end of the coating process, the chamber was evacuated to a pressure of 5 x
10-5 mbar before being returned to atmospheric pressure with ambient air. Table 4.6
shows the reactive gas composition and times for the coatings prepared. Samples S1-S7
have the same ion cleaning times (5 min), but different monomer ratios and S7 to S7-1 –
S7-3 have the same monomer ratios, but different ion cleaning times (5, 10, 20 and 30
min, respectively).

50
Table 4.6 Parameters used for the deposition of SiOx-like coatings
Coatings Si current
(A)
O2
(sccm or
ml/min)
HMDSO
(sccm or
ml/min)
Deposition
time
(min)
Ion cleaning
time
(min)
S1 - 90 8 45 5
S2 - 65 8 30 5
S3 - 65 14 30 5
S4 - 65 23 30 5
S5 - 65 29 30 5
S6 - 65 41 20 5
S7 - 65 48 20 5
S7-1 - 65 48 20 10
S7-2 - 65 48 20 20
S7-3 - 65 48 20 30
TCL40bt - 50 36 20 30
TCL40C1 - 19 16 100 30
TCL40C2 3 19 16 40 30
TCL40C3 3 23 12 50 30
TCL40C4 3 27 8 100 30
Second group of SiOx-like coatings (see Table 4.6, TCL40bt, TCL40C1-C4) were
deposited using a Teer Coatings Ltd hybrid unbalanced magnetron sputter ion-plating
PECVD deposition system (Navabpour et al, 2010).
51
CHAPTER 5 CHARACTERISATION OF COATINGS
5.1 Morphology of Coatings 5.1.1 Atomic Force Microscopy
Atomic Force Microscopy (AFM) is a very high-resolution type of scanning probe
microscope, which provides measurements of surface roughness, grain size and grain
size distribution. A Dimension 3000 Atomic Force Microscope (Nanoscope III) in the
Electronic Engineering and Physics Division, University of Dundee was used to obtain
topographic and three-dimensional imaging of surfaces with a lateral resolution of 1~2
nm and a vertical resolution of 0.01 nm. The equipment was operated in contact mode
in air.
Fig. 5.1 shows the typical AFM images of Si-doped DLC films with Si contents of 1%,
2% and 3.8%, respectively (Zhao et al, 2007b). These Si-doped coatings were prepared
by Teer Coatings Ltd and were used for bacterial adhesion and removal in this study.
The surface roughness for the different samples was measured over 2µm × 2µm area by
the AFM. Fig 5.1 and Table 5.1 indicate that the surface roughness increases slightly
with increasing Si content in the DLC films (Zhao et al, 2007b).

52
(a)
(b)
(c)
Fig. 5.1 AFM image of Si-doped DLC (a) Si:1%; (b)Si:2%; (c) Si:3.8%

53
Table 5.1 Si content, the ratio of sp2/sp3 and roughness Ra
The AFM images indicated that for most doped DLC coatings and SOx-like coatings
used in this study, their surface roughness values (Ra) were in the range of 15(±3) ~
50(±7) nm, while the Ra for Ni-P-polymers coatings were about 170(±8) ~200 (±11) nm.
The AFM images indicated that the Ni-P coating had a very similar Ra with stainless
steel, about 50(±7) nm. The Ni-P-polymers coatings become rougher due to the
incorporation of PTFE and biocide polymer nano-particles with diameter 50~200 nm.
5.1.2 Scanning Electron Microscope
The scanning electron microscope (SEM) is a type of electron microscope capable of
producing high resolution images of a sample surface. As the primary electrons strike
the surface they are inelastically scattered by atoms in the sample. Through these
scattering events, the primary electron beam effectively spreads and fills a teardrop-
shaped volume, known as the interaction volume, extending from less than 100 nm to
around 5 µm into the surface. Interactions in this region lead to the subsequent emission
of electrons which are then detected to produce an image. SEM images have a
characteristic three dimensional appearances and are useful for judging the surface
structure of the sample (O’Connor DJ et al.1992).
In this study, the Philips XL 30 Scanning Electron Microscope (SEM) in the Life
Science College, University of Dundee was used for observing the surface morphology
and the particles distribution in the Ni-P-polymers coating. Samples were examined in
an atmosphere of up to 10-2 Pa of nitrogen carbon dioxide gas. Resolution at 30KV is
3.5 nm. The magnification is in the range from 20X to approximately 30,000X with
high resolution of 50 to 100 nm. Figure 5.2 shows a typical morphology of Ni-P-
Materials sp2 content Ra by AFM
(nm)
Si-doped DLC with 1% Si 67.1% 16.0
Si-doped DLC with 2% Si 34.2% 17.7
Si-doped DLC with 3.8% Si 25.0% 27.8

54
Polymers nanocomposite coating. Clearly, PTFE polymer nano-particles (black dots)
were uniformly distributed into the coatings. The particles sizes were in the range of 50
nm~200 nm.
Fig. 5.2 Typical SEM image of Ni-P-Polymers nanocomposite coating
5.2 Composition of Coatings
5.2.1 Energy-dispersive X-ray spectroscopy
SEM is also capable of performing analyses of selected point locations on the samples,
which are especially useful in quantitatively or semi-quantitatively determining
chemical compositions of the coatings using energy-dispersive X-ray spectroscopy
(EDX). In this study, the EDX in the Life Science College, University of Dundee was
used for the measurement of element content in the Ni-P-Polymers nanocomposite
coatings. In general, if the thickness of coatings is over 1 µm and the substrates are
conductive, the EDX method is acceptable.
The chemical compositions of typical Ni-P based coatings (Ni-P, Ni-P-PTFE and Ni-P-
PTFE-biocide polymer) are given in Table 5.2. The PTFE content was calculated based
on F element content in the coating.

55
Table 5.2 Chemical compositions and content (wt. %) of coatings by EDX
Coatings C O F P Fe Ni
PTPE
content
(wt. %)
Ni-P 3.6 1.9 - 10.7 0.5 83.4 -
Ni-P-PTFE 4.2 10.0 3.9 9.0 1.4 71.5 5.1
Ni-P-PTFE-SM14 6.8 10.2 5.5 9.9 1.0 66.6 7.2
Ni-P- PTFE-SM20 11.3 9.7 8.0 9.0 0.9 61.1 10.5
5.2.2 X-ray Photoelectron Spectroscopy
X-ray Photoelectron Spectroscopy (XPS) is used to determine quantitive atomic
composition and chemistry. It is a surface analysis technique with a sampling volume
that extends from the surface to a depth of approximately 50-70 angstroms.
Alternatively, XPS can be utilized for sputter depth profiling to characterize thin films
by quantifying matrix-level elements as a function of depth. XPS is an elemental
analysis technique that is unique in providing chemical state information of the detected
elements. The process works by irradiating a sample with monochromatic x-rays,
resulting in the emission of photoelectrons whose energies are characteristic of the
elements within the sampling volume. In this study the percentage of doped elements in
the DLC coatings was determined with XPS using a Speces 150 SAGE instrument
operated with MgKα X-ray source with anode voltage 10kV and emission current 10
mA (Su et al, 2010). The results are shown in Tables 4.3, 4.4 and 4.5 respectively. XPS
measurements were also performed on the SiOx-like coatings in Table 5.6 with a VG
Scientific Microlab 310F instrument using Mg Kα radiation at 1253.6 eV with anode
voltage × emission current = 12.5 kV × 16 mA = 200W power (Akesso et al, 2009;
Navabpour et al, 2010). The results are given in Table 5.3
5.3 Coating Thickness
In this study a Digital Micrometer (Brown and Sharpe TESA, Swiss) was used for
coating thickness measurement of Ni-P-polymers coatings with accuracy ± 1 µm. The

56
coating thickness of these coatings was in the range of 10 – 15 μm, depending on
deposition time and bath composition.
The coating thickness of doped DLC coatings and SiOx-like coatings was measured
using a Cambridge Stereoscan 200 SEM. Coated samples were fractured and coated
with a thin layer of gold in order to obtain conductive samples. The cross-section of the
resulting samples was analysed using SEM. Thickness was measured in five different
places and mean and standard deviation were obtained. For the doped DLC coatings, the
average coating thickness was about 1 μm. The coating thickness of the SiOx-like
coatings is given in Table 5.3 (Akesso et al, 2009; Navabpour et al, 2010).
Table 5.3 Atomic composition and thickness of SiOx-like coatings
Coatings C
(Atom %)
O
(Atom %)
Si
(Atom %)
Film Thickness
(nm)
S1 1 ±0 64 ±6 35 ±4 400 ±20
S2 0 ±0 60 ±5 40 ±4 400 ±20
S3 4 ±1 57 ±5 39 ±4 920 ±80
S4 9 ±1 52 ±5 39 ±4 1000 ±60
S5 10 ±1 50 ±4 40 ±4 1120 ±80
S6 14 ±2 51 ±4 35 ±3 840 ±40
S7 16 ±2 41 ±4 43 ±4 1000 ±50
S7-1 17 ±2 44 ±4 39 ±4 1240 ±40
S7-2 16 ±2 46 ±5 38 ±4 970 ±30
S7-3 25 ±3 39 ±4 36 ±4 1030 ±30
TCL40bt 27 ±2 37 ±4 36 ±3 730 ±100
TCL40C1 32 ±3 32 ±3 36 ±4 1030 ±100
TCL40C2 31 ±3 37 ±3 32 ±3 1070 ±80
TCL40C3 22 ±1 43 ±4 35 ±3 1060 ±80
TCL40C4 2.0 ±0.5 58 ±5 40 ±3 890 ±40

57
5.4 Contact Angle and Surface Energy 5.4.1 Contact Angle Measurement
Surface energy is probably the most important physico-chemical property of a solid
surface. The environment of particles (ion, atom, or molecule) on the surface of a solid
differs from that in its interior. In the interior, a particle is evenly acted on by forces
exerted by the particles around it. On the surface, there is a tendency for the particle on
the surface to be pulled into the main body where an unsaturated force field exists, in
order to reduce the surface area to a minimum, so that surface free energy is produced,
as shown in Fig.5.3 (Liu, YL 2005). The stronger the interaction between particles, the
higher the surface energy. For metals, the bonding is strong, so usually metal surface
possesses high surface energy (Liu, YL 2005).
Fig. 5.3 Force between atoms or molecules inside and at the phase boundary
The surface energy ( sγ ) of a solid is defined as the change of the total surface energy
(G) per surface area (A) at constant temperature (T), pressure (P) and moles (n)
(Chaudhury MK, 1996; Good RJ, 1992):
nPTS dAdG ,,)/(=γ (5.1)
One way to quantify surface energy of a solid is to measure the contact angle of a drop
of liquid placed on the surface of an object. The contact angle, θ, is the angle formed by
a liquid drop at the three phase boundary where a liquid, air and solid intersect, as
shown in Figure 5.4. The contact angle is a quantitative measure of the wetting of a

58
solid by a liquid. If a liquid drop rests on a solid surface, the drop is in equilibrium by
balancing three forces, namely, the interfacial tensions between solid and liquid, SLγ ;
between liquid and vapor, LVγ (or Lγ ); and between solid and vapor, SVγ (or Sγ ).
Figure 5.4 Contact angle on solid surface
Low values of θ indicate a strong liquid-solid interaction such that the liquid tends to
spread on the solid, while high θ values indicate weak interaction. If the angle θ is less
than 90°, then the liquid is said to wet the solid; a zero contact angle represents
complete wetting; if the θ is greater than 90°, then it is said to be non-wetting.
In this study the contact angles on the coatings were obtained using a sessile drop
method with a Dataphysics OCA-20 contact angle analyser (Figure 5.5) at the
Biological and Nanomaterials Lab, University of Dundee. This instrument consists of a
CCD video camera with a resolution of 768×576 pixel and up to 50 images per second,
multiple dosing/micro-syringe units and a temperature controlled environmental
chamber. The drop image was processed by an image analysis system, which calculated
both the left- and right contact angles from the shape of the drop with an accuracy of ±
0.1°. Three test liquids were used as a probe for surface free energy calculations:
distilled water, diiodomethane (Sigma) and ethylene glycol (Sigma). The data for
surface tension components of the test liquids are given in Table 5.4 (van Oss et al 1988;
Good RJ 1992). All measurements were made at 25 °C. The samples were ultrasonically
cleaned in acetone, ethanol and deionized water in sequence for 5 minutes before
contact angle measurement.
The contact angle of bacterial cells was measured on the lawns of bacteria deposited on
membrane filters with a pore diameter of 0.45µm. Prior to contact angle measurement,
Vapour
Liquid
θ
γLV
γSV
Solid
γSL

59
the bacterial lawns were dried in the air to a certain state, indicated by stable water
contact angles. Usually this state of drying of a microbial lawn lasts 30-60 minutes and
indicated that only bound water is present on the surface (Liu and Zhao, 2005).
Figure 5.5 Dataphysics OCA-20 Contact Angle Analyzer
Table 5.4 Test liquids and their surface tension components Surface tension data (mJ/m²)
Lγ LWLγ AB
Lγ +Lγ −
Lγ
Water (W), H2O 72.8 21.8 51.0 25.5 25.5
Diiodomethane (D), CH2I2 50.8 50.8 0 0 0
Ethylene glycol (E), C2H6O2 48.0 29.0 19.0 1.92 47.0
5.4.2 Calculation of Surface Energy The theory of the contact angle of pure liquids on a solid was developed over 200 years
ago in terms of the Young equation (Young T, 1805):
SLVSLV γγθγ −=cos (5.2)
If the spreading pressure is neglected, the Young equation is modified as (Girifalco LA
et al., 1957):

60
SLSL γγθγ −=cos (5.3)
Where Lγ is the experimentally determined surface tension of the liquid, θ is the
contact angle, Sγ is the surface energy of the solid and SLγ is the solid/liquid interfacial
energy. Lγ (Table 5.4) and θ are usually known. In order to obtain the solid surface
energy Sγ an estimate of SLγ has to be obtained.
In 1962 Fowkes pioneered a surface energy component approach (Fowkes FM, 1962;
Fowkes FM, 1964). He divided the total surface energy in 2 parts: dispersive part and
non-dispersive (or polar) part. The first part results from the molecular interaction due
to London forces and the second part is due to all the non-London forces:
p
idii γγγ += (5.4)
He proposed the following relation for solid-liquid interaction by only dispersion force
interaction:
dL
dSLSSL γγγγγ ⋅−+= 2 (5.5)
Combining with Young equation (5.3), it follows that
dL
dSL γγθγ 2)cos1( =+ (5.6)
Since only dispersive interactions are taken into account, the application of the method
is quite restricted. Later the improved approaches (e.g. Owens-Wendt, Wu, van Oss
approach and equation of state) for the estimation of SLγ are widely used (Zhao et al
2004c).
5.4.2.1 Owens and Wendt Geometric Mean Approach
In 1969, Owens and Wendt proposed the division of the total surface energy of a
solid or liquid in two components-dispersion force component and hydrogen bonding

61
component ( pL
dLL γγγ += and p
SdSS γγγ += ). The interaction energy of the non-
dispersive forces at the interface was quantified and included as geometric mean of the
non-dispersive components of solid and liquid. They extended the Fowkes equation and
used geometric mean to combine the dispersion force and hydrogen bonding
components:
pL
pS
dL
dSLSSL γγγγγγγ ⋅−⋅−+= 22 (5.7)
Combining the Young equation (5.3), the following expression is obtained:
pL
pS
dL
dSL γγγγθγ 22)cos1( +=+ (5.8)
To obtain dSγ and p
Sγ of a solid, the contact angle of at least two liquids with known
surface tension components ( Lγ , dLγ , p
Lγ ) on the solid must be determined.
5.4.2.2 Wu Harmonic Mean Approach
Wu (1971) proposed the harmonic mean approach to combine the polar and dispersion
components of the solid and liquid surface energies in 1971:
pL
pS
pL
pS
dL
dS
dL
dS
LSSL γγγγ
γγγγ
γγγ+
−+
−+=44
(5.9)
Combining the equation (5.9) with the Eq. (5.3), the following equation is obtained:
pL
pS
pL
pS
dL
dS
dL
dS
L γγγγ
γγγγθγ
++
+=+
44)cos1( (5.10)
Similar to the Geometric mean approach, the contact angle data with two liquids with
known surface tension components ( Lγ , dLγ , p
Lγ ) are required in order to obtain the dSγ
and pSγ components of the solid. At least one of the test liquids must have a polar part.

62
5.4.2.3 van Oss Acid-Base Approach
van Oss et al. proposed the division of the total surface energy of a solid into two
components, Lifshitz-van der Waals apolar component LWiγ (corresponding to d
iγ ) and
Lewis acid/base polar component ABiγ (corresponding to p
iγ ) in 1986 (van Oss CJ et al.,
1986):
ABi
LWii γγγ += (5.11)
The acid-base polar component ABiγ can be further subdivided by using specific terms
for an electron donor ( −iγ ) and an electron acceptor ( +
iγ ) subcomponent:
−+= iiABi γγγ 2 (5.12)
The solid/liquid interfacial energy is then given by:
)(2 +−−+ ⋅+⋅+⋅−+= LSLSLWL
LWSLSSL γγγγγγγγγ (5.13)
Combining this with Eq. (5.3), a relation between the measured contact angle and the
solid and liquid surface energy terms can be obtained:
)(2)cos1( +−−+ ⋅+⋅+⋅=+⋅ LSLSLWL
LWSL γγγγγγθγ (5.14)
In order to determine the surface free energy components ( LWSγ ) and parameters +
Sγ and
−Sγ of a solid, the contact angle of at least three liquids with known surface tension
components ( LWLγ , +
Lγ , −Lγ ), two of which must be polar, has to be determined.
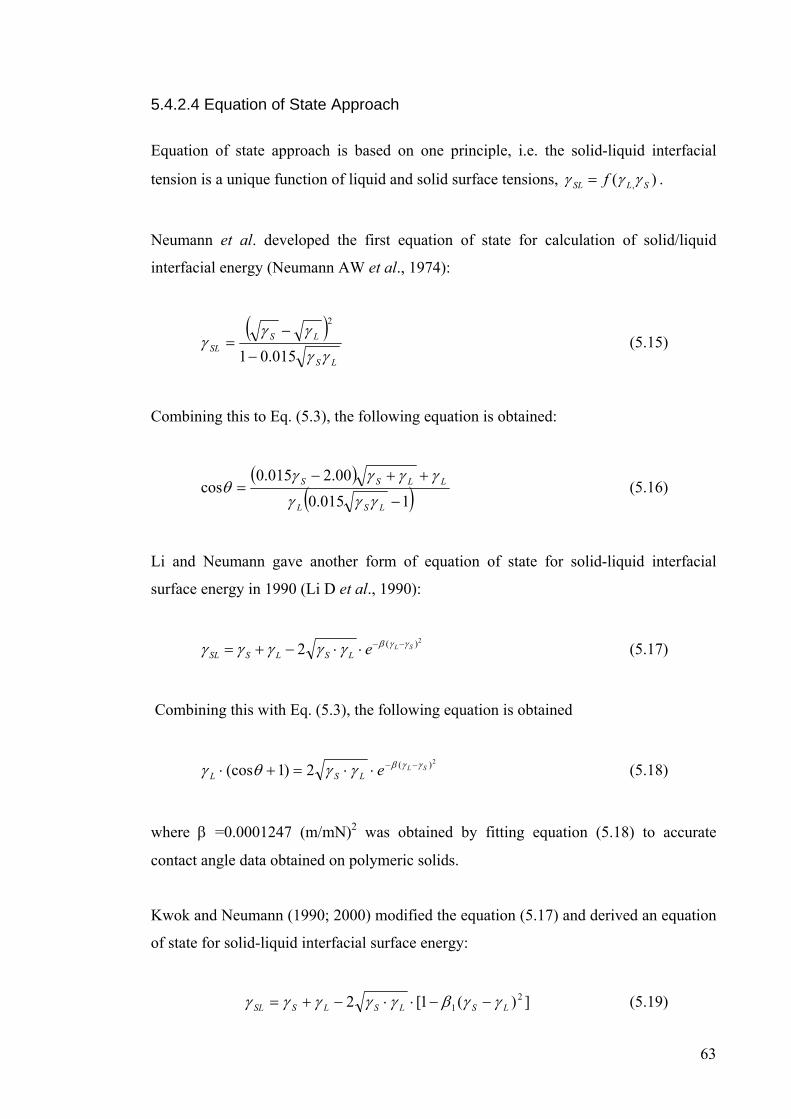
63
5.4.2.4 Equation of State Approach
Equation of state approach is based on one principle, i.e. the solid-liquid interfacial
tension is a unique function of liquid and solid surface tensions, )( , SLSL f γγγ = .
Neumann et al. developed the first equation of state for calculation of solid/liquid
interfacial energy (Neumann AW et al., 1974):
( )
LS
LSSL γγ
γγγ
015.01
2
−
−= (5.15)
Combining this to Eq. (5.3), the following equation is obtained:
( )
( )1015.000.2015.0
cos−
++−=
LSL
LLSS
γγγ
γγγγθ (5.16)
Li and Neumann gave another form of equation of state for solid-liquid interfacial
surface energy in 1990 (Li D et al., 1990):
2)(2 SLeLSLSSL
γγβγγγγγ −−⋅⋅−+= (5.17)
Combining this with Eq. (5.3), the following equation is obtained
2)(2)1(cos SLeLSL
γγβγγθγ −−⋅⋅=+⋅ (5.18)
where β =0.0001247 (m/mN)2 was obtained by fitting equation (5.18) to accurate
contact angle data obtained on polymeric solids.
Kwok and Neumann (1990; 2000) modified the equation (5.17) and derived an equation
of state for solid-liquid interfacial surface energy:
])(1[2 21 LSLSLSSL γγβγγγγγ −−⋅⋅−+= (5.19)

64
In conjunction with the Young equation (5.3), the current form of the equation of state
is as follows:
])(1[2)cos1( 21 LSLSL γγβγγθγ −−⋅⋅=+⋅ (5.20)
where β1 =0.0001057 (m/mN)2. Equation (5.20) enables the evaluation of the surface
energy of a solid Sγ from a single measurement of contact angle of a liquid with a
known surface tension Lγ , but neither the dispersion nor the polar component can be
evaluated.
5.5 Surface Energy of Coatings
The total surface energy values of the coatings obtained from the different methods are
not similar and are statistically significant different (p-value <0.05) (Zhao et al, 2005).
Currently van Oss acid-base approach is recommended to determine the surface energy
and its components as it contains three independent surface energy components which
are used in the extended DLVO theory (Sharma et al, 2002). In this study, the contact
angles of the coatings were measured with a Dataphysics OCA-20 contact angle
analyser and calculated the surface energy components of the coatings using van Oss
acid-base approach.
Tables 5.5-5.9 show the data of contact angle and surface energy components of the
coatings. Table 5.5 indicates that for the Ni-P-polymers coatings, the water contact
angle was generally larger than that of stainless steel. The TOTγ values for Ni-P-biocide
polymers were in the range of 28~30 mJ/m2 and the TOTγ values for Ni-P-PTFE or Ni-
P-PTFE-biocide polymers were in the range of 23~25 mJ/m2.
Table 5.6 indicates that for Si-doped DLC coatings, the water contact angle decreased
with increasing Si content. The γ − values of the Si-doped DLC coatings increased
significantly with increasing Si content while the TOTγ values were almost similar. For
Si-N-doped DLC coatings, the water contact angle increased with increasing Si content,
while the TOTγ values decreased from 52mJ/m2 to 41 mJ/m2.

65
Table 5.7 shows that the TOTγ values of F-doped DLC coatings decreased with
increasing F content.
Table 5.5 Contact angle and surface energy components of Ni-P-polymers coatings Coatings Contact Angle θ
[°] Surface Energy Components
[mJ/m2] θW θDi θEG LWγ +γ −γ ABγ TOTγ
Stainless steel 77.9±1.1 35.4±0.3 47.5±0.8 41.84 0.08 6.00 1.39 43.23 Ni-P 81.3±0.7 51.3±0.5 58.1±0.6 33.55 0.07 7.21 1.42 34.97 Ni-P-SM14 78.3±0.7 65.4±0.5 63.8±0.3 25.47 0.12 13.41 2.54 28.01 Ni-P-SM20 84.5±0.5 59.7±0.3 65.5±0.6 28.75 0.03 7.61 0.96 29.71 Ni-P-PTFE 91.8±1.6 69.6±2.0 88.1±0.7 23.00 0.00 11.36 0.00 23.00 Ni-P-PTFE-SM14 88.8±0.9 69.5±0.7 74.2±1.0 23.15 0.11 7.85 1.86 25.01 Ni-P-PTFE-SM20 90.1±1.1 69.2±0.9 73.3±0.7 23.32 0.04 6.39 1.01 24.33
Table 5.6 Contact angle and surface energy components of Si-N-doped DLC coatings Coatings Contact Angle θ
[°] Surface Energy Components
[mJ/m2] Name Chemistry θW θDi θEG LWγ +γ −γ ABγ TOTγ
DLC1 1%Si-DLC 72.2±1.2 19.4±0.8 45.3±0.3 46.78 5.21 1.52 5.63 52.41
DLC2 2%Si-DLC 69.4±0.4 16.9±0.4 34.8±0.6 47.43 0.96 8.05 5.56 52.99
DLC3 3.8%Si-DLC 61.4±0.7 16.3±0.4 30.6±0.7 47.58 0.57 16.11 6.06 53.64
DLC4 0.5%Si-2.2N%-
DLC
69.1±0.7 25.7±0.7 45.8±0.3 44.77 2.10 6.68 7.50 52.27
DLC5 3.7%Si-2.1N%-
DLC
69.2±0.3 27.3±0.2 45.2±0.9 44.18 1.90 7.21 7.41 51.59
DLC6 9.0%Si-2.3N%-
DLC
73.6±0.2 31.6±0.1 46.0±0.4 42.47 1.02 6.90 5.31 47.78
DLC7 20%Si-2.0N%-
DLC
80.2±0.8 39.0±0.5 50.5±0.8 39.12 0.12 7.20 1.86 41.00
Table 5.7 Contact angle and surface energy components of F doped DLC coatings Coatings Contact Angle θ
[°] Surface Energy Components
[mJ/m2] Name Chemistry θW θDi θEG LWγ +γ −γ ABγ TOTγ
DLC 8 DLC 70.0±0.6 21.4±0.5 47.0±0.5 46.35 0.00 11.08 0.00 46.35
DLC 9 6.5F%F-DLC 69.9±0.1 26.5±0.3 44.8±0.7 45.52 0.00 11.86 0.00 45.52
DLC 10 20.7%F-DLC 73.6±0.4 36.7±0.3 47.6±0.9 41.23 0.04 9.73 1.25 42.48
DLC 11 39.2%F-DLC 81.3±0.3 59.6±0.3 57.3±0.4 28.81 0.40 7.33 3.42 32.23

66
Table 5.8 shows that the TOTγ values for these doped DLC coatings were changed in the
range of 29~46 mJ/m2, depending on the doped elements and their contents in the DLC
coatings. For B-doped DLC coatings, with increasing B content the water contact angle
increased, while the TOTγ values decreased. For Ti-doped DLC coatings, with increasing
Ti content the water contact angle decreased, while theγ − values increased.
Table 5.8 Contact angle and surface energy components of B and Ti-doped DLC coatings
Coatings Contact Angle θ [°]
Surface Energy Components [mJ/m2]
Name Chemistry θW θDi θEG LWγ +γ −γ ABγ TOTγ
DLC 12 DLC 77.2±3.0 31.6±1.5 39.5±1.5 43.56 0.35 4.47 2.50 46.06
DLC 13 4.9% B-DLC 74.1±3.2 40.5±1.9 41.6±1.3 39.36 0.40 7.55 3.48 42.84
DLC 14 7.6%B-DLC 92.3±3.5 47.2±2.0 72.1±0.9 33.94 0.00 2.03 0.00 33.94
DLC 15 9.5%B-DLC 90.3±3.8 58.8±1.5 71.3±2.5 28.99 0.00 4.73 0.00 28.99
DLC 16 1.3%Ti-DLC 78.9±1.9 27.1±1.0 54.6±0.2 44.11 0.00 5.72 0.00 44.11
DLC 17 1.8%Ti-DLC 75.2±0.3 29.6±2.9 47.4±0.3 44.39 0.00 7.97 0.00 44.39
DLC 18 3.2%Ti-DLC 72.8±0.3 27.4±0.2 50.0±0.9 44.40 0.00 9.83 0.00 44.40
So far there are no standard manufacturing processes for producing doped DLC coatings
and it is still at the experimental stage. The selection of the doped elements was based
on previous experience on producing non-stick doped DLC coatings and on the ability
of manufacturers to produce the coatings. For example, initially we asked a
manufacture to prepare Ti-doped DLC coatings with Ti content of 3%, 6% and 12%,
but the manufacture produced the Ti-doped DLC coatings with Ti content of 1.3%,
1.8% and 3.2%, respectively after XPS analysis. Similar problems existed for other
doped DLC coatings. As the coatings were costly, we did not ask the manufacturers to
do the coatings again.
Table 5.9 shows that the TOTγ and γ − values for these SiOx-like coatings were changed
in the wide range: 23.1~45.7 mJ/m2 and 1.5~39.5 mJ/m2, respectively.
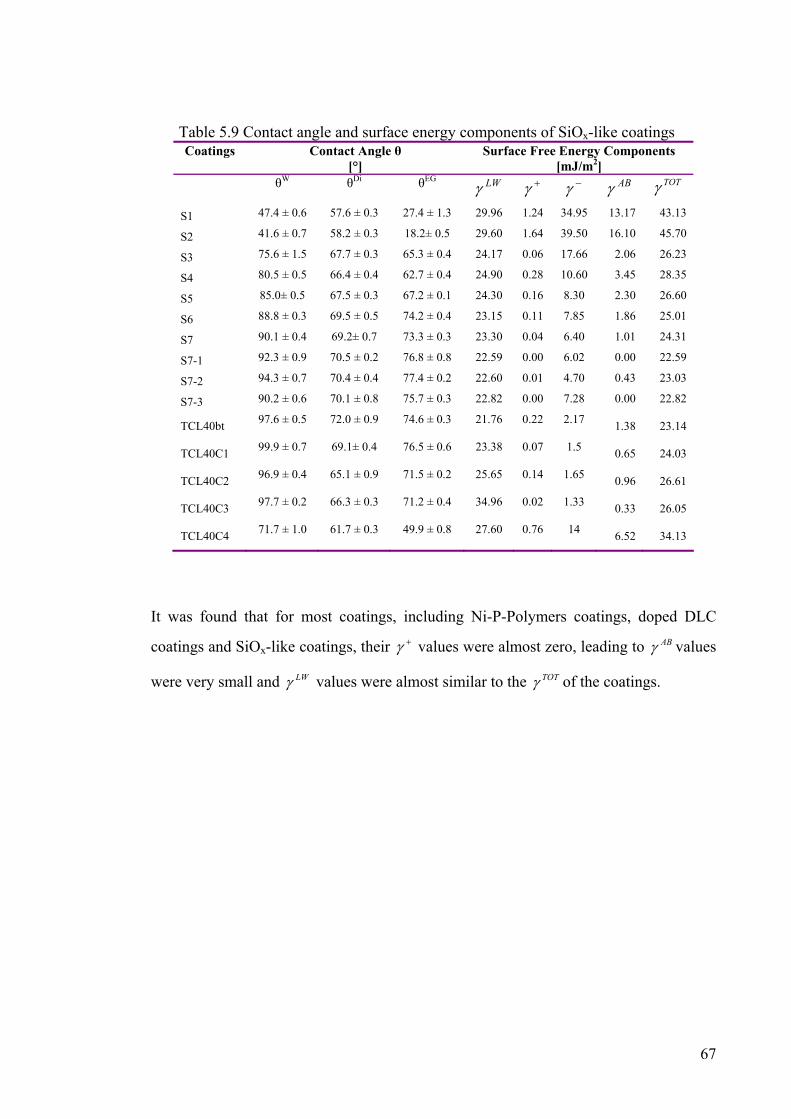
67
Table 5.9 Contact angle and surface energy components of SiOx-like coatings Coatings Contact Angle θ
[°] Surface Free Energy Components
[mJ/m2] θW θDi θEG LWγ +γ −γ ABγ TOTγ
S1 47.4 ± 0.6 57.6 ± 0.3 27.4 ± 1.3 29.96 1.24 34.95 13.17 43.13
S2 41.6 ± 0.7 58.2 ± 0.3 18.2± 0.5 29.60 1.64 39.50 16.10 45.70
S3 75.6 ± 1.5 67.7 ± 0.3 65.3 ± 0.4 24.17 0.06 17.66 2.06 26.23
S4 80.5 ± 0.5 66.4 ± 0.4 62.7 ± 0.4 24.90 0.28 10.60 3.45 28.35
S5 85.0± 0.5 67.5 ± 0.3 67.2 ± 0.1 24.30 0.16 8.30 2.30 26.60
S6 88.8 ± 0.3 69.5 ± 0.5 74.2 ± 0.4 23.15 0.11 7.85 1.86 25.01
S7 90.1 ± 0.4 69.2± 0.7 73.3 ± 0.3 23.30 0.04 6.40 1.01 24.31
S7-1 92.3 ± 0.9 70.5 ± 0.2 76.8 ± 0.8 22.59 0.00 6.02 0.00 22.59
S7-2 94.3 ± 0.7 70.4 ± 0.4 77.4 ± 0.2 22.60 0.01 4.70 0.43 23.03
S7-3 90.2 ± 0.6 70.1 ± 0.8 75.7 ± 0.3 22.82 0.00 7.28 0.00 22.82
TCL40bt 97.6 ± 0.5 72.0 ± 0.9 74.6 ± 0.3 21.76 0.22 2.17 1.38 23.14
TCL40C1 99.9 ± 0.7 69.1± 0.4 76.5 ± 0.6 23.38 0.07 1.5 0.65 24.03
TCL40C2 96.9 ± 0.4 65.1 ± 0.9 71.5 ± 0.2 25.65 0.14 1.65 0.96 26.61
TCL40C3 97.7 ± 0.2 66.3 ± 0.3 71.2 ± 0.4 34.96 0.02 1.33 0.33 26.05
TCL40C4 71.7 ± 1.0 61.7 ± 0.3 49.9 ± 0.8 27.60 0.76 14 6.52 34.13
It was found that for most coatings, including Ni-P-Polymers coatings, doped DLC
coatings and SiOx-like coatings, their +γ values were almost zero, leading to ABγ values
were very small and LWγ values were almost similar to the TOTγ of the coatings.

68
CHAPTER 6 ADHESION ASSAYS OF BACTERIA AND PROTEINS 6.1 Bacterial Culture 6.1.1 Types of Bacteria
In this study, the assays of bacterial adhesion and removal were performed at the
Biological and Nanomaterials Lab, University of Dundee. The bacteria including
Pseudomonas fluorescens (CHAO), Escherichia coli WT (F1693), Pseudomonas
aeruginosa (ATCC 33347), Staphylococcus aureus (F1557) and Staphylococcus
epidermidis (F1661) from Institute of Infection and Immunity, Nottingham University,
UK were used for the investigation of bacterial adhesion and removal. Pseudomonas
fluorescens is a common gram-negative, rod-shaped bacterium, which is usually found
in water and frequently causes biofouling in piping system, heat exchangers and
membrane filters (Bott, 2001). It can also cause bloodstream infections. The size of P.
fluorescens is around 0.6 µm and its growth temperature is 25~30 ºC. In laboratory, the
growth medium for P. fluorescens is Tryptone Soya Broth (TSB), which contains casein
peptone 10 g/l, soya peptone 3.0 g/l, NaCl 5.0 g/l, K2PO4H 2.5 g/l and glucose 2.5 g/l.
E. coli, P. aeruginosa, S. aureus and S. epidermidis are microorganism representative
that frequently cause medical devices and implants-related infections. The strains

69
belonged to an original collection of clinical isolates and then stored in laboratory. The
details of the bacterial culture method were described by Zhao et al. (2008). In brief, the
strains were subcultured and preserved in 15% glycerol in TSB (Tryptone Soya Broth,
Oxoid®, UK) as frozen stock at −80 °C. For all adhesion tests, TSA (Tryptone Soya
Agar) plates were streaked out with a loop from the frozen stock and grown overnight at
37 °C. A single colony was inoculated in 10 ml TSB and grown statically overnight at
37 °C. Five hundred microlitres from this culture were further inoculated into 100 ml
TSB in a conical flask and grown in a shaker-incubator at 37 °C and 250 rpm. The
culture was grown to mid-exponential phase. The strains were harvested by centrifuging
at 4500 rpm for 5 min at −4 °C, washed once in sterile distilled water and resuspended
PBS (Phosphate Buffered Saline) in the medium (pre-warmed to 37 °C) at a
107 CFU/ml concentration. The components of TSB, TSA and PBS are given in Table
6.1.
Table 6.1 Components of TSB, TSA and PBS Components Quantity (g/l) Pancreatic digest of casein 17 TSB Papaic digest of soybean meal 3 Sodium chloride 5 Di-basic potassium phosphate 2.5 Glucose 2.5 Tryptone 15 TSA Soya peptone 5 Sodium chloride 5 Agar 15 Sodium chloride 8 PBS Potassium chloride 0.2
Di-sodium hydrogen phosphate 1.15
6.1.2 Growth Curve of Bacteria
Bacterial growth means an increase in cellular constituents that may result in an
increase in cell size, an increase in cell number, or both. The growth curve is usually
analyzed in a closed system called a batch culture; usually plotted as the logarithm of
cell number versus the incubation time.

70
Bacteria that exhibit characteristic growth can be divided into the four distinct growth
phases as shown in Figure 6.1.
1) Lag Phase: Cells in a new inoculum adjust to the medium. Increases occur in
enzyme production and cell size. There is no cell division and therefore no increase
in numbers. Metabolically active but no increase in number. The lag phase may last
for 1 hour to several days, depending on the type of bacteria and other conditions.
2) Exponential or logarithmic (log) phase: Cells and cell mass double at a constant rate.
Thus there is a rapid exponential increase in population, which doubles regularly
until a maximum number of cells are reached. Most bacteria reproduce by binary
fission. One cell roughly doubles in volume, contents, and divides into 2 cells. As
bacteria in log phase is more active, the bacteria in log phase are usually used for
bacterial adhesion and removal assays.
3) Stationary Phase: The number of cells undergoing division is equal to the number of
cells that are dying. Therefore there is no further increase in cell number and the
population is maintained at its maximum level for a period of time.
4) Death or Decline phase: Death rate is greater than growth rate. Cell lysis may occur.
During the death phase, the number of viable cells decreases exponentially.
Fig. 6.1 Bacterial growth curve

71
6.1.3 Growth Curve Measurement After the frozen bacteria stock had been defrosted, they were cultured in TSA plates in
an incubator (Gallenkamp plus II Incubator) overnight at 28 °C for P. fluorescens and at
37 °C for P. aeruginosa, S. aureus, S. epidermidis and E. coli. A species bacterial colony
from agar was taken with a loop and was put into a conical flask containing 10 ml
medium to grow statically in a shaker-incubator (Stuart Oribital Incubator SI50) at 150
rpm overnight at 28 °C for P. fluorescens and at 37°C for other bacteria. Then the 500 µl
of a bacterial suspension was transferred into 100 ml medium in a conical flask and
cultured in the shaker-incubator at 150 rpm. The optical density (OD) value of bacterial
suspension was recorded by a cell density meter (Biowave CO8000 Cell Density Meter)
at set intervals, at which the number of cells were counted using viable plate count
method.
Figure 6.2(a) ~ 6.6(a) show the growth curves (Log Phases) of five bacteria (P.
fluorescens, E. coli, P. aeruginosa, S. aureus and S. epidermidis) respectively. Clearly,
the log number of cells increased along the growth time. The correlations between
OD600 of culture solution and log CFU/ml during the exponential phases for the five
bacteria are shown in Figure 6.2(b) ~ 6.6(b), respectively. The required concentration of
each bacterial suspension was calculated using the OD value and corresponding
equations in Figure 6.2(b) ~ 6.6(b).
P. fluorescens
66.5
77.5
8
8.59
9.510
0 2 4 6 8 10 12Time [h]
Log
[CFU
/ml]
y = 1.2488x + 6.6793R2 = 0.9825
6
7
8
9
10
0 0.5 1 1.5 2
OD 600
Log
[CFU
/ml]
(a) (b)
Figure 6.2 (a) P. fluorescens growth curve; (b) Log (CFU/ml) vs OD600

72
E. Coli
0
2
4
6
8
10
12
14
0 1 2 3 4 5 6
Time [h]
Log
[CFU
/ml]
y = 2.7378x + 6.2139R2 = 0.9632
0
2
4
6
8
10
12
14
0 0.5 1 1.5 2 2.5OD600
Log
[CFU
/ml]
(a) (b)
Figure 6.3 (a) E. coli growth curve; (b) Log (CFU/ml) vs OD600
P. aeruginosa
5
5.5
6
6.5
7
7.5
8
8.5
9
9.5
10
0 2 4 6 8 10 12
Time [h]
Log
[CFU
/ml]
OD600 Vs Log CFU/ml for P.aeruginosa
y = 1.8357x + 7.3412R2 = 0.974
7
7.5
8
8.5
9
9.5
0 0.2 0.4 0.6 0.8 1
OD 600
(a) (b)
Figure 6.4 (a) P. aeruginosa growth curve; (b) Log (CFU/ml) vs OD600
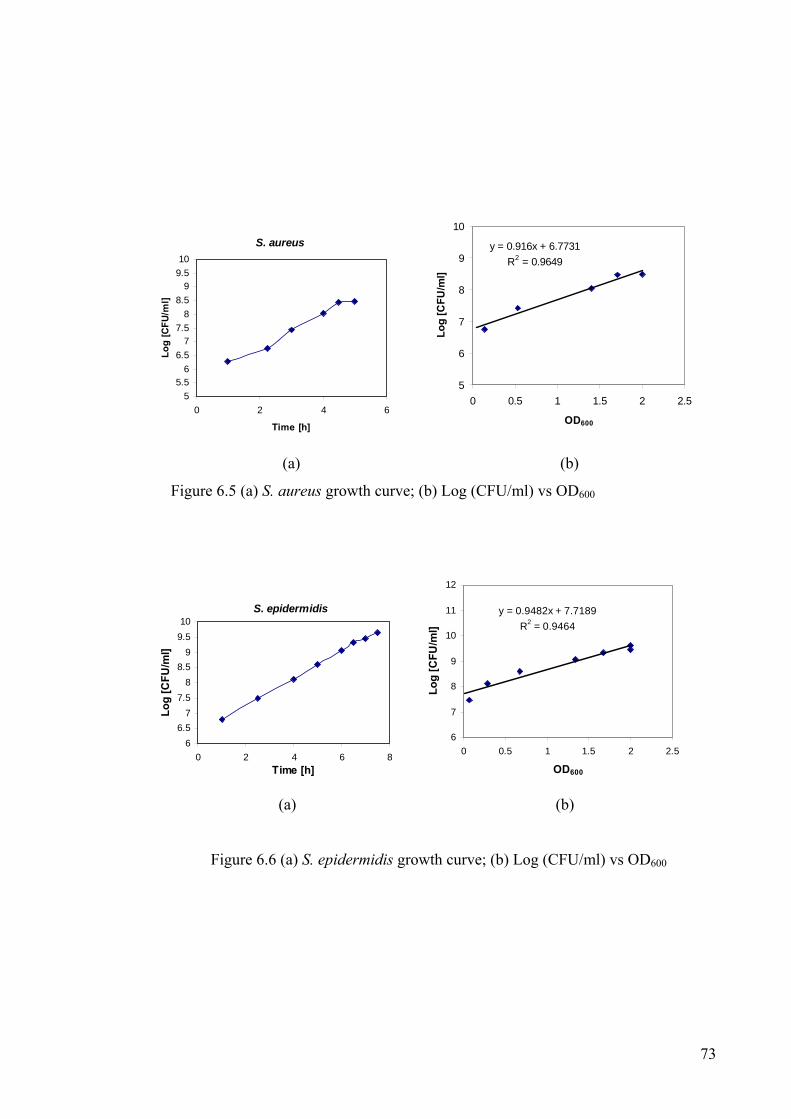
73
S. aureus
55.5
66.5
77.5
88.5
99.510
0 2 4 6
Time [h]
Log
[CFU
/ml]
y = 0.916x + 6.7731R2 = 0.9649
5
6
7
8
9
10
0 0.5 1 1.5 2 2.5
OD600
Log
[CFU
/ml]
(a) (b)
Figure 6.5 (a) S. aureus growth curve; (b) Log (CFU/ml) vs OD600
S. epidermidis
66.5
77.5
88.5
99.510
0 2 4 6 8Time [h]
Log
[CFU
/ml]
y = 0.9482x + 7.7189R2 = 0.9464
6
7
8
9
10
11
12
0 0.5 1 1.5 2 2.5
OD600
Log
[CFU
/ml]
(a) (b)
Figure 6.6 (a) S. epidermidis growth curve; (b) Log (CFU/ml) vs OD600

74
6.1.4 Contact angle and Surface Energy of Bacteria
The contact angle of bacterial cells was measured on the lawns of bacteria deposited on
membrane filters with pore diameter of 0.45µm. Prior to contact angle measurement, the
bacterial lawns were dried in the air to a certain state, indicated by stable water contact
angles. Usually this state of drying of a microbial lawn lasts 30-60 minutes and
indicated that only bound water is present on the surface. The static contact angles of
the three test liquids: distilled water (θw), diiodomethane (θD) and ethylene glycol (θE)
on the bacterial membrane filters at room temperature are given in Table 6.2. The value
of each contact angle is the average of three measurements and the standard deviation
value is 0.3-1.2°. Table 6.2 shows the contact angle values and the surface free energy
of the different bacteria strains, which were calculated using van Oss acid-base
approach (Liu, 2008; Wang 2008).
Table 6.2 Contact Angle and Surface Energy Components of Bacteria Bacteria Contact Angle θ
[°] Surface Free Energy Components
[mJ/m2] θW θDi θEG LWγ +γ −γ ABγ TOTγ
Pseudomonas fluorescens 17.9 61.7 18.6 27.62 1.08 66.79 16.96 44.58 Escherichia coli 16.5 47.6 22.9 35.60 0.14 67.68 6.16 41.76 Pseudomonas aeruginosa 78.0 55.4 72.4 31.10 0.00 17.60 0.00 31.10 Staphylococcus aureus 16.6 54.8 22.3 31.56 0.43 68.32 10.84 42.40 Staphylococcus epidermidis 31.0 48.2 50.1 32.91 0.00 63.15 0.00 32.91
6.2 Bacterial Adhesion and Removal 6.2.1 Bacterial Adhesion
In this study, the bacterial suspension with a 106 CFU/ml concentration for each type of
5 bacteria was prepared. Five replicate samples of each coating were immersed
vertically in a glass tank containing 500 ml of a bacterial suspension and were incubated
on a shaker at 20 rpm for 1, 5 or 18 hour at 28˚C for P. fluorescens or at 37˚C for E. coli,
P. aeruginosa, S. aureus or S. epidermidis. After that, each coating plate was taken out
from the tank using sterile forceps and was dipped twice vertically in sterile distilled

75
water with a custom-made automated dipper apparatus under a constant speed of 0.03 m
s-1 in order to remove loosely attached bacteria. Then the total number of bacteria on the
plate was counted either by viable plate count method or by fluorescence microscope.
For viable plate count method the plate was immersed in the 25ml sterile water beaker
and sonicated for 5 min to remove adhered bacteria from the surface of sample
thoroughly. Then 100 µl of sonicated suspension, 10-1, 10-2 and 10-3 dilutions were
plated out on TSA plates and incubated overnight at 28 °C or at 37 °C. The colonies
were counted out. Five parallel coating plate of each type were used to obtain the
average number of adherent bacteria of each coating. The adhered bacteria to each
substrate were the average of 5×4 measurements (maximum) by the viable plating count
method. For fluorescence microscope method, the number of bacteria on the plate was
counted directly using Image-Pro Plus software. For each plate 6 areas were counted.
Five replicate samples of each coating were used to obtain the average number of
adherent bacteria of each coating. The adhered bacteria to each substrate were the
average of 5×6 measurements (maximum) by the fluorescence microscope method.
6.2.2 Bacterial Removal
In order to investigate bacterial adhesion strength, a home-made dipping device (Figure
6.7) was designed by Zhao et al. (2008). It is designed to remove 10% ~ 90% bacteria
from surfaces through moving the sample up and down into the water at constant speed
(0.03 m/s) controlled by a motor. This process is identical to water flowing over the
surface of the sample and the whole area of samples is flushed with water at constant
shear stress. Therefore, the bacteria that adhered weakly to the surfaces can be removed
into the water tank. Finally, bacterial adhesion strength and removal percentage can be
determined (Zhao et al 2008; Liu 2011).

76
Figure 6.7 Dipping Device
To assess the adhesion strength of the attached bacteria, each sample was dipped 20
times vertically in a glass tank (A) containing 130 ml sterile distilled water at 28˚C (or
at 37 ˚C) at a constant 0.03 m/s speed (or a constant shear stress of 0.014 N m-2, see
equation 6.4) to remove 10-90% adhered bacteria using a dipping device. Each test
sample was transferred to a second glass tank (B) with 25 ml sterile distilled water and
sonicated in an ultrasonic bath to remove all the remaining attached bacteria thoroughly.
The number of bacteria in the tank (A) was defined as BA, while the number of bacteria
in the tank (B) was BB. The total number of bacteria attached to the sample BTOT is the
sum of the bacteria in tank (A), BA and the bacteria in tank (B), BB, as described in
equation (6.1). The percentage removal of bacteria from the sample was calculated
using equation (6.2):
BTOT = BA + BB (6.1)
Removal (%) = BA /BTOT ×100 (6.2)
The values of BA and BB were determined using a standard plating method for viable
counts. For vessel (A), 100 μl of bacterial suspension from 130 ml tank (A) as well as
10−1 and 10−2 dilutions were plated out onto TSA plates, respectively. The agar plates
were incubated for 24 h at 28˚C (or 37˚C) for viable cell counts. The number of bacteria
in 100 μl of bacterial suspension was obtained using the appropriate concentration from

77
original, 10−1 dilution or 10−2 dilution. Then the total number of bacteria in 130 ml in
vessel (A) was calculated. The number of bacteria in 25 ml from tank B was determined
using the same method. The total number of bacteria, as colony-forming units (CFU)
attached to the coating and the percentage removal from the coating was the mean of
maximum 15 measurements, 3 from each of 5 replicate samples.
For water flows over a flat plate with width b and length L with velocity U, the drag
force can be calculated using the following equation:
(6.3)
where ρ and μ are water density and viscosity, respectively. The corresponding shear
stress τw is defined as:
LU
LbFd
w
3
646.0 ρμτ =×
= (6.4)
The equation (6.4) is also suitable for the calculation of shear stress using the dipping
device. In this case, U is the dipping speed (0.03 m/s) and L is the height of water in
tank (0.075 m) (Zhao et al 2008).
6.3 Methods of Cell Counting 6.3.1 Viable Plate Counts Method
Plate counts is one of the most common methods of determining bacterial number, and
it is also a gratifying method to enumerating surface bacteria calls for the investigator to
detach the bacteria and count the number of colony forming units (CFU) recovered from
the detachment procedure. The plate counts method consists of diluting a sample until
the bacteria are dilute enough to count accurately. That is, the final plates in the series
should have between 30 and 300 colonies. Fewer than 30 colonies are not acceptable for
statistical reasons, and more than 300 colonies on a plate are likely to produce colonies
3646.0 LUbFd ρμ=
78
too close to each other to be distinguished as distinct CFU (Prescott LM et al., 2005).
The general procedure for the plate count method includes:
1) Plate out 100 μl from the obtained suspension and its dilutions (10-1, 10-2, 10-3,
and 10-4) on an agar plate (TSA)
2) Incubate at 28-37˚C the plates overnight, depending of the strains.
3) Count the colonies by a Digital Colony Counter next day
The main disadvantages of plate count method include:
1) It is very time-consuming and it takes about 1-2 days to get the results
2) It can only count viable bacteria.
6.3.2 Microscope Method
In general microorganisms cannot be observed in naked eye. If they are stained with
fluorescent dyes they can be seen with the fluorescence microscope. The main
advantages of this technique include:
1) It is very quick, compared with plate count method, making it especially suitable
for large sets of samples;
2) It can count both alive and dead bacteria;
In this study, the LIVE/DEAD BacLight bacterial viability kit was used for the
enumeration of bacteria on the coatings. The kit consists of two nucleic acid stains:
SYTO 9, which penetrates most membranes freely, and propidium iodide, which is
highly charged and normally does not permeate cells but does penetrate damaged
membrane. Simultaneous application of both dyes therefore results in green
fluorescence of viable cell with an intact membrane, whereas dead cells, because of a
compromised membrane, show intense red fluorescence. The procedures are shown as
follows (Wang, 2008):
1) Concentrate 10 mL of the bacterial suspension by centrifugation for 10 minutes.
2) Remove the supernatant and resuspend the pellet in 2 mL of 0.85% NaCl.

79
3) Add 1 mL of this suspension to each of two 30–40 mL centrifuge tubes
containing either 20 mL 0.85% NaCl (for live bacteria) or 20 mL of 70%
isopropyl alcohol (for killed bacteria).
4) Incubate both samples at room temperature for 1 hour, mixing every 15 minutes.
5) Pellet both samples by centrifugation for 10minutes.
6) Resuspend the pellets in 20 mL 0.85% NaCl and centrifuge again as in step 5.
7) Resuspend both pellets in separate tubes with 10 mL of 0.85% NaCl each.
8) Determine the optical density at 670 nm (OD670) of a 3 mL aliquot of the
bacterial suspensions in glass (1 cm pathlength).
9) Selection of Optical Filters (The fluorescence from both live and dead bacteria
may be viewed simultaneously with any standard fluorescein longpassfilter set.
Alternatively, the live (green fluorescent) and dead (red fluorescent) cells may
be viewed separately with fluoresceinn and Texas Red bandpass filter sets).
10) Staining Bacteria in Suspension with LIVE/DEAD BacLight stain. (Mix
thoroughly and incubate at room temperature in the dark for 15 minutes).
11) Trap 5 µL of the stained bacterial suspension between a slide and an 18 mm
square coverslip.
12) Observe in a fluorescence microscope equipped with filters. Prepare 3 slides for
each sample and record 10 fields.
13) Data analysis by image pro plus software.
In this study, a BX41 Olympus Fluorescence Microscope with QICAM High-
Performance Digital CCD Camera and Image-Pro Plus software was used for counting
bacteria on the coatings, as shown in Figure 6.8. The number of bacteria can be
accurately counted manually or automatically using image analysis by Image Pro Plus,
as shown in Figure 6.9. The green colour shows alive bacteria while the red colour
shows dead bacteria.

80
Figure 6.8 BX41 Olympus Fluorescence Microscope
Figure 6.9 Image Analysis by Image Pro Plus Software
6.4 Protein Removal Assays So far there are no studies that explore protein removal properties from the doped DLC
coatings with selected elements. The exact mechanisms of how individual doping
elements affect surface properties with respect to protein adhesion are not known and
are complex. In the present study, B and Ti-doped DLC coatings with a range of
proportion of the doping elements were produced by Tecvac Ltd in order to investigate
their effectiveness in enabling protein removal using two established cleaning methods,
one with a chemical detergent, the other with an enzymatic agent. All the coatings were
81
treated with 100 µg/ml brain homogenate and dried for 24 hours in the room
temperature. Then they were subsequently cleaned using a detergent- Decon. The
quantity of protein remaining after cleaning was determined by looking at the
fluorescence produced with OPA/NAC and comparing this to positive and negative
controls. The protein removal assays were performed at Barts and London School of
Medicine.

82
CHAPTER 7 EXPERIMENTAL RESULTS In this chapter, the adhesion and removal of bacteria and protein were investigated using
a range of nano-composite coatings including Ni-P-polymers coatings, doped DLC
coatings and SiOx-like coatings. The bacteria used included P. fluorescens, E. coli, P.
aeruginosa, S. aureus and S. epidermidis. The protein was brain homogenate. The effect
of surface energy, doped elements and their contents in the coatings on the adhesion and
removal of bacteria and protein were investigated.
7.1 Ni-P-Biocide Polymer Nanocomposite Coatings 7.1.1 Selection of Biocide Polymers According to the literature search, Ni–P–PTFE coatings seem the one of the best
coating techniques for controlling biofouling in heat exchangers and pipelines. However
their anti-biofouling and anti-corrosion properties could be futher improved by
incorperation biocide polymer nanoparticles into the Ni–P–PTFE coatings.
In this study, the anti-microbial efficiency of 13 different types of biocide polymers
from Graz University of Technology were evaluated with Escherichia coli and
Staphylococcus aureus. The detailed procedures of bacterial adhesion and removal are
described in Section 6.2: Bacterial Adhesion and Removal. In brief, the biocide polymer

83
samples were put into a beaker containing 500ml bacterial suspension with 1×10⁶
CFU/ml concentration and then the beaker was put in a shaker incubator (Stuart
Scientific, UK) at 37°C for 1h under a gentle stirring at 20rpm. In order to observe the
number of cells microscopically, the bacteria on the samples was stained using
LIVE/DEAD BacLight Kit L 13152 for 15 minutes and then observed under a
fluorescence microscope (OLYMPUS BX 41, Japan) and counted using Image Pro Plus
software (Media Cybernetics, USA).
Figure 7.1 shows that all the biocide polymers have strong antimicrobial properties with
respect to the bacterium Escherichia coli, compared to the control polymer without
additives (355.09.012). The polymers 355.09.004; 355.09.006; SK13; SM14 and SM20
perform better than others against bacterial attachment. Figure 7.2 shows bacterial
adhesion strength or bacterial removal rate. All these polymers have similar bacterial
removal rate except for SK13.
Figure 7.1 Bacterial attachment with Escherichia coli
Figure 7.3 shows that the biocide polymers have strong antimicrobial properties with
respect to the bacterium Staphylococcus aureus, compared to the control polymer
without additives (355.09.012). Again the polymers 355.09.004; 355.09.006; SK13;
SM14 and SM20 perform best against bacterial attachment. Figure 7.4 shows bacterial
adhesion strength or bacterial removal rate. SM14 and SM20 have higher bacterial
removal rate than the polymers 355.09.004; 355.09.006; SK13.
0100002000030000400005000060000700008000090000
100000
253.0
9.006
253.0
9.012
355.0
9.003
355.0
9.004
355.0
9.006
355.0
9.007
355.0
9.008
355.0
9.009
355.0
9.012
SK13SM14
SM20 VP
Att
ache
d ba
cter
ia [C
FU/c
m2 ]

84
0
20
40
60
80
100
120
140
160
253.0
9.006
253.0
9.012
355.0
9.003
355.0
9.004
355.0
9.006
355.0
9.007
355.0
9.008
355.0
9.009
355.0
9.012
SK13SM14
SM20 VP
Bac
teria
l rem
oval
[%]
Figure 7.2 Bacterial removal with Escherichia coli
Figure 7.3 Bacterial attachment with Staphylococcus aureus
0
20
40
60
80
100
120
140
253.0
9.006
253.0
9.012
355.0
9.003
355.0
9.004
355.0
9.006
355.0
9.007
355.0
9.008
355.0
9.009
355.0
9.012
SK13SM14
SM20 VP
Bac
teria
l rem
oval
[%]
Figure 7.4 Bacterial removal with Staphylococcus aureus
020000400006000080000
100000120000140000160000180000200000
253.0
9.006
253.0
9.012
355.0
9.003
355.0
9.004
355.0
9.006
355.0
9.007
355.0
9.008
355.0
9.009
355.0
9.012
SK13SM14
SM20 VP
Atta
ched
bac
teria
[CFU
/cm
2 ]

85
7.1.2 Ni-P-Biocide Polymers Coatings
Figures 7.1-7.4 indicate that the two biocide polymers SM14 and SM20 perform best
against bacterial attachment and removal. The chemical structures of SM14 and SM20
are shown in Fig. 4.4. As a result, four new anti-biofouling Ni-P-biocide polymers
nanocomposite coatings: Ni-P-SM14, Ni-P-PTFE-SM14, Ni-P-SM20 and Ni-P-PTFE-
SM20 were developed.
Figure 7.5 shows Escherichia coli adhesion on the coatings. Stainless steel and Ni-P
coatings were used as control. Overall all the coatings with biocide polymers and PTFE
performed much better than stainless steel and Ni-P coatings. The coatings with biocide
polymers (Ni-P-SM14 and Ni-P-SM20) performed much better than Ni-P coatings, and
the coatings with PTFE (Ni-P-PTFE-SM14 and Ni-P-PTFE-SM20) performed better
than the coatings without PTFE (Ni-P-SM14 and Ni-P-SM20). Ni-P-PTFE-SM14 and
Ni-P-PTFE-SM20 performed best, which reduced bacterial attachment by 94% and 70%
respectively as compared with stainless steel and Ni-P-PTFE. Figure 7.6 shows bacterial
removal with Escherichia coli. Overall the removal rate for the coatings with biocide
polymers and PTFE was much better than stainless steel and Ni-P coatings. As PTFE
has non-stick property, the coatings with PTFE (Ni-P-PTFE, Ni-P-PTFE-SM14 and Ni-
P-PTFE-SM20) have highest bacterial removal rate.
0
5000
10000
15000
20000
25000
30000
35000
40000
45000
Stainlesssteel
Ni-P Ni-P-PTFE
Ni-P-SM14
Ni-P-SM20
Ni-P-PTFE-SM14
Ni-P-PTFE-SM20
Adh
ered
bac
teria
[CFU
/cm
2 ]
Figure 7.5 Attachment of E. coli on Ni-P-Polymer coatings

86
0
20
40
60
80
100
120
Stainlesssteel
Ni-P Ni-P-PTFE
Ni-P-SM14
Ni-P-SM20
Ni-P-PTFE-SM14
Ni-P-PTFE-SM20
Bac
teria
l Rem
oval
[%]
Figure 7.6 Removal of E. coli from Ni-P-Polymer coatings
Figure 7.7 shows Staphylococcus aureus adhesion on the coatings. Similar results were
obtained. Ni-P-PTFE-SM14 and Ni-P-PTFE-SM20 performed best, which reduced
bacterial attachment by 87% and 53% respectively, as compared with stainless steel and
Ni-P-PTFE. Figure 7.8 shows bacterial removal with Staphylococcus aureus. The
removal rate for the coatings with biocide polymers and PTFE was much better than
stainless steel and Ni-P coatings. The coatings with PTFE (Ni-P-PTFE, Ni-P-PTFE-
SM14 and Ni-P-PTFE-SM20) have highest bacterial removal rate.
05000
100001500020000250003000035000400004500050000
Stainlesssteel
Ni-P Ni-P-PTFE
Ni-P-SM14
Ni-P-SM20
Ni-P-PTFE-SM14
Ni-P-PTFE-SM20
Adh
ered
bac
teria
[CFU
/cm
2 ]
Figure 7.7 Attachment of S. aureus on Ni-P-Polymer coatings
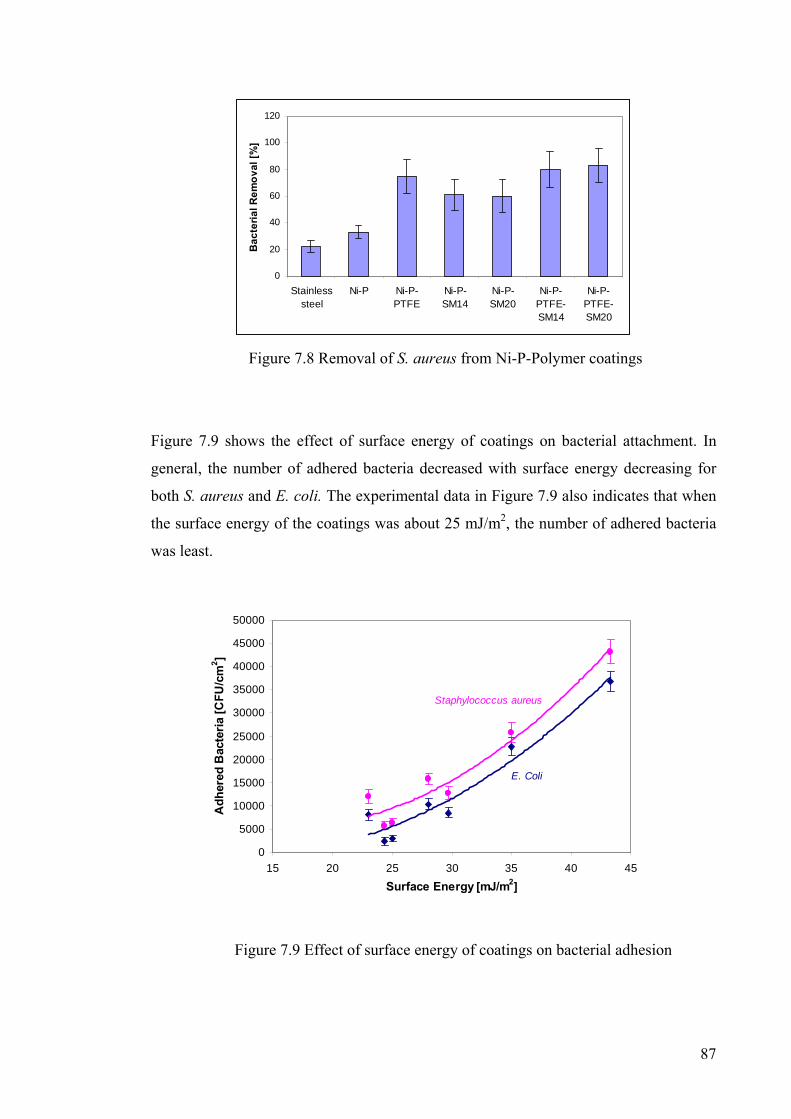
87
0
20
40
60
80
100
120
Stainlesssteel
Ni-P Ni-P-PTFE
Ni-P-SM14
Ni-P-SM20
Ni-P-PTFE-SM14
Ni-P-PTFE-SM20
Bac
teria
l Rem
oval
[%]
Figure 7.8 Removal of S. aureus from Ni-P-Polymer coatings
Figure 7.9 shows the effect of surface energy of coatings on bacterial attachment. In
general, the number of adhered bacteria decreased with surface energy decreasing for
both S. aureus and E. coli. The experimental data in Figure 7.9 also indicates that when
the surface energy of the coatings was about 25 mJ/m2, the number of adhered bacteria
was least.
0
5000
10000
15000
20000
25000
30000
35000
40000
45000
50000
15 20 25 30 35 40 45
Surface Energy [mJ/m2]
Adh
ered
Bac
teria
[CFU
/cm
2 ]
Staphylococcus aureus
E. Coli
Figure 7.9 Effect of surface energy of coatings on bacterial adhesion

88
Summary and discussion:
For Ni-P-PTFE coating, its anti-bacterial mechanism is due to the inherent non-stick
property of PTFE. For Ni-P-SM14 or Ni-P-SM20, their anti-bacterial mechanism is due
to the biocidal property of the biocide polymers SM14 and SM20. For Ni-P-PTFE-
SM14 and Ni-P-PTFE-SM20, their anti-bacterial mechanisms are due to the non-stick
property of PTFE and biocidal property of the biocide polymer SM14 or SM20. In
addition, the total surface energy of Ni-P-PTFE-SM14 and Ni-P-PTFE-SM20 was
controlled for the optimum value, about 25mJ/m2 (see Table 5.5). As a result, Ni-P-
PTFE-SM14 and Ni-P-PTFE-SM20 performed best against bacterial attachment and
had highest bacterial removal rate. Some of research work was presented in Euro-
Thermo Heat Exchanger Fouling and Cleaning Conference - June 05-10, 2011, Crete,
Greece and included in the refereed conference proceedings (Su et al 2011). An EU
patent was filed on 1 June 2012 (Su et al 2012).
7.2 Doped Diamond-Like Carbon Coatings
7.2.1 Si-N-Doped DLC Coatings
In the present study, a range of silicon- and nitrogen-doped DLC coatings with different
Si and N contents were produced in order to investigate microbial attachment and
release properties of the coatings i.e. the strength of attachment of cells, for a number of
applications where the control of biological fouling is critical e.g. heat exchangers,
pipelines and biomedical devices. The detailed procedure for preparing the Si- and N-
doped DLC coatings is given in Section 4.2.2. The chemical composition, contact angle
and surface energy components of Si-N-doped DLC coatings are given in Table 5.6.
These coatings were evaluated for attachment and removal of Pseudomonas fluorescens,
which is one of the most common bacteria that form biofilms on the surface of heat
exchangers in freshwater cooling water systems (Bott 2001). The detailed procedures of
bacterial adhesion and removal are described in Section 6.2: Bacterial Adhesion and
Removal. In brief, for bacterial attachment assays, five replicate samples of each

89
coating were immersed in a glass tank containing 500 ml of a suspension of P.
fluorescens (106 cells ml-1), incubated on a shaker (20 rpm) at 28˚C for 1 h. To assess
the adhesion strength of the attached bacteria, each sample was dipped a further 20
times vertically in a glass vessel containing 130 ml sterile distilled water at 28˚C at a
constant shear stress of 0.014 N m-2.
Initial attachment of Pseudomonas fluorescens on the Si-and Si-N-doped DLC coatings
(DLC1 - DLC7) is shown in Figure 7.10. The incorporation of 2%N into the Si-doped
DLC coatings (DLC4, DLC5, DLC6, DLC7) significantly reduced bacterial attachment
(p=0.05), compared with pure Si-DLC coatings (DLC1, DLC2, DLC3) and the standard,
Silastic® T2. Silicone coatings based on polydimethylsiloxane are being investigated as
fouling-release coatings for various applications including ship hulls. However, the poor
thermal conductivity, poor abrasion resistance and poor adhesion to metal substrates of
silicone elastomers currently inhibit their commercial use in heat exchangers (Müller-
Steinhagen and Zhao 1997). Figure 7.10 indicates that the Si-N-doped DLC coatings
performed better than silicone coatings against bacterial attachment.
The incorporation of 2%N into the Si-doped DLC coatings also increased bacterial
removal. Figure 7.11 indicates that for the first 3 Si-doped DLC coatings (DLC1, DLC2,
DLC3), percent bacterial removal increased with increasing Si content in the DLC
coatings i.e. adhesion strength decreased with increasing Si content in the DLC coatings.
DLC1 (1%Si-DLC) was significantly different (p=0.05) to DLC2 (2%Si-DLC) and
DLC3 (3.8%Si-DLC). Figure 7.11 also indicates that for the four Si-N-doped DLC
coatings (DLC4, DLC5, DLC6, DLC7), percent bacterial removal increased
significantly with increasing Si content in the DLC coatings.

90
0500
100015002000250030003500400045005000
DLC1DLC2
DLC3DLC4
DLC5DLC6
DLC7
T2 Sila
stic
Adh
ered
bac
teria
[CFU
/cm
2 ] Si-DLC
Si-N-DLC
Figure 7.10: Comparison of formation of pseudomonas fluorescens cells on Si-N-DLC
coatings and on T2 silastic. N = 15, error bars are 2× Standard Error.
0.0
20.0
40.0
60.0
80.0
100.0
120.0
DLC1
DLC2
DLC3
DLC4
DLC5
DLC6
DLC7
T2 Sila
stic
Bac
teria
l rem
oval
[%]
Si-DLC
Si-N-DLC
Figure 7.11: Comparison of removal of pseudomonas fluorescens cells on Si-N-DLC
coatings and on T2 silastic. N = 15, error bars are 2× Standard Error.
Figure 7.12 shows that percent bacterial removal strongly correlated with the surface
energy components electron acceptor +Sγ and electron donor −
Sγ of the DLC coatings.
Pseudomonas fluorescens had high value of −Bγ component (66.79 mN/m, see Table 6.2)
and low value of +Bγ component (1.08 mN/m, see Table 6.2), and would be negatively
charged with the zeta potential of -16.1 mV (Azeredo et al. 2003). Chibowski et al.
(1994) investigated the changes in zeta potential and surface energy components of

91
calcium carbonate due to exposure to radiofrequency electric field. They observed that
zeta potential decreased with an increase in the electron donor component −Sγ of the
surface energy. The observed changes in zeta potential and surface energy components
were believed to result from changes in the surface charge of calcium carbonate
(Chibowski et al. 1994). These observations may explain why bacterial removal
decreased with increasing electron acceptor +Sγ values of the DLC coatings (Fig 7.12a, b)
and increased with increasing electron donor −Sγ values of DLC coatings (Fig. 7.12c, d).
Figure 7.12 (a) Electron acceptor +Sγ vs bacterial removal for Si-doped DLC coatings; (b)
Electron acceptor +Sγ vs bacterial removal for Si-N-doped DLC coatings; (c) electron
donor −Sγ vs bacterial removal for Si-doped DLC coatings; (d) electron donor −
Sγ vs
bacterial removal for Si-N-doped DLC coatings. N = 15, error bars are 2× Standard
Error.
40
45
50
55
60
65
0 1 2 3 4 5 6
γ + surface energy [mJ/m2]
Bac
teria
l rem
oval
[%]
(a)
DLC3 DLC2
DLC1
50
60
70
80
90
100
110
0 0.5 1 1.5 2 2.5
γ + surface energy [mJ/m2]
Bac
teria
l rem
oval
[%]
(b)
DLC7 DLC6
DLC4
DLC5
50
60
70
80
90
100
110
6.5 6.7 6.9 7.1 7.3 7.5
γ - surface energy [mJ/m2]
Bac
teria
l rem
oval
[%]
(d)
DLC4
DLC6 DLC7
DLC5
40 45 50 55 60 65
0 5 10 15 20
γ - surface energy [mJ/m2]
Bac
teria
l rem
oval
[%]
(c)
DLC1 DLC2 DLC3

92
Summary and discussion:
In this investigation two types of the DLC coatings were produced. The Si-doped DLC
coatings (DLC1 - DLC3) were produced by an unbalanced magnetron sputter ion-
plating combined with PECVD. The Si in the DLC coatings was achieved by sputtering
a solid Si target, while the Si-N-doped DLC coatings (DLC4 – DLC7) were produced
by radio frequency PECVD and the Si in the DLC coatings was from the Si(CH3)4 gas.
The experimental results showed that the Si-N-doped DLC coatings performed more
efficiently than Si-doped DLC coatings both in reducing bacterial attachment and in
removal by shear stress. Clearly the incorporation of 2%N into the Si-doped DLC
coatings considerably improved the performance of the coatings. As well as the addition
of 2%N, the PECVD coating method and the Si source from Si(CH3)4 gas may also lead
to the improvement in performance of Si-N-doped DLC coatings. Some of the research
results were published in <Biofouling> (Zhao and Su et al, 2009).
Diamond-like carbon (DLC) coatings have favourable properties, such as excellent
thermal conductivity similar to metals, low friction, extremely smooth surface, hardness,
wear resistance and corrosion resistance, which are very suitable for heat exchanger
applications. It has already been demonstrated that DLC coatings reduce the formation
of hard mineral scale on heat transfer surfaces and have potential for heat exchanger
application (Förster and Bohnet 1999; Zhao and Wang 2005). This investigation further
demonstrates that the modified DLC coatings have the potential to reduce biofouling in
heat exchangers. As both DLC coatings and modified DLC coatings with Si and N are
biocompatible, they also have potential to reduce bacterial adhesion in biomedical
devices and implants.
7.2.2 F-Doped DLC Coatings
In order to investigate the effect of fluorine contents in DLC coatings on bacterial
adhesion and removal, the F-doped DLC coatings with a wide range of F contents were
prepared on stainless steel plates by CSIRO Materials Science and Engineering,
Australia. The detailed procedure for preparing F-doped DLC coatings is given in
Section 4.2.3. The chemical composition, contact angle and surface energy components
of F-doped DLC coatings are given in Table 5.7.

93
These coatings were evaluated for attachment and removal with Pseudomonas
fluorescens and Staphylococcus aureus, respectively. The detailed procedures of
bacterial adhesion and removal are described in Section 6.2: Bacterial Adhesion and
Removal. In brief, for bacterial attachment assays, five replicate samples of each
coating were immersed in a glass tank containing 500 ml of a suspension of P.
fluorescens or S. aureus (106 cells ml-1), incubated on a shaker (20 rpm) at 28 ˚C or 37
˚C for 1 h. To assess the adhesion strength of the attached bacteria or bacterial removal
rate, each sample was dipped a further 20 times vertically in a glass vessel containing
130 ml sterile distilled water at 28 ˚C or 37 ˚C at a constant shear stress of 0.014 N m-2.
Initial attachment of Pseudomonas fluorescens on the fluorinated DLC coatings is
shown in Figure 7.13. The number of adhered bacteria decreases with increasing F
contents in the F-DLC coatings. The F-DLC coatings with higher F content (39.2 % at.
%) reduced bacterial attachment by 49 %, compared with DLC coating.
Figure 7.13: Comparison of formation of Pseudomonas fluorescens cells on F-DLC
coatings and on DLC coatings. N = 15, error bars are 2× Standard Error.
Figure 7.14 indicates that percent bacterial removal increases significantly with
increasing F content in the DLC coatings i.e. adhesion strength decreased with
increasing F content in the DLC coatings. The F-DLC coatings with higher F content
(39.2 at. %) increased removal by 90.2 %, compared with DLC coating.
0
500
1000
1500
2000
2500
3000
3500
DLC 6.5%F- DLC 20.7%F-DLC
39.2%F-DLC
Adh
ered
bac
teria
(CFU
/cm
2 )

94
0
10
20
30
40
50
60
70
80
DLC 6.5%F- DLC 20.7%F-DLC 39.2%F-DLC
Bac
teria
rem
oval
(%)
Figure 7.14: Comparison of removal of Pseudomonas fluorescens cells on F-DLC
coatings and on DLC coatings. N = 15, error bars are 2× Standard Error.
The coatings were also stained with LIVE/DEAD BacLight Kit L 13152 for 15 minutes
and then observed under a fluorescence microscope (OLYMPUS BX 41, Japan) and
counted using Image Pro Plus software (Media Cybernetics, USA). The numbers of
cells on the coatings observed microscopically were almost equal with that determined
by the culture method. The effect of surface roughness on bacterial attachment and
removal were investigated, but no correlation was found in this study.
Figure 7.15 shows that the initial attachment of Pseudomonas fluorescens strongly
correlated with the total surface energy of the coatings. The number of adhered bacteria
decreased with the total surface energy of the coatings decreasing. Figure 7.16 shows
that percentage of bacterial removal strongly correlated with the total surface energy of
the F-DLC coatings. The percentage of bacterial removal increased with the total
surface energy of the F-DLC coatings decreasing.

95
0
500
1000
1500
2000
2500
3000
3500
25 30 35 40 45 50
Total surface energy [mJ/m2]
Adh
ered
bac
teria
[CFU
/cm
2 ]
Figure 7.15 Effect of total surface energy of F-DLC coatings on adhesion of
Pseudomonas fluorescens cells. N = 15, error bars are 2× Standard Error.
0
10
20
30
40
50
60
70
80
25 30 35 40 45 50
Total surface energy [mJ/m2]
Bac
teria
l rem
oval
[%]
Figure 7.16: The effect of total surface energy of F-DLC coatings on removal of
Pseudomonas fluorescens cells. N = 15, error bars are 2× Standard Error.
Figure 7.17 shows that the number of adhered Staphylococcus aureus decreased with
increasing F contents in the F-DLC coatings. The F-DLC coatings with higher F content
(39.2 at. %) reduced bacterial attachment by 67 %, compared with DLC coating.

96
Figure 7.18 indicates that percent bacterial removal increased significantly with
increasing F content in the DLC coatings. The F-DLC coatings with the highest F
content (39.2 at. %) increased removal rate 32 %, compared with DLC coating.
0
10000
20000
30000
40000
50000
60000
70000
DLC 6.5%F- DLC 20.7%F-DLC 39.2%F-DLC
Adh
ered
bac
teria
[CFU
/cm
2 ]
Figure 7.17: Comparison of formation of Staphylococcus aureus cells on F-DLC
coatings and on DLC coatings. N = 15, error bars are 2× Standard Error.
01020
30405060
7080
DLC 6.5%F- DLC 20.7%F-DLC
39.2%F-DLC
Bac
teria
l rem
oval
[%]
Figure 7.18: Comparison of removal of Staphylococcus aureus cells on F-DLC coatings
and on DLC coatings. N = 15, error bars are 2× Standard Error.
Figure 7.19 shows that the number of adhered Staphylococcus aureus decreased with
the total surface energy of the coatings decreasing.

97
Figure 7.20 shows that percentage of bacterial removal strongly correlated with the total
surface energy of the F-DLC coatings. The percentage of bacterial removal increased
with the total surface energy of the F-DLC coatings decreasing.
0
10000
20000
30000
40000
50000
60000
70000
25 30 35 40 45 50
Total surface energy [mJ/cm2]
Adh
ered
bac
teria
[CFU
/m2 ]
Figure 7.19 Effect of total surface energy of F-DLC coatings on adhesion of
Staphylococcus aureus cells. N = 15, error bars are 2× Standard Error.
0
10
20
30
40
50
60
70
80
25 30 35 40 45 50
Total surface energy [CFU/cm2]
Bac
teria
l rem
oval
[%]
Figure 7.20: The effect of total surface energy of F-DLC coatings on removal of
Staphylococcus aureus cells. N = 15, error bars are 2× Standard Error.

98
Summary and discussion:
The DLC and F-DLC coatings were prepared onto stainless steel substrates by radio
frequency plasma-enhanced chemical vapour deposition. The surface energy of the F-
DLC coatings decreased with increasing F content in the coatings. The incorporation of
fluorine into the DLC coatings reduced significantly bacterial attachment and increased
bacterial removal. The F-DLC coatings with higher F content (39.0 at. %) reduced
bacterial attachment by 49-67 % and increased removal 32 %, compared with pure DLC
coating. Both the initial bacterial attachment and the percent bacterial removal strongly
correlated with the total surface energy of the coatings. Some of the research results
were published in <Surface & Coatings Technology> (Su et al, 2009).
From the point of view of surface science, the bacterial adhesion on the coatings may be
considered as an interaction between the bacteria and the coatings. In general, maximum
adhesion occurs in systems undergoing a maximum decrease in surface energy and
weakest fouling adhesion should occur on materials that have low surface energies.
Therefore, it may be concluded that the prerequisite condition for a surface to possess
low biofouling behaviour is that the surface should have a low surface energy.
F-doped diamond-like carbon coatings have favorable properties, such as excellent
thermal conductivity similar to metals, low friction, extremely smooth surface, hardness,
wear resistance and corrosion resistance, which are very suitable for heat exchanger
applications. As the F-doped DLC coatings are biocompatible, they also have potential
to reduce bacterial adhesion in biomedical devices and implants.
7.2.3 B-Doped DLC Coatings
The detailed procedure for preparing B-doped DLC coatings is given in Section 4.2.4.
The chemical composition, contact angle and surface energy components of B-doped
DLC coatings are given in Table 5.8.
These coatings were evaluated for attachment and removal with Pseudomonas
aeruginosa and Staphylococcus epidermidis, respectively. The detailed procedures of
bacterial adhesion and removal are described in Section 6.2: Bacterial Adhesion and

99
Removal. In brief, for bacterial attachment assays, five replicate samples of each
coating were immersed in a glass tank containing 500 ml of a suspension of P.
aeruginosa or S. epidermidis (106 cells ml-1), incubated on a shaker (20 rpm) at 37 ˚C
for different contact time, 1 h, 5h and 18h, respectively. To assess the adhesion strength
of the attached bacteria or bacterial removal rate, each sample was dipped a further 20
times vertically in a glass vessel containing 130 ml sterile distilled water at 37 ˚C at a
constant shear stress of 0.014 N m-2.
To count the number of bacteria on coatings, the coatings were stained with
LIVE/DEAD BacLight Kit L 13152 for 15 minutes and then observed under a
fluorescence microscope (OLYMPUS BX 41, Japan) and counted using Image Pro Plus
software (Media Cybernetics, USA). It was found that after the coatings were exposed
to air for 15 minutes, some bacteria on the coatings were dead. Therefore the total
bacteria on each coating are the sum of live bacteria (green colour) and dead bacteria
(red colour) that were observed under the fluorescence microscope.
7.2.3.1 Contact time 1 h with P. aeruginosa
Figure 7.21 show typical images of live and dead P. aeruginosa cells on a DLC coating.
For 4.9% B-DLC coatings, 7.6%B-DLC coatings and 9.5%B-DLC coatings, similar
images were observed.
Figure 7.21 Live and dead P. aeruginosa cells on DLC coating
(Contact time: 1 h)

100
Figure 7.22 shows the attachment of P. aeruginosa cells on the B-DLC coatings for
contact time 1 hour. After the coatings with bacteria were exposed to air for 15 minutes,
some bacteria on the coatings were dead. Obviously all the B-DLC coatings performed
much better than DLC coating against bacterial attachment. The number of adhered
bacteria (live, dead and total bacteria) decreased with boron content increasing. The
9.5% B-DLC performed best, which reduced total bacterial adhesion by 70%, compared
with pure DLC coating.
Figure 7.22 Attachment of P. aeruginosa cells on B-DLC coatings
(Contact time: 1 h)
Figure 7.23 clearly shows that the live, dead and total P. aeruginosa cells on the B-DLC
coatings decreased linearly with the boron content in the DLC coatings increasing.
Figure 7.24 shows that the live, dead and total P. aeruginosa cells on the B-DLC
coatings decreased with the total surface energy of the B-DLC coatings decreasing. The
results were consistent with previous results on the effect of total surface energy on
bacterial adhesion. If the total surface energy approaches to 25 mJ/m2, bacterial
adhesion is minimal.
0
50000
100000
150000
200000
250000
300000
DLC 4.9%B-DLC 7.6%B-DLC 9.5%B-DLC
Adh
ered
bac
teria
[CFU
/cm
2 ]
Live bacteriaDead bacteriaTotal bacteria

101
0
50000
100000
150000
200000
250000
300000
-2 0 2 4 6 8 10 12
Boron content in DLC coatings [at.%]
Adh
ered
bac
teria
[CFU
/cm
2 ]
Live bacteriaDead bacteriaTotal bacteria
Figure 7.23 Effect of boron content on the number of live, dead and
total P. aeruginosa cells on B-DLC coatings (Contact time: 1 h)
0
50000
100000
150000
200000
250000
300000
20 25 30 35 40 45 50
Total surface energy of DLC coatings [mJ/m2]
Adh
ered
bac
teria
[CFU
/cm
2 ]
Live bacteriaDead bacteriaTotal bacteria
Figure 7.24 Effect of surface energy of B-DLC coatings on the attachment of live, dead
and total P. aeruginosa cells (Contact time: 1 h)
In order to assess the adhesion strength of the attached bacteria, each sample with
bacteria was dipped 20 times vertically in a glass vessel containing 130 ml sterile
distilled water at 37 ˚C at a constant shear stress of 0.014 N m-2. During the dipping
process, some bacteria were removed from the coatings. The remaining bacteria on the
coatings were observed under the fluorescence microscope (OLYMPUS BX 41, Japan)
and counted using Image Pro Plus software (Media Cybernetics, USA).

102
Figure 7.25 shows the remaining P. aeruginosa cells on the B-DLC coatings after
dipping process. The numbers of remaining bacteria (live, dead and total bacteria)
decreased with boron content increasing. The remaining bacteria (live, dead and total
bacteria) on the 9.5% B-DLC coatings were reduced by 87%, 77% and 83%
respectively, compared with pure DLC coating.
0
20000
40000
60000
80000
100000
120000
140000
160000
DLC 4.9%B-DLC 7.6%B-DLC 9.5%B-DLC
Rem
aini
ng b
acte
ria [C
FU/c
m2 ]
Live bacteriaDead bacteriaTotal bacteria
Figure 7.25 Remaining P. aeruginosa cells on B-DLC coatings
after dipping process(Contact time: 1 h)
Figure 7.26 clearly shows that the remaining P. aeruginosa cells (live, dead and total
bacteria) decreased linearly with boron content increasing.
0
20000
40000
60000
80000
100000
120000
140000
160000
-2 0 2 4 6 8 10 12
Boron content in DLC coatings [at/%]
Rem
aini
ng b
acte
ria [C
FU/c
m2 ]
Live bacteriaDead bacteriaTotal bacteria
Figure 7.26 Effect of Boron content in DLC coatings
on the remaining P. aeruginosa cells (Contact time: 1 h)

103
Figure 7.27 shows that the remaining P. aeruginosa cells (live, dead and total bacteria)
on the B-DLC coatings decreased with the total surface energy of the B-DLC coatings
decreasing. Again if the surface energy approaches 25mJ/m2, the number of the
remaining bacteria is minimal.
0
20000
40000
60000
80000
100000
120000
140000
160000
20 25 30 35 40 45 50
Total surface energy [mJ/m2]
Rem
aini
ng b
acte
ria [C
FU/c
m2 ]
Live bacteriaDead bacteriaTotal bacteria
Figure 7.27 Effect of surface energy of B-DLC coatings
on the remaining P. aeruginosa cells (Contact time: 1 h)
Figure 7.28 shows the removal percentage of P. aeruginosa cells from the B-DLC
coatings after dipping process. The removal percentage of live, dead and total bacteria
increased with boron content in the DLC coating increasing. The removal percentage of
live, dead and total bacteria on the 9.5% B-DLC coatings was 58%, 73% and 68%
respectively; while the removal percentage on the pure DLC coatings was only 34%,
53% and 43%. Figure 7.28 also indicates that the removal percentage of dead bacteria
was higher than that of live bacteria. This means the dead bacteria were more easily
removed than the live bacteria.

104
Figure 7.28 Removal percentage of P. aeruginosa cells from B-DLC coatings
after dipping process (Contact time: 1 h)
7.2.3.2 Contact time 5 h with P. aeruginosa
Figure 7.29 shows the attachment of P. aeruginosa cells on the B-DLC coatings for a
contact time of 5 hours. After the coatings with bacteria were exposed to air for 15
minutes, some bacteria on the coatings were dead. Obviously all the B-DLC coatings
performed much better than DLC coating against bacterial attachment. The number of
adhered bacteria (live, dead and total bacteria) decreased with boron content increasing.
The 9.5% B-DLC performed best, which reduced bacterial adhesion (live, dead and
total bacteria) by 43%, 46% and 44% respectively, compared with pure DLC coating.
Figure 7.30 clearly shows that the P. aeruginosa cells (live, dead and total) on the B-
DLC coatings decreased linearly with the boron content in the DLC coatings increasing.
Figure 7.31 shows that the live, dead and total P. aeruginosa cells on the B-DLC
coatings decreased with the total surface energy of the B-DLC coatings decreasing. The
results were consistent with previous results on the effect of total surface energy on
bacterial adhesion.
0
10
20
30
40
50
60
70
80
90
DLC 4.9%B-DLC 7.6%B-DLC 9.5%B-DLC
Bac
teria
l rem
oval
[%]
Live bacteria removalDead bacteria removalTotal bacteria removal

105
0
50000
100000
150000
200000
250000
300000
350000
400000
DLC 4.9%B-DLC 7.6%B-DLC 9.5%B-DLC
Adh
ered
bac
teria
[CFU
/cm
2 ]
Live bacteriaDead bacteriaTotal bacteria
Figure 7.29 Attachment of P. aeruginosa cells on B-DLC coatings
(Contact time: 5 h)
0
50000
100000
150000
200000
250000
300000
350000
400000
-2 0 2 4 6 8 10 12
Boron content in DLC coatings [at.%]
Adh
ered
bac
teria
[CFU
/cm
2 ] Live bacteriaDead bacteriaTotal bacteria
Figure 7.30 Effect of boron content on the number of live, dead and
total P. aeruginosa cells on B-DLC coatings (Contact time: 5 h)

106
0
50000
100000
150000
200000
250000
300000
350000
400000
20 25 30 35 40 45 50
Total surface energy of DLC coatings [mJ/m2]
Adh
ered
bac
teria
[CFU
/cm
2 ]
Live bacteriaDead bacteriaTotal bacteria
Figure 7.31 Effect of surface energy of B-DLC coatings
on the attachment of P. aeruginosa cells (Contact time: 5 h)
In order to assess the adhesion strength of the attached bacteria, each sample with
bacteria was dipped 20 times vertically in a glass vessel containing 130 ml sterile
distilled water at 37 ˚C at a constant shear stress of 0.014 N m-2. During the dipping
process, some bacteria were removed from the coatings. Figure 7.32 shows the
remaining P. aeruginosa cells on the B-DLC coatings after dipping process. The
numbers of remaining bacteria decreased with boron content increasing. The remaining
bacteria (live, dead and total bacteria) on the 9.5% B-DLC coatings were reduced by
61%, 67% and 63% respectively, compared with pure DLC coating.
0
50000
100000
150000
200000
250000
300000
350000
DLC 4.9%B-DLC 7.6%B-DLC 9.5%B-DLC
Rem
aini
ng b
acte
ria [C
FU/c
m2 ]
Live bacteriaDead bacteriaTotal bacteria
Figure 7.32 Remaining P. aeruginosa cells on B-DLC coatings after dipping process

107
Figure 7.33 clearly shows that the remaining P. aeruginosa cells (live, dead and total
bacteria) decreased linearly with boron content increasing.
0
50000
100000
150000
200000
250000
300000
350000
-2 0 2 4 6 8 10 12
Boron content in DLC coatings [at/%]
Rem
aini
ng b
acte
ria [C
FU/c
m2 ]
Live bacteriaDead bacteriaTotal bacteria
Figure 7.33 Effect of Boron content in DLC coatings
on the remaining P. aeruginosa cells (Contact time: 5 h)
Figure 7.34 shows that the remaining P. aeruginosa cells (live, dead and total bacteria)
on the B-DLC coatings decreased with the total surface energy of the B-DLC coatings
decreasing.
0
50000
100000
150000
200000
250000
300000
350000
20 25 30 35 40 45 50
Total surface energy [mJ/m2]
Rem
aini
ng b
acte
ria [C
FU/c
m2 ]
Live bacteriaDead bacteriaTotal bacteria
Figure 7.34 Effect of surface energy of B-DLC coatings
on the remaining P. aeruginosa cells (Contact time: 5 h)

108
Figure 7.35 shows the removal percentage of P. aeruginosa cells from the B-DLC
coatings after dipping process. The removal percentage of live, dead and total bacteria
increased with boron content in the DLC coating increasing. The removal percentage of
live, dead and total bacteria on the pure DLC coatings was only 13%, 21% and 17% ,
respectively; while the removal percentage of live, dead and total bacteria on the
9.5%B- DLC coatings was increased to 40%, 51% and 45% , respectively. Figure 7.35
also indicates that the removal percentage of dead bacteria was higher than that of live
bacteria. This means the dead bacteria were more easily removed than the live bacteria.
0
10
20
30
40
50
60
70
DLC 4.9%B-DLC 7.6%B-DLC 9.5%B-DLC
Bac
teria
l rem
oval
[%]
Live bacteria removalDead bacteria removalTotal bacteria removal
Figure 7.35 Removal percentage of P. aeruginosa cells from B-DLC coatings
after dipping process (Contact time: 5 h)
7.2.3.3 Contact time 18 h with P. aeruginosa
Figure 7.36 shows the attachment of P. aeruginosa cells on the B-DLC coatings for a
contact time of 18 hours. After the coatings with bacteria were exposed to air for 15
minutes, some bacteria on the coatings were dead. All the B-DLC coatings performed
much better than DLC coating against bacterial attachment. The number of adhered
bacteria (live, dead and total bacteria) decreased with boron content increasing. The
9.5% B-DLC performed best, which reduced bacterial adhesion (live, dead and total
bacteria) by 52%, 47% and 50% respectively, compared with pure DLC coating.

109
0
50000
100000
150000
200000
250000
300000
350000
DLC 4.9%B-DLC 7.6%B-DLC 9.5%B-DLC
Adh
ered
bac
teria
[CFU
/cm
2 ]
Live bacteriaDead bacteriaTotal bacteria
Figure 7.36 Attachment of P. aeruginosa cells on B-DLC coatings
(Contact time: 18 h)
Figure 7.37 clearly shows that the P. aeruginosa cells (live, dead and total) on the B-
DLC coatings decreased linearly with the boron content in the DLC coatings increasing.
0
50000
100000
150000
200000
250000
300000
350000
-2 0 2 4 6 8 10 12
Boron content in DLC coatings [at.%]
Adh
ered
bac
teria
[CFU
/cm
2 ] Live bacteriaDead bacteriaTotal bacteria
Figure 7.37 Effect of boron content on the number of live, dead and
total P. aeruginosa cells on B-DLC coatings (Contact time: 18 h)

110
Figure 7.38 shows that the live, dead and total P. aeruginosa cells on the B-DLC
coatings decreased with the total surface energy of the B-DLC coatings decreasing. The
results were consistent with previous results on the effect of total surface energy on
bacterial adhesion.
0
50000
100000
150000
200000
250000
300000
350000
20 25 30 35 40 45 50
Total surface energy of DLC coatings [mJ/m2]
Adh
ered
bac
teria
[CFU
/cm
2 ]Live bacteriaDead bacteriaTotal bacteria
Figure 7.38 Effect of surface energy of B-DLC coatings
on the attachment of P. aeruginosa cells (Contact time: 18 h)
In order to assess the adhesion strength of the attached bacteria, each sample with
bacteria was dipped 20 times vertically in a glass vessel containing 130 ml sterile
distilled water at 37 ˚C at a constant shear stress of 0.014 N m-2. During the dipping
process, some bacteria were removed from the coatings. The remaining bacteria on the
coatings were observed under the fluorescence microscope and counted using Image
Pro Plus software.
Figure 7.39 shows the remaining P. aeruginosa cells on the B-DLC coatings after
dipping process. The numbers of remaining bacteria (live, dead and total bacteria)
decreased with boron content increasing. The remaining bacteria (live, dead and total
bacteria) on the 9.5% B-DLC coatings were reduced by 63%, 58% and 61%
respectively, compared with pure DLC coating.

111
0
50000
100000
150000
200000
250000
DLC 4.9%B-DLC 7.6%B-DLC 9.5%B-DLC
Rem
aini
ng b
acte
ria [C
FU/c
m2 ]
Live bacteriaDead bacteriaTotal bacteria
Figure 7.39 Remaining P. aeruginosa cells on B-DLC coatings
after dipping process (Contact time: 18 h).
Figure 7.40 clearly shows that the remaining P. aeruginosa cells (live, dead and total
bacteria) decreased linearly with boron content increasing.
0
50000
100000
150000
200000
250000
-2 0 2 4 6 8 10 12
Boron content in DLC coatings [at/%]
Rem
aini
ng b
acte
ria [C
FU/c
m2 ]
Live bacteriaDead bacteriaTotal bacteria
Figure 7.40 Effect of Boron content in DLC coatings
on the remaining P. aeruginosa cells (Contact time: 18 h)
Figure 7.41 shows that the remaining P. aeruginosa cells (live, dead and total bacteria)
on the B-DLC coatings decreased with the total surface energy of the B-DLC coatings
decreasing.

112
0
50000
100000
150000
200000
250000
20 25 30 35 40 45 50
Total surface energy [mJ/m2]
Rem
aini
ng b
acte
ria [C
FU/c
m2 ]
Live bacteriaDead bacteriaTotal bacteria
Figure 7.41 Effect of surface energy of B-DLC coatings
on the remaining P. aeruginosa cells (Contact time: 18 h).
Figure 7.42 shows the removal percentage of P. aeruginosa cells from the B-DLC
coatings after dipping process. The bacterial removal percentage increased with boron
content in the DLC coating increasing. The removal percentage of live, dead and total
bacteria on the pure DLC coatings was only 20%, 28% and 24%, respectively; while the
removal percentage of live, dead and total bacteria on the 9.5%B- DLC coatings was
increased to 39%, 44% and 41%, respectively. The removal percentage of dead bacteria
was higher than that of live bacteria.
0
10
20
30
40
50
60
DLC 4.9%B-DLC 7.6%B-DLC 9.5%B-DLC
Bac
teria
l rem
oval
[%]
Live bacteria removalDead bacteria removalTotal bacteria removal
Figure 7.42 Removal percentage of P. aeruginosa cells from the B-DLC coatings
after dipping process (Contact time: 18 h).

113
7.2.3.4 Effect of Contact Time on P. aeruginosa Adhesion
Figure 7.43 shows the effect of contact time (1 hour, 5 hour and 18 hours) on the
attachment of live, dead and total P. aeruginosa cells on the B-DLC coatings. When
contact time increased to 5 hours from 1 hour more bacteria attached to each type of the
coatings. However when contact time increased to 18 hours from 5 hour the number of
adhered bacteria on the coatings decreased. Due to lack of nutrients, the number of dead
P. aeruginosa cells in bacterial suspension and on the coatings increased with time
increasing. As a result, less bacteria attached to the coatings and some adhered bacteria
were also detached from the coatings (Zhao et al 2007, 2008).
0
20000
4000060000
80000
100000
120000
140000
160000
180000
200000
DLC 4.9%B-DLC 7.6%B-DLC 9.5%B-DLC
Adh
ered
live
bac
teria
[CFU
/cm
2 ] Contact time: 1 hContact time: 5 hContact time: 18 h
(a)
0
20000
40000
60000
80000
100000
120000
140000
160000
180000
DLC 4.9%B-DLC 7.6%B-DLC 9.5%B-DLC
Adh
ered
dea
d ba
cter
ia [C
FU/c
m2 ]
Contact time: 1 hContact time: 5 hContact time: 18 h
(b)

114
0
50000
100000
150000
200000
250000
300000
350000
400000
DLC 4.9%B-DLC 7.6%B-DLC 9.5%B-DLC
Adh
ered
tota
l bac
teria
[CFU
/cm
2 ]
Contact time: 1 hContact time: 5 hContact time: 18 h
(c)
Figure 7.43 Effect of contact time on the attachment of live (a), dead (b) and total (c)
P. aeruginosa cells on B-DLC coatings
Figure 7.44 shows the effect of contact time (1 hour, 5 hour and 18 hours) on the
removal of live, dead and total P. aeruginosa cells on the B-DLC coatings. For contact
time 1 hour, the bacterial removal percentage was much higher than those for contact
time 5 h and 18 h. For contact time 1 h, the initial bacterial adhesion to the coatings was
weak. However when contact time increased to 5 h or 18 h, the bacterial adhesion
strength increased significantly as live bacteria on the coatings started producing sticky
exopolymer (Bos R et al., 1999). This explains Figure 7.44a why the bacterial removal
percentage for contact time 1 hour was higher than that for contact time 5 h or 18 h. For
Figure 7.44b, most bacteria on the coatings had produced exopolymer after 5 or 18 h
contact before they were dead, so the dead bacterial adhesion strength was higher than
the dead bacteria for contact time 1 h.

115
0
10
20
30
40
50
60
70
80
DLC 4.9%B-DLC 7.6%B-DLC 9.5%B-DLC
Live
bac
teria
l rem
oval
[%]
Contact time: 1 hContact time: 5 hContact time: 18 h
(a)
0
10
20
3040
50
60
70
80
90
DLC 4.9%B-DLC 7.6%B-DLC 9.5%B-DLC
Dea
d ba
cter
ial r
emov
al [%
] Contact time: 1 hContact time: 5 hContact time: 18 h
(b)
0
102030
4050
60
7080
90
DLC 4.9%B-DLC 7.6%B-DLC 9.5%B-DLC
Tota
l bac
teria
l rem
oval
[%] Contact time: 1 h
Contact time: 5 hContact time: 18 h
(c)
Figure 7.44 Effect of contact time on the removal of live (a), dead (b) and total (c)
P. aeruginosa cells on B-DLC coatings

116
7.2.3.5 Contact time 1 h with S. epidermidis
The B-DLC coatings were evaluated with S. epidermidis and very similar results to P.
aeruginosa were obtained. The number of adhered S. epidermidis cells (live, dead and
total bacteria) decreased linearly with boron content increasing (Figure 7.45), but
decreased with the total surface energy of the B-DLC coatings decreasing (Figure 7.46).
The 9.5% B-DLC performed best, which reduced total bacterial adhesion by 57%,
compared with pure DLC coating.
0
50000
100000
150000
200000
250000
300000
DLC 4.9%B-DLC 7.6%B-DLC 9.5%B-DLC
Adh
ered
bac
teria
[CFU
/cm
2 ]
Live bacteriaDead bacteriaTotal bacteria
Figure 7.45 Attachment of S. epidermidis cells on the B-DLC coatings
(Contact time: 1 h)
0
50000
100000
150000
200000
250000
300000
20 25 30 35 40 45 50
Total surface energy of DLC coatings [mJ/m2]
Adh
ered
bac
teria
[CFU
/cm
2 ]
Live bacteriaDead bacteriaTotal bacteria
Figure 7.46 Effect of surface energy of B-DLC coatings on the attachment of live, dead
and total S. epidermidis cells (Contact time: 1 h)
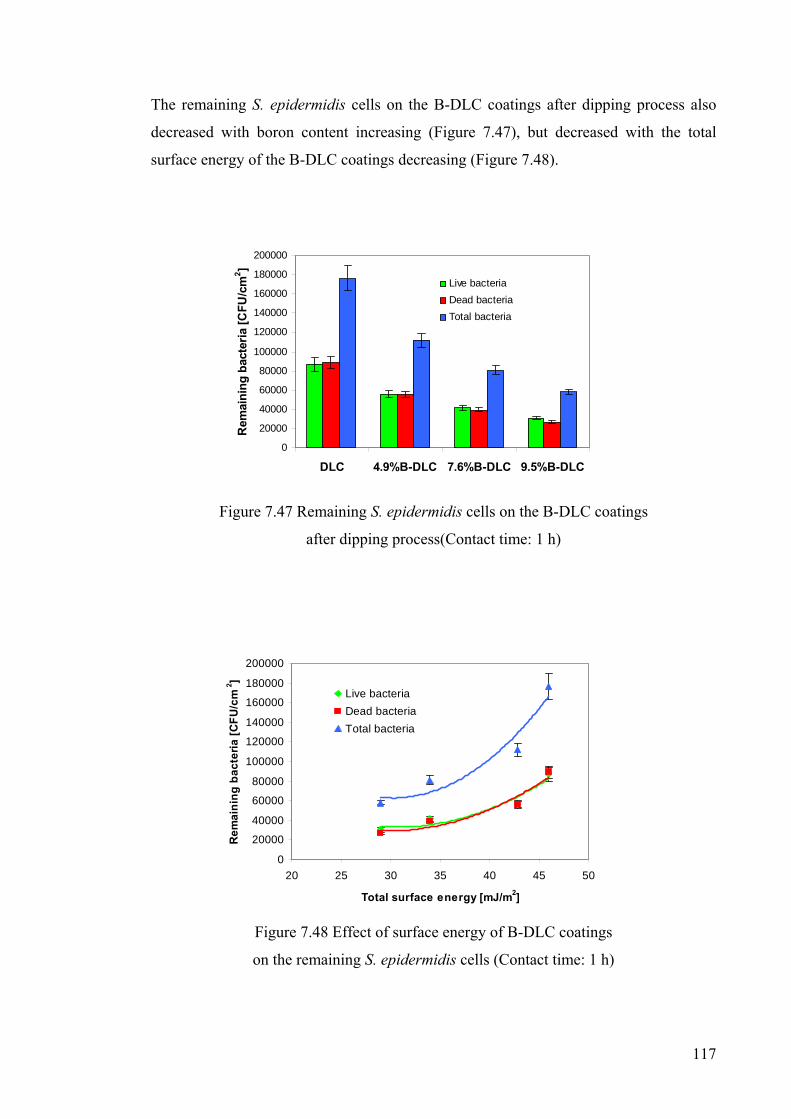
117
The remaining S. epidermidis cells on the B-DLC coatings after dipping process also
decreased with boron content increasing (Figure 7.47), but decreased with the total
surface energy of the B-DLC coatings decreasing (Figure 7.48).
0
20000
40000
60000
80000
100000
120000
140000
160000
180000
200000
DLC 4.9%B-DLC 7.6%B-DLC 9.5%B-DLC
Rem
aini
ng b
acte
ria [C
FU/c
m2 ]
Live bacteriaDead bacteriaTotal bacteria
Figure 7.47 Remaining S. epidermidis cells on the B-DLC coatings
after dipping process(Contact time: 1 h)
0
20000
40000
60000
80000
100000
120000
140000
160000
180000
200000
20 25 30 35 40 45 50
Total surface energy [mJ/m2]
Rem
aini
ng b
acte
ria [C
FU/c
m2 ]
Live bacteriaDead bacteriaTotal bacteria
Figure 7.48 Effect of surface energy of B-DLC coatings
on the remaining S. epidermidis cells (Contact time: 1 h)

118
The removal percentage of S. epidermidis cells from the B-DLC coatings after dipping
process increased with boron content in the DLC coating increasing, as shown in Figure
7.49. The removal percentage of live, dead and total bacteria on the 9.5% B-DLC
coatings was 40%, 50% and 45% respectively; while the removal percentage on the
pure DLC coatings was only 24%, 28% and 26%.
0
10
20
30
40
50
60
70
DLC 4.9%B-DLC 7.6%B-DLC 9.5%B-DLC
Bac
teria
l rem
oval
[%]
Live bacteria removalDead bacteria removalTotal bacteria removal
Figure 7.49 Removal percentage of S. epidermidis cells from the B-DLC coatings
after dipping process (Contact time: 1 h)
7.2.3.6 Contact time 5 h with S. epidermidis
The results for contact time 5 h show that the number of adhered S. epidermidis cells
(live, dead and total bacteria) decreased linearly with boron content increasing (Figure
7.50), but decreased with the total surface energy of the B-DLC coatings decreasing
(Figure 7.51). The 9.5% B-DLC performed best, which reduced bacterial adhesion (live,
dead and total bacteria) by 41%, 46% and 44% respectively, compared with pure DLC
coating.

119
0
50000
100000
150000
200000
250000
300000
350000
DLC 4.9%B-DLC 7.6%B-DLC 9.5%B-DLC
Adh
ered
bac
teria
[CFU
/cm
2 ]
Live bacteriaDead bacteriaTotal bacteria
Figure 7.50 Attachment of S. epidermidis cells on the B-DLC coatings
(Contact time: 5 h)
0
50000
100000
150000
200000
250000
300000
350000
20 25 30 35 40 45 50
Total surface energy of DLC coatings [mJ/m2]
Adh
ered
bac
teria
[CFU
/cm
2 ]
Live bacteriaDead bacteriaTotal bacteria
Figure 7.51 Effect of surface energy of B-DLC coatings
on the attachment of S. epidermidis cells (Contact time: 5 h)
The remaining S. epidermidis cells on the B-DLC coatings after dipping process
decreased with boron content increasing (Figure 7.52), but decreased with the total
surface energy of the B-DLC coatings decreasing (Figure 7.53). The remaining bacteria
(live, dead and total bacteria) on the 9.5% B-DLC coatings were reduced by 55%, 60%
and 58% respectively, compared with pure DLC coating.

120
0
50000
100000
150000
200000
250000
300000
DLC 4.9%B-DLC 7.6%B-DLC 9.5%B-DLC
Rem
aini
ng b
acte
ria [C
FU/c
m2 ]
Live bacteriaDead bacteriaTotal bacteria
Figure 7.52 Remaining S. epidermidis cells on the B-DLC coatings
after dipping process (Contact time: 5 h)
0
50000
100000
150000
200000
250000
300000
20 25 30 35 40 45 50
Total surface energy [mJ/m2]
Rem
aini
ng b
acte
ria [C
FU/c
m2 ]
Live bacteriaDead bacteriaTotal bacteria
Figure 7.53 Effect of surface energy of B-DLC coatings
on the remaining S. epidermidis cells (Contact time: 5 h)
Figure 7.54 shows the removal percentage of S. epidermidis cells from the B-DLC
coatings after dipping process. The removal percentage of live, dead and total bacteria
increased with boron content in the DLC coating increasing. The removal percentage of

121
live, dead and total bacteria on the pure DLC coatings was only 15%, 25% and 20% ,
respectively; while the removal percentage of live, dead and total bacteria on the
9.5%B- DLC coatings was increased to 36%, 45% and 40% , respectively. Figure 7.54
also indicates that the removal percentage of dead bacteria was higher than that of live
bacteria. This means the dead bacteria were more easily removed than the live bacteria.
0
10
20
30
40
50
60
70
DLC 4.9%B-DLC 7.6%B-DLC 9.5%B-DLC
Bac
teria
l rem
oval
[%]
Live bacteria removalDead bacteria removalTotal bacteria removal
Figure 7.54 Removal percentage of S. epidermidis cells from the B-DLC coatings
after dipping process (Contact time: 5 h)
7.2.3.7 Contact time 18 h with S. epidermidis
For contact time 18 h the number of adhered S. epidermidis cells (live, dead and total
bacteria) decreased linearly with boron content increasing (Figure 7.55), but decreased
with the total surface energy of the B-DLC coatings decreasing (Figure 7.56). The 9.5%
B-DLC performed best, which reduced bacterial adhesion (live, dead and total bacteria)
by 44%, 49% and 46% respectively, compared with pure DLC coating.

122
0
50000
100000
150000
200000
250000
300000
350000
DLC 4.9%B-DLC 7.6%B-DLC 9.5%B-DLC
Adh
ered
bac
teria
[CFU
/cm
2 ]
Live bacteriaDead bacteriaTotal bacteria
Figure 7.55 Attachment of S. epidermidis cells on the B-DLC coatings
(Contact time: 18 h)
0
50000
100000
150000
200000
250000
300000
350000
20 25 30 35 40 45 50
Total surface energy of DLC coatings [mJ/m2]
Adh
ered
bac
teria
[CFU
/cm
2 ]
Live bacteriaDead bacteriaTotal bacteria
Figure 7.56 Effect of surface energy of B-DLC coatings
on the attachment of S. epidermidis cells (Contact time: 18 h)
After dipping process the numbers of remaining S. epidermidis cells (live, dead and
total bacteria) decreased linearly with boron content increasing (Figure 7.57), but
decreased with the total surface energy of the B-DLC coatings decreasing (Figure 7.58).
The remaining bacteria (live, dead and total bacteria) on the 9.5% B-DLC coatings were
reduced by 58%, 61% and 59% respectively, compared with pure DLC coating.

123
0
50000
100000
150000
200000
250000
300000
350000
DLC 4.9%B-DLC 7.6%B-DLC 9.5%B-DLC
Rem
aini
ng b
acte
ria [C
FU/c
m2 ]
Live bacteriaDead bacteriaTotal bacteria
Figure 7.57 Remaining S. epidermidis cells on the B-DLC coatings
after dipping process (Contact time: 18 h).
0
50000
100000
150000
200000
250000
300000
350000
20 25 30 35 40 45 50
Total surface energy [mJ/m2]
Rem
aini
ng b
acte
ria [C
FU/c
m2 ]
Live bacteriaDead bacteriaTotal bacteria
Figure 7.58 Effect of surface energy of B-DLC coatings
on the remaining S. epidermidis cells (Contact time: 18 h).
Figure 7.59 shows the removal percentage of S. epidermidis cells from the B-DLC
coatings after dipping process. The bacterial removal percentage increased with boron
content in the DLC coating increasing. The removal percentage of live, dead and total
bacteria on the pure DLC coatings was only 19%, 27% and 23%, respectively; while the
removal percentage of live, dead and total bacteria on the 9.5%B- DLC coatings was
increased to 39%, 44% and 42%, respectively. The removal percentage of dead bacteria
was higher than that of live bacteria.

124
0
10
20
30
40
50
60
70
80
DLC 4.9%B-DLC 7.6%B-DLC 9.5%B-DLC
Bac
teria
l rem
oval
[%]
Live bacteria removalDead bacteria removalTotal bacteria removal
Figure 7.59 Removal percentage of S. epidermidis cells from the B-DLC coatings
after dipping process (Contact time: 18 h).
7.2.3.8 Effect of Contact Time on S. epidermidis Adhesion
Figure 7.60 shows the effect of contact time (1 hour, 5 hour and 18 hours) on the
attachment of total S. epidermidis cells on the B-DLC coatings. Initially the number of
adhered bacteria increased with contact time increasing until 5 h. However due to lack
of nutrients, some S. epidermidis cells were dead, leading to the number of adhered
bacteria at 18 h was slightly lower than that at 5 h.
0
50000
100000
150000
200000
250000
300000
350000
DLC 4.9%B-DLC 7.6%B-DLC 9.5%B-DLC
Adh
ered
tota
l bac
teria
[CFU
/cm
2 ]
Contact time: 1 hContact time: 5 hContact time: 18 h
Figure 7.60 Effect of contact time on the attachment of
S. epidermidis cells on B-DLC coatings

125
Figure 7.61 shows the effect of contact time (1 hour, 5 hour and 18 hours) on the
removal of total S. epidermidis cells on the B-DLC coatings. For contact time 1 hour,
the bacterial removal percentage was much higher than those for contact time 5 h and
18 h. For contact time 1 h, the initial bacterial adhesion to the coatings was weak.
However when contact time increased to over 5 h, the bacterial adhesion strength
increased significantly as bacteria on the coatings started producing sticky exopolymer
(Bos R et al., 1999).
0
10
20
30
40
50
60
70
80
DLC 4.9%B-DLC 7.6%B-DLC 9.5%B-DLC
Tota
l bac
teria
l rem
oval
[%] Contact time: 1 h
Contact time: 5 hContact time: 18 h
Figure 7.61 Effect of contact time on the removal of
S. epidermidis cells on B-DLC coatings
Summary and discussion:
The experimental results showed that the surface energy of the B-DLC coatings
decreased with increasing B content in the coatings. The incorporation of Boron into the
DLC coatings reduced significantly bacterial attachment and increased bacterial
removal.
It was observed that after the coatings with bacteria were exposed to air for 15 minutes,
some bacteria on the coatings were dead. The numbers of adhered bacteria (live, dead
and total P. aeruginosa and S. epidermidis) decreased with boron content increasing or
with the total surface energy of the B-DLC coatings decreasing. The 9.5% B-DLC
performed best, which reduced total bacterial adhesion by up to 70%, compared with
pure DLC coating.

126
In order to assess the adhesion strength of the attached bacteria, some bacteria on the
coatings were removed through the dipping process. The numbers of remaining bacteria
(live, dead and total P. aeruginosa and S. epidermidis) also decreased with boron
content increasing or with the total surface energy of the B-DLC coatings decreasing.
The remaining bacteria (live, dead and total bacteria) on the 9.5% B-DLC coatings were
reduced by up to 87%, 77% and 83% respectively, compared with pure DLC coating.
The removal percentage of the bacteria (live, dead and total P. aeruginosa and S.
epidermidis) increased with boron content increasing or with the total surface energy of
the B-DLC coatings decreasing. The removal percentage of live, dead and total bacteria
on the 9.5% B-DLC coatings increased by up to 207%, 142% and 164% respectively,
compared with pure DLC coatings. The dead bacteria were more easily removed than
the live bacteria.
In this study the contact time (1 hour, 5 hour and 18 hours) had significant influence on
the attachment of live, dead and total P. aeruginosa and S. epidermidis cells on the B-
DLC coatings. In general, the numbers of adhered bacteria increased with contact time
increasing. However when contact time increased to 18 hours the number of adhered
bacteria on the coatings decreased due to lack of nutrients for bacteria to survive. The
contact time also had significant influence on the bacterial removal. For contact time 1
hour, the bacterial removal percentage was much higher than those for contact time 5 h
and 18 h as bacteria on the coatings started producing sticky exopolymer with contact
time increasing.
7.2.4 Ti-Doped DLC Coatings
The detailed procedure for preparing titanium-doped DLC coatings is given in Section
4.2.4. The chemical composition, contact angle and surface energy components of Ti-
doped DLC coatings are given in Table 5.8.
These coatings were evaluated for attachment and removal with E. coli for contact time
1 h and 5h. The detailed procedures of bacterial adhesion and removal are described in
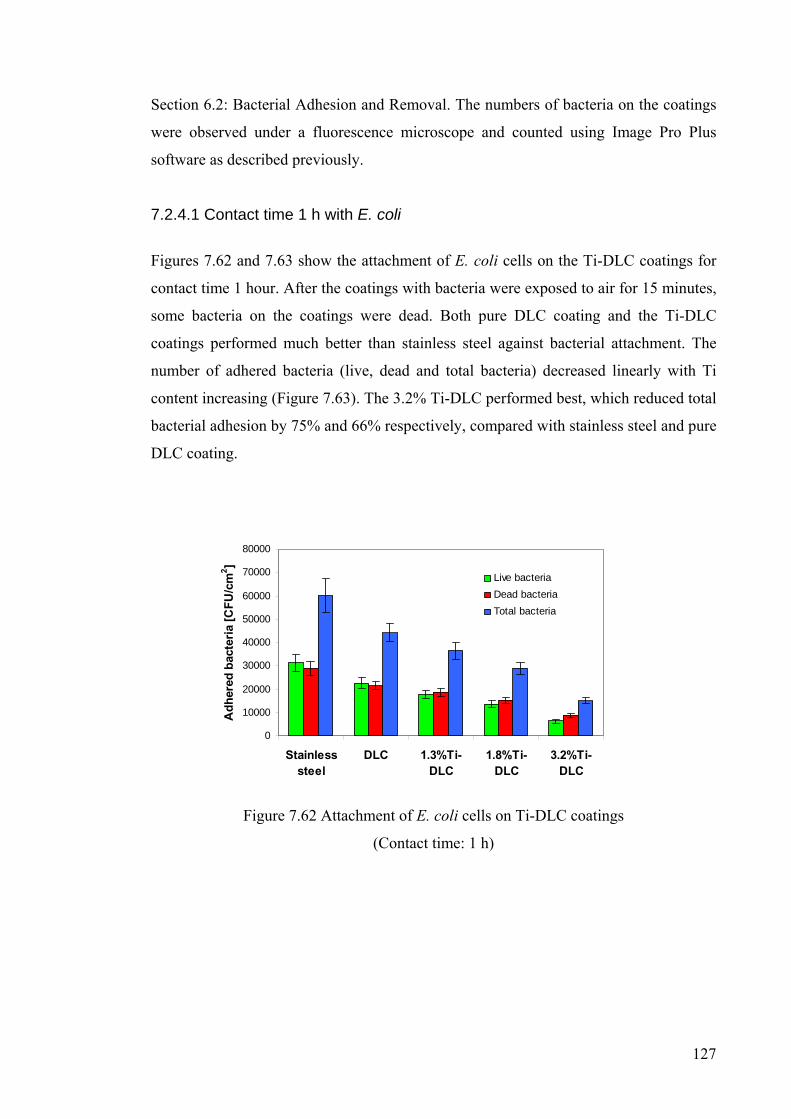
127
Section 6.2: Bacterial Adhesion and Removal. The numbers of bacteria on the coatings
were observed under a fluorescence microscope and counted using Image Pro Plus
software as described previously.
7.2.4.1 Contact time 1 h with E. coli
Figures 7.62 and 7.63 show the attachment of E. coli cells on the Ti-DLC coatings for
contact time 1 hour. After the coatings with bacteria were exposed to air for 15 minutes,
some bacteria on the coatings were dead. Both pure DLC coating and the Ti-DLC
coatings performed much better than stainless steel against bacterial attachment. The
number of adhered bacteria (live, dead and total bacteria) decreased linearly with Ti
content increasing (Figure 7.63). The 3.2% Ti-DLC performed best, which reduced total
bacterial adhesion by 75% and 66% respectively, compared with stainless steel and pure
DLC coating.
0
10000
20000
30000
40000
50000
60000
70000
80000
Stainlesssteel
DLC 1.3%Ti-DLC
1.8%Ti-DLC
3.2%Ti-DLC
Adh
ered
bac
teria
[CFU
/cm
2 ]
Live bacteriaDead bacteriaTotal bacteria
Figure 7.62 Attachment of E. coli cells on Ti-DLC coatings
(Contact time: 1 h)

128
0
10000
20000
30000
40000
50000
60000
-1 0 1 2 3 4 5 6
Titanium content in DLC coatings [at.%]
Adh
ered
bac
teria
[CFU
/cm
2 ]
Live bacteriaDead bacteriaTotal bacteria
Figure 7.63 Effect of Titanium content on the attachment of E. coli cells
on Ti-DLC coatings (Contact time: 1 h)
The improved anti-bacterial properties of Ti-DLC coatings with Ti content increasing
could be due to electron donor γ − increasing and titanium oxide (e.g. TiOx or TiO2)
increasing.
Table 5.8 indicates that the −γ surface energy component of Ti-DLC coatings increased
with Ti content increasing. In general bacteria are negatively charged. It was reported
that the larger the electron donor component −γ of a surface, the more negatively
charged the surface (Chibowski et al. 1994). Therefore bacterial adhesion should
decrease with increasing electron donor −γ values of the coatings if other parameters
that affect bacterial adhesion are identical. In this study the total surface energies of Ti-
DLC coatings were almost same, about 44 mJ/m2, but −γ values were changed in the
range of 4.47- 9.83 mJ/m2 (see Table 5.8).
Figure 7.64 shows that the live, dead and total E. coli cells on the Ti-DLC coatings
decreased linearly with the −γ surface energy of the Ti-DLC coatings increasing.

129
0
10000
20000
30000
40000
50000
60000
2 4 6 8 10 12
γ- surface energy of Ti-DLC coatings [mJ/m2]
Adh
ered
bac
teria
[CFU
/cm
2 ]
Live bacteriaDead bacteriaTotal bacteria
Figure 7.64 Effect of −γ surface energy of Ti-DLC coatings
on the attachment of E. coli cells (Contact time: 1 h)
The microbiocidal effect of TiO2 photocatalytic reactions was first reported by
Matsunaga et al (1985). The microbiocidal mechanisms of TiO2 photocatalysts have
been investigated in details by Huang et al (2000) and Wang et al (2000). It is suggested
that TiO2 photocatalysts generate strong oxidizing power when illuminated with UV
light with wave-lengths of less than 385 nm. The initial oxidative damage takes place on
the cell wall when contact with the TiO2 photocatalytic surface. Then the further
oxidative damage takes place on the underlying cytoplasmic membrane, leading to cell
death. Kikuchi et al. (1997) showed that TiO2 films coated on different substrates such
as glass, tiles and stainless steel possessed antibacterial functions under weak ultraviolet
light in living areas and the viable number of Escherichia coli significantly decreased
on the illuminated TiO2 film. Li and Logan (2005) reported that bacterial adhesion on
TiO2 coated surfaces reduced significantly after exposed UV light. In this study all the
Ti-DLC coatings had been treated with UV light for 1 hour before they were tested with
bacteria.
Figure 7.65 shows that the ratio of dead E. coli cells to total E. coli cells on the coatings
increased slightly with Ti content increasing after they had been immerged in bacterial
suspension for 1 h and then exposed to air for 15 minutes.

130
0.0
10.0
20.0
30.0
40.0
50.0
60.0
70.0
80.0
Stainlesssteel
DLC 1.3%Ti-DLC
1.8%Ti-DLC
3.2%Ti-DLC
Dea
d ba
cter
ia/to
tal b
acte
ria [%
]
Figure 7.65 Effect of Ti content on the ratio of dead/total E. coli cells
(contact time: 1 hour)
In order to assess the adhesion strength of the attached bacteria, each sample with
bacteria was dipped 20 times vertically in a glass vessel containing 130 ml sterile
distilled water at 37 ˚C at a constant shear stress of 0.014 N m-2. During the dipping
process, some bacteria were removed from the coatings. Figure 7.66 and Figure 7.67
show that the numbers of remaining bacteria (live, dead and total bacteria) decreased
linearly with Ti content increasing.
0
10000
20000
30000
40000
50000
60000
Stainlesssteel
DLC 1.3%Ti-DLC
1.8%Ti-DLC
3.2%Ti-DLC
Rem
aini
ng b
acte
ria [C
FU/c
m2 ]
Live bacteriaDead bacteriaTotal bacteria
Figure 7.66 Remaining E. coli cells on Ti-DLC coatings
after dipping process (Contact time: 1 h)

131
0
10000
20000
30000
40000
50000
60000
-1 0 1 2 3 4 5 6
Titanium content in DLC coatings [at/%]
Rem
aini
ng b
acte
ria [C
FU/c
m2 ]
Live bacteriaDead bacteriaTotal bacteria
Figure 7.67 Effect of Ti content in DLC coatings
on the remaining E. coli cells (Contact time: 1 h)
Figure 7.68 shows that the remaining E. coli cells (live, dead and total bacteria) on the
Ti-DLC coatings decreased linearly with the −γ surface energy of the Ti-DLC coatings
increasing.
0
10000
20000
30000
40000
50000
60000
2 4 6 8 10 12
γ- surface energy of Ti-DLC coatings [mJ/m2]
Rem
aini
ng b
acte
ria [C
FU/c
m2 ] Live bacteriaDead bacteriaTotal bacteria
Figure 7.68 Effect of −γ surface energy of Ti-DLC coatings
on the remaining E. coli cells (Contact time: 1 h)

132
Figure 7.69 shows that the removal percentage of E. coli cells from the Ti-DLC
coatings after dipping process increased with Ti content in the DLC coating increasing.
The removal percentages of live, dead and total bacteria on the 3.2% Ti-DLC coatings
increased by 215%, 206% and 214% respectively, compared with stainless steel.
0
10
20
30
40
50
60
70
Stainlesssteel
DLC 1.3%Ti-DLC
1.8%Ti-DLC
3.2%Ti-DLC
Bac
teria
l rem
oval
[%]
Live bacteria removalDead bacteria removalTotal bacteria removal
Figure 7.69 Removal percentage of E. coli cells from Ti-DLC coatings
after dipping process (Contact time: 1 h)
7.2.4.2 Contact time 5 h with E. coli
Figures 7.70 and 7.71 show the attachment of E. coli cells on the Ti-DLC coatings for
contact time 5 hour. The number of adhered bacteria (live, dead and total bacteria)
decreased linearly with Ti content increasing. The 3.2% Ti-DLC performed best, which
reduced bacterial adhesion (live, dead and total bacteria) by 75%, 66% and 71%
respectively, compared with stainless steel.
Figure 7.72 shows that the live, dead and total E. coli cells on the Ti-DLC coatings
decreased with the −γ surface energy of the Ti-DLC coatings increasing. The results
were consistent with previous results on the effect of surface energy on bacterial
adhesion.

133
0
10000
20000
30000
40000
50000
60000
70000
80000
90000
Stainlesssteel
DLC 1.3%Ti-DLC
1.8%Ti-DLC
3.2%Ti-DLC
Adh
ered
bac
teria
[CFU
/cm
2 ]
Live bacteriaDead bacteriaTotal bacteria
Figure 7.70 Attachment of E. coli cells on Ti-DLC coatings
(Contact time: 5 h)
0
10000
20000
30000
40000
50000
60000
-1 0 1 2 3 4 5 6
Titanium content in DLC coatings [at.%]
Adh
ered
bac
teria
[CFU
/cm
2 ]
Live bacteriaDead bacteriaTotal bacteria
Figure 7.71 Effect of Ti content on the attachment of E. coli cells
on Ti-DLC coatings (Contact time: 5 h)

134
0
10000
20000
30000
40000
50000
60000
2 4 6 8 10 12
γ- surface energy of Ti-DLC coatings [mJ/m2]
Adh
ered
bac
teria
[CFU
/cm
2 ]
Live bacteriaDead bacteriaTotal bacteria
Figure 7.72 Effect of −γ surface energy of Ti-DLC coatings
on the attachment of E. coli cells (Contact time: 5 h)
Figure 7.73 shows that the ratio of dead E. coli cells to total E. coli cells increased
slightly with Ti content increasing after they had been immerged in bacterial suspension
for 5 h and then exposed to air for 15 minutes.
0.0
10.0
20.0
30.0
40.0
50.0
60.0
70.0
80.0
Stainlesssteel
DLC 1.3%Ti-DLC
1.8%Ti-DLC
3.2%Ti-DLC
Dea
d ba
cter
ia/to
tal b
acte
ria [%
]
Figure 7.73 Effect of Ti content on the ratio of dead/total E. coli cells
(contact time: 5 hours)
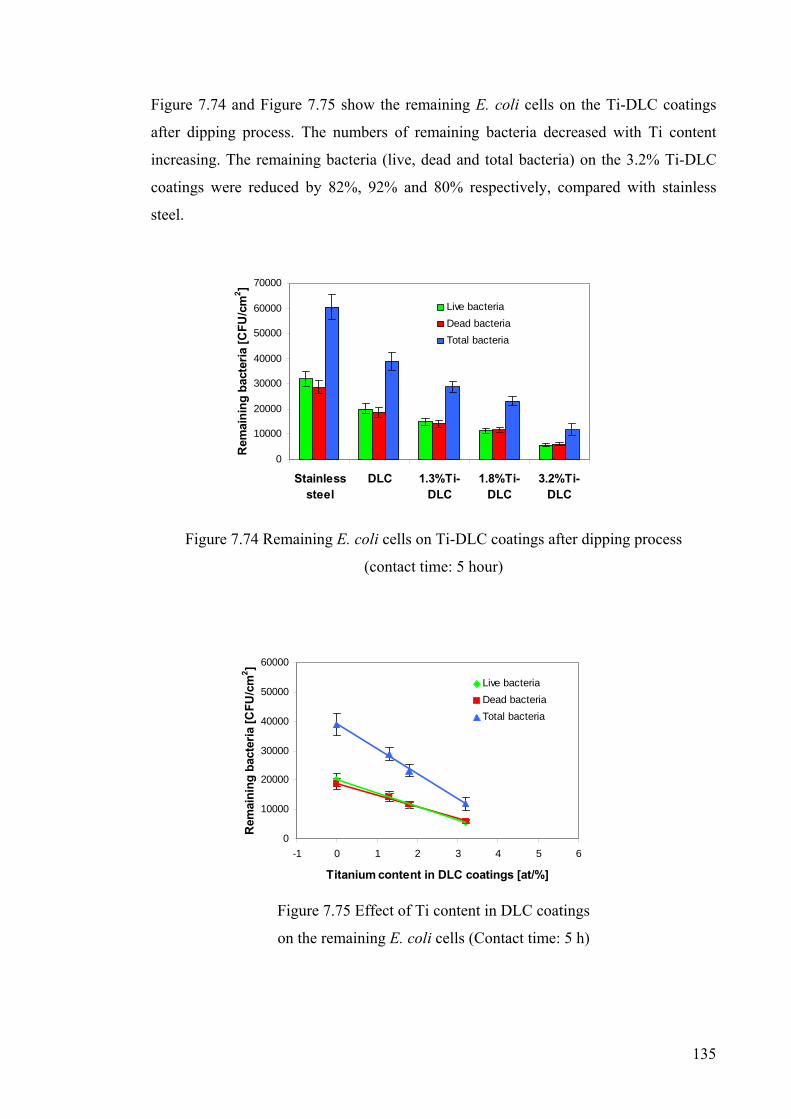
135
Figure 7.74 and Figure 7.75 show the remaining E. coli cells on the Ti-DLC coatings
after dipping process. The numbers of remaining bacteria decreased with Ti content
increasing. The remaining bacteria (live, dead and total bacteria) on the 3.2% Ti-DLC
coatings were reduced by 82%, 92% and 80% respectively, compared with stainless
steel.
0
10000
20000
30000
40000
50000
60000
70000
Stainlesssteel
DLC 1.3%Ti-DLC
1.8%Ti-DLC
3.2%Ti-DLC
Rem
aini
ng b
acte
ria [C
FU/c
m2 ]
Live bacteriaDead bacteriaTotal bacteria
Figure 7.74 Remaining E. coli cells on Ti-DLC coatings after dipping process
(contact time: 5 hour)
0
10000
20000
30000
40000
50000
60000
-1 0 1 2 3 4 5 6
Titanium content in DLC coatings [at/%]
Rem
aini
ng b
acte
ria [C
FU/c
m2 ]
Live bacteriaDead bacteriaTotal bacteria
Figure 7.75 Effect of Ti content in DLC coatings
on the remaining E. coli cells (Contact time: 5 h)

136
Figure 7.76 shows that the remaining E. coli cells (live, dead and total bacteria) on the
Ti-DLC coatings decreased with the −γ surface energy of the Ti-DLC coatings
increasing.
0
10000
20000
30000
40000
50000
60000
2 4 6 8 10 12
γ- surface energy of Ti-DLC coatings [mJ/m2]
Rem
aini
ng b
acte
ria [C
FU/c
m2 ] Live bacteria
Dead bacteriaTotal bacteria
Figure 7.76 Effect of −γ surface energy of Ti-DLC coatings
on the remaining E. coli cells (Contact time: 5 h)
Figure 7.77 shows the removal percentage of E. coli cells from the Ti-DLC coatings
after dipping process. The removal percentage of live, dead and total bacteria increased
with Ti content in the DLC coating increasing. The removal percentage of live, dead
and total bacteria on the 3.2%Ti-DLC coatings was increased by 127%, 150% and
142% respectively, compared with stainless steel. Figure 7.77 also indicates that the
removal percentage of dead bacteria was higher than that of live bacteria. This means
the dead bacteria were more easily removed than the live bacteria.

137
0
10
20
30
40
50
60
70
Stainlesssteel
DLC 1.3%Ti-DLC
1.8%Ti-DLC
3.2%Ti-DLC
Bac
teria
l rem
oval
[%]
Live bacteria removalDead bacteria removalTotal bacteria removal
Figure 7.77 Removal percentage of E. coli cells from Ti-DLC coatings
after dipping process (Contact time: 5 h)
7.2.4.3 Effect of Contact Time on E. coli Adhesion
Figure 7.78 shows the effect of contact time (1 hour, 5 hour) on the attachment of live,
dead and total E. coli cells on the Ti-DLC coatings. As expected, when contact time
increased to 5 hours from 1 hour more bacteria attached to each type of the coatings.
Figure 7.79 shows the effect of contact time (1 hour, 5 hour) on the removal of live,
dead and total E. coli cells on the Ti-DLC coatings. The bacterial removal percentage at
contact time 5 hour was higher than that at contact time 1 h. The results were not
consistent to the B-DLC coatings. In general, when contact time increased to 5 h the
bacterial adhesion strength increased as live bacteria on the coatings started producing
sticky exopolymer. However as the Ti-DLC coatings may be toxic to the bacteria, the
bacterial adhesion may decrease with contact time increasing. This may explain why
the bacterial removal percentage for contact time 5 hour was slightly higher than that for
contact time 1 h.

138
0
10000
20000
30000
40000
50000
60000
Stainlesssteel
DLC 1.3%Ti-DLC
1.8%Ti-DLC
3.2%Ti-DLC
Adh
ered
live
bac
teria
[CFU
/cm
2 ]
Contact time: 1 hContact time: 5 h
(a)
0
10000
20000
30000
40000
50000
60000
Stainlesssteel
DLC 1.3%Ti-DLC
1.8%Ti-DLC
3.2%Ti-DLC
Adh
ered
dea
d ba
cter
ia [C
FU/c
m2 ]
Contact time: 1 hContact time: 5 h
(b)
0100002000030000400005000060000700008000090000
Stainlesssteel
DLC 1.3%Ti-DLC
1.8%Ti-DLC
3.2%Ti-DLC
Adh
ered
tota
l bac
teria
[CFU
/cm
2 ]
Contact time: 1 hContact time: 5 h
(c)
Figure 7.78 Effect of contact time on the attachment of live (a), dead (b) and total (c)
E. coli cells on Ti-DLC coatings

139
0
10
20
30
40
50
60
70
80
Stainlesssteel
DLC 1.3%Ti-DLC
1.8%Ti-DLC
3.2%Ti-DLC
Live
bac
teria
l rem
oval
[%] Contact time: 1 h
Contact time: 5 h
(a)
0
10
20
30
40
50
60
70
80
Stainlesssteel
DLC 1.3%Ti-DLC
1.8%Ti-DLC
3.2%Ti-DLC
Dea
d ba
cter
ial r
emov
al [%
] Contact time: 1 hContact time: 5 h
(b)
0
1020
30
40
50
60
70
80
Stainlesssteel
DLC 1.3%Ti-DLC
1.8%Ti-DLC
3.2%Ti-DLC
Tota
l bac
teria
l rem
oval
[%]
Contact time: 1 hContact time: 5 h
(c)
Figure 7.79 Effect of contact time on the removal of live (a), dead (b) and total (c)
E. coli cells on Ti-DLC coatings

140
Summary and discussion:
The experimental results showed that the total surface energies of Ti-DLC coatings
were almost same, about 44 mJ/m2, but −γ values were changed in the range of 4.47-
9.83 mJ/m2 (see Table 5.8).
It was observed that after the coatings with bacteria were exposed to air for 15 minutes,
some bacteria on the coatings were dead. The numbers of adhered bacteria (live, dead
and total E. coli cells) decreased with Ti content or −γ values increasing. The 3.2% Ti-
DLC performed best, which reduced total bacterial adhesion by 75% and 66%
respectively, compared with stainless steel and pure DLC coating.
The removal percentage of the bacteria (live, dead and total E. coli cells) increased with
Ti content or −γ values increasing. The removal percentage of live, dead and total
bacteria on the 3.2%Ti-DLC coatings was increased by 127%, 150% and 142%
respectively, compared with stainless steel. The dead bacteria were more easily
removed than the live bacteria.
In this study the contact time (1 hour, 5 hour) had significant influence on the
attachment of E. coli cells on the Ti-DLC coatings. In general, the numbers of adhered
bacteria increased with contact time increasing. The Ti-DLC coatings may be toxic to
bacteria due to the formation TiOx or TiO2. Further study is required to confirm the
existence of TiOx or TiO2 in the Ti-DLC coatings.
7.3 SiOx-like Coatings
The detailed procedure for preparing SiOx-like coatings is given in Section 4.3. The
chemical composition, contact angle and surface energy components of the SiOx-like
coatings are given in Table 5.9.
These coatings were evaluated for attachment and removal with P. fluorescens for
contact time 1 h. The detailed procedures of bacterial adhesion and removal are
described in Section 6.2: Bacterial Adhesion and Removal.

141
First group of SiOx-like coatings: Figure 7.80 shows the initial attachment of P. fluorescens cells on the first group of
SiOx-like coatings (see Table 5.9). S7-1, S7-2 and S7-3 with lower surface energy (23
mJ/m2) performed best against bacterial attachment. Figure 7.81 shows that the number
of adhered bacteria increased with increasing total surface energy of the coatings.
0
2000
4000
6000
8000
10000
12000
S1 S2 S3 S4 S5 S6 S7 S7-1 S7-2 S7-3
Adh
ered
bac
teria
[CFU
/cm
2 ]
Figure 7.80 Initial attachment of P. fluorescens cells on SiOx-like coatings
y = 374.84x - 8150.4R2 = 0.9639
0
2000
4000
6000
8000
10000
12000
15 20 25 30 35 40 45 50
Total surface energy γTot [mJ/m2]
Adh
ered
bac
teria
[CFU
/cm
2 ]
Figure 7.81: Effect of total surface energy of SiOx-like coatings
on the attachment of P. fluorescens

142
Figure 7.82 shows the removal of P. fluorescens cells from the SiOx-like coatings. S2
with the highest surface energy (45.7 mJ/m2) had the lowest bacterial removal rate
(7.5% cells removed). Figure 7.83 shows that the bacterial removal rate decreased with
increasing total surface energy of the SiOx-like coatings.
0.0
20.0
40.0
60.0
80.0
100.0
120.0
S1 S2 S3 S4 S5 S6 S7 S7-1 S7-2 S7-3
Bac
teria
l Rem
oval
[%]
Figure 7.82 Removal of P. fluorescens cells from SiOx-like coatings
y = 3E+06x-3.3212
R2 = 0.9119
0.0
20.0
40.0
60.0
80.0
100.0
120.0
15 20 25 30 35 40 45 50
Total surface energy γTot [mJ/m2]
Bac
teria
l rem
oval
[%]
Figure 7.83: Effect of total surface energy of SiOx-like coatings
on removal of biofilm of P. fluorescens cells
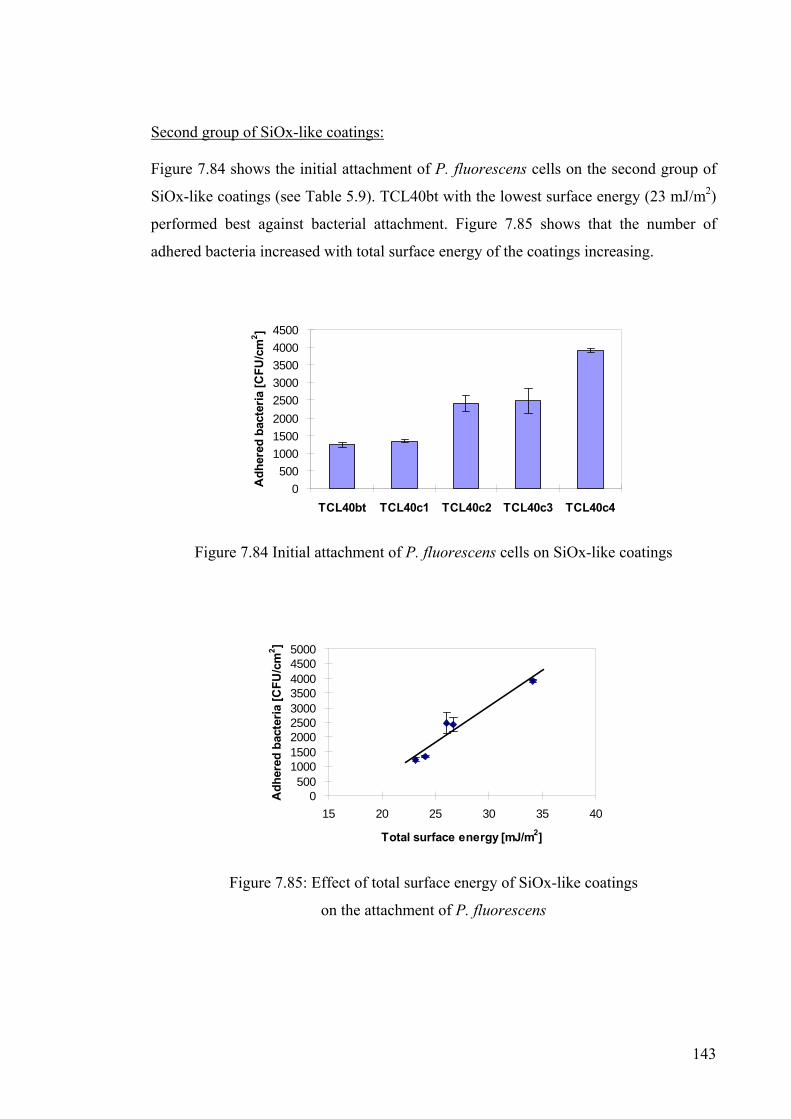
143
Second group of SiOx-like coatings: Figure 7.84 shows the initial attachment of P. fluorescens cells on the second group of
SiOx-like coatings (see Table 5.9). TCL40bt with the lowest surface energy (23 mJ/m2)
performed best against bacterial attachment. Figure 7.85 shows that the number of
adhered bacteria increased with total surface energy of the coatings increasing.
0500
10001500200025003000350040004500
TCL40bt TCL40c1 TCL40c2 TCL40c3 TCL40c4
Adh
ered
bac
teria
[CFU
/cm
2 ]
Figure 7.84 Initial attachment of P. fluorescens cells on SiOx-like coatings
0500
100015002000250030003500400045005000
15 20 25 30 35 40
Total surface energy [mJ/m2]
Adh
ered
bac
teria
[CFU
/cm
2 ]
Figure 7.85: Effect of total surface energy of SiOx-like coatings
on the attachment of P. fluorescens

144
Figure 7.86 shows the removal of P. fluorescens cells from the SiOx-like coatings.
TCL40bt with the lowest surface energy (23 mJ/m2) had the highest removal rate.
Figure 7.87 shows that the bacterial removal rate decreased with increasing total surface
energy.
0
20
40
60
80
100
120
TCL40bt TCL40c1 TCL40c2 TCL40c3 TCL40c4
Bac
teria
l rem
oval
[%]
Figure 7.86 Removal of P. fluorescens cells from SiOx-like coatings
0
20
40
60
80
100
120
15 20 25 30 35 40
Total surface energy [mJ/m2]
Bac
teria
l rem
oval
[%]
Figure 7.87: Effect of total surface energy of SiOx-like coatings
on removal of biofilm of P. fluorescens cells
Summary and discussion:
Surface energy has a significant influence on bacterial adhesion. It can be seen that the
number of adhered bacteria increased with increasing surface energy. When the surface
energy of the coatings was 23 mN/m (S7-1, TCL40bt), the number of adhered bacteria
was lowest. Zhao et al. (2004; 2007a) derived the optimum surface energy component

145
of a substrate, for which bacterial adhesion force is minimal, using the extended DLVO
theory. According to the optimum surface energy equation, the theoretical value of
surface energy of coatings to minimize the adhesion P. fluorescens is 21 mN/m. This
value is also within the optimum range of the surface energy of a surface (20 - 30 mJ/m2)
to inhibit biofouling that Baier and Meyer (1992) recommend. Bacterial removal
decreased with increasing surface energy, i.e. the adhesion strength increased with
increasing surface energy. When the surface energy of the coatings was 23 mN/m (S7-1
or TCL40bt), the bacterial adhesion strength to the coatings was weakest. The results
are consistent with the findings by Zhao et al. (2004; 2007a) on the optimum surface
energy component of a substrate.
7.4 B- and Ti-DLC Coatings for Protein Removal The detailed procedure for preparing B-DLC coatings and Ti-DLC coatings is given in
Section 4.2.4. The chemical composition, contact angle and surface energy components
of the coatings are given in Table 5.8. The detailed procedures of protein removal
assays are described in Section 6.4: Protein Removal Assays. In brif, all the coatings
were treated with 100 µg/ml brain homogenate and dried for 24 hours in the room
temperature. Then they were subsequently cleaned using a detergent Decon. The
quantity of protein remaining after cleaning was determined by a fluorescence technique.
The protein removal assays were performed at Barts and London School of Medicine.
Figure 7.88 shows the protein remaining after cleaning with Decon. The 7.6%B-DLC
and 9.5%B-DLC with lower surface energy performed better than others, which reduced
protein adhesion by 88% and 78% respectively, compared with stainless steel and pure
DLC coating.
Figure 7.89 shows that the protein remaining decreased with boron content increasing.
Figure 7.90 shows that the protein remaining decreased with total surface energy of B-
DLC coatings decreasing.

146
050
100150200250300350400
Stainlesssteel
DLC 4.9%B-DLC
7.6%B-DLC
9.5%-B-DLC
Res
idua
l Pro
tein
[ng] After cleaning with Decon
Figure 7.88 Protein remaining after cleaning with Decon
0
50
100
150
200
250
0 2 4 6 8 10
Boron content in DLC Coatings [at%]
Res
idua
l Pro
tein
[ng]
After cleaning with Decon
Figure 7.89 Effect of boron content in DLC coatings on protein remaining
0
50
100
150
200
250
20 30 40 50
Total surface energy of B-DLC Coatings [mJ/m2]
Res
idua
l Pro
tein
[ng]
After cleaning with Decon
Figure 7.90 Effect of total surface energy of B-DLC coatings
on protein remaining

147
Figure 7.91 shows the protein remaining after cleaning with Decon. The Ti-DLC
coatings performed much better than stainless steel and pure DLC coating against
protein adhesion. Figure 7.91 shows that the protein remaining decreased with Ti
content increasing. The 3.2%Ti-DLC coatings performed best, which reduced protein
adhesion by 95% and 91% respectively, compared with stainless steel and pure DLC
coating. Figure 7.92 shows that the protein remaining decreased with −γ surface energy
of Ti-DLC coatings increasing.
0
50
100
150
200
250
300
350
400
StainlessSteel
DLC 1.3%Ti-DLC
1.8%Ti-DLC
3.2%Ti-DLC
Res
idua
l pro
tein
[ng]
Figure 7.91 Protein remaining on Ti-DLC coatings
0
50
100
150
200
250
0 0.5 1 1.5 2 2.5 3 3.5
Titanium content in DLC Coatings [at.%]
Res
idua
l Pro
tein
[ng]
Figure 7.92 Effect of Ti content in DLC coatings on protein remaining

148
0
50
100
150
200
250
2.00 4.00 6.00 8.00 10.00 12.00
γ- surface energy of Ti-DLC coatings [mJ/m2]
Res
idua
l pro
tein
[ng]
Figure 7.93 Effect of total surface energy of Ti-DLC coatings
on protein remaining
Summary and discussion:
The experimental results showed that both type and content of the doped elements in
DLC coatings had significant influence on the protein adhesion. The protein remaining
decreased with boron or titanium content increasing. The protein remaining also
decreased with total surface energy of B-DLC coatings decreasing or with −γ surface
energy of Ti-DLC coatings increasing. The best B and Ti doped DLC coatings reduced
residual protein adhesion by 88% and 95%, respectively, compared with stainless steel.

149
CHAPTER 8 MODELLING OF INTERACTION ENERGIES 8.1 Thermodynamic Approach
A thermodynamic approach offers a useful tool to predict bacterial adhesion to solid
substrates (Busscher HJ et al., 1984). It is based on surface energies of the interacting
surfaces and does not include an explicit role for electrostatic interactions. It is
expressed in terms of work of adhesion as:
BLSLSBadhF γγγ −−=Δ (8.1)
where adhFΔ is the interfacial free energy of adhesion or work of adhesion, SBγ is the
solid-bacteria interfacial free energy, SLγ is the solid-liquid interfacial free energy, and
BLγ is the bacteria-liquid interfacial free energy, whereas bacterial adhesion is
energetically unfavourable if:
0>Δ adhF (8.2)

150
The interfacial free energies in Eq. (8.1) can be calculated from van Oss Acid-Base
Approach.
In the Chapter 5.4.2.3 van Oss Acid-Base Approach, the interfacial free energy of
adhesion of solid-liquid can be calculated by Eq. (5.13), with the same method, the
solid-bacteria and bacteria-liquid interfacial free energies can be express as follows:
)(2 +−−+ ⋅+⋅+⋅−+= BSBSLWB
LWSBSSB γγγγγγγγγ (8.3)
)(2 +−−+ ⋅+⋅+⋅−+= LBLBLWL
LWBLBBL γγγγγγγγγ (8.4)
Combining Eq. (5.13), Eq. (8.1), Eq. (8.3) and Eq. (8.4), the work of adhesion adhFΔ is
obtained:
)
(2
LBSBSLWB
LWS
LBLBLWL
LWBLSLS
LWL
LWSadhF
γγγγγγγ
γγγγγγγγγγγγ
−−−−
+++++=Δ+−−+
+−−++−−+
(8.5)
8.2 Extended DLVO Theory
Derjaguin – Landau – Verwey – Overbeek (DLVO) theory was the first theory to be
used to explain microbial adhesion (Verwey and Overbeek 1955). It includes Lifshitz-
Van de Waals force (LW) and electrostatic force (EL). Later, van Oss (1994) suggested
an extended DLVO theory by including Lewis acid-base (AB) and Brownian motion
interactions (Br). The Lewis acid-base interactions are based on electron-donating ( −γ )
and electron-accepting ( +γ ) interactions between polar moieties in aqueous solutions.
The Brownian motion interactions are kinetic energy of onward motion by any molecule
suspended in liquid. Therefore, microbial adhesion is described as a balance between
attractive LW force, repulsive electrostatic force, AB interaction force and Br force
(Sharma et al, 2002). The total interaction energy TOTE132Δ between a particle 1 and a solid
surface 2 in liquid 3 can be written as the sum of these corresponding interaction terms:
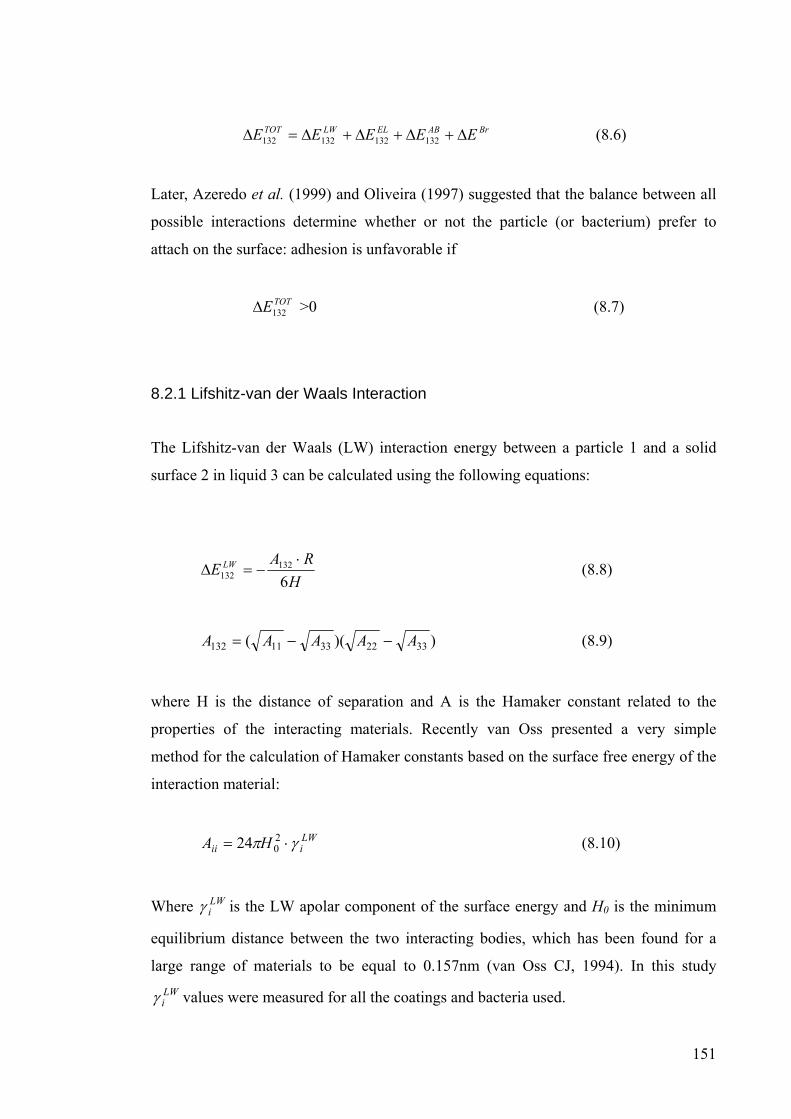
151
BrABELLWTOT EEEEE Δ+Δ+Δ+Δ=Δ 132132132132 (8.6)
Later, Azeredo et al. (1999) and Oliveira (1997) suggested that the balance between all
possible interactions determine whether or not the particle (or bacterium) prefer to
attach on the surface: adhesion is unfavorable if
TOTE132Δ >0 (8.7)
8.2.1 Lifshitz-van der Waals Interaction
The Lifshitz-van der Waals (LW) interaction energy between a particle 1 and a solid
surface 2 in liquid 3 can be calculated using the following equations:
HRA
E LW
6132
132⋅
−=Δ (8.8)
))(( 33223311132 AAAAA −−= (8.9)
where H is the distance of separation and A is the Hamaker constant related to the
properties of the interacting materials. Recently van Oss presented a very simple
method for the calculation of Hamaker constants based on the surface free energy of the
interaction material:
LWiii HA γπ ⋅= 2
024 (8.10)
Where LWiγ is the LW apolar component of the surface energy and H0 is the minimum
equilibrium distance between the two interacting bodies, which has been found for a
large range of materials to be equal to 0.157nm (van Oss CJ, 1994). In this study LWiγ values were measured for all the coatings and bacteria used.

152
Then the LW interaction component between a particle 1 and a solid surface 2 in liquid
3 can be expressed
HRH
ELWLWLWLW
LW
6))((24 3231
20
132
⋅−−−=Δ
γγγγπ (8.11)
8.2.2 Electrostatic Double-Layer Interaction
The electrostatic double layer interaction ELE132Δ for a particle 1 with radius R to a solid
surface 2 in liquid 3 is given by (Bos R et al., 1995):
( ) ( )( ) ( ){ }⎥
⎦
⎤⎢⎣
⎡⋅⋅−−+
⋅−−⋅−+
⋅+⋅⋅
⋅+⋅⋅⋅=Δ HHHRE EL κ
κκ
ζζζζ
ζζεπ 2exp1lnexp1exp1ln2
22
21
2122
21132 (8.12)
where ε is the electrical permittivity of the solution; κ is the Debye-Hückel parameter
(1/κ =1.1nm). ζ is the zeta potential of the particle or the solid surface. ε (ε0 εr) is
permittivity. ε0 is permittivity under vacuum 8.85×10⁻¹² J m-1 V-2, and εr is relative
dielectric permittivity of water (78.54 for water).
8.2.3 Lewis Acid/Base Interaction
van Oss (1994) extended the DLVO theory by including the Lewis acid/base (AB)
interaction ABE132Δ between the particle 1 and the surface 2 in medium 3 :
⎟⎠⎞
⎜⎝⎛ −
Δ=Δλ
λπHH
ERE ABH
AB 0)(132132 exp2
0 (8.13)
( ) ( )⎥⎥
⎦
⎤
⎢⎢
⎣
⎡
−⋅−
−+⋅+−+⋅=Δ
+−−+
+++−−−−+
2121
32133213)(132 2
0
γγγγ
γγγγγγγγAB
HE (8.14)

153
where λ is the correlation length of the molecules of the liquid medium, which is in the
range of 0.2~1.0 nm (Israelachvili 1985). For pure water, λ = 0.2 nm (Oliveira 1997).
For water +3γ = −
3γ =25.5 mJ/m2; +1γ , −
1γ represent the acid and base polar components of
the surface energy of bacteria, and +2γ , −
2γ represent the acid and base polar components
of the surface energy of coatings.
8.2.4 Brownian Motion
A fundamental consequence of the kinetic theory is that, in the absence of external
forces, all suspended particles, regardless of their size, have the same average
translational kinetic energy. The average translational kinetic energy for any particle is
1½ kT, where k is Boltzmann’s constant (1.381 × 10⁻²³ J/K) and T the absolute
temperature in degree K. Particles adhering to a surface have two instead of three
degrees of freedom, as one perpendicular to the surface has been blocked by bonding.
(for a system with two degrees of freedom) (van Oss CJ, 1994). Since Brownian motion
comprises 21 kT per degree of freedom, the corresponding free energy term BrEΔ of a
particle adhering to a surface equals 1 kT = 2010414.0 −× J (300ºK).
2010414.0 −×=Δ BrE J (8.15)
8.3 Work of Adhesion and Extended DLVO Theory
When H=Ho, the sum of LWE132Δ (Eq. 6.11) and ABE132Δ (Eq.8.14) is equal to the work of
adhesion adhFΔ in Eq. (8.5). This means the extended DLVO theory can be simplified
to the work of adhesion approach if the electrostatic double layer interaction ELE132Δ and
Brownian motion BrEΔ are ignored and H=Ho. The extended DLVO theory is found to
be more effective in predicting the adhesion behaviour than the expectations from the
work of adhesion approach (Sharma et al, 2002, 2003). In this study the extended
DLVO theory was used to predict bacterial adhesion.

154
8.4 Modelling Results 8.4.1 Effect of Surface Energy on Total Interaction Energy According to the extended DLVO theory, the main parameters that affect TOTE132Δ value
include λ, H, ζ and the surface energy components of bacteria, substrate and liquid. In
the modeling, the 5 bacteria used in the bacterial adhesion assays were used, including
Pseudomonas fluorescens, Escherichia coli, Pseudomonas aeruginosa, Staphylococcus
aureus and Staphylococcus epidermidis. The surface energy components are given in
Table 6.2. In the modeling, the surface energy components of substrates ( 2LWγ , +
2γ and
−2γ ) were assumed to be changed in the range 10 ~ 70 mJ/m², 0 ~1.6 mJ/m² and 10 ~ 70
mJ/m², respectively. The zeta potential for the all surfaces 2ζ was assumed to be -25
mV (Liu and Zhao 2005). The λ value was taken 0.6 nm (Dávalos-Pantoja et al. 2000).
The H value was assumed around 4nm depending on the coatings and the bacteria (Liu
and Zhao 2005). The surface energy components of water are given in Table 5.4.
The total interaction energy TOTE132Δ between the 5 bacteria strains and the substrates
with different surface energy components was modeled by extended DLVO theory.
Figure 8.1 shows the effect of surface energy components on TOTE132Δ . The modeling
results indicated that for given −2γ values, the TOTE132Δ values increased with
decreasing LW2γ . In most case, the surface energy component +
2γ value is nearly equal to
zero, leading to LW2γ ≈ TOT
2γ . Figure 8.1 also shows that for given LW2γ values, TOTE132Δ
values increased with increasing −2γ . According to the DLVO theory, bacterial adhesion
strength decreased with TOTE132Δ increasing. The modelling results give us a clear
direction to design both anti-biofouling and biofouling-release coatings by decreasing LW2γ and by increasing −
2γ . The modelling results explain the experimental results- why
the number of adhered bacteria decreased with decreasing TOT2γ and with increasing −
2γ ;
why bacterial removal rate increased with decreasing TOT2γ and with increasing −
2γ .

155
P. fluorescens
5.00E-20
1.00E-19
1.50E-19
2.00E-19
2.50E-19
3.00E-19
0 10 20 30 40 50 60 70 80γ2
LW [mJ/m2]
ΔE 1
32TO
T [J]
γ2-=70
γ2-=50
γ2-=40
γ2-=30
γ2-=20
γ2-=10
γ2-=70
γ2-=10
(a)
E. coli
5.00E-20
1.00E-19
1.50E-19
2.00E-19
2.50E-19
3.00E-19
0 10 20 30 40 50 60 70 80γ2
LW [mJ/m2]
ΔE 1
32TO
T [J]
γ2-=70
γ2-=50
γ2-=40
γ2-=30
γ2-=20
γ2-=10
γ2-=70
γ2-=10
(b)
P. aeruginosa
-8.00E-20
-3.00E-20
2.00E-20
7.00E-20
1.20E-19
1.70E-19
0 10 20 30 40 50 60 70 80γ2
LW [mJ/m2]
ΔE 1
32TO
T [J]
γ2-=70
γ2-=50
γ2-=40
γ2-=30
γ2-=20
γ2-=10
γ2-=70
γ2-=10
(c)

156
S. aureus
-8.00E-20
-3.00E-20
2.00E-20
7.00E-20
1.20E-19
1.70E-19
2.20E-19
2.70E-19
0 10 20 30 40 50 60 70 80γ2
LW [mJ/m2]
ΔE 1
32TO
T [J]
γ2-=70
γ2-=50
γ2-=40
γ2-=30
γ2-=20
γ2-=10
γ2-=70
γ2-=10
(d)
S. epidermidis
-8.00E-20
-3.00E-20
2.00E-20
7.00E-20
1.20E-19
1.70E-19
2.20E-19
2.70E-19
0 10 20 30 40 50 60 70 80γ2
LW [mJ/m2]
ΔE 1
32TO
T [J]
γ2-=70
γ2-=50
γ2-=40
γ2-=30
γ2-=20
γ2-=10
γ2-=70
γ2-=10
(e)
Figure 8.1 Effect of surface energy components of substrates on total interaction energy
(a) P. fluorescens, (b) E. coli, (c) P. aeruginosa, (d) S. aureus and (e) S. epidermidis.
8.4.2 Case Study- Effect of Interaction Energy
In order to further validate the modelling results, the bacterial adhesion and removal on
the coatings with different surface energy were investigated.

157
8.4.2.1 Ni-P-Biocide Polymer Nanocomposite Coatings
The total interaction energy TOTE132Δ between two types of bacteria (E. coli and S. aureus,
see Table 6.2) and the substrates (stainless steel, Ni-P coating and 5 Ni-P-biocide
polymer coatings, see Table 5.5) in water was calculated using the extended DLVO
theory, as shown in Figure 8.2a and b. The results showed that the number of adhered
bacteria decreased with increasing TOTE132Δ values, which is consistent with the DLVO
theory, i.e. bacterial adhesion decreased with increasing TOTE132Δ values.
0
5000
10000
15000
20000
25000
30000
35000
40000
45000
-6.E-20 -3.E-20 0.E+00 3.E-20 6.E-20 9.E-20
ΔE132TOT [J]
Adh
ered
bac
teria
[CFU
/cm
2 ]
(a) E. coli
0
5000
10000
15000
20000
25000
30000
35000
40000
45000
50000
-6.E-20 -3.E-20 0.E+00 3.E-20 6.E-20 9.E-20
ΔE132TOT [J]
Adh
ered
bac
teria
[CFU
/cm
2 ]
(b) S. aureus
Figure 8.2 Effect of TOTE132Δ on the attachment of (a) E. coli (b) S. aureus

158
8.4.2.2 Si-N-doped DLC Coatings
The total interaction energy TOTE132Δ between P. fluorescens (see Table 6.2) and the 4 Si-
N-DLC coatings (see Table 5.6) in water was calculated using the extended DLVO
theory. Figure 8.3 shows that the bacterial removal percentage increased with increasing TOTE132Δ values, which is also consistent with the DLVO theory.
50
60
70
80
90
100
110
-2.E-20 0.E+00 2.E-20 4.E-20
ΔE132TOT [J]
Bac
teria
l rem
oval
[%]
P. fluorescens
Figure 8.3 Effect of TOTE132Δ on the removal of P. fluorescens
8.4.2.3 F-doped DLC Coatings
The total interaction energy TOTE132Δ between S. aureus (see Table 6.2) and the F-DLC
coatings (see Table 5.7) in water was calculated using the extended DLVO theory.
Figure 8.4a shows that the number of adhered bacteria decreased with increasing TOTE132Δ
values, which is consistent with the DLVO theory. Figure 8.4b shows that the bacterial
removal percentage increased with increasing TOTE132Δ values, which is also consistent
with the DLVO theory.

159
0
10000
20000
30000
40000
50000
60000
70000
0.E+00 2.E-20 4.E-20
ΔE132TOT [J]
Adh
ered
bac
teria
[CFU
/cm
2 ]
(a)
0
10
20
30
40
50
60
70
80
0.E+00 2.E-20 4.E-20
ΔE132TOT [J]
Bac
teria
l rem
oval
[%]
(b)
Figure 8.4 Effect of TOTE132Δ on the attachment (a) and removal (b) of S. aureus
8.4.2.4 B and Ti-doped DLC Coatings
The total interaction energy TOTE132Δ between P. aeruginosa and S. epidermidis (see Table
6.2) and the B-doped DLC coatings (see Table 5.8) in water was calculated using the
extended DLVO theory. The total interaction energy TOTE132Δ between E. coli (see Table
6.2) and the Ti-doped DLC coatings (see Table 5.8) in water was also calculated using
the extended DLVO theory. The results indicated that for B-DLC coatings the number
of adhered bacteria decreased with increasing TOTE132Δ values for contact time 1h, 5h and
18h; and that the bacterial removal percentage increased with increasing TOTE132Δ values.
The similar results were also obtained for the Ti-doped DLC coatings. Figure 8.5a and b

160
show typical modelling results on the effect of total interaction energy TOTE132Δ on the
adhesion and removal of S. epidermidis cells from the B-doped DLC coatings for
contact time 1 h.
0
50000
100000
150000
200000
250000
300000
-8.E-20 -6.E-20 -4.E-20 -2.E-20 0.E+00 2.E-20 4.E-20
ΔE132TOT [J]
Adh
ered
bac
teria
[CFU
/cm
2 ](a)
0
10
20
30
40
50
60
70
80
-8.E-20 -6.E-20 -4.E-20 -2.E-20 0.E+00 2.E-20
ΔE132TOT [J]
Bac
teria
l rem
oval
[%]
(b)
Figure 8.5 Effect of TOTE132Δ on the attachment (a) and removal (b) of S. epidermidis

161
CHAPTER 9 CONCLUSIONS 9.1 Ni-P-Biocide Polymers Noanocomposie Coatings
A series of novel anti-bacterial Ni-P-Biocide polymers nanocomposite coatings
was developed using electroless nanocoating technique.
The novel electroless Ni-P-SM14, Ni-P-SM20, Ni-P-PTFE-SM14 and Ni-P-
PTFE-SM20 composite coatings showed the excellent anti-microbial properties.
Ni-P-PTFE-SM14 and Ni-P-PTFE-SM20 performed better than Ni-P-SM14
and Ni-P-SM20. For Ni-P-SM14 or Ni-P-SM20, their anti-bacterial mechanism
is due to the biocidal property of the biocide polymers SM14 and SM20. For
Ni-P-PTFE-SM14 and Ni-P-PTFE-SM20, their anti-bacterial mechanisms are
due to the non-stick property of PTFE and biocidal property of the biocide
polymer SM14 or SM20. Ni-P-PTFE-SM14 and Ni-P-PTFE-SM20 performed
best, which reduced bacterial attachment by 94% and 70% respectively as
compared with stainless steel and Ni-P-PTFE.
In addition, the total surface energy of Ni-P-PTFE-SM14 and Ni-P-PTFE-
SM20 was controlled in the optimum value, about 24.5 mJ/m2(see Table 5.5).
As a result, Ni-P-PTFE-SM14 and Ni-P-PTFE-SM20 performed best against
bacterial attachment and had highest bacterial removal rate. An EU patent was
filed on 1 June 2012.

162
9.2 Doped Diamond-like Carbon Coatings
9.2.1 Si-N-doped DLC Coatings
A series of new Si-N-DLC coatings doped with different contents of silicon (1-
3.8% Si) and nitrogen (2% N) were designed and produced in the collaboration
with Teer Coatings Ltd using their PECVD technique.
Previously we found that Si-DLC coatings with 1% -3.8% Si performed better
than pure DLC coating and stainless steel against bacterial adhesion. In this
study we found that the incorporation of 2%N into the Si-doped DLC coatings
significantly reduced bacterial attachment, compared with Si-DLC coatings.
The number of adhered bacteria decreased significantly with increasing Si
content in the DLC coatings.
The incorporation of 2%N into the Si-doped DLC coatings also increased
bacterial removal. The bacterial removal percentage increased significantly
with increasing Si content in the DLC coatings.
9.2.2 F-doped DLC Coatings
A series of F-doped DLC coatings with different contents of fluorine (6.5 -
39.2%) were designed and produced on stainless steel substrates in the
collaboration with CSIRO using their PECVD technique.
The surface energy of the F-DLC coatings decreased with increasing F content
in the coatings. The incorporation of fluorine into the DLC coatings reduced
significantly bacterial attachment and increased bacterial removal. The F-DLC
coatings with the highest F content (39.0 at. %) reduced bacterial attachment
by 67 % and increased removal 32 %, compared with pure DLC coating. Both
the initial bacterial attachment and the percent bacterial removal strongly
correlated with the total surface energy of the coatings. The bacterial
attachment decreased with decreasing surface energy of the F-DLC coatings;
while the percent bacterial removal increased with decreasing surface energy
of the F-DLC coatings.

163
9.2.3 B-doped DLC Coatings
A series of new B-doped DLC coatings with different contents of boron (4.9 -
9.5%) were designed and produced on stainless steel substrates in the
collaboration with Tecvac Ltd using their PECVD technique.
The experimental results showed that the surface energy of the B-DLC
coatings decreased with increasing B content in the coatings. The incorporation
of boron into the DLC coatings reduced significantly bacterial attachment and
increased bacterial removal.
It was observed that after the coatings with bacteria were exposed to air for 15
minutes, some bacteria on the coatings were dead. The numbers of adhered
bacteria (live, dead and total P. aeruginosa and S. epidermidis) decreased with
boron content increasing or with the total surface energy of the B-DLC
coatings decreasing. The 9.5% B-DLC performed best, which reduced total
bacterial adhesion by up to 70%, compared with pure DLC coating.
In order to assess the adhesion strength of the attached bacteria, some bacteria
on the coatings were removed through the dipping process. The numbers of
remaining bacteria (live, dead and total P. aeruginosa and S. epidermidis) also
decreased with boron content increasing or with the total surface energy of the
B-DLC coatings decreasing. The remaining bacteria (live, dead and total
bacteria) on the 9.5% B-DLC coatings were reduced by up to 87%, 77% and
83% respectively, compared with pure DLC coating.
The removal percentage of the bacteria (live, dead and total P. aeruginosa and
S. epidermidis) increased with boron content increasing or with the total
surface energy of the B-DLC coatings decreasing. The removal percentage of
live, dead and total bacteria on the 9.5% B-DLC coatings increased by up to
207%, 142% and 164% respectively, compared with pure DLC coatings. The
dead bacteria were more easily removed than the live bacteria.
In this study the contact time (1 hour, 5 hour and 18 hours) had significant
influence on the attachment of live, dead and total P. aeruginosa and S.
epidermidis cells on the B-DLC coatings. In general, the numbers of adhered
bacteria increased with contact time increasing. However when contact time
increased to 18 hours the number of adhered bacteria on the coatings decreased
due to lack of nutrients for bacteria to survive. The contact time also had
164
significant influence on the bacterial removal. For contact time 1 hour, the
bacterial removal percentage was much higher than those for contact time 5 h
and 18 h as bacteria on the coatings started producing sticky exopolymer with
contact time increasing.
The experimental results also showed that the B-DLC coatings reduced protein
adhesion significantly. The protein remaining after cleaning decreased with
boron content increasing. The protein remaining also decreased with total
surface energy of B-DLC coatings decreasing. The best B doped DLC coatings
reduced residual protein adhesion by 88%, compared with stainless steel.
9.2.4 Ti-doped DLC Coatings
A series of new Ti-doped DLC coatings with different contents of titanium
(1.3 -3.2%) were designed and produced on stainless steel substrates in the
collaboration with Tecvac Ltd using their PECVD technique.
The experimental results showed that the total surface energies of Ti-DLC
coatings were almost same, about 44 mJ/m2, but −γ values were changed in the
range of 4.47- 9.83 mJ/m2 .
It was observed that after the coatings with bacteria were exposed to air for 15
minutes, some bacteria on the coatings were dead. The numbers of adhered
bacteria (live, dead and total E. coli cells) decreased with Ti content or −γ values increasing. The 3.2% Ti-DLC performed best, which reduced total
bacterial adhesion by 75% and 66% respectively, compared with stainless steel
and pure DLC coating.
The removal percentage of the bacteria (live, dead and total E. coli cells)
increased with Ti content or −γ values increasing. The removal percentage of
live, dead and total bacteria on the 3.2%Ti-DLC coatings was increased by
127%, 150% and 142% respectively, compared with stainless steel. The dead
bacteria were more easily removed than the live bacteria.
In this study the contact time (1 hour, 5 hour) had significant influence on the
attachment of E. coli cells on the Ti-DLC coatings. In general, the numbers of
adhered bacteria increased with contact time increasing. The Ti-DLC coatings

165
may be toxic to bacteria due to the formation TiOx or TiO2. Further study is
required to confirm the existence of TiOx or TiO2 in the Ti-DLC coatings.
The experimental results also showed that the Ti-DLC coatings reduced protein
adhesion significantly. The protein remaining decreased with titanium content
increasing. The protein remaining also decreased with −γ surface energy of Ti-
DLC coatings increasing. The best Ti doped DLC coatings reduced residual
protein adhesion by 95%, compared with stainless steel.
9.3 SiOx-like Coatings
A series of new SiOx-like coatings with different surface energies ( 23 – 46
mJ/m2) were designed and produced in the collaboration with Teer Coatings
Ltd using their PECVD technique.
Surface energy has a significant influence on bacterial adhesion. The number
of adhered bacteria increased with increasing surface energy. When the surface
energy of the coatings was 23 mN/m (S7-1, TCL40bt), the number of adhered
bacteria was lowest.
Bacterial removal decreased with increasing surface energy, i.e. the adhesion
strength increased with increasing surface energy. When the surface energy of
the coatings was 23 mN/m (S7-1 or TCL40bt), the bacterial adhesion strength
to the coatings was weakest.
9.4 Bacterial Adhesion Mechanisms
The total interaction energy TOTE132Δ between the different bacteria strains and
the substrates with different surface energy components was modelled by
extended DLVO theory. The modelling results indicated that for given −2γ
values, the TOTE132Δ values increased with decreasing LW2γ . In most case, the
surface energy component +2γ value is nearly equal to zero, leading
to LW2γ ≈ TOT
2γ . For given LW2γ values, TOTE132Δ values increased with
increasing −2γ . According to the DLVO theory, bacterial adhesion strength
decreased with TOTE132Δ increasing. The modelling results give us a clear

166
direction to design both anti-biofouling and biofouling-release coatings by
decreasing LW2γ and by increasing −
2γ . The modelling results explain the
experimental results- why the number of adhered bacteria decreased with
decreasing TOT2γ and with increasing −
2γ ; why bacterial removal rate increased
with decreasing TOT2γ and with increasing −
2γ .

167
CHAPTER 10 FUTURE WORK
10.1 Anti-biofouling Coatings To further investigate the effect of B and Ti contents on bacterial adhesion by increasing
B and Ti contents to 15 at%.
To further investigate the effect of two or more doped elements (Si-F; Si-B; B-Ti; etc)
on bacterial adhesion.
10.2 Biofouling Adhesion Mechanisms
To further investigate the adhesion mechanisms of proteins if we know the surface
energy of level 3 prion proteins.
10.3 Practical Applications of the New Coatings
To investigate the practical applications of the new anti-biofouling coatings for heat
exchangers and medical devices in the collaboration with relevant industries.

168
REFERENCES
A Aftring R.P., Capone D.C., Duguay L., Fell J., Master I.M. and Taylor B.F., 1978, Biofouling and site characterisation studies in the ocean thermal energy conversion (o.t.e.c.) experiment at st. croix, u.s. virgin islands, In Proceeding of The Fifth Ocean Thermal Energy Conversion Conference, Florida USA, pp. VIII-45-VIIII-73, Department Of Energy, Washington, USA Agarwala R.C., Agarwala V., and Sharma R., 2006, Electroless Ni-P based nanocoating technology—a review, Synthesis and Reactivity in Inorganic, Metal-Organic, and Nano-Metal Chemistry, Volume 36, Issue 6, Pages 493–515 Ahlborg HG, Josefsson PO (1999), Pin-Tract Complications in External Fixation of Fractures of the Distal Radius, Acta Orthop Scand, Volume 70, pp.116-118 Akesso, L., Navabpour, P, Teer, D., Pettitt, ME., Callow, ME., Liu, C., Su, XJ., Wang, S., Zhao, Q., Donik, C., Kocijan, A., Jenko, M., Callow, JA., 2009a, Deposition parameters to improve the fouling-release properties of thin siloxane coatings prepared by PACVD. Applied Surface Science, Volume 255 (13-14):6508–6514 Akesso L, Pettitt M E, Callow J A, Callow M E, Stallard J, Teer D, Liu C, Wang S, Zhao Q, D’Souza F D, Willemsen P R, Donnelly G T, Donik C, Kocijan A, Jenko M, Jones L A, Guinaldo P C. 2009b. The potential of nanostructured silicon oxide type coatings deposited by PACVD for control of aquatic biofouling. Biofouling 25: 55-67. Albaugh E.K., 1984, Copper-Nickel piping reduces costs, Biofouling Corrosion, World Oil, Volume 199, Issue 6, Pages 94-100 Allion A., Baron JP., Boulange-Petermann, L. (2006) Impact of surface energy and roughness on cell distribution and viability, Biofouling, 22(5): 269 – 278 Allonier, A.S., Khalanski, M., Camel, V., Bermond, A., (1999). Characterization of chlorination by –products in cooling effluents of coastal nuclear power stations. Marine Pollution Bulletin 38, 1232-1241. An YH, Friedman RJ, Draughn RA (1995), Rapid Quantification of Staphylococci Adhered to Titanium Surfaces Using Image Analyzed Epifluorescence Microscopy, J. Microbiol Meth., Volume 24, pp.29-40 An YH, Friedman RJ, Draughn RA, et al. (1996), Bacterial Adhesion to Biomaterial Surfaces. In: Wise DE, et al., ed. Human Biomaterials Applications. Humana Press, Totowa, New Jersey, pp.19-57 An YH, Friedman RJ (2000), Handbook of Bacterial Adhesion: Principles, Methods, and Applications, Humana Press, Totowa, New Jersey

169
An YH, Friedman RJ (1997), Laboratory methods for studies of bacterial adhesion, Journal Of Microbiological Methods, 30 (2):141-152 Antich-Adrover, Mari-Garin D, Murias-Alvarez J, Puente-Alonso CW (1997), External and Secondary Intramedullary Nailing of Open Tibial Fractures: A Randomized, Prospective Trial, J Bone Joint Surg Br; Volume 79B, pp.433-437 Apachitei I, Duszczyk J, Katgerman L, Overkamp PJB (1998a), Electroless Ni-P Composite Coatings: The Effect of Heat Treatment on the Microhardness of Substrate and Coating, Scripta Mater, Vol.38, No.9, pp.1347-1353 Apachitei I, Duszczyk J, Katgerman L, Overkamp P.J.B (1998b), Particles Co-Deposition by Electroless Nickel, Scripta. Mater. Vol. 38, No. 9, pp.1383-1389 Armyanov, S., Georgieva, J., Tachev, D., Valova, E., Nyagolova, N., Mehta, S., Leibman, D., Ruffini, A., (1999). Electroless deposition of Ni-Cu-P alloys in acidic solutions. Electrochemical and Solid State letters 2, 323-325. Aronov D., Rosen R., Ron E.Z., and Rosenman G., 2008, Electron-induced surface modification of hydroxyapatite-coated implant, Surface and Coatings Technology, Volume 202, Issue 10, Pages 2093-2102 Azeredo J, Visser J, Oliveira R. (1999), Exopolymers in bacterial adhesion: interpretation in terms of DLVO and XDLVO theories, Colloid Surfaces B 14:141-148. Azeredo J, Pacheco AP, Lopes I, Oliveira R, Vieira MJ. 2003. Monitoring cell detachment by surfactants in a parallel plate flow chamber. Water Science and Technology. 47:77-82. AWWA, (1998). Standard Methods for the Examination of Water and Wastewater , 20th. Edition. Azis, PKA, Al-Tisan, I., Sasikumar, N. (2001), Biofouling potential and environmental factors of seawater at a desalination plant intake, Desalination, 135:69-82. Azis P. K. A., Al-Tisan I., Al-Daili M., Green T.N., Ba-Mardouf K., Al-Qahtani S.A., and Al-Sabai K., 2003, Marine macrofouling: a review of control technology in the context of an on-line experiment in the turbine condenser water box of Al-Jubail Phase-1 power/MSF plants, Desalination, Volume 154, Issue 3, Pages 277-290 B Baier, R.E. (1980). Adsorption of Micro-organisms to Surface, Wiley-Interscience Publishers, New York, 59-104. Baier, R.E., DePalma, V.A., Meyer, A.E., King, R.W., Fornalik, M.S., (1981). American Society of Mechanical Engineers, Heat Transfer Division 17, 97-103. Baier R.E., Meyer A.E., Depalma V.A., King R.W., and Fornalik M.S., 1983, Surface microfouling during the induction period, Journal of Heat Transfer, Volume 105, Issue

170
3, Pages 619-624 Bambauer R, Jutzler GA (1982), Transcutaneous Insertion of the Shaldon Catheter Through the Internal Jugular Vein as Access for Acute Hemodialysis, Dial Transplant, Volume 11, pp.766-771 Bambauer R, Mestres P, Pirrung KH (1994), Side Efffects and Infections Associated with Large-bore Catheters for Extracorporeal Detoxification Methods, ECC International, Volume 6, pp.5-19 Bates J (1998), Why Use Electroless Nickel Today?, Plat Surf Finish, Volume 85, pp.14-16 Baum, C., Meyer, W., Stelzer, R., Fleischer, L.G., and Siebers, D. (2002). Average Nanorough Skin Surface of the Pilot Whale: consideration on the Self-cleaning abilities based on nanoroughness, Marine Biology, 140(3), 653-657. Bayoudh S., Othmane A., Mora L., and Ouada H.B., 2009, Assessing bacterial adhesion using DLVO and XDLVO theories and the jet impingement technique, Colloids and Surfaces B: Biointerfaces, Volume 73, Issue 1, Pages 1-9 Beigbeder A, Degee P, Conlan S L, Mutton R J, Clare A S, Pettitt M E, Callow M E, Callow J A, Dubois P. 2008. Preparation and characterisation of silicone-based coatings filled with carbon nanotubes and natural sepiolite and their application as marine fouling-release coatings. Biofouling 24: 291-302. Bell, R. et al, State of the Art Mechanical Systems for Scale and Biofilm Controls, Electric Power Research Institute (EPRI ) CS-4339, November, 1985 Berger L.R., McCoy W.F., and Berger J.A., 1979, Biofouling assay for O.T.E.C. pipes, in proceedings of the ocean thermal energy conversion (O.T.E.C.) Biofouling, Corrosion And Materials Workshop, Rosslyn, Virginia, USA, pp: 38-56. Argonne National Laboratory, Argonne, Illinois, USA Bernoulli, C. et al. 1977. Danger of accidental person-to-person transmission of Creutzfeldt-Jakob disease by surgery [letter]. . Lancet, 1, 478-479 Bers, A.V. and Wahl, M. (2004). The influence of Natural Surface Microtopographies on Fouling, Biofouling, 20(1), 43-51 Blot F, Nitenberg G, Chachaty E, Raynard B, Germann N, Antoun S, Laplanche A, Brun-Buisson C, Trancrede C (1999), Diagnosis of Catheter-Related Bacteremia: A Prospective Comparison of the Time to Positivity of Hub-Blood Versus Peripheral-Blood Cultures, Lancet, Volume 354, No.9184, pp.1071-1077 Bollen C.M.L., Lambrechts P., and Quirynen M., 1997, Comparison of surface roughness of oral hard materials to the threshold surface roughness for bacterial plaque retention: a review of the literature. Dent Mater, Volume13, Pages 258–269 Bornhorst, A., Müller-Steinhagen, H., Zhao, Q. 1999. Reduction of Scale Formation By

171
Ion-Implantation and Magnetron Sputtering on Heat Transfer Surfaces, Heat Transfer Engineering, Volume 20 (2):.6–14 Borsenko KB, Reavy HJ, Zhao Q and Abel EW. Adhesion of protein residues to substituted (111) diamond surfaces: an insight from density functional theory and classical molecular dynamics simulations. J. Biomedical Materials Research Part A 2008; 86A: 1113-1121 Bos R, van der Mei HC, Busscher HJ. 1999. Physico-chemistry of initial microbial adhesive interactions--its mechanisms and methods for study. FEMS Microbiol Rev. 23(2):179-230 Bosque,P.J. 2002. Bovine spongiform encephalopathy, chronic wasting disease, scrapie, and the threat to humans from prion disease epizootics. Curr. Neurol. Neurosci. Rep. 2, 488-495 Bosetti M, Masse A, Tobin E, Cannas M., 2002. Silver coated materials for external fixation devices: in vitro biocompatibility and genotoxicity. Biomaterials, 23(3):.887-892 Bott T.R., Fouling of heat exchangers, In: Churchill S.W., Editor. Chemical engineering monographs, Volume26. Amsterdam, The Netherlands: Elsevier, 1995 Bott TR. 2001. Potential Physical Methods for the Control of Biofouling in Water Systems. Chemical Engineering Research and Design. 79: 484-490. Bott T.R. and Miller P.C.,2008, Mechanisms of biofilm formation on aluminium tubes, Journal of Chemical Technology and Biotechnology. Biotechnology, Volume 33, Issue 3, Pages 177-184 Boyer, RME, Malherbe, C, 1979. Experience Of Electricite De France In The Use Of Sea Water For Cooling Thermal Power Stations, Institution of Mechanical Engineers, Conference Publications, pp.21-28 Braceras I, Alava JI, O˜nate JI, Brizuela M, Garcia-Luis A, Garagorri N, 2002. Improved osseointegration in ion implantation-treated dental implants. Surf Coat Technol.158–159:28–32. Brady R.F. and Singer I.L., 2000, Mechanical factors favoring release from fouling release coatings, Biofouling, Volume 15, No. 1-3, Pages 73-81 Brenner A, Riddell G (1946), Nickel Plating on Steel by Chemical Reduction, J. Research Nat. Bur. of Standards, Volume 37, pp.31-34 Breteau P (1911), Bull. Soc. Chim., Volume 9, pp.515-518 Brown, P. et al. 1982. Chemical disinfection of Creutzfeldt-Jakob disease virus. N. Engl. J Med. 306, 1279-1282

172
Brown, P. et al. 2000. New studies on the heat resistance of hamster-adapted scrapie agent: Threshold survival after ashing at 600°C suggests an inorganic template of replication. Proc. Natl. Acad. Sci. USA 97, 3418-3421 Bruce, M.E. et al. 1997. Transmissions to mice indicate that 'new variant' CJD is caused by the BSE agent. Nature, 389, 498-501 Brun-Buisson C, Abrouk F, Legrand P, Huet Y, Larabi S, Rapin M (1987), Diagnosis of Central Venous Catheter-Related Sepsis, Arch Intern Med, Volume 147, No.5, pp.873-877 Brink, L.E.S., Elbers, S.J.G., Robbertsen, T., Both, P., (1993). The anti-fouling action of polymers preadsorbed on ultrafiltration and microfiltration membranes. Journal of Membrane Science 76, 281-291. Burton, D.T., 1979. Biofouling Control Procedures for Power Plant Cooling Water Systems., EPRI Symp. Proc., pp.251-266, Atlanta Busscher H.J., Modern Approaches to Wettability, Theory and Applications, Plenum, New York, 1992 Butter RS and Lettington AH (1995), Diamond-like Carbon for Biomedical Application, J. Chem. Vapor Depos., Volume 3, pp.182-192 Butterworth D., 2002, Design of shell-and-tube heat exchangers when the fouling depends on local temperature and velocity, Applied Thermal Engineering, Volume 22, Issue 7, Pages 789-801 C Callow J.A., Callow M.E., Ista L.K., Lopez G., and Chaudhury M.K., 2005, The influence of surface energy on the wetting behaviour of the spore adhesive of the marine alga Ulva linza (synonym Enteromorpha linza), Journal of the Royal Society, Interface, Volume 2, No. 4, Pages 319-325 Carlos, WC, 1981. Corrosion Control Of An OTEC Platform. Proceedngs of the Ocean Energy Conference, Vol.1, pp.127-131 Carmen, M.L., Estes, T.G., Feinberg, A.W., Schumacher, J.F., Wilkerson, W., Wilson, L.H., Callow, M.E., Callow, J.A., and Brennan, A.B.(2006). Engineered Antifouling Microtopographies – Correlating Wettability with Cell Attachment, Biofouling, 22(1), 11-21. Chambers, L.D., Stokes, K.R., Walsh, F.C., and Wood, R.J.K., (2006). “Modern Approaches to Marine Antifouling Coatings,” Surface & Coatings Technology, 201, 362-3652. Campbell, I, Hall, K, Searle, NK, 1979. Use of Titanium In Seawater Heat Exchangers. Institution of Mechanical Engineers, Conference Publications, pp.123-130
173
Characklis, W.G. (1983). Mathematics in Microbiology, in Bazin, M. (Eds), Academic Press, London, 171-234. Chibowski E, Holysz L, Wójcik W. 1994. Changes in zeta potential and surface free energy of calcium carbonate due to exposure to radiofrequency electric field. Colloids and Surfaces A 92:79-85. Chitty J, Pertuz A, Hintermann H, Staia MH, Puchi ES (1997), Influence of Electroless Ni-P Deposits on the Corrosion-Fatigue Properties of an AISI 1045 Steel, Thin Solid Films, Volume 308, pp.430-435 Choong S, Wood S, Fry C, Whitfield H. (2001), Catheter associated urinary tract infection and encrustation, International J of Antimicrobial Agents, 17:305-310 Chow W., 1987, Targeted Chlorination Schedules and Corrosion Evaluations, American Power Conference Chicago Clasper JC, Cannon LB, Stapley SA, Taylor VM, Watkins PE., 2001. Fluid accumulation and the rapid spread of bacteria in the pathogenesis of external flxator pin track infection, Injury, Int. J. Care Injured, 32: 377-381 Clifford RP, Lyons TJ, Webb JK., 1987. Complications of external fixation of open fractures of the tibia. Injury, 18 (3):174-176 Collinge CA, Goll G, Seligson D, Easley KJ., 1994. Pin tract infections: silver vs uncoated pins. Orthopedics, 17(5):445-448 Collinge, J., Sidle, K.C.L., Meads, J., Ironside, J. & Hill, A.F. 1996. Molecular analysis of prion strain variation and the aetiology of 'new variant' CJD. Nature, 383, 685-690 Cook G, Costerton JW, Darouiche RO. (2000), Direct confocal microscopy studies of the bacterial colonization in vitro of a silver-coated heart valve. International Journal of Antimicrobial Agents, 13:169-173 Cwikel, D., Zhao, Q., Liu, C., Su, XJ, Marmur,A., 2010, Comparing Contact Angle Measurements and Surface Tension Assessments of Solid Surfaces, Langmuir, Volume 26(19):15289–15294 D Darouiche RO (2001), Device-Associated Infections: A Macroproblem That Starts with Microadherence, Clin Infect Dis, Volume 33, pp.1567-1572 Darouiche RO (2003), Antimicrobial Approaches for Preventing Infections Associated with Surgical Implants, Clin Infect Dis, Volume 36, pp.1284-1289 Darouiche RO (2004), Treatment of Infections Associated with Surgical Implants, N. Engl. J. Med., Volume 350, pp.1422-1429

174
Darouiche RO (2007), Preventing Infection in Surgical Implants, US Surgery 2007, pp.40-44 Demichelis F, Pirri CF, Tagliaferro A. 1992. Influence of silicon on the physical properties of diamond-like films, Mat. Sci. Eng. B-Solid 11:313-316. Denyer, S.P., 1990. Mechanism of Action of Biocides. International Biodeterioration. Vol.26, pp.89-100 Deslys, J.-P. et al. 1997. New variant Creutzfeldt-Jakob disease in France. Lancet, 349, 30-31 Dexter, S.C., Sullivan, J.D., Williams, J., Watson, S.W., (1975). Influence of substrate wettability on the attachment of marine bacteria to various surfaces. Applied Microbiology 30, 298-308. Dexter S.C., 1979, Influence of substratum critical surface tension on bacterial adhesion in situ studies, J. Colloid Interface Sci, Volume 70, Pages 346-354 DiCinto, R.A., DeCarolis, G., (1993). Biofouling and corrosion. Corrosion Prevention & Control 40, 104-107. Duncan RN (1989), Metal Finish, Vol. 9, pp.33 Duncan RN (1995), Electroless Nickel-Past, Present and Future-An Update, in Electroless Nickel’95, Fort Mitchell, KY, November 6-8 E Ederth, T.; Ekblad, T.; Petitt, M.; Conlan, S.; Du, CX; Callow, M; Callow, J; Mutton, R; Clare, A; D’Souza, F; Donnelly, G; Bruin, A; Willemsen, P; Su, XJ; Wang, S; Zhao, Q; Hederos, M; Konradsson, P; Lieberg, B. 2011, Resistance of galactoside-terminated alkanethiol self-assembled monolayers to marine fouling organisms, ACS Applied Materials & Interfaces, 3, 3890–3901. Eggimann P, Pittet D (2002), Overview of Catheter-Related Infections with Special Emphasis on Prevention Based on Educational Programs, Clin Microbiol Infect, Volume 8, pp.295-309 Eguia E, Trueba A, Giron A, Rio-Calonge B, Otero F, Bielva C. 2007. Optimisation of biocide dose as a function of residual biocide in a heat exchanger pilot plant effluent. Biofouling 23:231–247. Eguia E., Trueba A., Río-Calonge B., Girón A., and Bielva C., 2008, Biofilm control in tubular heat exchangers refrigerated by seawater using flow inversion physical treatment, International Biodeterioration and Biodegradation, Volume 62, Issue 2, Pages 79-87 Efird, K.D., Effect of Fluid Dynamics on the Corrosion of Copper Base Alloys in Sea Water, Corrosion’76, Conference Houston, March 1976.
175
Efird and Anderson. "Sea Water Corrosion of 90-10 and 70-30 Cu-Ni C 14 Year Exposures." Materials Performance, November 1975. Elliott TSJ, Faroqui MH (1992), Infections and Intravascular Devices, Br J Hosp Med, Volume 48, pp.496-503 Epstein, N. (1983). Thinking About Heat Transfer Fouling: A 5x5 Matrix, Heat Transfer Engng., Vol.4, pp43-56. Ernst, D.R. & Race, R.E. 1993. Comparative analysis of scrapie agent inactivation methods. J Virol Methods 41, 193-201 F Fang H.H.P., Xu L.C., and Chan K.Y., 2002, Effects of toxic metals and chemicals on biofilm and biocorrosion, Water Research, Volume 36, Issue 19, Pages 4709-4716 Fattom, A., Shilo, M., (1984). Hydrophobicity as an adhesion mechanism of benthic cyanobacteria, Applied and Environmental Microbiology 47, 135-143. Feldstein MD (1998), Composite Electroless Nickel Coatings for the Aerospace & Airline Industries, Plat Surf Finish, Vol.85, No.11, pp.248-252 Fitzgerald RH (1989), Infections of Hip Prostheses and Artificial Joints, Infect Dis Clin North Am, Volume 3, pp.329-338 Flechsig, E. et al. 2001. Transmission of scrapie by steel-surface-bound prions. Mol. Med. 7, 679-684 Flemming HC, Schaule G, Griebe T, Schmitt J, Tamachkiarowa A. 1997. Biofouling—the Achilles heel of membrane processes. Desalination. 113:215-225.
Fletcher, M., Marshall, K.C., (1982). Are solid surfaces ecological significance to aquatic bacteria? Advances in Microbial Ecology 47, 135-143. Fletcher M., and Pringle J.H., 1985, The effect of surface free energy and medium surface tension on bacterial attachment to solid surfaces, Journal of Colloid and Interface Science, Volume 104, Pages 5-14 Forster M., and Bohnet M., 1999, Influence of the interfacial free energy crystal/heat transfer surface on the induction period during fouling, International Journal of Thermal Sciences, Volume 38, No. 11, Pages 944-954 Förster, M., Bohnet, M., (2000). Modification of molecular interactions at the interface crystal/heat transfer surface to minimize heat exchanger fouling. International Journal of Thermal Sciences 39, 697-708.

176
Fowkes FM (1962), Determination of Interfacial Tensions, Contact Angles, and Dispersion Forces in Surfaces by Assuming Additivity of Intermolecular Interactions in Surfaces, J. Phys. Chem., Volume 66, pp.382. Fowkes, F.M., (1964). Dispersion force contributions to surface and interfacial tensions, contact angles, and heats of immersion. Advances in Chemistry 43, 99-111 Franceschini, DF, Achete CA, Freire FLJr.1992. Internal stress reduction by nitrogen incorporation in hard amorphous carbon thin films. Applied Physics letters 60:3229-3231. Frosh A, Joyce R, Johnson A., 2001. Iatrogenic vCJD from surgical instruments, BMJ. 322(7302):1558-1559 Fuller, R, 1976. Plate Heat Exchangers Solve Cooling Problem, Petroleum Engineers, Oct , 1976, pp.22-28 Fuller, R, 1979. Plate Heat Exchangers In Sea Water Cooling Systems, Institution of Mechanical Engineers, Conference Publications, 1979, pp.29-38 G Gaffoglio, C.J., (1987). Beating biofouling with copper-nickel alloys offshore, Sea Technology, 28, 43-46. Gago R, Sánchez-Garrido O, Climent-Font A, Albella JM, Román E, Raisanen J, Raühala E. 1999. Effect of the substrate temperature on the deposition of hydrogenated amorphous carbon by PACVD at 35 kHz. Thin Solid Films 338:88-92. Gangopadhyay AK, Willermet PA, Tamour MA, Vassell WC. 1997. Amorphous hydrogenated carbon films for tribological application I. Development of moisture insensitive films having reduced compressive stress Tribology International 30:9-18. Garrett-Price, B. A. et al. (1985) Fouling of heat Exchangers- Characteristics, Costs, Prevention, Control and Removal. Noyes Publications, Park Ridge, New Jersey. Ger MD, Hwang BJ (2002), Effect of Surfactants on Codeposition of PTFE Particles with Electroless Ni-P Coating, Mater Chem Phys, Vol.76, No.1, pp.38-45 Ghanem, N.A., EI-Awady, N.I., EI-Hamouly, W.S. and EI-Awady, M.M., 1982. New Approaches to Non-Toxic Antifouling Coatings for Ship-Hull Protection, Journal of Coatings Technology, Vol.54, No.684, pp.83-88 Ghani, A.C., Ferguson, N.M., Donnelly, C.A., Hagenaars, T.J., Anderson, R.M.1999, Epidemiological determinants of the pattern and magnitude of the vCJD epidemic in Great Britain. Proc R Soc Lond B 265, 2443-2452
Ghani, A.C., Ferguson, N.M., Donnelly, C.A., Anderson, R.M. 2000, Predicted vCJD mortality in Great Britain. Nature, 406, 583-584

177
Gibbs, C.J.Jr. et al. 1968. Creutzfeldt-Jakob Disease (Spongiform Encephalopathy): Transmission to the Chimpanzee. Science, 161, 388-389 Gibbs, C.J.Jr. et al. 1994. Transmission of Creutzfeldt-Jakob disease to a chimpanzee by electrodes contaminated during neurosurgery. J. Neurol. Neurosurg. Psychiatry 57, 757-758 Gilbert, PT. and North, W., 1972. Copper Alloys in Marine Engineering Applications, Trans. of The Institute of Marine Eng., Vol 84, Part 16, pp.520-525. Gilbert_PT, 1978. Copper Alloys For Offshore Applications. Metallurgist and Materials Technologist, Vol.10, No.6, pp.316-319 Gilbert_PT, 1982. Review Of Recent Work On Corrosion Behavior Of Copper Alloys In Sea Water, Materials Performance, Vol.21, No.2, pp.47-53. Girifalco LA, Good RJ (1957), A Theory for the Estimation of Surface and Interfacial Energies, J Phys Chem, Volume 61, pp.904-909 Goldie W., Metallic Coating of Plastics, Electrochemical Publications Ltd., British Isles, 1968 Good, R.J., (1992). Contact-angle, wetting, and adhesion – A critical – review. Journal of Adhesion Science and Technology 6, 1269-1302 Gopal S, Majumder S, Batchelor AG, Knight SL, De Boer P, Smith RM., 2000. Fix and flap: the radical orthopaedic and plastic treatment of severe open fractures of the tibia, J Bone Joint Surg Br , 82(7):959-966 Greenberg T., and Itzhak D., 2005, Marine biofouling of titanium alloys in the coral reef environment, Corrosion Reviews, Volume 23, Issue 4-6, Pages 405-413 Grischke M, Hieke A, Morgenweck F, Dimigen H (1998), Variation of the wettability of DLC-coatings by network modification using silicon and oxygen, Diamond and Related Materials 7:454-458 Giffin, OM, Some Early And Recent Novel OTEC Systems. American Society of Mechanical Engineers, Ocean Engineering Division (Proceedings) OED, 1978, Vol.5, pp.1-6 Gregory P, Pevny T, Teague D (1996), Early Complications with External Fixation of Pediatric Femoral Shaft Fractures, J Orthop Trauma, Volume 10, pp.191-198 Grill A. 1993. Review of the tribology of diamond-like carbon, Wear. 168:143-153. Gristina, AG. 1987. Biomaterial-centered infection: microbial adhesion versus tissue integration, Science 237 : 1588-1599

178
Grosjean A, Eezrazi M, Tachez M (1997), Influence of Nickel Ions on the Surface Charge of Silicon Carbide Particles for Elaboration of Nickel-SiC Electroless Composite Deposits, Surf. Coat. Technol. Vol.96, pp. 300-304 Gutzeit G., and Crehan W.J., 1954, U.S. Patent, Volume 2, Page 690 H Hadley JS, Harland LE (1987), Metal Finishing, Vol.85, No.12, pp.51 Hahnel S., Rosentritt M., Handel G., and Bürgers R., 2009, Surface characterization of dental ceramics and initial streptococcal adhesion in vitro, Dental Materials, Volume 25, Issue 8, Pages 969-975 Hamza, A., Pham, V.A., Matsuura, T, Santerre, J.P., (1997). Development of membranes with low surface energy to reduce the fouling in ultrafiltration applications. Journal of Membrane Science 131, 217-227. Hardy F.G., and Moss B.L., 1979, The effects of the substratum on the morphology of the rhizoids of Fucus germlings, Estuarine and Coastal Marine Science, Volume 9, Issue 5, Pages 577-578 Hasebe, T., Yohena, S., Kamijo, A., Okazaki, Y., Hotta, A., Takahashi, K., Suzuki, T. 2007. Journal of Biomedical Materials Research Part A 83A, 1192. Hauert R. 2003. A review of modified DLC coatings for biological applications Diamond and Related Materials, 12:583-589. Hedin H, Hjorth K, Rehnberg L, et al (2003), External Fixation of Displaced Femoral Shaft Fractures in Children: A Consecutive Study of 98 Fractures, J Orthop Trauma, Volume 17, pp.250-256 Higashitani K, Yoshba A, Tanise T and Murata H (1993), Dispersion of Coagulated Colloids by Ultrasonication, Colloids and Surface A: Physicochem. Eng. Aspects, Vol.81, pp.167-175 Helle K. and Walsh, F. 1997. Transactions of the Institute of Metal Finishing, 75 (2), 53 Hill, A.F. et al. 1997. The same prion strain causes vCJD and BSE. Nature, 389, 448-450 Hilton,D.A. et al. 2002. Accumulation of prion protein in tonsil and appendix: review of tissue samples. BMJ , 325, 633-634 Hilton, D.A., Fathers, E., Edwards, P., Ironside, J.W., Zajicek, J. 1998. Prion immunoreactivity in appendix before clinical onset of variant Creutzfeldt-Jakob disease. Lancet 352, 703-704 Huang Z, Maness P C, Blake DM, Wolfrum EJ, Smolinski SL, Jacoby WA Bactericidal mode of titanium dioxide photocatalysis, Journal of Photochemistry and Photobiology

179
A: Chemistry. Journal of Photochemistry and Photobiology A: Chemistry. 2000;130:163-170 I Ilker, M. F.; Schule, H.; Coughlin, E. B. Macromolecules, 2004, 37(3), 694 Illingworth B, Bianco RW, Weisberg S (2000), In Vivo Efficacy of Silver-Coated Fabric Against Staphylococcus Epidermidis, J Heart Valve Dis, Volume 9, pp.135-141 Ishihara, M., Kosaka, T., Nakamura, T., Tsugawa, K., Hasegawa, M., Kokai, F. , Koga, Y. 2006. Diamond and Related Materials 15:1011. Israelachvili, J.N. (1992). Intermolecular and Surface Forces. 2nd Ed., London, Academic Press. J Jarvis WR (1996), Selected Aspects of the Socioeconomic Impact of Nosocomial Infections: Morbidity, Mortality, Cost, and Prevention, Infect Control Hosp Epidemiol, Volume 17, pp.552-557 Jenner, H.A., Taylor, C.J.L., vanDonk, M., Khalanski, M.,(1997). Chlorination by-products in chlorinated cooling water of some European coastal power stations. Marine Environmental Research 43, 279-293 Johnson EE, Simpson LA, Helfet DL (1990), Delayed Intramedullary Nailing after Failed External Fixation of the Tibia, Clin Orthop, Volume 253, pp.251-257 Jones GLI, Russell AD, Caliskan Z, Stickler DJ (2005), A strategy for the control of catheter blockage by crystalline Proteus mirabilis biofilm using the antibacterial agent triclosan, European Urology 48 (5): 838-845 K Kaiga, N, Seki, T, Iyasu, K, 1989. Ozone treatment in cooling water systems, Ozone: Science and Engineering, Vol.11, No.3, pp.325-338. Katsikogianni M., and Missirlis Y.F., 2004, Concise review of mechanisms of bacterial adhesion to biomaterials and of techniques used in estimating bacteria-material interactions, European Cells & Materials Journal, Volume 8, Pages 37-57 Katsikogianni M., Amanatides E., Mataras D., and Missirlis Y.F., 2008, Staphylococcus epidermidis adhesion to He, He/O2 plasma treated PET films and aged materials: Contributions of surface free energy and shear rate, Colloids and Surfaces B: Biointerfaces, Volume 65, Issue 2, Pages 257-268 Keating JF, Gardner E, Leach WJ, Macpherson S, Abrami G., 1991. Management of tibial fractures with the orthofix dynamic external fixator, J R Coll Surg Edinb, 36 (4): 272-277

180
Kenausis G.L., Voros J., Elbert D.L., Huang N., Hofer R., Ruiz-Taylor L., Textor M., and Spencer N.D., 2000, Poly(L-lysine)-g-poly(ethylene glycol) layers on metal oxide surfaces: Attachment mechanism and effects of polymer architecture on resistance to protein adsorption, Journal of Physical Chemistry B, Volume 104, No. 14, Pages 3298-3309 Kerr A., Effect of Surface Roughness on the Accumulation of Marine Biofouling, Postgraduate Colloquium, 2000 Kerr C, Barker D, Walsh F, Archer J (2000), The Electrodeposition of Composite Coatings Based on Metal Matrix-Included Particle Deposits, T I Met Finish, Vol.78, No. 5, pp.171-178 Kesel, A. and Liedert, R. (2007). “Learning from Nature: Non-toxic Biofouling Control by Shark Skin Effect,” Comparative Biochemistry &. Physiology. A, 146, S130. Kikuchi Y, Sunada K, Iyoda T, Hashimoto K, Fujishima A. Photocatalytic bactericidal effect of TiO2 thin films: dynamic view of the active oxygen species responsible for the effect. J. Photochem. Photobiol. A: Chem. 1997;106:51–56 Kim J, Chisholm BJ, Bahr J. 2007. Adhesion study of silicone coatings: The interaction of thickness, modulus, and shear rate on adhesion force. Biofouling 23: 113-120. Kim MG, Lee KR, Eun KY. 1999. Tribological behavior of silicon-incorporated diamond-like carbon films. Surface and Coatings Technology, 112:204-209. Kinelski_EH, Ocean Thermal Energy Conversion Heat Exchangers: A Review of Research and Development, Marine Technology, Jan 1985, Vol.22, No.1, pp.64-73 Kinelski, E.H. (1978). Proc. of the Ocean Thermal Energy Conversation Conference, 5th, Miami Beach Fla, VIII. 1-VIII. 6. Kingshott P., and Griesser H.J., 1999, Surfaces that resist bioadhesion, Current Opinion in Solid State & Materials Science, Volume 4, No. 4, Pages 403-412 Kite P, Dobbins BM, Wilcox MH, McMahon MJ (1999), Rapid Diagnosis of Central Venous-Catheter-Related Bloodstream Infection Without Catheter Removal, Lancet, Volume 354, No.9189, pp.1504-1507 Kjaer, E.B., 1992. Bioactive Materials For Antifouling Coatings, Progress in Organic Coatings, Vol.20, pp.339-352 Koh, L.L., Hong, W.K., Lip, L.K., (1991). Ecology of marine fouling organisms at eastern Johore strait. Environmental Monitoring and Assessment 19, 319-333. Kreutzwiesner, E., Noormofidi, N., Wiesbrock, F., Kern, W., Rametsteiner, K., Stelzer, F., Slugovc, C., 2010, Contact Bactericides and Fungicides on the Basis of Amino-Functionalized Poly(norbornene)s. C. J. Polym. Sci. Part A: Polym. Chem. 48, 4504-4514.

181
Kukulka D.J., and Devgun M., 2007, Fluid Temperature and velocity effect on fouling, Applied Thermal Engineering, Volume 27, Issue 16, Pages 2732-2744 Kumar PS, Nair PK (1996), Studies on Crystallization of Electroless Ni-P Deposits, J Mater Process Tech, Vol.56, No.1-4, pp.511-520 Kumon K, Hashimoto H, Nishimura M, Monden K, Ono N (2001), Catheter-associated urinary tract infections: impact of catheter materials on their management, International Journal Of Antimicrobial Agents, 17 (4): 311-316 Kvajic, G, 1978. Electromagnetic Water Treatment And Fouling Of Heat Exchangers, Proc of the Ocean Therm Energy Convers Conf, 5th, Miami Beach Fla, Feb 20-22,1978, pp.III. 231-III. 234a Kwok D.Y., and Neumann A.W., 1999, Contact angle measurements and contact angle interpretation, Colloid Interfac., Volume 81, Pages 167-249 Kwok D.Y., and Neumann A.W., 2000, Contact angle interpretation in terms of solid surface tension, Colloids and Surface A: Physicochem. Eng. Aspects, Volume 161, Pages 31-48 L La, B., V, Collinge, J., Pocchiari, M. & Piccoli, F. 2002. Variant Creutzfeldt-Jakob disease in an Italian woman. Lancet, 360, 997 Lai KK, Fontecchio SA. (2002), Use of silver-hydrogel urinary catheters on the incidence of catheter-associated urinary tract infections in hospitalized patients. American Journal of Infection Control, 30 (4): 221-225 Lascovich JC, Scaglione S. 1994. Comparison among XAES, PELS and XPS techniques for evaluation of sp2 percentage in a-C:H, Appl. Surf. Sci. 78:17-23. Laurenson IF, Whyte AS, Fox C, Babb JR., 1999. Contaminated surgical instruments and variant Creutzfeldt-Jakob disease. Lancet, 354(9192):1823 Lee KR, Kim MG, Cho SJ, Eun KY, Seong TY.1997. Structural dependence of mechanical properties of Si incorporated diamond-like carbon films deposited by RF plasma-assisted chemical vapour deposition. Thin Solid Films 308/309:263-267. Leone M, Garnier F, Avidan M and Martin C (2004), Catheter-Associated Urinary Tract Infections in Intensive Care Units, Microbes and Infection, Volume 6, pp.1026-1032 Li BK, Logan BE. The impact of ultraviolet light on bacterial adhesion to glass and metal oxide-coated surface. Colloids and Surfaces B: Biointerfaces. 2005;41: 153-161 Li D., and Neumann A.W., 1990, A reformulation of the equation of state for interfacial tension, Journal of Colloid and Interface Science, Volume 137, No. 1, Pages 304-307

182
Lin CR, Wang TJ, Chen KC, Chang CH. 2001. Nano-tip diamond-like carbon fabrication utilizing plasma sheath potential drop technique, Mater. Chem. Phys. 72:126-129. Lindner, E., 1988. Failure Mechanism of Copper Antifouling Coatings, International Biodeterioration, Vol. 24, pp.247-253 Lira, R, Sengupta, S, 1990. Effects of Wall Shear on Biofilm Growth, Heat Transfer and Fluid Resistance in Shell and Tube Heat Exchangers. American Society of Mechanical Engineers, Heat Transfer Division, (Publication) HTD, Vol.129, pp.101-109 Lira, R, Poteat, LE, Camerota, L, Sengupta, S, 1985. Marine Biofouling Control With Anodically Polarized Protection In Shell And Tube Heat Exchangers. American Society of Mechanical Engineers, Heat Transfer Division, (Publication) HTD, Vol.50, pp.25-32 Little B., and Lavoie D., 1979, Gulf of mexico ocean thermal energy conversion (O.T.E.C.) biofouling and corrosion experiment, in proceedings of the ocean thermal energy conversion (O.T.E.C.) Biofouling, Corrosion And Materials Workshop, Rosslyn, Virginia, USA, pp: 60-61. Argonne National Laboratory, Argonne, Illinois, USA Liu C., 2011, Influence of Surface Free Energy of Ni-P based Coatings on Biofouling Adhesion, PhD thesis, University of Dundee, UK Liu, C and Zhao Q. (2011a), The CQ Ratio of Surface Energy Components Influences Adhesion and Removal of Fouling Bacteria, Biofouling, 27 (3):275–285 Liu C. and Zhao Q. (2011b), Influence of Surface-Energy Components of Ni–P–TiO2–PTFE Nanocomposite Coatings on Bacterial Adhesion. Langmuir, 27(15):9512–9519. Liu Y., 2005, Development and Evaluation of electroless Metal-PTFE composite coatings and their potential applications, PhD thesis, University of Dundee, UK Liu, Y and Zhao, Q. 2003. “Effects of Surfactants On The PTFE Particle Sizes In Electroless Plating Ni-P-PTFE Coatings”, Transactions of the Institute of Metal Finishing, Volume 81 (5):168–171 Liu Y, Zhao Q (2005), Influence of surface energy of modified surfaces on bacterial adhesion, Biophysical Chemistry, 117:39-45 Losiewicz B, Stepien A, Gierlotka D, Budniok A (1999), Composite Layers in Ni-P System Containing TiO2 and PTFE, Thin Solid Films, Vol. 349, No.1-2, pp.43-50 Lucas, K.E., Bergh, J.O., Christian, D.K., (1996). Dechlorination equipment development for shipboard pollution prevention. Naval Engineers Journal 108, 19-25. M Mahan J, Seligson D, Henry SL, Hynes P, Dobbins J (1991), Factors in Pin Tract Infections, Orthopedics, Volume 14, pp.305-308
183
Maki D, Tambyah P (2001), Engineering out the Risk of Infection with Urinary Catheters, Emerg Infect Dis, Volume 7, pp.1-13 Mallory G.O., Product Finishing, 1979 Mallory G.O., and Hajdu J.B., Electroless plating: fundamentals and applications, American electroplaters and surface finishers society, New York, 2000 Martyak NM, Wetterer S, Harrison L, Mcneil M, Heu R, Neiderer AA (1993), Structure of Electroless Nickel Coatings, Plat. Surf. Finish. Vol. 80, No.6, pp.60-64
Mason WT, Khan SN, James CL, Chesser T, Ward A (2005), Complications of Temporary and Definitive External Fixation of Pelvic Ring Injuries, Injury, Volume 36, pp.599-604 Masse A, Bruno A, Bosetti M, Biasibetti A, Cannas M, Gallinaro P (2000), Prevention of Pin Track Infection in External Fixation with Silver Coated Pins: Clinical and Microbiological Results, J Biomed Mater Res, Volume 53, pp.600-604 Matsunaga T, Tomoda R, Nakajima T, Wake H, Photoelectrochemical sterilization of microbial cells by semiconductor powders Photoelectrochemical sterilization of microbial cells by semiconductor powders. FEMS Microbiology Letters. 1985; 29:211-214 Mauer D, Merkow RL, Gustilo RB (1989), Infection after Intramedullary Nailing of Severe Open Tibial Fractures Initially Treated with External Fixation, J Bone Joint Surg Am, Volume 71A, pp.835-838 Mathiyarasu J., Palaniswamy N., and Muralidharan V.S., 2002, Cyclic voltammetric studies on the electrochemical behaviour of cupronickel in sodium chloride solution, Bulletin of Electrochemistry, Volume 18, No. 11, Pages 489-495 Matsuda H, Nishira M, Kiyono Z, Takano O (1995), Effect of Surfactants Addition on The Suspension Of PTFE Particles In Electroless Plating Solutions, T I Met Finish, Vol.73, No.1, pp.16-18 McGowan JE Jr (2001), Economic Impact of Antimicrobial Resistance, Emerg. Infect. Dis., Volume 7, pp.286-292 McGraw JW, Lim EVA (1988), Treatment of Open Tibial-Shaft Fractures. External Fixation and Secondary Intramedullary Nailing, J Bone Joint Surg Am., Volume 70A, pp.900-911 McGuire J., and Swartzel K.R., Influence of solid surface energetics on macromolecular adsorption from milk, American Institute of Chemical Engineers, National Meeting, 1987 Medilanski E, Kaufmann K, Wick LY, Wanner O, Harms H. 2002. Influence of the surface topography of stainless steel on bacterial adhesion. Biofouling 18:193 – 203.
184
Melo L. F., and Bott T. R., 1997, Biofouling in water systems, Experimental Thermal and Fluid Science, Volume 14, Issue 4, Pages 375-381 Mermel LA (2000), Correction: Catheter-Related Blood Stream Infections, Ann Intern Med, Volume 5, pp.395 Meyer A., Baier R., Wood C.D., Stein J., Truby K., Holm E., Montemarano J., Kavanagh C., Nedved B., Smith C., Swain G., and Wiebe D., 2006, Contact angle anomalies indicate that surface-active eluates from silicone coatings inhibit the adhesive mechanisms of fouling organisms, Biofouling, Volume 22, Issue 6, Pages 411 – 423 Milne, A., Callow, M.E. (1985). Polymers in Marine Enviroment, in Smith, R. (Eds), The Institute of Marine Engineers, London, 229-233. Moonir-Vaghefi SM, Saatchi A, Hejazi J (1997), The Effect of Agitation on Electroless Nickel-Phosphorus-Molybdenum Disulfide Composite Plating, Metal Finish. Vol. 95, No.6, pp.102-106 Morris NS, Stickler DJ, Winters C (1997). Which indwelling urethral catheters resist encrustation by Proteus mirabilis biofilms? British J. of Urology, 80 (1): 58-63 Mostafavi HR, Tornetta III P (1997), Open Fractures of the Humerus Treated with External Fixation, Clin Orthop Relat Res, Volume 337, pp.187-197 Mott I.E.C., Biofouling and studies using simulated cooling water, PhD thesis, University of Birmingham, UK, 1991 Müller-Steinhagen, H., Zhao, Q., (1997). Investigation of low fouling surface alloys made by ion implantation technology. Chemical Engineering Science 52, 3321-3332. Müller-Steinhagen, H., Zhao, Q., Helali-Zadeh, A., Ren, X. 2000. The Effect of Surface Properties on CaSO4 Scale Formation During Convective Heat Transfer and Subcooled Flow Boiling, Canadian Journal of Chemical Engineering, Volume78 (1):12–20. Müller-Steinhagen, H. (2013), Heat Exchanger Fouling and Cleaning, http://www.heatexchanger-fouling.com/ Mussalli, Y.G., Tsou, J. (1989). Proc. of the 51st American Power Conference, 1094-1099.
N Navabpour, P, Teer, D., Su, XJ, Liu, C., Wang, S., Zhao, Q., Donik, C., Kocijan, A., Jenko, M., 2010, Optimisation of the properties of siloxane coatings as antibiofouling coatings: Comparison of PACVD and hybrid PACVD-PVD coatings, Surface and Coatings Technology, Volume 204 (20):3188–3195 Nebot E., Casanueva J.F., Casanueva T., and Sales D., 2007, Model for fouling deposition on power plant steam condensers cooled with seawater: Effect of water velocity and tube material, International Journal of Heat and Mass Transfer, Volume 50,

185
Issues 17-18, Pages 3351-3358 Neumann A.W., Good R.J., and Hope C.J., 1974, An equation-of–state approach to determine surface tensions of low-energy solids from contact angles, Journal of Colloid and Interface Science, Volume 49, Pages 291-304 Nishira M, Takano O (1994), Friction And Wear Characteristics of Electroless Ni-P-PTFE Composite Coatings, Plat Surf Finish, Vol.81, No.1, pp.48-50 Nishira M, Yamagishi K, Matsuda H, Suzuki M, Takano O (1996), Uniform Dispersibility of PTFE Particles in Electroless Composite Plating, T I Met Finish, Vol.74, No.2, pp.62-64 Nosetani, T, Sato, S, Onda, K, Kashiwada, J, Kawaguchi, K, 1981. Effect of Marine Biofouling on the Heat Transfer Performance of Titanium Condenser Tubes. Sumitomo Light Metal Technical Reports, Vol.22, No.1- 2, pp.30-41 Nosetani, T, Hotta, Y, Sato, S, 1987. Improvement Of Surface Condenser Performance By In-Situ Artificial Protective Film Coating, Sumitomo Keikinzoku Giho/Sumitomo Light Metal Technical Reports, Vol.28, No.1, pp.29-38 Nosetani, T, Sato, S, Onda, K, Kato, Y, 1988. Biofouling Control of Titanium Condenser Tubes By New-Type Abrasive Sponge Balls, Sumitomo Keikinzoku Giho/Sumitomo Light Metal Technical Reports, Vol.29, No.4, pp.40-49 Nosetani, T, Hotta, Y, Sato, S, Onda, K, Nakamura, T, Kato, Y, 1989. Biofouling Control of Titanium Condenser Tubes By New-Type Abrasive Sponge Balls. American Society of Mechanical Engineers, Heat Transfer Division, (Publication) HTD, Vol.108, pp.281-288 Novak, L, Comparison Of The Rhine River And The Oresund Sea Water Fouling And Its Removal By Chlorination. American Society of Mechanical Engineers, Heat Transfer Division, (Publication) HTD, 1981, Vol.17, pp.61-66. Novak. L, Comparison Of The Rhine River And The Oresund Sea Water Fouling And Its Removal By Chlorination, Journal of Heat Transfer, Transactions ASME, NOV 1982, Vol.104,No.4, pp.663-669 O O’Connor DJ, Sexton BA, Smart RStC (1992), Surface Analysis Methods in Materials Science, Spring-Verlag, Berlin. ODonnell, J., Improve Seawater Cooling With Titanium Finned Tubes. Hydrocarbon Processing, Oct 1992, Vol.71, No.10, pp.61-63, 65 O’Grady NP et al. (2002), Guidelines for the Prevention of Intracscular Catheter-Related Infections, MMWR, Volume 51, pp.1-29

186
Okpalugo T, Ogwu A, Maguire P, McLaughlin J. (2001). Technology and Healthcare 9:81. Oliverira, R., (1997). Understanding adhesion: a means for preventing fouling. Experimental Thermal and Fluid Science 14, 316-322. Öncü S, Sakarya S (2003), Central Venous Catheter-Related Infections: An Overview with Special Emphasis on Diagnosis, Prevention and Management, The Internet Journal of Anesthesiology, Volume 7, Number 1 Owens D.K., and Wendt R.C., 1969, Estimation of the surface free energy of polymers, Journal of Colloid and Interface Science, Volume 13, Pages 1714-1747 P Paal C., and Frederici L., 1931, Berichte der Deutschen Chemischen Gesellschaft, Volume 64, , Issue 9, Page 2561-2569 Paley D (1990), Problems, Obstacles and Complications of Limb Lengthening by the Ilizarov Technique, Clin Orthop, Volume 250, pp.81-104 Palraj S., and Venkatachari G., 2008, Effect of biofouling on corrosion behaviour of grade 2 titanium in mandapam seawaters, Desalination, Volume 230, Issues 1-3, Pages 92-99 Parameswaran AD, Roberts CS, Seligson D, et al. (2003), Pin Tract Infection with Contemporary External Fixation: How Much of A Problem? J Orthop Trauma, Volume 17, pp.503-507 Park JH, Cho YW, Kwon IC, Jeong SY, Bae YH (2002), Assessment of PEO/PTMO multiblock copolymer/segmented polyurethane blends as coating materials for urinary catheters: in vitro bacterial adhesion and encrustation behavior, Biomaterials 23 (19): 3991-4000 Pasmore M., Todd P., Smith S., Baker D., Silverstein J., Coons D., and Bowman C.N., 2001, Effects of ultrafiltration membrane surface properties on Pseudomonas aeruginosa biofilm initiation for the purpose of reducing biofouling, Journal of Membrane Science, Volume 194, Issue 1, Pages 15-32 Patterson MM (2005), Multicenter Pin Care Study, Orthop Nurs, Volume 24, pp.349-360 Patent US4 419 248 The Removal Of Microbial Fouling By Ice Nucleation Pearson ML (1996), Guideline for Prevention of Intravascular Device-Related Infections. Part I. Practices Advisory Committee, Am J Infect Control, Volume 24, pp.262-277 Pereni, CI, Zhao, Q., Liu, Y. , Abel, E., 2006, Surface Free Energy Effect On Bacterial Adhesion, Colloids and Surfaces B: Biointerfaces 48:143-147

187
Ploof L.,2008. Electroless Nickel Composite Coatings, Advanced Material and Processes, VOL 166; NUMB 5, pages 36-38 Plowman R, Graves N, Griffin M, Roberts JA, Swan AV, Cookson B, Taylor L (1999), Socio-economic Burden of Hospital Acquired Infection, PHLS, London Plowman R, Graves N, Esquivel J, Roberts JA (2001), An economic model to assess the cost and benefits of the routine use of silver alloy coated urinary catheters to reduce the risk of urinary tract infections in catheterized patients, Journal of Hospital Infection, 48:33-42 Powell, CA, Preventing Biofouling With Copper-Nickel Alloys, Materials World, Apr 1994, Vol.2, No.4, pp.181-183 Preiser H.S., Ticker A., Bohlander G.S., Taylor D.W., Costlow J.D., and Tipper R.C., 1984, Marine Biodeterioration: An Interdisciplinary Study, Naval Institute Press, MD, USA, London E. and F. N. SPON, Page 223 Prescott LM, Harley JP, Klein DA (2005), Microbiology, New York, McGraw-Hill Pritchard A.M., 1987, The Economics of fouling. in fouling science and technology, Edts. Melo, L.F, Bott, T.R. and Bernardo, C.A. NATO ASl Series E, Vol. 145, KIuwer Academic Publishers Prusiner, S.B. et al. 1990. Transgenetic studies implicate interactions between homologous PrP isoforms in scrapie prion replication. Cell, 63, 673-686 Quirynen M., and Bollen C.M.L., 1995, The influence of surface-roughness and surface-free energy on supragingival and subgingival plaque-formation in man -A review of the literature, Journal of Clinical Periodontology, Volume 22 , Pages 1-14 R Raad I, Hanna H (2002), Intravascualr Catheter-Related Infection, Arch Intern Med, Volume 162, pp.871-878 Raad I, Darouiche RO (1996), Catheter Related Septicaemia: A Risk Reduction, Infect Med, Volume 13, pp.807-812; 815-816; 823 Rajagopal, S., Venugopalan, V.P., Van der Velde, G., Jenner, H.A., (2003). Comparative chlorine and temperature tolerance of the oyster Crassostrea madrasensis: Implications for cooling system fouling, 19, 115-124 Ralston, E. and Swain, G. (2009). “Bioinspiration – the Solution for Biofouling Control,” Bioinspiration and Biomimetics, 4, 015007. Rankin, B. H. and Adamson, W. L. (1973) Scale formation as related to evaporation surface conditions. Desalination 13, 63-87.

188
Richards MJ, Edwards JR, Culver DH, Gaynes RP (1999), Nosocomial Infections in Medical Intensive Care Units in the United States. National Nosocomial Infections Surveillance System, Crit. Care Med., Volume 27, pp.887-892 Robertson J. 2002. Diamond-like amorphous carbon. Materials Science and Engineering: R: Reports, 37:129-281. Rosmaninho R, Santos O, Nylander T, Paulsson M, Beuf M, Benezech T, Yiantsios S, Andritson S, Karabelas A, Rizzo G, Mu¨ ller-Steinhagen H, Melo LF. 2006. Modified stainless steel surfaces targeted to reduce fouling –evaluation of fouling by milk components. J Food Eng 80:1176–1187. Ritter_RB, Suitor_JM, Handling and Disposal of Solid Wastes from Steam Power Plants, Proc of the Natl Conf on Complete Watereuse, 2nd: Water's Interface with Energy, Air and Solids, Chicago, Ill,, 1975, pp.604-609 Ritter, R.B. and Suitor, J.W., Fouling Research on Copper and its Alloys-Seawater Studies, Heat Transfer Research,Inc,June 1976(Rev.1).pp137. Roosjen A., van Der Mei H.C., Busscher H.J., and Norde W., 2004, Microbial adhesion to poly(ethylene oxide) brushes: Influence of polymer chain length and temperature, Langmuir, Volume 20, Issue 25, Pages 10949-10955 Rosmaninho R, Santos O, Nylander T, Paulsson M, Beuf M, Benezech T, et al.2007. Modified stainless steel surfaces targeted to reduce fouling—evaluation of fouling by milk components. J Food Eng. 80:1176–87. Roux F.G., 1916, U.S. Patent No. 119612870 S Saikhwan P., Geddert T., Augustin W., Scholl S., Paterson W.R., and Wilson D.I., 2006, Effect of surface treatment on cleaning of a model food soil, Surface and Coatings Technology, Volume 201, Issues 3-4, Pages 943-951 Saint S (2000), Clinical and Economic Consequences of Nosocomial Catheter-Related Bacteriuria, Am J Infect Control, Volume 28, pp.68-75 Samano EC, Soto G, Olivas A, Cota L. 2002. DLC thin films characterized by AES, XPS and EELS. Applied Surface Science, 202:1-7 Santos O., Nylander T., Rosmaninho R., Rizzo G., Yiantsios S., Andritsos N., Karabelas A., Müller-Steinhagen H., Melo L., Boulangé-Petermann L., Gabet C., Braem A., Trägårdh C., and Paulsson M., 2004, Modified stainless steel surfaces targeted to reduce fouling–surface characterization, Journal of Food Engineering, Volume 64, Issue 1, Pages 63-79 Scardino, A.J., Hudleston, D., Peng, Z., Paul, N.A., and De Nys, R. (2009). “Biomimetic Characterisation ooofff Key Surface Parametersfor te Development of Fouling Resistant Materials,” Biofouling, 25(1), 83-93.
189
Schierholz JM, Lucas LJ, Rump A, Pulverer G. (1998), Efficacy of sliver-coated medical devices. Journal of Hospital Infection, 40:257-262 Schierholz JM, Beuth J (2002), Implant Infections: a Haven for Opportunistic Bacteria, J. Hosp. Infect., Volume 49, pp.87-93 Scholder R., and Haken H.I., 1931, Berichte der Deutschen Chemischen Gesellschaft, Volume 64B, Pages 2870 Scholder R., and Heckal H., 1931, Zeitschrift für anorganische und allgemeine Chemie, Volume 198, Page 329 Seki, A, Auker, B, Fujioka, R, Ono, P, Takahashi, P, 1985. Ultraviolet Irradiation For Controlling Biofouling In OTEC Heat Exchangers: A Preliminary Report. Oceans (New York), pp.1273-1278 Seki, A, Auker, B, Fujioka, R, Ono, P, Takahashi, P, 1986. OTEC Heat Exchangers Biofouling Control By Ultraviolet Irradiation, Oceans (New York), No.1986., pp.232-237 Shao, W., Zhao, Q., Abel, E.W., Bendavid, A. 2010. Influence of interaction energy between Si-doped diamond-like carbon films and bacteria on bacterial adhesion under flow conditions, J. Biomedical Materials Research Part A Volume 93 (1): 133–139. Sharma PK, Rao KH. 2002. Analysis of different approaches for evaluation of surface energy of microbial cells by contact angle goniometry. Adv. Colloid Interface Sci. 98:341-463. Sharma PK, Rao KH (2003), Adhesion of Paenibacillus Polymyxa on Chalcopyrite and Pyrite: Surface Thermodynamics and Extended DLVO Theory, Colloids Surface B: Biointerfaces, Volume 29, pp.21-38 Sheng S, Sacher E, Yelon A. 2001. Structural changes in amorphous silicon studied by X-ray photoemission spectroscopy: a phenomenon independent of the Staebler–Wronski effect?. J. Non-Cryst Solids 282:165-172. Sherertz RJ, Ely EW, Westbrook DM, Gledhill KS, Streed SA, Kiger B, Flynn L, Hayes S, Strong S, Cruz J, Bowton DL, Hulgan T (2000), Education of Physicians-in-Training can Decrease the Risk for Vascular Catheter Infection, Am Intern Med, Volume 132, No.8, pp.641-648 Shone, EB, Grim, GC, 1974. Problems in Seawater Circulating Systems. British Corrosion Journal, , No.1, pp.32-38 Shone, EB, Grim, GC, 1986. Experience With Seawater-Cooled Heat Transfer Equipment. Marine Engineers Review, Mar 1986, No.Mar 1986, pp.20-23 Shuji Y, Chiba N (1996), Patent No.EP 0 737 759 A1, Oct.

190
Sims M, Saleh M (2000), External Fixation - the Incidence of Pin Site Infection: A Prospective Audit, J Orthop Res, Volume 4, pp.59-63 Singh A, Ehteshami G, Massia S, He J, Storer RG and Raupp G (2003), Glial Cell and Fibroblast Cytotoxicity Study on Plasma-deposited Diamond-like Carbon Coatings, Biomaterials, Volume 24, pp.5083-5089 Sipahi C., Anil N., and Bayramlib E., 2001, The effect of acquired salivary pellicle on the surface free energy and wettability of different denture base materials, Journal Of Dentistry, Volume 29, Issue 3, Pages 197-204 Sleigh M.A., Microbes in the sea, Chichester Ellis Horwood, 1987 Sriyutha Murthy P., Venkatesan R., Nair K.V.K., and Ravindran M., 2004, Biofilm control for plate heat exchangers using surface seawater from the open ocean for the OTEC power plant, International Biodeterioration and Biodegradation, Volume 53, Pages 133–140 Staia MH, Castillo EJ, Puchi ES, Lewis B, Hintermann HE (1996), Wear Performance and Mechanism of Electroless Ni-P Coating, Surf. Coat. Technol., Volume 86-87, pp.598-602 Steinhagen R., Müller-Steinhagen H.M., and Maani K., 1990, Heat Exchanger Applications, Fouling Problems and Fouling Costs in New Zealand Industries, Ministry of Commerce Report RD8829 Straight M.R., Sudarshan T.S., and Wilson J.H., 1988, Significance of defects in fatigue of Cu-Ni/steel welds, Engineering Fracture Mechanics, Volume 31, Issue 4, Pages 673-681 Strauss S.D., 1989, New methods: chemical improve control of biological fouling, Power , Pages 51-52 Su, X.J., Zhao, Q., Wang, S., Bendavid, A. 2010, Modification of diamond-like carbon coatings with fluorine to reduce biofouling adhesion, Surface and Coatings Technology, Volume 204 (5):2454–2458
Su, X.J., Zhao, Q., Wang, S., Zhang, S., Noormofidi N., Kreutzwiesner, E., Slugovc, C. 2011. Antimicrobial Efficiency of Metal-Polymer Nanocomposite Coatings. Euro-Therm Heat Exchanger Fouling and Cleaning - June 05-10, 2011, Fodele Beach & Water Park Holiday Resort, Crete, Greece Su, X.J. Zhao, Q., Wang, S., Kienberger, J., Slugovc, C., 2012. Coating reducing the attachment of bacteria. EU Patent Application. 1st June 2012. Swain G., Proceedings of the International Symosium on Sea Water Drag Reduction, The Naval Undersea Warfare Center, Newport, 1998, Pages 155-161

191
T Tachev D, Georgieva J, Armyanov S (2001), Magnetothermal Study of Nanocrystalline Particle Formation in Amorphous Electroless Ni-P And Ni-Me-P Alloys, Electrochim Acta, Volume 47, pp.359-369 Takahoshi, P., 1986. Study of the Non-Chemical Methods of Biofouling Control in OTEC Heat Exchangers, Solar Energy Research Institute, April, 1986 Taylor R.L., Verran J., Lees G.C., and Ward A.J.P., 1998, The influence of substratum topography on bacterial adhesion to polymethyl methacrylate, Journal of Materials Science: Materials in Medicine, Volume 9, Pages 17-22 Taylor, D.M. et al. 1994. Decontamination studies with the agents of bovine spongiform encephalopathy and scrapie. Arch. Virol. 139, 313-326 Taylor, D.M., McConnell, I., Fernie, K. 1996. The effect of dry heat on the ME7 strain of mouse-passaged scrapie agent. J. Gen. Virol. 77, 3161-3164 Thibon P, Le Coutour X, Leroyer R, Fabry J. (2000), Randomized multi-centre trial of the effects of a catheter coated with hydrogel and silver salts on the incidence of hospital-acquired urinary tract infections. J. Of Hospital Infection; 45 (2):117-124 Tomozeiu N, van Faassen EE, Palmero A, Arnoldbik WM, Vredenberg AM, Habraken FHPM. 2004. Study of the a-Si/a-SiO2 interface deposited by r.f. magnetron sputtering. Thin Solid Films 447-448:306-310. Torbin, RN and Mussalli, Y.G., The Cost Effectiveness of Alternative Condenser Biofouling Control Methods, EPRI Symp. Proc., pp. 497-517, Atlanta, 1979. Tozzi P, Al-Darweesh A, Vogt P, Stumpe F. (2001), Silver-coated prosthetic heart valve: a double-bladed weapon. European J of Cardio-Thoracic Surgery, 19:729-731 Tsai Y.P., 2005, Impact of flow velocity on the dynamic behaviour of biofilm bacteria, Biofouling, Volume 21, Issue 5-6, Pages 267–277 Tsibouklis J., Stone M., Thorpe A.A., Graham P., Peters V., Heerlien R., Smith J.R., Green K.L., and Nevell T.G., 1999, Preventing bacterial adhesion onto surfaces: The low-surface-energy approach, Biomaterials, Volume 20, Issue 13, Pages 1229-1235 Tsibouklis J., Stone M., Thorpe A.A., Graham P., Nevell T.G., Ewen R.J., 2000, Inhibiting bacterial adhesion onto surfaces: the non-stick coating approach, International Journal of Adhesion and Adhesives, Volume 20, Issue 2, Pages 91-96 Tsou, J., Mussalli, Y.G., (1988). American Society of Mechanical Engineers, Heat Transfer Division, 1, 231-237. Tulsi SS, Ebdon P (1982), Electroless Nickle-PTFE Composite Coatings, UK National Corrosion Conference, London

192
Tulsi SS (1983), Electroless Nickel-PTFE Composite Coatings, Trans. Inst. Metal Finish. Vol. 61, pp. 142-149. Tulsi, S.S., (1983). Composite PTFE-nickel coatings for low friction applications. Finishing 7, 14-18. Tunney MM, Gorman SP (2002), Evaluation of a poly(vinyl pyrollidone)-coated biomaterial for urological use, Biomaterials 23 (23): 4601-4608 Tuthill, A.H., Guidelines for the Use of Cooper Alloys in Sea Water, Materials Performance, Vol. 26, No 9, 1987. pp 12-22.
V
van Dijk J., Herkstroter F., Busscher H., Weerkamp A., Jansen H. and Arends J., 1987, Surface-free energy and bacterial adhesion: An in vivo study in beagle dogs, Journal of Clinical Periodontology, Volume 14, Issue 5, Pages 300–304 van Oss, C.J. (1994). Interfacial Forces in Aqueous Media. Marcel Dekker, New York. van Oss, C.J., Good, R.J., Chaundhury, M.K., (1988). Additive and nonadditive surface-tension components and the interpretation of contact angles. Langmuir 4, 884-891. van Oss C.J., Good R.J., and Chaudhury M.K., 1986, The role of van der waals forces and hydrogen bonds in ‘hydrophobic interactions’ between biopolymers and low energy surfaces, Journal of Colloid and Interface Science, Volume 111, No. 2, Pages 378-390 Veenstra DL, Saint S, Saha S, Lumley T, Sullivan SD (1999), Efficacy of Antiseptic-Impregnated Central Venous Catheters in Preventing Catheter-Related Bloodstream Infection: A Meta-Analysis, JAMA, Volume 281, pp.261-267 Venugopalan, V.P., Thyagarajan, V. and Nair, K.V.K., 1997, Marine growth in large seawater intake systems: Problems and their control, Proc. 2nd Indian Nat. Conf. Harb. and Ocean eng., Thiruvananthapuram (India), Voloume 1, Pages 640-647 Verwey EJW, Overbeek JTG (1955), Theory of the Stability of Lyophobic Colloids, Journal of Colloid Science, Volume 10, Issue 2, April 1955, Pages 224-225. Videla H.A., 1994, Biofilms and corrosion interactions on stainless steel in seawater, International Biodeterioration & Biodegradation, Volume 34, Issues 3-4, Pages 245-257 Vishwakarma V., and Josephine J., and George R.P., 2009, Antibacterial copper-nickel bilayers and multilayer coatings by pulsed laser deposition on titanium, Biofouling, Volume 25, Issue 8, Pages 705-710 Visser H., 1998, The role of surface forces in fouling of stainless steel in the dairy industry, Journal Of Dispersion Science And Technology, Volume 19, No. 6-7, Pages 1127-1150

193
Vladkova T., 2007, surface engineering for non-toxic biofouling control review, Journal of the University of Chemical Technology and Metallurgy, Volume 42, No. 3, Pages 239-256 von Eiff, C, Jansen B, Kohnen W, Becker K (2005), Infections Associated with Medical Devices: Pathogenesis, Management and Prophylaxis, Drugs, Volume 65, pp.179-214 W Wang, C., 2008, Development and Evaluation of Anti-Bacterial Nano-Biomaterials for Medical Devices and Implants, PhD thesis, University of Dundee. Wang XP, Yu Y, Hu XF, Gao L. Hydrophilicity of TiO2 films prepared by liquid phase deposition Hydrophilicity of TiO2 films prepared by liquid phase deposition Thin Solid Films. 2000; 371:148-152 Waite, T.D. and Fagan, J.R.,1979. Summary of Biofouling Control Alternatives, EPRI Symp. Proc., pp.441-462, Atlanta Wassall MA, Santin M, Isalberti C, Cannas M, Denyer SP. (1997), Adhesion of bacteria to stainless steel and silver-coated orthopedic external fixation pins. Journal of Biomedical Materials Research, 36:325-330 Wheelwright EF, Court-Brown CM (1992), Primary External Fixation and Secondary Intramedullary Nailing in the Treatment of Tibial Fractures, Injury, Volume 23, pp.373-376 Will,R.G. et al. 1996. A new variant of Creutzfeldt-Jakob disease in the UK. Lancet, 347, 921-925. Wu S., 1971, The work of adhesion tool determines an index of wetting ability of a liquid for a solid, Journal of Polymer Science, Volume C34, Page 19 Wu WJ, Hon MH. 1999. Thermal stability of diamond-like carbon films with added silicon. Surface and Coatings Technology, 111:134-140. Xu Z.M., Zhang Z.B., and Yang S.R., Costs Due to Utility Fouling in China, ECI Symposium Series, Volume RP5: Proceedings of 7th International Conference on Heat Exchanger Fouling and Cleaning - Challenges and Opportunities, Engineering Conferences International, Tomar, Portugal, July 1 - 6, 2007 Y Yebra D.M., Kiil S., and Dam-Johansen K., 2004, Antifouling technology-past, present and future steps towards efficient and environmentally friendly antifouling coatings, Progress in Organic Coating, Volume 50, Issue 2, Pages 75-104 Yokoyama K, Itoman M, Tanaka K, et al. (1988), Secondary Undreamed Intramedullary Nailing Following External Fixation and Acute Flap Coverage for Type IIIB Open

194
Tibia Fractures: A Report of Three Successful Cases, J Orthop Surg, Volume 6, pp.71-77 Yoon J., and Lund D.B., 1994, Magnetic treatment of milk and surface treatment of plate heat exchangers: Effects on milk fouling, Journal of Food Science, Volume 59, Issue 5, Pages 964 – 969
Yoshinari M, Oda Y, Kato T, Okuda K. 2001. Influence of surface modifications to titanium on antibacterial activity in vitro. Biomaterials. 22:2043–8. Young, T., (1805). An essay on the cohesion of fluids. Phylosophical Transactions of the Royal Society London 95, 65-87. Z Zajíčková L, Veltruská K, Tsud N, Franta D. 2001, XPS and ellipsometric study of DLC/silicon interface. Vacuum 61:269-273.
Zettler, HU., Weiß, M., Zhao, Q., H. Müller-Steinhagen, H., 2005. Influence of Surface Properties and Characteristics on Fouling in Plate Heat Exchangers, Heat Transfer Engineering, Volume 26 (2):3–17 Zhao, Q., Liu, Y., Müller-Steinhagen, H., Liu, G., 2002. “Graded Ni-P-PTFE Coatings and Their Potential Applications”, Surface & Coatings Technology, Volume 155 (2-3):279–284 Zhao, Q., Müller-Steinhagen, H., 2002. Intermolecular and adhesion forces of deposits on modified heat transfer surfaces. in Heat exchanger fouling – Fundamental Approches and Technical Solutions, eds. H. Müller-Steinhagen et.al., Publico Publ., Essen, pp. 41-46. Zhao, Q., Wang S. and Müller-Steinhagen, H. 2004a. Tailored Surface Free Energy of Membrane Diffusers to Minimize Microbial Adhesion, Applied Surface Science, 230 (1-4):371–378. Zhao Q., 2004b, Effect of surface free energy of graded Ni–P–PTFE coatings on bacterial adhesion, Surface and Coatings Technology, Volume 185, Issues 2-3, Pages 199-204 Zhao Q, Liu Y, Abel EW. 2004c. Effect of temperature on the surface free energy of amorphous carbon films. Journal of Colloid and Interface Science, 280:174-183. Zhao, Q., Liu, Y., Wang, S., Müller-Steinhagen, H. 2005a. Effect of surface free energy on the adhesion of biofouling and crystalline fouling. Chemical Engineering Science, 60 (17):4858–4865 Zhao Q, Wang X. 2005b. Heat transfer surfaces coated with fluorinated diamond-like carbon films to minimize scale formation. Surface and Coatings Technology, 192:77-80.

195
Zhao Q, and Liu Y., 2005c, Electroless Ni–Cu–P–PTFE composite coatings and their anticorrosion properties, Surface and Coatings Technology, Volume 200, Pages 2510-2514 Zhao Q, Liu Y, Wang C. 2005d, Development and evaluation of electroless Ag-PTFE composite coatings with anti-microbial and anti-corrosion properties Applied Surface Science, 252(5):1620-1627 Zhao Q, Liu Y (2006), Modification of stainless steel surfaces by electroless Ni-P and small amount of PTFE to minimize bacterial adhesion, Journal of Food Engineering, 72 (3):266-272 Zhao Q., Liu Y., Wang C., Wang S., Peng N., and Jeynes C., 2007a, Bacterial adhesion on ion-implanted stainless steel surfaces, Applied Surface Science, Volume 253, Issue 21, 31, Pages 8674-8681 Zhao Q, Liu Y, Wang C, Wang S 2007b. Evaluation of bacterial adhesion on Si-doped diamond-like carbon films. Applied Surface Science, 253:7254-7259 Zhao, Q., Wang, C., Liu Y., Wang, S. 2007c. Bacterial Adhesion on the Metal-Polymer Composite Coatings, International Journal of Adhesion and Adhesives 27 (2):85–91. Zhao Q, Liu Y, Wang C, Wang S, Peng N, Jeynes C. 2008. Reduction of bacterial adhesion on ion implanted stainless steel surfaces, Medical Engineering & Physics, Volume 30 (3):341–349 Zhao, Q., Su, XJ., Wang, W., Zhang, X., Navabpour, P., Teer, D. 2009, Bacterial removal properties of Si-and N-doped diamond-like carbon coatings, Biofouling 25 (5):377 – 385 Zobeley, E., Flechsig, E., Cozzio, A., Masato, E., Weissmann, C. 1999. Infectivity of scrapie prions bound to a stainless steel surface. Molecular Medicine 5, 240-243 Su XJ' PUBLICATIONS Su, X.J., Zhao, Q., Wang, S., Bendavid, A. 2010, Modification of diamond-like carbon coatings with fluorine to reduce biofouling adhesion, Surface and Coatings Technology, Volume 204 (5):2454–2458
Su, X.J., Zhao, Q., Wang, S., Zhang, S., Noormofidi N., Kreutzwiesner, E., Slugovc, C. 2011. Antimicrobial Efficiency of Metal-Polymer Nanocomposite Coatings. Euro-Therm Heat Exchanger Fouling and Cleaning - June 05-10, 2011, Fodele Beach & Water Park Holiday Resort, Crete, Greece Su, X.J. Zhao, Q., Wang, S., Kienberger, J., Slugovc, C., 2012. Coating reducing the attachment of bacteria. EU Patent Application. 1st June 2012. Akesso, L., Navabpour, P, Teer, D., Pettitt, ME., Callow, ME., Liu, C., Su, XJ., Wang, S., Zhao, Q., Donik, C., Kocijan, A., Jenko, M., Callow, JA., 2009a, Deposition

196
parameters to improve the fouling-release properties of thin siloxane coatings prepared by PACVD. Applied Surface Science, Volume 255 (13-14):6508–6514 Cwikel, D., Zhao, Q., Liu, C., Su, XJ, Marmur,A., 2010, Comparing Contact Angle Measurements and Surface Tension Assessments of Solid Surfaces, Langmuir, Volume 26(19):15289–15294 Ederth, T.; Ekblad, T.; Petitt, M.; Conlan, S.; Du, CX; Callow, M; Callow, J; Mutton, R; Clare, A; D’Souza, F; Donnelly, G; Bruin, A; Willemsen, P; Su, XJ; Wang, S; Zhao, Q; Hederos, M; Konradsson, P; Lieberg, B. 2011, Resistance of galactoside-terminated alkanethiol self-assembled monolayers to marine fouling organisms, ACS Applied Materials & Interfaces, 3, 3890–3901. Navabpour, P, Teer, D., Su, XJ, Liu, C., Wang, S., Zhao, Q., Donik, C., Kocijan, A., Jenko, M., 2010, Optimisation of the properties of siloxane coatings as antibiofouling coatings: Comparison of PACVD and hybrid PACVD-PVD coatings, Surface and Coatings Technology, Volume 204 (20):3188–3195 Zhao, Q., Su, XJ., Wang, W., Zhang, X., Navabpour, P., Teer, D. 2009, Bacterial removal properties of Si-and N-doped diamond-like carbon coatings, Biofouling 25 (5):377 – 385
Q. Zhao, XJ Su, S Wang, Development and evaluation of modified DLC coatings to minimize bacterial adhesion. International Conference on Heat Exchanger Fouling and Cleaning, 14-19 June 2009, Schladming, 8973, AUSTRIA
Q. Zhao, XJ Su, S Wang, X Zhang, P. Navabpour, D Teer, Development of nano-structured diamond-like carbon coatings with biofouling-resistant property. Proceedings of European and International Forum on Nanotechnology, 2-5 June, 2009, Prague, Czech Republic, Page 70. }
Top Related