


Languages
Pages
Legal


Union Budget 2020-21A deeper look from the
standpoint of
Trade, Technology and Trust
Rajat Kathuria
ICRIER
February 8, 2020

Open Economy Macro
• In an open economy, national income (Y) or GDP can be split into consumption (C), investment (I), government expenditure (G) and net exports (X-M)
• Y = C+I+G+(X-M)
• Need $ 1 trillion of exports to reach $5 trillion economy
• Export clusters matter, Exchange rate matters, Export logistics are important and Tax refund’s matter
• Networked products (Assemble in India)
• Have FTA’s been harmful? Economic Survey does not think so
• The idea sits uneasily with continued increase in customs duties.
•But an Investment led strategy is inevitablyan export led strategy
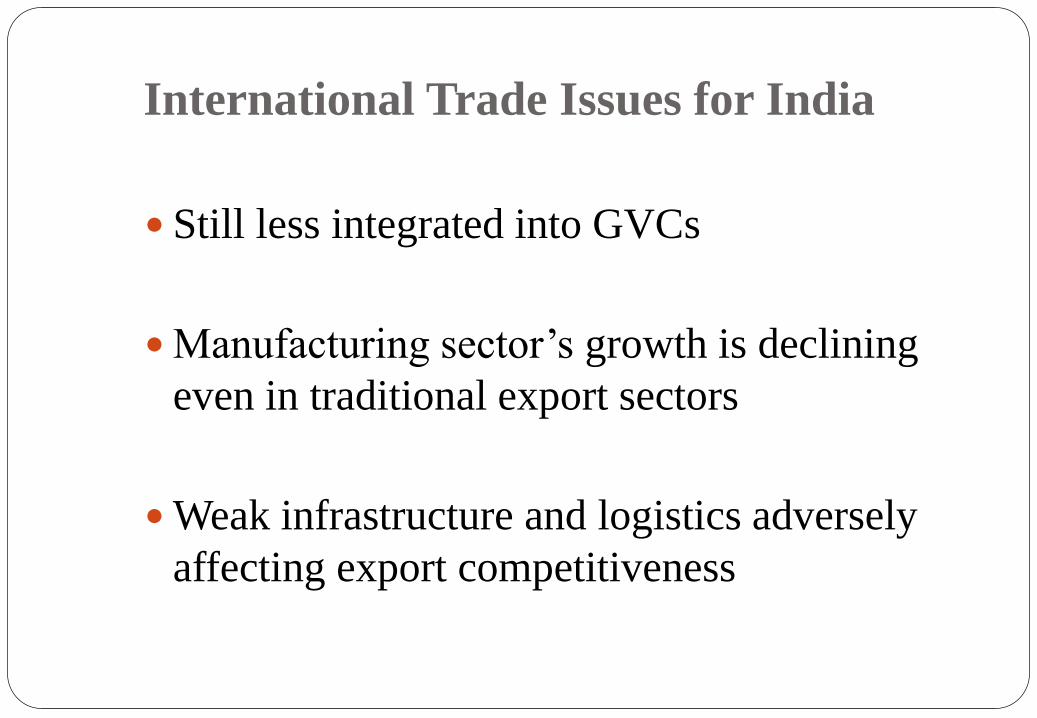
International Trade Issues for India
Still less integrated into GVCs
Manufacturing sector’s growth is declining
even in traditional export sectors
Weak infrastructure and logistics adversely
affecting export competitiveness
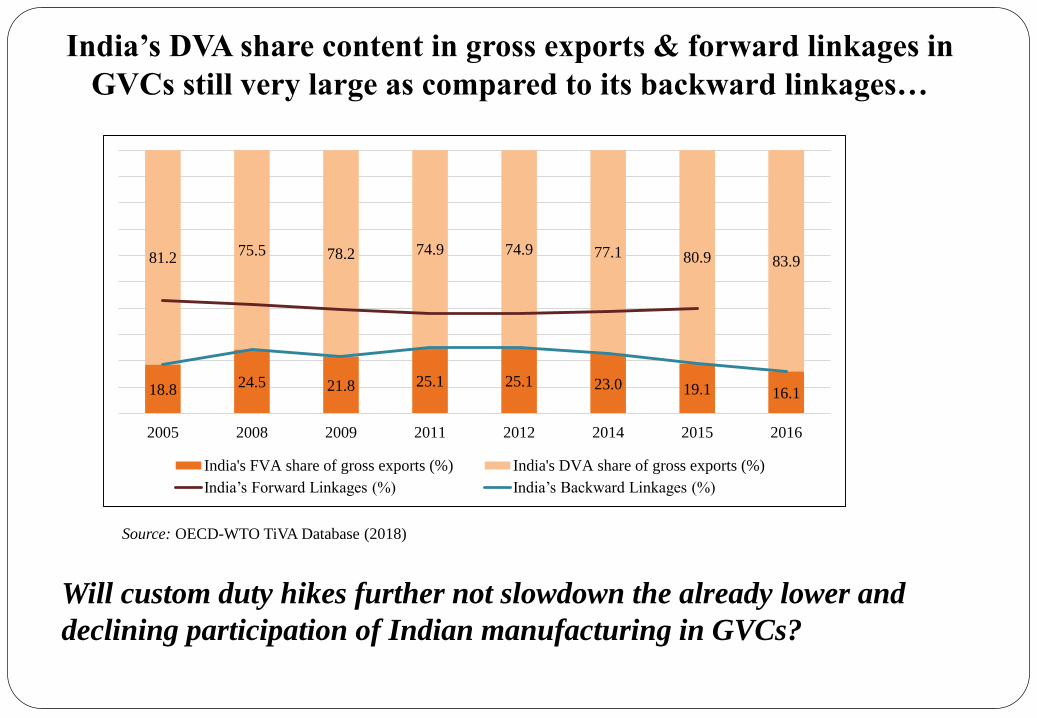
India’s DVA share content in gross exports & forward linkages in
GVCs still very large as compared to its backward linkages…
Source: OECD-WTO TiVA Database (2018)
18.824.5 21.8 25.1 25.1 23.0 19.1 16.1
81.275.5 78.2 74.9 74.9 77.1 80.9 83.9
2005 2008 2009 2011 2012 2014 2015 2016
India's FVA share of gross exports (%) India's DVA share of gross exports (%)
India’s Forward Linkages (%) India’s Backward Linkages (%)
Will custom duty hikes further not slowdown the already lower and
declining participation of Indian manufacturing in GVCs?

Make in India – case study of mobile phones
Mobile phone manufacturing is often cited
as a successful example of Make in India.
An import substitution policy has been
visible to provide impetus to local
manufacturing. Customs duties applicable
on import of mobile phones has
progressively increased
Other policies included the Modified
Special Incentive Package Scheme
(MSIPS) of 2012 that provide capital
subsidy, the Phased Manufacturing
Program and the most recent National
Policy on Electronics (2019)
Items2016-
17
2017-
2018
2018-
20192020-2021
Cellular mobile phones 10 15 20
20 + 10 %
service
welfare cess
PCBA of
charger/adapter and
moulded plastics of
charger/adapter of
cellular mobile phones
Nil 10 20
Vibrator/Ringer of
Mobile phones10
Display Panel and
Touch Assembly 10
Specified parts and
accessories
of cellular mobile
phones
7.5/ 10 15
Preform of silica for
use in manufacture of
telecom grade optical
fibres or optical fibre
cables
Nil 5 In 2019-20 the customs duty on cellular mobile phones was
kept unchanged though duties on camera modules, charger
and adapter of mobile phones was reduced

Make in India – case study of mobile phones
• While India’s growth in mobile phone production has been impressive –from 2 manufacturing units in 2014 to 268 manufacturing units in 2019, exports are at less than one percent of global exports of mobile phones
• India still depends on the import of several components. Import of chargers/ adapters increased from 38 million units in 2013-14 to 124 million units in 2018-19. The numbers for battery packs are 20 million units and 627 million units for 2013-14 and 2018-19 respectively
• Inverted structures have largely been addressed Value addition in India in the mobile phone space has improved from around 5 % in 2014 to about 10 % in 2017
• Indian brands such as Micromax, Lava, Intex and Karbonn that dominated the markets in 2012, have been completely wiped out by Chinese brands Xiamoi, Oppo, Vivo and the Korean brand Samsung. Micromax has now entered the market for AI enabled e-vehicles

Revenue collection from total customs declined, while from Basic
Duty has increased since 2017-18
Source: Union Budget (2016-17 to 2020-21)
HEADING 2014-15 2015-16 2016-17 2017-18 2018-192019-20
(RE)
2020-21
(BE)
Centre's Total Tax
Revenue (in Cr)903615 943765 1101372 1242488 1317211 1504587 1635909
from Import Duties 181270 203075 222336 128636 115666 123335 135130
BCD 52644 59684 64584 80755 104783 110445 124000
from Total Customs 188016 210338 225370 129030 117813 125000 138000
Customs as share of
tax revenue (%)20.8 22.3 20.5 10.4 8.9 8.3 8.4
BCD as % of
Customs28.0 28.4 28.7 62.6 88.9 88.4 89.9

India’s imports of machinery, raw materials, capital goods, etc. are large but with
growing export potential - Imposition of more tariffs may adversely affect our
export competitiveness in many products if our partners also start to retaliate
India’s Trade Balance (in USD Billion)
Category 2013 2015 2016 2018
Raw Materials -171 -102 -89 -198
Intermediate Goods -29 -49 -30 -85
Consumer Goods 111 74 77 74
Capital Goods -35 -42 -44 -83
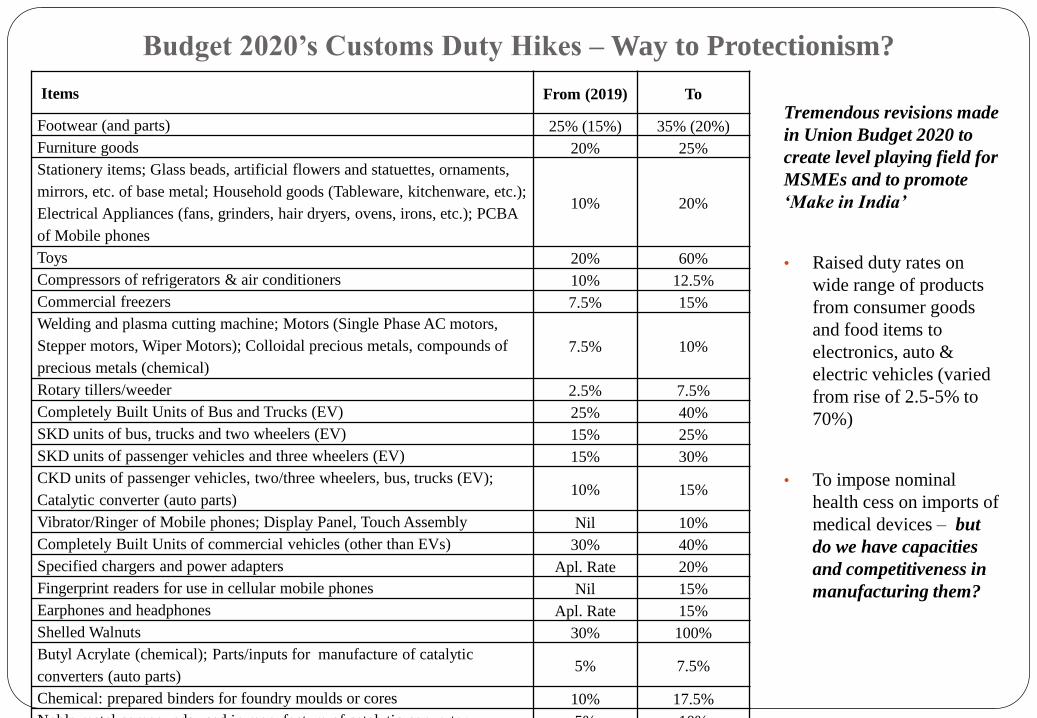
Budget 2020’s Customs Duty Hikes – Way to Protectionism?
Tremendous revisions made
in Union Budget 2020 to
create level playing field for
MSMEs and to promote
‘Make in India’
• Raised duty rates on
wide range of products
from consumer goods
and food items to
electronics, auto &
electric vehicles (varied
from rise of 2.5-5% to
70%)
• To impose nominal
health cess on imports of
medical devices – but
do we have capacities
and competitiveness in
manufacturing them?
Items From (2019) To
Footwear (and parts) 25% (15%) 35% (20%)
Furniture goods 20% 25%
Stationery items; Glass beads, artificial flowers and statuettes, ornaments,
mirrors, etc. of base metal; Household goods (Tableware, kitchenware, etc.);
Electrical Appliances (fans, grinders, hair dryers, ovens, irons, etc.); PCBA
of Mobile phones
10% 20%
Toys 20% 60%
Compressors of refrigerators & air conditioners 10% 12.5%
Commercial freezers 7.5% 15%
Welding and plasma cutting machine; Motors (Single Phase AC motors,
Stepper motors, Wiper Motors); Colloidal precious metals, compounds of
precious metals (chemical)
7.5% 10%
Rotary tillers/weeder 2.5% 7.5%
Completely Built Units of Bus and Trucks (EV) 25% 40%
SKD units of bus, trucks and two wheelers (EV) 15% 25%
SKD units of passenger vehicles and three wheelers (EV) 15% 30%
CKD units of passenger vehicles, two/three wheelers, bus, trucks (EV);
Catalytic converter (auto parts)10% 15%
Vibrator/Ringer of Mobile phones; Display Panel, Touch Assembly Nil 10%
Completely Built Units of commercial vehicles (other than EVs) 30% 40%
Specified chargers and power adapters Apl. Rate 20%
Fingerprint readers for use in cellular mobile phones Nil 15%
Earphones and headphones Apl. Rate 15%
Shelled Walnuts 30% 100%
Butyl Acrylate (chemical); Parts/inputs for manufacture of catalytic
converters (auto parts)5% 7.5%
Chemical: prepared binders for foundry moulds or cores 10% 17.5%
Noble metal compounds used in manufacture of catalytic converter 5% 10%

In fact Continuous Rise in Duty Rates in Selected Industries (electronics, auto parts, footwear, furniture, toys, chemicals)
Aim to increase
domestic value
added and give
some protection
to local firms
mainly MSMEs
to produce high-
quality labour-
intensive
goods…
Items Pre-Budget
Rates
Budget
2018-19
ItemsPre-Budget
Budget
2019-20
Mobile Phones 10% (to 15%
in Dec 2017)
20% Indoor & outdoor unit of split system AC10% 20%
Parts & accessories of mobile
phones
7.5%/10% 15% CCTV camera and IP camera15% 20%
LCD/ LED/OLED TV panel &
parts
7.5%/10% 15% Digital and Network Video Recorders10% 15%
Specified parts for manufacture
of LCD/LED TV panels
Nil 10% Capital goods used for manufacture of PCBA,
camera module, charger of mobile phonesAppl. Rates Nil
Wrist watches, clocks 10% 20% Loudspeaker 10% 15%
Preform of silica for use in
manufacture of telecom grade
optical fibres or fibre cables
Nil 5% Optical Fibres, optical fibre bundles and cables
10% 15%
Specified parts/accessories of
motor vehicles, motor cycles
7.5%/10% 15% Auto & parts10% 15%
CBU imports of motor vehicles 20% 25% Oil, petrol & intake air filters for internal
combustion engines; parts of visual or sound
signaling equipment, of windscreen wipers,
defrosters of motor vehicles
7.5% 10%
CKD imports of motor
vehicles
10% 15% CBU imports of motor vehicles25% 30%
Truck and Bus radial tyres 10% 15% Base metal fittings, mountings suitable for
furniture, doors, hinge for auto mobiles10% 15%
Toys and games 10% 20% Stainless steel products 5% 7.50%
Footwear (Parts) 10% (10%) 20% (15%) Footwear 20% 25%
Furniture, mattresses, fittings 10% 20% Articles of plastic 10% 15%
Silk Fabrics 10% 20% Printed books Nil 5%
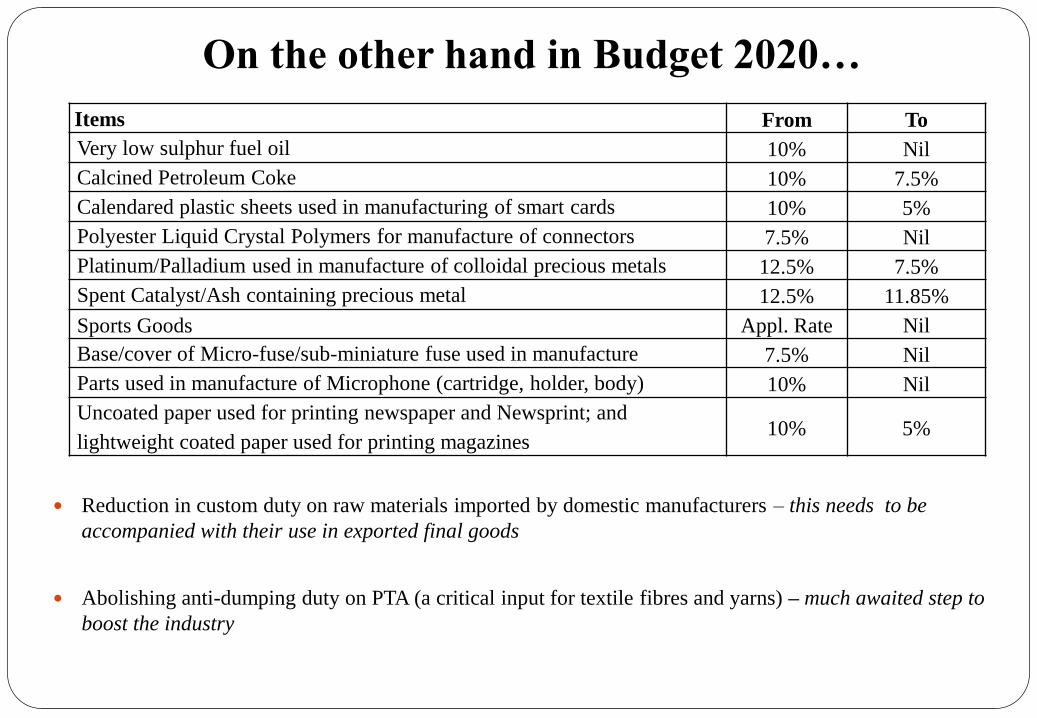
On the other hand in Budget 2020…
Reduction in custom duty on raw materials imported by domestic manufacturers – this needs to be
accompanied with their use in exported final goods
Abolishing anti-dumping duty on PTA (a critical input for textile fibres and yarns) – much awaited step to
boost the industry
Items From To
Very low sulphur fuel oil 10% Nil
Calcined Petroleum Coke 10% 7.5%
Calendared plastic sheets used in manufacturing of smart cards 10% 5%
Polyester Liquid Crystal Polymers for manufacture of connectors 7.5% Nil
Platinum/Palladium used in manufacture of colloidal precious metals 12.5% 7.5%
Spent Catalyst/Ash containing precious metal 12.5% 11.85%
Sports Goods Appl. Rate Nil
Base/cover of Micro-fuse/sub-miniature fuse used in manufacture 7.5% Nil
Parts used in manufacture of Microphone (cartridge, holder, body) 10% Nil
Uncoated paper used for printing newspaper and Newsprint; and
lightweight coated paper used for printing magazines10% 5%

Make in India
• Make in India was launched to make India a manufacturing
hub with higher domestic value addition, promote
investments, industrial corridors and generate employment,
and to connect better with world markets and augment
exports and be better positioned in GVCs
• Question- Will continuous rise in customs duty help achieve
these objectives?
or
• Should we improve logistics infrastructure (both soft and
hard) and the manufacturing environment

Labour intensive manufacturing – textiles, footwear and furniture
• Budget 2020 increased custom duty on imported footwear and furniture to promote domestic
manufacturing
• According to a National Skill Development Council (NSDC) report, India’s furniture and
furnishings industry will need 11.3 million skilled workers by the year 2022
• Nearly every successful economic growth take-off in post-war history in East Asia has been
associated with rapid expansion in clothing and footwear exports in the early stages
Sector Jobs per
lakh
investment
Female Jobs per
lakh investment
Apparels (NIC 14) 23.9 8.2
Leather & Footwear
(NIC 15)
7.1 3.4
Footwear (NIC 1520) 7.7 3.8 Source: Economic Survey 2016-17
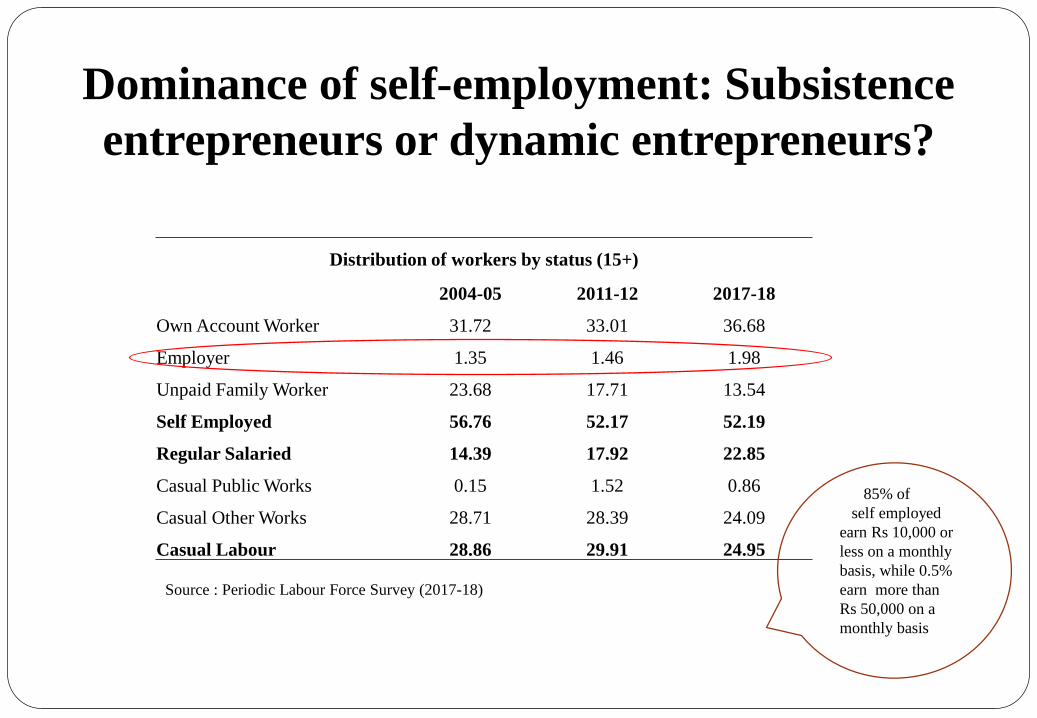
Dominance of self-employment: Subsistence
entrepreneurs or dynamic entrepreneurs?
Distribution of workers by status (15+)
2004-05 2011-12 2017-18
Own Account Worker 31.72 33.01 36.68
Employer 1.35 1.46 1.98
Unpaid Family Worker 23.68 17.71 13.54
Self Employed 56.76 52.17 52.19
Regular Salaried 14.39 17.92 22.85
Casual Public Works 0.15 1.52 0.86
Casual Other Works 28.71 28.39 24.09
Casual Labour 28.86 29.91 24.95
85% of
self employed
earn Rs 10,000 or
less on a monthly
basis, while 0.5%
earn more than
Rs 50,000 on a
monthly basis
Source : Periodic Labour Force Survey (2017-18)

The Imperative of Manufacturing-led-GrowthSectoral Breakdown of Employment
Sector 2004-05 2011-12 2017-18
Agriculture 58.3 48.8 44.1
Mining & Quarrying 0.6 0.5 0.4
Manufacturing 11.6 12.7 12.3
Electricity, Gas & Water supply 0.3 0.4 0.6
Construction 5.6 10.6 11.7
Trade, Hotel & Restaurants 10.3 11.5 12.4
Transport, Storage &
Communication 3.9 4.4 5.2
Finance, Business, Real Estate 1.6 2.6 3.8
Public Ad, Health, education 7.8 8.3 9.5
Source: NSS (various rounds ) and PLFS (2017-18)
Manufacturing led growth will
•generate faster growth of employment for low skilled and medium skilled workers compared to services-led
growth.
•demand development of physical infrastructure (boosting construction), drive growth of employment in
services that are required as inputs in manufacturing, and raise growth of non-traded services through the
income effect.

Need for an Industrial Policy
Need to focus on labour intensive industries in a capital scarce economy
“RIL reports $110 billion in assets and 250,000 employees across its various ventures.
Therefore, it employs five workers for each $2.2 million in assets. Shahi Exports, which
is India’s largest apparel exporter, has assets worth $185 million and employs 106,000
workers in its apparel factories. Therefore, it employs 1,260 workers for every $2.2
million in assets. For the same investment, Shahi Exports creates 252 times the jobs that
RIL does.”
Panagariya (2018)

Industrial policy and Hausmann’s product space
Source: Atlas of Economic Complexity
Products Exported from India (2017) Products Exported from India with RCA >1 (2017)
• The product space depicts the connectedness between products, based on the similarities of know-how
required to produce them
• It reveals that India’s immediate opportunities for diversification based on what it currently exports largely
include minerals, agricultural products, textiles and chemicals
CHEMICALS
METALS
ELECTRONICS
AUTO
MINERALS
TEXTILES
PRECIOUS
STONES

Need for a well thought out Industrial Policy’
Framework for Analysis of Competitiveness
Supply side: Identify products and industries that are in line with the current endowment structures
(Labour-intensive industries).
Demand side:
Domestic Demand ( consumption baskets by income groups)
Exports
An effective IP needs to go beyond sectors and focus on enterprises and firms
Strategy for Effective Cluster Development : Well-designed clusters around uniform products,
complementary technologies could be a better way to generate a virtuous cycle of output and
employment growth. This calls for careful localised state interventions.
Collective efficiency : Growth path for SMEs
A symbiotic relationship between local industry and the state is an important catalyst for SME growth

Key messages
• Maximisation of employment and not just GDP needs to take centre-stage
• Creation of jobs that have the capacity to deliver a living wage rather than just a
minimum wage will create a larger spending category at the lower-middle-class
level
• Dynamism at the enterprise level is critical to the productive jobs agenda
• Not enough to reduce multiple labour laws into four codes. Mere
compilation/number reduction without a change in the content of the codes will
make no difference
• Erosion of the standard employer-employment relationship calls for a rethink on
who is a worker

THE FUTURE OF DATA CENTRE PARKS IN INDIA
• Budget 2020 -policy on Data Centre Parks
• The data centre market in India has doubled in the
last 3 years and is projected to grow 1.5 times by
2020.
• MIDC, Adani among others
• China US$ 0.18 per hour, 0.292 per hour in India
• The annual expenditure on a data centre in the US
is USD 200 million compared to USD 396 in India

THE FUTURE OF BHARAT NET
Missed Deadlines
Launched in October 2011 with a target completion date of October 2013
Pilot started in March 2013
December 2013 – Centre completed MoUs with states
January 2015 – first district was completed
Missed deadline of connecting 100,000 villages (Phase 1) by 2015. Overall deadline of 2016 missed.
Deadline extended to March 2017, further extended to December 2018 and March 2019, thereafter. All of them were missed
• The initial proposal for the National Optical Fibre Network (rechristened Bharat Net) as conceived in 2011 was to connect 2,50,000 Gram Panchayats.
• Budget 2020-21 allocated Rs. 6000 crores to the Bharat Net programme.

Vivad se vishwas – addressing the trust deficit
Budget 2020 introduced a one-time measure
to waive off interest and penalty if tax
demands were paid by March 31st, 2020
According to budget 2020, there are 4,83,000
direct tax cases pending in various appellate
forums involving Rs. 9.32 lakh crore
According to industry sources the
government could recover Rs. 30,000 crore
through the scheme
The faceless assessment scheme has been
extended to deliver faceless appeals
Receipt Budget
Over 1 year but less than 2 years
Over 2 years but less than 5 years
Over 5 years but less than 10 years
Over 10 years
2019-20 313387 271319 26384 12449
2018-19 386804 191267 21701 10618
2017-18 282575 265589 21046 8515
Direct Taxes (Amounts Under Dispute in Rs Crore)
Compiled from Receipt Budgets

Vivad se vishwas – addressing the trust deficit
ICRIER conducted a study on Barriers to Compliance and Cost of Compliance for
Direct Taxes in India
The estimates of cost of compliance for direct taxes in India is high
The top ranked barriers to compliance include inefficiencies in tax administration,
fear of scrutiny and litigation, feeling of inappropriate utilization of tax payer’s
money, harassment by tax officials and bribery, frequency of changes in tax law, etc.
The recommendations (i) perception management (ii) adopting a customer-centric
approach (iii) focusing on improving tax payer services and (iv) developing a
communication strategy that is integrated with overall compliance
The recommendations included strengthening of the Citizen’s Charter that included
the Vision, Mission and Standards of Service Delivery to taxpayers. Mandating the
the Central Board of Direct Taxes (CBDT) to adopt a Taxpayers’ Charter in Budget
2020 is a very welcome step

TAX PAYER CHARTERS
• Her Majesty’s Revenue & Customs (HMRC), The Australian
Tax Office
• Taxpayer Charter citizen rights and obligations
• Fair and reasonable treatment
• Being honest
• Fair use of the government’s access to information
gathering powers
• Protecting information and respecting privacy
• Being responsive
• Being helpful and efficient

Challenges Ahead and Policy Focus
Stabilize GST implementation to remove uncertainty for exporters, facilitate
easier compliance, and expand the tax base
Completing the Tw in Balance Sheet actions by focusing on 4R’s
Disinvestment/Privatization
Staving off threats to macro-economic stability
Areas of policy focus over medium -term
Finding good jobs for the young and burgeoning workforce, especially for
women
Creating an educated and healthy labor force
Raising farm productivity while strengthening agricultural resilience.
Integrating into the value chains

Thank you