


Languages
Pages
Legal


Understanding Big data & Big systems Holger Rootzén, Mathematical Sciences
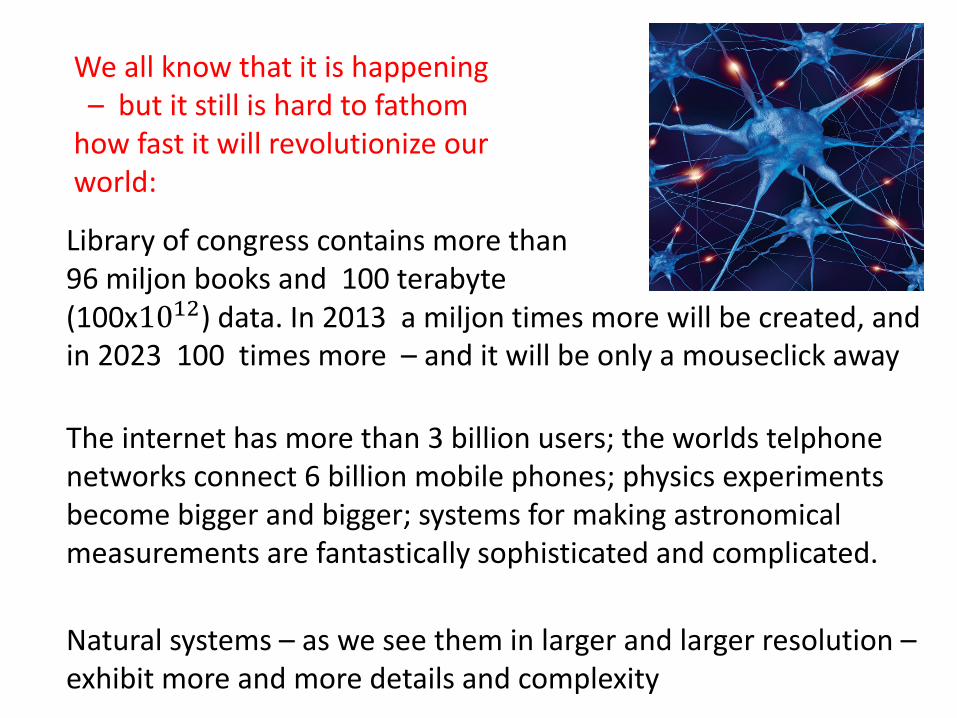
Library of congress contains more than 96 miljon books and 100 terabyte (100x1012) data. In 2013 a miljon times more will be created, and in 2023 100 times more – and it will be only a mouseclick away
The internet has more than 3 billion users; the worlds telphone networks connect 6 billion mobile phones; physics experiments become bigger and bigger; systems for making astronomical measurements are fantastically sophisticated and complicated.
Natural systems – as we see them in larger and larger resolution – exhibit more and more details and complexity
We all know that it is happening – but it still is hard to fathom how fast it will revolutionize our world:

more abstraction more generality
need
more mathematics
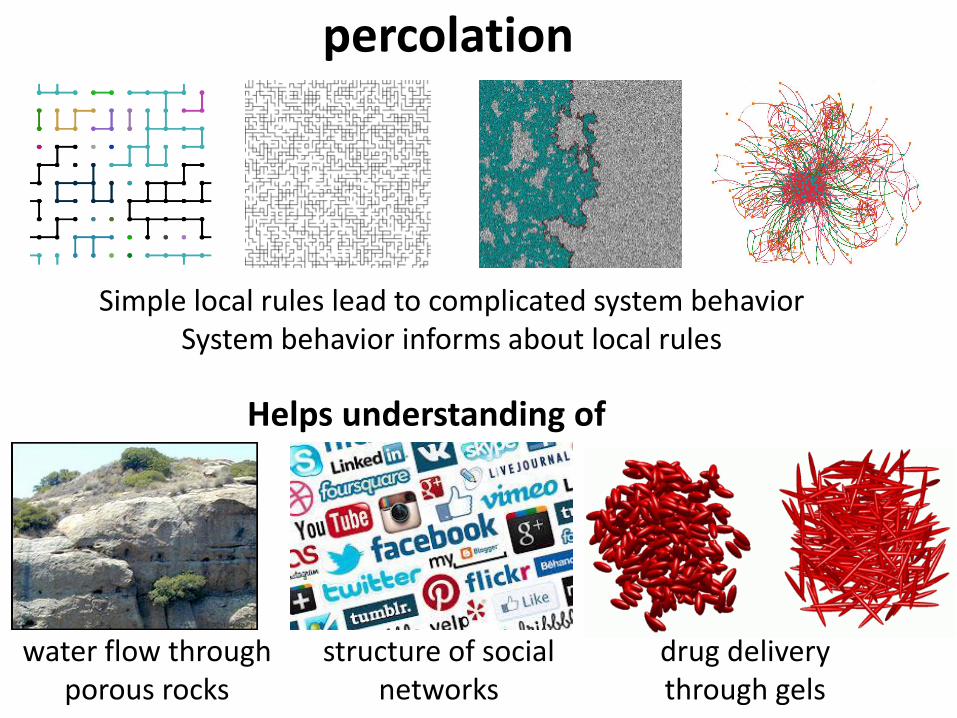
percolation
Simple local rules lead to complicated system behavior System behavior informs about local rules
Helps understanding of
drug delivery through gels
water flow through porous rocks
structure of social networks
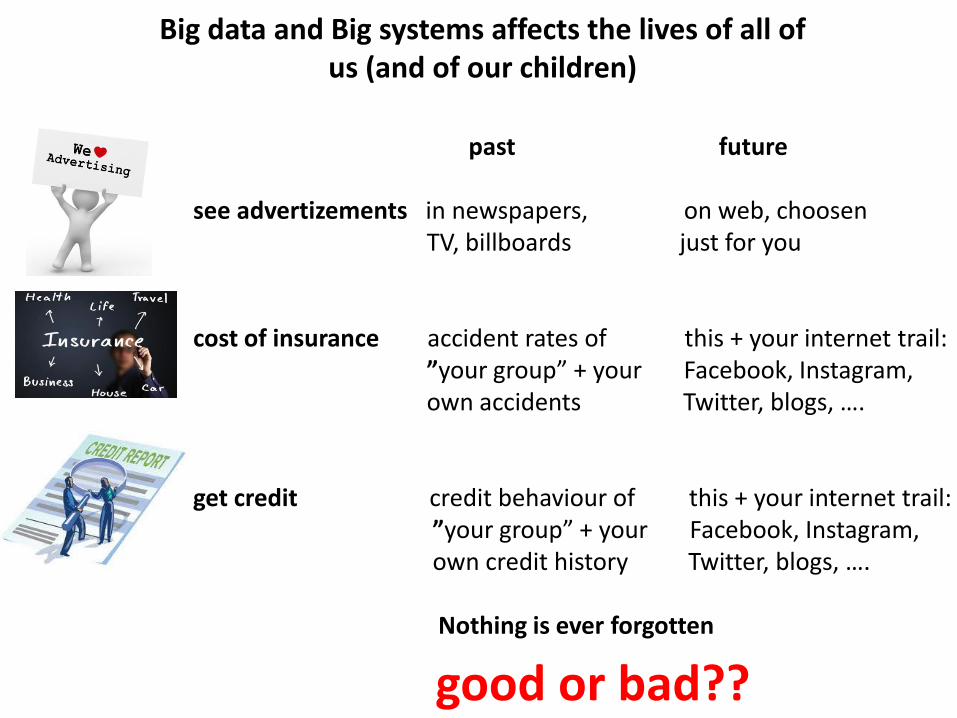
Big data and Big systems affects the lives of all of us (and of our children)
past future see advertizements in newspapers, on web, choosen TV, billboards just for you cost of insurance accident rates of this + your internet trail: ”your group” + your Facebook, Instagram, own accidents Twitter, blogs, …. get credit credit behaviour of this + your internet trail: ”your group” + your Facebook, Instagram, own credit history Twitter, blogs, ….
Nothing is ever forgotten
good or bad??

understand 27 millon p-values from a study of interaction between pairs of genes in yeast, coming from 27 million experiments in 4 replications
Some things we do:
understand how huge datasets from weather satellites, buoys, weather stations, and sensor systems can improve safety and efficiencey of marine transports
understand traffic accidents from a naturalistic driving study where 2000 cars equipped with web cams, radars, gps-s, sensors are driven in normal traffic for 3 years by drivers like you and me, and all data is saved

Traffic accidents
• 1.3 miljon deaths/year worldwide, 20-50 million severely injured
• Large economic losses
• Less than 1 death/day in Sweden now. Down from 3 deaths/day a few decades ago – at a time with much less traffic
• First simple measures: seatbelts, helmets, follow traffic rules, drunk driving laws, …, then more sophisticated ones: rebuild roads, better tires, improve driver education, airbags, …, then next level of sophistication: more driver training and retraining, ABS, ESP, …, and ??
Naturalistic driving studies: cars with drivers like you and me are instrumented with video cameras, radar, GPS, sensors for steering wheel movement, gas- and brake pedal movement, …
Generates extremely large data sets – and give completely new opportunities for preventing traffic accidents
Accidents are extreme events – same methods as those for financial risks and for natural catastrophes (later in talk!) can be used
New and exciting area for statistics
Selection bias/errors Risk estimation
Active safety systems for next generation cars. Important for competition with other car makers and for safety (?)
Driver training, traffic laws, …
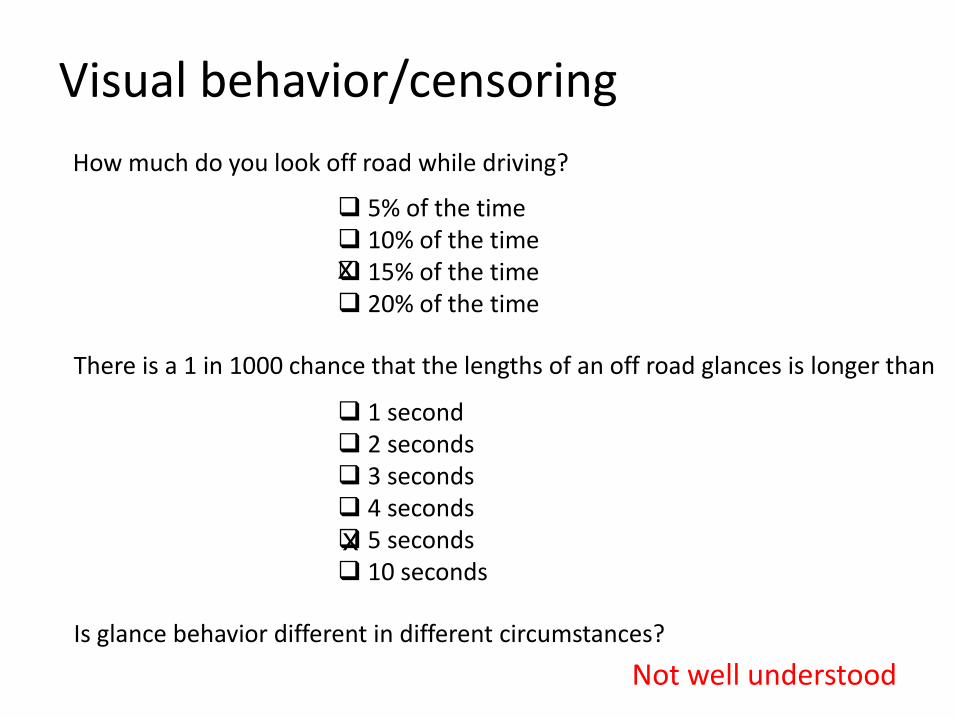
Visual behavior/censoring
How much do you look off road while driving?
5% of the time 10% of the time 15% of the time 20% of the time
There is a 1 in 1000 chance that the lengths of an off road glances is longer than
1 second 2 seconds 3 seconds 4 seconds 5 seconds 10 seconds
Is glance behavior different in different circumstances?
Not well understood
x
x
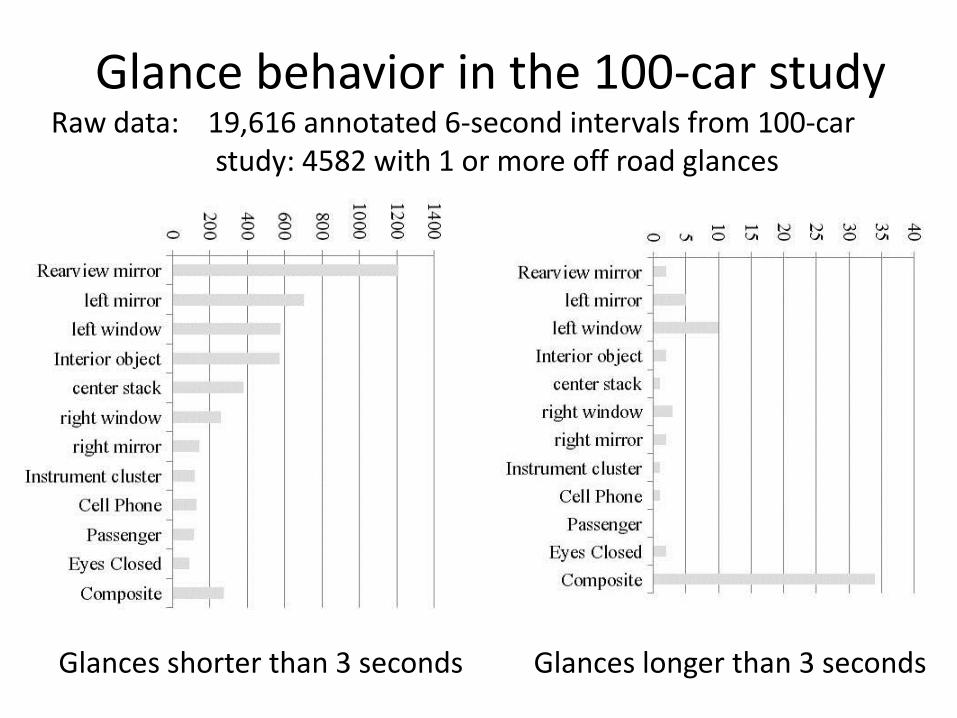
Glances shorter than 3 seconds Glances longer than 3 seconds
Glance behavior in the 100-car study Raw data: 19,616 annotated 6-second intervals from 100-car study: 4582 with 1 or more off road glances
My research this week: How should one use window censored observations of 0-1 processes to find the tail behaviour of the distributions of lengths of 0-intervals (= off road glances)?
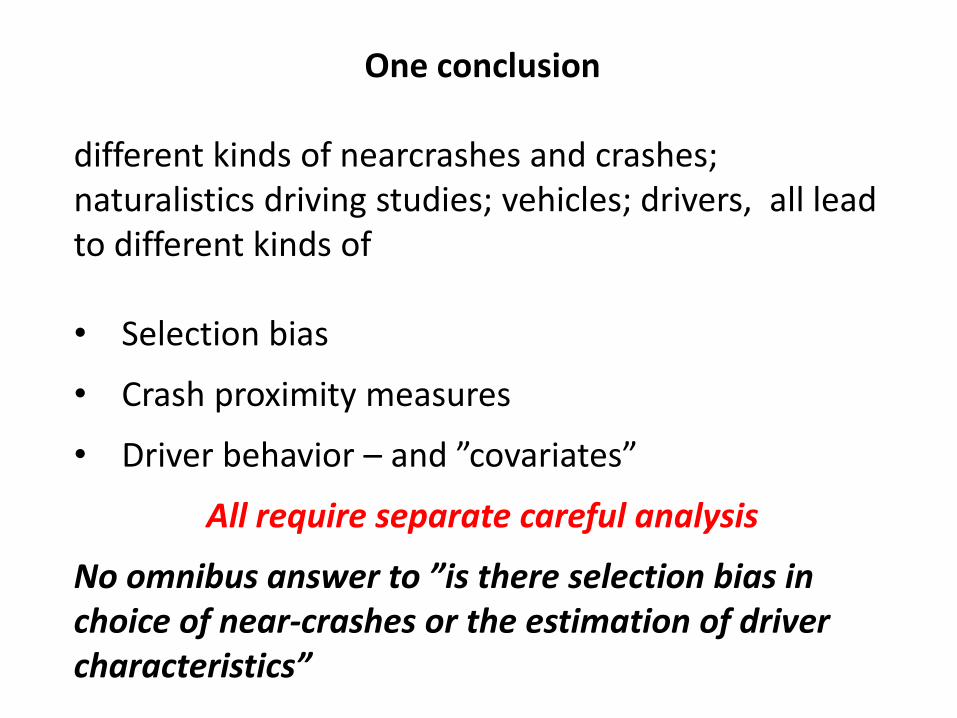
One conclusion different kinds of nearcrashes and crashes; naturalistics driving studies; vehicles; drivers, all lead to different kinds of • Selection bias
• Crash proximity measures
• Driver behavior – and ”covariates”
All require separate careful analysis
No omnibus answer to ”is there selection bias in choice of near-crashes or the estimation of driver characteristics”
The next step: SHRP 2
• 2000 cars • 3 years • Much better instrumentation (?) • Started a year ago

Some more things we do

Catastrophes
Not now Normal statistics: uses typical values, helps make life longer,
feed the world
Now
Extreme value statistics: only uses extreme observations, helps avoid floods, bridges collapsing, increase safety of cars, ships, airplanes, understanding of climate
The wonderful and useful generality of mathematics and statistics
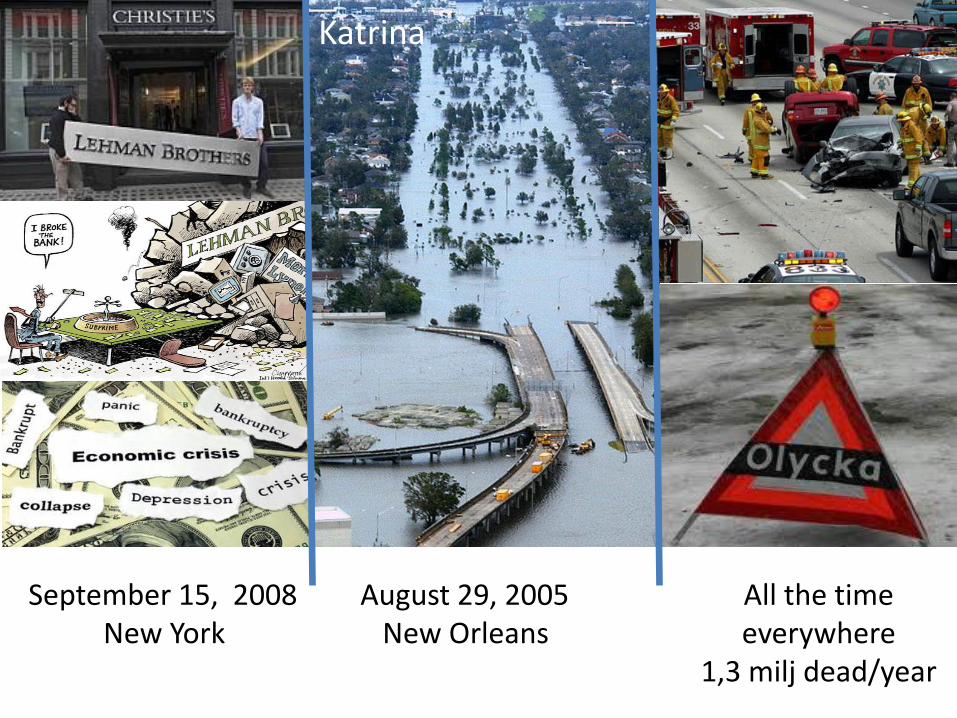
Katrina
September 15, 2008 New York
August 29, 2005 New Orleans
All the time everywhere
1,3 milj dead/year

Nassim Taleb: Black swans
• Rare: Have not occured before
• Extreme consequences
• Unpredicatable before, easy to predict after they have happened
• Shape history
Taleb (approximately): History is shaped by black swans – so not worth your while to try to manage risks
Cygnus atratus
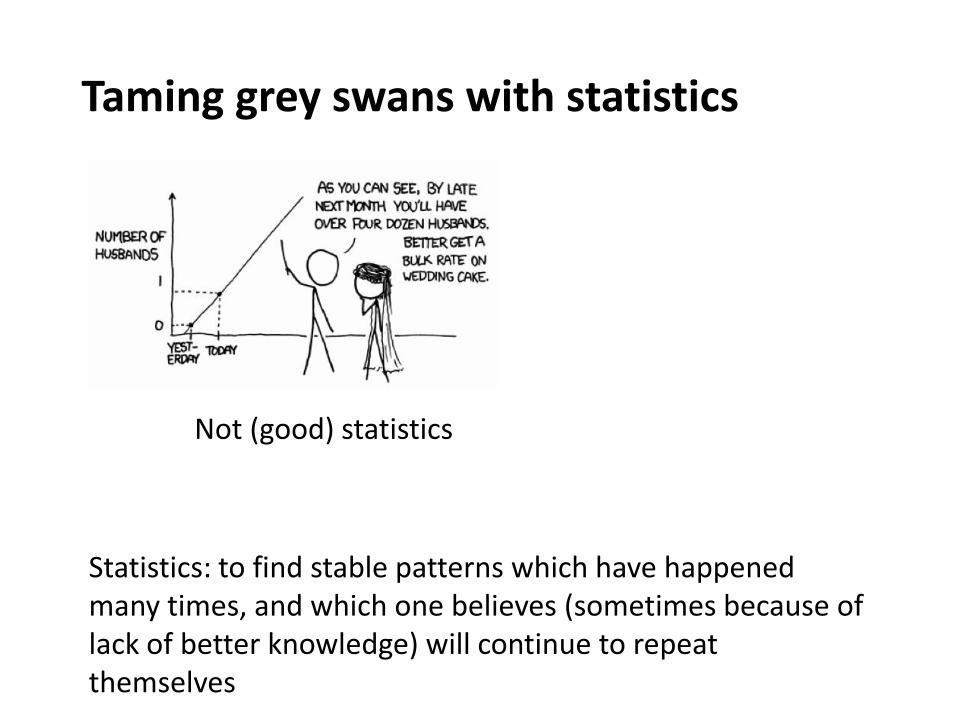
Taming grey swans with statistics
Statistics: to find stable patterns which have happened many times, and which one believes (sometimes because of lack of better knowledge) will continue to repeat themselves
Not (good) statistics

Error in the measured distance = sum of many small measurement errors
Normal distribution
Extreme value distribution
Stable patterns statistical distributions
Highest water level during year = maximum of daily water levels
Matematics shapes of possible distributions Statistics choice of specific distribution (with uncertainty)
Distribution quantifies risk

Statistics can tame swans if
• One has realized they exist
• One has enough data
• There are sufficiently stable patterns in data – and the patterns continue to repeat themselves in the future
Then statistics can help judging: ”How big is the risk?” -- and what types of catastrophes are most likely (how to handle the risk then depends on the situation)
If not then statistics cannot help
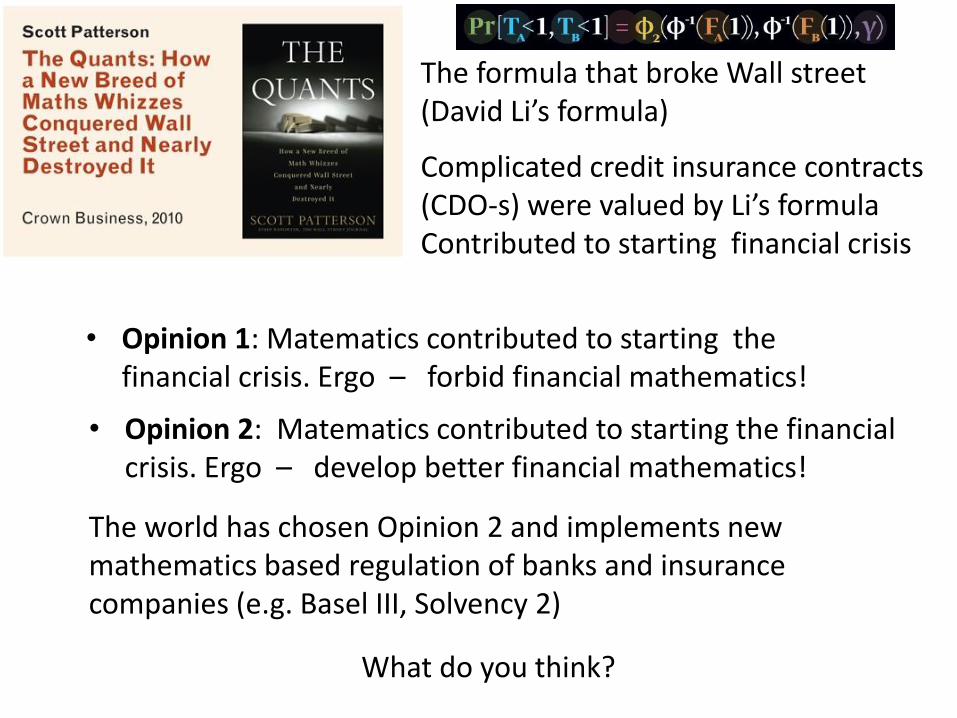
The formula that broke Wall street (David Li’s formula)
Complicated credit insurance contracts (CDO-s) were valued by Li’s formula Contributed to starting financial crisis
• Opinion 1: Matematics contributed to starting the financial crisis. Ergo – forbid financial mathematics!
The world has chosen Opinion 2 and implements new mathematics based regulation of banks and insurance companies (e.g. Basel III, Solvency 2)
What do you think?
• Opinion 2: Matematics contributed to starting the financial crisis. Ergo – develop better financial mathematics!
Megastort skadestånd för Weavering-blåsning Dagens industri 2011-09-02 08:23
Weavering Capital Founder charged with fraud The Guardian 2012-12-14
”Weavering Capital-härvan: Magnus Petersons, den svenske grundarens, styvfar och bror döms att solidariskt betala ett skadestånd på 700 miljoner kronor. "Det är fruktansvärt mycket pengar", säger brodern Stefan Peterson. Men det är inte Stefan Petersons inblandning i Weaverings svenska del som nu straffar sig.
Det var i mars 2009 som skandalen kring Weavering Capital, och den svenske grundaren till det brittiska fondbolaget Magnus Peterson, briserade. … Trots den turbulens som följde efter Lehman Brothers-kraschen hösten 2008 såg Weaverings fond ut att klara sig oförskämt bra. Men fondens värde misstänks ha blåsts upp av internaffärer och med hjälp av ränteswappar. Det mesta var dock luft. Sammanlagt uppges Weavering ha förvaltat omkring 5 miljarder kronor, men en stor del av de pengarna misstänks vara försvunna. … I en domstol på Caymanöarna föll i fredags en dom mot Magnus Petersons 85-årige styvfar och bror. Den senare var chef för det svenska dotterbolaget Weavering Capital, ett av dotterbolagen till det brittiska bolaget.” ”Hedge fund boss Magnus Petersen charged with six offences after three-and-a-half year investigation by Serious Fraud Office. … ” investigation first closed and then reopend.

Court demands 10 years of accounts from Weavering Capital boss Joe McGrath
22 Jul 2013
Magnus Peterson – the $600 million hedge fund leader facing a criminal
prosecution for alleged fraud – has 10 weeks to provide a personal asset
trail to forensic investigators at liquidators Duff & Phelps.
At an unrelated hearing at the High Court last week, the founder of
Weavering Capital UK was instructed by deputy chancery master
Roger Bartlett to provide a list of all transactions over £2,000 for
him and his wife, Amanda, dating to 2003.
In a trial scheduled for October 2014, Peterson faces criminal
charges of forgery, fraudulent trading and false accounting, brought
by the Serious Fraud Office. He has not yet made a plea and has
not issued any comment through a lawyer as he is representing himself.
Peterson was declared bankrupt in 2012 after the High Court handed down a $450 million
judgment against him and three other senior executives at Weavering Capital UK, which was the
UK-based manager for the Cayman Islands Weavering Macro Fixed Income hedge fund.
The Petersons are due to leave the family home they share with their four children at the end of
next month in order to settle debts from an earlier High Court case, Amanda Peterson said in
court. This is unconnected with next year’s fraud case.
Financial News, Nov. 26, 2013
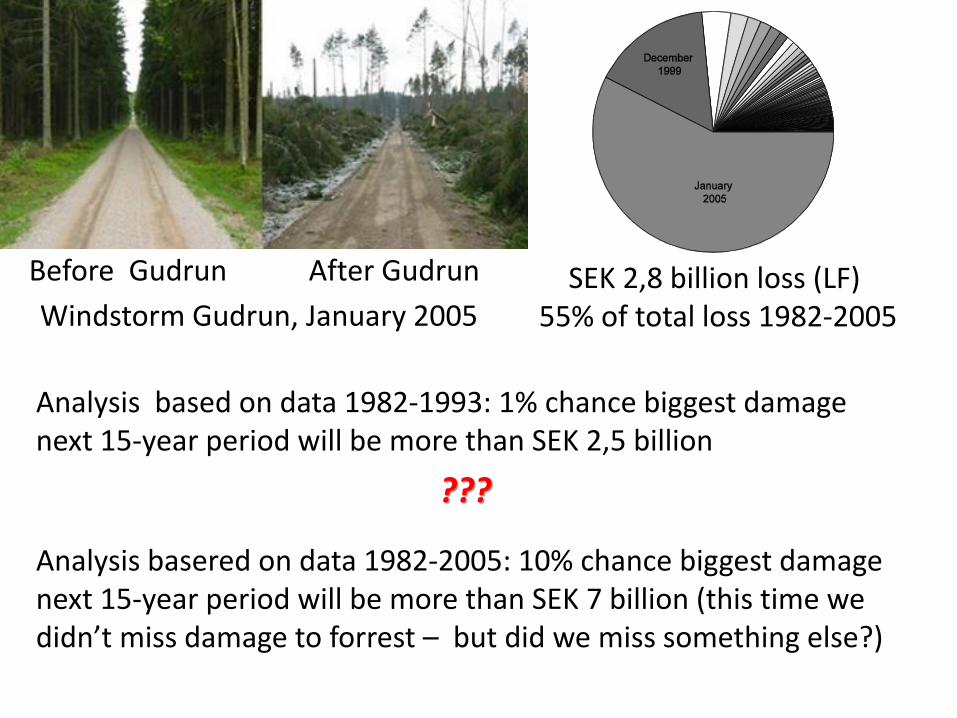
Before Gudrun After Gudrun SEK 2,8 billion loss (LF) 55% of total loss 1982-2005
Analysis based on data 1982-1993: 1% chance biggest damage next 15-year period will be more than SEK 2,5 billion
???
Analysis basered on data 1982-2005: 10% chance biggest damage next 15-year period will be more than SEK 7 billion (this time we didn’t miss damage to forrest – but did we miss something else?)
Windstorm Gudrun, January 2005
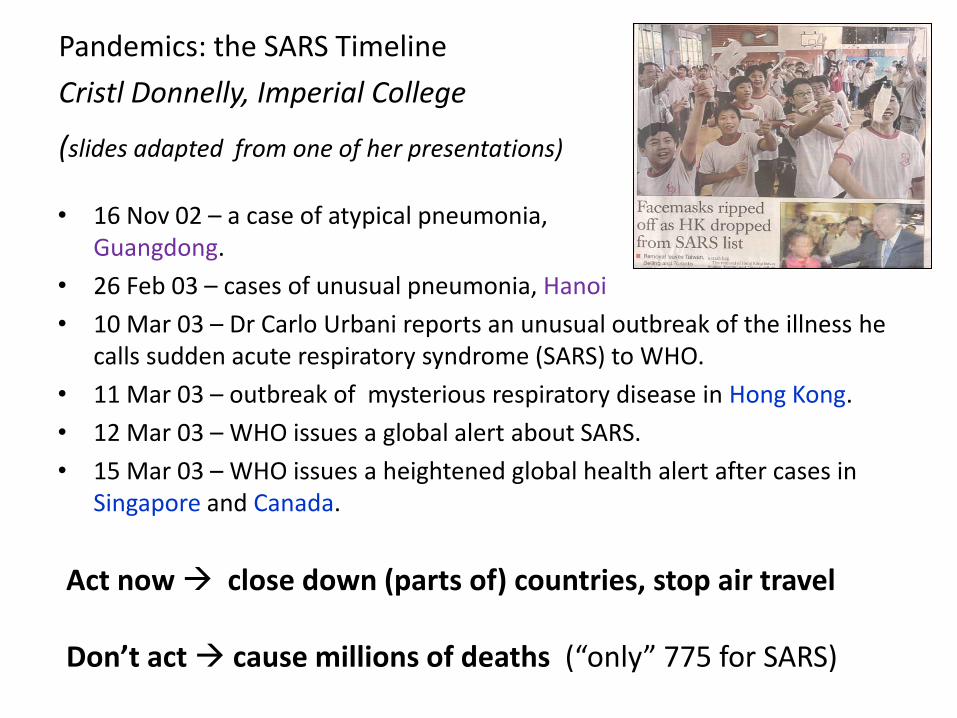
• 16 Nov 02 – a case of atypical pneumonia, Guangdong.
• 26 Feb 03 – cases of unusual pneumonia, Hanoi
• 10 Mar 03 – Dr Carlo Urbani reports an unusual outbreak of the illness he calls sudden acute respiratory syndrome (SARS) to WHO.
• 11 Mar 03 – outbreak of mysterious respiratory disease in Hong Kong.
• 12 Mar 03 – WHO issues a global alert about SARS.
• 15 Mar 03 – WHO issues a heightened global health alert after cases in Singapore and Canada.
Pandemics: the SARS Timeline
Cristl Donnelly, Imperial College
(slides adapted from one of her presentations)
Act now close down (parts of) countries, stop air travel Don’t act cause millions of deaths (“only” 775 for SARS)
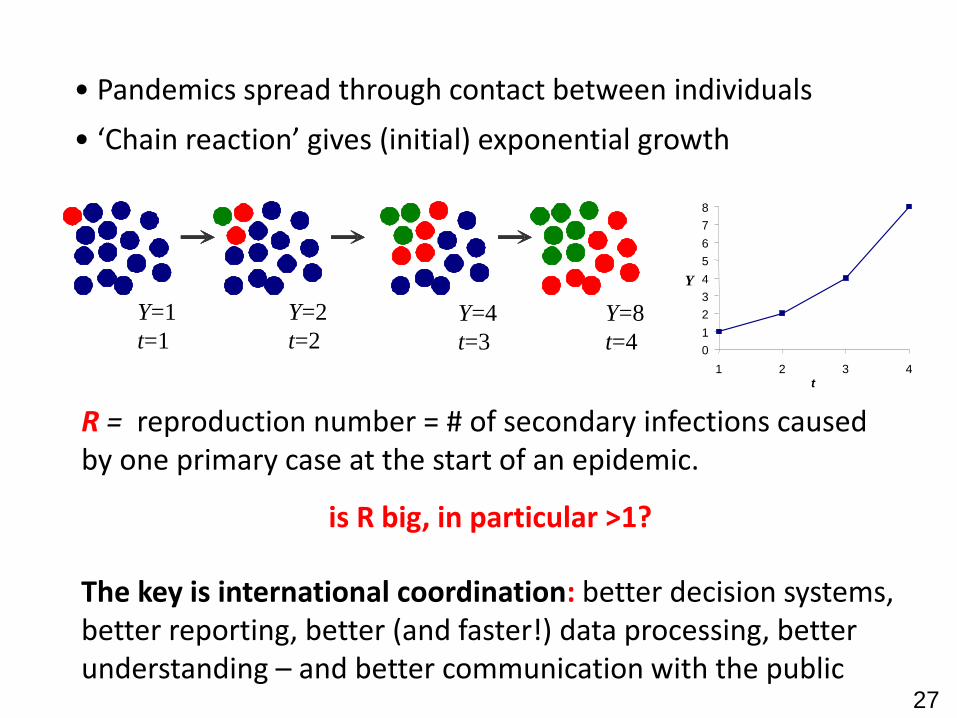
• Pandemics spread through contact between individuals
• ‘Chain reaction’ gives (initial) exponential growth
Y=1
t=1
Y=2
t=2 Y=4
t=3
Y=8
t=4 0
1
2
3
4
5
6
7
8
1 2 3 4
t
Y
R = reproduction number = # of secondary infections caused by one primary case at the start of an epidemic.
is R big, in particular >1?
27
The key is international coordination: better decision systems, better reporting, better (and faster!) data processing, better understanding – and better communication with the public
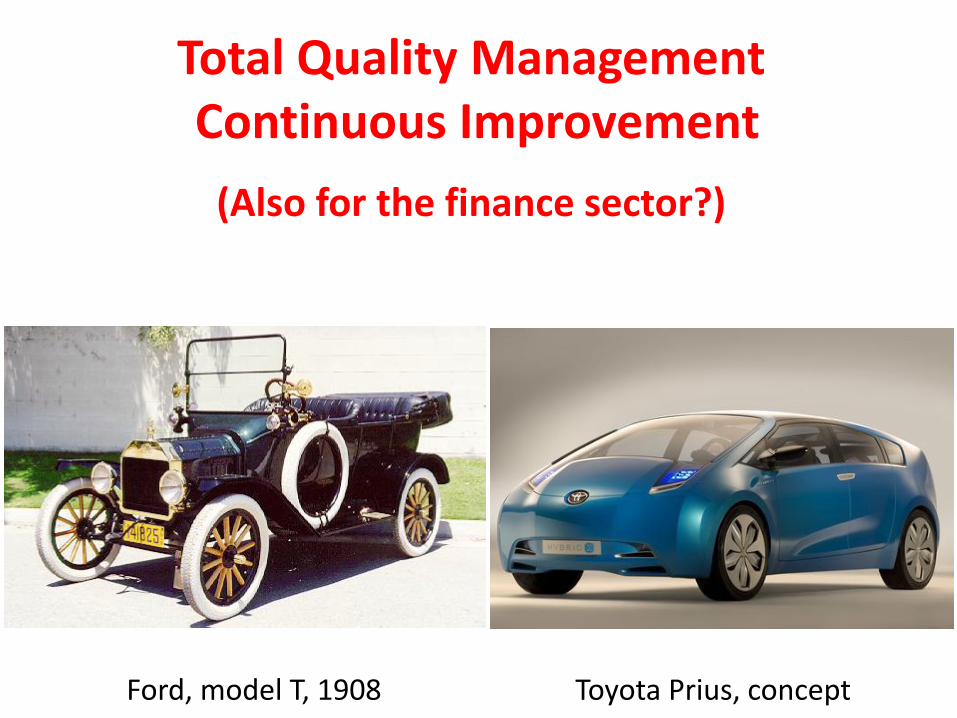
Ford, model T, 1908 Toyota Prius, concept
Total Quality Management Continuous Improvement
(Also for the finance sector?)
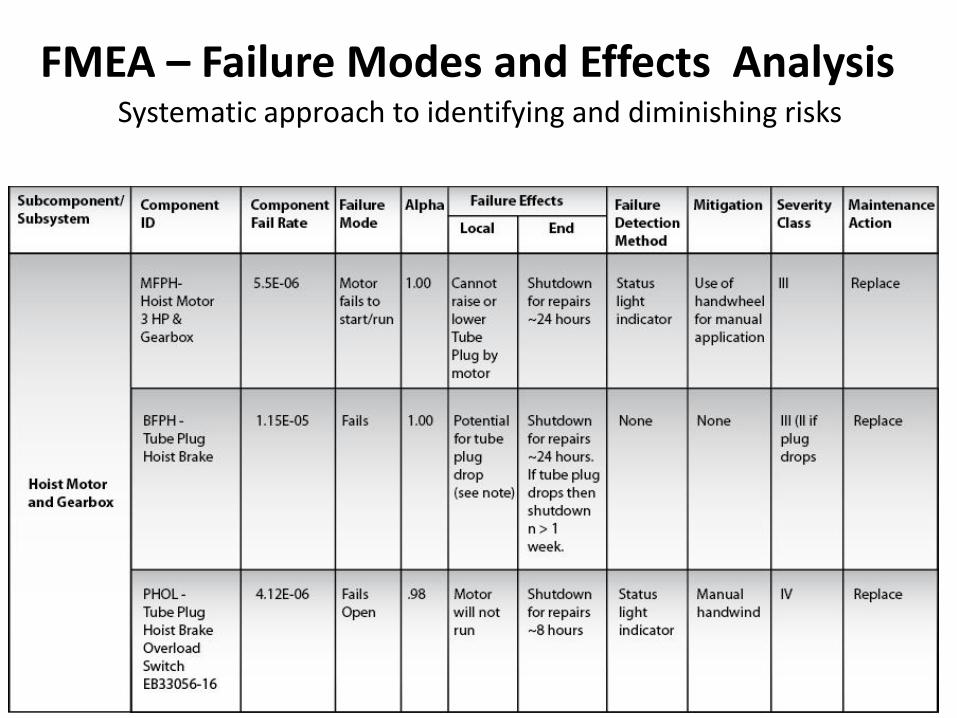
FMEA – Failure Modes and Effects Analysis Systematic approach to identifying and diminishing risks

working group with broad and diverse background – leader – data – training – plan work – brainstorm – take notes – everyone responsible – systematic judgment of likelihoods; consequences; countermeasures – someone responsible for implementing results
Systematic Creative Seriously and well thought through for many different kinds of FMEA-s
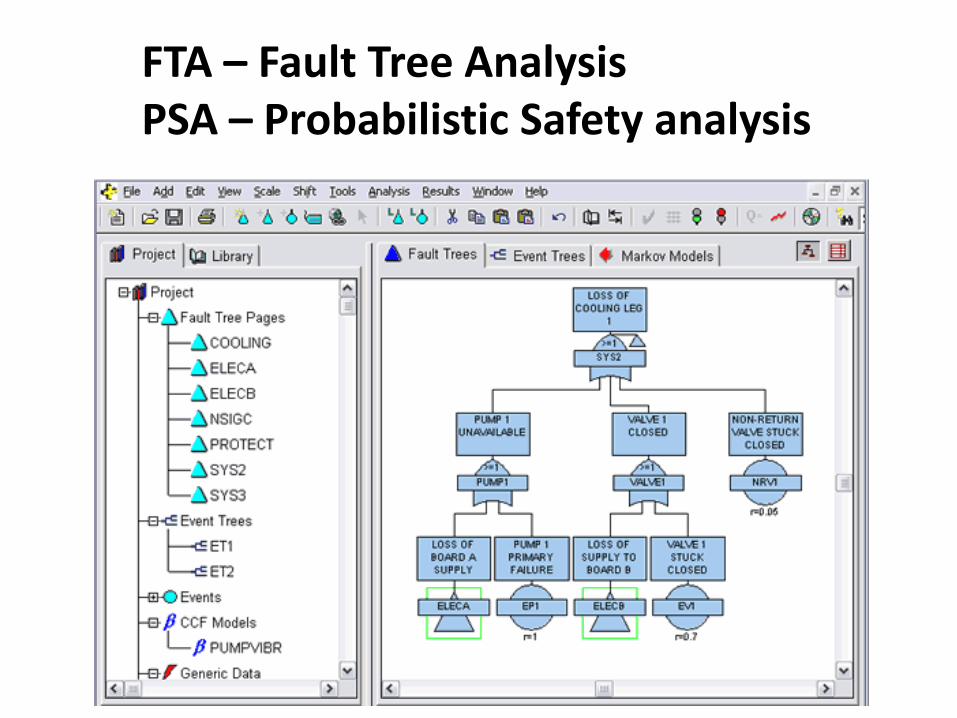
FTA – Fault Tree Analysis PSA – Probabilistic Safety analysis

Used for • Estimating probabilities • Identification of important risks
Unreliable!

FMEA: Bottom up, simple systems FTA: Top down, redundant system
Tools for continuous improvement
(but unstructured thinking about risks is also needed)

(Ambio, 1999)
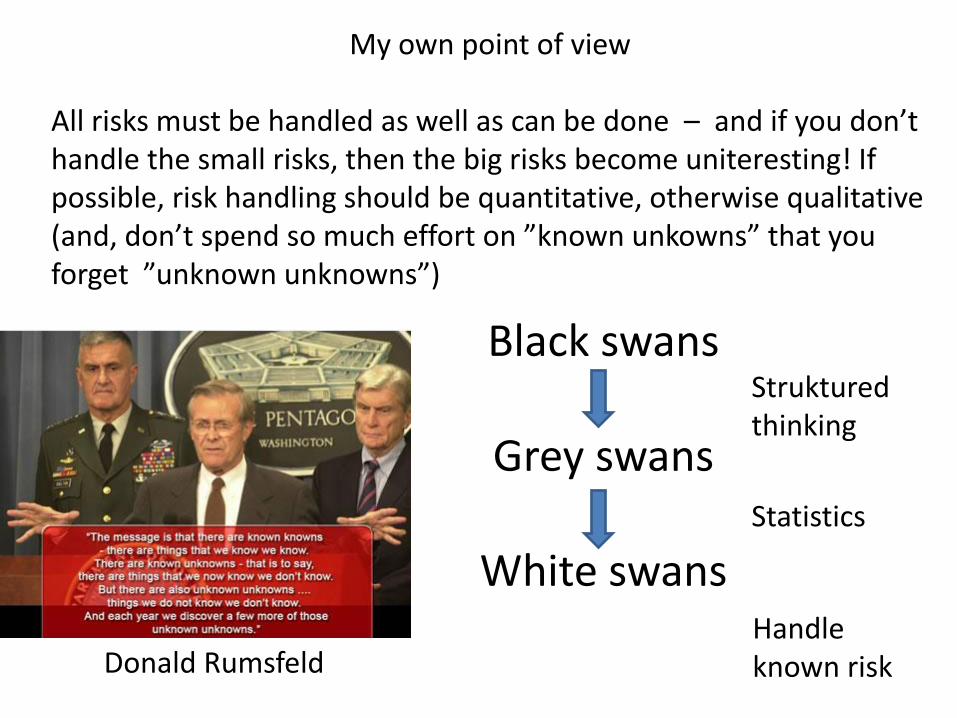
My own point of view All risks must be handled as well as can be done – and if you don’t handle the small risks, then the big risks become uniteresting! If possible, risk handling should be quantitative, otherwise qualitative (and, don’t spend so much effort on ”known unkowns” that you forget ”unknown unknowns”)
Black swans
Grey swans
White swans
Struktured thinking
Statistics
Handle known risk Donald Rumsfeld

Many small changes together lead to dramatic results
Rome10.000 years ago Rom now
Mankind’s total transformation of our earth has occured in very many small steps
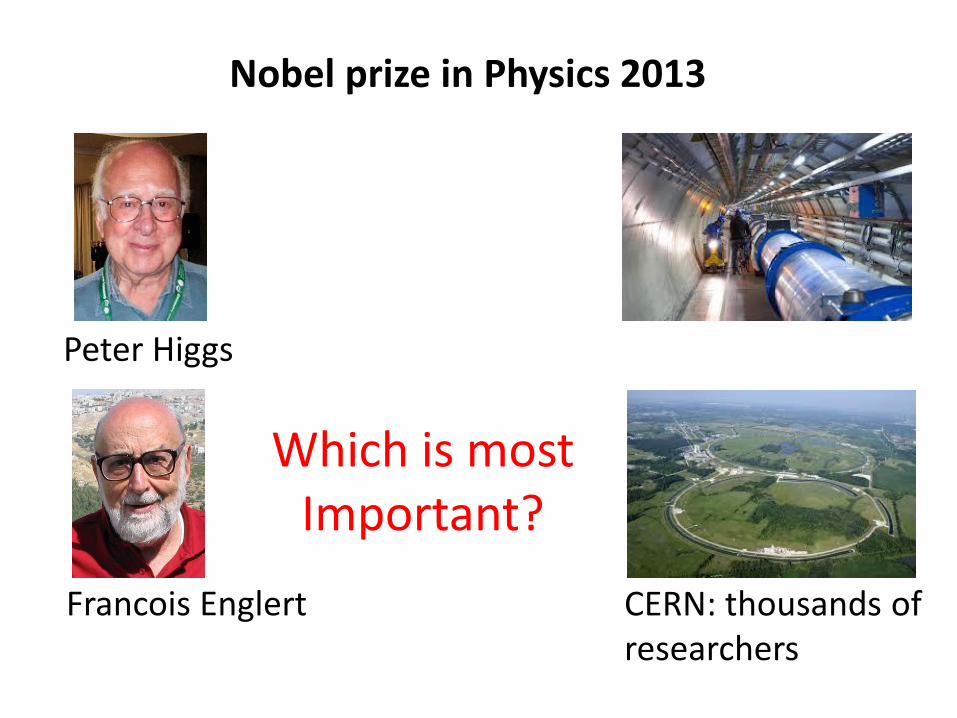
Nobel prize in Physics 2013
Peter Higgs
Francois Englert CERN: thousands of researchers
Which is most Important?

Climate change
slow down, stop
mitigate

Make dyke 1.5 m higher
costs billions of Euros, popular protests
Keep dyke as is (perhaps) thousands of deaths
Extreme climate

”Dammanläggningar som dimensioneras enligt flödesdimensioneringsklass II ska vid dämningsgränsen kunna framsläppa ett tillrinnande flöde med en återkomsttid av minst 100 år.”
Climate change: the standard method above doesn’t work any more, one has to specify • Design life period (e. g. 2015-2115) • Risk (e.g. 5% probability of a flood
during this period)
Design life level

Design Life Prob. Design Life Level Return Level EWT EWT (2015 climate) (trend stopped)
2015-2064 0.05 11.5 10.9 251 788 2015-2064 0.01 15.2 14.4 431 3839 2065-2114 0.05 12.6 10.9 262 1008 2065-2114 0.01 16.6 14.4 453 5002 Return levels are for T = 975 and T = 4975, respectively. EWT is expected waiting time
First convince engineering and political community that this has to be done, then the rest is climate modelling and (extreme value) statistics (But science and statistics is only one part, one has to develop new and much more flexible and adaptive approaches to design)

Estimation of the distribution of maximal inclusion sizes in clean steels, from measurements on planar sections
Fatigue: metal specimens subjected to varying stresses develop cracks and eventually break --- the major cause ofmechanical failure Fatigue limit: if stresses are lower than this limit, cracks stop growing and the specimen doesn’t break Murakami’s theory: fatigue limit is determined by the square root of area of the largest inclusion, measured on the projection perpendicular to the direction of stress
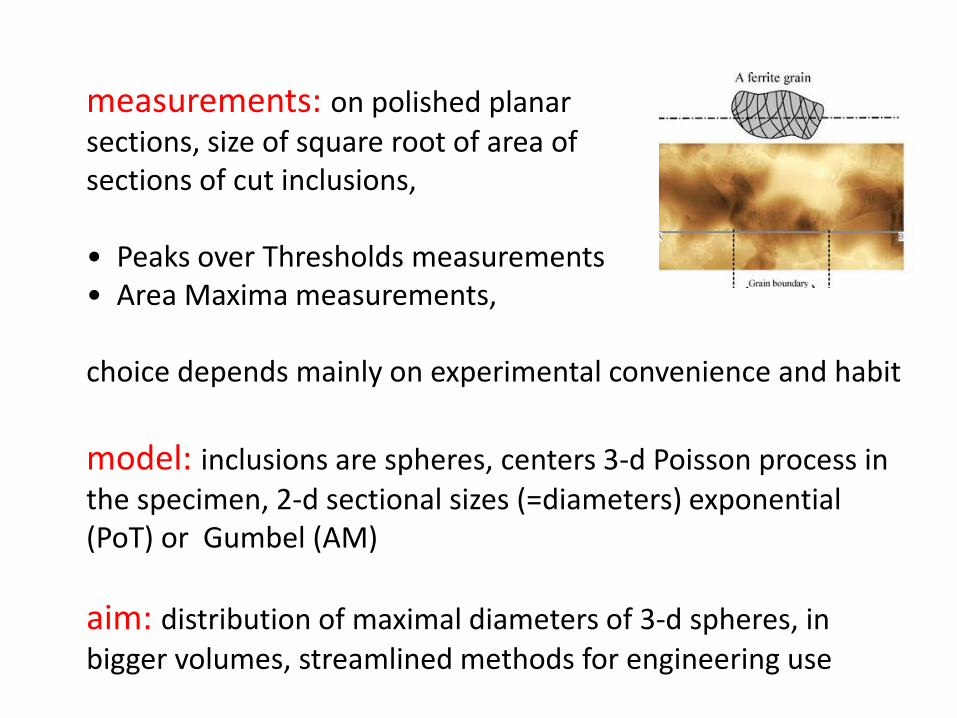
measurements: on polished planar sections, size of square root of area of sections of cut inclusions, • Peaks over Thresholds measurements • Area Maxima measurements,
choice depends mainly on experimental convenience and habit
model: inclusions are spheres, centers 3-d Poisson process in the specimen, 2-d sectional sizes (=diameters) exponential (PoT) or Gumbel (AM)
aim: distribution of maximal diameters of 3-d spheres, in bigger volumes, streamlined methods for engineering use
Top Related