


Languages
Pages
Legal


-A186 283 FAULT TREE RELIABILITY ANALYSIS OF THE NAVAL t/i
POSTGRADUATE SCHOOL HINT-SATELLITE (ORION)(U) NAVALPOSTGRADUATE SCHOOL MONTEREY CA T G KEEBLE SEP 87
UNCLASSIFIED F/G 12/4 NLEIEIIIIEEEIIEllllEElllllhEEIIIIIIEIIIIIEElllEEIhEllIIEElEEEllllllllIEEllEllEEEIIEEI
4/ 11 1-3,. 1112
I- IIIL25
iiiiliii Ijii~lt
FILE COI
NAVAL POSTGRADUATE SCHOOLMonterey, California
00
DTICIELECTERSV 20 1987D
CH
THESISFAULT TREE RELIABILITY ANALYSIS OF THE
NAVAL POSTGRADUATE SCHOOL MINI-SATELLITE(ORION)
by
Trenton G. Keeble
September 1987
Thesis Advisor: J. D. Esary
Approved for public release; distribution is unlimited
* IT

REPORT DOCUMENTATION PAGE
4 PERsORMA.G ORGAN'IATCN REPORI N.,MBER S) S OjOiGORGANZArioN REPORT NuYBE(S)
6a NAM~E OFP ERFORtMING ORGANIZAT ON 60"CE SYMBOL a* NAMEf 0; M0NIOR-NG ORGANdZATON
4 00 D,00,abuf
N~aval Postgraduate School 55 Naval Postaraduate Schconi6. ADDRESS Ctr; Staff and ZIP Code) 7 ADRS CySte.&dZPole
Monterey, California 93943-5000 Monterey, California 93943-5000
8a NAME OF FuNDiNG.- SPONSORiNG B b OF'CE SY'MBOL 9 PROCUREMENT *NSTRjAENT iDENJPCATION -JUM8(RORGANIZAT ON4 [ (of jopoca(bov)
8c ADORE SS (Ct)-y State and ZP Code) 10 SOURCE OP PUNDiNG NUMBERS
PROGRAM PRO,ECT TAK ORKC.~IELEMENT NO NO NO ACC ESS ON NO
* .E i-ec',~de Secu'r-r C&Lvudcdtpo,Fault Tree Reliability Analysis of the NavalPostgraduate School Mini-Satellite (ORION)
KEEBLE, Trenton G.33 ., Cr 1: REP~ORT 3D YVE (vE QE' '4 DATE OF REPORT (Year MA Oy) PACE (0,%TMaster's Thesis ' o 98 September 8
.6 SP;1,EVCTARV NO'AT ON
COSA' CODES IS SUSEC' 'ERIS (Conf,ut on 'ereiw. f nec*Ua'y ad1 ,dent-0y by bI0ck nuMber)E.: DRoup S~q GROU'P Reliability, Fault Tree Analysis, ORION
I :.S'RAC' (Conf,nto oA #erse 0 nectui', and .doriffy by block mumYbe')
Fault tree analysis, which has proved to be a useful analytical toolfor the reliability and safety analysis of complex systems, is appliedto the Naval Postgraduate School Mini-Satellite (ORION). A generalbackground to reliability analysis, fault tree analysis, and fault treeconstruction is given. Impact of a phased mission is included in theanalysis. A identify minimal cut sets and minimal path sets. The cutssets and path sets are, in turn, used to calculate an estimate ofORION's reliability to perform a three year mission. The reliabilitymodel was const Aructed in a Lotus 1-2-3 spreadsheet to enable thedesigners to do Awhat-if" analysis.
~ 3,' CNAVALA110TV OP ABSTRACT RP o .3521 ABSTRACT SECURITv CL.ASSIFIC.A11ON-NSSF[1JLMI[ SAME AS RP r, .Sa JNCLASSIFIED
,'Ja *.AYE OF RESPONSSBLE P.0vID1UAL 11tb TEAPNON( (include Are# Code) 22c 0;0 (1 SINAGO,Prof:. J. D. Esar' 40-4628 5 E'. xae3
00 FORM 1 473,584 MAR 8) APR vdl om ay be sod uY1.I huali-led SEC RT CLASS4,'(AT'0N OF '-$_PACE oAll otmer od I-M a(* Ob'10letO Dist
* Cnpy*SEn)
LI,
Approved for public release: distribution is unlimited.
Fault TreeReliability Analysis
of the Naval Postgraduate SchoolMini-Satellite (ORION)
by
Trenton G. KeebleMajor, United States Army
B.S., United States Military Academy, 1975
Submitted in partial fulfillment of the
requirements for the degree of
MASTER OF SCIENCE IN OPERATIONS RESEARCH
from the
NAVAL POSTGRADUATE SCHOOLSeptember 1987
Author:__~ nton G. el
Approved by: -- -5 4 s vJ.D. Esary .71_esis Advisor
Allen E. Fuhs, Second Reader
Peter Purdue, Chair an, Department of~Operatio s Research
Ja: s M. Fr~ren, Actin Dean of
rmation/and Policy clences, /
/
oVI

ABSTRACT
Fault tree analysis, which has proved to be a
useful analytical tool for the reliability and safety
analysis of complex systems, is applied to the Naval
Postgraduate School Mini-Satellite (ORION). A general
background to reliability analysis, fault tree
analysis, and fault tree construction is given. Impact
p of a phased mission is included in the analysis. A
fault tree for ORION is constructed and used to--
identify minimal cut sets and minimal path sets. The
cuts sets and path sets are, in turn, used to calculate
an estimate of ORION's reliability to perform a three
year mission. The reliability model was constructed in
a Lotus 1-2-3 spreadsheet to enable the designers to do
"what-if" analysis.
A3
TABLE OF CONTENTS
I. INTRODUCTION . . . . . . . . . . . . . . . .. 8
A. GENERAL BACKGROUND AND PURPOSE............. 8
B. SATELLITE OVERVIEW.......................... 8
1. Objectives of ORION...................... 8
2. ORION Main Subsystems.................... 9
3. Possible Military Applications........... 9
C. ORGANIZATION................................. 10
D. SUMMARY....................................... 10
II. BACKGROUND TO RELIABILITY ANALYSIS............. 12A. GENERAL........................................ 12
B. PHASED MISSIONS............................... 14
C. MISSION PROFILES.............................. 16
III. FAULT TREE ANALYSIS DESCRIPTION................. 18
A. BACKGROUND TO FAULT TREE ANALYSIS............ 18
B. PURPOSE OF FAULT TREES....................... 20
C. ASSUMPTIONS................................... 22
D. ADVANTAGES OF FAULT TREES.................... 23
E. DISADVANTAGES OF FAULT TREES................ 24
V.F. CONSTRUCTION OF A FAULT TREE................ 24
1. Events...................................... 25
2. Logic Gates................................ 25
3. Special Symbols............................ 28
G. MINIMAL CUT SETS.............................. 28
H. MINIMAL PATH SETS............................. 33
I. PROBABILITY EVALUATION OF FAULT TREES........3:3
J. IMPORTANCE OF BASIC EVENTS................... 37IV. SYSTEM RELIABILITY ANALYSIS..................... 40
V. CONCLUSION........................................ 43
A. OVERALL FINDINGS.............................. 43-ft.B. RECOMM ENDATIONS............................... 42
APPENDIX A ORION SUBSYSTEM SCHEMATICS............... 45
ft. 4
I %
MR

APPENDIX B ORION FAULT TREES......................... 55
APPENDIX C ORION PATH AND CUT SETS................... 64
APPENDIX D LOTUS SPREADSHEET LISTING................ 69
LIST OF REFERENCES...................................... 79
INITIAL DISTRIBUTION LIST.............................. 80

LIST OF FIGURES
3.1 Example of a Fault Tree .................... 21
3.2 Events ..................................... 26
3.3 Logic Gates ................................ 27
3.4 Special Symbols ............................ 29
3.5 Fault Tree for Example 3.1 ................... 31
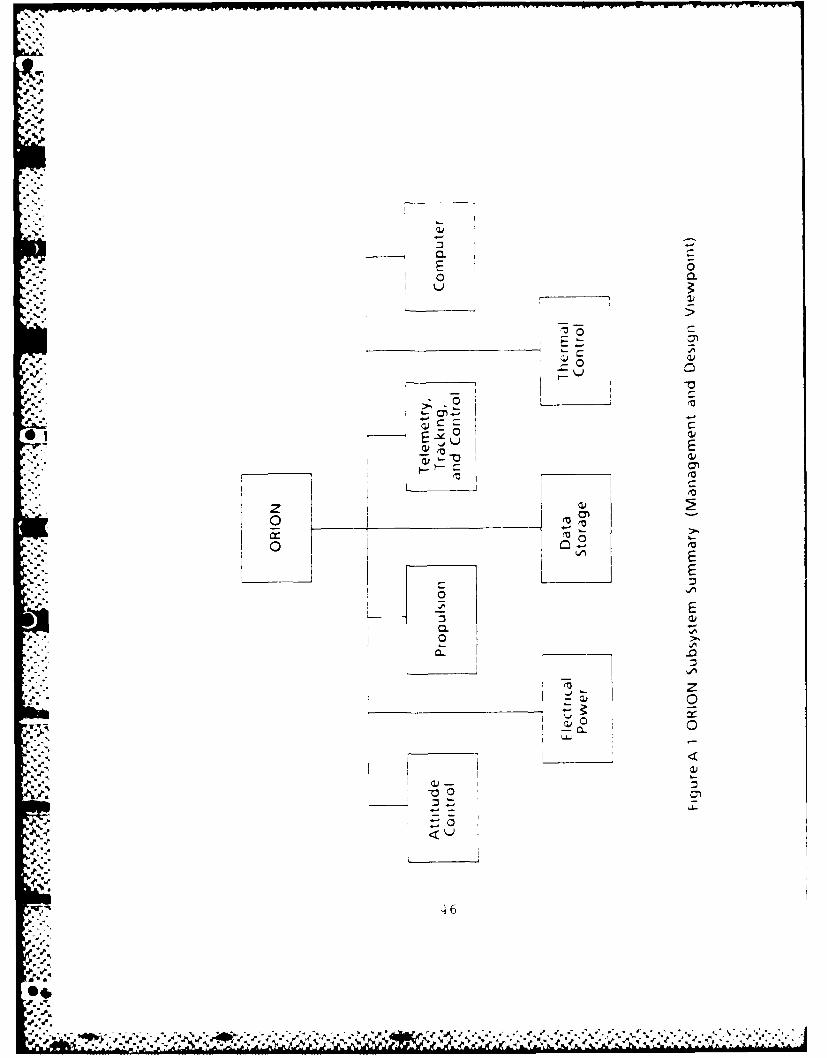
A.1 ORION Subsystem Summary
(Management and Design Viewpoint) ............ 46
A.2 ORION Subsystem Summary
(Reliability Viewpoint) ................... 47
A.3 Thermal Control Subsystem .................. 48
9 A.4 Propulsion Subsystem ....................... 49
A.5 Telemetry, Tracking, and Control Subsystem 50
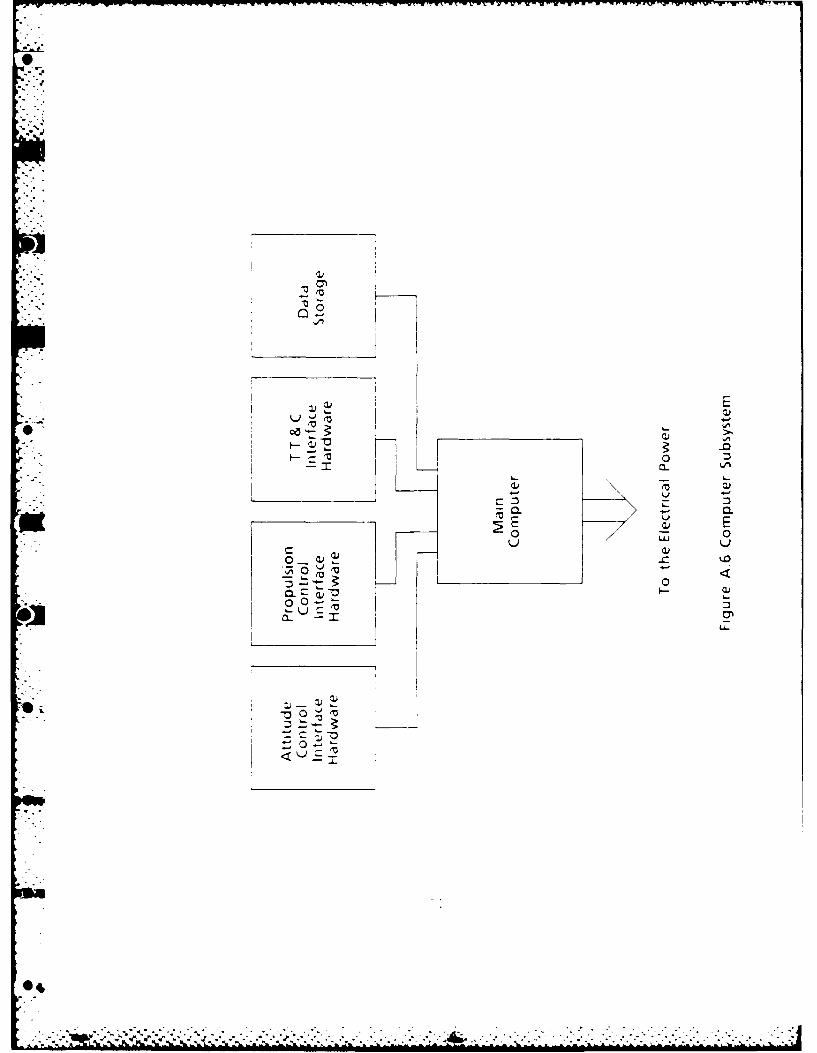
A.6 Computer Subsystem ......................... 51
A.7 Attitude Control Subsystem ................. 52
A-8 Data Storage Subsystem ..................... 53
A.9 Electrical Power Subsystem ................. 54
B.1 Top of Fault Tree .......................... 5b
B.2 Control Fault Tree ......................... 57
B.3 Attitude Detection Fault Tree ................ 58
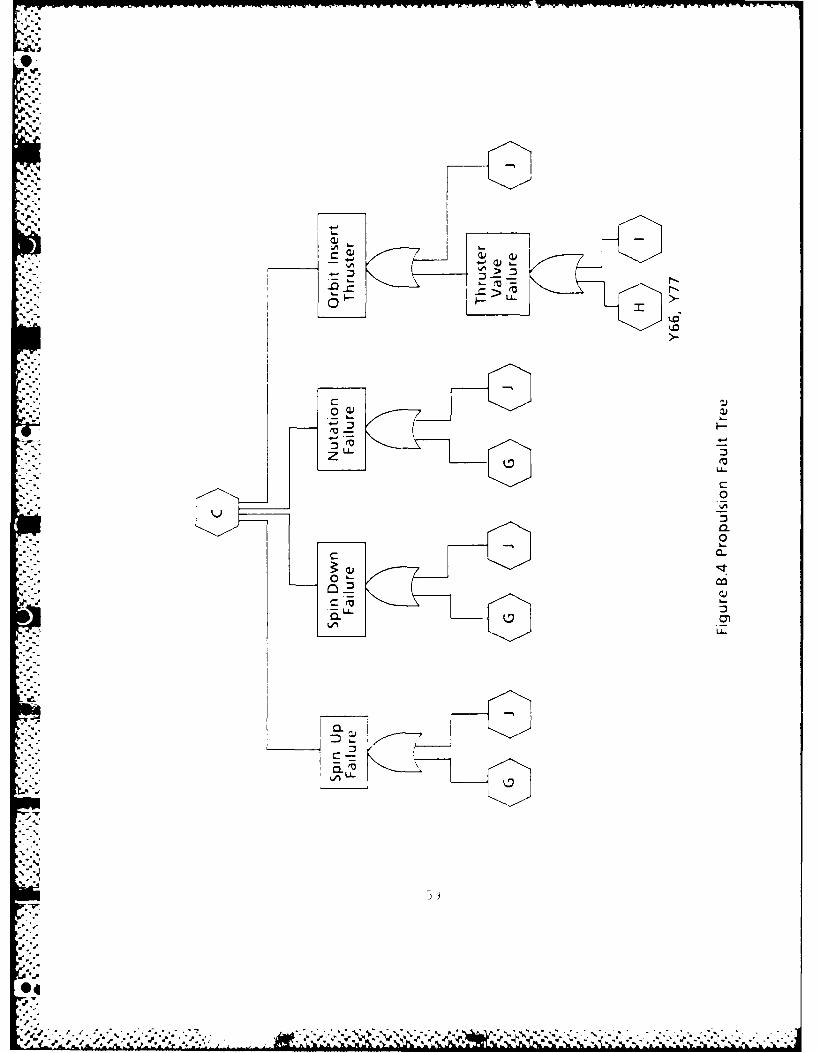
B.4 Propulsion Fault Tree ...................... 59
B.5 Thruster Fault Tree ........................ 60
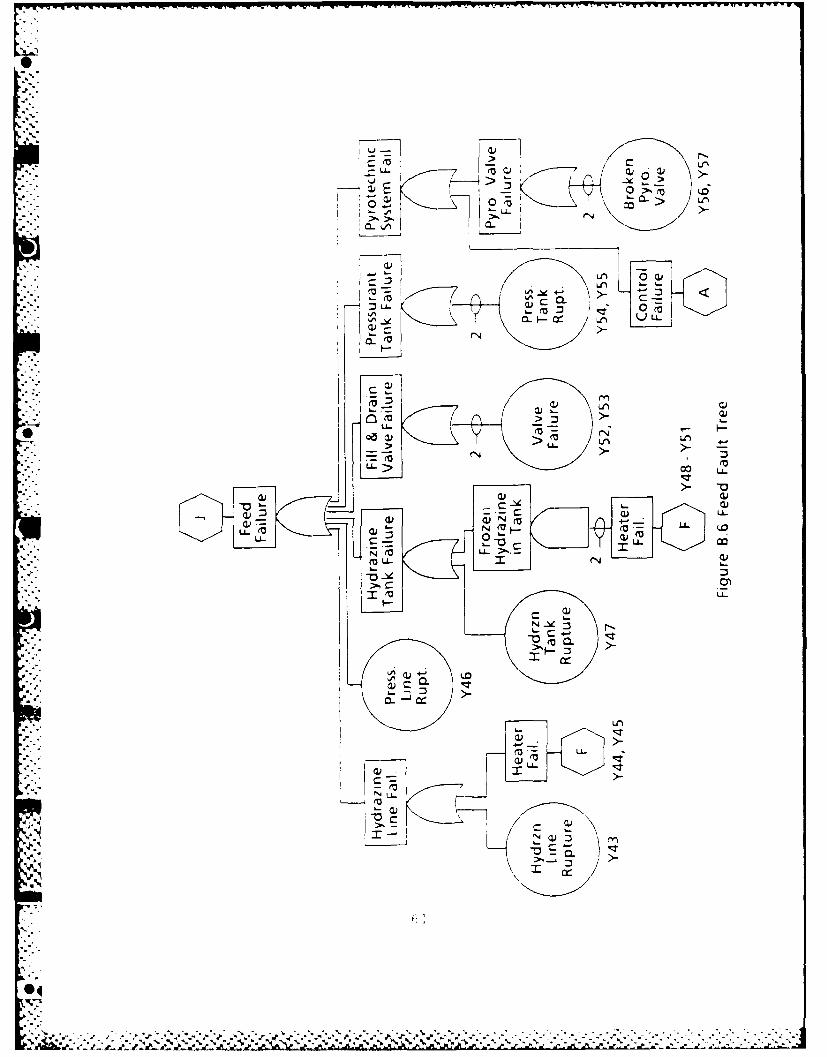
B.6 Feed Fault Tree. ............................ 61
B.7 Telemetry, Tracking and Communications
Fault Tree ................................. 62
B.8 Electrical Power Fault Tree .................. 63
C .1 Path Sets .................................. 68
,6
el6
o - . • . . . . . . • o q -p * "* " . " . % m % " b0 "-"- "% ,
ACKNOWLEDGMENT
This analysis effort could not have been accom-
plished without the assistance and guidance from Marty
Mosier, System Engineer for ORION. The additional
insights provided by Ed Senasack and Tom Whitmeyer,
both of the Naval Research Laboratory, were essential
to the completion of this thesis. Thanks to these three
gentlemen my education has been broadened and my depthof understanding of satellites has increased
immeasurably.
-v7

I. INTRODUCTION
A. GENERAL BACKGROUND AND PURPOSE
The Naval Postgraduate School Mini-Satellitep
(subsequently referred to as ORION) is an actual
engineering effort by the students and faculty of the
Naval Postgraduate School to produce a low cost, multi-
purpose satellite. The focus of this thesis, as a
portion of that effort, is to derive a fault tree for
ORION and assist in its design by identifying weak
links in its system reliability. The format of the
thesis is intended to make the results of this analysis
readily accessible to colleagues to facilitate the
design and construction of ORION.
B. SATELLITE OVERVIEW
ORION is an alternative concept for low cost
military spaceflight. It is designed to be aninexpensive, reliable satellite bus that can be mission
4specific, yet maintain a flexible architecture. The
mission payloads can vary from 50 lbs. to 130 lbs. and
are designed for a mission life of three years. Due to
its simplistic design, ORION includes very little
redundancy.
1. Objectives of ORION
ORION is designed with eight objectives in
mind. They are:
a. to satisfy many small mission needs with a low
cost, reconfigurable vehicle.* b. to provide an affordable, boosted-free flyer to
complement SPARTAN and SPAS1.
1 1SPARTAN and SPAS are existing experimental4- platforms used b.y the Shuttle. They are on station as
long as the Shuttle is on station.
8
L4

C. to achieve circular orbits from 135 nm (nautical
miles) to 800 nm with propellant reserve.
d. to achieve elliptic orbits to 2200 nm with a
perigee of 135 nm.
e. to have a longer life at Shuttle altitude than
SPARTAN.
f. to provide an affordable platform for space
science, space technology, and military missions.
g. to provide a cost effective bus for constellation
proliferation.
h. to be dependable and affordable.
2. ORION Main Subsystems
For purposes of management and design, ORION
can be separated into seven subsystems. The subsystems
* are:
a. the propulsion subsystem.
b. the electrical power subsystem.
C. the data storage subsystem.d. the telemetry subsystem.
e. the thermal control subsystem.
f. the attitude control subsystem.
*g. the computer subsystem.
The reliability analysis focuses on how the
subsystems interrelate. As an example, all the
subsystems require the electrical power subsystem towork. These dependency relationships are developed and
displayed in the fault tree.
3. Possible Military Applications
Due to ORION's objectives and simplistic
design, there are several apparent militaryapplications. Some of those applications include:
a. proliferated platforms for communication.A b. ultraviolet sensor platforms.
9
@14

M7
C. high energy particle detectors.
d. targeting laser or KE (kinetic energy)Aweapons, reentry vehicle simulator, or kill
assessment.
e. low cost imaging platforms.
C. ORGANIZATION
This chapter provides some background to ORION and
Its possible applications. Chapter II gives a short
background of reliability analysis. Chapter III followswith a description of fault tree analysis. Chapter IV
contains the applications of a fault tree analysis to
ORION. The final chapter, Chapter V, states the
conclusions, recommendations, and suggestions for
further research.
D. SUMM'ARY
The primary benefit of this analysis has been toaid in the design of ORION. This was accomplished by
identifying 82 minimal cut sets. Of these cut sets 22
are single-element sets, 29 are double-element cut
sets, 27 are three-element cut sets, 2 are five-element
cut sets, 1 is a six-element cut set and 1 is an
eleven-element cut set.
The dual tree reveals over 33 billion distinct
paths. Using modular decomposition this number is
reduced to three distinct paths. The path sets were
used to determine the structural Importance of each
component.
The structural Importance analysis determined seven
different levels of significance. Twenty components are
structurally the most significant. A listing of them is
given in Appendix C. The remaining levels and their
associated components are listed in Chapter IV.
10
.+I +., .+:,:+ , I -. , ~, 01, "J ".7 . _V -I - I - PW 1 W,,I+ . + +. .. . , : + . p m + ++
The reliability importance of components cannot be
determined since the design is not completely
established. A Lotus spreadsheet was developed to allow
the designers to do a "what-if" analysis with component
reliabilities as the subsystems are developed.
.Z6I,
..:
.4.-.z
.4.
4- ++1 -+ -++ + :+ ' ++ + + 1 ++++ 1 ' - 5 +[' I .. ';m+ +]: % ++ . . . .

II. BACKGROUND TO RELIABILITY ANALYSIS
A salesman called on Steinway & Sons to show them a
new piano-key pin. "My company believes this aluminum
pin is greatly superior to the pin you have been
using," he said.
Mr. Steinway deliberated for some moments. "Well,
young man," he said at last, "we are an old firm, slow
and cautious about making changes. But we will install
your pins in one of our pianos and give them a trial."
The salesman was delighted. "That's good enough for
me," he said. "How long a trial will you need?"
"Oh," said Mr. Steinway thoughtfully, "I'd say
about 50 years." [Ref. i]
A. GENERAL
Performing the mission is undoubtedly the best test
of reliability. However, today's decision makers and
analysts rarely have Mr. Steinway's luxury of time. Not
only is time a scarce resource, but there are many
cases when neither the system's working or living
environment nor the money to do extensive or realistic
reliability tests is available. With such constraints,
other methods must be employed to estimate
4. reliabilities or limits on reliabilities. Reliability,
in the sense used here and throughout the thesis, is
the probability of a device performing its function
adequately for a specified length of time and operating
conditions. Therefore, the purpose of reliability or
system analysis is to seek out those reliabilities or
limits on reliabilities. Within that pursuit, there are
two important aspects to a system analysis: (1) an
12
Sa7............................................................

inductive analysis stage and (2) a deductive analysis
stage.
During the inductive analysis stage, available
information on the system is gathered and organized.
The system is then defined, its functional purpose de-
scribed, and its critical components determined. At
this stage, the question is posed "What can happen to
the system as a result of component failure or human
error?" Possible system failure modes are then hypo-
thesized. A failure modes and effects analysis is
. conducted at the component level. Specifically, a list
of all envisioned mechanical and electrical failure
modes is generated. This, in turn, leads to a critical
components list including assessed failure rates.
Additionally, it is well known that system failures
S, often occur at subsystem interfaces. The interfaces,
therefore, become an important part of the analysis
along with the components.
The deductive analysis of a system or reliability
analysis answers the question "How can a system fail
(or succeed) or be unavailable?" A logic tree (or fault
tree) is often the best device for deducing how a major
system failure event could occur. However, its
construction depends on a thorough understanding of the
system and the results of the system inductive
analysis. A block diagram or a network graph is a
useful device for representing a successfully
functioning system. Since the network graph is close to
a system functional representation, it cannot capture
abstract system failure and human error events as well
as the logic tree representation. [Ref. 2: pp. 1-2]
Also during the deductive stage a particular method
of analysis must be selected and employed. Some of
those methods include: fault tree analysis; state space
approach; decomposition method; circuit stress
13
%..

analysis; network reduction technique; block diagrams;
and Monte Carlo simulation. Each has its advantages and
disadvantages. The primary reason fault tree analysts
was selected is that ORION is still in its design stage
and fault tree analysis is particularly beneficial in
developing a design.
B. PHASED MISSIONS
Phases of deployment affect a satellite's
reliability. A phase change occurs whenever the size of
the set of active components changes. Another way to
look at this is to say the functional organization of
the system changes with time. During each phase of the
mission the system must accomplish a specified task.
A phased mission profile causes complexities not
present in a single-phase system. However, it can be
transformed into an equivalent synthetic single-phase
system. This refined profile can then be used to derive
an approximation of, or bounds on, mission or satellite
reliability.
* * It is inappropriate to do a standard reliability
* analysis for each separate phase, and then multiply the
* . resulting phase reliabilities together as If they
referred to independent events. The implicit assump-
tion, that each component is functioning at the
beginning of a phase when the system has functioned
throughout the previous phase, is not necessarily true.
[Ref. 3: pp. 11, 12] A component must have survived the
first n-i phases before it can function in the nth
phase. Additionally, through the sequence of phases, a
component or set of components may be turned on and off
several times during the first n-i phases before it is
needed during the nth phase. These are all reasons
the phase reliabilities cannot be merely multiplied
together to obtain an overall system reliability. A
14
'.eW.

simple example follows to illustrate phased mission
analysis.
Example 2.1 A system with two independent
components, C1 and C 2 , is designed for a two-phased
mission. In order for the system to perform the
required tasks, at least one component has to function
through phase 1 and both components have to function
through phase 2. The block diagrams for this systm is
Cl
C2
phase 1 phase 2For k=l,2, let Pki denote the probability that
component Ck functions through phase 1, and Pk2 denote
the conditional probability that component Ck functions
through phase 2, given that it has functioned through
phase 1. The system reliability for phase 1 Is
Pl = P11 + P21 - P11P21, and the system reliability for
phase 2, given that both the components have functioned
through phase 1, is P2 - P12P22" Multiplying these
together would lead to the mission reliability
P - (P11 + P21 - P11P21)P21P22
This is greater than the correct mission reliability,
which is
P11P12P21P22
since mission success is achieved only if both compo-
nents function through both phases. [Ref. 3: pp. 12-
13]
15
014
-A.-%e

C. MISSION PROFILES
An additional complication to phased missions is
the absence of an exact mission profile for ORION.
Since ORION is designed to be a low-cost general
purpose bus for an electronics package, it can be
employed in an infinite variety of profiles. For
purposes of this analysis, two distinct profiles are
analyzed.
The first mission profile envisions a 3-axis
stabilized sensor platform that does not experience an
..,orbit change. After the satellite has been ejected from
the canister it becomes autonomous. A short time delay
is needed before ORION begins its mission profile. The
time delay is necessary to insure ORION is sufficiently
away from the Shuttle before It becomes active. This
profile is partitioned into five phases. They are:
- activation
- antenna boom deployment
- establish orientation
- re-orientation (if necessary)
- station keeping
The purpose of the activation phase is to "wake up"
. ORION and conduct internal checks to insure ORION is
functioning. The antenna deployment phase Is completed
when the antenna booms are locked in the extended
position. The specific mission of the orientation phase
is to establish ORION's spatial and orbital orlenta-
tion. The fourth phase may or may not occur. If It Is
determined that ORION is not properly oriented then re-S.
orientation is essential. This phase includes any
necessary re-orientation commands. The final phast,ensures ORION maintains the orbit(s) specified by Its
mission profile. All of ORION's subsystems are required
(i.e. must function) to perform station keeping tasks.
01
" ".e
The second mission profile is for a spin stabilized
satellite with an orbit change. Such a profile is
_ characteristic of a communications satellite. This
profile has nine phases with the same four initial
phases as the first mission profile (i.e. activation,
antenna boom deployment, orientation and re-
orientation). The remaining five phases are:
- orbit boost
- orbit fix
- orientation
- re-orientation (if necessary)
- station keeping
The purpose of the orbit boost phase is to accelerate
ORION out of its low earth orbit. The orbit fix phase
establishes ORION's mission orbit. The remaining three
phases are identical in purpose to the final three
phases of the first mission profile. Again, all of
ORION's subsystems must function to perform station
keeping tasks.
In both mission profiles (or in any mission profile
generated) the last phase utilizes all of the satel-
lite's subsystems. Since all subsystems are needed
during the last phase, the phased mission analysis
dictates that every subsystem must survive the entire
*mission life. The resulting synthetic single-phase is
all the subsystems operating in series during the
entire length of the mission.
.1
- 17
U.
0.°
III. FAULT TREE ANALYSIS DESCRIPTION
A. BACKGROUND TO FAULT TREE ANALYSIS
The bulk of this chapter is a compilation of
information extracted from reliability literature. It
is included here only to give the reader a background
to the fault tree reliability analysis performed In
this thesis.
.The fault tree method resulted from a contract
between the Air Force Ballistics Division and Bell
Telephone Laboratories for the study of an inadvertent
launch of the Minuteman ICBM. The Launch Control Safety
Study (1962) first described fault tree analysis in
Volume I Section VII "Method of Inadvertent Launch
Control Analysis." Minutempn I was in production when
the study was completed, therefore no design changes
resulted from the study (effecting design changes has
become a primary advantage of fault tree analysis).
Because the results of the analysis were so close to
the observed data of Minuteman I, fault tree analysis
was used during the design phase of Minuteman II. Since
then, fault tree analysis has been used in combination
with other techniques to predict and improve saf-ty
performance and reliability in complex aerospace ;and
- -. military systems.
After initial work at Bell Telephone Laboratorles.
e(lvelopment of the faul t tree method cont Inued at th,
Bo ing Company, where the technique was applied to
mann,,d spacecraft. Boeing and AVCO pub]li shed fault t r,ee
reports on the Minuteman II system in March 196: , and
January I194, respect IveIy. In ,June 190, Boe l ni and
the University of Washington C- sp(nso)red a SV.zteli
.. Safety Symposium in Seat t le. Five o)f the present at iI".
-o°=-
-%.V
-02"
OI
were fault tree articles by Boeing employees. A paper
by A. B. Mearns of Bell Telephone Laboratories also
described fault trees. These six papers and the Launch
Control Safety Study are the main references cited in
articles after 1965. [Ref. 4: p. 3]
-" Fault tree analysis consists of six steps:
1. define the top event to be investigated,
2. gain an understanding of the syqtem,
:3. construct the tree,
4. collect quantitative data,
5. evaluate the probability of the top event,
and
b. analyze the results.
,2 The top event of the tree should be well defined in
terms of operating modes of the system, environmental
*I conditions and time limits. However, the failure must
represent a major system malfunction which threatens
personnel or equipment.
Generally accepted symbols are necessary t()
represent differences In events and logic relationships
since the fault tree is graphic as well as analytic. In
addition, several people at separate locations and at
different times may contribute to the analysis. The
Collowing sections describe events, logic gates and
special symbols.
Instead of being hardware oriented, fault tree
analysis is event or failure oriented: that Is, it
examines a particular system failure for all possible
causes. Control of the system fal ure through knowldg,'
t,, its causes is the analysis objective. The tree is a
t raphlcal representation of possible causes )f a major
fa I lure which appears at the top of the t ree ('cal Ied
t he t)p event During construct I(,) the t ree grws
downward and outward as fal 1 ures an (I Cael s a r
described In increasing detail . When th, tree Is
191

completed, probabilities are associated with the
failures lowest on the tree. The bottom events concern
failures of basic components which can be associated
with probabilities. The assigned probabilities are
combined as dictated by logic gates to give
probabilities for events higher on the tree. The
combination of probabilities continues until the
complex top event has a probability calculated from the
-- accurate component data at the bottom of the tree. In
general, fault tree analysis involves two kinds of
reasoning: the thought processes involved in
construction produce a downward flow, whereas the
evaluation of probability and operation of the logic
gates dictate an upward flow. [Ref. 4: pp. 1,6,7] See
Figure 3.1 for an example of a fault tree.
B. PURPOSE OF FAULT TREES
Generally, fault trees serve three purposes.
First, they aid in determining the possible causes
of a system failure. When properly used, the fault tree
often leads to discovery of failure combinations which
* otherwise might not have been recognized as causes of
the top event.
Secondly, they serve as a display of results. If
the system design is not adequate, the fault tree can
* be used to show what the weak points are and how they
lead to undesirable events. if the design Is
adequate, the fault tree can be used to show that all
conceivable causes have been considered.
L-astly, they provide a con~enient and efficient
format helpful in the computation of the probability of
-stem failure. [Ref. 5: p. 10]
20
Vs.

TopEvent
ANDGate
4' Events
OR.. 4*~*Gate
Bottom Events
Fiue31Eape4faFutTe

C. ASSUMPTIONS
In selecting fault tree analysis as the analysis
tool, some assumptions had to be made. Fault tree
analysis requires each component to be either in a go
or no-go status. Typically, a spacecraft has functional
A states which are considered as degraded. During the
design of ORION, subsystems were engineered for more
than just their design envelope. An example is the
propulsion system. More fuel than an extreme mission
profile would require is designed into ORION. As such,
a true degradation will exist in the working environ-
ment (i.e. fuel is used throughout the mission and its
tank is not always full), and the propulsion system isconsidered to either work or not work.
System components are assumed to have statistically
* , independent lives. No component can be repaired or
replaced, and each component has a finite life. [Ref.
6: p. 10] As with the components, only two states of
the system are recognized, functioning or failed. It is
assumed throughout this thesis that the state of the
system (i.e. functioning or failed) is completelydetermined by the states of its components.
Each component will be tested prior to installation
and again after installation to insure the system
functions properly. The total test time for every
component will be at least 500 hours. During these
tests the components will have an opportunity to fail
and be replaced. If after all the tests the component
Is still functioning, It is assumed it will face aconstant failure rate during Its mission life. This
-"p..assumption means the exponential distribution will be
used in determining a component's survival probability.
The physical structure of the satellite will
undergo stresses and strains. Throughout the analysis
It is assumed the satellite will not be stressed
22
.1*

- -------- rr
outside of its design envelope. This means no component
will experience loads greater than or equal to its
elastic limit. Additionally, no part will experience
fatigue failure due to cyclic mechanical or thermal
stress loading. It is also assumed the shared stress
environment creates associated components. The concept
of association will be addressed later.
All basic events are assumed to be relevant to the
event tree. This means each basic event appears in the
union of the min cut sets. A formal definition of
relevant components is presented in Section J of this
chapter.
* D. ADVANTAGES OF FAULT TREES
There are some distinct advantages of fault tree
analysis that make it particularly suited for the
reliability analysis of ORION. These advantages
include:
1. the clarity of subsystem interrelation is ex-
pressed by the tree.
2. the fact that the tree can be quantified.
3. enabling the analyst to focus on one particular
undesired event at a time.
4. for constructing meaningful fault trees, the
analyst has to Interact with the designers and
operators to fully understand the system. The
insight obtained during this process is of major
benefit to system design, since weaknesses are
spotted and corrected during this period.
5. the graphical representation of the logic struc-
* ture provides a visual tool to both the engineers
-~ and management and is useful for justifying
design changes and performing trade off studies.
6. the fault tree, being In essence a top-down
failure mode and effect analysis, lends itself to
23
@4

better organization and control than the c(,nven-
tional failure mode and effect analysis. Because
of the top-down approach, it also offers more
flexibility in terms of termination at any hard-
ware level as well as selectively exploring
certain critical faults in greater depth.
7. the fault tree can be used to obtain minimal cut
sets which define the modes of system failure and
identify critical components. [Ref. 71 Minimal
cut sets are addressed in paragraph G of this
chapter.
E. DISADVANTAGES OF FAULT TREES
treThough there are some general drawbacks to fault
treanalysis, these shortcomings do not adversely
affect the analysis of ORION. Fault tree analysis can
be time consuming, expensive to produce, and include
overwhelming detail for large or complex systems. Since
ORION is to be a low cost, multi-purpose bus, a fault
tree analysis is not necessarily complex or time
consuming. Another general drawback is it requires
considerable effort to include all types of common
A cause failures in the fault tree. A fault tree cannot
readily handle priority AND gates and elements in cold
standby. A priority AND gate restricts its inputs toe
specified sequence. ORION has no feature requiring a
priority AND gate and has no component in cold standby.
* F. CONSTRUCTION OF A FAULT TREE
There are three groups of symbols commonly used to
construct a fault tree. The three groups presented here
are the events, the logic gates and some special
symbols.
24

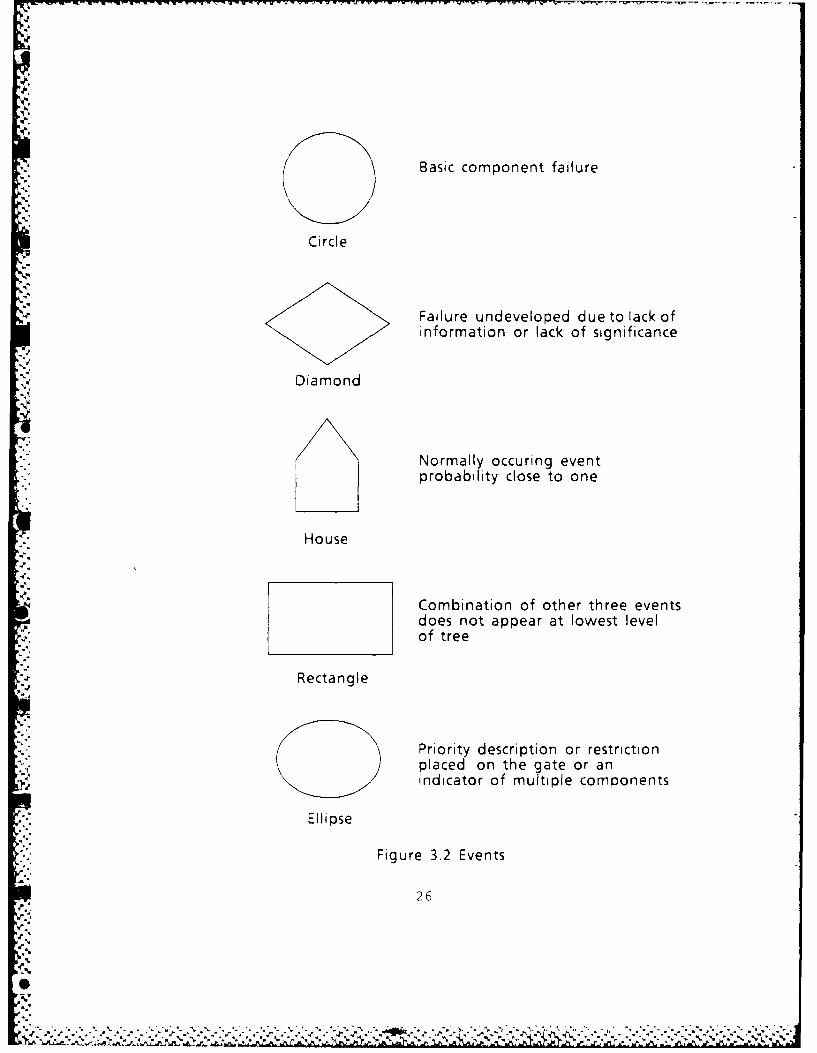
1. Events
Four kinds of events are represented by the
four symbols in Figure 3.2. A circle represents a
clearly defined failure of a basic component. In con-
trast to the exactness represented by the circle is the
uncertainty associated with a diamond event, which is a
failure not well understood because of absence of
information or significance. Circles are called primary
events and diamonds secondary events. Collectively they
are called bottom events. As such, they are on the
bottom of the tree, have reliabilities associated with
them, and represent the depth of resolution. Normal,
frequently occurring events are symbolized by a house-
shaped figure. An example is the satellite being
eclipsed by the earth. Without sunlight the solar
* panels will not generate a voltage. Though no voltage
is considered a failure, this condition is not the
result of a broken panel. Finally, several events
combined together by a logic gate form a combination
event represented by a rectangle. Rectangles are called
gate events. Gate nodes correspond to intermediate
events while the top node corresponds to a very serious
system failure event.
2. Logic Gates
Many different logic gates are used to combine
events, but three simple ones are sufficient. These
three (AND, OR, and INHIBIT) are illustrated in Figure
3.3. Note that the inputs enter from below and the
voutput comes from the top of the gate. The AND gate
produces an output if all the inputs exist simulta-,.
neously. The OR gate produces an output when at least
'- one of the input conditions occur. These two gates are
the same as ordinary usage of the words "and" and "or."
The INHIBIT gate produces output when the input is
present and a specified cond'tion exists. In
25
V0"
*'o".o
( ) Basic component failure
Circle
Failure undeveloped due to lack of
< > information or lack of significance
Diamond
Normally occuring eventprobability close to one
House
Combination of other three eventsdoes not appear at lowest levelof tree
Rectangle
Priority description or restrictionplaced on the gate or anindicator of multiple components
Ellipse
Figure 3.2 Events
26

AND Gate
*°1
, .
Priority AND Gate
Description of priorityor restriction on inputs
OR Gate
4-,
I -- CRestricted OR Gate
Restriction on inputI :combinations producing
output
Figure 3.3 Logic Gates
27
0
- .. ... . . . .. I*

words, the output is "inhibited" by lack of the stated
condition. The INHIBIT gate can be compared to
FORTRAN's logical IF statement. The FORTRAN statement
"IF (A .EQ. B) GOTO 1030" states that if the condition
A equals B is satisfied, go to statement number 1030.
If the condition is not satisfied, continue in normal
sequence.
3. Special Symbols
Shown in Figure 3.4 are three special symbols
representing parts of trees used to reduce redundancy.
These comprise the last set of symbols presented for
construction of a fault tree.
The hexagon refers to another fault tree which
is substituted where the symbol appears. A good use for
this symbol would be when a particular failure needs
* further definition. The detailed tree would be headed
with another hexagon and bear the same label as the
hexagon in the original tree.
To repeat another portion of the same tree, a
pair of triangles is used. The portion of the tree
below the triangle on the left is substituted at the
point where the triangle appears on the right.
The last special symbol (an ellipse) indicates
identical components either in series or parallel. In
this case only one component is mentioned and the
* redundancy is shown by an ellipse around the input. The
number of components is written beside the symbol.
G. MINIMAL CUT SETS
A listing of minimal cut sets (or min cut sets or
MCS) is useful for design purposes by helping to
determine the "weakest link(s)" in the system. A cut
set is defined as any set of primary and secondary
events whose occurrences cause the top event to occur.
28

HEXAGONTo repeataseparate tree
'a
b TRIANGLETo repeat a port Ionof the same tree
bL
ELLIPSEn n To indicate n
identical components
Figure 3.4 Special Symbols
-~ 29
4
A cut set is minimal If" it cannot be reduced and still
ensure the occurrence of the top event.
The algorithm used to identify min cut se-ts i-
based on the fact that AND gates always Increase tilt
size ot a cut set while an OR gate always Increases the
number of cut sets.
The simplest and clearest way to explain th tiltr,
u t set algorithm Is to Illustrate its opt rat ion iil il
example. The event tree for Example :.1 is Figure. :-5.
Example 3.1:
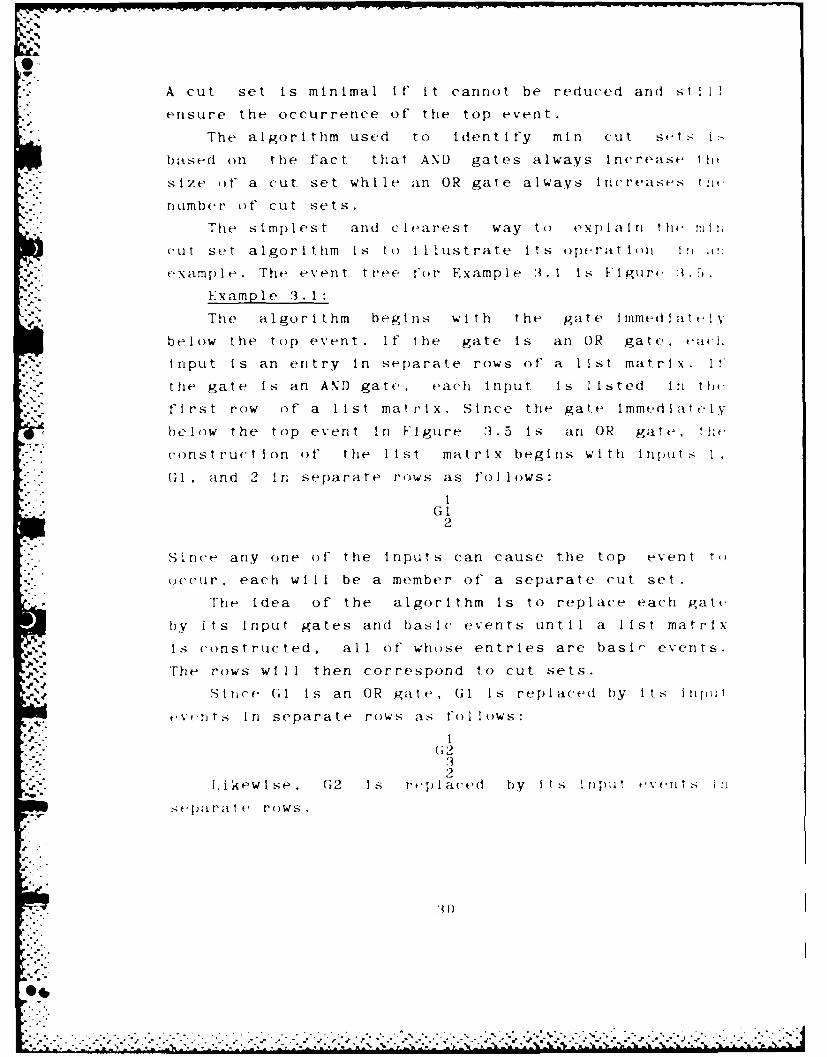
The algorithm begins with the gate immedlat.l V
below the top event. If the gate is an OR gate, each
Input is an entry in separate rows of a list matrix. I'
the gate is an AND gate, each Input Is listed li tilt-
first row of a list matrix. Since the gate immedlate.ly
below the top event In Figure 3.5 is an OR gate, the
construction of the list matrix begins with inputs 1.
l and 2 in separate rows as follows:
I. 12
Since any one of the Inputs can cause the top event to
occur, each will be a member of' a separate cut set.
The Idea of the algorithm Is to replace each gate
by its input gates and basic events until a list matrix
is constructed, all of whose entries are bash( events.
The rows will then correspond to cut sets.
I Since 6; 1 is an OR gate, (1 Is re)lace(I by Its in put
e-ven ts In separate rows as ftol lows:
:32
Likewise, G62 Is retpla ed by I ts Input eve.nts i
- separate rows.
.-.
-W- ,,..•N A . o . . . .

[ VENTI
CO"
G 02
K3 N
G2
4
G3
G4 G56I
17 ' 8 910 1' 2i1 13
Figure 3 5 Pault Tree for Examole 3 1
..P&'&!"
-.
.J~.;,.aaaai a P

W°
G3
Sine al I inputs to an ANI) gate must (cur to (au.-,
, iIte, rmtediate event abo)ve the AND gate, this .,'.
I lhat an AND gate I ncreases the length )t' Its row. An (OP
igat t. . oi t it (iI lie r lanil , i ncrea s-s t lie num)e r ()I r(w-
i rn I l 1t- lis t ma tr'i1 .
pepl ac I rig GA (whicl Is an AND gate) by Its I ript
l t. s t mat r I x become s
p 14.: 5
(14 G (5:32
tep 1 a ig G4 by It s inputs, the list becomes
4":"" 5
6,t (;r5t) , G(5
( ,it ifi r g Urit 1 1 the 1 1st c(n tia Ins )n ly pr I mar'y ,
-..5( (INdIV eveits the list stoips with thse (e r arranged
" ( z-i t s "
1 t),9 7',9,,(
2 b, 10 , 0 , 0t ) "" I I ) I I
4 6 ,12 712 S,1 25b ,1: ,:3 3 :3
Ir th I s examp I e bas i c events arf- ri t r' epeat (It. I I
has i - .ents are not r e pe attd aI I tf' the ut sets ',
m i r i i (tl t se t . . i I s m ean s no 011t' u t sIt t
"- ii r tjn med Iti any oit , Itt . G tine ral Iv, iF C ,.t:- i
.,it s are rep-eated In the i r'ee thei alkgor I t hn d(ot,- nl,,
t -- ,' mrm i cl InIv m Il cu t sts. o, when l)as Ic even .ts mr,
., t pated smfwhtre In the' trt,t t he I Ist mat r -x r i, t 1),
.t Ir' 1 d t .l Ir ni t fts w Ich 1 w tI 1,
.l. t'i r, II t w ill t 1in int ainI ri .V( un it a '
.12
fL: .706

7 --
. H. MINIIAL. PATH SETS
* The dual to a cut set Is a path set. Path sets art,
identified -,rough the dual event tree and consist ,
the events necessary to make the system furct ion rat her
than fail. To draw the dual event tree, replace AND
gates with OR gates and OR gates with AND gates in the
original tree. Each event must also be replaced with a
dual description. Failures in the original tree beeme'
successes in the dual (new) tree. In general, thc dual
basic events are the non-occurrence of the- oripirna'
basic events.
As in the cut sets, the focus is on lhe. nllriim;
path se-ts. A path set is minimal If it canne
r urther redur'ed and st I I Insure the lop everit I il, t I
system success). Min path sets are de term I r ed by
app lvi ng: The same ml n cut a lgor I t hm to tht dual (
PROBABILITY EVALUATION OF FAULT TREES
T() bul d the mathematical structure necessary '
",ln Ive system rel lab Ill ties the states of a comr),,)( ,.:1
first be deflined. To) Indicate the state ,)I ie. :
"-lr ,mpnin t a binary indicator varlable x 1 is as!iritned
' , r.tl , nI¢ f t :
,' r'L . -. . . . .n . and r is the ri'rnber of (ompoflt i"!:-l h svs t em. AddA t Ina1 ly, a binary varlab It •
dd I t " '............
;': r,', t is assumed that the state of the' m T
,i leteflY de t ermlines the state , the sy tem
. vstem state can be represented as
....................................................."...........................

where
The function ',( ) Is called the structure function (0'
the system. The number of components (n In the system
Is called the o-der of the system. As an example, th,.
structure function of a series of n comp ,nents Is
H
i(,A, i s t -n t wIth a b v v i t .
Sm>p. nt e nrt as a'tl n c t I n
S I n I ar pv, nr a itara I ri arr. raiv m1 (I-
p. fi 1 t n I , I t i t e 1i .rSPI(i T i T! ) ages, hi I.-
A A t I . iu -fn s t nu- t une f tnrc t I ons I f and onr I y I1!' it
k (o't the n comprenit~s f'und 1on . Thi1s striic~i ne
.4.<I ()rl I s s own b
i;iui I I nees w I t h AN\D ;iind P~- pa T rs c nti T s ni( lit
'1
.°4.
"*4** r '' :s a ''a ke v th ~ . is )i
'S..

functions which are coherent 2 . Then given a coherent
structure ( of order nri
11
Ibs means a system's performance is bounded below by a
serles representation and above by a parallel
rtpre sentat ion. [Ref. 8: pp. -8]
With the jth (j - 1..... p) min path set Pj, we
..i v e, xpress a structure (cal led the minimal path
Sse-les strlicture) with arguments
, sCru( turf, is binary and takes on the valute 1 If
. . !i, (,,MP ,,rnts I the j min path set tunct ion.
x r-esS ln 0-plcts a path set as a series
,, the' path set 's elements. A system wil 1 1
- :., in wr ,rer at least ,,he mln path set f!unctloris. The
irt- f'urk t I ()t,. (an t hen, bt' writ ten asN
S,,dr.- 'i,- st F r t f'urlclt orl carl be viewed as a
,. rangemenr )f the path sets. This is commonly
i".t., ' a. a parak f -serIes arrangement
V wit t, r. i u ma I cut set s the st ruc tire
.: .l r i a 1I 'I It s t rli ct i r c c' a ri h
"A rAnt- st tm i tirt heIig rough 1 y Wtt W!hosera ;A I i# s r i
t d t * r t at f- herl fall e c, r , D V) t ur , 1 ' I trig ones Re t : pp. 19 , 1 ()2
§r'
o
*.."i • . . . . . . ''" " . *. ."' .' " *"." ' . "''-,".-' " ".-'. - .'. -. . -- • '. " " . *- -. ". " " "" "' . . . . .""

q.1*
which is binary and takes on the value 0 when all the
components In the jth min cut set fall, and 1
otherwise.
Since the system will fail if and only If at least
one of the min cut structures fails, the structure
function can be viewed as a series arrangement of the
cut sets with the elements of a cut set arranged in
parallel. Such an arrangement can be expressed as
T1.. is referred to as a series-parallel arrangement.
Initially, the components are assumed to be statis-
tically independent. If the state of the 1 th component
Is random (denoted as XI) then
-X I1 ; ri[2:, . -r 1
w. where E[X] means the expected value of X. The
" probability that I functions, Pl, is referred to as the
reliability of component I. In similar fashion, the
reliability of the system is
!" "; f"I X .- ' = . .:: X
Th 1t rel iabli ty of the k-out-of-n case with
u a , I mponen t s and re 1 lab I I I.t i es conmes [ Ref. S:
; pp. 20-21
-.-
The preceding formula holds under the assumption of
'omponent Independence. In reality, this Is not usually
36
@4
.. A . ... . . - . * - . -..- :-.-. . -- - . . . ' ...- i . .. '- ., . . ? . - -. '7 '? i - Y .--- '

J''-I
the case. Independence will be replaced with a form of
positive dependence. Components can become positively
dependent in various ways. For example, If a subsystem
has several like-components and one of them fails, the
subsystem remains functional because the remaining
functioning components share the load. Another way
positive dependence is created is when all the
components are subjected to the same stress environ-
ment. The components of ORION fall in this category. If
the reliability of a series arrangement of independent
components is calculated, when In fact they are
associated 3, the resultant reliability will be an
underestimate of the true reliability. The opposite
holds for parallel systems. [Ref. 8: pp. 29,32]
The following min-max bounds theorem is presented
In Reference 8, page 37, along with the theorem's
proof.
Let ; be a coherent structure. Let P 1 , P 2 .... Ppbe the component mmn path sets corresponding to ,
arid let K 1 , K 2 ... , Kk be the component min cut sets
corresponding to . If components are associated,
then the following bounds hold:
p 1',[1
Another, equivalent relationship can be expressed in
terms of q, - I-pl. The above bounds now become:
J. IMPORTANCE OF BASIC EVENTS
There are two kinds of component importance. The
first Is structure importance and the second is
3 Assoclation is a naticular form of positivedependence Ref. 8: . 0 which can be a reasonableassumption n modeling ORION.
d" 37
04
L.-
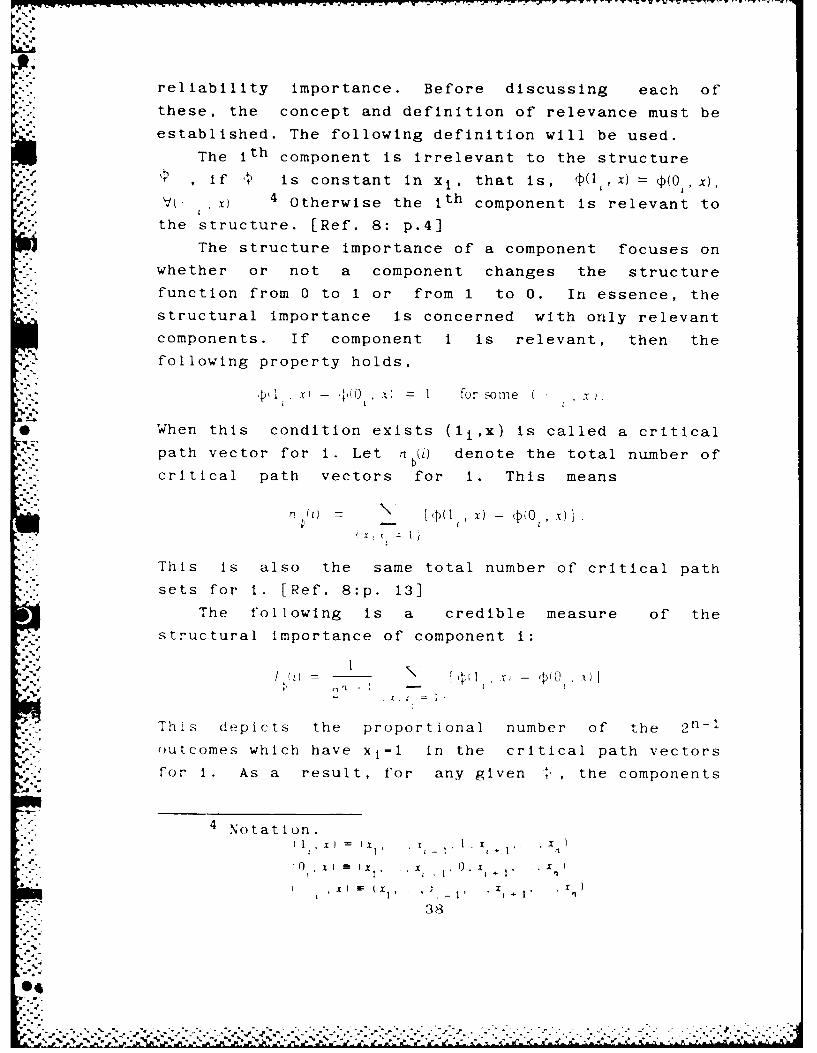
reliability importance. Before discussing each of
these, the concept and definition of relevance must be
established. The following definition will be used.
The ith component is irrelevant to the structure
if 4) is constant in x 1 , that is, (1, X) =(0 V x),V- . 4Otherwise the ith component is relevant to
the structure. [Ref. 8: p.4]
The structure importance of a component focuses onwhether or not a component changes the structure
function from 0 to 1 or from 1 to 0. In essence, the
structural importance is concerned with only relevant
components. If component I is relevant, then the
.- following property holds,.o
pl ,.J - 0 ..) = for - mo e (
* When this condition exists (li,x) is called a critical
path vector for I. Let n (i) denote the total number of
critical path vectors for 1. This means
S\ ,p(1 x) - (P(01 X)
This is also the same total number of critical path
* sets for I. [Ref. 8:p. 13]
The following is a credible measure of the
-. structural importance of component I:
This depicts the proportional number of the 2 n-1
outcomes which have xi 1 l in the critical path vectors
for I. As a result, for any given ,, the components
4 Notation.1 x M ( ,X
: ' ' - ' I 1 ' I
..............
.... .... ..) (X1. .. ... ..' ' ' |' ' l38

may be ordered (based on structural importance) by
ordering 1 i1,. / tn) [Ref. 8:p. 14]
The second type of importance is the component's
reliability importance. This takes into account the
component rellabilitles as well as the system
structure. If components can be ranked according to
-. -. their Importance to the system reliability, this
ranking information can be helpful in determining which
components should have the highest priority for
research and development. This allows managers to
expend effort and money more wisely. [Ref. 8:p. 26]
Intuitively, it would seem a component's
..:. reliability importance could be measured by observing
. the rate of change in the system's reliability as the
component's reliability changes. The reliability
importance Ir(i) of component I is given by
"':".I = E[,V 1. 1 - ,1)(0 .X) .I - E -1
This definition holds even if the components are
associated. [Ref. 8: pp. 26-27]
. °
39
I °- A -, ,. . . . . .
.° . . . . . . . . . . . . . . .- .-. .- - . . . . . . .
o**l*

t',
IV. SYSTEM RELIABILITY ANALYSIS
Using a copy of the schematics of ORION (Appendix
A) and maintaining a constant interface with the
designers, the ORION fault tree was developed (Appendix
B). Once the fault tree was established the min cut
algorithm was applied to it. This algorithm revealed 82
minimal cut sets. Of these cut sets 22 are single
* -. element sets, 29 are double element cut sets, 27 are
triple element cut sets, 2 are five element cut sets, 1
is a six element cut set and 1 is an eleven element cut
set. Once these cut sets were established, the dual
- . tree was constructed and the min paths determined.
There are 33,890,503,680 distinct paths, of which the
vast majority is due to the large number of paths
through the solar strings. In general, the paths are
-<. formed by combining the following components:
- - 2 out of 3 attitude detection components
- sun sensor
- earth sensor
- 1 out of 4 magnetometers
- 1 computer
- 4 out of 6 bubble memory cards each with
functional heater strips and thermistors
- 1 shunt regulator
- out of 2 batteries
- 14 out of 24 solar strings
- 4 solar connectors
3 out of 4 momentum wheels
- 1 out of 2 spin up thrusters with a functional
solenoid
Si out of 2 spin down thrusters with a functional
solenoid
40
04

- 1 out of 2 nutation thrusters with a functional
so l eno i d
- 1 orbit insert thruster with a functional solenoid
- 2 pyrotechnic valves
- 2 fill and drain valves
- 2 pressurant tanks
- hydrazine tank with functioning heaters and
thermistors
- Hydrazine line intact with functional heaters and
" thermistors
- 1 out of 2 antennas functioning and deployed
- 1 combiner/splitter in the TT&C.
". - 1 TT&C transceiver
S. - 1 TT&C interface hardware
- Pressurant line intact
* - 1 heater control hardware
- 1 bubble storage controller
- 1 attitude control interface
If the solar strings are considered as a single
module, the number of paths reduces to 17,280. Similar
modular reductions can take place when a subsystem
consists of k out of n like-components. All but the
attitude detection subsystem can be reduced to an
tuquivalelt single component. This reduces the final
r umnber of paths to three.
The three reduced paths were used to calculate the
r ,(tiral Imprtance of the components. The calcula-
S r .- r v al s en levels of relative importance in the
" Inp Leirar( hV f I being the most relevant):
all ,ba ,mponents except those listed below.
(A (iat Tit i i s is given in Appendix C);
hi bu tblt, mem,)ry ('ard with functioning heaters and
4. a solar strlng:
t .. 4 1
• A.

J-
5. the sun sensor, the earth sensor, a nutation,
spin up, and spin down thruster with their
functioning solenoids;
6. a battery, an antenna, a hydrazine tank heater
and a thermistor; and
" . 7. a magnetometer.
A schematic of the path sets is at Appendix C.
The reliability importance cannot be specifically
calculated since the actual hardware for several
. subsystems has not been defined. A Lotus 1-2-3
spreadsheet was developed so the designers can input
component reliabilities as the subsystems are defined.
The spreadsheet can then calculate the system's
reliability boundaries and components' reliability
importance. The data (i.e. component failure rates) for
* inclusion in the spreadsheet come from two major
sources, JPL TR 32-1505 and MILSTD 217D. The spread-
. sheet identifies the lower boundary as the most
reliable path and the upper boundary as the least
reliable cut. The number of paths to compare is
significantly reduced by using a modular approach (i.e.
using the binomial distribution to calculate the
reliability of a k out of n subsystem). Such a
reduction allows the problem to be handled by a
spreadsheet. Even in a reduced form, the model
maintains the ability to discern an impact on the
system reliability when changing, for example, only a
solar string's reliability. The spreadsheet is then
singularly important because it can readily do this
"what-if" analysis.
442
V. CONCLUSION
A. OVERALL FINDINGS
... Throughout the analysis, it became apparent t.a',
the fault tree is a "living" document. It must h,
maintained to reflect the existing design it' it Is to
aid in the design process. The fault tree can help
. explain the cause of a failure after design is complet,,
and the system is on station, but only if the fault
tree reflects the current design. Aiding in the desiri,
and determination of a failure after system employment
are strong motives to maintain the fault tree. Thi.
thesis includes sufficient background so maintenanct,
can be done to insure the longevity of the fault tree.
• A total of 82 cut sets were determined and the
components' structural importance derived. The
-. information can be used to help focus research and
' " 'budget efforts.
Lastly, a spreadsheet was developed to model the
' system's reliability boundaries as well as component
reliability importance.
B. RECOTMENDATIONS
There are five recommendations based upon the fault
tree analysis. They are:
1. as each subsystem is developed, conduct a
detailed fault tree analysis of that subsystem.
2. after a subsystem is constructed, conduct a
circuit stress anilysis of each component and the
subsystem.
3. as the design may change, maintain the fault
tree.
4. for electrical components, use the designing
engineer's reliability based diagram to help
43
.:/..* ~ ~ . . .
construct t he fau I t t ree I f a (I I a r a ms
aval abl1e, reques t one be made,
5 focus research arnI budge t a t tet-nt Io()n (in ths
-'componien ts I Is ted w It h t he hi I ghest s tructu ralI arnd
reliability Importance.
-. Due to( ORION's des Ign to b)e Ilow co st a 11d
re c on fIgu r ab Ic e* OR ION Is an e xc el Ie nt. c an d I (Ia t e f'()
uonstellation proliferation. A logical f ollIow -on -st ud(I
to this one would be a study of a constellation' S
r'eliability.
44
% .. . . . . . . . . . ., . . .. . . . . . . . . . . . . . . . .

APPENDIX A
ORION SUBSYSTF'M S(UHFMA'VI('S
The enclosed schernat ics were, use-d (q II 11f.I~p
C au I t t ree for OR IO N.
45
A A
c I,
-.. ...
.< -E 8
oe0 e
E E
- o _ _ __-
E
.".-
oC
<E
46E

A-A
0
I A 0
Q, 0.
0 0'LA
</
* /7

V
be
0
* ;.* 0.
- ~
'p. '.- 0 5V. 0. ~J Q
E ~- -
I-
*w*. C
0
c -
E
.1 __
f -,
* ~ '-,~j - ,A-~--~. - - --
b~
N -~
-~
-9- -:.~ -
2:'N
*ijp
V ~ . - . . . .

.1.N -." i-- _ -
2
= i~ i " ,",
r -z\ \ _
a 0
00- --- I " r - -TYT
I _> o0
I .- 0-c_ 5.~
// / "
OK a
....: ..... .: .: .-. .. :. . .. .. . .-._. ...._. .C.:." " . - -° -'. . . , ." ." " . ." t ,, /', ? ,' .',., ,,' 0

-C-.o2 E
0- CL
a-A
a-'a
C-L
E-C
- I--
o0

02
0)0
0~H 0-
00 0
L)
04

F- 0
00)
0- 0
-0 E
040
81 -,A A :.M-

I-L
00
ZugJ
ML0 3

6j7- ---
APPENDIX B
ORION FAULT TREES
The large fault tree developed is broken into small
sections and is included in this Appendix.
55

Sate IIitep Failure
FFailure
TD
Wh iFaii Y36, Y37
Figure B 1 Top of Fault Tree

ControlFailure
NoBubbe An07 Outputute
FaFiluur
Figuree FailCorolFutTeI 57
83 o ke f
Y4, Y5,.Y
Failure.

*045
,.L .
c U-
0 LL.
C<C
UU
t.A UU-
'I..
L 0
-iC
<7
4.D
9-L'ISL
.5..
SI..-
V0
-. 5.C-
s~co
I -i
1. au-

G
ThrusterFailure
Thruster ElectricalValve InterfaceFailure Failure
2 -CD
H No PoThrust IntrfceA
* *,*Failure
Y42
/DeadThruster F
*.p. ~Y38, Y39 Y0 4
Figure B.5 Thruster Fault Tree
04-.Pi
9-l
eo Cj owl0
Q~I-) L(
wm,- i_ .4
> M
7- (13
U- >
UL-
LLL
- 4-
LA-.
L-
C-L

cU--
~ V
< -.
N 00

00L
C-CL
LA Q)
I- 7 c
00
- / U
L~LL
>-LA-
00 c 0
Lin~

APPENDIX C
ORION PATH AND CUT SETS
, Use of the mnn cut algorithm produced 82 minimal
1 'ut sets. Their basic component designation a 1!
d escription are listed below:
Single Element Cut Sets
Yl Attitude control interface electronics
Y3 Data storage controller
Y13 Heater control hardware
Y14 Computer
Y15 Shunt regulator
Y42 Propulsion interface electronics
* Y43 Hydrazine line
Y44 Hydrazine line heater
Y45 Hydrazine line thermistor
Y4b Pressurant line
Y47 Hydrazine tank
Y52 and Y53 Fill and drain valve
Y54 and Y55 Pressurant tank
Y56 and Y57 Pyrotechnic valve
Y66 Orbit thruster
Y67 Orbit thruster heater
Y74 TT&C combiner splitter
Y75 TT&C transceiver hardware
Y76 TT&C interface hardware
Double Element Cut Sets
Y2, Y31 Sun sensor and earth sensor
Y16, Y17 Both batteries
Y23, Y24 Two solar array connectors
Y36, Y37 Two momentum wheels
Y38, Y39 Y38, Y41 Any pair of' thruisttrs
64
~~.-*~-.-.-* ea** * **. *.-,--

Y3 1) ,Y40 Y40, Y41 (spin up, spin down ()r
Y58 Y50 Y58, Y61 nutation) disabled by a
SY59, Y60 YbO, Y6 combination of the
b2, Y63 Y62, Y65 thruster or its heater
Yb3 , Y04 Y64 , 1"65 failing and a simi lar
failure on the couple d
thrus ter.
Y48, Y50 Y48, Y51 Any combination of the
Y49, Y50 Y49, Y51 heaters and thermistors
on the hydrazine tank.
SY68, Y71 Y68, Y72 Any combination of an
Y68, Y73 Y69, Y71 antenna, an antenna
Y69, Y72 Y69, Y73 connector, or antenna
Y70, Y71 Y70, Y72 deployment with the
Y70, Y73 similar events of the
other antenna.
Triple Element Cut Sets
All of these cut sets are any combination of a
bubble memory card, its heater or its thermistor with
the similar events on any other two bubble memory
cards.
Y4, Y5, Y6 Y4, Y5, Y9 Y4, Y5, Y12
Y4, Y8, Y6 Y4, Y8, Y9 Y4, Y8, Y12
Y4, Y11, Y6 Y4, Yll, Y9 Y4, Yll, Y12
Y7, Y5, Y6 Y7, Y5, Y9 Y7, Y5, Y12-7, Y8, Yb7 , , Y8, Y9 Y7, Y8, Y12
Y7 , Yll, Y6 Y7, Yll, Y9 Y7 Y11, Y12
Y10, Y5, Y6 Y1O, Y5, Y9 Yi0, Y5, Y12
.10YI , Y8, Y6 YIO, IYS, Y9 Yl1 , YS, Y12
-10, Yi1 , Y6 Y10, Yl1 , Y9 10, 11 , Y12
65
'2

Five Element Cut Sets
Y2, Y32, Y33, Y34, Y35 The sun sensor and all
four magnetometers
Y31, Y32, Y33, Y34, Y35 The earth sensor and all
four magnetometers
Six Element Cut Set
Y18, Y19, Y20, Y21, Y22, Y23 One solar array
and any five solar strings from the
remaining 18
Eleven Element Cut Set
Y18, Y19, Y20, Y21, Y22, Y25, Y26, Y27, Y28, Y29, Y30
* Any combination of ii solar strings from the 24
* -. The following components were determined to have
the highest structural importance.
Computer- Shunt regulator
- Solar array connectors
- Heater control hardware
- Hydrazine tank
- Hydrazine line
- Hydrazine line heater
- Hydrazine line thermistor
a - Pressurant tanks
- Pressurant line
- Fill and drain valves
- Propulsion interface electronics
- Orbit thruster
- Orbit thruster heater
- Attitude control interface
- Data storage controller
66
............................ ....... _ ........ . o°: °- ,, o, ,]

- TT&;C combiner splitter
- TT&C transceiver hardware
- TT&C interface hardware
67

CLC
01
-oC
LwL
C3)C
00 EH
6 P,
. . . . '- ,m ._ -.. ; _ = -.. .- . - ' - - , ; - - . . . 'T " . . 2 " £ - " " - ° " " "
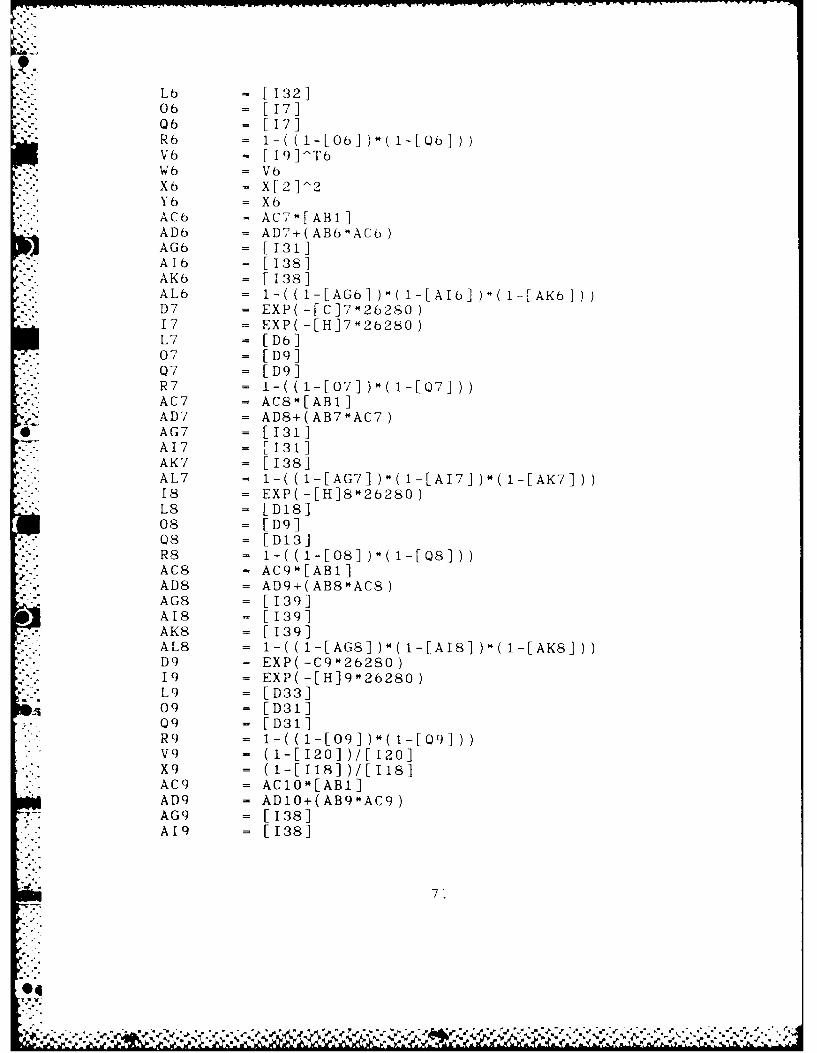
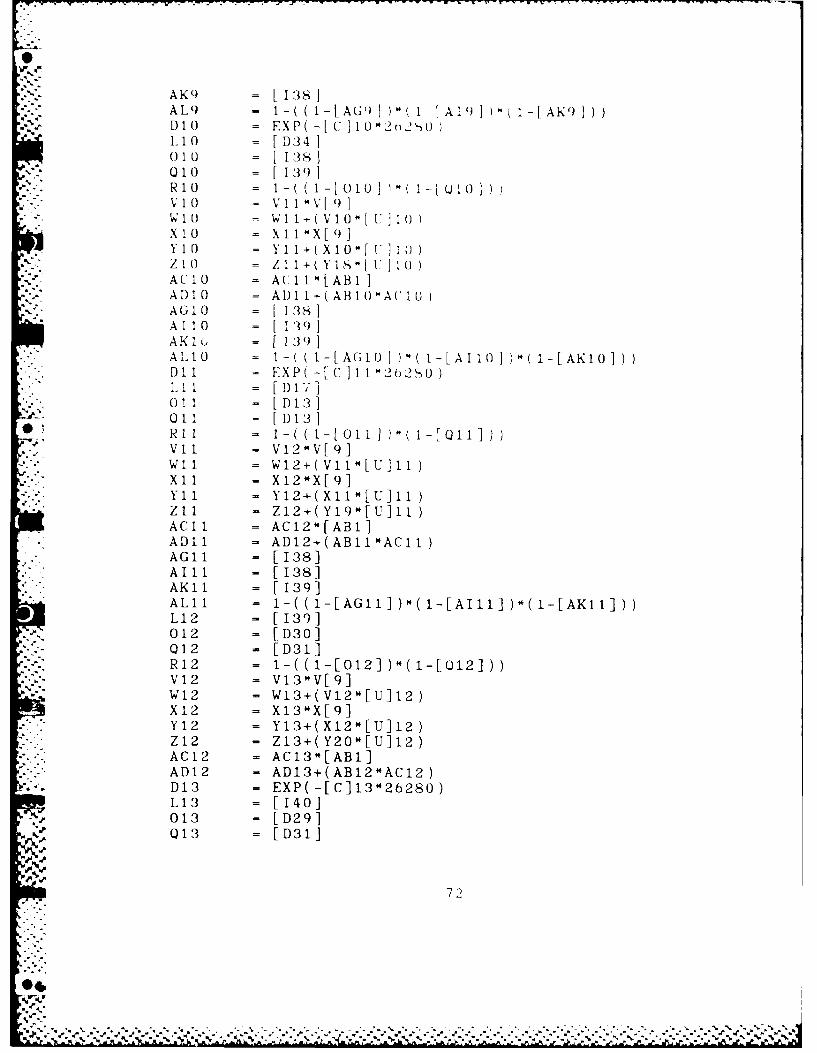
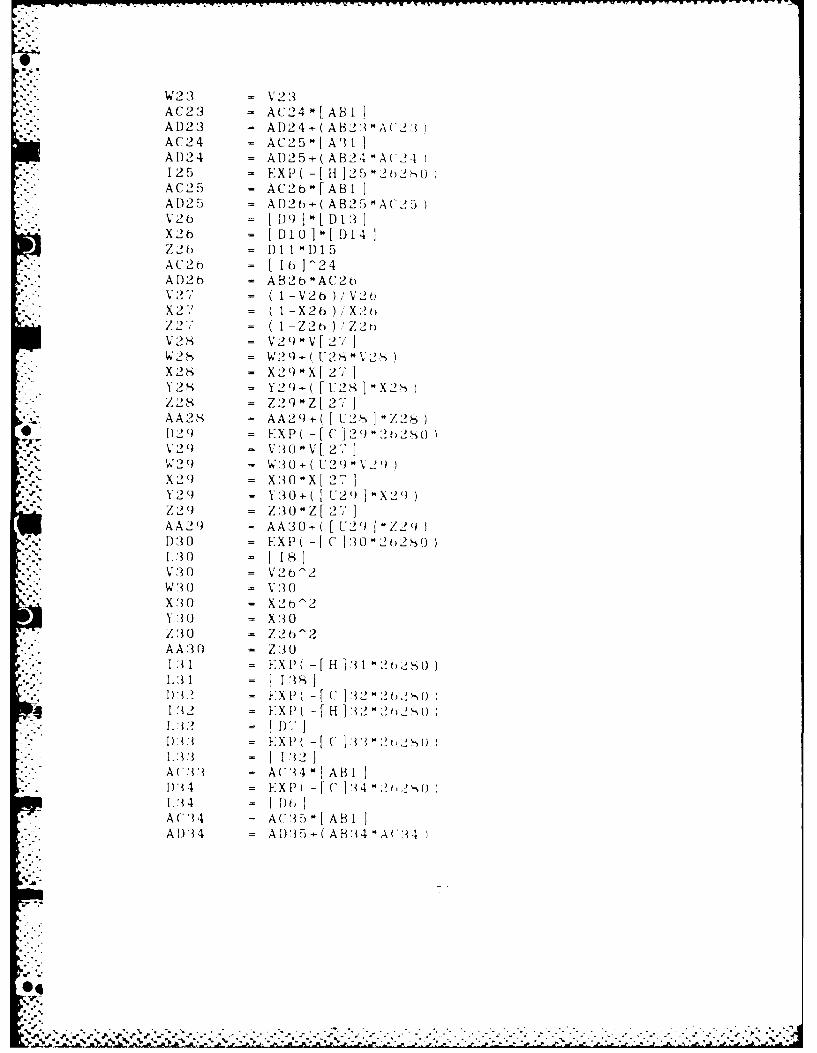
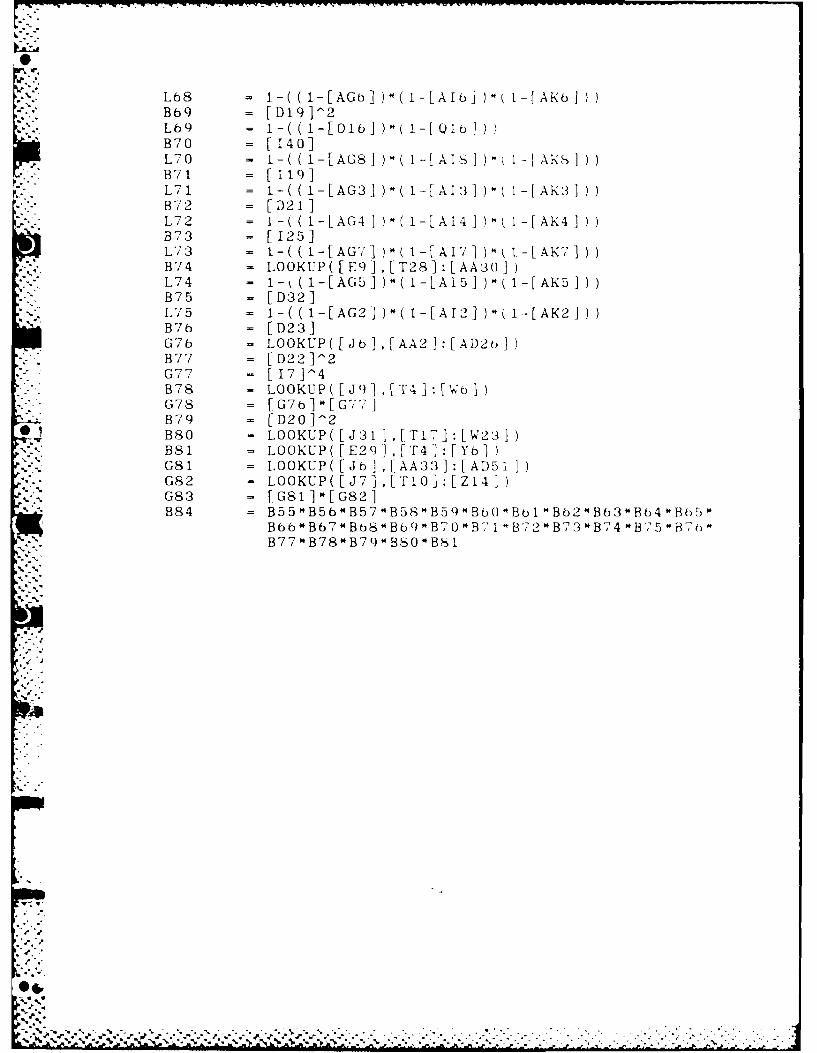
APPENDIX D
LOTUS SPREADSHEET LISTING
The enclosed listing of a Lotus 1-2-3 spreadsh(,.t
was converted to a MathPlan 3.0 format for inclusion in
this Appendix. It contains the elements necessary to (10
a "what-if" analysis. As the subsystems are designed
and constructed, their reliabilities can be placed in
the spreadsheet to observe the subsystem's impact on
the system's reliability.
04
7 6-
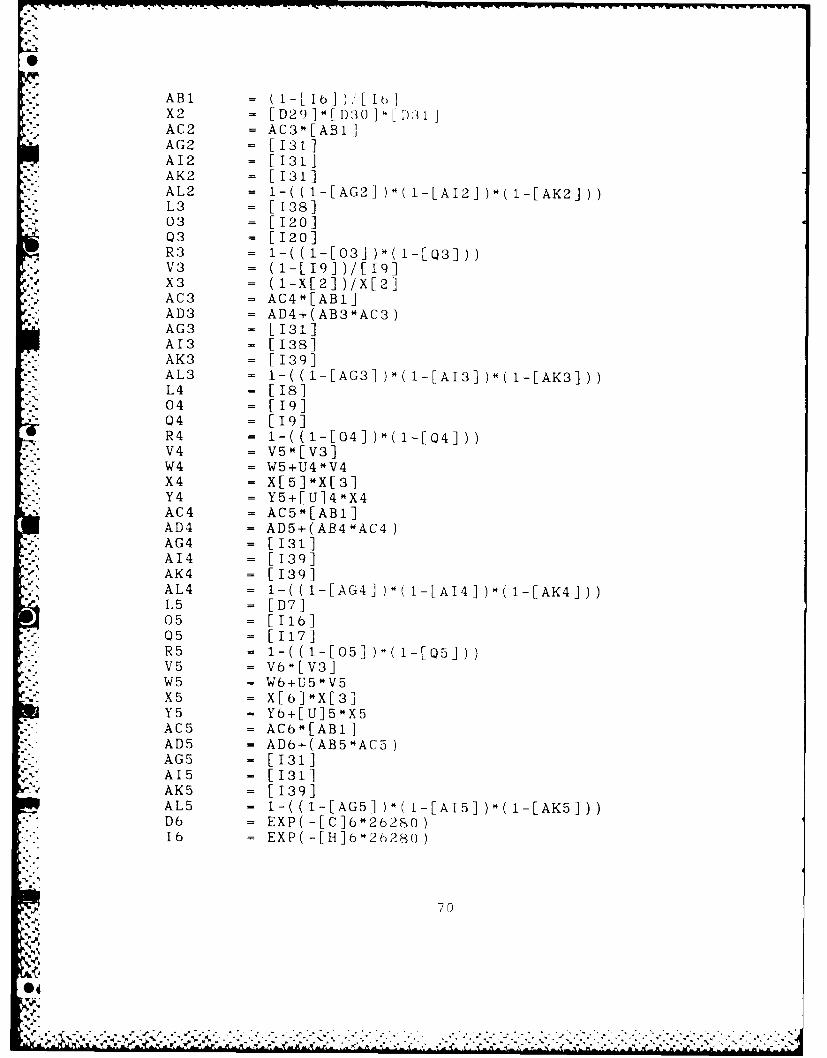
ABi = (1-[ 16.] )[IX2 - [D29 ~D30 ]DAi~iIAC2 = AC3-[AB1 IAG2 = [131]A12 = [13 1AK2 = [131]AL2 = 1-( ( -[AG2] V'( -[A1])1*( -[AK2])L3 = [138103 = [120]Q3 = [120]R3 = - l [0 1 " I [ 3 )V3 = (1-[19])/E[1]X3 = (1-X[2])/X[2]AC3 = AC4-[AB1]AD3 = AD4+(AB34AC3)AG3 = [131]A13 = [138]AK3 = [139]AL3 = 1-( ( -[AG3] )'*( -[AI3] )-( -[AK3])
-,L4 = [IS]04 = [19]Q4 = [19]R4 = 1-1( 1-[04] )-( -[Q4])V4 = V5*"[V3]W4 - W5+U4*V4X4 = X[5]-X[3]Y4 = Y5+[U]4*X4AC4 = AG5-[ABl]AD4 = AD5+(AB4mAC4)AG4 = [131]A14 = [139]AK4 = [139]AL4 = 1-( ( -[AG4] )"( -[A14] )-( -[AK4])L5 = [D7]05 = [1161Q 5 = [1171R5 = 1 ( l [ 5 )* l [ 5 )V5 = V6-[V3]W5 = Wb+U5*V5X5 = X[6]*X[3]Y5 = Y6+[U]5OX5AC5 = ACb-[AB1]ADS = AD6+(AB50AC5)AG5 - [131]A15 - [131]AK5 = [139]AL5 - 1-( ( -[AG5] *( 1-[AI5] )*(I-[AK5])D6 = EXP(-[C]6-26280)16 = EXP(-~[H]6*26280)
70
*~~ ~ . .. . . . .* .*
Lb - 132106 = [17]Q6 = 17]R6 = l-( (1-L[b])*( i-[0bj)
Wb = V6Xb = X[2]-2Yb = X6ACb =. AC7 AB IADb = AD7+(AB6 OACbAGb = [13 1A16 = [138]AK6 = E[1381ALb = 1-( (l-[AGb] )-(l-[Ar1] )-(l-[AKbj)
*D7 = EXP(-[C]7'*262S0)17 = EXP(-[H]702b280)L7 = [D6107 = [D91Q7 = [D9]R7 =
AC7 = ACS-EAB1]AD7 = AD8+(AB7-AC7)
*AG7 = [131]A17 = [131]AK7 = [138]
18 = EXP(-[H]8'*2628O)LS = [D18]08 = [D9]Q8 = [D131RS =1-(1-0])(-o]
ACS = AC9[AB1] CSADS = AD9+(AB8SC8AG8 = [139]A18 = [139]AKS = [139]AL8 =1((1-G8)(1-A8)(1-K]
D9 = EXP(-C902628O)19 = EXP(-[H]902628O)L9 = [D33]09 = [D31]Q 9 = [D31i]
R9 = 1-l[12o])[12o] ])V 9 = (1-[120])/[121]
*AC9 = AClO%[ABl]AD9 = AD10+(AB9*AG9)AG9 = [138]A19 = [138]
71
04
-.7.' dW~ .>&\
AK9) =138]
*AL9 - 1-( ((1-[LAG9 1 -Al I I AKO )D 10 = F.XP( [C]IO102tn2SULlO = [D34]()10( = [138]Q010 1,39])
R10 = i((ii0101)*(1-[QI0]))V 1(0 V 1< 1~ v:0
xio =X11*X[t9]
Y 1 = Y 11±( x 10*[ u 10)1 0 = 1 ( iS :1
AtlO = ACI11I[AB1]AD10 = AM11±(AB 10 "Ac'lAGlO = [138]All 0 = [ 19AR'1, = [ 1.39)Al10 = 1-( 1-[AGiGi l)*( -[AIlO ] *"( -[AKI)D11 = KXP([C 111--262,50)L Ii = [ 1) 17,
0)1 =[D13]
011 = (D13]
VII - V12-V[9]
Xli = X12+(X i"[9]l
yi 1 Y12+(X11*[Ui)Zi I Z12+(Y19-[U]11)AClI = AC12*[AB1]AD11 = AD12+(ABl11ACll)AG11 - [ 138]A I 1 1[ E138]AKil1 = [ 139]
L12 = [139]012 = [D30]012 = [D31]R12 = 1-((1-[012])4(1-[Ql2]))V12 = V 13 -V [ 9W12 = Wl3+(Vl2"[U]l2)X12 - X13*X[g]Y12 = Y13+(X12*[LT]12)Z12 - Z13+(Y200[U]12)AC12 = AC13*[AB1]AD12 - AD13+(AB12*AC12)D13 - EXP(-[C]13'*2628O)L13 = [140]013 = [D291
Qrz 13 = [D31]
72
04P

R13 = 1-( (-[013 )-(1-[013]V13 = V14 V[9]W13 = W14+( V13*[ U]13X13 = X14*X[9]Y13 = Y14+( X13-[ U1:1Z13 = Z14+(Y21[Uj13)AC13 = AC14-[AB1]AD13 = AD14+(AB13*ACi:3)D14 = EXP(-[C]14* 2 b28L14 = [I19]014 = [D30]Q14 = [D30]R14 = 1-((1-[014] )*(i-[U14] )V14 = [120]^4
. W14 = V14*U14X14 = [1181V]4Y14 = [I18]'4Z14 = [17]^4AC14 = AC15-[AB1]AD14 = AD15+(AB14"AC14)DI5 = EXP(-[C]15-2b2S0)L15 = [D211
* 015 = [D29]015 = [D30]
-"RI5 1 -( (i-[015] )( 1-[015 ])
AC15 = AC16-[AB1]AD15 = AD16+(AB15-AC15)AG15 = [116]AI15 = LOOKUPt([GiS]-[JISI+I) ,[Y10]:[TI4])
- ALl5 = 1-( ( I-[AG15] )*( I-[AI11]))b-16 EXP(-[H]160262sO)
L16 = [1251016 = [D29]016 - [D29]Rb = 1-((1-[O16,I)"(i-[Q1 ]))V16 = (1-[Xi6])/[Xib]X16 = [ I38]"[ 139 9[ 1311ACI = AC1T-[AB1IAD16 = AD17+(AB16*AC16)AG1 = [117]A116 = LOOKUP( ( [G,]- Pl]+ ),[Y0]:[T14]AL1 = -((1-[AII )(1-[A(IG ))
:1-...DI7? - EXP( -[C]17,w-:2.o2 0)
117 - EXP( -[H]17-2 2S )LI1 = [D19]V 17 = VI8 V[ 16]W17 = WI8+(U17"V17)Y17 - (1-[11])/[17]
- * ACI7 = ACIS*[AB1]
~73
V -,
.e .40 ,-'.,'-v '- ' - -' ",.- - - : - • --- .-- - - e -- - . - . . , .- .-,-, ..,,-,:

AD1 7 - AD18+(AB17*ACI7)D1 - EXP(-[C]18*2b2,,O}118 = EXP(-[H]18-2b280)LIS = [D231Vis = V19-V[io]W18 = W19+( UISOVIS)Y18 =YGY 7ACiS = AC19-~[AB11ADIS = AD19+(ABIS*AC18)D1I ) = EXP (- [C119 -2 62,-,119 = EXP(-[H]19-262SO)L19) = [D321v i9 = V20-V[1bJW19 = W20+(U19*VI9)'fiG = Y20-Y[17]AC19 = AC2O*I[AB1IAD19 = AD20+(AB19*ACI))D20 = EX P(-C 2 0 -2 2SO120 = EXP(-[H]20-262SO)1,20 = [D20]V20 = V21-V[16]W20 = W21+(U20-V20)J-20 = Y21-Y[17]A (2 0 = AC2 I*AB IAD20 - AD21±(AB20*AC20)
*A(G20 = LOOKUP([Jb],[AA33]:[AD51,A120 = -ooKup ( [,j i] , [T-r I t:[Z 14 1)AL 20 = I -( ( -[A12o )-( 1-[AG20 I)AN2( - [ B84 IA 1'2(0 = NI I N(L30 :L-,5)D)2 1 - FXP( -[ c121 *2o2so)V 21 - V22-V[ 16]W2 1 = W22-t(U21"V21IY21 = Y22-Y[ 17 IAC2 1 = AC22"[AB1}AD21 = AD)22+(AB21*AC21IA(;2I = LOOKUP( J6 I AA2 AlD2t)A1.2 1 = [AG~21AN21 - A5E51) 22 = PX( 11 C 12 2 W~2 21-
= W2:3-V( It)2v
L.2 - [ 17 '~A(;22 - A C2:3 -1A R IA AD22 - A D23 ( A B22 A(J2AN22 = [C'55]
V2:~ = IXt I()
04~l
W23 = V 23AC23 = AC24*[ABI]AD23 = AD24-( AB2:A(2: 1AC24 = AC25"[A'11A D24 = AD25+(AB24A('24125 = I-XP( -[ H ]25-2t) 2 0AC25 = AC2bo[ABI]AD25 = AD2 + (AB25"A(25)V2b ) Dl 1:X2b = [DIOJ]'[Dl4Z2b = Dll"D15
.'2A)at) = [10 ]-24AD2b = AB2b*AC2OV2" (1 -V2b )/V2tX27 = (I-X2b )X2)Z27 = (l-Z2t)'Z2t)v28 = V29-V[27i]W,2, 1-= W2-)+( U 5 '2X2s = X2()-X 2VY2.S = Y2 ) ( U2 S]X2SZ28 = Z29-Z[ 2v,AA2S = AA29+( [ U2,JI]Z2S)D)2( = EXP( -[( 129- 262-0V2') = V:lO V[ 2. 7]V2) W 0i U +(U2) \1,-1 )X 2 = X310 X[2-1Y29 = Y3 O+( U2 2 X2)Z29 = Z:30Z ()-z2 ,AA29 = AA30-( [U21 I"Z29D30 = EXP( -j C '30 2b2,0-"I.30 = [181V 30 = V20^2W ( = V: 0X:(O = X2b-'2Y:30 = X:3Oz30 = Z26^2AA30 = Z301 3l = FXP( -[ H ]Il '2 2S0
i)32 - FX P ( ] ' " , t 2 % ). 132 - LXP( -[H H]:2)22s
I. 2 = E P)7 H
.Dii: = HXP( - ( 1 l::':>22 (jI.* = [ I:22
A: UA": = A("14w AB II•)1i4 = EXP( - C 1:14 A 2 2 I).:14 = [1) I)
A("4 = A(:-35 [ AB IAI)"4 = ADA5( ABi4"A(: 4
,.,~~~~~~~~~ ~~.............. . .,........................ ... .....-. ,...,....

A A I- = ADIt)1 AB!
A (,-':= A( T' A liSA)t) A D:"AC3 A [(-0-4 A]A ': 1'= A{) AR r
A Y A AB I
A 1 ) A )i A A)-- ) F \ 1 AI I A :A{CA ) A(40" ABI1
A 1), ) 1= A IT) A ,) "A-. . I140 = FXt { H 4"
1.40 = A1I.] [ :o ]AU1- A({41 ARHA4 (} = A1) 4 1 A .4 "A 41,41 = [ 140A{C4 1 = A{'4I2 A i'
r,-A[}41( ABA 1'd+ AB.1 "4 4
LAD1 = [ I) A () iAU4 )2 = A('4 "I ARi:AIJ4 2 = AI)'-. A! 14:'- 4,!
..... 1,4:3 = I I - A ! 1 (, , .i A {;A(4'1 = A('44" a I I
A 1)43 = A 44 AB4A iA 41A44 =A4 f R
A('44 - A{45" ABI IA D44 = AI)45 AB44 4 A(
1.45 = 1- ( 1 5-[ 1- .A('45 = AC4 0,,[ AB I
--. A[}45 = AD)4O+( AB4-) A?)2- B4o = I.{}()K P(Ij ,I I ,[i } Y '- ; ]
1.4o = I 125 ]A('4t = A('4"*[ ABI ]A D4 AIAt= 4'A+l ( AB4t)"AA 4t,(4 = [h4r] B4,, ]
• . -1 . 4- [ 1 ) 1 9 1A(4, = AU4.W'I ABIAI)4" - AD.A',+(AB4 'A( 4"_5 B4 - 1 1I7lA C{4,1 = A (4') A B I
).4AI}41 = A)4H)+( AB4 "A{.11
* %" ... f

p;'4
-,~
A,, A ,;
A AI AR 1A
lH 4
A' ,A< -- A , I -\ L
* ).t -- ,
- :2 2)!,
It I I
SI
,,# ' r) { 'lA ] * (
ri A( -1A ] 1 -[AK9 ])
.7' . ' < - (Th ' " l- (jo ] ) )
to -I , FAA 3
S ,-,u 'Ii
, I -! A ( ) " - 1 lU ) ] ) );)) I I
to I I A I I()i I I AK 11 1
,, 1 ~ ~ ~ - (. " -I)] '(I [A 9. ,,') -(i I, , 1 [ o )
,tot,,X
,- A I ") * - A ) ] I A)( 1Ii(
/ .' , .* . t' . ' " ) : W 4 1
L68 = 1-( ( -[AGb] )-( -[AT6J ) -f -Akb I))Bb9 = [D19]^2Lb9 = 1 -( 1 -[L b] I i-Q IB70 = [140]L-70 = - -AS ~ -L~I) - K )B71 = [119]L71 = i-( ( -[AG3] )-( 1-AI:3] )-( -[AK'3 I)B72 = [D21]L72 = 1-( ( -[AG4 I -( -[A1I)-( I-[AK4 I))B73 = [125]L73 - i-( ( -LAG7 )*( I-[A171 )- l- A1K7 IB74 - LOOKL'P([E9],[T28]:[AA301)L74 = 1-k (1-[AG5] )--( -LA!s )"-( -[AK5])B75 = [D32]L75 - i-( ( -[AG2] )-( -[A1])-( -[AK2])B76 = [D23]G7b = LOOKUP([JbJ,[AA2]:[AD2o)B77 = [D22]"2G-77 = [171^4B78 = LOOKUP ( [J I 9 J T4 3: [WbjG78 = [G7b]-[G77]B79 = [D201^2
.7B80 = LOOKUP([J3Ij,[T17]:[W23])B81 = LOOKUP([E2'9J,[T41:[Yb])G81 = LOOKUP([Jb},[AA33]:[AI)5il)G82 = LOOKUP([J7],[T1O]:[Z141)G83 = [G81]'-iG82]B84 = B55*B5bwB57*B58"B59),Bbt)*Bb1 *B62"Bb36b4*Btb
B66*B67*Bb8*Bb9*B70*B71 B72*B7'3*B744B?5wBtwB 77*B 78wB 79B S~oB 1
LIST OF RIII-RI-vF:S
"i s M t' 1 i -' , t. I 1 1 C l t , 0. 1 1 ,
m(,aIiIrn I Her,-,te-.ty, System RilablIV Ara.s>:
.- iiridv ,t iris, bV P. V. Barl)w. ,uly 1(0-K .
< 1 im , H., PR i l I I t y Aialy -,t" Pia.->, ,I ssxin I, Ph. 1). Tht'sls , Naval Po)tgraoiate -lo,,
oo- t t,,,-t.y (a 1I '()rn ia, De cembe r 1 9 4
IAM( r ea Train I ng Cecnt er , A -'ail t Tre "aniua
0 bhV T. W. 1.mg, I e( ember 1970.
f()i I tot Naval Research, Ar Ingt fmrn, VI r'in ria,
T iI r'r duct ()n to() Fau l t Free AnalysIs, by R. F.
Har 1 (,w andi P). (ha t t terj ee , I)ec mber 1 W,"I .
. r V: . ,.1D. , arnd arshal I A .W. , "Sys-tm .St r,u(t u ,
;ril th- FxI 5. n(. e ()f" a System . Fe, ''Per ,,ruo ,ot 'i;-
. t pp. 4 5 -4 23. 1W)4
;Iii 1 1 in, B. S. and Slngh, (. , "On Fail t Tl ees a:
0 hen. Re 1I labl I It y Fvaluat 1,)tn Methoods "t 11 'o N , ,. .
--
*n 1",, s and R 1 1 l a!) il (+ , v . 11), pp[. 0) -( . I) K I
m. Han'Io)w, P . F., arnti |Proo)sehan, F. Stat) 1st io;! '.}; ','
,, R" I(' !I ab 1 1 t and I I 11", "Tes* in !' Pr', ';ha ' it i V M,, . ..
od., '(. ,TF ,' Ho I ' , I ".'
* .. . ...

INITIAL DISTRIBUTION LIST
Dctferise Technical Information Center
Cameron Stat ion
-F.->Alexandria, Virginia 22304-6145
2. Liary, Code 01422
* - Naval Postgraduate School
Monterey, Callifornia 93943-5002
S upe r i ni t e n den t.
Attn: Prof. J. D. Esary, Code 55Ey
Naval Postgraduate School
* Monterey, California 93943-5000
4. Prof. Allen E. Fuhs (Emeritus)
Box 222040
Carmel, California 93922
5 MAJ Trenton G. Keeble23~491 Earl Dr.
Santa Clara, California 95051
b 0 SuperIn t endent
Attn: Marty Mosier, Code 72
N aval Postgraduate School
Mo)nterey, California 93943-5000
U >ind Co)rporation
Attn: Herb Shukiar
1 ','0O0 Ma in St.
San ta Mon ic a, C a I i fo r n i a 9 04 0 6 - 2 1 :18
Ed Seriasack\ aval Pfesearch Labioratory , Code S'220)
:) 55 Over loo)k Ave.. S.W.WahI ngt on , 1). C . 2 0:1',
s0

a %-
-'" Tom WhitmeyerNaval Research Labovatory, Code S223
. -4555 Overlook Ave., S.W.
Washin ton ,I). C. 2037:5
04
i S•
.r

}. ,.
S.4
F/LmE
pE c
loot, -of- ... - . ..- .- .' .
Top Related