


Languages
Pages
Legal

Supplementary Appendix to:
“Uncertainty Shocks and the Cross-Border Funding of Banks:
Unmasking Heterogeneity”
Agustın Benetrix∗
Trinity College Dublin
Michael Curran†
Villanova University
The structure of this appendix is as follows. We report data sources and detail data con-struction in Section S1. Section S2 presents tabular and graphical evidence of the dynamicbehavior of cross-border bank flows. We plot individual time-series for each country’s ag-gregate cross-border liabilities as well as cross-border funding vis-a-vis banks and vis-a-visnon-banks. This Section also illustrates cumulative distribution functions for average growthrates, standard deviations, and persistence of growth rates of cross-border liabilities. We alsoinclude tables of moments for funding growth. Here we plot dispersion as measured by thedifferent quantiles over countries at each point in time and averages against a measure ofturbulence, the correlation of each country’s international rank across the current and priorperiod. In Section S3, similarly, we report tabular and graphical evidence of the dynamicbehavior of the uncertainty measures. We show a correlation matrix between our uncertaintymeasures and we plot cumultative distribution functions for the persistence of uncertaintyas measured by the (i) auto-regressive coefficient and (ii) half-life coefficient. This sectiongraphs dispersion and turbulence of uncertainty measures and reports a table of moments foruncertainty measures. Section S4 presents bivariate and multivariate regression results forthe one period lag of uncertainty variables.
∗Email: [email protected]; Phone: (+353) 1-896-2259Address: Economics Dept., Trinity College Dublin, Dublin 2, Ireland.
†Email: [email protected]; Phone: (+1) 610-519-8867Address: Economics Dept., Villanova School of Business, Villanova University, 800 E Lancaster Ave, PA 19085, USA.
1

2 BENETRIX AND CURRAN
S1 Data Sources and Construction
S1.1 Data Sources
To construct real GDP growth, we obtain data on GDP, exchange rates, GDP deflators, andCPI mostly from the IMF’s IFS.1 We regress GDP deflators on CPI to extend GDP deflatorseries in some instances and use GDP deflators, along with bilateral exchange rates withrespect to the US dollar, to convert nominal GDP to real GDP in billions of US dollars. Formost countries we use seasonally unadjusted data and subsequently seasonally adjust withX12-ARIMA. Data on stock market capitalization is sourced from Bloomberg.2 Inflation ratesare based on CPI from Bloomberg. We use quarter-on-quarter growth in our analysis for realGDP growth, stock market growth, and the inflation rate. Monetary policy rates are sourcedfrom Bloomberg, from BIS central bank policy rates, and by our calculations from nationalcentral bank websites. Data on exchange rates come from the IMF IFS, where we use nominaleffective exchange rate growth in our analysis. Data on exchange rates come from the IMFIFS.3 We investigate effective exchange rates in robustness checks. Credit growth is bankcredit growth to the private non-financial sector and is sourced from BIS. We take externaldebt-to-GDP as outstanding debt securities from the BIS as a percentage of GDP. We restrictour sample to the core group of 24 countries over the period 2003Q1-2018Q4 to achieve abalanced sample. Table S1 lists these core countries.
Table S1: Stock Market Indexes For 24 Core Countries
Reporter BBG Index Reporter BBG Index Reporter BBG Index
Australia AS52 France CAC Portugal BVLXAustria ATX Germany DAX Singapore STIBelgium BELPRC India SENSEX Spain IBEXBrazil IBOV Ireland ISEQ Sweden OMXCanada SPTSX Italy ITLMS Switzerland SPIChile IGPA Japan NKY Turkey XU100Denmark KAX Netherlands AEX UK UKXFinland HEX Norway OSEBX USA SPX
Notes: We source data from Bloomberg. We use Bloomberg’s OVM function to computeimplied volatility at the money for one- and three-month maturities and take the last valuein each quarter. We use quarterly frequency US Dollar nominal price index data to buildmeasures of realized volatility. The full BIS set of 48 reporting countries is the following:Australia, Austria, Bahamas, Bahrain, Belgium, Bermuda, Brazil, Canada, Cayman Islands,Chile, China, Curacao, Cyprus, Denmark, Finland, France, Germany, Greece, Guernsey,Hong Kong, India, Indonesia, Ireland, Isle of Man, Italy, Japan, Jersey, Luxembourg, Macao,Malaysia, Mexico, Netherlands, Norway, Panama, Philippines, Portugal, Russia, Singapore,South Africa, South Korea, Spain, Sweden, Switzerland, Taiwan, Turkey, UK, and USA.
1In a few cases we source data from Bloomberg, OECD, St. Louis FRED, Eurostat, and national centralbank websites.
2We extend the sample by interpolating annual data from the World Bank’s World Development Indicators.3An increase in the exchange rate against the US dollar corresponds to a a weakening or depreciation of
the local currency.

UNCERTAINTY SHOCKS AND THE CROSS-BORDER FUNDING OF BANKS 3
S1.2 Construction
Real GDP
Nominal GDP in domestic currency (GDPDC) is converted to real GDP in billions of USdollars (RGDPUSD), where b = 2010Q3 is the base period, using nominal exchange rate (E)and price level (P ) through the equation
RGDPUSDt =
GDPDCt ×Et
Pt
Pb
Et
Eb
Monetary Policy Target Rates
Australia: RBA cash rate target [RBATCTR].
Brazil : Selic target rate [BZSTSETA].
Canada: Bank of Canada overnight lending rate [CABROVER].
Chile: monetary policy rate (TPM): [CHOVCHOV].
Denmark : repurchase rate repo [DERE].
Euro area: ECB main refinancing operation announcement rate [EURR002W].
India: Reserve Bank of India repurchase effective cut off rate [INRPYLD].
Japan: Bank of Japan unsecured overnight call rate [MUTKCALM].
Norway : deposit rate Norges bank announcement rate [NOBRDEPA].
Singapore: overnight rate: annualized rate of interest bank charges for lending or pay forborrowing a currency [SDDR1T].
Sweden: repo rate (decision rate) [SWRRATEI].
Switzerland : national bank Libor target [SZLTTR].
Turkey : 1 week repo announcement [TUBR1WRA].
United Kingdom: Bank of England official bank rate [UKBRBASE].
United States: US Fed target rate midpoint and US Fed Funds effective rate (source: BIS).

4 BENETRIX AND CURRAN
S2 Dynamic Behavior of Cross-Border Liabilities
Figure S1: Cross-border liabilities
4.5
55.
56
6.5
2002q3 2006q3 2010q3 2014q3 2018q3
Australia
4.5
55.
56
6.5
2002q3 2006q3 2010q3 2014q3 2018q3
Austria
4.5
55.
56
2002q3 2006q3 2010q3 2014q3 2018q3
Belgium4.
55
5.5
6
2002q3 2006q3 2010q3 2014q3 2018q3
Brazil
4.5
55.
56
6.5
2002q3 2006q3 2010q3 2014q3 2018q3
Canada
44.
55
5.5
6
2002q3 2006q3 2010q3 2014q3 2018q3
Chile
Notes: Total cross-border liabilities reported to BIS by country. Log-level of index=100 for 2002Q1.

UNCERTAINTY SHOCKS AND THE CROSS-BORDER FUNDING OF BANKS 5
Figure S2: Cross-border liabilities
4.5
55.
56
2002q3 2006q3 2010q3 2014q3 2018q3
Denmark
45
67
8
2002q3 2006q3 2010q3 2014q3 2018q3
Finland4.
55
5.5
66.
5
2002q3 2006q3 2010q3 2014q3 2018q3
France
4.6
4.8
55.
25.
4
2002q3 2006q3 2010q3 2014q3 2018q3
Germany
4.5
55.
56
6.5
2002q3 2006q3 2010q3 2014q3 2018q3
India
4.5
55.
56
6.5
2002q3 2006q3 2010q3 2014q3 2018q3
Ireland
Notes: Total cross-border liabilities reported to BIS by country. Log-level of index=100 for 2002Q1.

6 BENETRIX AND CURRAN
Figure S3: Cross-border liabilities
4.5
55.
56
2002q3 2006q3 2010q3 2014q3 2018q3
Italy
4.6
4.8
55.
25.
45.
6
2002q3 2006q3 2010q3 2014q3 2018q3
Japan4.
55
5.5
6
2002q3 2006q3 2010q3 2014q3 2018q3
Netherlands
4.5
55.
56
6.5
7
2002q3 2006q3 2010q3 2014q3 2018q3
Norway
44.
55
5.5
2002q3 2006q3 2010q3 2014q3 2018q3
Portugal
4.6
4.8
55.
25.
4
2002q3 2006q3 2010q3 2014q3 2018q3
Singapore
Notes: Total cross-border liabilities reported to BIS by country. Log-level of index=100 for 2002Q1.
UNCERTAINTY SHOCKS AND THE CROSS-BORDER FUNDING OF BANKS 7
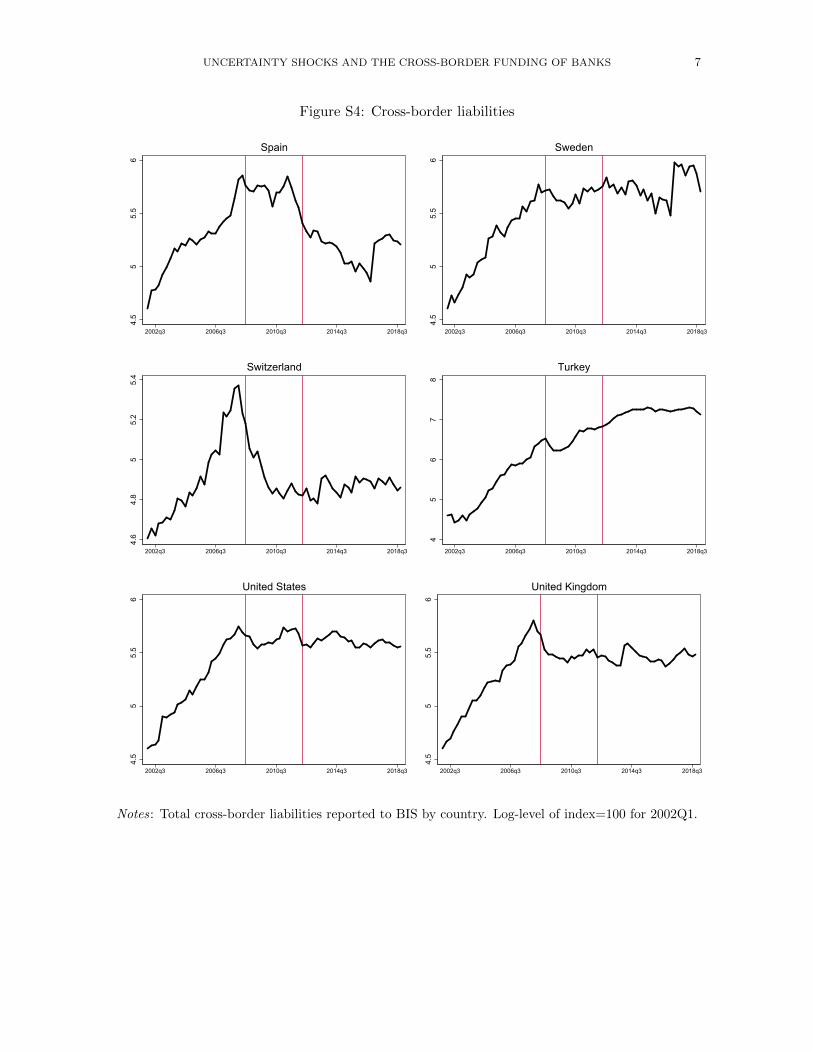
Figure S4: Cross-border liabilities
4.5
55.
56
2002q3 2006q3 2010q3 2014q3 2018q3
Spain
4.5
55.
56
2002q3 2006q3 2010q3 2014q3 2018q3
Sweden4.
64.
85
5.2
5.4
2002q3 2006q3 2010q3 2014q3 2018q3
Switzerland
45
67
8
2002q3 2006q3 2010q3 2014q3 2018q3
Turkey
4.5
55.
56
2002q3 2006q3 2010q3 2014q3 2018q3
United States
4.5
55.
56
2002q3 2006q3 2010q3 2014q3 2018q3
United Kingdom
Notes: Total cross-border liabilities reported to BIS by country. Log-level of index=100 for 2002Q1.

8 BENETRIX AND CURRAN
Figure S5: Cross-border liabilities vis-a-vis banks and non-banks4
56
78
9
2002q3 2006q3 2010q3 2014q3 2018q3
Bank Non-bankBank (estimated)
Australia
4.5
55.
56
6.5
2002q3 2006q3 2010q3 2014q3 2018q3
Bank Non-bankBank (estimated)
Austria
44.
55
5.5
6
2002q3 2006q3 2010q3 2014q3 2018q3
Bank Non-bankBank (estimated)
Belgium
4.5
55.
56
6.5
7
2002q3 2006q3 2010q3 2014q3 2018q3
Bank Non-bankBank (estimated)
Brazil
4.5
55.
56
6.5
2002q3 2006q3 2010q3 2014q3 2018q3
Bank Non-bankBank (estimated)
Canada
44.
55
5.5
66.
5
2002q3 2006q3 2010q3 2014q3 2018q3
Bank Non-bankBank (estimated)
Chile
Notes: Total cross-border liabilities reported to BIS by country broken down between banks and non-banks. For cases where vis-a-vis bank data were not available, we compute it as the residual betweentotal liabilities and liabilities vis-a-vis non-banks. These cases are indicated with green vertical linesfor cases where this approach was followed to fill in missing data. Log-level of index=100 for 2002Q1.
UNCERTAINTY SHOCKS AND THE CROSS-BORDER FUNDING OF BANKS 9
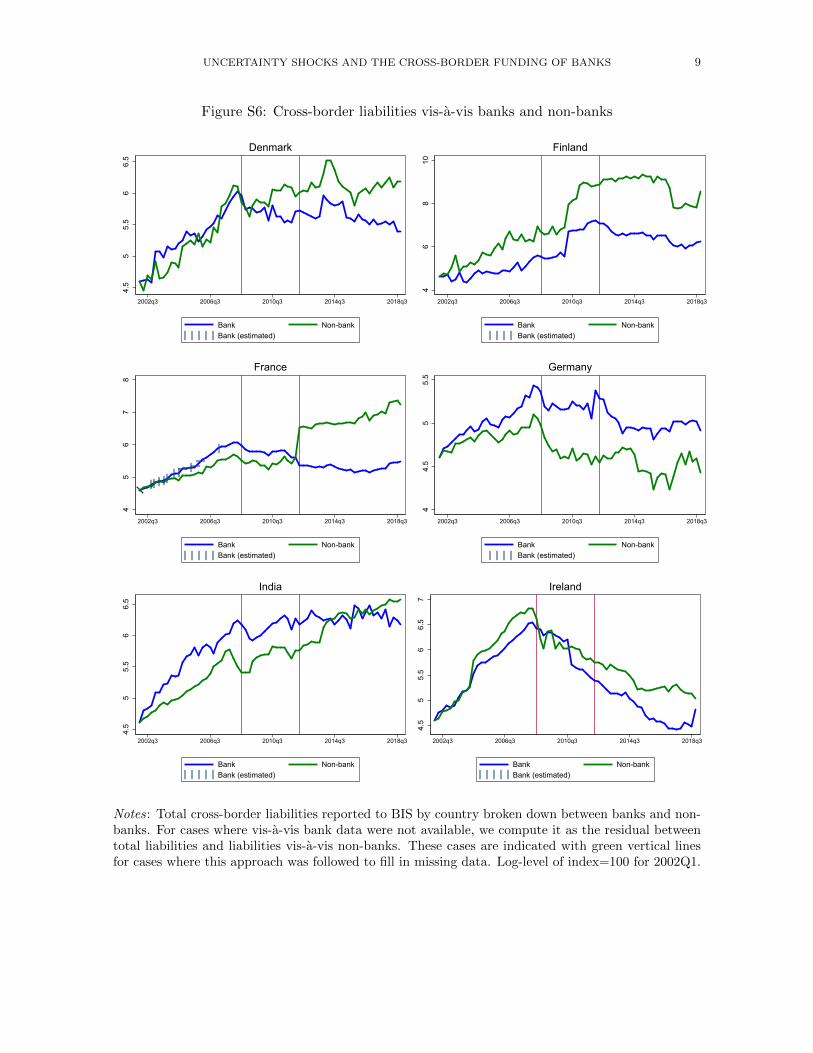
Figure S6: Cross-border liabilities vis-a-vis banks and non-banks4.
55
5.5
66.
5
2002q3 2006q3 2010q3 2014q3 2018q3
Bank Non-bankBank (estimated)
Denmark
46
810
2002q3 2006q3 2010q3 2014q3 2018q3
Bank Non-bankBank (estimated)
Finland
45
67
8
2002q3 2006q3 2010q3 2014q3 2018q3
Bank Non-bankBank (estimated)
France
44.
55
5.5
2002q3 2006q3 2010q3 2014q3 2018q3
Bank Non-bankBank (estimated)
Germany
4.5
55.
56
6.5
2002q3 2006q3 2010q3 2014q3 2018q3
Bank Non-bankBank (estimated)
India
4.5
55.
56
6.5
7
2002q3 2006q3 2010q3 2014q3 2018q3
Bank Non-bankBank (estimated)
Ireland
Notes: Total cross-border liabilities reported to BIS by country broken down between banks and non-banks. For cases where vis-a-vis bank data were not available, we compute it as the residual betweentotal liabilities and liabilities vis-a-vis non-banks. These cases are indicated with green vertical linesfor cases where this approach was followed to fill in missing data. Log-level of index=100 for 2002Q1.

10 BENETRIX AND CURRAN
Figure S7: Cross-border liabilities vis-a-vis banks and non-banks4.
55
5.5
66.
5
2002q3 2006q3 2010q3 2014q3 2018q3
Bank Non-bankBank (estimated)
Italy
4.5
55.
56
6.5
7
2002q3 2006q3 2010q3 2014q3 2018q3
Bank Non-bankBank (estimated)
Japan
4.5
55.
56
2002q3 2006q3 2010q3 2014q3 2018q3
Bank Non-bankBank (estimated)
Netherlands
4.5
55.
56
6.5
7
2002q3 2006q3 2010q3 2014q3 2018q3
Bank Non-bankBank (estimated)
Norway
44.
55
5.5
6
2002q3 2006q3 2010q3 2014q3 2018q3
Bank Non-bankBank (estimated)
Portugal
4.5
55.
5
2002q3 2006q3 2010q3 2014q3 2018q3
Bank Non-bankBank (estimated)
Singapore
Notes: Total cross-border liabilities reported to BIS by country broken down between banks and non-banks. For cases where vis-a-vis bank data were not available, we compute it as the residual betweentotal liabilities and liabilities vis-a-vis non-banks. These cases are indicated with green vertical linesfor cases where this approach was followed to fill in missing data. Log-level of index=100 for 2002Q1.
UNCERTAINTY SHOCKS AND THE CROSS-BORDER FUNDING OF BANKS 11
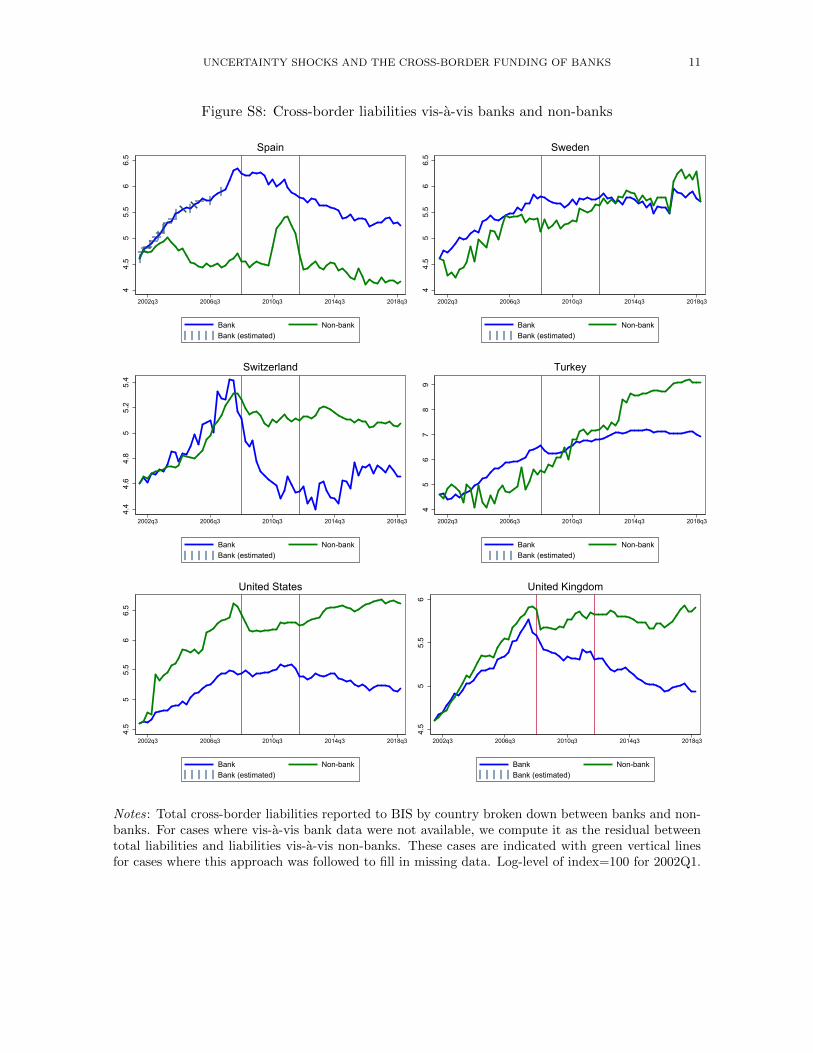
Figure S8: Cross-border liabilities vis-a-vis banks and non-banks4
4.5
55.
56
6.5
2002q3 2006q3 2010q3 2014q3 2018q3
Bank Non-bankBank (estimated)
Spain
44.
55
5.5
66.
5
2002q3 2006q3 2010q3 2014q3 2018q3
Bank Non-bankBank (estimated)
Sweden
4.4
4.6
4.8
55.
25.
4
2002q3 2006q3 2010q3 2014q3 2018q3
Bank Non-bankBank (estimated)
Switzerland
45
67
89
2002q3 2006q3 2010q3 2014q3 2018q3
Bank Non-bankBank (estimated)
Turkey
4.5
55.
56
6.5
2002q3 2006q3 2010q3 2014q3 2018q3
Bank Non-bankBank (estimated)
United States
4.5
55.
56
2002q3 2006q3 2010q3 2014q3 2018q3
Bank Non-bankBank (estimated)
United Kingdom
Notes: Total cross-border liabilities reported to BIS by country broken down between banks and non-banks. For cases where vis-a-vis bank data were not available, we compute it as the residual betweentotal liabilities and liabilities vis-a-vis non-banks. These cases are indicated with green vertical linesfor cases where this approach was followed to fill in missing data. Log-level of index=100 for 2002Q1.
12 BENETRIX AND CURRAN
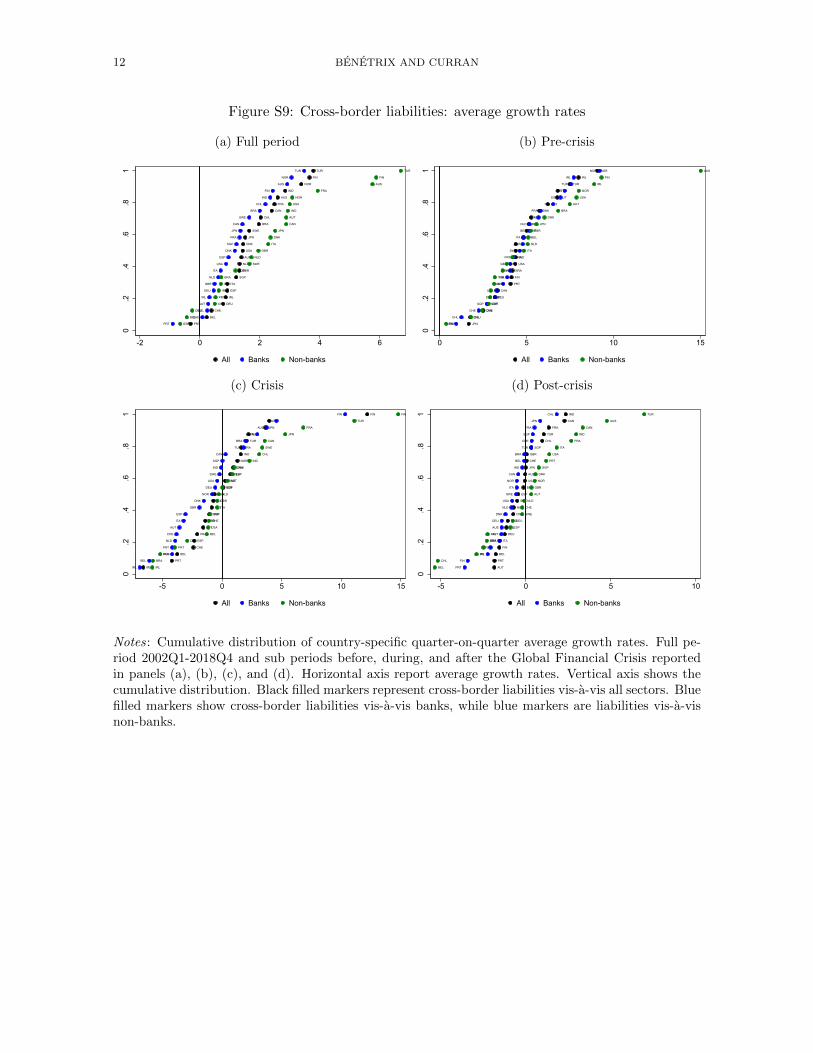
Figure S9: Cross-border liabilities: average growth rates
(a) Full period
PRT
BEL
CHE
DEU
IRL
ESP
ITA
SGP
GBR
NLD
AUT
USA
DNK
JPN
SWE
BRA
CHL
CAN
FRA
AUS
IND
NOR
FIN
TUR
PRT
CHE
BEL
AUT
IRL
DEU
GBR
NLD
ITA
USA
ESP
DNK
SGP
FRA
JPN
CAN
SWE
BRA
CHL
IND
FIN
AUS
NOR
TUR
ESP
BEL
DEU
CHL
PRT
IRL
CHE
BRA
SGP
SWE
NLD
GBR
ITA
DNK
JPN
CAN
AUT
IND
USA
NOR
FRA
AUS
FIN
TUR
0.2
.4.6
.81
-2 0 2 4 6
All Banks Non-banks
(b) Pre-crisis
JPN
CHL
CHE
SGP
DEU
CAN
PRT
FIN
BRA
USA
IND
SWE
GBR
ITA
ESP
BEL
NLD
DNK
AUS
AUT
FRA
TUR
IRL
NOR
JPN
CHL
CHE
SGP
DEU
USA
CAN
FIN
BRA
GBR
PRT
SWE
AUT
ITA
BEL
NLD
DNK
FRA
IND
ESP
AUS
TUR
IRL
NOR
ESP
DEU
CAN
CHE
SGP
PRT
SWE
TUR
IND
CHL
FRA
ITA
NLD
BEL
GBR
JPN
DNK
BRA
AUT
USA
NOR
IRL
FIN
AUS
0.2
.4.6
.81
0 5 10 15
All Banks Non-banks
(c) Crisis
IRL
PRT
BEL
CHE
ESP
FRA
AUT
GBR
DNK
NLD
ITA
USA
SGP
SWE
DEU
CAN
NOR
IND
BRA
TUR
AUS
JPN
CHL
FIN
IRL
BEL
FRA
PRT
NLD
CHE
AUT
ITA
ESP
GBR
DNK
NOR
DEU
USA
SWE
IND
SGP
CAN
TUR
BRA
JPN
AUS
CHL
FIN
IRL
BRA
AUS
PRT
DEU
BEL
USA
CHE
SGP
ITA
GBR
NLD
NOR
AUT
ESP
DNK
IND
CHL
SWE
CAN
JPN
FRA
TUR
FIN
0.2
.4.6
.81
-5 0 5 10 15
All Banks Non-banks
(d) Post-crisis
AUT
PRT
BEL
FIN
ITA
DEU
IRL
NLD
DNK
NOR
SWE
ESP
BRA
USA
AUS
JPN
CHE
GBR
SGP
CHL
TUR
FRA
CAN
IND
PRT
FIN
IRL
ESP
GBR
AUT
AUS
DEU
DNK
NLD
USA
SWE
ITA
NOR
CAN
IND
BEL
BRA
TUR
CHE
SGP
FRA
JPN
CHL
BEL
CHL
IRL
JPN
BRA
FIN
ESP
DEU
SWE
CHE
NLD
AUT
GBR
NOR
DNK
SGP
PRT
USA
ITA
FRA
IND
CAN
AUS
TUR
0.2
.4.6
.81
-5 0 5 10
All Banks Non-banks
Notes: Cumulative distribution of country-specific quarter-on-quarter average growth rates. Full pe-riod 2002Q1-2018Q4 and sub periods before, during, and after the Global Financial Crisis reportedin panels (a), (b), (c), and (d). Horizontal axis report average growth rates. Vertical axis shows thecumulative distribution. Black filled markers represent cross-border liabilities vis-a-vis all sectors. Bluefilled markers show cross-border liabilities vis-a-vis banks, while blue markers are liabilities vis-a-visnon-banks.
UNCERTAINTY SHOCKS AND THE CROSS-BORDER FUNDING OF BANKS 13
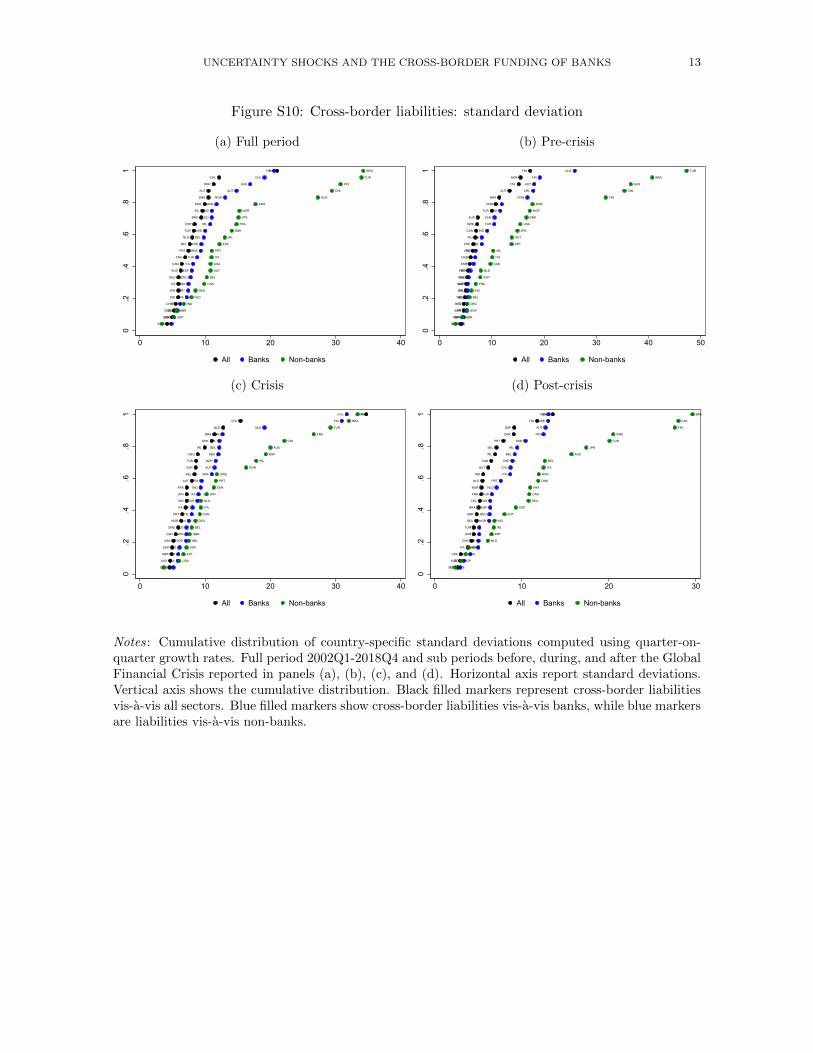
Figure S10: Cross-border liabilities: standard deviation
(a) Full period
SGP
USA
GBR
CHE
IND
JPN
ITA
DEU
AUS
CAN
FRA
PRT
BEL
NLD
TUR
ESP
BRA
IRL
SWE
DNK
AUT
NOR
CHL
FIN
USA
GBR
SGP
JPN
FRA
PRT
CAN
DEU
ESP
ITA
TUR
BRA
CHE
BEL
SWE
IRL
NLD
IND
DNK
NOR
AUT
AUS
CHL
FIN
CHE
SGP
GBR
IND
NLD
DEU
CAN
BEL
AUT
USA
ITA
PRT
ESP
IRL
DNK
FRA
JPN
NOR
SWE
AUS
CHL
FIN
TUR
BRA
0.2
.4.6
.81
0 10 20 30 40
All Banks Non-banks
(b) Pre-crisis
DEU
GBR
SGP
BEL
IND
ITA
NLD
USA
PRT
ESP
FRA
JPN
CHE
IRL
CAN
SWE
AUS
TUR
DNK
BRA
AUT
CHL
NOR
FIN
USA
FRA
PRT
ITA
BEL
DEU
GBR
NLD
ESP
IRL
JPN
SGP
SWE
CAN
IND
TUR
CHE
BRA
DNK
NOR
CHL
AUT
FIN
AUS
CHE
GBR
SGP
DEU
BEL
IND
FRA
ESP
NLD
CAN
ITA
IRL
PRT
AUT
JPN
USA
DNK
NOR
SWE
FIN
CHL
AUS
BRA
TUR
0.2
.4.6
.81
0 10 20 30 40 50
All Banks Non-banks
(c) Crisis
CHE
AUS
GBR
SGP
USA
CAN
SWE
NOR
PRT
ITA
IND
JPN
FRA
AUT
BEL
ESP
TUR
DEU
IRL
DNK
BRA
NLD
CHL
FIN
GBR
USA
PRT
SWE
SGP
JPN
AUS
CAN
CHE
ESP
TUR
ITA
IND
FRA
BRA
AUT
NOR
DEU
BEL
IRL
DNK
NLD
FIN
CHL
CHE
USA
AUT
SGP
IND
GBR
BEL
DEU
CAN
ITA
NLD
JPN
DNK
PRT
SWE
NOR
IRL
ESP
AUS
CHL
FRA
TUR
BRA
FIN
0.2
.4.6
.81
0 10 20 30 40
All Banks Non-banks
(d) Post-crisis
SGP
AUS
USA
ITA
CHE
JPN
TUR
DEU
GBR
BRA
CHL
FRA
NOR
NLD
IND
AUT
CAN
IRL
BEL
PRT
DNK
ESP
FIN
SWE
GBR
SGP
USA
BRA
JPN
TUR
FRA
NOR
DEU
ESP
CAN
AUS
NLD
PRT
ITA
CHL
CHE
BEL
IRL
DNK
FIN
AUT
SWE
IND
CHE
SGP
USA
GBR
NLD
PRT
IRL
IND
AUT
ESP
DEU
CAN
FRA
DNK
NOR
ITA
BEL
AUS
JPN
TUR
SWE
FIN
CHL
BRA
0.2
.4.6
.81
0 10 20 30
All Banks Non-banks
Notes: Cumulative distribution of country-specific standard deviations computed using quarter-on-quarter growth rates. Full period 2002Q1-2018Q4 and sub periods before, during, and after the GlobalFinancial Crisis reported in panels (a), (b), (c), and (d). Horizontal axis report standard deviations.Vertical axis shows the cumulative distribution. Black filled markers represent cross-border liabilitiesvis-a-vis all sectors. Blue filled markers show cross-border liabilities vis-a-vis banks, while blue markersare liabilities vis-a-vis non-banks.
14 BENETRIX AND CURRAN
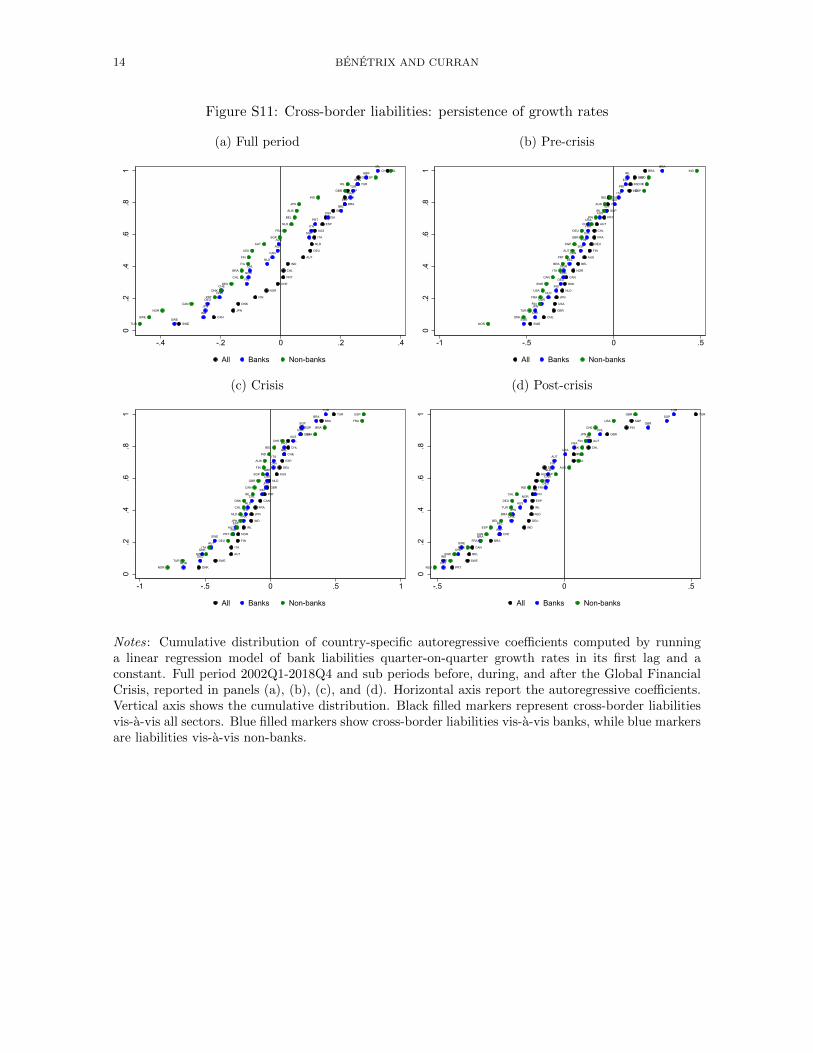
Figure S11: Cross-border liabilities: persistence of growth rates
(a) Full period
SWE
CAN
JPN
DNK
FIN
NOR
CHE
PRT
CHL
IND
AUT
DEU
NLD
ITA
AUS
ESP
USA
BEL
BRA
FRA
SGP
TUR
GBR
IRL
SWE
IND
JPN
DEU
DNK
CHE
FIN
NOR
CHL
NLD
CAN
AUT
AUS
SGP
ITA
PRT
USA
BEL
ESP
FRA
TUR
BRA
GBR
IRL
TUR
SWE
NOR
CAN
PRT
DNK
DEU
CHL
BRA
ITA
FIN
USA
AUT
SGP
FRA
NLD
BEL
AUS
JPN
IND
GBR
IRL
ESP
CHE
0.2
.4.6
.81
-.4 -.2 0 .2 .4
All Banks Non-banks
(b) Pre-crisis
SWE
CHE
GBR
USA
JPN
NLD
DNK
CAN
NOR
BEL
AUS
FIN
DEU
FRA
CHL
AUT
PRT
SGP
ITA
TUR
IND
IRL
ESP
BRA
SWE
CHE
JPN
GBR
NLD
IND
DEU
DNK
NOR
BEL
CAN
SGP
FIN
CHL
FRA
USA
AUS
TUR
AUT
ITA
PRT
ESP
IRL
BRA
NOR
DNK
TUR
FIN
FRA
USA
SWE
CAN
ITA
BRA
PRT
AUT
SGP
GBR
DEU
CHL
JPN
IRL
AUS
BEL
ESP
CHE
NLD
IND
0.2
.4.6
.81
-1 -.5 0 .5
All Banks Non-banks
(c) Crisis
DNK
SWE
AUT
ITA
FIN
NOR
IRL
IND
JPN
FRA
CAN
PRT
GBR
NLD
AUS
DEU
ESP
CHE
CHL
BEL
USA
SGP
BRA
TUR
NOR
DEU
DNK
AUT
SWE
FIN
ESP
FRA
IRL
NLD
CHL
IND
JPN
CHE
GBR
CAN
ITA
BEL
PRT
AUS
USA
SGP
BRA
TUR
NOR
TUR
SWE
ITA
DEU
PRT
AUT
JPN
NLD
CHL
DNK
IRL
CAN
GBR
SGP
FIN
AUS
IND
BEL
CHE
USA
BRA
FRA
ESP
0.2
.4.6
.81
-1 -.5 0 .5 1
All Banks Non-banks
(d) Post-crisis
PRT
SWE
BEL
CAN
BRA
CHE
IND
DEU
NLD
IRL
ESP
JPN
FRA
NOR
AUS
DNK
USA
ITA
CHL
AUT
GBR
FIN
SGP
TUR
PRT
IND
CHE
SWE
BRA
ESP
BEL
DNK
JPN
AUS
NOR
ITA
DEU
CAN
NLD
FIN
AUT
USA
FRA
IRL
CHL
GBR
SGP
TUR
NLD
PRT
SWE
NOR
FRA
CAN
ESP
BEL
BRA
TUR
DEU
CHL
IND
IRL
SGP
AUS
ITA
AUT
DNK
FIN
JPN
CHE
USA
GBR
0.2
.4.6
.81
-.5 0 .5
All Banks Non-banks
Notes: Cumulative distribution of country-specific autoregressive coefficients computed by runninga linear regression model of bank liabilities quarter-on-quarter growth rates in its first lag and aconstant. Full period 2002Q1-2018Q4 and sub periods before, during, and after the Global FinancialCrisis, reported in panels (a), (b), (c), and (d). Horizontal axis report the autoregressive coefficients.Vertical axis shows the cumulative distribution. Black filled markers represent cross-border liabilitiesvis-a-vis all sectors. Blue filled markers show cross-border liabilities vis-a-vis banks, while blue markersare liabilities vis-a-vis non-banks.
UNCERTAINTY SHOCKS AND THE CROSS-BORDER FUNDING OF BANKS 15
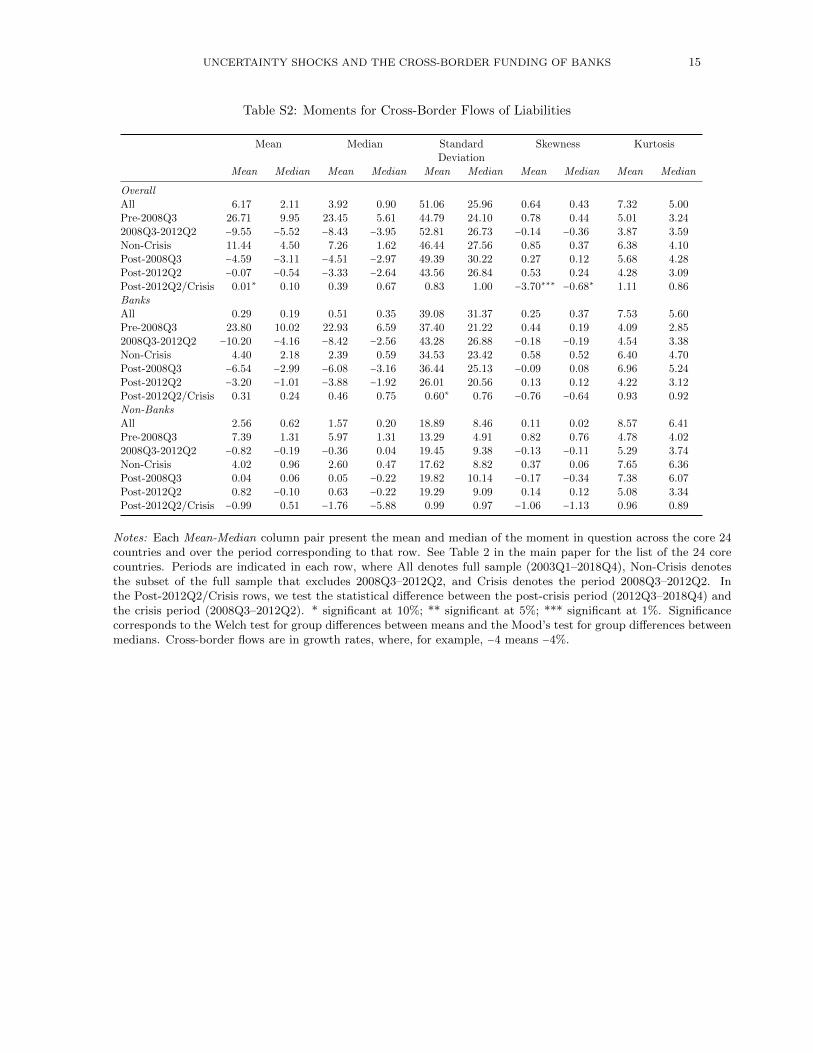
Table S2: Moments for Cross-Border Flows of Liabilities
Mean Median Standard Skewness KurtosisDeviation
Mean Median Mean Median Mean Median Mean Median Mean Median
OverallAll 6.17 2.11 3.92 0.90 51.06 25.96 0.64 0.43 7.32 5.00Pre-2008Q3 26.71 9.95 23.45 5.61 44.79 24.10 0.78 0.44 5.01 3.242008Q3-2012Q2 −9.55 −5.52 −8.43 −3.95 52.81 26.73 −0.14 −0.36 3.87 3.59Non-Crisis 11.44 4.50 7.26 1.62 46.44 27.56 0.85 0.37 6.38 4.10Post-2008Q3 −4.59 −3.11 −4.51 −2.97 49.39 30.22 0.27 0.12 5.68 4.28Post-2012Q2 −0.07 −0.54 −3.33 −2.64 43.56 26.84 0.53 0.24 4.28 3.09Post-2012Q2/Crisis 0.01∗ 0.10 0.39 0.67 0.83 1.00 −3.70∗∗∗ −0.68∗ 1.11 0.86BanksAll 0.29 0.19 0.51 0.35 39.08 31.37 0.25 0.37 7.53 5.60Pre-2008Q3 23.80 10.02 22.93 6.59 37.40 21.22 0.44 0.19 4.09 2.852008Q3-2012Q2 −10.20 −4.16 −8.42 −2.56 43.28 26.88 −0.18 −0.19 4.54 3.38Non-Crisis 4.40 2.18 2.39 0.59 34.53 23.42 0.58 0.52 6.40 4.70Post-2008Q3 −6.54 −2.99 −6.08 −3.16 36.44 25.13 −0.09 0.08 6.96 5.24Post-2012Q2 −3.20 −1.01 −3.88 −1.92 26.01 20.56 0.13 0.12 4.22 3.12Post-2012Q2/Crisis 0.31 0.24 0.46 0.75 0.60∗ 0.76 −0.76 −0.64 0.93 0.92Non-BanksAll 2.56 0.62 1.57 0.20 18.89 8.46 0.11 0.02 8.57 6.41Pre-2008Q3 7.39 1.31 5.97 1.31 13.29 4.91 0.82 0.76 4.78 4.022008Q3-2012Q2 −0.82 −0.19 −0.36 0.04 19.45 9.38 −0.13 −0.11 5.29 3.74Non-Crisis 4.02 0.96 2.60 0.47 17.62 8.82 0.37 0.06 7.65 6.36Post-2008Q3 0.04 0.06 0.05 −0.22 19.82 10.14 −0.17 −0.34 7.38 6.07Post-2012Q2 0.82 −0.10 0.63 −0.22 19.29 9.09 0.14 0.12 5.08 3.34Post-2012Q2/Crisis −0.99 0.51 −1.76 −5.88 0.99 0.97 −1.06 −1.13 0.96 0.89
Notes: Each Mean-Median column pair present the mean and median of the moment in question across the core 24countries and over the period corresponding to that row. See Table 2 in the main paper for the list of the 24 corecountries. Periods are indicated in each row, where All denotes full sample (2003Q1–2018Q4), Non-Crisis denotesthe subset of the full sample that excludes 2008Q3–2012Q2, and Crisis denotes the period 2008Q3–2012Q2. Inthe Post-2012Q2/Crisis rows, we test the statistical difference between the post-crisis period (2012Q3–2018Q4) andthe crisis period (2008Q3–2012Q2). * significant at 10%; ** significant at 5%; *** significant at 1%. Significancecorresponds to the Welch test for group differences between means and the Mood’s test for group differences betweenmedians. Cross-border flows are in growth rates, where, for example, −4 means −4%.
16 BENETRIX AND CURRAN
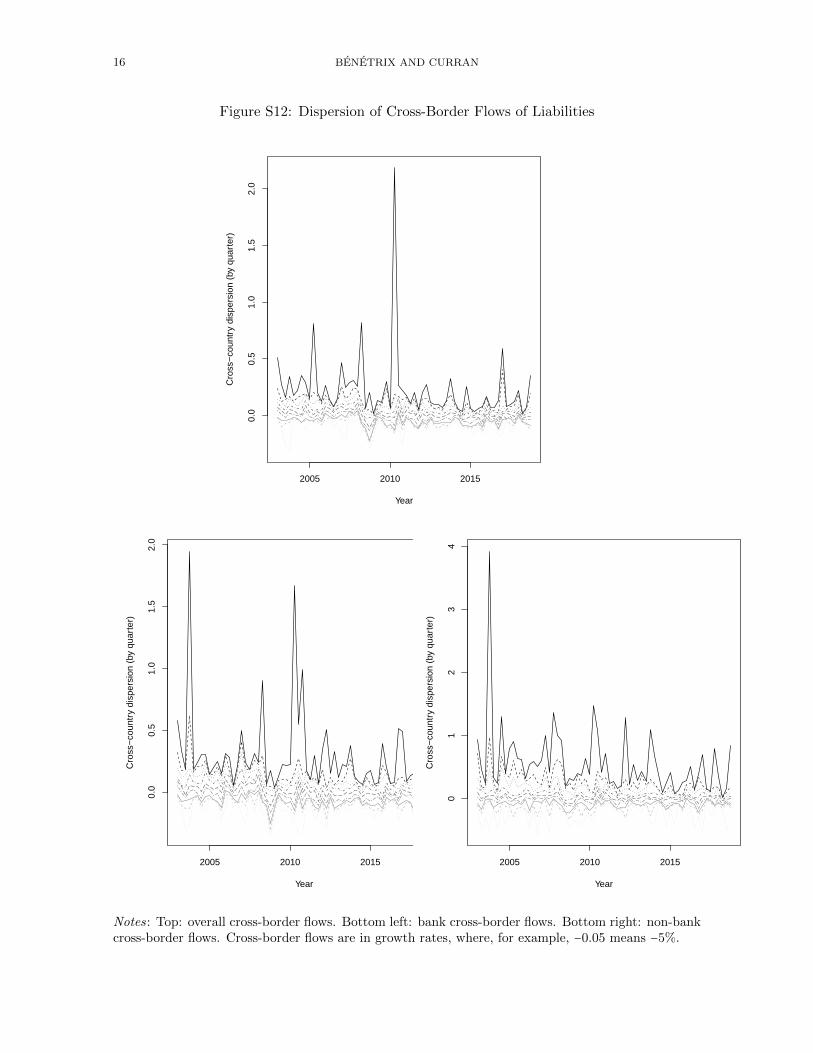
Figure S12: Dispersion of Cross-Border Flows of Liabilities
Year
Cro
ss−
coun
try
disp
ersi
on (
by q
uart
er)
2005 2010 2015
0.0
0.5
1.0
1.5
2.0
Year
Cro
ss−
coun
try
disp
ersi
on (
by q
uart
er)
2005 2010 2015
0.0
0.5
1.0
1.5
2.0
Year
Cro
ss−
coun
try
disp
ersi
on (
by q
uart
er)
2005 2010 2015
01
23
4
Notes: Top: overall cross-border flows. Bottom left: bank cross-border flows. Bottom right: non-bankcross-border flows. Cross-border flows are in growth rates, where, for example, −0.05 means −5%.
UNCERTAINTY SHOCKS AND THE CROSS-BORDER FUNDING OF BANKS 17
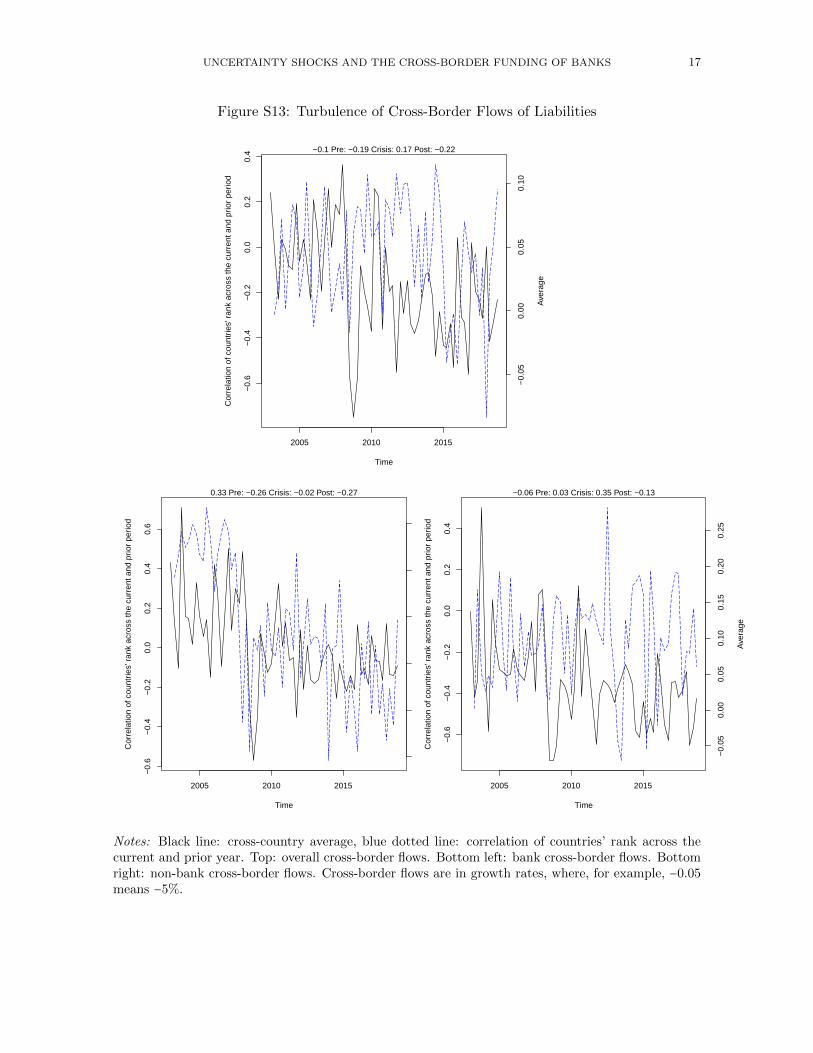
Figure S13: Turbulence of Cross-Border Flows of Liabilities
Time
Cor
rela
tion
of c
ount
ries'
ran
k ac
ross
the
curr
ent a
nd p
rior
perio
d
2005 2010 2015
−0.
6−
0.4
−0.
20.
00.
20.
4
−0.
050.
000.
050.
10
Ave
rage
−0.1 Pre: −0.19 Crisis: 0.17 Post: −0.22
Time
Cor
rela
tion
of c
ount
ries'
ran
k ac
ross
the
curr
ent a
nd p
rior
perio
d
2005 2010 2015
−0.
6−
0.4
−0.
20.
00.
20.
40.
6
−0.
10−
0.05
0.00
0.05
0.10
0.15
Ave
rage
0.33 Pre: −0.26 Crisis: −0.02 Post: −0.27
Time
Cor
rela
tion
of c
ount
ries'
ran
k ac
ross
the
curr
ent a
nd p
rior
perio
d
2005 2010 2015
−0.
6−
0.4
−0.
20.
00.
20.
4
−0.
050.
000.
050.
100.
150.
200.
25
Ave
rage
−0.06 Pre: 0.03 Crisis: 0.35 Post: −0.13
Notes: Black line: cross-country average, blue dotted line: correlation of countries’ rank across thecurrent and prior year. Top: overall cross-border flows. Bottom left: bank cross-border flows. Bottomright: non-bank cross-border flows. Cross-border flows are in growth rates, where, for example, −0.05means −5%.

18 BENETRIX AND CURRAN
S3 Dynamic Behavior of Uncertainty Measures
Table S3: Correlation Matrix Between Uncertainty Measures
Uncertainty IV3 IV1 RV EPU WUI FD
IV3 1.0000 0.8779 0.1698 0.0940 −0.0172 0.0307IV1 0.8779 1.0000 0.1711 0.0203 −0.0060 −0.0012RV 0.1698 0.1711 1.0000 0.0244 0.0007 −0.0552
EPU 0.0940 0.0203 0.0244 1.0000 0.1513 −0.1632WUI −0.0172 −0.0060 0.0007 0.1513 1.0000 −0.1909FD 0.0307 −0.0012 −0.0552 −0.1632 −0.1909 1.0000
Notes: Correlation matrix for uncertainty measures: implied volatility at three- and one-month maturities, realizedvolatility, EPU, WUI, and forecast dispersion.

UNCERTAINTY SHOCKS AND THE CROSS-BORDER FUNDING OF BANKS 19
Table S4: Moments for Uncertainty Measures
Mean Median Standard Skewness KurtosisDeviation
Mean Median Mean Median Mean Median Mean Median Mean Median
IV3All 2.91 2.93 2.87 2.89 0.37 0.36 0.72 0.70 3.98 3.31Pre-2008Q3 2.81 2.79 2.79 2.74 0.33 0.34 0.42 0.46 2.46 2.312008Q3-2012Q2 3.12 3.19 3.02 3.03 0.38 0.37 0.83 0.67 3.23 2.85Non-Crisis 2.81 2.82 2.78 2.77 0.31 0.30 0.42 0.36 3.18 2.55Post-2008Q3 2.96 2.97 2.91 2.93 0.37 0.34 0.93 0.84 4.06 3.46Post-2012Q2 2.81 2.79 2.76 2.74 0.27 0.26 0.43 0.31 2.78 2.09Post-2012Q2/Crisis 0.90∗∗∗ 0.87∗∗∗ 0.91∗∗∗ 0.90∗∗∗ 0.69 0.70∗∗∗ 0.52∗∗∗ 0.46∗∗∗ 0.86 0.73∗∗∗
IV1All 2.86 2.88 2.82 2.86 0.42 0.40 0.61 0.48 3.56 2.94Pre-2008Q3 2.75 2.73 2.70 2.66 0.38 0.39 0.52 0.45 2.68 2.532008Q3-2012Q2 3.07 3.15 2.99 3.00 0.42 0.39 0.63 0.53 2.81 2.38Non-Crisis 2.76 2.75 2.72 2.67 0.37 0.36 0.53 0.47 3.43 2.79Post-2008Q3 2.91 2.92 2.86 2.86 0.41 0.38 0.74 0.62 3.51 3.04Post-2012Q2 2.76 2.72 2.72 2.67 0.33 0.32 0.61 0.47 3.30 2.61Post-2012Q2/Crisis 0.90∗∗∗ 0.86∗∗∗ 0.91∗∗∗ 0.89∗∗∗ 0.80∗∗ 0.83∗∗ 0.98 0.89 1.17 1.10Realized VolatilityAll 3.01 3.01 2.96 2.92 0.39 0.41 0.78 0.74 3.88 3.68Pre-2008Q3 2.93 2.87 2.88 2.84 0.29 0.30 0.79 0.77 3.16 2.902008Q3-2012Q2 3.30 3.32 3.21 3.21 0.40 0.40 0.82 0.86 3.41 3.31Non-Crisis 2.89 2.85 2.86 2.82 0.30 0.30 0.43 0.34 3.06 2.96Post-2008Q3 3.06 3.06 3.02 3.00 0.42 0.43 0.67 0.69 3.69 3.55Post-2012Q2 2.83 2.79 2.80 2.74 0.29 0.29 0.28 0.30 2.91 2.71Post-2012Q2/Crisis 0.86∗∗∗ 0.84∗∗∗ 0.87∗∗∗ 0.85∗∗∗ 0.74∗∗∗ 0.74∗∗∗ 0.34∗∗ 0.35∗∗∗ 0.86∗∗ 0.82∗∗
EPUAll sample 4.74 4.70 4.76 4.69 0.45 0.47 −0.03 0.02 2.63 2.55Pre-2008Q3 4.37 4.37 4.35 4.36 0.37 0.35 0.59 0.64 3.59 3.592008Q3-2012Q2 4.94 4.93 4.94 4.92 0.31 0.34 −0.03 −0.07 2.40 2.25Non-Crisis 4.68 4.65 4.70 4.64 0.47 0.50 0.11 0.10 2.61 2.67Post-2008Q3 4.94 4.83 4.93 4.85 0.35 0.35 0.10 0.14 2.74 2.71Post-2012Q2 4.94 4.81 4.95 4.84 0.33 0.33 0.20 0.14 2.89 2.72Post-2012Q2/Crisis 1.00 0.98 1.00 0.98 1.09 0.98 −5.89∗ −2.12 1.21∗∗ 1.21∗∗∗
WUIAll sample 2.43 2.48 2.72 2.77 1.20 1.24 −0.89 −1.08 3.34 3.09Pre-2008Q3 2.07 2.19 2.25 2.35 1.14 1.20 −0.58 −0.64 2.64 2.362008Q3-2012Q2 2.31 2.35 2.54 2.74 1.24 1.28 −0.80 −0.70 3.45 2.06Non-Crisis 2.53 2.55 2.79 2.83 1.15 1.14 −0.91 −1.02 3.33 2.96Post-2008Q3 2.62 2.65 2.85 2.98 1.18 1.19 −1.19 −1.33 4.24 3.93Post-2012Q2 2.90 2.96 3.11 3.21 0.93 0.93 −1.10 −1.26 4.48 3.74Post-2012Q2/Crisis 1.26∗∗∗ 1.26∗∗∗ 1.23∗∗ 1.17∗∗ 0.75∗∗∗ 0.72∗∗ 1.37 1.79 1.30 1.82∗∗
Forecast DispersionAll sample 2.48 3.01 2.37 2.89 0.70 0.64 0.18 0.26 2.65 2.36Pre-2008Q3 2.75 2.91 2.78 2.81 0.62 0.57 −0.12 −0.19 2.31 2.262008Q3-2012Q2 2.46 3.09 2.24 3.03 0.68 0.67 0.35 0.30 2.76 2.27Non-Crisis 2.45 2.82 2.50 2.81 0.68 0.61 −0.01 −0.03 2.40 2.20Post-2008Q3 2.36 3.00 2.19 2.99 0.67 0.67 0.42 0.37 3.03 2.78Post-2012Q2 2.27 2.73 2.14 2.84 0.61 0.55 0.20 0.20 2.52 2.42Post-2012Q2/Crisis 0.92 0.88 0.95 0.94 0.90 0.83 0.58 0.67 0.91 1.06
Notes: See notes to Table S2. To ensure consistency across uncertainty measures throughout the analysis, we useln (EPU + 1) for EPU. Similarly, denoting WUI and the forecast-based measures by x, we transform x to ln (100x + 1).

20 BENETRIX AND CURRAN
Figure S14: Dispersion of Uncertainty Measures
Year
Cro
ss−
coun
try
disp
ersi
on (
by q
uart
er)
2005 2010 2015
23
45
Year
Cro
ss−
coun
try
disp
ersi
on (
by q
uart
er)
2005 2010 20152
34
5
Year
Cro
ss−
coun
try
disp
ersi
on (
by q
uart
er)
2005 2010 2015
2.0
2.5
3.0
3.5
4.0
4.5
Year
Cro
ss−
coun
try
disp
ersi
on (
by q
uart
er)
2005 2010 2015
3.5
4.0
4.5
5.0
5.5
6.0
6.5
Year
Cro
ss−
coun
try
disp
ersi
on (
by q
uart
er)
2005 2010 2015
01
23
45
Year
Cro
ss−
coun
try
disp
ersi
on (
by q
uart
er)
2005 2010 2015
01
23
45
Notes: Top row from left to right: implied-volatility at 3 month maturity (IV3), implied-volatilityat 1 month maturity (IV1), realized volatility (RV). Bottom row from left to right: economic policyuncertainty (EPU) index, world uncertainty index (WUI), forecast dispersion. See Section 2 in themain paper for detailed description of uncertainty measures.
UNCERTAINTY SHOCKS AND THE CROSS-BORDER FUNDING OF BANKS 21
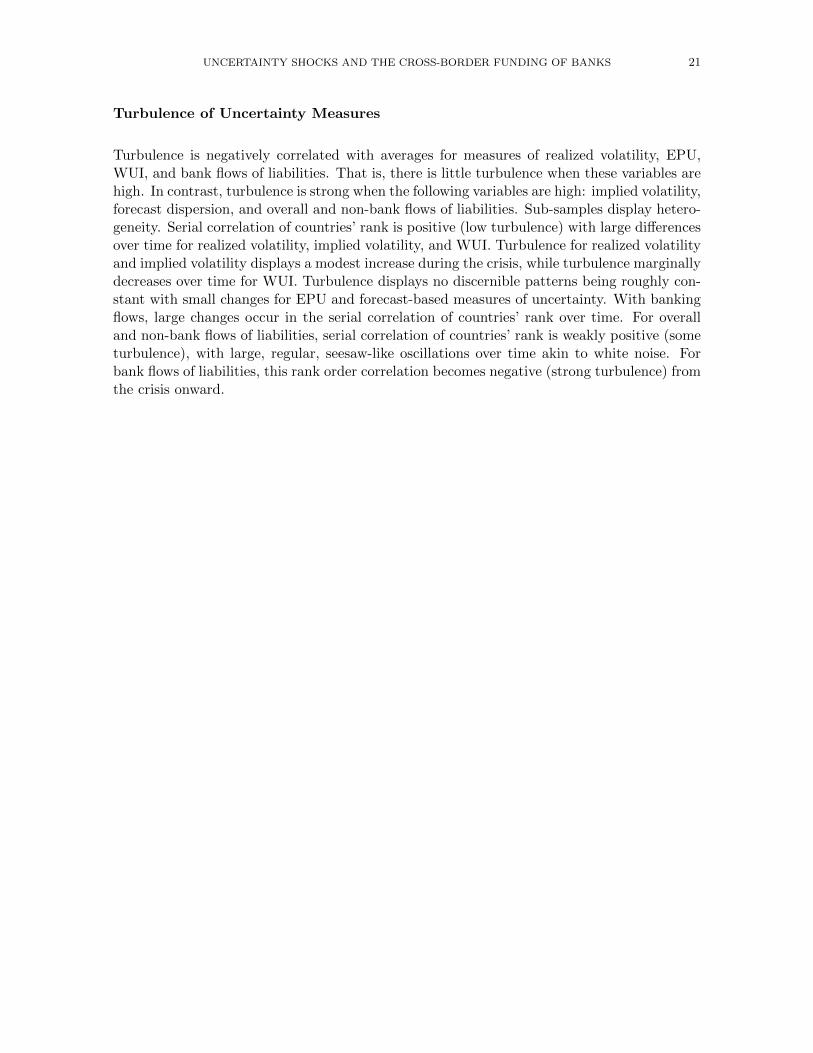
Turbulence of Uncertainty Measures
Turbulence is negatively correlated with averages for measures of realized volatility, EPU,WUI, and bank flows of liabilities. That is, there is little turbulence when these variables arehigh. In contrast, turbulence is strong when the following variables are high: implied volatility,forecast dispersion, and overall and non-bank flows of liabilities. Sub-samples display hetero-geneity. Serial correlation of countries’ rank is positive (low turbulence) with large differencesover time for realized volatility, implied volatility, and WUI. Turbulence for realized volatilityand implied volatility displays a modest increase during the crisis, while turbulence marginallydecreases over time for WUI. Turbulence displays no discernible patterns being roughly con-stant with small changes for EPU and forecast-based measures of uncertainty. With bankingflows, large changes occur in the serial correlation of countries’ rank over time. For overalland non-bank flows of liabilities, serial correlation of countries’ rank is weakly positive (someturbulence), with large, regular, seesaw-like oscillations over time akin to white noise. Forbank flows of liabilities, this rank order correlation becomes negative (strong turbulence) fromthe crisis onward.
22 BENETRIX AND CURRAN
Figure S15: Turbulence of Uncertainty Measures – 1 of 2
Time
Cor
rela
tion
of c
ount
ries'
ran
k ac
ross
the
curr
ent a
nd p
rior
perio
d
2005 2010 2015
0.5
0.6
0.7
0.8
0.9
2.5
3.0
3.5
4.0
Ave
rage
−0.41 Pre: −0.02 Crisis: −0.87 Post: −0.25
Time
Cor
rela
tion
of c
ount
ries'
ran
k ac
ross
the
curr
ent a
nd p
rior
perio
d
2005 2010 20150.
30.
40.
50.
60.
70.
80.
9
2.4
2.6
2.8
3.0
3.2
3.4
3.6
3.8
Ave
rage
−0.29 Pre: −0.33 Crisis: −0.05 Post: −0.58
Time
Cor
rela
tion
of c
ount
ries'
ran
k ac
ross
the
curr
ent a
nd p
rior
perio
d
2005 2010 2015
0.4
0.5
0.6
0.7
0.8
0.9
2.5
3.0
3.5
4.0
Ave
rage
0.08 Pre: −0.5 Crisis: 0.16 Post: −0.06
Notes: Black line: cross-country average, blue dotted line: correlation of countries’ rank across thecurrent and prior year. Top left: implied volatility at 3 month maturity (IV3). Top right: impliedvolatility at 1 month maturity (IV1). Bottom: realized volatility (RV). See Section 2 in the mainpaper for detailed description of uncertainty measures.

UNCERTAINTY SHOCKS AND THE CROSS-BORDER FUNDING OF BANKS 23
Figure S16: Turbulence of Uncertainty Measures – 2 of 2
Time
Cor
rela
tion
of c
ount
ries'
ran
k ac
ross
the
curr
ent a
nd p
rior
perio
d
2005 2010 2015
0.75
0.80
0.85
0.90
0.95
4.0
4.5
5.0
5.5
Ave
rage
0.35 Pre: −0.3 Crisis: 0.14 Post: 0.42
Time
Cor
rela
tion
of c
ount
ries'
ran
k ac
ross
the
curr
ent a
nd p
rior
perio
d
2005 2010 20150.
00.
20.
40.
60.
8
1.5
2.0
2.5
3.0
3.5
Ave
rage
0.16 Pre: −0.18 Crisis: −0.53 Post: −0.21
Time
Cor
rela
tion
of c
ount
ries'
ran
k ac
ross
the
curr
ent a
nd p
rior
perio
d
2005 2010 2015
0.80
0.85
0.90
0.95
0.15
0.20
0.25
0.30
0.35
0.40
0.45
Ave
rage
−0.04 Pre: 0 Crisis: −0.26 Post: −0.23
Notes: Black line: cross-country average, blue dotted line: correlation of countries’ rank across the cur-rent and prior year. Top left: economic policy uncertainty (EPU) index. Top right: world uncertaintyindex (WUI). Bottom: forecast dispersion. See Section 2 in the main paper for detailed description ofuncertainty measures.

24 BENETRIX AND CURRAN
Figure S17: AR(1) Persistence of Uncertainty
AUS
AUT
BEL
BRA
CAN
CHL
DNK
FIN
FRA
DEU
IND
IRL
ITA
JPN
NDL
NOR
PRT
SGPESP
SWE
CHE
TUR
USA
GRB
0.2
.4.6
.81
.988 .99 .992 .994 .996RV
AUS
AUT
BEL
BRA
CAN
CHL
DNK
FIN
FRA
DEU
IND
IRL
ITA
JPN
NDL
NOR
PRT
SGP
ESP
SWE
CHE
TUR
USA
GRB
AUSBRA
CAN
CHL
FRA
DEU
INDIRL
ITAJPN
NDL
SGP
ESP
SWEUSA
GRB
0.2
.4.6
.81
.6 .7 .8 .9 1
WUI EPU
AUS
AUT
BEL
BRA
CAN
CHLDNK
FIN
FRA
DEU
IND
IRL
ITA
JPN
NDL
NOR
PRT
SGP
ESPSWE
CHE
TUR
USA
GRB
AUS
AUT
BEL
BRA
CAN
CHL
DNK
FINFRA
DEU
IND
IRL
ITA
JPN
NDL
NOR
PRT
SGP
ESP
SWE
CHE
TUR
USA
GRB
0.2
.4.6
.81
.95 .96 .97 .98 .99 1
IV3 IV1
AUS
BRA
CAN
CHL
FRA
DEU
IND
ITA
NDL
SGP
ESP
SWE
CHE
TUR
GRB
0.2
.4.6
.81
.4 .6 .8 1FD
Notes: Cumulative distributions of AR(1) coefficients (ρ) from ∆UNCt = ρUNCt−1 + εt. Resultsare robust to the inclusion of the constant term. Top left: realized volatility (RV). Top right: worlduncertainty index (WUI) and economic policy uncertainty (EPU) index. Bottom left: implied volatilityat 3 and 1 month maturities (IV3 and IV1). Bottom right: forecast dispersion (FD). See Section 2 inthe main paper for detailed description of uncertainty measures.

UNCERTAINTY SHOCKS AND THE CROSS-BORDER FUNDING OF BANKS 25
Figure S18: Half-Life Persistence of Uncertainty
AUS
AUT
BEL
BRA
CAN
CHL
DNK
FIN
FRA
DEU
IND
IRL
ITA
JPN
NDL
NOR
PRT
SGP
ESP
SWE
CHE
TUR
USA
GRB
0.2
.4.6
.81
.5 1 1.5 2RV
AUS
AUT
BEL
BRA
CAN
CHL
DNK
FIN
FRA
DEU
IND
IRL
ITA
JPN
NDL
NORPRT
SGP
ESP
SWE
CHE
TUR
USA
GRB
AUSBRA
CAN
CHL
FRA
DEU
IND
IRL
ITAJPN
NDL
SGP
ESP
SWE
USA
GRB
0.2
.4.6
.81
.5 1 1.5 2 2.5 3
WUI EPU
AUS
AUT
BEL
BRA
CAN
CHL
DNK
FIN
FRA
DEU
IND
IRL
ITA
JPN
NDL
NOR
PRT
SGP
ESP
SWE
CHETUR
USA
GRBAUS
AUT
BEL
BRA
CAN
CHL
DNK
FIN
FRADEU
IND
IRL
ITA
JPN
NDL
NOR
PRT
SGP
ESP
SWE
CHE
TUR
USA
GRB
0.2
.4.6
.81
0 1 2 3
IV3 IV1
AUS
BRA
CAN
CHL
FRA
DEU
IND
ITA
NDL
SGP
ESP
SWE
CHE
TUR
GRB
0.2
.4.6
.81
0 .5 1 1.5FD
Notes: cumulative distributions of half-life coefficients (h) from ∆UNCt = ρUNCt−1 + εt as computed
by h =ln(0.5)ln(γ) , where γ = 1 + ρ > 0 is a complete scalar measure of persistence. Under mean reversion
a proportion γn of any shock will remain after n periods. Results are robust to the inclusion of theconstant term. Top left: realized volatility (RV). Top right: world uncertainty index (WUI) andeconomic policy uncertainty (EPU) index. Bottom left: implied volatility at three- and one-monthmaturities (IV3 and IV1). Bottom right: forecast dispersion (FD). See Section 2 in the main paperfor detailed description of uncertainty measures.
26 BENETRIX AND CURRAN
S4 Lagged Uncertainty Variables
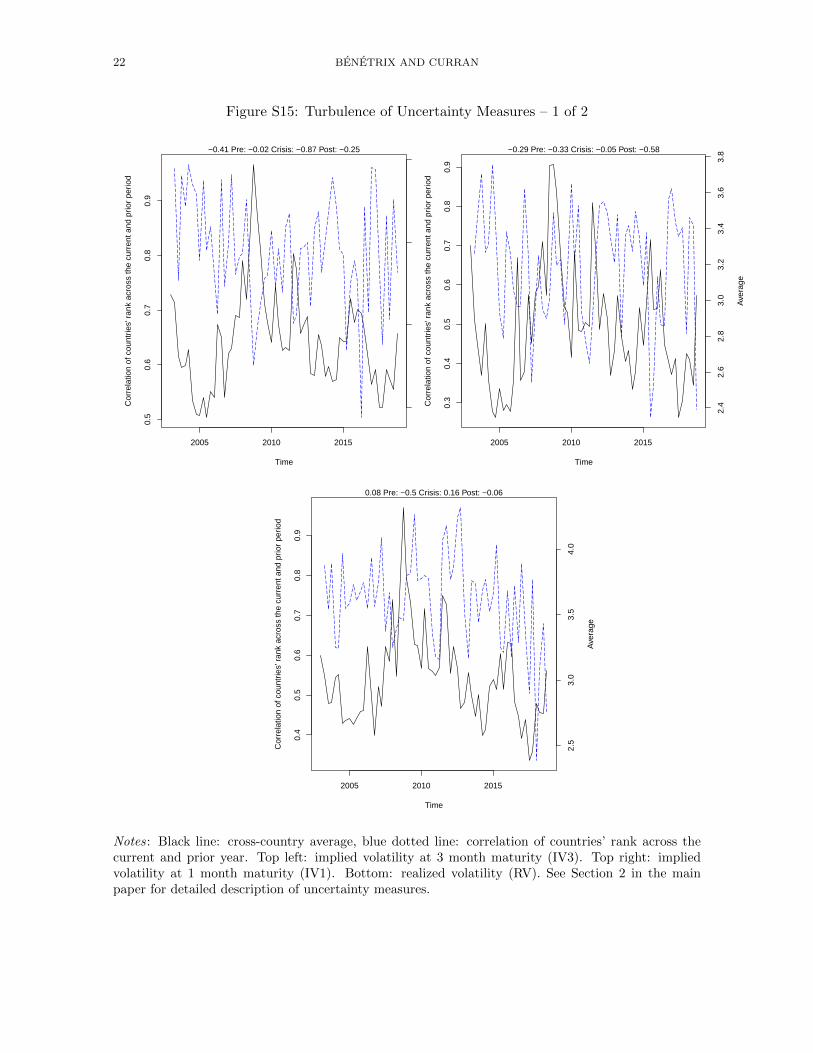
Figure S19: Bivariate models.Uncertainty measure: three-month implied volatility in t − 1.
BRA (R2=.97)TUR (R2=.99)IRL (R2=.97)
PRT (R2=.97)FRA (R2=.97)
BEL (R2=.9)GBR (R2=.93)
MG model (R2=.94)
Panel model (R2w=.96; R2b=1; R2o=1)
ITA (R2=.96)FIN (R2=.96)
CHE (R2=.87)USA (R2=.97)NLD (R2=.91)AUT (R2=.92)
CHL (R2=.95)CAN (R2=.98)ESP (R2=.91)SGP (R2=.97)SWE (R2=.87)
DEU (R2=.8)IND (R2=.98)AUS (R2=.98)DNK (R2=.89)
JPN (R2=.97)NOR (R2=.98)
0.2
.4.6
.81
Prop
ortio
n
-40 -30 -20 -10 0 10
BRA (R2=.97)TUR (R2=.99)IRL (R2=.98)
FRA (R2=.95)BEL (R2=.9)
PRT (R2=.98)
GBR (R2=.95)
MG model (R2=.92)Panel model (R2w=.94; R2b=1; R2o=.99)
AUT (R2=.87)
CHL (R2=.91)CHE (R2=.85)
ITA (R2=.9)ESP (R2=.95)SGP (R2=.95)
USA (R2=.95)SWE (R2=.84)IND (R2=.91)FIN (R2=.94)CAN (R2=.94)NLD (R2=.84)AUS (R2=.94)DEU (R2=.75)
JPN (R2=.96)DNK (R2=.82)
NOR (R2=.96)
0.2
.4.6
.81
Prop
ortio
n
-40 -30 -20 -10 0 10
BRA (R2=.68)AUS (R2=.82)
USA (R2=.96)
MG model (R2=.91)Panel model (R2w=.93; R2b=1; R2o=.99)
TUR (R2=.96)IRL (R2=.94)FIN (R2=.96)
DNK (R2=.92)BEL (R2=.93)
DEU (R2=.81)PRT (R2=.75)SWE (R2=.86)FRA (R2=.96)GBR (R2=.96)
NLD (R2=.96)SGP (R2=.96)CHE (R2=.96)
AUT (R2=.95)IND (R2=.98)NOR (R2=.96)
CAN (R2=.98)JPN (R2=.94)ESP (R2=.85)ITA (R2=.95)
CHL (R2=.81)
0.2
.4.6
.81
Prop
ortio
n
-40 -30 -20 -10 0 10
Notes: Point estimates from bivariate regression models from equation (1) in the paper for the log-level of cross-border bank liabilities vis-a-vis all all counterparties, banks, and non-banks. Theexplanatory variable is the logarithm of uncertainty lagged one quarter, captured by implied volatilitybased on three-month option prices. All models include a constant and the lagged dependent variable.In addition to country-specific regression models, these figures include the point estimates of bivariatemodels obtained from Pesaran and Smith (1995)’s mean group estimator and a panel model withcountry fixed effects. The size of these coefficients is measured on the x-axis. The vertical axis capturesthe proportion of countries in the cumulative distribution of coefficients. All models are estimatedusing the full time period: 2003Q1–2018Q4. Filled circles represent statistically significant coefficientestimates based on 2 standard deviation error bands. Country-specific estimates are identified withISO3 codes. R2s for each regression reported in parenthesis. For the mean group estimator, we reportthe average R2s across all countries. For the panel data model, we report within, between, and overallR2s.

UNCERTAINTY SHOCKS AND THE CROSS-BORDER FUNDING OF BANKS 27
Figure S20: Multivariate models.Uncertainty measure: one-month implied volatility in t-1.
BRA (R2=.98)
GBR (R2=.93)
Panel model (R2w=.96; R2b=1; R2o=1)
MG model (R2=.95)
SWE (R2=.88)IRL (R2=.98)NLD (R2=.91)
FRA (R2=.97)PRT (R2=.98)FIN (R2=.97)
TUR (R2=1)DNK (R2=.89)
DEU (R2=.82)
USA (R2=.97)NOR (R2=.98)CAN (R2=.98)SGP (R2=.97)ESP (R2=.92)IND (R2=.98)AUT (R2=.93)CHE (R2=.89)
BEL (R2=.93)JPN (R2=.97)ITA (R2=.97)AUS (R2=.98)
CHL (R2=.96)
0.2
.4.6
.81
Prop
ortio
n
-30 -20 -10 0 10
BRA (R2=.98)
Panel model (R2w=.94; R2b=1; R2o=.99)
AUS (R2=.94)
SWE (R2=.85)IRL (R2=.98)USA (R2=.96)PRT (R2=.99)
TUR (R2=.99)SGP (R2=.95)FRA (R2=.96)GBR (R2=.96)
CHE (R2=.87)DNK (R2=.83)IND (R2=.85)FIN (R2=.95)MG model (R2=.92)NOR (R2=.97)DEU (R2=.79)BEL (R2=.92)ITA (R2=.92)ESP (R2=.96)
CAN (R2=.95)JPN (R2=.96)
NLD (R2=.86)CHL (R2=.92)
AUT (R2=.88)
0.2
.4.6
.81
Prop
ortio
n
-30 -20 -10 0 10
AUS (R2=.8)
DEU (R2=.87)
GBR (R2=.96)
SWE (R2=.87)
BRA (R2=.67)DNK (R2=.93)
NLD (R2=.96)IRL (R2=.95)
NOR (R2=.97)FRA (R2=.97)MG model (R2=.92)
CAN (R2=.98)Panel model (R2w=.93; R2b=1; R2o=.99)
CHE (R2=.96)IND (R2=.98)
ITA (R2=.95)SGP (R2=.96)BEL (R2=.94)PRT (R2=.79)USA (R2=.97)ESP (R2=.86)JPN (R2=.95)CHL (R2=.84)AUT (R2=.95)
FIN (R2=.97)TUR (R2=.97)
0.2
.4.6
.81
Prop
ortio
n
-30 -20 -10 0 10
Notes: Point estimates from bivariate regression models from equation (1) in the paper for the log-levelof cross-border bank liabilities vis-a-vis all counterparties, banks, and non-banks. The explanatoryvariable is the logarithm of uncertainty lagged one quarter, captured by the EPU index. All modelsinclude a constant and the lagged dependent variable. In addition to country-specific regression models,these figures include the point estimates of bivariate models obtained from Pesaran and Smith (1995)’smean group estimator and a panel model with country fixed effects. The size of these coefficients ismeasured on the x-axis. The vertical axis captures the proportion of countries in the cumulativedistribution of coefficients. All models are estimated using the full time period: 2003Q1–2018Q4.Filled circles represent statistically significant coefficient estimates based on 2 standard deviation errorbands. Country-specific estimates are identified with ISO3 codes. R2s for each regression reported inparenthesis. For the mean group estimator, we report the average R2s across all countries. For thepanel data model, we report within, between, and overall R2s.

28 BENETRIX AND CURRAN
Figure S21: Bivariate models.Uncertainty measure: Economic Policy Uncertainty in t-1.
IRL (R2=.97)
NLD (R2=.92)
ITA (R2=.96)
MG model (R2=.94)
BRA (R2=.97)
Panel model (R2w=.96; R2b=1; R2o=1)
SWE (R2=.87)
CHL (R2=.95)
USA (R2=.97)
SGP (R2=.97)
DEU (R2=.81)
FRA (R2=.97)
ESP (R2=.91)
GBR (R2=.93)
AUS (R2=.98)
CAN (R2=.98)
IND (R2=.98)
JPN (R2=.97)
0.2
.4.6
.81
Prop
ortio
n
-.1 -.05 0 .05
NLD (R2=.85)
IRL (R2=.98)
ITA (R2=.91)
MG model (R2=.92)
FRA (R2=.95)
Panel model (R2w=.94; R2b=1; R2o=1)
GBR (R2=.95)
SWE (R2=.84)
BRA (R2=.97)
DEU (R2=.76)
ESP (R2=.95)
USA (R2=.95)
SGP (R2=.95)
CAN (R2=.94)
AUS (R2=.94)
CHL (R2=.91)
IND (R2=.91)
JPN (R2=.96)
0.2
.4.6
.81
Prop
ortio
n
-.1 -.05 0 .05
IRL (R2=.95)
AUS (R2=.81)
CHL (R2=.82)
USA (R2=.96)
DEU (R2=.82)
NLD (R2=.96)
MG model (R2=.9)
SGP (R2=.96)
ITA (R2=.95)
SWE (R2=.85)
Panel model (R2w=.89; R2b=1; R2o=.99)
ESP (R2=.85)
GBR (R2=.96)
IND (R2=.98)
BRA (R2=.65)
FRA (R2=.96)
CAN (R2=.98)
JPN (R2=.94)
0.2
.4.6
.81
Prop
ortio
n
-.1 -.05 0 .05
Notes: Point estimates from bivariate regression models from equation (1) in the paper for the log-levelof cross-border bank liabilities vis-a-vis all counterparties, banks, and non-banks. The explanatoryvariable is the logarithm of uncertainty lagged one quarter, captured by realized volatility. All modelsinclude a constant and the lagged dependent variable. In addition to country-specific regression models,these figures include the point estimates of bivariate models obtained from Pesaran and Smith (1995)’smean group estimator and a panel model with country fixed effects. The size of these coefficients ismeasured on the x-axis. The vertical axis captures the proportion of countries in the cumulativedistribution of coefficients. All models are estimated using the full time period: 2003Q1–2018Q4.Filled circles represent statistically significant coefficient estimates based on 2 standard deviation errorbands. Country-specific estimates are identified with ISO3 codes. R2s for each regression reported inparenthesis. For the mean group estimator, we report the average R2s across all countries. For thepanel data model, we report within, between, and overall R2s.

UNCERTAINTY SHOCKS AND THE CROSS-BORDER FUNDING OF BANKS 29
Figure S22: Multivariate models.Uncertainty measure: World Uncertainty Index in t-1.
ESP (R2=.93)
FIN (R2=.97)NOR (R2=.98)
TUR (R2=1)SWE (R2=.88)
CAN (R2=.98)ITA (R2=.97)
BRA (R2=.97)JPN (R2=.97)
CHL (R2=.96)AUS (R2=.98)Panel model (R2w=.96; R2b=1; R2o=1)MG model (R2=.95)IRL (R2=.98)PRT (R2=.98)
DNK (R2=.89)NLD (R2=.9)CHE (R2=.89)
DEU (R2=.82)AUT (R2=.93)BEL (R2=.93)USA (R2=.97)
FRA (R2=.97)
GBR (R2=.93)
0.2
.4.6
.81
Prop
ortio
n
-4 -2 0 2 4
NOR (R2=.97)SWE (R2=.85)
FIN (R2=.95)TUR (R2=.99)
CHL (R2=.92)CAN (R2=.95)
JPN (R2=.96)IRL (R2=.98)
BRA (R2=.98)MG model (R2=.92)
DEU (R2=.79)AUT (R2=.88)Panel model (R2w=.94; R2b=1; R2o=.99)
DNK (R2=.83)ITA (R2=.92)PRT (R2=.99)
BEL (R2=.92)CHE (R2=.87)
AUS (R2=.93)NLD (R2=.86)
ESP (R2=.96)GBR (R2=.96)USA (R2=.96)
FRA (R2=.96)
0.2
.4.6
.81
Prop
ortio
n
-4 -2 0 2 4
FIN (R2=.97)PRT (R2=.8)
NOR (R2=.97)SWE (R2=.86)
IRL (R2=.95)BRA (R2=.67)
TUR (R2=.97)AUT (R2=.95)
Panel model (R2w=.93; R2b=1; R2o=.99)JPN (R2=.95)CHE (R2=.96)CAN (R2=.98)USA (R2=.97)DNK (R2=.93)MG model (R2=.92)
NLD (R2=.96)DEU (R2=.85)
BEL (R2=.94)ITA (R2=.95)
AUS (R2=.77)GBR (R2=.96)FRA (R2=.97)
ESP (R2=.87)CHL (R2=.84)
0.2
.4.6
.81
Prop
ortio
n
-4 -2 0 2 4
Notes: Point estimates from bivariate regression models from equation (1) in the paper for the log-levelof cross-border bank liabilities vis-a-vis all counterparties, banks, and non-banks. The explanatoryvariable is the logarithm of uncertainty lagged one quarter, captured by the World Uncertainty Index(WUI). All models include a constant and the lagged dependent variable. In addition to country-specificregression models, these figures include the point estimates of bivariate models obtained from Pesaranand Smith (1995)’s mean group estimator and a panel model with country fixed effects. The size ofthese coefficients is measured on the x-axis. The vertical axis captures the proportion of countriesin the cumulative distribution of coefficients. All models are estimated using the full time period:2003Q1–2018Q4. Filled circles represent statistically significant coefficient estimates based on 2 stan-dard deviation error bands. Country-specific estimates are identified with ISO3 codes. R2s for eachregression reported in parenthesis. For the mean group estimator, we report the average R2s acrossall countries. For the panel data model, we report within, between, and overall R2s.
30 BENETRIX AND CURRAN
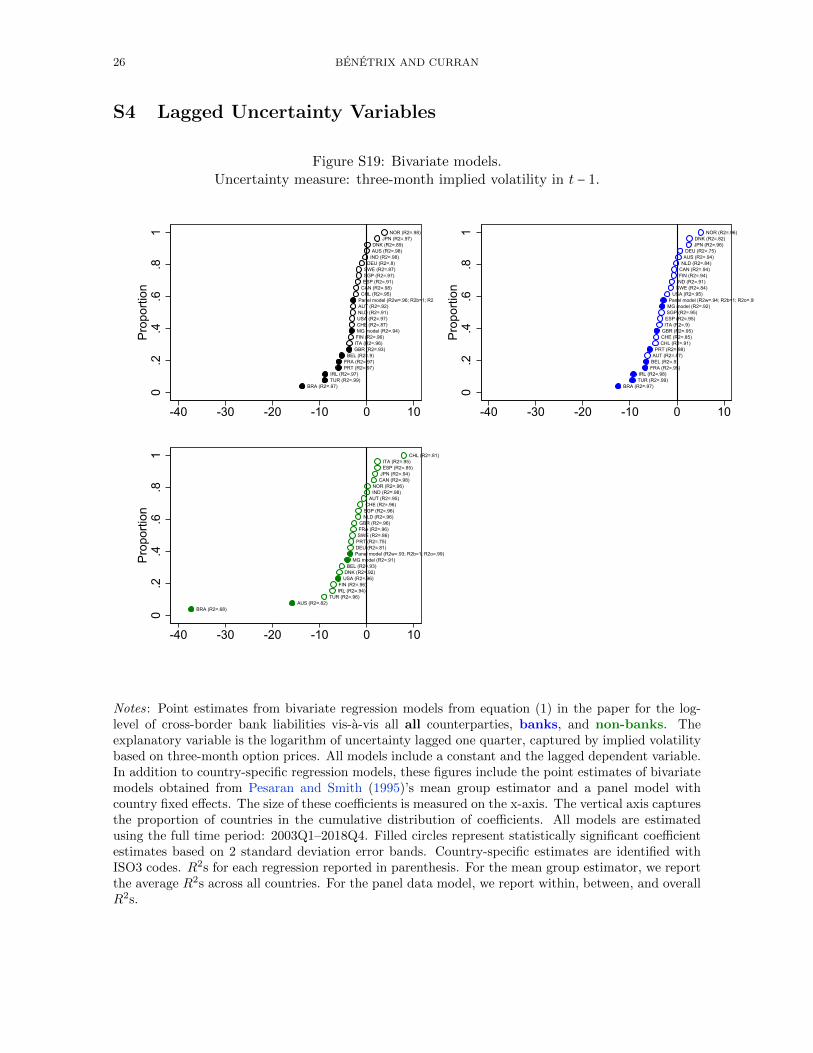
Figure S23: Multivariate models.Uncertainty measure: Forecast Dispersion in t-1.
ESP (R2=.93)
FIN (R2=.97)NOR (R2=.98)
TUR (R2=1)SWE (R2=.88)
CAN (R2=.98)ITA (R2=.97)
BRA (R2=.97)JPN (R2=.97)
CHL (R2=.96)AUS (R2=.98)Panel model (R2w=.96; R2b=1; R2o=1)MG model (R2=.95)IRL (R2=.98)PRT (R2=.98)
DNK (R2=.89)NLD (R2=.9)CHE (R2=.89)
DEU (R2=.82)AUT (R2=.93)BEL (R2=.93)USA (R2=.97)
FRA (R2=.97)
GBR (R2=.93)
0.2
.4.6
.81
Prop
ortio
n
-4 -2 0 2 4
NOR (R2=.97)SWE (R2=.85)
FIN (R2=.95)TUR (R2=.99)
CHL (R2=.92)CAN (R2=.95)
JPN (R2=.96)IRL (R2=.98)
BRA (R2=.98)MG model (R2=.92)
DEU (R2=.79)AUT (R2=.88)Panel model (R2w=.94; R2b=1; R2o=.99)
DNK (R2=.83)ITA (R2=.92)PRT (R2=.99)
BEL (R2=.92)CHE (R2=.87)
AUS (R2=.93)NLD (R2=.86)
ESP (R2=.96)GBR (R2=.96)USA (R2=.96)
FRA (R2=.96)
0.2
.4.6
.81
Prop
ortio
n
-4 -2 0 2 4
FIN (R2=.97)PRT (R2=.8)
NOR (R2=.97)SWE (R2=.86)
IRL (R2=.95)BRA (R2=.67)
TUR (R2=.97)AUT (R2=.95)
Panel model (R2w=.93; R2b=1; R2o=.99)JPN (R2=.95)CHE (R2=.96)CAN (R2=.98)USA (R2=.97)DNK (R2=.93)MG model (R2=.92)
NLD (R2=.96)DEU (R2=.85)
BEL (R2=.94)ITA (R2=.95)
AUS (R2=.77)GBR (R2=.96)FRA (R2=.97)
ESP (R2=.87)CHL (R2=.84)
0.2
.4.6
.81
Prop
ortio
n
-4 -2 0 2 4
Notes: Point estimates from bivariate regression models from equation (1) in the paper for the log-levelof cross-border bank liabilities vis-a-vis all counterparties, banks, and non-banks. The explanatoryvariable is the logarithm of uncertainty lagged one quarter, captured by the professional forecastsurvey dispersion (FD). All models include a constant and the lagged dependent variable. In additionto country-specific regression models, these figures include the point estimates of bivariate modelsobtained from Pesaran and Smith (1995)’s mean group estimator and a panel model with countryfixed effects. The size of these coefficients is measured on the x-axis. The vertical axis capturesthe proportion of countries in the cumulative distribution of coefficients. All models are estimatedusing the full time period: 2003Q1–2018Q4. Filled circles represent statistically significant coefficientestimates based on 2 standard deviation error bands. Country-specific estimates are identified withISO3 codes. R2s for each regression reported in parenthesis. For the mean group estimator, we reportthe average R2s across all countries. For the panel data model, we report within, between, and overallR2s.

UNCERTAINTY SHOCKS AND THE CROSS-BORDER FUNDING OF BANKS 31
References
Pesaran, M. H. and Smith, R. (1995). Estimating Long-Run Relationships from DynamicHeterogeneous Panels. Journal of Econometrics, 68 (1), 79–113.
Top Related