


Languages
Pages
Legal


8/7/2019 ufr present mizah
http://slidepdf.com/reader/full/ufr-present-mizah 1/9

8/7/2019 ufr present mizah
http://slidepdf.com/reader/full/ufr-present-mizah 2/9
If the ratio is more than one , the
company be considers in good condition.
Cash interest cover for HSIB is increasesfrom year to year.
2007 is 1582.76 times
2008 is 2622.23 times
2009 is 64746.68 times
HSIB good : small number of interestpayment.
HTIB : great amount of interest payment.
It shows that HTIB not has propermana gement.
CASH INTEREST COVER
Times

8/7/2019 ufr present mizah
http://slidepdf.com/reader/full/ufr-present-mizah 3/9
HSIB : N ot efficient in assets utilisation.
Even it keep increases.
COMPAREHTIB: Good to be skilled in assets
utilisation.
Good fixed asset turnover ratio .
F IXED ASSET TURNOVER(sales / non-current assets)

8/7/2019 ufr present mizah
http://slidepdf.com/reader/full/ufr-present-mizah 4/9
Increasin g from 2007 - 2009
2007 (worst)
: 4.14%
: Lower net profit after taxation
2008 & 2009:
: Net profit increases
because increased of sales.
(ROSF)Return on Ordinary Shareholders¶ Funds
Percentage, %
Year

8/7/2019 ufr present mizah
http://slidepdf.com/reader/full/ufr-present-mizah 5/9
ROCE: Earning sufficient revenue & profitfor maximise capital assets usage
HSIB
2007 (worst)
bad business performancelower operating profit ($ 6,131,3 09 )material cost was rising
2009 (highest)
buy raw material & other goods at theche ap er price.
HTIB : p ricey raw material.
(ROCE)Return on Capital Employed
%
Year

8/7/2019 ufr present mizah
http://slidepdf.com/reader/full/ufr-present-mizah 6/9
Net Profit MarginHSIB- Increases- Improvement in controlling cost
2009: lower revenueconsumer spending is affected byeconomic crisisstiff competition between competitors
2008 > 2009 : Cost and inputs controlprecisely .
high ratio : attract investor & satisfycurrent shareholders .
HTIB: expenses > sale.: bad control on expenses: poor operating pricing
8/7/2019 ufr present mizah
http://slidepdf.com/reader/full/ufr-present-mizah 7/9
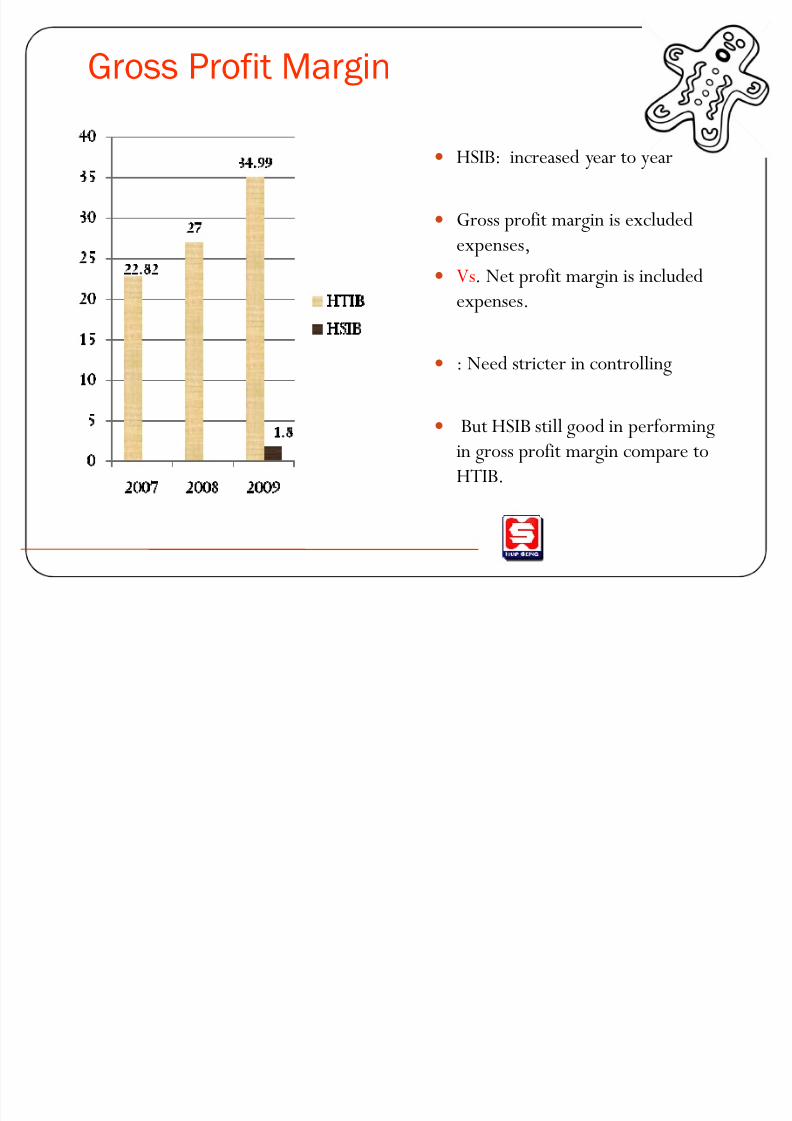
G ross Profit Margin
y HSIB: increased year to year
y Gross profit margin is excludedexpenses,
y Vs. Net profit margin is includedexpenses.
y : Need stricter in controlling
y But HSIB still good in performingin gross profit margin compare toHTIB.

8/7/2019 ufr present mizah
http://slidepdf.com/reader/full/ufr-present-mizah 8/9
HSIB should not pay their dividend at the greater rate than their net profit.
They should keep that money as the retained earnin gs & use the money forresearch and development or clear those outstandin g debts.
It is not a sustainable condition if the ratio exceeds 100%.
Expenses is plan wisely.
Observation and strict control needed for accuracy .
Research for a lower price raw material from suppliersFor reduction of wasta ge = net cash or quantity of profit induction.
The strict control on credit term of trade payment from receivables should be keepcontinue for HSIB.
To minimize the over credit risk by down the amount of bad debt.
RECOMENDATION

8/7/2019 ufr present mizah
http://slidepdf.com/reader/full/ufr-present-mizah 9/9
Based on our opinion:
Hup Seng Industries Berhad (HSIB) is greater than HwaTai Industries Berhad(HTIB).
HSIB : whelming result in profitability, gearing, and liquidity.
HTIB: good in some cash flow and efficiency.
o So, HSIB s financial for the company in 2007 until 2009 is quick performing betterthan HTIB
However, limitation of HSIB must be taken in count.
CONCLUSIONCONCLUSION
CONCLU SION
Top Related