


Languages
Pages
Legal

TCT 2012 | Miami, FL | October 24, 2012
Three-Year Outcomes of Transcatheter Aortic Valve Replacement (TAVR) in “Inoperable” Patients With Severe Aortic Stenosis: The PARTNER Trial
Samir R. Kapadia, MD On behalf of The PARTNER Trial Investigators
Background (1)
• Transcatheter aortic valve replacement (TAVR) is
the recommended treatment for “inoperable”
patients with severe aortic stenosis (AS), based
upon 1-year results of The PARTNER Trial which
demonstrated reduced mortality and improved
quality of life.
• However, whether clinical benefit and valve
performance are sustained beyond two years
is unknown and longer term outcomes will
importantly alter clinical practice decisions.

Background (2)

Objectives
• To evaluate the clinical outcomes of TAVR
compared to standard therapy at 3 years in
“inoperable” aortic stenosis patients.
• To assess valve hemodynamics and durability
using echocardiography.
• To perform subgroup analyses to better define
the impact of co-morbidities on outcomes.

PARTNER Study Design
n = 358 Inoperable
Standard
Therapy
n = 179
ASSESSMENT:
Transfemoral
Access
TF TAVR
n = 179
Primary Endpoint: All-Cause Mortality
Over Length of Trial (Superiority)
1:1 Randomization
VS
Symptomatic Severe Aortic Stenosis
• Primary endpoint evaluated when all patients reached one year follow-up.
• After primary endpoint analysis reached, patients were allowed to cross-over to TAVR.

Inclusion Criteria
• Severe calcific aortic stenosis defined as echo
derived valve area of < 0.8 cm2 (EOA index
< 0.5 cm2/m2), and mean gradient > 40 mmHg
or jet velocity > 4.0 m/s.
• NYHA functional class ≥ II
• Inoperable defined as risk of death or serious
irreversible morbidity of AVR as assessed by
cardiologist and two surgeons exceeding 50%.
Key End-Points for 3 Year Analysis
• All cause mortality
• Cardiac mortality
• Rehospitalization
• Adverse outcomes including stroke, bleeding,
renal failure, and MI
• NYHA functional class
• Days alive and out of hospital
• Echo-derived valve areas, transvalvular gradients,
and paravalvular aortic regurgitation
• Mortality outcomes stratified by STS score

n = 358
Randomized Inoperable
n = 179
TAVR
n = 179
Standard Therapy
124/124 patients 100% followed at 1 Yr
85/85 patients 100% followed at 1 Yr
101/102 patients* 99.0% followed at 2 Yr
46/46 patients 100% followed at 2 Yr
Study Flow Inoperable Cohort
• *One TAVR patient was alive and censored prior to the window
• **Two TAVR patients were alive and censored prior to the window (including the one in the same status at 2 years); one TAVR patient withdrew between 2 and 3 years
• No patients were lost to follow-up
80/82 patients** 97.6% followed at 3 Yr
19/19 patients 100% followed at 3 Yr
Cross over
11 pts
Cross over
9 pts
Statistical Method
• Primary analysis was by “intention-to-treat” (ITT).
• Clinical outcomes were analyzed by ITT with
censoring of Standard Rx cross-over patients.
• Additional analysis of death was performed by
following cross-over patients with their randomized
trial arms.
• Event rates are given as Kaplan-Meier estimates.
• Core lab echo results are presented from
the valve implant population (valve retained
in position).

Patient Characteristics (1)
Characteristic TAVR n = 179
Standard Rx n = 179
p value
Age – yr 83.1 ± 8.6 83.2 ± 8.3 0.95
Male sex (%) 45.8 46.9 0.92
STS Score 11.2 ± 5.8 12.1 ± 6.1 0.14
NYHA
I or II (%)
III or IV (%)
7.8
92.2
6.1
93.9
0.68
0.68
CAD (%) 67.6 74.3 0.20
Prior MI (%) 18.6 26.4 0.10
Prior CABG (%) 37.4 45.6 0.17
Prior PCI (%) 30.5 24.8 0.31
Prior BAV (%) 16.2 24.4 0.09
CVD (%) 27.4 27.5 1.00
Note: Same as previously presented at TCT 2010 and published in the NEJM manuscript.
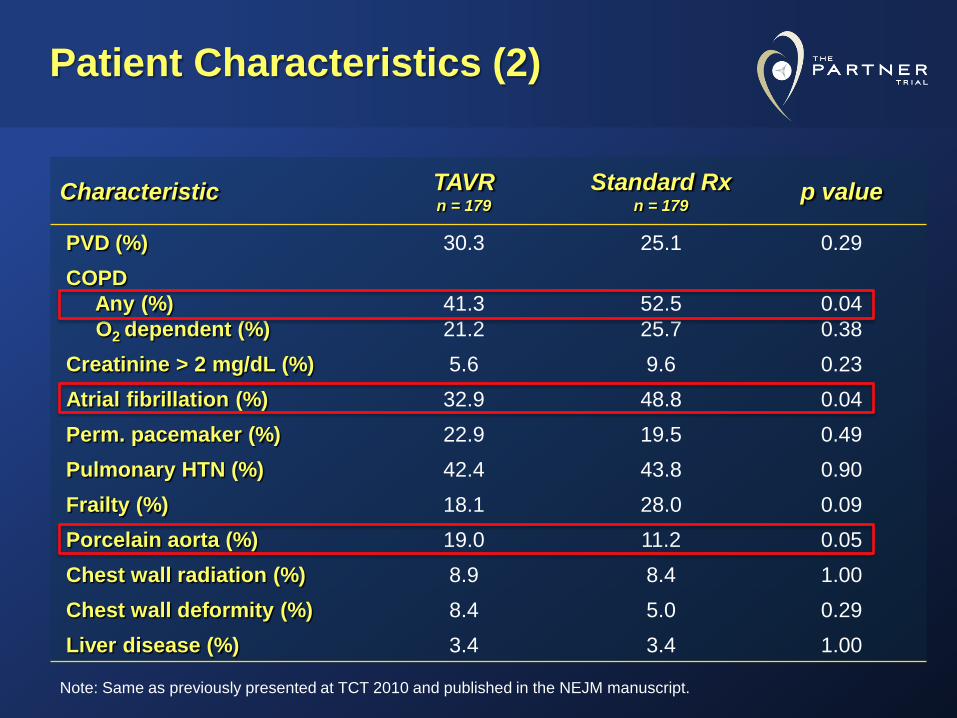
Patient Characteristics (2)
Characteristic TAVR n = 179
Standard Rx n = 179
p value
PVD (%) 30.3 25.1 0.29
COPD
Any (%)
O2 dependent (%)
41.3
21.2
52.5
25.7
0.04
0.38
Creatinine > 2 mg/dL (%) 5.6 9.6 0.23
Atrial fibrillation (%) 32.9 48.8 0.04
Perm. pacemaker (%) 22.9 19.5 0.49
Pulmonary HTN (%) 42.4 43.8 0.90
Frailty (%) 18.1 28.0 0.09
Porcelain aorta (%) 19.0 11.2 0.05
Chest wall radiation (%) 8.9 8.4 1.00
Chest wall deformity (%) 8.4 5.0 0.29
Liver disease (%) 3.4 3.4 1.00
Note: Same as previously presented at TCT 2010 and published in the NEJM manuscript.
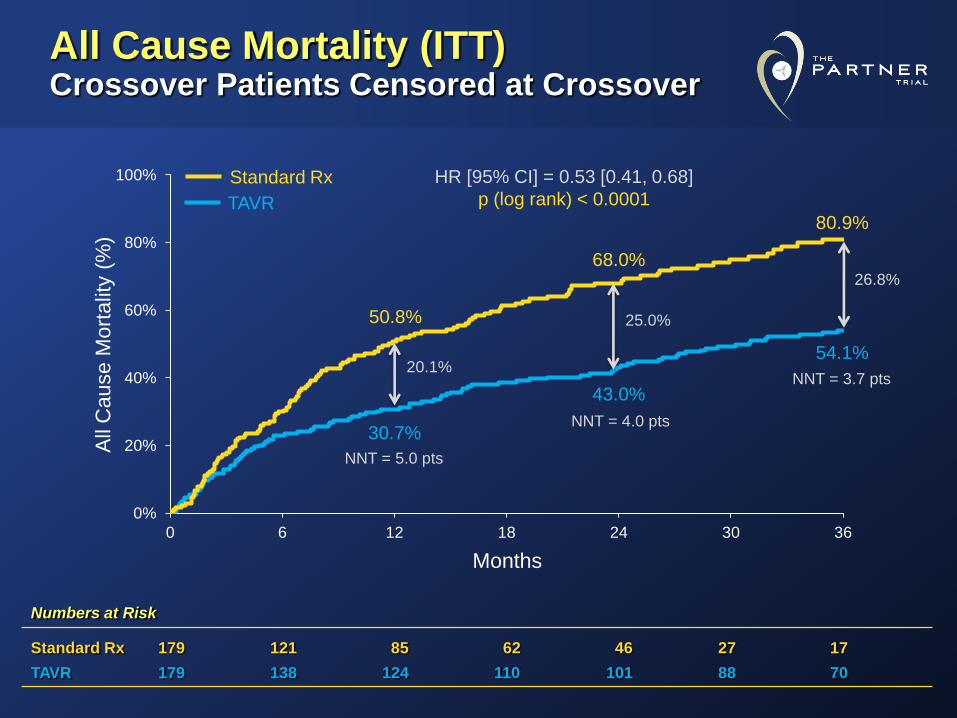
Numbers at Risk
Standard Rx 179 121 85 62 46 27 17
TAVR 179 138 124 110 101 88 70
All Cause Mortality (ITT) Crossover Patients Censored at Crossover
0%
20%
40%
60%
80%
100%
0 6 12 18 24 30 36
30.7%
50.8%
43.0%
68.0%
54.1%
80.9%
All
Cause M
ort
alit
y (
%)
Months
HR [95% CI] = 0.53 [0.41, 0.68]
p (log rank) < 0.0001
20.1%
25.0%
26.8%
NNT = 5.0 pts
NNT = 4.0 pts
NNT = 3.7 pts
Standard Rx
TAVR

Cardiovascular Mortality (ITT) Crossover Patients Censored at Crossover
0%
20%
40%
60%
80%
100%
0 6 12 18 24 30 36
20.5%
44.6%
30.7%
62.4%
41.4%
74.5%
Card
iovascula
r M
ort
alit
y (
%)
Numbers at Risk
Standard Rx 179 121 85 62 46 27 17
TAVR 179 138 124 110 101 88 70
Months
HR [95% CI] = 0.41 [0.30, 0.56]
p (log rank) < 0.0001
24.1%
31.7%
33.1%
NNT = 4.1 pts
NNT = 3.2 pts
NNT = 3.0 pts
Standard Rx
TAVR
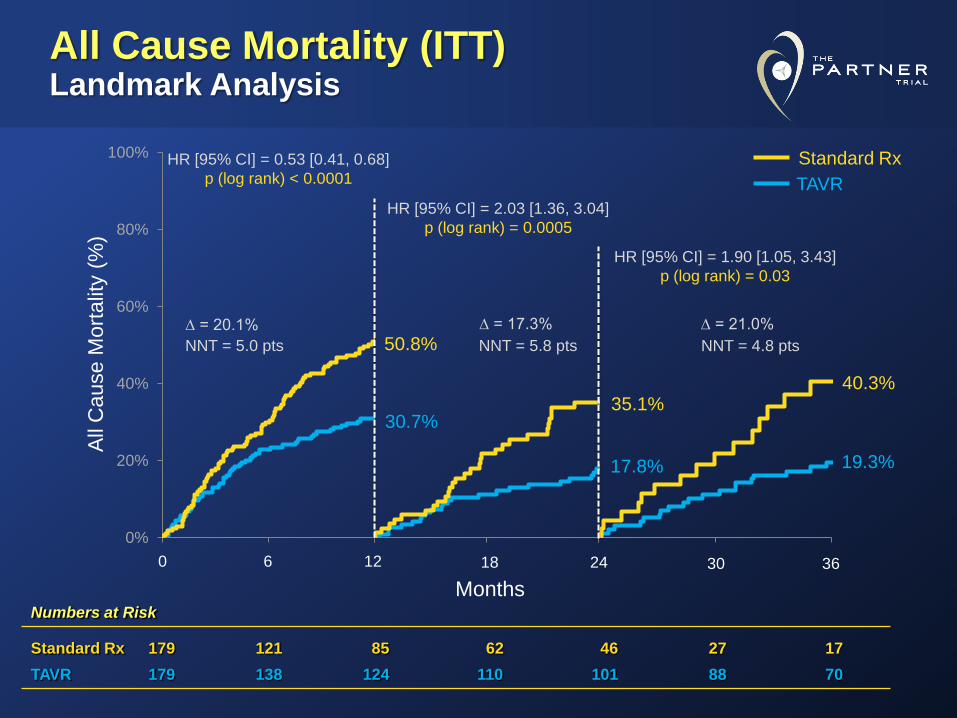
0%
20%
40%
60%
80%
100%
Months Numbers at Risk
Standard Rx 179 121 85 62 46 27 17
TAVR 179 138 124 110 101 88 70
0 6 12 18 24 30 36
All Cause Mortality (ITT) Landmark Analysis
30.7%
50.8%
17.8%
35.1%
19.3%
40.3%
All
Cause M
ort
alit
y (
%)
HR [95% CI] = 1.90 [1.05, 3.43]
p (log rank) = 0.03
HR [95% CI] = 2.03 [1.36, 3.04]
p (log rank) = 0.0005
HR [95% CI] = 0.53 [0.41, 0.68]
p (log rank) < 0.0001
∆ = 20.1% ∆ = 17.3% ∆ = 21.0%
NNT = 5.0 pts NNT = 5.8 pts NNT = 4.8 pts
Standard Rx
TAVR
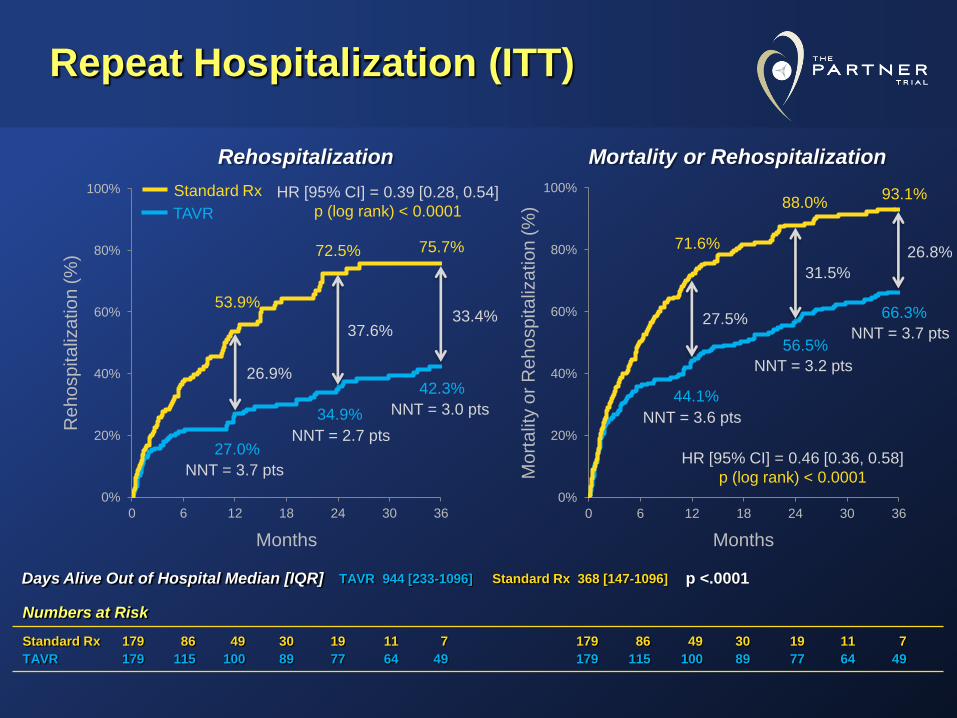
Repeat Hospitalization (ITT)
0%
20%
40%
60%
80%
100%
0 6 12 18 24 30 36
0%
20%
40%
60%
80%
100%
0 6 12 18 24 30 36
53.9%
27.0%
72.5%
34.9%
75.7%
42.3%
71.6%
44.1%
88.0%
56.5%
93.1%
66.3%
Numbers at Risk
Standard Rx 179 86 49 30 19 11 7 179 86 49 30 19 11 7
TAVR 179 115 100 89 77 64 49 179 115 100 89 77 64 49
Months Months
Re
ho
sp
ita
liza
tio
n (
%)
Mo
rta
lity o
r R
eh
osp
ita
liza
tion
(%
)
Rehospitalization Mortality or Rehospitalization
Standard Rx
TAVR
33.4%
HR [95% CI] = 0.39 [0.28, 0.54]
p (log rank) < 0.0001
NNT = 3.7 pts
NNT = 2.7 pts
NNT = 3.0 pts NNT = 3.6 pts
NNT = 3.2 pts
NNT = 3.7 pts 37.6%
26.9%
26.8%
31.5%
27.5%
HR [95% CI] = 0.46 [0.36, 0.58]
p (log rank) < 0.0001
TAVR 944 [233-1096] Standard Rx 368 [147-1096] p <.0001 Days Alive Out of Hospital Median [IQR]
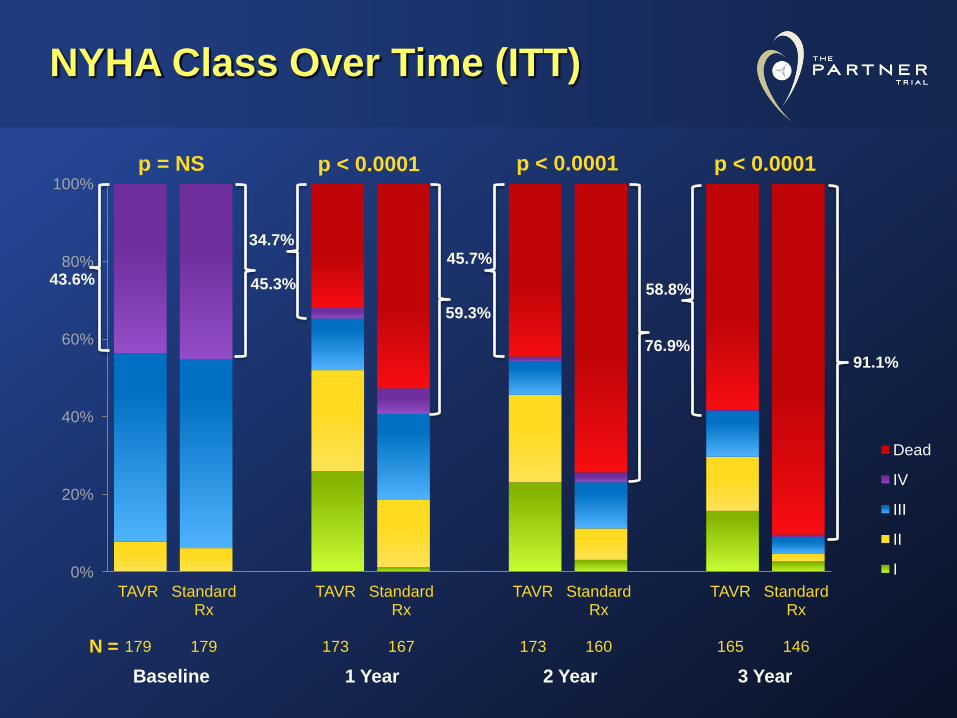
NYHA Class Over Time (ITT)
0%
20%
40%
60%
80%
100%
TAVR
179
Standard Rx
179
TAVR
173
Standard Rx
167
TAVR
173
Standard Rx
160
TAVR
165
Standard Rx
146
Dead
IV
III
II
I
Baseline 1 Year 2 Year 3 Year
p < 0.0001
N =
p = NS p < 0.0001 p < 0.0001
58.8%
91.1%
45.7%
76.9%
34.7%
59.3%
43.6% 45.3%
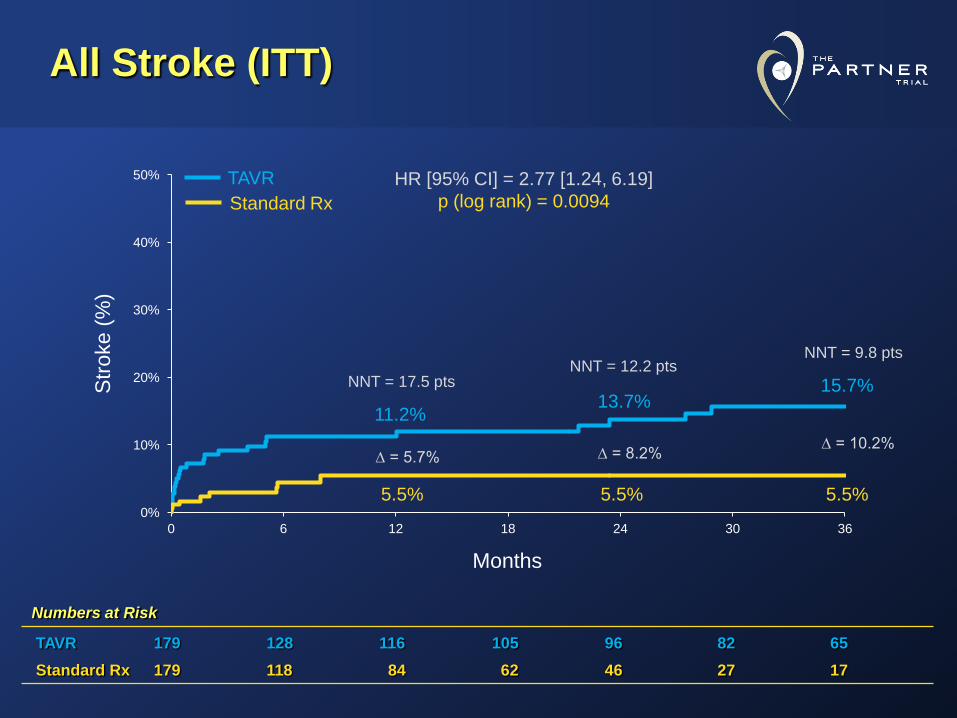
All Stroke (ITT)
0%
10%
20%
30%
40%
50%
0 6 12 18 24 30 36
5.5%
11.2%
5.5%
13.7%
5.5%
15.7% Str
oke (
%)
Months
HR [95% CI] = 2.77 [1.24, 6.19]
p (log rank) = 0.0094
∆ = 5.7%
NNT = 17.5 pts NNT = 12.2 pts
NNT = 9.8 pts
∆ = 8.2% ∆ = 10.2%
Standard Rx
TAVR
Numbers at Risk
TAVR 179 128 116 105 96 82 65
Standard Rx 179 118 84 62 46 27 17
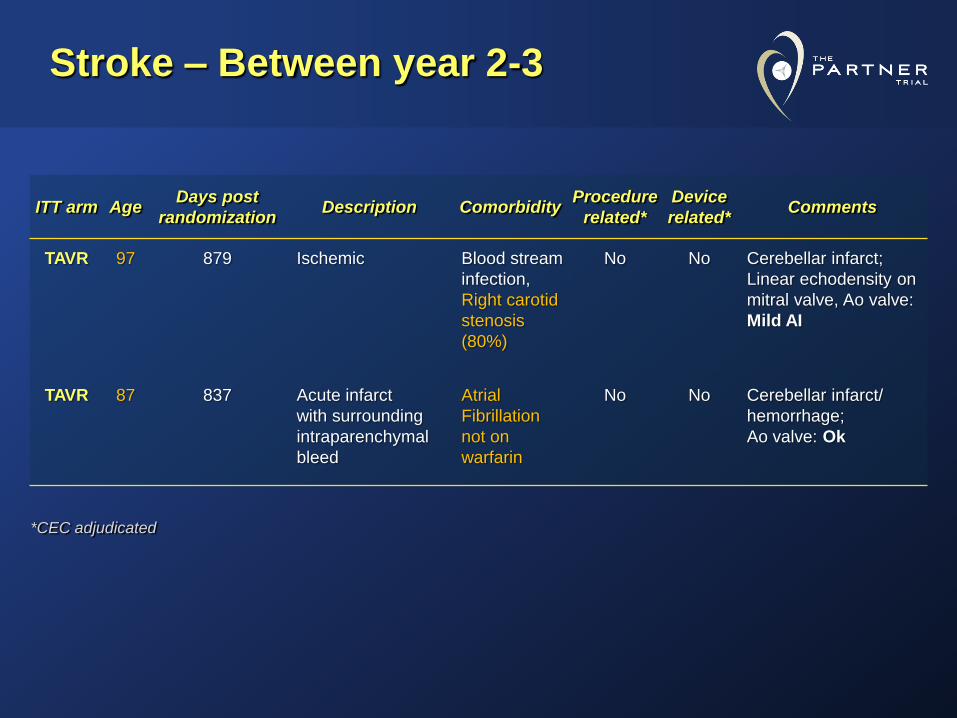
Stroke – Between year 2-3
ITT arm Age Days post
randomization Description Comorbidity
Procedure
related*
Device
related* Comments
TAVR 97 879 Ischemic Blood stream
infection,
Right carotid
stenosis
(80%)
No No Cerebellar infarct;
Linear echodensity on
mitral valve, Ao valve:
Mild AI
TAVR 87 837 Acute infarct
with surrounding
intraparenchymal
bleed
Atrial
Fibrillation
not on
warfarin
No No Cerebellar infarct/
hemorrhage;
Ao valve: Ok
*CEC adjudicated
Numbers at Risk
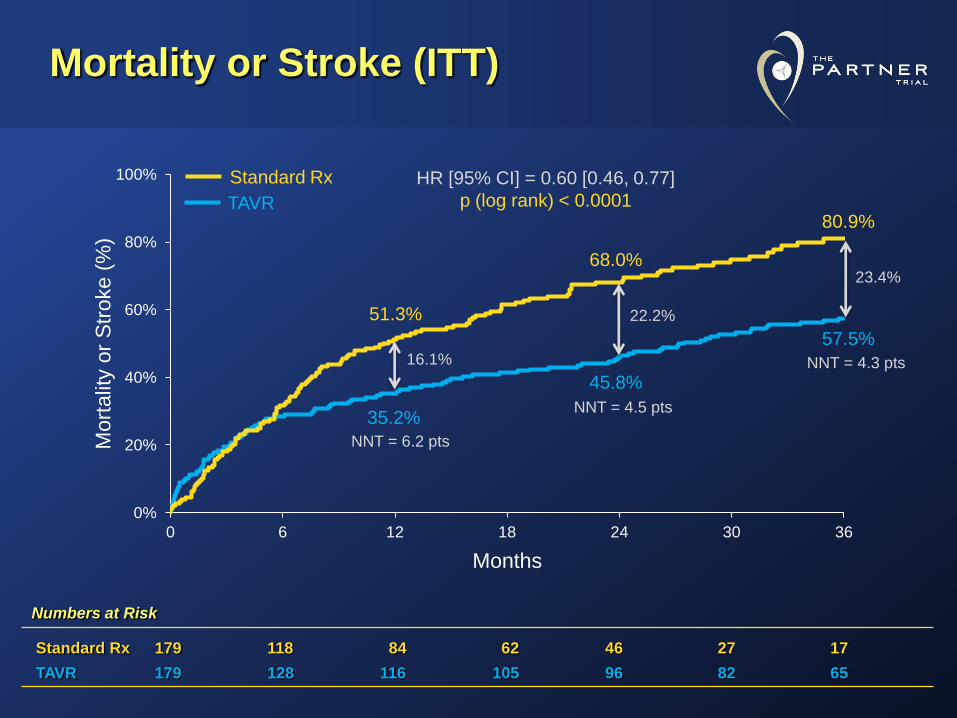
Standard Rx 179 118 84 62 46 27 17
TAVR 179 128 116 105 96 82 65
Mortality or Stroke (ITT)
0%
20%
40%
60%
80%
100%
0 6 12 18 24 30 36
51.3%
35.2%
45.8%
57.5%
68.0%
80.9%
Mort
alit
y o
r S
troke (
%)
Months
HR [95% CI] = 0.60 [0.46, 0.77]
p (log rank) < 0.0001
16.1%
22.2%
23.4%
NNT = 6.2 pts
NNT = 4.5 pts
NNT = 4.3 pts
Standard Rx
TAVR
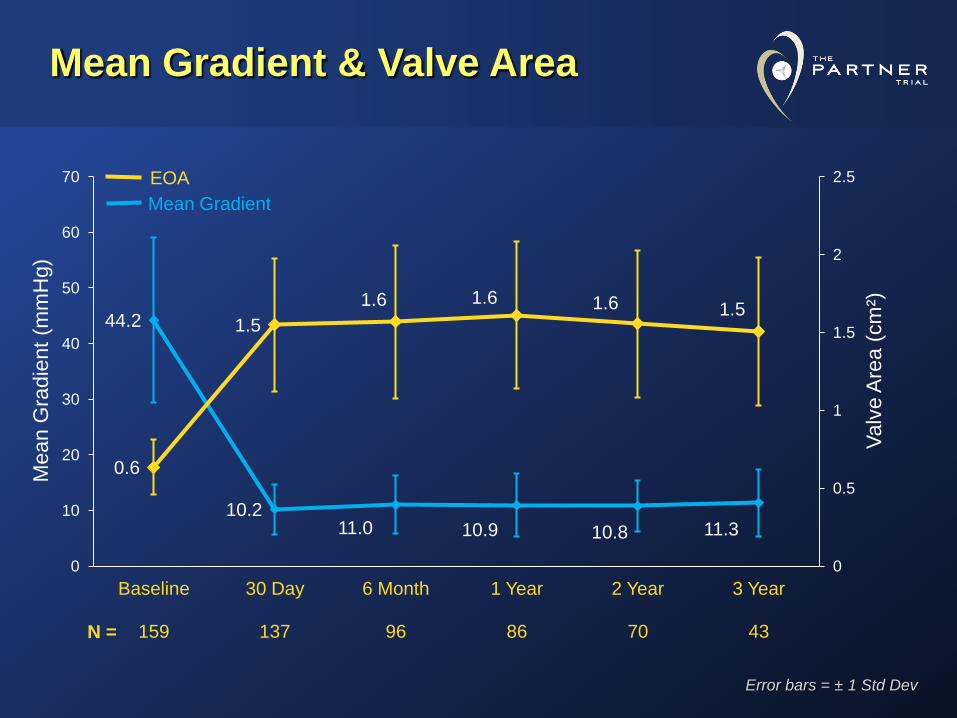
Mean Gradient & Valve Area
44.2
10.2 11.0 10.9 10.8 11.3
0.6
1.5
1.6 1.6 1.6 1.5
0
0.5
1
1.5
2
2.5
0
10
20
30
40
50
60
70
Baseline
159
30 Day
137
6 Month
96
1 Year
86
2 Year
70
3 Year
43
Mean G
radie
nt
(mm
Hg)
EOA
Mean Gradient
Valv
e A
rea (
cm
²)
N =
Error bars = ± 1 Std Dev

Paravalvular Leak
0%
20%
40%
60%
80%
100%
30 Day
44
6 Month
45
1 Year
44
2 Year
45
3 Year
46
Valve Implant Patients (restricted to patients with 3 year values)
Severe
Moderate
Mild
Trace
None
Perc
ent of
evalu
able
echos
N =
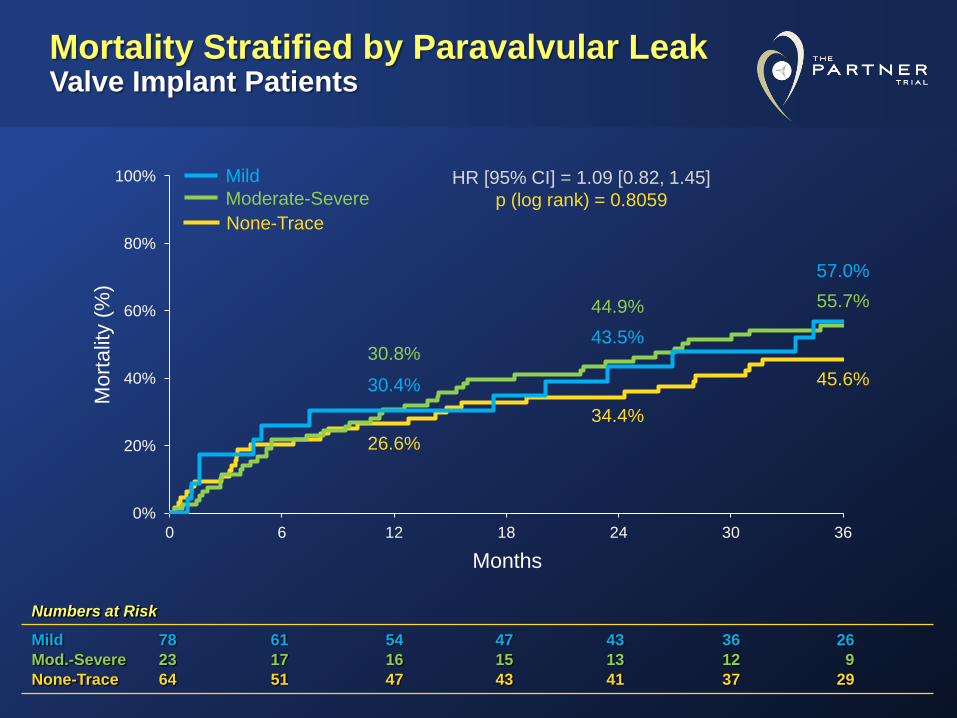
Numbers at Risk
Mild 78 61 54 47 43 36 26
Mod.-Severe 23 17 16 15 13 12 9
None-Trace 64 51 47 43 41 37 29
Mortality Stratified by Paravalvular Leak Valve Implant Patients
0%
20%
40%
60%
80%
100%
0 6 12 18 24 30 36
26.6%
30.8%
30.4%
34.4%
43.5%
44.9%
45.6%
55.7%
57.0%
None-Trace
Moderate-Severe
Mild
Mort
alit
y (
%)
Months
HR [95% CI] = 1.09 [0.82, 1.45]
p (log rank) = 0.8059
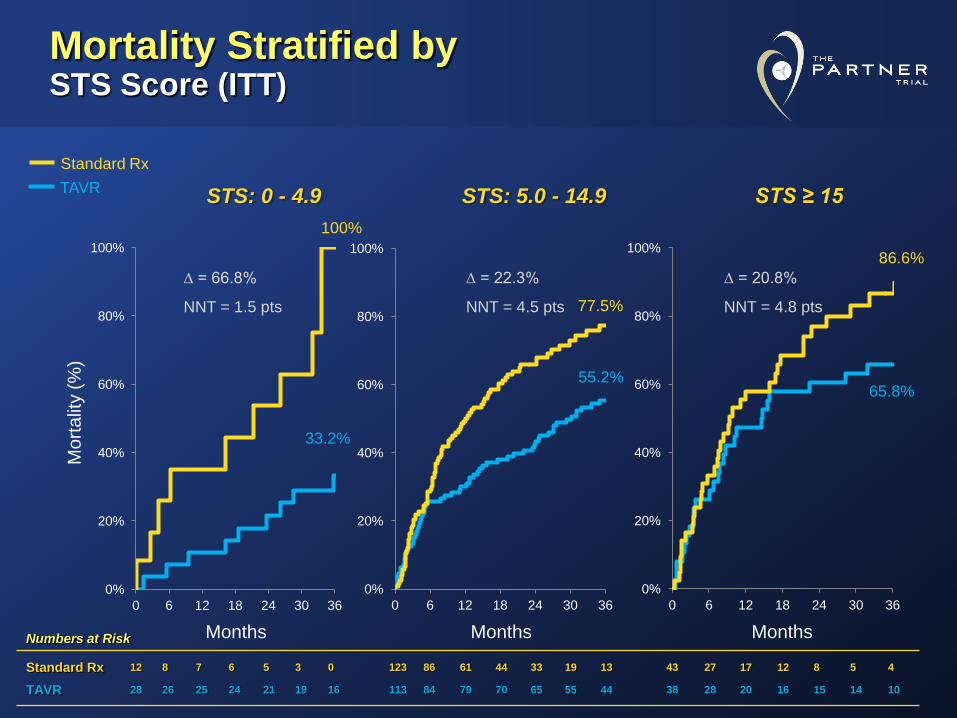
Mortality Stratified by STS Score (ITT)
0%
20%
40%
60%
80%
100%
0 6 12 18 24 30 36
0%
20%
40%
60%
80%
100%
0 6 12 18 24 30 36
0%
20%
40%
60%
80%
100%
0 6 12 18 24 30 36
Mo
rta
lity (
%)
Months Months Months
STS: 0 - 4.9 STS: 5.0 - 14.9 STS ≥ 15
Standard Rx
TAVR
∆ = 66.8%
NNT = 1.5 pts NNT = 4.5 pts NNT = 4.8 pts
∆ = 20.8% ∆ = 22.3%
Numbers at Risk
Standard Rx 12 8 7 6 5 3 0 123 86 61 44 33 19 13 43 27 17 12 8 5 4
TAVR 28 26 25 24 21 19 16 113 84 79 70 65 55 44 38 28 20 16 15 14 10
100%
33.2%
86.6%
65.8% 55.2%
77.5%
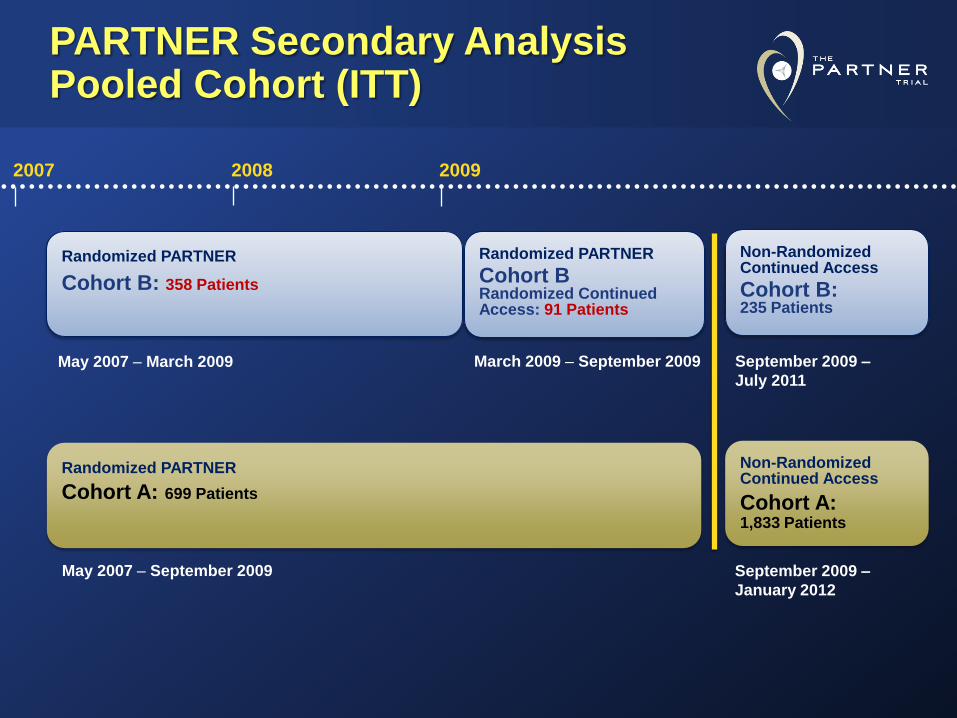
Non-Randomized Continued Access
Cohort B: 235 Patients
Randomized PARTNER
Cohort A: 699 Patients
May 2007 – September 2009
PARTNER Secondary Analysis Pooled Cohort (ITT)
Randomized PARTNER
Cohort B: 358 Patients
2007 2008 2009
Randomized PARTNER
Cohort B Randomized Continued Access: 91 Patients
May 2007 – March 2009 March 2009 – September 2009
September 2009 –
January 2012
Non-Randomized Continued Access
Cohort A: 1,833 Patients
September 2009 –
July 2011

Primary Outcome (Composite) All Cause Mortality

Conclusions (1)
• At 3 years follow-up benefits of TAVR were
sustained as measured by:
– All cause mortality
– Cardiovascular mortality
– Repeat hospitalization
– Functional status
• Valve durability was demonstrated with no increase
in transvalvular gradient or attrition of valve area.
• Detailed analysis of all randomized inoperable
patients showed consistent results for all outcomes.

Conclusions (2)
• Survival benefit of TAVR is dependent on the
presence of comorbid illness.
• Without TAVR, mortality is similar irrespective
of comorbid illness.
Clinical Implications
• Three year data continue to support the role of
TAVR as the standard-of-care for symptomatic
patients with aortic stenosis who are not surgical
candidates.
• These data underscore the importance of patient
selection before TAVR and the need for
aggressive management of illnesses after TAVR.

Thank You to the Dedicated Study Teams at All PARTNER Investigational Sites

Backup Slides

n = 358
Randomized Inoperable
n = 179
TAVR
n = 179
Standard Therapy
124/124 patients 100% followed at 1 Yr
85/85 patients 100% followed at 1 Yr
101/102 patients* 99.0% followed at 2 Yr
56/56 patients 100% followed at 2 Yr
Study Flow Inoperable Cohort – Crossover Patients Followed in Standard Therapy Arm
• *One TAVR patient was alive and censored prior to the window
• **Two TAVR patients were alive and censored prior to the window (including the one in the same status at 2 years); one TAVR patient withdrew between 2 and 3 years
• No patients were lost to follow-up
80/82 patients** 97.6% followed at 3 Yr
34/34 patients 100% followed at 3 Yr

Survival of Crossover Patients
1-2 year n = 11
2-3 year n = 9
Alive, n (%) Dead, n (%) Alive, n (%) Dead, n (%)
8 (72%) 3 (28%) 7 (77%) 2 (22%)
Crossover Follow-up (days) Crossover Follow-up (days)
522 ± 129 323 ± 248 469 ± 178 110 ± 11
• No patients crossed over after three years
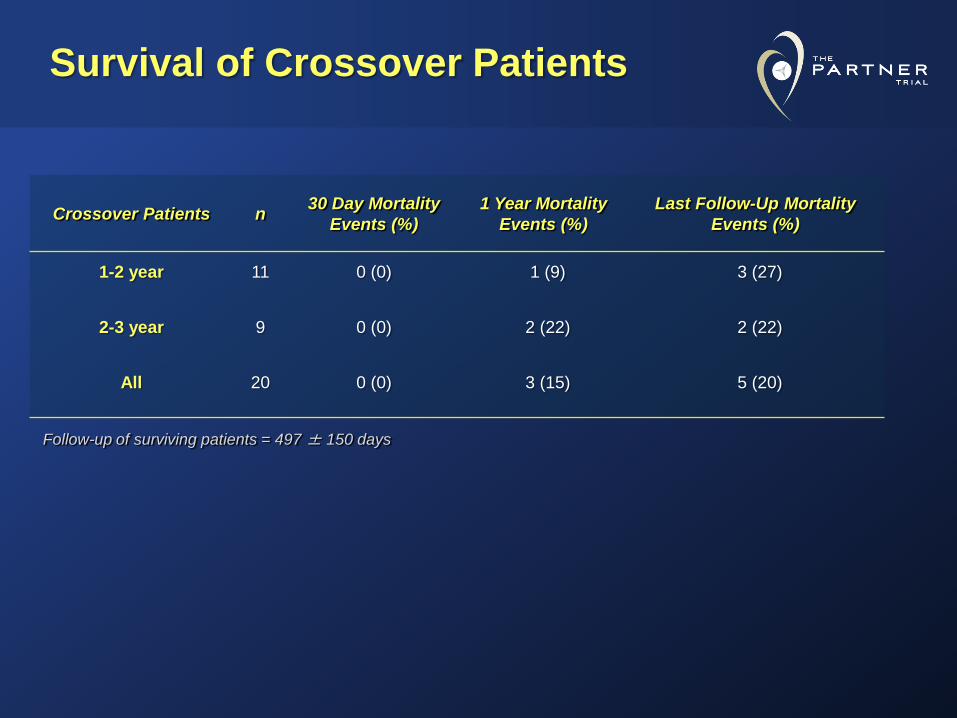
Survival of Crossover Patients
Crossover Patients n 30 Day Mortality
Events (%)
1 Year Mortality
Events (%)
Last Follow-Up Mortality
Events (%)
1-2 year 11 0 (0) 1 (9) 3 (27)
2-3 year 9 0 (0) 2 (22) 2 (22)
All 20 0 (0) 3 (15) 5 (20)
Follow-up of surviving patients = 497 ± 150 days
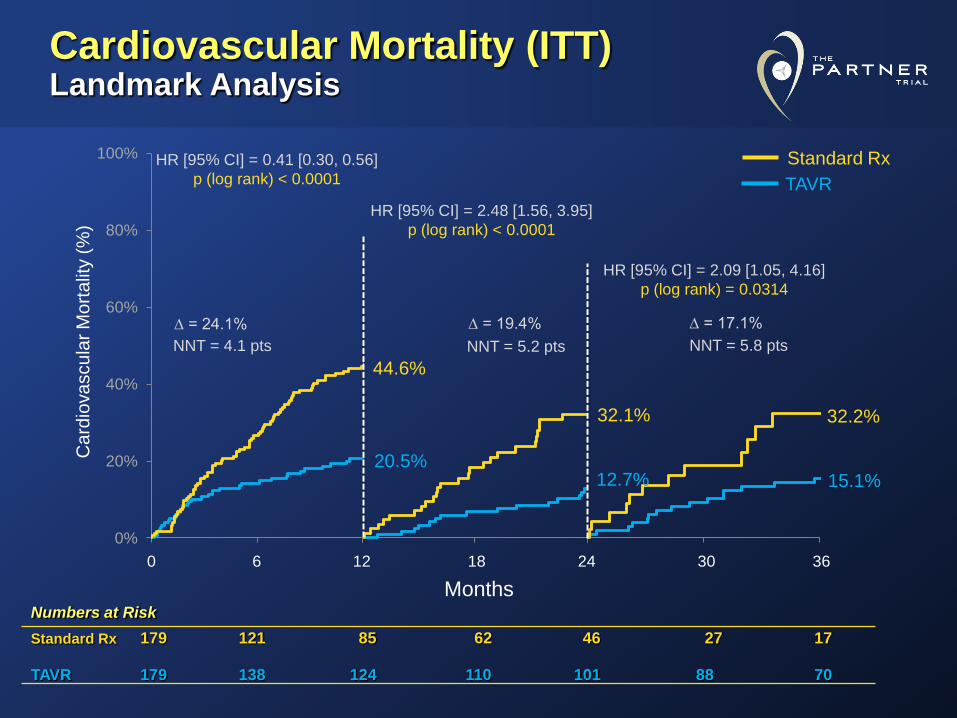
Cardiovascular Mortality (ITT) Landmark Analysis
0%
20%
40%
60%
80%
100%
20.5%
44.6%
12.7%
32.1%
15.1%
32.2%
Ca
rdio
va
scu
lar
Mo
rta
lity (
%)
Numbers at Risk
Standard Rx 179 121 85 62 46 27 17
TAVR 179 138 124 110 101 88 70
HR [95% CI] = 0.41 [0.30, 0.56]
p (log rank) < 0.0001
HR [95% CI] = 2.48 [1.56, 3.95]
p (log rank) < 0.0001
HR [95% CI] = 2.09 [1.05, 4.16]
p (log rank) = 0.0314
∆ = 24.1% ∆ = 19.4% ∆ = 17.1%
NNT = 4.1 pts NNT = 5.2 pts NNT = 5.8 pts
0 6 12 18 24 30 36
Months
Standard Rx
TAVR

NYHA Class Over Time (ITT) Survivors
0%
20%
40%
60%
80%
100%
TAVR
179
Standard Rx
179
TAVR
118
Standard Rx
79
TAVR
96
Standard Rx
41
TAVR
69
Standard Rx
14
IV
III
II
I
Baseline 1 Year 2 Year 3 Year
N =
29.0%
50.0%
17.7%
56.1%
23.7%
60.8%
92.2% 93.9%
p = NS p = NS p < 0.0001 p < 0.0001
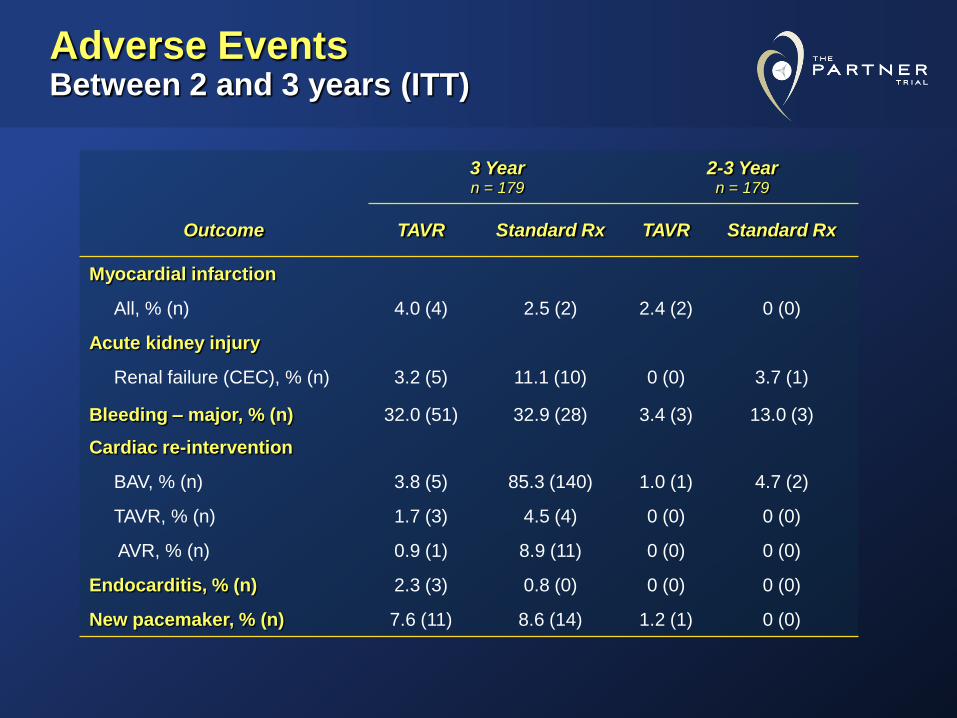
Adverse Events Between 2 and 3 years (ITT)
3 Year n = 179
2-3 Year n = 179
Outcome TAVR Standard Rx TAVR Standard Rx
Myocardial infarction
All, % (n) 4.0 (4) 2.5 (2) 2.4 (2) 0 (0)
Acute kidney injury
Renal failure (CEC), % (n) 3.2 (5) 11.1 (10) 0 (0) 3.7 (1)
Bleeding – major, % (n) 32.0 (51) 32.9 (28) 3.4 (3) 13.0 (3)
Cardiac re-intervention
BAV, % (n) 3.8 (5) 85.3 (140) 1.0 (1) 4.7 (2)
TAVR, % (n) 1.7 (3) 4.5 (4) 0 (0) 0 (0)
AVR, % (n) 0.9 (1) 8.9 (11) 0 (0) 0 (0)
Endocarditis, % (n) 2.3 (3) 0.8 (0) 0 (0) 0 (0)
New pacemaker, % (n) 7.6 (11) 8.6 (14) 1.2 (1) 0 (0)
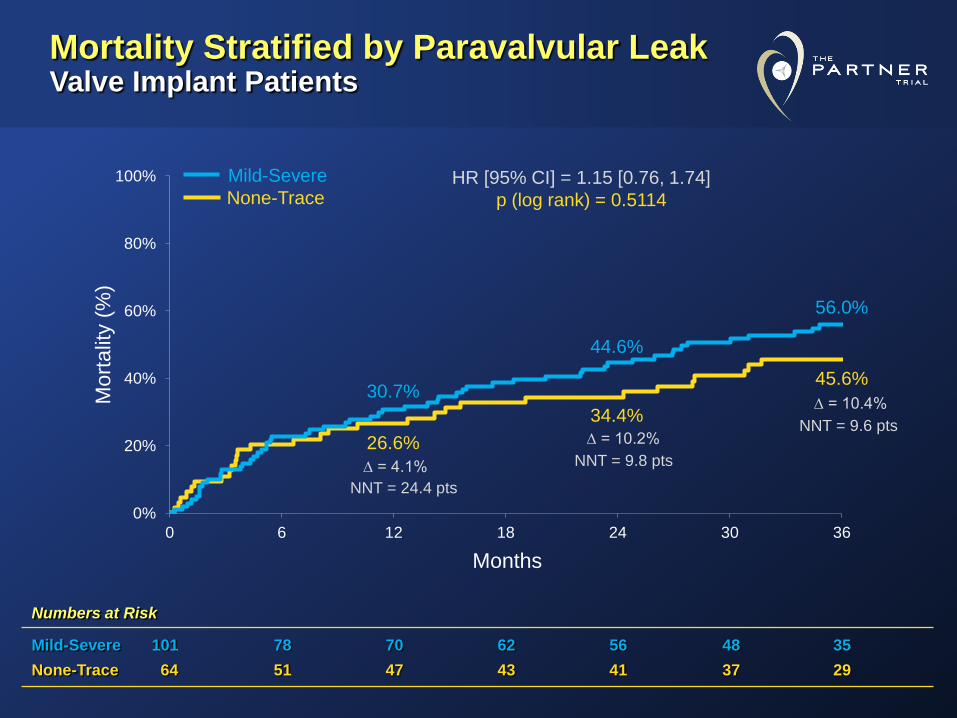
Numbers at Risk
Mild-Severe 101 78 70 62 56 48 35
None-Trace 64 51 47 43 41 37 29
Mortality Stratified by Paravalvular Leak Valve Implant Patients
0%
20%
40%
60%
80%
100%
0 6 12 18 24 30 36
30.7%
26.6%
44.6%
34.4%
56.0%
45.6%
Months
Mort
alit
y (
%)
HR [95% CI] = 1.15 [0.76, 1.74]
p (log rank) = 0.5114
∆ = 10.4%
NNT = 24.4 pts
NNT = 9.8 pts
NNT = 9.6 pts
∆ = 4.1%
∆ = 10.2%
Mild-Severe
None-Trace

Echo Analysis PV Leak Changes 30 Days Compared to 3 Years
16.6% Progressed 31.0% Improved 52.4% Unchanged
3 Year
30 Day None Trace Mild Moderate
None 7 3 0 0
Trace 5 5 2 0
Mild 5 1 11 2
Moderate 0 1 2 0
Of the 42 patients alive with data at 3 years:
Patients With Data at Both Time Points
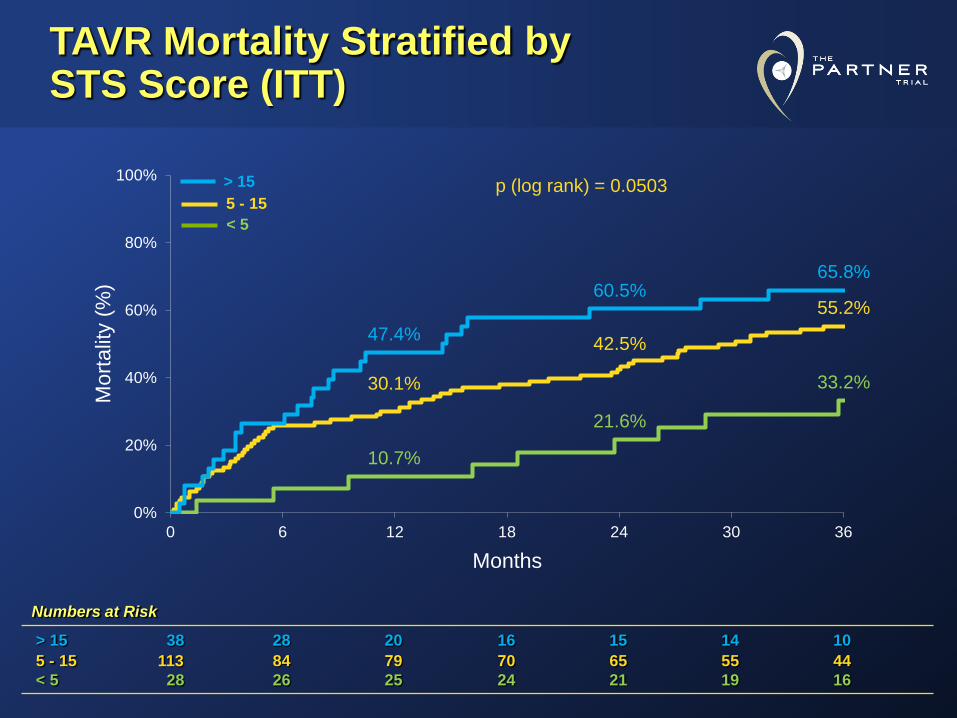
Numbers at Risk
> 15 38 28 20 16 15 14 10
5 - 15 113 84 79 70 65 55 44
< 5 28 26 25 24 21 19 16
TAVR Mortality Stratified by STS Score (ITT)
0%
20%
40%
60%
80%
100%
0 6 12 18 24 30 36
10.7%
47.4%
30.1%
21.6%
60.5%
42.5%
33.2%
65.8%
55.2%
Mort
alit
y (
%)
5 - 15
> 15
< 5
Months
p (log rank) = 0.0503
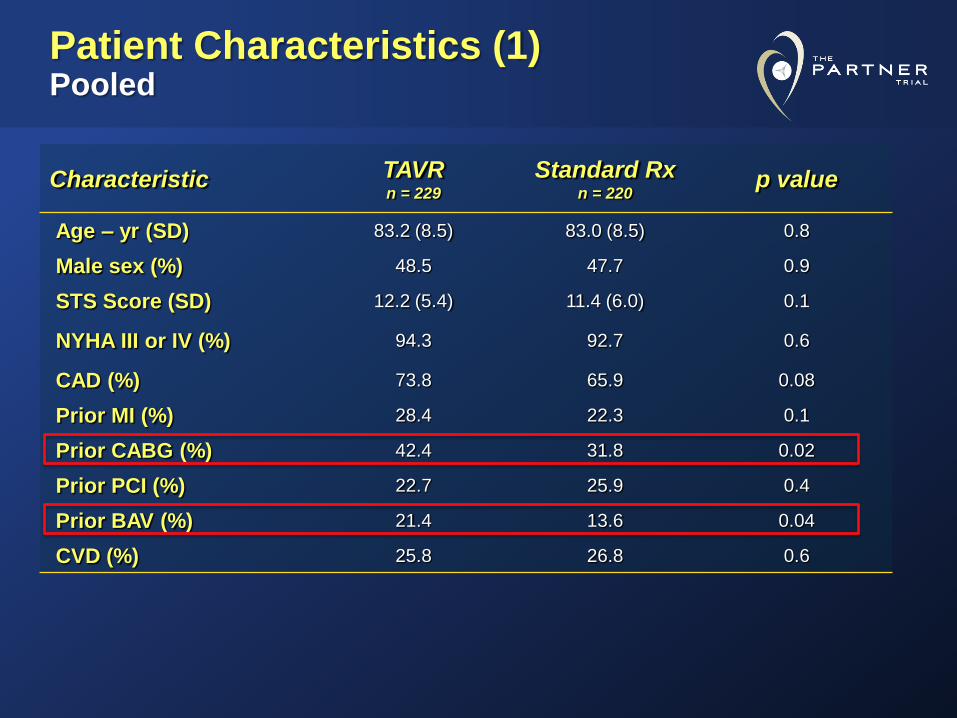
Patient Characteristics (1) Pooled
Characteristic TAVR n = 229
Standard Rx n = 220
p value
Age – yr (SD) 83.2 (8.5) 83.0 (8.5) 0.8
Male sex (%) 48.5 47.7 0.9
STS Score (SD) 12.2 (5.4) 11.4 (6.0) 0.1
NYHA III or IV (%) 94.3 92.7 0.6
CAD (%) 73.8 65.9 0.08
Prior MI (%) 28.4 22.3 0.1
Prior CABG (%) 42.4 31.8 0.02
Prior PCI (%) 22.7 25.9 0.4
Prior BAV (%) 21.4 13.6 0.04
CVD (%) 25.8 26.8 0.6

Patient Characteristics (2) Pooled
Characteristic TAVR n = 229
Standard Rx n = 220
p value
PVD (%) 24.9 30.0 0.2
COPD
Any (%)
O2 dependent (%)
72.9
24.7
64.3
22.0
0.1
0.8
Creatinine > 2 mg/dL (%) 8.8 5.5 0.2
Atrial fibrillation (%) 26.6 20.8 0.2
Perm. pacemaker (%) 19.7 20.5 0.9
Pulmonary HTN (%) 50.7 47.7 0.6
Frailty (%) 25.6 17.8 0.1
Porcelain aorta (%) 11.8 18.6 0.049
Chest wall radiation (%) 7.9 7.7 1.0
Chest wall deformity (%) 6.1 7.7 0.6
Liver disease (%) 3.5 5.0 0.4
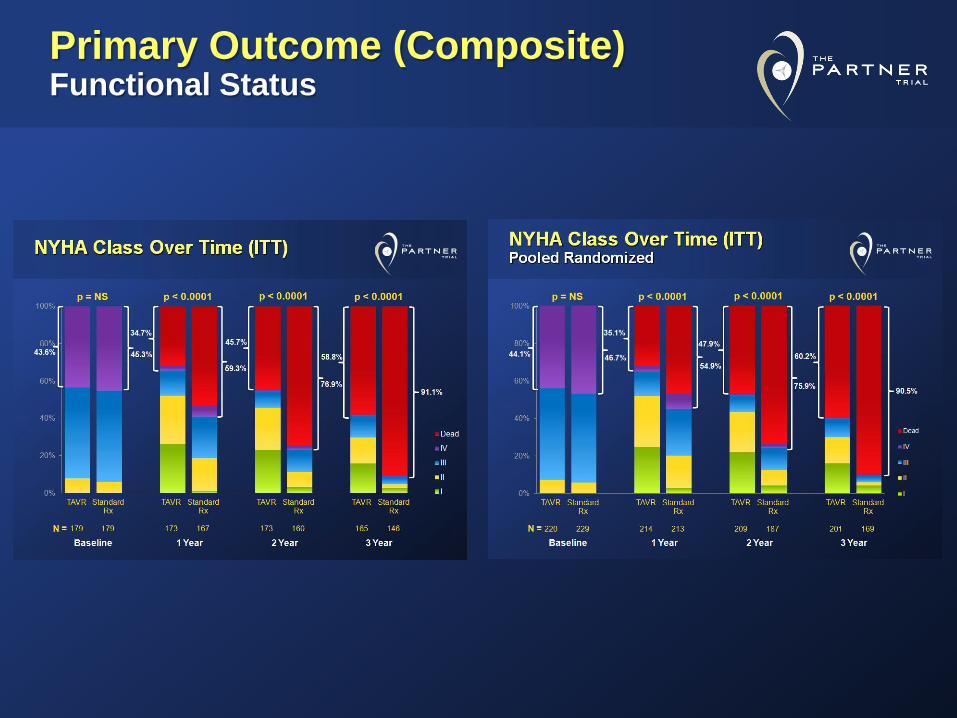
Primary Outcome (Composite) Functional Status

Primary Outcome (Composite) Mean Gradient & AVA
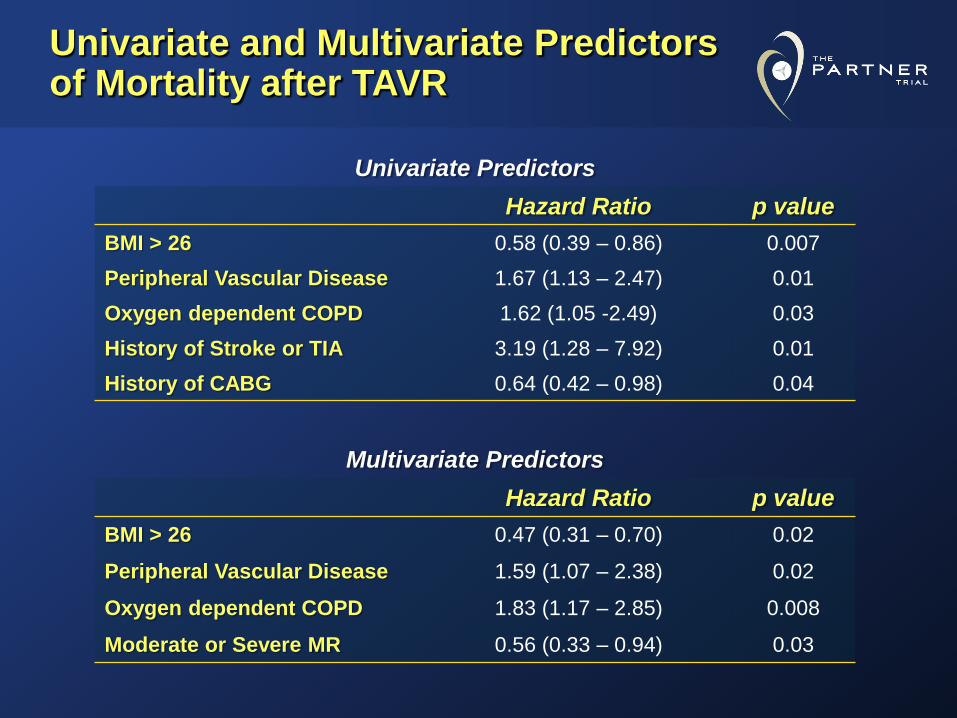
Univariate and Multivariate Predictors of Mortality after TAVR
Univariate Predictors
Hazard Ratio p value
BMI > 26 0.58 (0.39 – 0.86) 0.007
Peripheral Vascular Disease 1.67 (1.13 – 2.47) 0.01
Oxygen dependent COPD 1.62 (1.05 -2.49) 0.03
History of Stroke or TIA 3.19 (1.28 – 7.92) 0.01
History of CABG 0.64 (0.42 – 0.98) 0.04
Multivariate Predictors
Hazard Ratio p value
BMI > 26 0.47 (0.31 – 0.70) 0.02
Peripheral Vascular Disease 1.59 (1.07 – 2.38) 0.02
Oxygen dependent COPD 1.83 (1.17 – 2.85) 0.008
Moderate or Severe MR 0.56 (0.33 – 0.94) 0.03

Pooled Randomized

Numbers at Risk
Standard Rx 229 163 118 77 56 33 17
TAVR 220 169 151 133 117 103 70
All Cause Mortality (ITT) Pooled Randomized Crossover Patients Censored at Crossover
0%
20%
40%
60%
80%
100%
0 6 12 18 24 30 36
31.4%
45.5%
44.8%
64.3%
54.9%
78.0%
All
Ca
use M
ort
alit
y (
%)
Months
HR [95% CI] = 0.60 [0.47, 0.76]
p (log rank) < 0.0001
14.1%
19.5%
23.1%
NNT = 7.1 pts
NNT = 5.1 pts
NNT = 4.3 pts
Standard Rx
TAVR
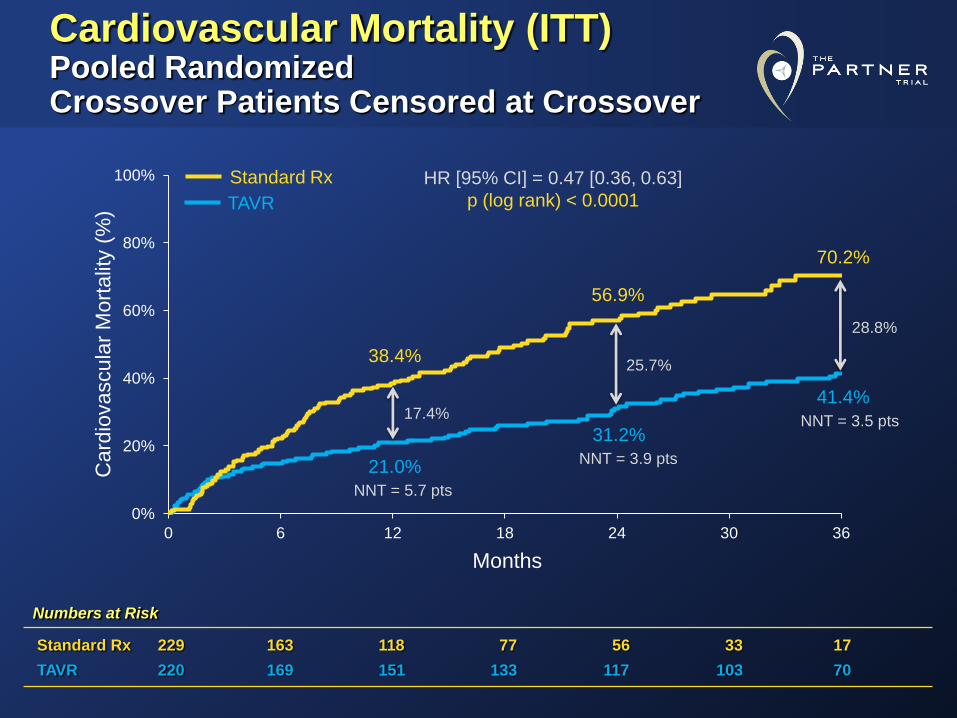
Cardiovascular Mortality (ITT) Pooled Randomized Crossover Patients Censored at Crossover
0%
20%
40%
60%
80%
100%
0 6 12 18 24 30 36
21.0%
38.4%
31.2%
56.9%
41.4%
70.2%
Card
iovascula
r M
ort
alit
y (
%)
Numbers at Risk
Standard Rx 229 163 118 77 56 33 17
TAVR 220 169 151 133 117 103 70
Months
HR [95% CI] = 0.47 [0.36, 0.63]
p (log rank) < 0.0001
17.4%
25.7%
28.8%
NNT = 5.7 pts
NNT = 3.9 pts
NNT = 3.5 pts
Standard Rx
TAVR

All Cause Mortality (ITT) Pooled Randomized – Landmark Analysis
0%
20%
40%
60%
80%
100%
31.4%
45.5%
19.6%
34.4%
18.3%
38.5%
All
Cause M
ort
alit
y (
%)
Months
Numbers at Risk
Standard
Rx 229 163 118 77 56 33 17
TAVR 220 169 151 133 117 103 70
HR [95% CI] = 1.94 [1.09, 3.45]
p (log rank) = 0.0223
HR [95% CI] = 1.94 [1.33, 2.83]
p (log rank) = 0.0004
HR [95% CI] = 0.60 [0.47, 0.76]
p (log rank) < 0.0001
∆ = 14.1% ∆ = 14.8% ∆ = 20.2%
NNT = 7.1 pts NNT = 6.8 pts NNT = 5.0 pts
Standard Rx
TAVR
0 6 12 18 24 30 36
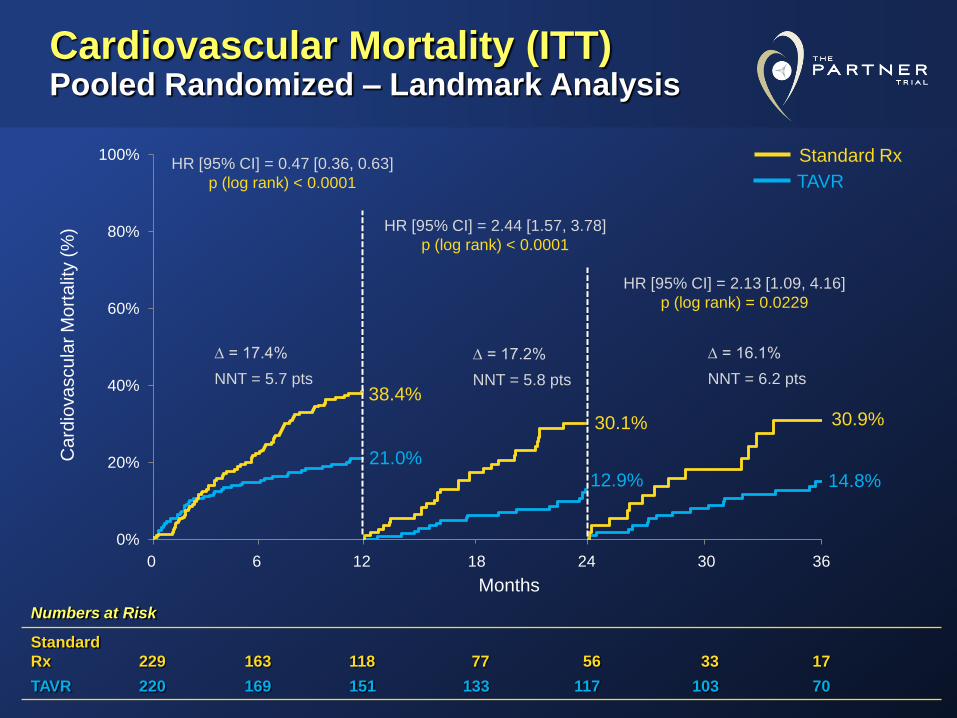
Cardiovascular Mortality (ITT) Pooled Randomized – Landmark Analysis
0%
20%
40%
60%
80%
100%
21.0%
38.4%
12.9%
30.1%
14.8%
30.9%
Ca
rdio
va
scu
lar
Mo
rta
lity (
%)
Months
Numbers at Risk
Standard
Rx 229 163 118 77 56 33 17
TAVR 220 169 151 133 117 103 70
∆ = 17.4% ∆ = 17.2% ∆ = 16.1%
NNT = 5.7 pts NNT = 5.8 pts NNT = 6.2 pts
0 6 12 18 24 30 36
HR [95% CI] = 0.47 [0.36, 0.63]
p (log rank) < 0.0001
HR [95% CI] = 2.44 [1.57, 3.78]
p (log rank) < 0.0001
HR [95% CI] = 2.13 [1.09, 4.16]
p (log rank) = 0.0229
Standard Rx
TAVR
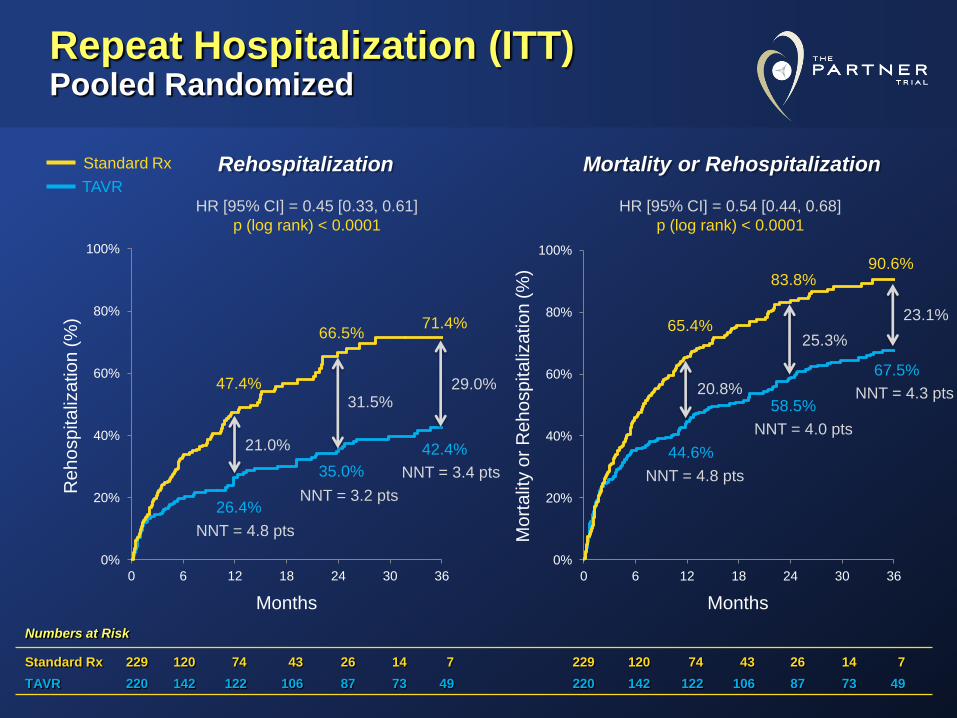
Repeat Hospitalization (ITT) Pooled Randomized
Numbers at Risk
Standard Rx 229 120 74 43 26 14 7 229 120 74 43 26 14 7
TAVR 220 142 122 106 87 73 49 220 142 122 106 87 73 49
0%
20%
40%
60%
80%
100%
0 6 12 18 24 30 36
0%
20%
40%
60%
80%
100%
0 6 12 18 24 30 36
47.4%
26.4%
66.5%
35.0%
71.4%
42.4%
65.4%
44.6%
83.8%
58.5%
90.6%
67.5%
HR [95% CI] = 0.45 [0.33, 0.61]
p (log rank) < 0.0001
29.0%
NNT = 4.8 pts
NNT = 3.2 pts
NNT = 3.4 pts NNT = 4.8 pts
NNT = 4.0 pts
NNT = 4.3 pts 31.5%
21.0%
23.1%
25.3%
20.8%
HR [95% CI] = 0.54 [0.44, 0.68]
p (log rank) < 0.0001
Rehospitalization Mortality or Rehospitalization
Re
ho
sp
ita
liza
tio
n (
%)
Mo
rta
lity o
r R
eh
osp
ita
liza
tion
(%
)
Months Months
Standard Rx
TAVR

NYHA Class Over Time (ITT) Pooled Randomized
0%
20%
40%
60%
80%
100%
TAVR
220
Standard Rx
229
TAVR
214
Standard Rx
213
TAVR
209
Standard Rx
187
TAVR
201
Standard Rx
169
Dead
IV
III
II
I
Baseline 1 Year 2 Year 3 Year
p < 0.0001 p = NS p < 0.0001 p < 0.0001
60.2%
90.5%
47.9%
75.9%
35.1%
54.9%
44.1% 46.7%
N =

NYHA Class Over Time (ITT) Pooled Randomized (Survivors)
0%
20%
40%
60%
80%
100%
TAVR
220
Standard Rx
229
TAVR
145
Standard Rx
113
TAVR
111
Standard Rx
49
TAVR
81
Standard Rx
17
IV
III
II
I
Baseline 1 Year 2 Year 3 Year
25.9%
41.2%
18.0%
53.1%
23.4%
61.9%
92.7% 94.3%
p = NS p = NS
N =
p < 0.0001 p < 0.0001

All Stroke (ITT) Pooled Randomized
Numbers at Risk
Standard Rx 229 160 117 77 56 33 17
TAVR 220 158 142 127 112 97 65
0%
10%
20%
30%
40%
50%
0 6 12 18 24 30 36
4.2%
10.5%
4.2%
12.7%
4.2%
14.4% Str
oke (
%)
Months
HR [95% CI] = 3.33 [1.51, 7.35]
p (log rank) = 0.0016
∆ = 6.3%
NNT = 15.9 pts NNT = 11.8 pts
NNT = 9.8 pts
∆ = 8.5% ∆ = 10.2%
Standard Rx
TAVR

Mortality or Stroke (ITT) Pooled Randomized
Numbers at Risk
Standard Rx 229 160 117 77 56 33 17
TAVR 220 158 142 127 112 97 65
0%
20%
40%
60%
80%
100%
0 6 12 18 24 30 36
45.9%
35.5%
47.1%
57.8%
64.2%
78.0%
Mort
alit
y o
r S
troke (
%)
Months
HR [95% CI] = 0.67 [0.53, 0.85]
p (log rank) = 0.0008
10.4%
17.1%
20.2%
NNT = 9.6 pts
NNT = 5.8 pts
NNT = 5.0 pts
Standard Rx
TAVR

Mean Gradient & Valve Area Pooled Randomized
43.6
10.2 10.7 10.7 10.9 11.6
0.6
1.6
1.6 1.6 1.5 1.5
0
0.5
1
1.5
2
2.5
0
10
20
30
40
50
60
70
Baseline
196
30 Day
168
6 Month
120
1 Year
107
2 Year
82
3 Year
49
Mean G
radie
nt
(mm
Hg)
EOA
Mean Gradient
Valv
e A
rea (
cm
²)
N =
Error bars = ± 1 Std Dev
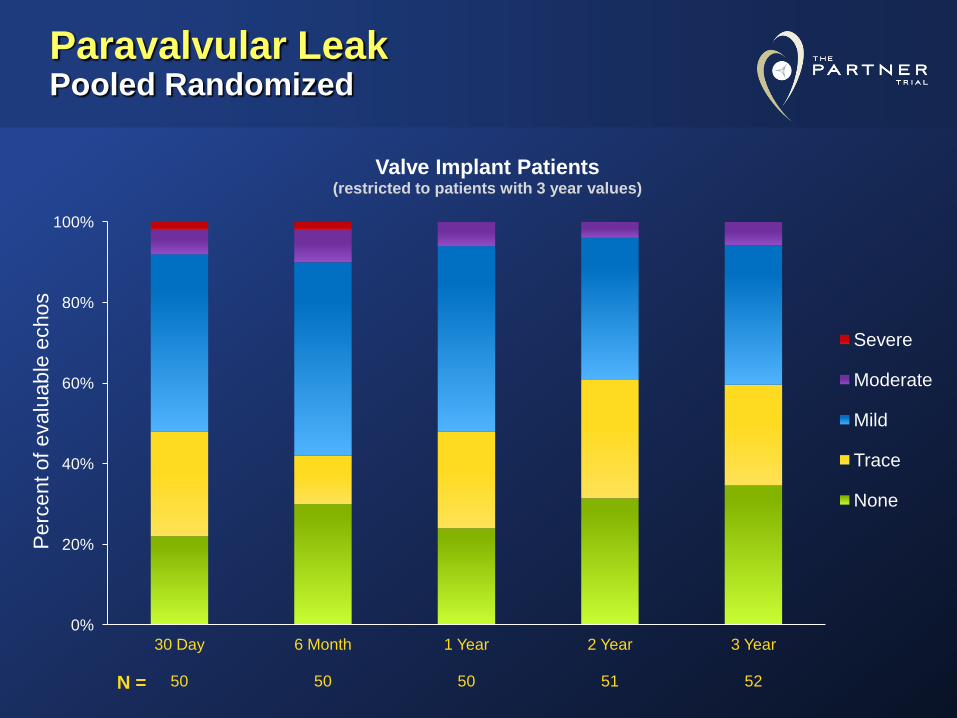
Paravalvular Leak Pooled Randomized
0%
20%
40%
60%
80%
100%
30 Day
50
6 Month
50
1 Year
50
2 Year
51
3 Year
52
Valve Implant Patients (restricted to patients with 3 year values)
Severe
Moderate
Mild
Trace
None
Perc
ent of
evalu
able
echos
N =

Mortality Stratified by Paravalvular Leak (ITT) Pooled Randomized – Valve Implant Patients
Numbers at Risk
Mild-Severe 123 95 83 72 62 54 35
None-Trace 81 65 61 55 51 46 29
0%
20%
40%
60%
80%
100%
0 6 12 18 24 30 36
32.5%
24.7%
48.1%
33.6%
59.0%
43.0%
Months
Mort
alit
y (
%)
HR [95% CI] = 1.32 [0.90, 1.94]
p (log rank) = 0.1483
∆ = 16.0%
NNT = 12.8 pts
NNT = 6.9 pts
NNT = 6.3 pts
∆ = 7.8%
∆ = 14.5%
Mild-Severe
None-Trace
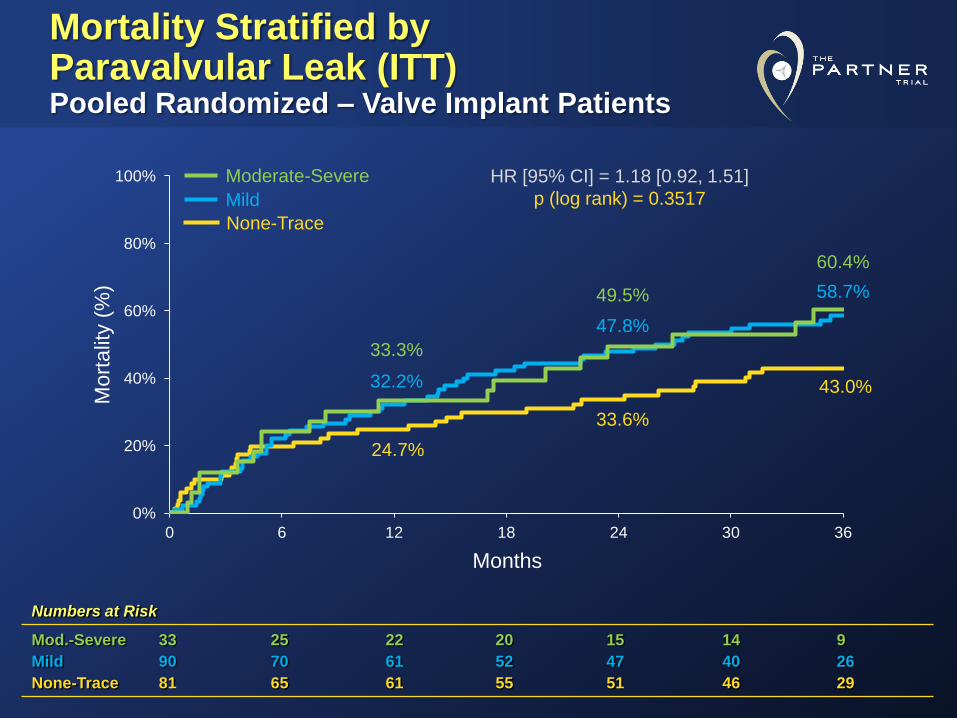
Mortality Stratified by Paravalvular Leak (ITT) Pooled Randomized – Valve Implant Patients
Numbers at Risk
Mod.-Severe 33 25 22 20 15 14 9
Mild 90 70 61 52 47 40 26
None-Trace 81 65 61 55 51 46 29
0%
20%
40%
60%
80%
100%
0 6 12 18 24 30 36
24.7%
33.3%
32.2%
33.6%
47.8%
49.5%
43.0%
60.4%
58.7%
Mort
alit
y (
%)
Months
HR [95% CI] = 1.18 [0.92, 1.51]
p (log rank) = 0.3517
None-Trace
Mild
Moderate-Severe
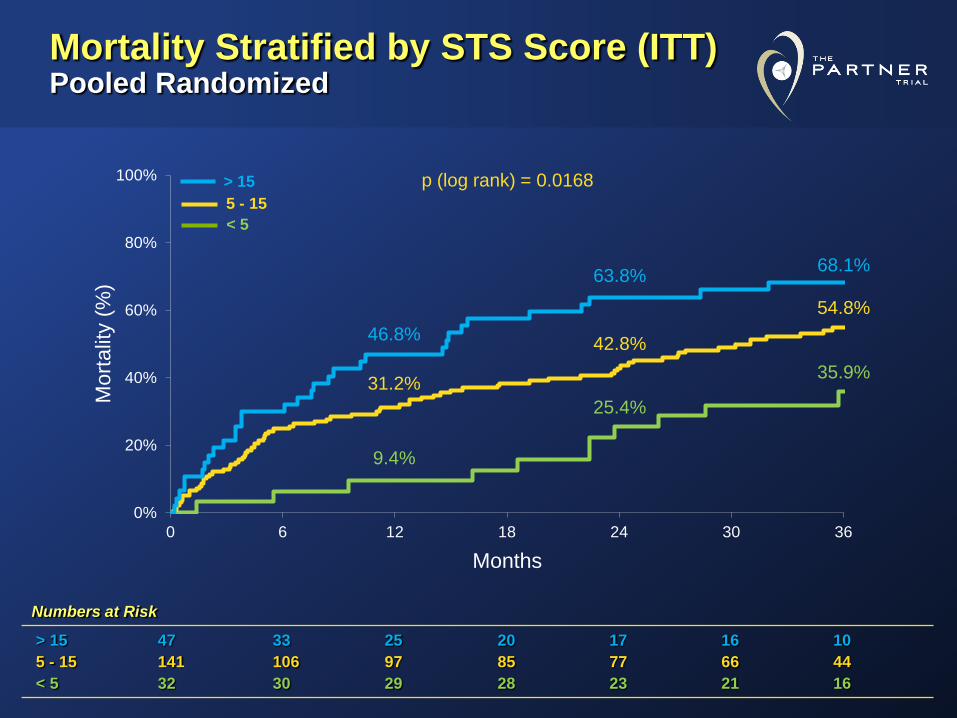
Mortality Stratified by STS Score (ITT) Pooled Randomized
Numbers at Risk
> 15 47 33 25 20 17 16 10
5 - 15 141 106 97 85 77 66 44
< 5 32 30 29 28 23 21 16
0%
20%
40%
60%
80%
100%
0 6 12 18 24 30 36
9.4%
46.8%
31.2%
25.4%
63.8%
42.8%
35.9%
68.1%
54.8%
Mort
alit
y (
%)
Months
p (log rank) = 0.0168
5 - 15
> 15
< 5
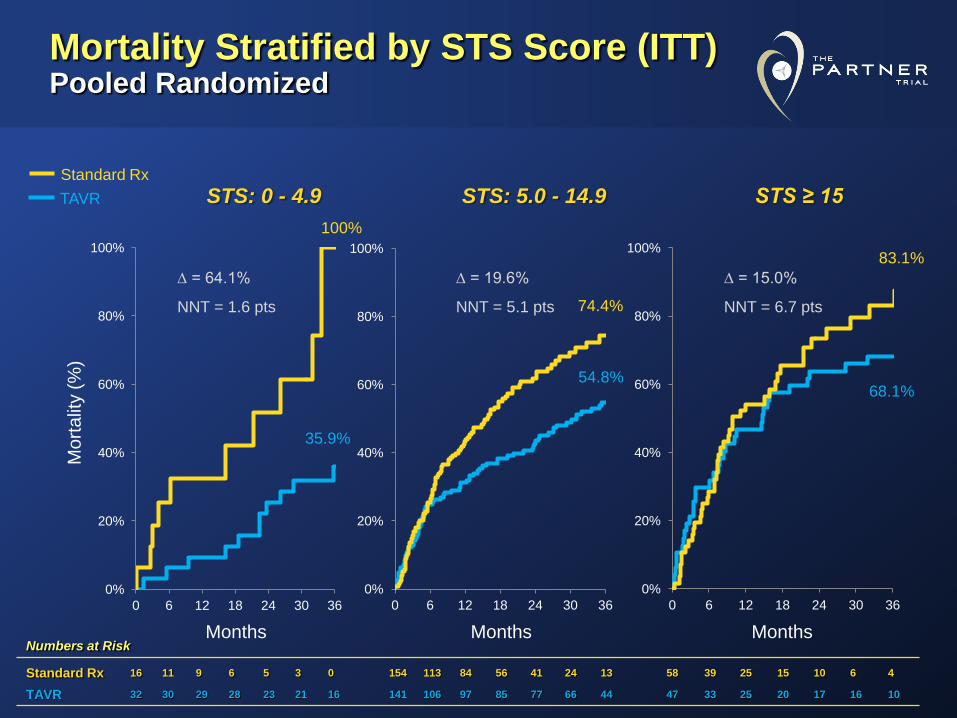
Mortality Stratified by STS Score (ITT) Pooled Randomized
0%
20%
40%
60%
80%
100%
0 6 12 18 24 30 36
0%
20%
40%
60%
80%
100%
0 6 12 18 24 30 36
0%
20%
40%
60%
80%
100%
0 6 12 18 24 30 36
Mo
rta
lity (
%)
Months Months Months
STS: 0 - 4.9 STS: 5.0 - 14.9 STS ≥ 15
∆ = 64.1%
NNT = 1.6 pts NNT = 5.1 pts NNT = 6.7 pts
∆ = 15.0% ∆ = 19.6%
Numbers at Risk
Standard Rx 16 11 9 6 5 3 0 154 113 84 56 41 24 13 58 39 25 15 10 6 4
TAVR 32 30 29 28 23 21 16 141 106 97 85 77 66 44 47 33 25 20 17 16 10
100%
35.9%
83.1%
68.1% 54.8%
74.4%
Standard Rx
TAVR
Top Related