


Languages
Pages
Legal

Registration and coffee
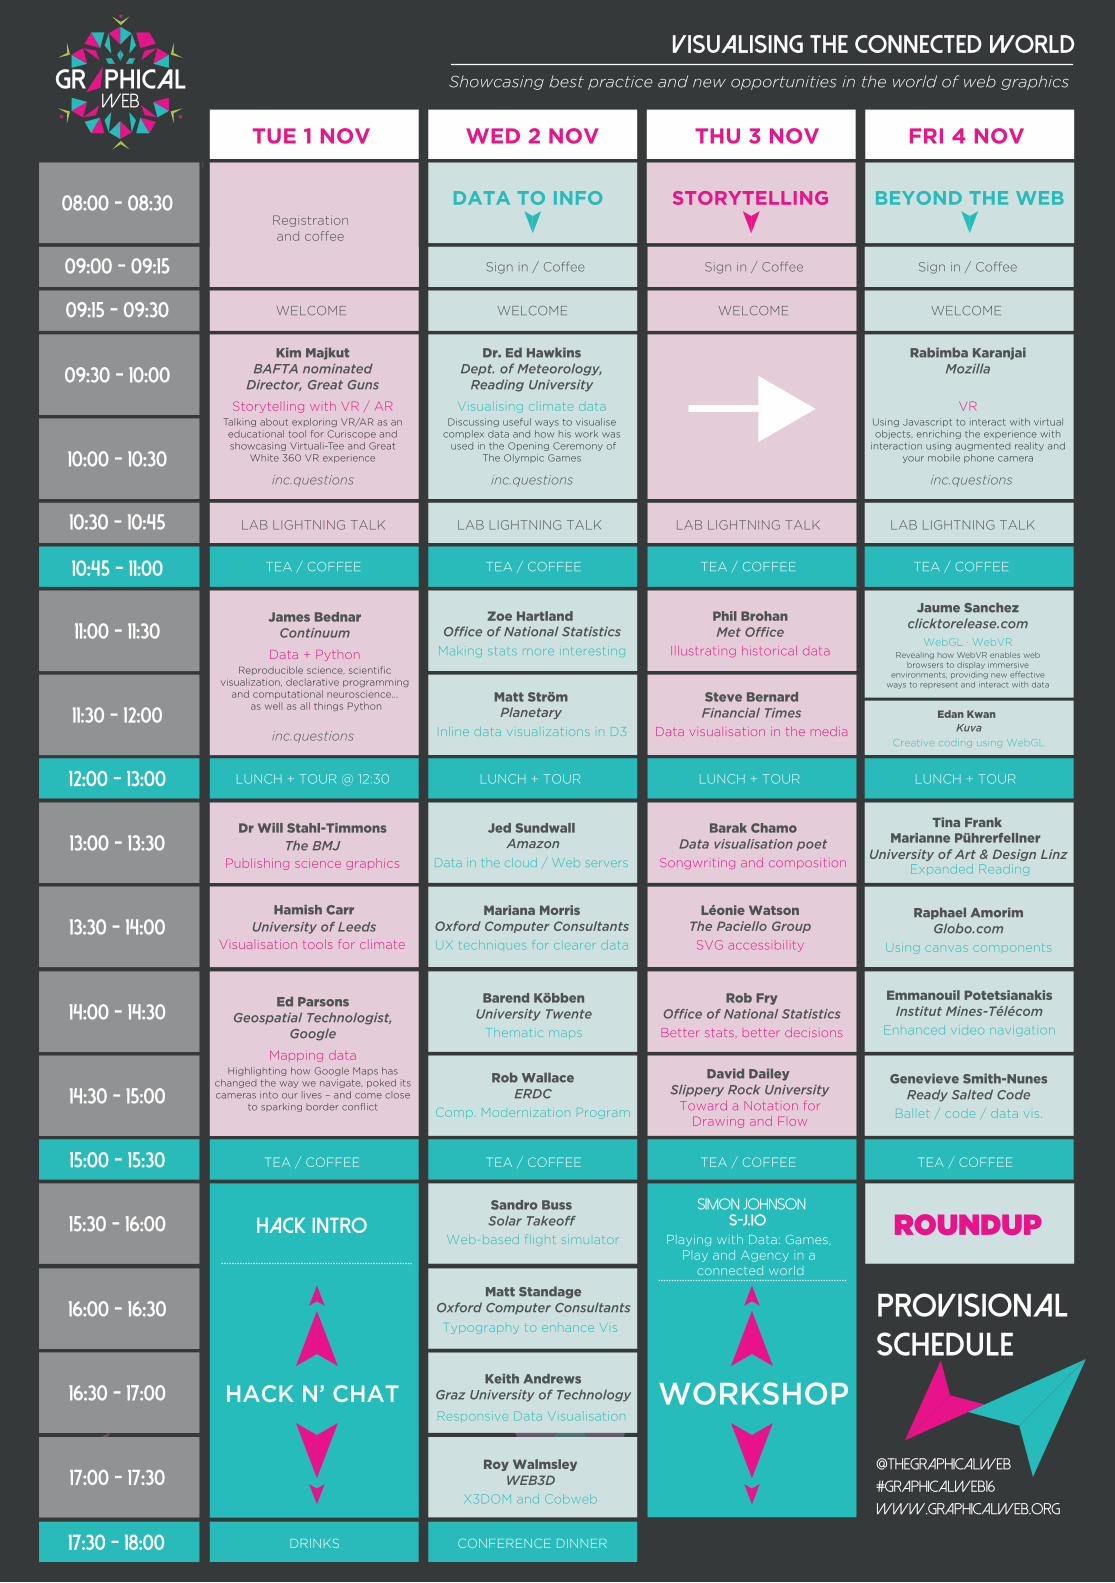
Dr. Ed HawkinsDept. of Meteorology,
Reading University
Visualising climate dataDiscussing useful ways to visualise
complex data and how his work was used in the Opening Ceremony of
The Olympic Games
Sign in / Coffee
inc.questions
Sign in / Coffee Sign in / Coffee
WELCOME WELCOME WELCOME WELCOME
www.graphicalweb.org
#graphicalweb16
@Thegraphicalweb
VISUALISING THE CONNECTED WORLD
TUE 1 NOV WED 2 NOV THU 3 NOV FRI 4 NOV
Showcasing best practice and new opportunities in the world of web graphics
DATA TO INFO STORYTELLING BEYOND THE WEB
WEB
08:00 - 08:30
09:30 - 10:00
10:00 - 10:30
09:00 - 09:15
09:15 - 09:30
LAB LIGHTNING TALK LAB LIGHTNING TALK LAB LIGHTNING TALK LAB LIGHTNING TALK
TEA / COFFEE TEA / COFFEE TEA / COFFEE TEA / COFFEE
10:30 - 10:45
inc.questions
Kim MajkutBAFTA nominated
Director, Great Guns
Storytelling with VR / ARTalking about exploring VR/AR as an educational tool for Curiscope and showcasing Virtuali-Tee and Great
White 360 VR experience
inc.questions
Rabimba KaranjaiMozilla
VRUsing Javascript to interact with virtual objects, enriching the experience with
interaction using augmented reality and your mobile phone camera
11:00 - 11:30
11:30 - 12:00inc.questions
10:45 - 11:00
TEA / COFFEE TEA / COFFEE TEA / COFFEE TEA / COFFEE15:00 - 15:30
DRINKS CONFERENCE DINNER17:30 - 18:00
12:00 - 13:00
James BednarContinuum
Data + PythonReproducible science, scientific
visualization, declarative programming and computational neuroscience...
as well as all things Python
Zoe Hartland Office of National Statistics
Making stats more interesting
Inline data visualizations in D3
Matt Ström Planetary
Phil Brohan Met Office
Illustrating historical data
Steve BernardFinancial Times
Data visualisation in the media
13:00 - 13:30
15:30 - 16:00
13:30 - 14:00
LUNCH + TOUR @ 12:30 LUNCH + TOUR LUNCH + TOUR LUNCH + TOUR
Mariana Morris Oxford Computer ConsultantsUX techniques for clearer data
Léonie Watson The Paciello GroupSVG accessibility
Barak Chamo Data visualisation poet
Songwriting and composition
14:00 - 14:30
14:30 - 15:00
Ed ParsonsGeospatial Technologist,
Mapping dataHighlighting how Google Maps has
changed the way we navigate, poked its cameras into our lives – and come close
to sparking border conflict
Barend KöbbenUniversity Twente
Thematic maps
Rob Wallace ERDC
Comp. Modernization Program
David Dailey Slippery Rock University
Toward a Notation forDrawing and Flow
Simon Johnson s-j.io
Playing with Data: Games, Play and Agency in a
connected world
Rob Fry Office of National StatisticsBetter stats, better decisions
Edan Kwan Kuva
Creative coding using WebGL
16:00 - 16:30
16:30 - 17:00
17:00 - 17:30
Sandro Buss Solar TakeoffHACK INTRO ROUNDUP
HACK N’ CHAT WORKSHOPKeith Andrews
Graz University of Technology
Responsive Data Visualisation
Typography to enhance Vis
Web-based flight simulator
Matt Standage Oxford Computer Consultants
Roy Walmsley WEB3D
X3DOM and Cobweb
Jed Sundwall Amazon
Data in the cloud / Web servers
Hamish CarrUniversity of Leeds
Visualisation tools for climate
Dr Will Stahl-TimmonsThe BMJ
Publishing science graphics
Jaume Sanchezclicktorelease.com
WebGL · WebVRRevealing how WebVR enables web
browsers to display immersive environments, providing new effective
ways to represent and interact with data
Emmanouil Potetsianakis Institut Mines-Télécom
Enhanced video navigation
Tina FrankMarianne Pührerfellner
University of Art & Design LinzExpanded Reading
Raphael AmorimGlobo.com
Using canvas components
Genevieve Smith-NunesReady Salted Code
Ballet / code / data vis.
Top Related