


Languages
Pages
Legal


TENNESSEE STROKE REGISTRY QUARTERLY REPORT Volume 1, Issue 3 September 2018
This report is published quarterly using data from the Tennessee Stroke Registry.
Inside this report
Data on diagnosis, gender distributions, age distribution, arrival modes, insurance
status, last known well to arrival, and medical history
Data from January 2018 to March 2018
Contact information for the Tennessee Stroke Registry

Background
The Tennessee Stroke Registry (TSR) was created in 2009 through the Tennessee Stroke
Registry Act of 2008. In July 2017, the legislation was updated with Tennessee House Bill 123, requiring
all certified comprehensive and primary stroke centers in Tennessee to share their data with the TSR in
order to improve stroke care in the state. The bill requires data to be provided from hospitals on a
quarterly basis. The data are uploaded to the American Heart/American Stroke Association’s Get With
the Guidelines (GWTG) data system, Quintiles. This report provides a summary of the TSR data for the
third quarter of the fiscal year, January to March 2018. The data are aggregate data from the 30
hospitals currently reporting to Quintiles. In this report, illustrations are made on similarities and
differences between Quarter 1, 2, and 3 data. Quarter 1 contains data from July to September 2017, and
Quarter 2 contains data from October through December 2017.

� � �
Data and Distributions
Diagnosis
78%
8% 4%
14%
70%
6% 5%
14%
69.7%
7.0% 4.7%
13.9%
Ischemic stroke Transient ischemic attack (<24 hours)
Subarachnoid Hemorrhage Intracerebral Hemorrhage
Stroke diagnosis Quarters 1, 2, and 3
Quarter 1 Quarter 2 Quarter 3
Overall, the patterns and distributions for the second quarter are similar to what was shown in past TSR
reports. The total number of stroke cases for the quarter was 2,888. The most common cases were
ischemic strokes at 69.7% of strokes reported to the registry. In Quarter 1, there was a greater proportion
of ischemic strokes than in Quarters 2 and 3. The difference was significant between Quarter 1 and 2,
with 77.9% ischemic strokes in Quarter 1, and Quarter 2 having 70% (z=7.068, p<.01). The difference
was also significant between Quarter 1 and Quarter 3 (z=4.559, p <.01).
� � �
43%
57%
40%
60%
37%
63%
Male Female
Gender distribution SAH Quarters 1, 2, and 3
Quarter 1 Quarter 2 Quarter 3
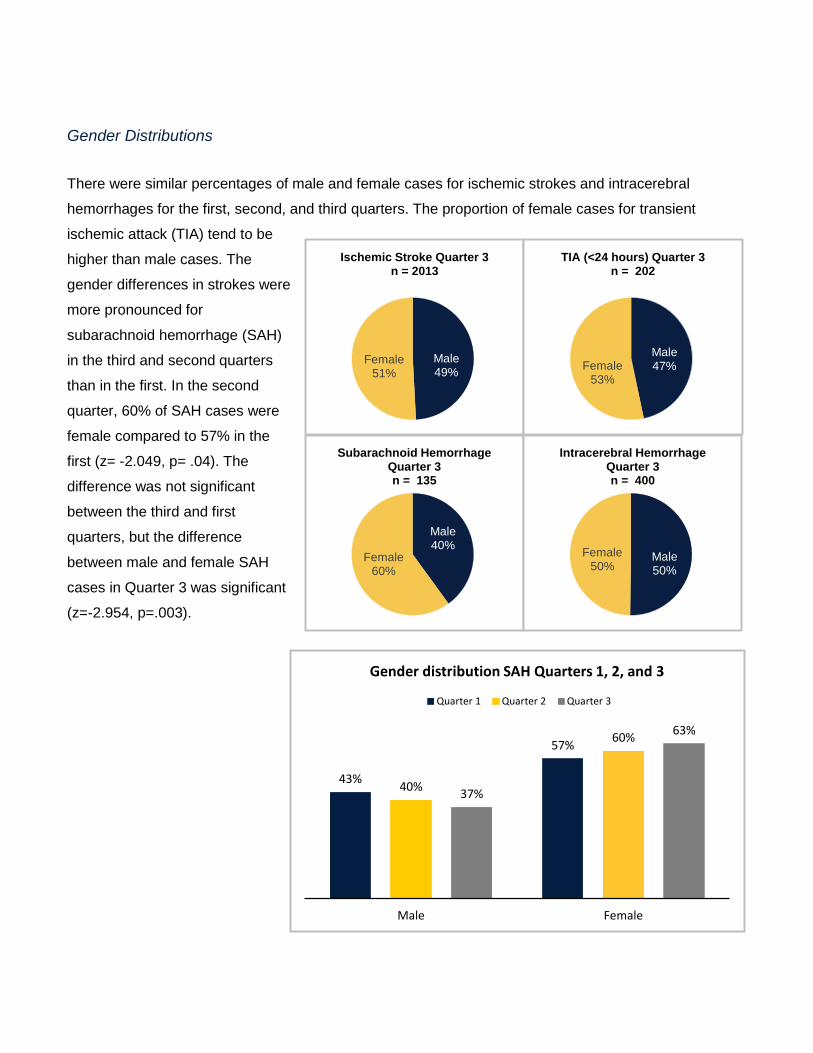
Gender Distributions
There were similar percentages of male and female cases for ischemic strokes and intracerebral
hemorrhages for the first, second, and third quarters. The proportion of female cases for transient
ischemic attack (TIA) tend to be
higher than male cases. The
gender differences in strokes were
more pronounced for
subarachnoid hemorrhage (SAH)
in the third and second quarters
than in the first. In the second
quarter, 60% of SAH cases were
female compared to 57% in the
first (z= -2.049, p= .04). The
difference was not significant
between the third and first
quarters, but the difference
between male and female SAH
cases in Quarter 3 was significant
(z=-2.954, p=.003).
Male 49%
Female 51%
Ischemic Stroke Quarter 3 n = 2013
Male 47%Female
53%
TIA (<24 hours) Quarter 3 n = 202
Male 40%
Female 60%
Male
Subarachnoid Hemorrhage Quarter 3
Intracerebral Hemorrhage
n = 135
50%
Female 50%
Quarter 3 n = 400

Ischemic Stroke Quarter 2 n = 2187
Female Male 49% 51%
TIA (<24 hours) Quarter 2 n = 195
Male 45%
Female 55%
Subarachnoid Hemorrhage Quarter 2 n = 165
Male 37%
Female 63%
Intracerebral Hemorrhage Quarter 2 n = 425
Male Female
48%52%

- -
• •
Age distributions
67 68 70 58 6768 70 59 67 0
10
20
30
40
50
60
70
80
90
All stroke Ischemic TIA SAH ICH
Average Ages of Stroke Subtypes Quarter 2 and 3 +/- 1 Standard Deviation
Quarter 2 Mean Quarter 3 Mean
The most common age
group experiencing strokes
were those from ages 66-85,
with 49% of all cases in this
bracket. The prevalence of
stroke overall increased by
age, with only 8.2% of cases
occurring from in those aged 18-45. This pattern was similar for all stroke types except subarachnoid
hemorrhage (SAH), where 47% of cases occurred in those ages 46-65. There was an increase for SAH
in the 18-45 age group in the second quarter compared to the first quarter of 2017. In the third quarter,
we saw the proportion of cases in the 18-45 age bracket decrease to 19%, a significant decrease from
Quarter 2 (z=2.077, p=.038).
Age Distribution among SAH Patients Quarter 2
>85 2%
18 - 45 66 85 24% 28%
46 - 65 45%
Age Distribution among SAH Patients Quarter 3
>85 4%
18 - 45 19%
66 85 30%
46 - 65 47%

� � �
Co-morbidities
76%
40% 35%
24% 24%
75%
38% 34%
24% 23%
78%
39% 34%
24% 24%
Hypertension Dyslipidemia Diabetes Mellitus Previous Stroke CAD/Prior MI
Top 5 Co-morbidities among Stroke Patients
Quarter 1 Quarter 2 Quarter 3
The top three co-morbidities among stroke patients, as seen in past quarters’ data, were hypertension
with 77.8% of cases, dyslipidemia at 39.1%, and diabetes mellitus at 34.2%.
Arrival mode
Most patients arrived via EMS services,
with 39.7% of patients in the third quarter
using this method of transportation.
Arrival Mode for All Stroke Types Quarter 3
EMS from home/scene
39.7%
Mobile Stroke Unit
0.4%
Private transport/taxi/
other from homes/scene
27.7%
Transfer from other
hospital 32.1%

� �
� �
Transportation times
Similar transport times
for the various types of
transportation were
reported in the first and
second quarter, with
private transport
experiencing longer
transportation times on
average from
home/scene in
comparison to
Emergency Medical
Services (EMS)
transport. Most patients
arrived at the hospital
in over 300 minutes via
private transportation
(74%) while only 51.1%
of patients via EMS
services arrived in that
time frame (z=9.97, p<.001).
Time from Last Known Well to Arrival Quarter 2 and 3
Quarter 2 Quarter 3
66%64%
11% 10% 11% 10%9% 9%7% 7%
0-60 min. 61-120 min. 121-180 min. 181-300 min. >300
Time from Last Known Well to Arrival Quarter 3
Private transport/taxi/other from home/scene EMS from home/scene
74%
51%
20% 14%
9% 9% 10% 7%5% 5%
0-60 min. 61-120 min. 121-180 min. 181-300 min. >300
Meanwhile, 14.2% of patients arrived to the hospital via EMS services in
less than 60 minutes, compared to 9.5% in private transport (z=2.402, p=.016).

� �
Insurance status
The majority of stroke
patients had Medicare
(59.4%). This reflects that
the most common age
group experiencing strokes
are those from ages 66-85.
The majority of patients with a diagnosis of
ischemic stroke or stroke not otherwise specified,
94%, had a score reported for the National
Institute of Health Stroke Scale (NIHSS). The
NIHSS is a 15-item examination used to evaluate
the effect of acute cerebral infarction on the
levels of consciousness, language, neglect, Yes 94%
No 6%
Quarter 3 NIHSS Reported
58%
11%
35%
7%
59%
11%
34%
7%
Medicare Medicaid Private Self-pay
Insurance Status of Stroke Patients Quarter 2 and Quarter 3
Quarter 2 Quarter 3
NIHSS Reported
visual-field loss, extraocular movement, motor
strength, ataxia, dysarthria, and sensory loss.

� �
� �
Time to Intravenous Thrombolytic Therapy
IV t-PA was
initiated within 60
minutes for most
patients in Quarter
3, at 90.5%.
Compared to
transport via EMS
services, private
transport
experience slightly
slower times with
80% of patients
receiving treatment
in an hour versus
92.4% (z=-2.571,
p=.01).
Time to Intravenous Thrombolytic Therapy Quarter 2 and 3
Quarter 2 Quarter 3
64%
51%
38%
26%
8%6% 3% 1% 1% 0% 0% 1%
0-30 min. 31-60 min. 61-90 min. 91-120 min. 121-150 min. >150 min.
Time to Intravenous Thrombolytic Therapy Quarter 3
Private transport/taxi/other from home/scene EMS from home/scene
69% 63%
29%
18% 11%
6% 2%0% 1% 0% 0% 0%
0-30 min. 31-60 min. 61-90 min. 91-120 min. 121-150 min. >150 min.

• •
Reasons for no IV rt-PA
27%
24%
20%
15%
7% 5% 5% 5%
5%
23%
26%
20%
14%
8% 8% 7%
5%
3%
Reasons for no IV rt-PA Initiation Quarter 2 and 3
Quarter 2 Quarter 3
The top five reasons for no IV rt-PA initiation in Quarter 3, in order of highest proportion of
patients to lowest, were because IV or IA tPA was given outside the hospital, the stroke severity
was too mild, the patient showed rapid improvement, acute bleeding diathesis, and recent IC or
spinal surgery. In Quarter 2, we saw similar proportions for these reasons, except the top
reason in Quarter 2 was that the stroke severity was too mild.

� �
Reasons for delay, IV rt-PA beyond 60 minutes
54%
22%
12% 9%
4%
45%
30%
4%
15% 11%
Care-team unable to determine patient
eligibility
Hypertension Refusal Further diagnostic evaluation
Management of concomitant emergent
conditions
Reasons for no IV rt-PA Initiation Beyond 60 mins Quarter 2 and 3
Quarter 2 Quarter 3
The most common reason for delay in IV rt-PA beyond 60 minutes was that care-team was
unable to determine eligibility of patient, composing 44.7% of cases. The difference between
Quarter 2 and Quarter 3 was not significant.

• •
Modified Rankin Scale at discharge
10% 11% 10% 10%
17%
5% 11%
27%
73%
10% 10% 10% 9%
19%
5% 10%
28%
72%
0 1 2 3 4 5 6 ND/Missing Documented mRS at
discharge
Modified Rankin Scale at Discharge Quarter 2 and Quarter 3
Quarter 2 Quarter 3
72% of patients had their Modified Rankin Scale at discharge documented in Quarter 3. The
Modified Rankin Scale ranges from 0-6, with the following designations for values:
0 - No symptoms at all
1 - No significant disability despite symptoms: Able to carry out all usual activities
2 - Slight disability
3 - Moderate disability: Requiring some help but able to walk without assistance
4 - Moderate to severe disability: Unable to walk without assistance and unable to attend to own bodily needs without assistance
5 - Severe disability: Bedridden, incontinent and requiring constant nursing care and attention
6 - Death

� �
Complication types
41%
59%
11% 11%
46%
73%
0%
12%
IV t-PA & Symptomatic Intracranial Hemorrhage
Intra-arterial & Symptomatic Intracranial Hemorrhage
IV t-PA & Life-threatening, serious systemic hem
Intra-arterial & Life-threatening
Co-morbidities among Stroke Patients
Quarter 2 Quarter 3
The most common type of complication for thrombolytic therapy in Quarter 3 was Intra-arterial
and Symptomatic Intracranial Hemorrhage at 73.1%. This was an increase from Quarter 2, but
the difference was not significant, with a sample size in Quarter 2 of 27 and a sample size in
Quarter 3 of 26.

• •
Initial exam findings
Quarter 2 and Quarter 3 Initial Exam Findings
Quarter 2 Quarter 3
66%63%
24%
39% 45%
4% 0%
7%
24%
44% 47%
3% 0%
6%
The most common findings in initial exam of patients were weakness/paresis (65.5%), language
disturbance (43.6%), and other neurological symptoms (45.1%).

• •
Length of stay (LOS)
The type of stroke with the longest length of hospital stay was SAH at about 11 days, and the
type of stroke with the shortest LOS was TIA at about 3 days.
GWTG/PAA Defect Free
93% of patients received defect free care
according to GWTG standards.
Defect Free 93%
Not Defect Free 7%
Quarter 3 Percentage GWTG/PAA Defect Free
n = 2421
5.9 5.3
2.4
12.2
8.0
4.8 5.5
1.8
6.0 5.6
2.8
11.3
7.7
5.2
3.3 1.8
All Patients Ischemic Stroke
Transient Ischemic
Attack
Subarachnoid Hemorrhage
Intracerebral Hemorrhage
Stroke of Uncertain
Type
No stroke related
diagnosis
Elective Carotid
Intervention only
Average Length of Stay Quarter 2 and 3
Quarter 2 Average Quarter 3 Average
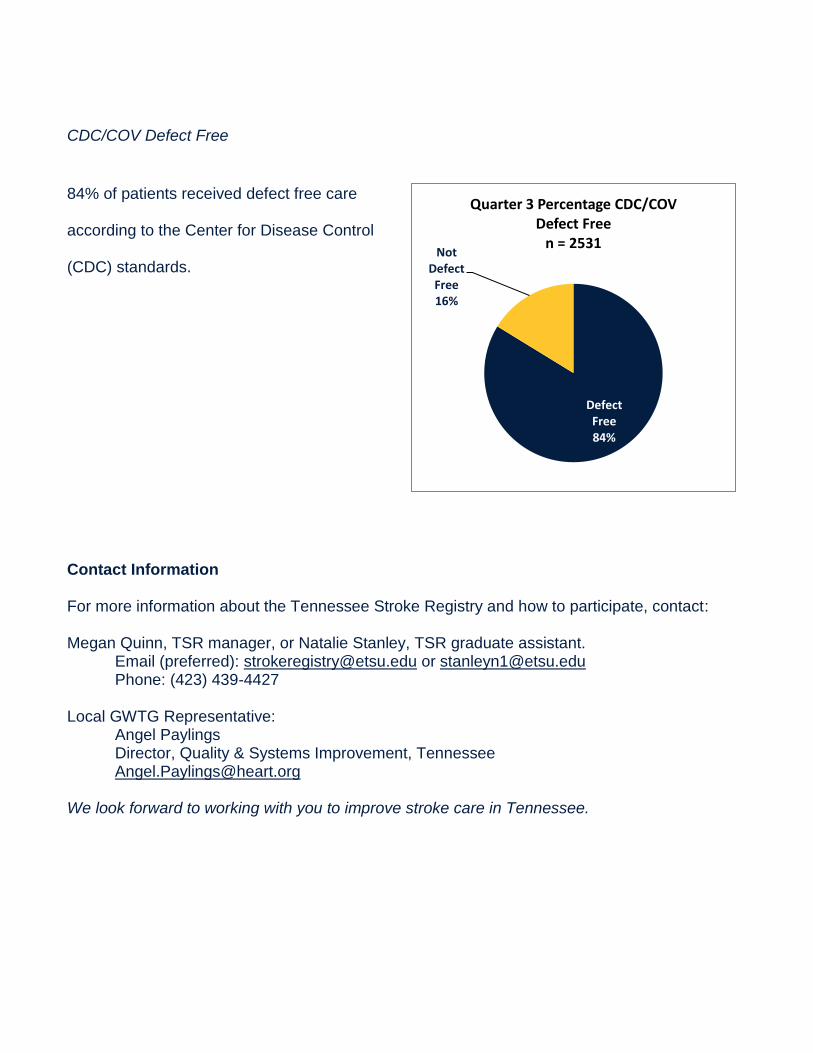
CDC/COV Defect Free
84% of patients received defect free care Quarter 3 Percentage CDC/COV
Defect Free according to the Center for Disease Control n = 2531
Not (CDC) standards. Defect
Free 16%
Defect Free 84%
Contact Information
For more information about the Tennessee Stroke Registry and how to participate, contact:
Megan Quinn, TSR manager, or Natalie Stanley, TSR graduate assistant. Email (preferred): [email protected] or [email protected] Phone: (423) 439-4427
Local GWTG Representative: Angel Paylings Director, Quality & Systems Improvement, Tennessee [email protected]
We look forward to working with you to improve stroke care in Tennessee.
Top Related