


Languages
Pages
Legal


Transportation in the Northeast Corridor of the U.S.: A Multimodal and Intermodal Conceptual Framework.
Research performed for the Institution for Transportation Policy Studies (ITPS)
Toranomon Marine Building 3F 3-‐18-‐19 Toranomon, Minato Ku
Tokyo 105-‐0001 Japan
Contact Mr. Kenji Shimizu Email: [email protected]
By
Massachusetts Institute of Technology (MIT) Prof. Joseph M. Sussman, Principal Investigator
1-‐617-‐253-‐4430 [email protected]
Final Project Report February 29, 2012


MIT HSR/Regions Group Sussman Introductory comments
i
Introductory comments Joseph M. Sussman
The Northeast Corridor of the United States – stretching from Boston, MA to Washington, DC – is the most densely settled region in the richest country in the world, yet it has been plagued for decades with congestion of all types on its roads, in the air and on its rails. It is arguably the most studied region in the world from a transportation perspective, but is also one of the most challenging to study: for example, the rail system alone has four owners and nine passenger rail operators, as shown in Figure I, operating on infrastructure originally built around the turn of the 20th century.
Given the myriad studies that have been done, one might ask what value added there will be in yet another study of this vital region – vital from both a national and an international perspective. There are two reasons. First of all, the Obama administration in the U.S. has made high-‐speed rail a national priority, the first U.S. administration to do so ever. Conflicts between the political parties are intense with the Democrats (Pres. Obama’s party) and the Republicans usually at loggerheads. The Republicans, while not favoring by any means a national high-‐speed rail system, seem inclined to consider the Northeast Corridor as the one place in the United States where high-‐speed rail might make sense. Representative John Mica, a Republican from Florida and the Chairman of the powerful House Transportation and Infrastructure Committee in Congress, seems to favor this possibility.
The second reason for further study is that the nascent field of engineering systems as studied in the Engineering Systems Division of MIT presents the possibility of looking at the Northeast Corridor with new methods that could possibly lead to further insights about how one might go about improving mobility.
This study applies new and innovative methods in the engineering systems field to seek those insights. It is the first phase of what we hope is a multi-‐phase project and the work reported on herein, while reaching a useful set of conclusions, in some sense serves as a platform for further study of this region.
The methods that the research team has used to study the Northeast Corridor are:
The CLIOS Process, extended in this work to study connectivity of various components in the CLIOS representation that we develop in this research;
Scenario analysis used in conjunction with the CLIOS Process in a unique way to understand the main sources of uncertainty; and
The concept of “Flexibility” in developing what we call “bundles of strategic alternatives” for going forward toward implementation.

MIT HSR/Regions Group Sussman Introductory comments
ii
Linking these concepts together – the CLIOS Process, scenarios and flexibility – in a unique way, breaks down some preconceived ways of thinking about the well-‐studied Northeast Corridor. The results of this research are embodied in:
1) the CLIOS representation, presented in Chapter 1;
2) extensions to the CLIOS representation to identify highly-‐leveraged points in the representation, introduced in Chapters 4 and 5;
3) scenario analysis to identify how uncertainty could manifest itself and what implications it has for planning in the corridor, presented in Chapter 6; and finally
4) flexibility analysis – the notion that by creating flexible strategic alternatives, we can deal more effectively with uncertainty – introduced in Chapter 7.
The overall result has been some useful new ways of thinking about the Northeast Corridor.
In parallel to these activities, we have also developed some proposed goals, objectives and performance measures that are discussed in Chapter 2; generated some possible “bundles of strategic alternatives” that are introduced in Chapter 3; and identified some quantitative models for detailed analysis that are presented in Chapter 8. The logical connection between all nine chapters in the body of the report is highlighted in the flow chart shown in Figure II. Further information about the CLIOS Process, a potential stakeholder analysis typology, and the programming code required to identify some of the “high-‐impact” paths in the CLIOS Representation can be found in Appendices A, B, and C, respectively.
We note that this research for JITI was not performed in a vacuum. Rather it is part of a portfolio of high-‐speed rail-‐oriented research being carried out in the High-‐speed Rail/Regions Research Group headed by Prof. Joseph Sussman at MIT. Other projects that in many instances informed our views, is work dealing with the development of high-‐speed rail in Portugal, studies of international comparisons of high-‐speed rail productivity in various countries and in various institutional settings, and studies concerned with the relationship between air and high-‐speed rail transportation considering case studies in Europe, China and the United States. This final study attempts to categorize the environmental impact of various high-‐speed modes including high-‐speed rail and air with an eye to considering how public policies could be developed to ameliorate air pollution and global climate change. The researchers in each of these areas, all supervised by Prof. Sussman, added to the rich mix of perspectives that informed this research. The research team of Prof. Sussman, Andrés F. Archila, S. Joel Carlson, M.T. (Maite) Peña-‐Alcaraz and Naomi Stein, thank their colleagues for their contributions to our thinking on this JITI Project.
Further thanks are due to Mr. Kenji Shimizu of JITI who provided many excellent suggestions as the work proceeded over these past six months. Mr. Shimizu gave us very

MIT HSR/Regions Group Sussman Introductory comments
iii
useful feedback on our progress reports and he has served as an excellent partner in this research endeavor.
This project proved to be an especially interesting research activity. As it should be in research, when we began the project we could not fully define the results – and this is certainly true on the JITI Project. Ideas have emerged and integrated into our work plan that we had not anticipated. Other ideas which we thought would be of value were ultimately discarded. But we hope on balance we have prepared a report that will be of value to our sponsors and to the professional community.

MIT HSR/Regions Group Sussman Introductory comments
iv
Figure I: Map of Northeast Corridor rail infrastructure owners and passenger rail operators (Source: NEC
Infrastructure Master Plan Working Group 2010)

MIT HSR/Regions Group Sussman Introductory comments
v
Figure II: Logical connections between the nine chapters in this report

MIT HSR/Regions Group Table of contents
vi
Table of contents
Glossary
Chapter 1 CLIOS Representation of the Northeast Corridor (NEC) 1-‐1
Chapter 2 Northeast Corridor goals, objectives and performance measures 2-‐1
Chapter 3 Northeast Corridor bundles of strategic alternatives 3-‐1
Chapter 4 Next steps in the CLIOS representation: Component connectivity and path impact
4-‐1
Chapter 5 Discussion of high-‐impact paths and their implications on the bundles of strategic alternatives
5-‐1
Chapter 6 Development of scenarios 6-‐1
Chapter 7 Adding Flexibility to the bundles of strategic alternatives 7-‐1
Chapter 8 Quantitative models needed for detailed analysis 8-‐1
Chapter 9 Closing comments and next Steps 9-‐1
Appendix A CLIOS Process teaching Note A-‐1
Appendix B Stakeholders analysis -‐ salience and decision-‐making B-‐1
Appendix C MATLAB Algorithm for Characterizing Paths C-‐1

MIT HSR/Regions Group Pena, Archila and Carlson Glossary
vii
Glossary Maite Peña-‐Alcaraz | Andrés F. Archila | S. Joel Carlson
In this glossary we present the definition of many of the concepts widely used along the report. The glossary is organized in alphabetical order. Italicized comments indicate that the word is a CLIOS term.
Actors: an actor is an institutional stakeholder in the CLIOS representation.
Bundles: a bundle is a set of strategic alternatives for simultaneous or phased implementation.
Class 1 link: a link is called a class 1 link when it connects components in the physical domain.
Class 2 link: a link is called a class 2 link if it connects a component in the physical domain with an actor in the institutional sphere.
Class 3 link: a link is called a class 3 link if it connects actors in the institutional sphere.
CLIOS system: a CLIOS system (complex, large-‐scale, interconnected, open, sociotechnical system) is a class of engineering systems with wide-‐ranging social and environmental impacts, and important technological components.
CLIOS process: The CLIOS process is a methodology to study CLIOS systems. It can be used as an organizing mechanism for understanding a CLIOS System’s underlying structure and behavior, identifying and deploying strategic alternatives for improving the system’s performance, and monitoring the performance of those strategic alternatives.
CLIOS representation: The CLIOS representation is the first one of three stages of the CLIOS process. The representation stage is primarily diagrammatic in nature. Diagrams are used to represent the structure and behavior of the CLIOS System by graphically illustrating the system components and interactions in the physical domain, on the institutional sphere, and between them. An accompanying text describing and explaining the CLIOS System diagrams is often helpful.
Common driver: common drivers are components that are shared across multiple and possibly all subsystems of the physical domain.
Component: components are the basic units that make up a subsystem in the CLIOS representation.
Driving force: key factor that will drive the behavior of a system (Schwartz, 1996).
External factor: external factors can be defined as components outside the boundaries of the CLIOS system that usually influence the CLIOS System unidirectionally.
MIT HSR/Regions Group Pena, Archila and Carlson Glossary
viii
Flexibility: flexibility refers to the ability to adjust a design of a system in significant ways that enable the decision maker to redirect the system in a way that either avoids downside consequences or exploits upside opportunities (de Neufville, 2004).
High-‐impact path or subnetwork: is a path or collections of paths of the CLIOS representation with high values of the impact associated with them.
Impact: the impact of a path is a measure of the importance of the path and is computed as the product of the path speed and the path strength.
Institutional sphere: the institutional sphere includes actors and organizations (i.e. the institutional stakeholders) that influence and affect (and are affected by) one or all of the subsystems.
Link: a link is defined as a direct oriented connection between two components in the CLIOS Representation
Loop: a loop is defined as a path that returns to the initial component on the path.
Low-‐impact path: is a path of the CLIOS representation with low values of the impact associated with them.
Path: a path is defined as a collection of two or more components connected together through links.
Physical domain: the physical domain is the set of all subsystems of the CLIOS representation without considering the institutions (such as the transportation subsystem, the land use subsystem, for example).
Policy lever: policy levers are components within the physical domain that are most directly controlled or influenced by decisions taken by the actors — often institutions and organizations – on the institutional sphere.
Real option: is the right, but not the obligation, for the option holder to take some action at a future date at a predetermined price (McConnell, 2007).
Robustness: is the ability to perform reasonably well under different futures (Sussman et al., 2009).
Scenario: a scenario is a story about the way in which the world might turn out (Schwartz, 1996).
Speed: the speed of a path represents how fast the effect that the initial component produces on the final component propagates.
Strategic alternatives: the strategic alternatives represent changes that are intended to enhance the performance of the CLIOS system. These strategic alternatives can take the

MIT HSR/Regions Group Pena, Archila and Carlson Glossary
ix
form of changes to the subsystems in the physical domain, or changes to the related organizations and their inter-‐relationships on the institutional sphere.
Strength: the strength of a path represents the proportionality of the effect of the initial component of a path in the final component of the path.
Subnetwork: a subnetwork is a collection of interconnected paths and loops of the CLIOS representation.
Subsystem: in this report, subsystems refer to major parts of the physical domain.
Vertical integration: this term refers to having ownership and management of both track infrastructure and train operations handled by one organization.
Vertical separation: vertical separation refers to having the ownership and maintenance of track infrastructure handled by one organization and train operations handled by one or several other organizations.
REFERENCES
de Neufville, R. (2004). Uncertainty Management for Engineering Systems Planning and Design, Monograph, 1st Engineering Systems Symposium. MIT, Cambridge, MA. http://esd.mit.edu/symposium/pdfs/monograph/uncertainty.pdf, (accessed on 28 February 2012).
McConnell, J.B. 2007. A Life-‐Cycle Flexibility Framework for Designing, Evaluating and Managing "Complex" Real Options: Case Studies in Urban Transportation and Aircraft Systems. MIT PhD dissertation.
Schwartz P., (1996). The Art of the Long View.
Sussman, J. et al. 2009. The CLIOS Process: A User’s Guide – February 2009. (Included as Appendix A)

MIT HSR/Regions Group Archila and Carlson Chapter 1 - CLIOS Representation of the Northeast Corridor
1-1
Chapter 1
CLIOS Representation of the Northeast Corridor (NEC) Andrés F. Archila | S. Joel Carlson _________________________________________________________________________________________________________
CONTENTS
Introductory Comments
Introduction to the CLIOS Representation
Boundaries of the CLIOS Representation
Physical Domain
Institutional Sphere
References
INTRODUCTORY COMMENTS
This chapter describes the complete CLIOS representation of the Northeast Corridor (NEC),
as a follow-up to the project initiation memo on October 17, 2011. The CLIOS
representation is a key element of the overall conceptual framework we will be creating in
this research. The research team’s hope is that our approach will lead to new insights about
the corridor and the role of HSR within it.
For this progress report we assume the reader is familiar with Sussman et al., 2009, which
discusses the CLIOS Process in detail.
INTRODUCTION TO THE CLIOS REPRESENTATION
The first stage of the CLIOS process involves creating a system representation of the
Northeast Corridor. This representation includes a physical domain composed of
subsystems (such as the transportation subsystem, the land use subsystem, for example)
nested within an institutional sphere containing actors that can influence or be influenced
by the physical domain (Sussman et al. 2009). Representation of the NEC is ongoing and
the preliminary diagrams and descriptions can be found below.
We describe some of the challenges the research group has encountered trying to define
the boundaries of the CLIOS representation and then present and summarize the initial
representations of the physical subsystems. Finally, a description of some of the key
institutional actors is presented.
The CLIOS process is iterative. The diagrams and information presented here will be
expanded upon and refined as necessary to present a clear and comprehensive

MIT HSR/Regions Group Archila and Carlson Chapter 1 - CLIOS Representation of the Northeast Corridor
1-2
representation of the NEC. In addition to figures found in this chapter, an interactive
version of the CLIOS representation is available as a complement to this report at:
http://prezi.com/cyl0h8yglkcb/clios-rep-of-the-nec/?auth_key=d5f248efb258bf65d86ee1cbe6a410b9c0609c07
BOUNDARIES OF THE CLIOS REPRESENTATION
One of the challenges associated with creating the CLIOS representation is determining the
system boundaries. When working through the first stage of the CLIOS process for the NEC,
the High-Speed Rail/Regions Research Group debated whether to include or exclude
various components and subsystems in the representation. As an example of choices the
research group made, it considered including the relationship between transportation and
work force education (which relates to productivity), but decided against including such a
link. Although such research could be valuable, considering this relationship would likely
not significantly affect the evaluation of the strategic alternatives.
The research group also debated whether to include an “energy subsystem,” which
represents the major components of electricity generation. In this case, the group decided
to include the energy subsystem in the representation as it may impact the evaluation of
the strategic alternatives. When constructing an environmental subsystem, the research
group realized that most of its components were common drivers with links already shown
in other subsystems, especially in the energy subsystem. This high degree of dependence of
the environmental subsystem to the energy subsystem motivated the research group to
combine them into an energy/environmental subsystem.
Another potential subsystem evaluated was a “culture of travel” subsystem. Its purpose
was to show how transportation choices vary over time. However, the research group came
to the conclusion that this behavioral change would be better captured through
performance measures rather than from additional subsystems.
Although these three examples represent some of the larger decisions made by the
research group to include or exclude specific components, individual analysts drafting the
representations make many other smaller decisions frequently. As a result, because
defining of the boundaries and the structure of the CLIOS representation is a subjective
process, the research team collaborates and updates the diagrams frequently to ensure the
representation is comprehensive and not subject to the preconceived notions of one
individual analyst. To further ensure that the CLIOS representation is comprehensive and
unbiased, the research group carried on independent checks from fellow researchers.
MIT HSR/Regions Group Archila and Carlson Chapter 1 - CLIOS Representation of the Northeast Corridor
1-3
PHYSICAL DOMAIN
For the purposes of this CLIOS representation, the physical domain has been divided into
five subsystems and 52 components (11 common drivers, 25 [regular] components, 10
policy levers and 6 external factors):
• Transportation subsystem,
• Energy / environmental subsystem,
• Land use subsystem,
• Economic activity subsystem,
• Multi-modal transportation subsystem
Because the CLIOS process is intrinsically subjective, the reader may argue that some
subsystems overlap, some components of the system were ignored or some links between
components are missing. Indeed, one of the challenges of the CLIOS process is to simplify
the system, such that it replicates the original dynamics and yet provides a manageable
representation. In the following diagrams, only strong, direct relationships among
components are shown, while weak relationships are ignored. The links between
components that are strongly but indirectly related can be revealed by following the links
between intermediate components inside the subsystem. While the number of direct links
between components is fixed and relatively small, the amount of indirect connections
between components is significantly greater and may provide new insights and
unanticipated relationships.
It is also noteworthy that the connection between components is independent of the
subsystem. Each subsystem is defined by the analyst as a collection of components and
links between those components, which exist a priori. The function of the subsystems is to
help us understand the dynamics of the Physical Domain. For instance, by using the same
set of components and links of this particular CLIOS system, an independent user could
define alternative subsystems to those presented here and discover new interactions.
Finally, to clarify the use of some terms, a brief description of each component in the
Physical Domain is included.
TRANSPORTATION SUBSYSTEM
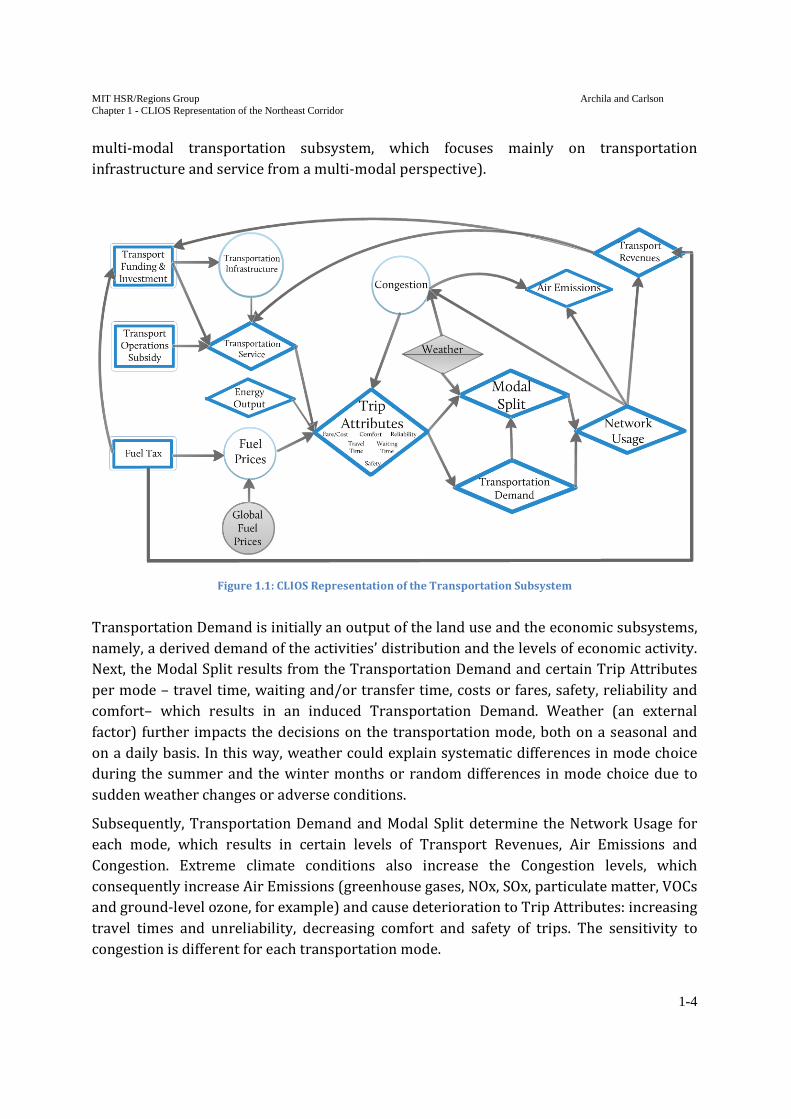
Figure 1.1 shows the CLIOS representation of the transportation subsystem. In this
representation, transportation modes have not (yet) been separated As a result, some of
the components may not be applicable for all transportation modes (i.e. “transportation
service” is particularly applicable to shared transportation options [such as train and bus],
but not particularly useful in describing private auto travel). For a first order of
understanding of the system, this generalization is acceptable. However, in order to obtain
a greater level of detail of the CLIOS system and of the impact of strategic alternatives,
especially involving high-speed rail, a multi-mode expansion is included (please refer to the
MIT HSR/Regions Group Archila and Carlson Chapter 1 - CLIOS Representation of the Northeast Corridor
1-4
multi-modal transportation subsystem, which focuses mainly on transportation
infrastructure and service from a multi-modal perspective).
Figure 1.1: CLIOS Representation of the Transportation Subsystem
Transportation Demand is initially an output of the land use and the economic subsystems,
namely, a derived demand of the activities’ distribution and the levels of economic activity.
Next, the Modal Split results from the Transportation Demand and certain Trip Attributes
per mode – travel time, waiting and/or transfer time, costs or fares, safety, reliability and
comfort– which results in an induced Transportation Demand. Weather (an external
factor) further impacts the decisions on the transportation mode, both on a seasonal and
on a daily basis. In this way, weather could explain systematic differences in mode choice
during the summer and the winter months or random differences in mode choice due to
sudden weather changes or adverse conditions.
Subsequently, Transportation Demand and Modal Split determine the Network Usage for
each mode, which results in certain levels of Transport Revenues, Air Emissions and
Congestion. Extreme climate conditions also increase the Congestion levels, which
consequently increase Air Emissions (greenhouse gases, NOx, SOx, particulate matter, VOCs
and ground-level ozone, for example) and cause deterioration to Trip Attributes: increasing
travel times and unreliability, decreasing comfort and safety of trips. The sensitivity to
congestion is different for each transportation mode.

MIT HSR/Regions Group Archila and Carlson Chapter 1 - CLIOS Representation of the Northeast Corridor
1-5
Some of the Transport Revenues are destined to Transport Funding and Investment, which
then determines the levels of maintenance and improvements of the Transportation
Infrastructure. Transport Funding and Investment as well as Transport Revenues are
strongly dependent on the excise Fuel Tax. An additional recipient of Transport Revenues
and Transport Investment is Transportation Service, which also benefits from a “state of
good repair” (one of five overarching goals that U.S. DOT has put forward for the national
transportation system) for the Transportation Infrastructure. Usually for mass transit
systems, an additional Subsidy is given to cover operational costs.
Then, Transportation Service, Energy Output (to be defined in the next subsystem) and
Fuel Prices influence the relative Trip Attributes as described before. Energy Output is
especially important in setting the travel costs for public transportation, whereas Fuel
Prices play a major role both for private and public vehicles. Fuel Prices are sensitive to
variations in external factors, such as the Global Fuel Prices, or governmental policies, such
as the Fuel Tax.
The above factors lead to the first loops in the subsystem and therefore it is revealed as a
dynamic, rather than as static system. Common drivers further link the subsystem to other
subsystems in the physical domain. It is not surprising that half of the components of this
subsystem are common drivers, since transportation demand is derived demand from all
other human activities. Those linkages are discussed in the respective subsystem
descriptions.
ENERGY SUBSYSTEM
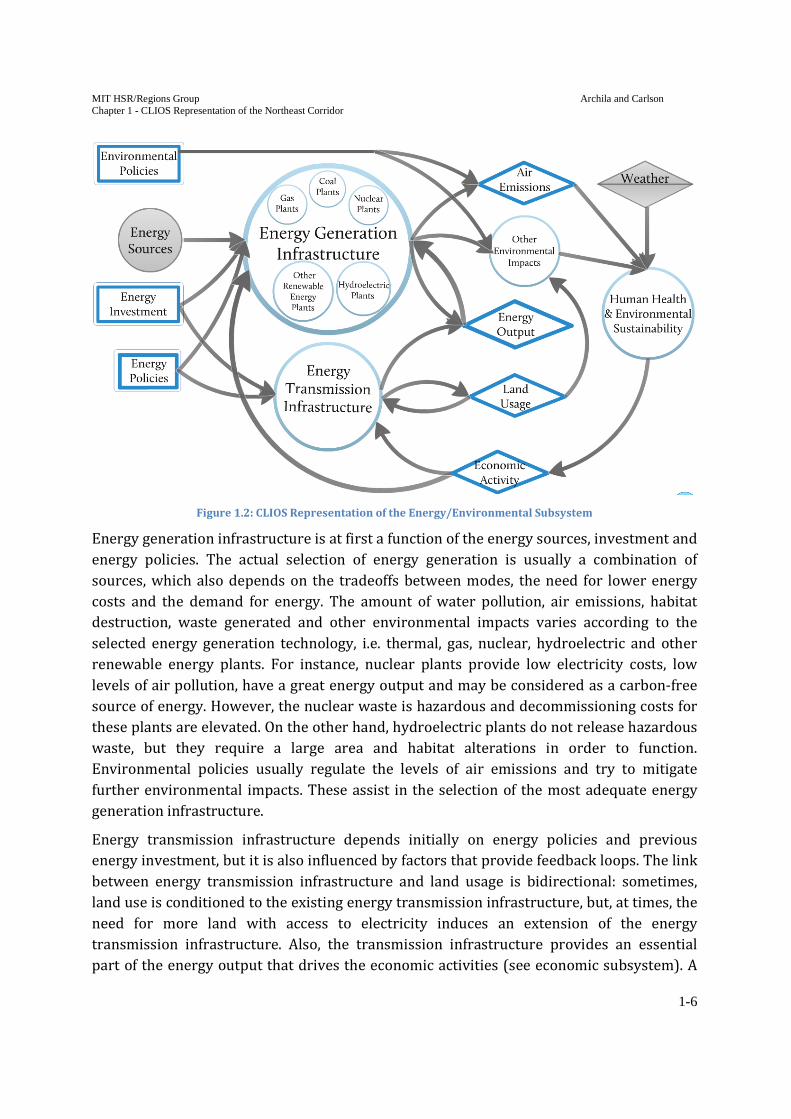
Figure 1.2 shows the CLIOS representation of the energy/environmental subsystem. The
most relevant component of this subsystem to the transportation subsystem is Energy
Output, although Land Usage and Economic Activity are common drivers with strong links
in multiple subsystems and are also important for transportation. Here, the term “energy
output” refers to the mode, amount, availability, reliability and cost of energy.
The type of energy generation technology and fuel selected determine to a great extent the
energy output, although energy transmission infrastructure significantly modifies the
output. Special care must be paid to environmental damages caused by energy generation,
as they degrade human health and the environment, which reduces the levels of economic
activity and threatens the sustainability of society.
MIT HSR/Regions Group Archila and Carlson Chapter 1 - CLIOS Representation of the Northeast Corridor
1-6
Figure 1.2: CLIOS Representation of the Energy/Environmental Subsystem
Energy generation infrastructure is at first a function of the energy sources, investment and
energy policies. The actual selection of energy generation is usually a combination of
sources, which also depends on the tradeoffs between modes, the need for lower energy
costs and the demand for energy. The amount of water pollution, air emissions, habitat
destruction, waste generated and other environmental impacts varies according to the
selected energy generation technology, i.e. thermal, gas, nuclear, hydroelectric and other
renewable energy plants. For instance, nuclear plants provide low electricity costs, low
levels of air pollution, have a great energy output and may be considered as a carbon-free
source of energy. However, the nuclear waste is hazardous and decommissioning costs for
these plants are elevated. On the other hand, hydroelectric plants do not release hazardous
waste, but they require a large area and habitat alterations in order to function.
Environmental policies usually regulate the levels of air emissions and try to mitigate
further environmental impacts. These assist in the selection of the most adequate energy
generation infrastructure.
Energy transmission infrastructure depends initially on energy policies and previous
energy investment, but it is also influenced by factors that provide feedback loops. The link
between energy transmission infrastructure and land usage is bidirectional: sometimes,
land use is conditioned to the existing energy transmission infrastructure, but, at times, the
need for more land with access to electricity induces an extension of the energy
transmission infrastructure. Also, the transmission infrastructure provides an essential
part of the energy output that drives the economic activities (see economic subsystem). A

MIT HSR/Regions Group Archila and Carlson Chapter 1 - CLIOS Representation of the Northeast Corridor
1-7
higher level of economic activity may force an upgrade in the current transmission
infrastructure. All in all, the objectives of the transmission infrastructure are to maximize
the coverage, minimize the transmission losses and provide a reliable source of energy.

MIT HSR/Regions Group Archila and Carlson Chapter 1 - CLIOS Representation of the Northeast Corridor
1-8
LAND USE SUBSYSTEM
Figure 1.3 shows the CLIOS representation of the land use subsystem, which is intended to
show the distribution of activities. The Land Usage component represents the distribution
of location, amount and type of land that is being used at any given time by either firms or
households.
Figure 1.3: CLIOS Representation of the Land Use Subsystem
Land Usage is a function of the Land Supply, Demand and Costs. The Land Supply is
determined by the Physical Characteristics of Land, which depend on the Natural
Characteristics of the plot and on its previous usage; by the Land Accessibility, which refers
to the ability of goods, services, energy or people to reach the land and depends on the
existing Transportation Service, Energy Output and Land Usage; and finally by
Environmental and Land Use Policies that regulate the land use.
The Land Demand is determined by the distribution of Economic Activity and by
Demographics.
Finally, the Land Cost is defined through land demand/supply interactions and the
combination of these three components yield the Land Usage and completes the loop.
Changes in physical characteristics and accessibility are expected. At last, the new
MIT HSR/Regions Group Archila and Carlson Chapter 1 - CLIOS Representation of the Northeast Corridor
1-9
distribution of activities modifies the transportation demand, which is a common driver in
several subsystems.
ECONOMIC SUBSYSTEM
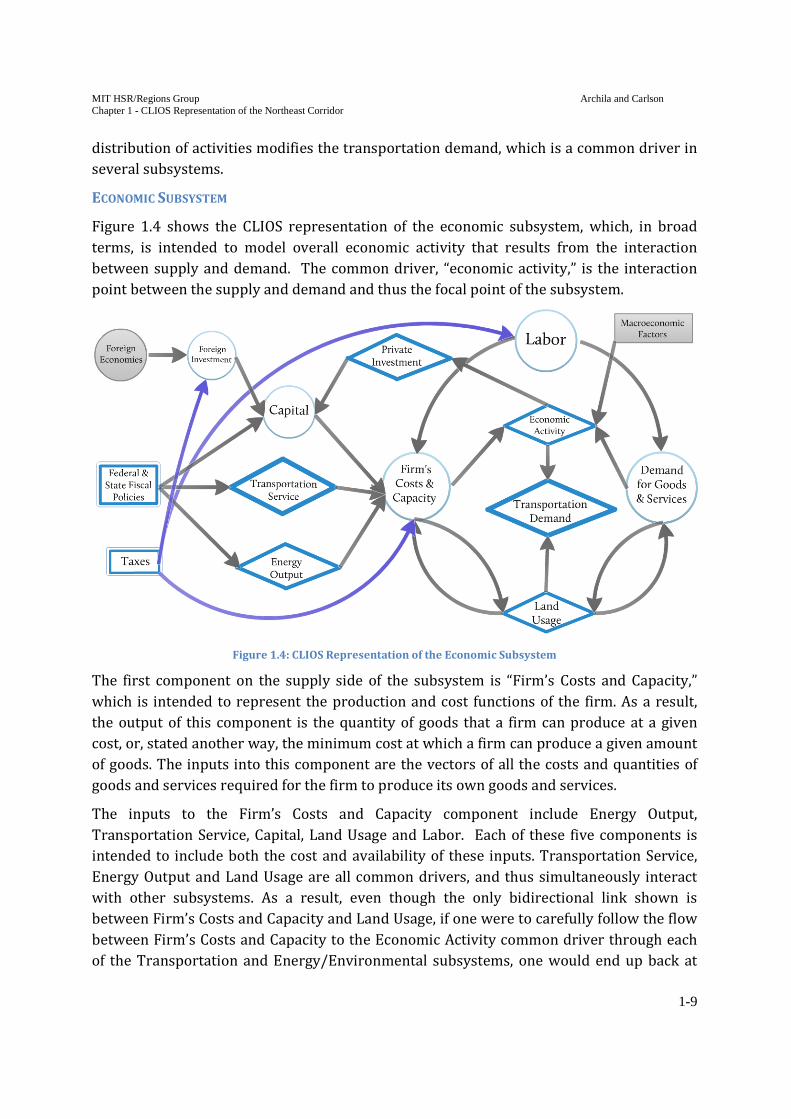
Figure 1.4 shows the CLIOS representation of the economic subsystem, which, in broad
terms, is intended to model overall economic activity that results from the interaction
between supply and demand. The common driver, “economic activity,” is the interaction
point between the supply and demand and thus the focal point of the subsystem.
Figure 1.4: CLIOS Representation of the Economic Subsystem
The first component on the supply side of the subsystem is “Firm’s Costs and Capacity,”
which is intended to represent the production and cost functions of the firm. As a result,
the output of this component is the quantity of goods that a firm can produce at a given
cost, or, stated another way, the minimum cost at which a firm can produce a given amount
of goods. The inputs into this component are the vectors of all the costs and quantities of
goods and services required for the firm to produce its own goods and services.
The inputs to the Firm’s Costs and Capacity component include Energy Output,
Transportation Service, Capital, Land Usage and Labor. Each of these five components is
intended to include both the cost and availability of these inputs. Transportation Service,
Energy Output and Land Usage are all common drivers, and thus simultaneously interact
with other subsystems. As a result, even though the only bidirectional link shown is
between Firm’s Costs and Capacity and Land Usage, if one were to carefully follow the flow
between Firm’s Costs and Capacity to the Economic Activity common driver through each
of the Transportation and Energy/Environmental subsystems, one would end up back at

MIT HSR/Regions Group Archila and Carlson Chapter 1 - CLIOS Representation of the Northeast Corridor
1-10
the Transportation Service and Energy Output common drivers, respectively. As a result,
the interaction of these components forms a feedback cycle, which shows that, as economic
activity increases, Transportation Service and Energy Output should increase as well, or
risk stifling economic activity.
The central component on the demand side of the subsystem is the Demand for Goods and
Services component. This component is driven by Labor, which is intended to represent the
employment and wages of individuals, and Land Usage. The link between Land Usage and
Demand for Goods and Services is bidirectional as, if the demand for a certain good or
service increases, the land use may change to reflect that new desire; and if the land use
changes and a new good or service becomes available, the demand for this good or service
might increase.
Other factors can also influence this process, including several policy levers. For example,
Federal and State Fiscal Policies can influence the cost of Capital, Transportation Service
and Energy Output. Increasing (decreasing) Taxes can have a significant impact on the real
wages of Labor, and can indirectly increase (decrease) a firm’s labor costs. As well,
increasing (decreasing) Taxes also increases (decreases) the burden on individuals, and
thus indirectly affects demand. Finally, Private Investment and Foreign Investment can
improve the quantity and cost of providing Capital.
As a final note regarding this subsystem, it would be interesting to study ways in which the
economic activity generated from an investment in transportation (and in particular, HSR)
could be harnessed to spur more private investment in transportation: that is, seeing how
the Private and Foreign Investment components could be related to the Transportation
Infrastructure and Service components, and thus form a feedback loop similar to the two
described above. Public-private partnerships could be one method to achieve this goal, and
there may be other methods.
MULTI-MODAL TRANSPORTATION SUBSYSTEM
Figure 1.5 shows the multi-modal transportation subsystem. Transportation infrastructure
and service are enlarged in order to look at them in a disaggregate way. This subsystem
interprets transportation as a network of Linkages and Nodes used by Vehicles subject to
certain Frequencies. Each of these four components includes representatives from the each
transportation mode, from both private and public sectors, from regional and local levels
and from passenger and freight transportation. These representatives can be organized
according to the previous characteristics and hierarchy when moving inside each
component in the counter-clockwise direction. Some representatives are exclusive to a
transportation mode, economic sector, geographical scale and target, but others are shared,
and they are shown towards the center of each component.

MIT HSR/Regions Group Archila and Carlson Chapter 1 - CLIOS Representation of the Northeast Corridor
1-11
Figure 1.5: CLIOS Representation of the Multi-Modal Transportation Subsystem
Representatives of Nodes are parking lots, bus terminals, transit stops, train stations, ports
and airports. The distribution of housing is ignored at this level of detail.
Representatives of Linkages are highways, roads, tunnels, bridges, transit lines, ROW, track,
airspace.
Representatives of Vehicles are automobiles, intercity buses, transit cars, trucks, freight
trains, intercity trains and aircraft. Bicycles are ignored at this level of detail.
Representatives of Frequency are bus schedule, transit schedule, train schedule and air
schedule. Schedule here refers not only to the time when a vehicle departs but the pattern
of linkages that it follows.
Nodes and Linkages represent the infrastructure of the transportation system and
determine its geographical Coverage, that is, the number of people or the amount of goods
that is in close proximity to a mode and can be connected to a destination that is under the
system’s coverage. All four components (Nodes, Linkages, Vehicles and Frequencies)
determine the system’s capacity per mode. Coverage and Capacity determine the basic Trip
Attributes per mode, given that a person or good can only be transported by a single mode.
However, if there is Connectivity between modes, synergies may appear and hence modify
the composed Trip Attributes.

MIT HSR/Regions Group Archila and Carlson Chapter 1 - CLIOS Representation of the Northeast Corridor
1-12
As explained in the “Transportation Subsystem”, Trip Attributes play a major role in
determining the Modal Split, which then partially determines the Network Usage.
Variations in Network Usage may force changes in Coverage and Capacity of the system.
There are two ways to achieve changes in Trip Attributes. First, better capacity and
coverage may be achieved through further modifications in representatives of the Nodes,
Linkages, Vehicles or Frequency. Such modifications to the network components can come
from either Private Investment or public Transport Funding and Investment. Private
Investment is strongly link to Transport Revenues and public Funding and Investment
depends both on Taxes and Transport Revenues. On the other hand, synergies may be
formed by encouraging Connectivity among combinations of two or more modes in the
existing network through Inter-Modal Integration Policies.
DISCUSSION OF COMPONENTS IN THE PHYSICAL DOMAIN
As mentioned before, the physical domain comprises five subsystems and 52 components:
11 common drivers, 25 (regular) components, 10 policy levers and 6 external factors. In
order to clarify the use of some terms, Table 1.1 provides a list of components in the
physical domain and brief description of each one.
Table 1.1: Description of Components in the Physical Domain.
COMMON DRIVERS
# Name Description
1 Transportation Demand Combination of O-D patterns and volumes. It includes both
the aggregate and disaggregate demand
2 Energy Output Mode, amount availability, reliability and cost
3 Transportation Service Transportation operations, including frequency, reliability
and quality of service
4 Modal Split Share of the transportation demand per mode
5 Air Emissions Both greenhouse gases and NOx
6 Trip Attributes Includes in-vehicle travel time, waiting time at stops,
transfer time, walking time, safety, security, reliability and
comfort
7 Network Usage Usage volumes per mode. Subject to capacity constraints
8 Transport Revenues Revenues obtained from providing transportation services
9 Land Usage Specifies location, quantity and type of land
10 Economic Activity Vector of GDP, GDP per capita and income distribution
11 Private Investment Private investment in all sectors of the economy including
transportation
MIT HSR/Regions Group Archila and Carlson Chapter 1 - CLIOS Representation of the Northeast Corridor
1-13
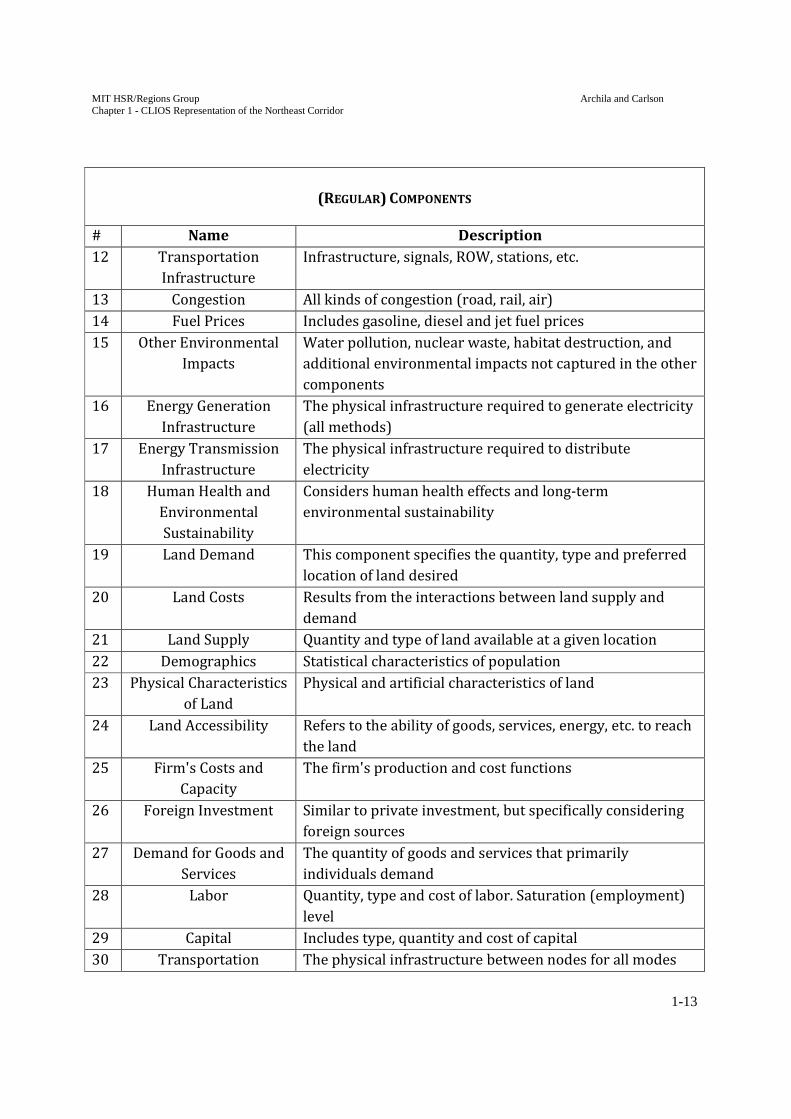
(REGULAR) COMPONENTS
# Name Description
12 Transportation
Infrastructure
Infrastructure, signals, ROW, stations, etc.
13 Congestion All kinds of congestion (road, rail, air)
14 Fuel Prices Includes gasoline, diesel and jet fuel prices
15 Other Environmental
Impacts
Water pollution, nuclear waste, habitat destruction, and
additional environmental impacts not captured in the other
components
16 Energy Generation
Infrastructure
The physical infrastructure required to generate electricity
(all methods)
17 Energy Transmission
Infrastructure
The physical infrastructure required to distribute
electricity
18 Human Health and
Environmental
Sustainability
Considers human health effects and long-term
environmental sustainability
19 Land Demand This component specifies the quantity, type and preferred
location of land desired
20 Land Costs Results from the interactions between land supply and
demand
21 Land Supply Quantity and type of land available at a given location
22 Demographics Statistical characteristics of population
23 Physical Characteristics
of Land
Physical and artificial characteristics of land
24 Land Accessibility Refers to the ability of goods, services, energy, etc. to reach
the land
25 Firm's Costs and
Capacity
The firm's production and cost functions
26 Foreign Investment Similar to private investment, but specifically considering
foreign sources
27 Demand for Goods and
Services
The quantity of goods and services that primarily
individuals demand
28 Labor Quantity, type and cost of labor. Saturation (employment)
level
29 Capital Includes type, quantity and cost of capital
30 Transportation The physical infrastructure between nodes for all modes

MIT HSR/Regions Group Archila and Carlson Chapter 1 - CLIOS Representation of the Northeast Corridor
1-14
Linkages (e.g. track)
31 Transportation Nodes Physical terminal/station infrastructure for all modes
32 Transportation Vehicles Refers to vehicles operated by all modes of transportation
(e.g. cars, buses)
33 Transportation
Frequency
The service plan of the operators
34 Transportation
Capacity
The number of people or amount of goods that can be
transported per mode per unit of time
35 Transportation
Coverage
The number of people or the amount of goods that is in
close proximity to a mode
36 Transportation
Connectivity
The concept of how well the modes are connected
POLICY LEVERS
# Name Description
37 Transport Funding and
Investment
Federal and state investment
38 Transport Operations
Subsidy
How much the government chooses to subsidize
transportation operations
39 Fuel Tax Excise fuel tax. Fixed since 1991
40 Energy Investment Monetary investment in energy
41 Energy Policies Environmental and technical policies
42 Environmental Policies US EPA's regulations
43 Land Use Policies Primarily state and local policies
44 Federal and State Fiscal
Policies
Allocation of expenditures
45 Taxes Includes business and personal taxes
46 Inter-Modal
Transportation
Integration Policies
How well transportation agencies/operators interact
between modes and how well infrastructure is able to
serve multiple modes

MIT HSR/Regions Group Archila and Carlson Chapter 1 - CLIOS Representation of the Northeast Corridor
1-15
EXTERNAL FACTORS
# Name Description
47 Weather Weather and environmental conditions. It is also a common
driver
48 Global Fuel Prices The market price of petroleum products
49 Energy Sources Wind, solar, water, nuclear, coal or gas availability
50 Natural
Characteristics of
Land
Includes slope, type of soils, climate conditions, etc.
51 Foreign Economies Foreign economic factors largely outside of government
control
52 Macroeconomic
Factors
Economic factors largely outside of government control
DISCUSSION OF LINKS IN THE PHYSICAL DOMAIN
The components in the physical domain are connected to each other through class 1 links.
Although these links are shown separately in each of the diagrams, it is also convenient to
have them all in a matrix, together with the component’s definitions. The matrix shows
whether a component belongs to a subsystem or not, the number of appearances of a
component in the subsystems, whether there is a link between components and the
directionality of the links. It also counts how many components are present in a subsystem
and how many links start from or end at a component. Finally, it allows the user to sort the
components according to its type, subsystem, number of appearances and other fields,
which helps the user gain a better understanding of the system. This Component -
Component (Class 1) Links Matrix is included as a separate file.
The 52 components in the physical domain are connected through 103 links, including 4 bi-
directional. In order to clarify the use of some terms, Table 1.2 provides a list of links in the
physical domain, and a brief characterization of each one.
MIT HSR/Regions Group Archila and Carlson Chapter 1 - CLIOS Representation of the Northeast Corridor
1-16
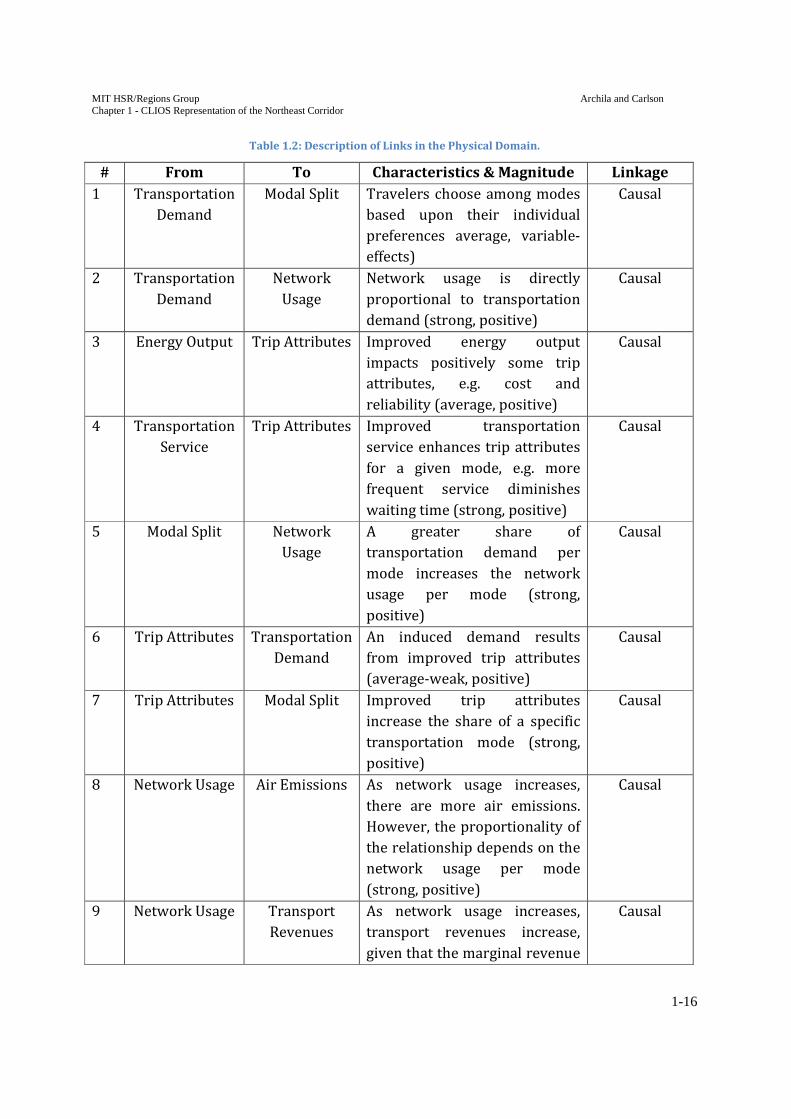
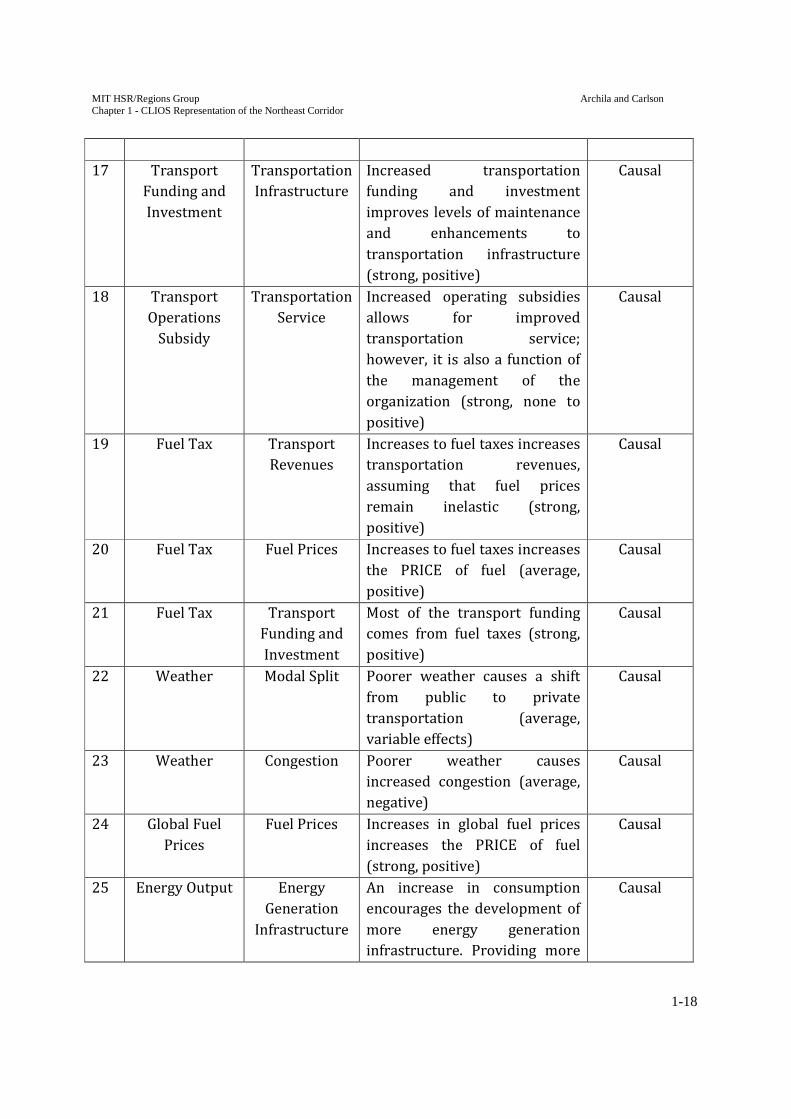
Table 1.2: Description of Links in the Physical Domain.
# From To Characteristics & Magnitude Linkage
1 Transportation
Demand
Modal Split Travelers choose among modes
based upon their individual
preferences average, variable-
effects)
Causal
2 Transportation
Demand
Network
Usage
Network usage is directly
proportional to transportation
demand (strong, positive)
Causal
3 Energy Output Trip Attributes Improved energy output
impacts positively some trip
attributes, e.g. cost and
reliability (average, positive)
Causal
4 Transportation
Service
Trip Attributes Improved transportation
service enhances trip attributes
for a given mode, e.g. more
frequent service diminishes
waiting time (strong, positive)
Causal
5 Modal Split Network
Usage
A greater share of
transportation demand per
mode increases the network
usage per mode (strong,
positive)
Causal
6 Trip Attributes Transportation
Demand
An induced demand results
from improved trip attributes
(average-weak, positive)
Causal
7 Trip Attributes Modal Split Improved trip attributes
increase the share of a specific
transportation mode (strong,
positive)
Causal
8 Network Usage Air Emissions As network usage increases,
there are more air emissions.
However, the proportionality of
the relationship depends on the
network usage per mode
(strong, positive)
Causal
9 Network Usage Transport
Revenues
As network usage increases,
transport revenues increase,
given that the marginal revenue
Causal

MIT HSR/Regions Group Archila and Carlson Chapter 1 - CLIOS Representation of the Northeast Corridor
1-17
exceeds marginal cost (strong)
10 Network Usage Congestion As network usage increases,
congestion will also increase,
although the proportionality of
the relationship depends on the
modal split and the available
capacity (average, positive)
Causal
11 Transport
Revenues
Transportation
Service
In general, increases in
transportation revenues will
allow for transportation
services to be improved, but it
is subject to the decision of the
firm (weak-average, none or
positive)
Causal
12 Transport
Revenues
Transport
Funding and
Investment
An increase in transportation
revenues will encourage more
transportation investment, but
it is subject to the decision of
the institutional actor (average,
none to positive)
Causal
13 Transportation
Infrastructure
Transportation
Service
Improving transportation
infrastructure allows for better
transportation service, but the
decision to improve
transportation service is subject
to other conditions (strong,
none to positive)
Causal
14 Congestion Trip Attributes An increase in congestion has a
negative impact on trip
attributes (average, negative)
Causal
15 Fuel Prices and
Availability
Trip Attributes Improvements to fuel prices
and availability (e.g. a decrease
in cost and an increase in
availability) improves trip
attributes (average, positive)
Causal
16 Transport
Funding and
Investment
Transportation
Service
Increased transportation
funding and investment allows
for improved transportation
service (average, positive)
Causal
MIT HSR/Regions Group Archila and Carlson Chapter 1 - CLIOS Representation of the Northeast Corridor
1-18
17 Transport
Funding and
Investment
Transportation
Infrastructure
Increased transportation
funding and investment
improves levels of maintenance
and enhancements to
transportation infrastructure
(strong, positive)
Causal
18 Transport
Operations
Subsidy
Transportation
Service
Increased operating subsidies
allows for improved
transportation service;
however, it is also a function of
the management of the
organization (strong, none to
positive)
Causal
19 Fuel Tax Transport
Revenues
Increases to fuel taxes increases
transportation revenues,
assuming that fuel prices
remain inelastic (strong,
positive)
Causal
20 Fuel Tax Fuel Prices Increases to fuel taxes increases
the PRICE of fuel (average,
positive)
Causal
21 Fuel Tax Transport
Funding and
Investment
Most of the transport funding
comes from fuel taxes (strong,
positive)
Causal
22 Weather Modal Split Poorer weather causes a shift
from public to private
transportation (average,
variable effects)
Causal
23 Weather Congestion Poorer weather causes
increased congestion (average,
negative)
Causal
24 Global Fuel
Prices
Fuel Prices Increases in global fuel prices
increases the PRICE of fuel
(strong, positive)
Causal
25 Energy Output Energy
Generation
Infrastructure
An increase in consumption
encourages the development of
more energy generation
infrastructure. Providing more
Causal

MIT HSR/Regions Group Archila and Carlson Chapter 1 - CLIOS Representation of the Northeast Corridor
1-19
energy generation
infrastructure increases the
availability of energy, but has a
variable impact on energy cost,
depending on the cost of
bringing these plants online and
the regulatory environment (i.e.
are prices fixed by a regulator)
(bi-directional, average-strong,
variable impacts)
26 Air Emissions Human Health
&
Environmental
Sustainability
An increase in air emissions has
a deleterious effect on human
health and environmental
sustainability (strong, negative)
Causal
27 Land Usage Other
Environmental
Impacts
Land usage has various impacts
on other environmental impacts
(average, variable)
Causal
28 Land Usage Energy
Transmission
Infrastructure
Certain types of land usage
requiring energy output can
encourage the development of
transmission infrastructure.
Similarly, improvements to
energy transmission
infrastructure can encourage
the development of land (bi-
directional, average, generally
positive)
Causal
29 Economic
Activity
Energy
Generation
Infrastructure
An increase in economic activity
encourages the development of
energy generation
infrastructure (average,
positive)
Causal
30 Economic
Activity
Energy
Transmission
Infrastructure
An increase in economic activity
encourages the development of
energy transmission
infrastructure (average,
positive)
Causal
31 Other
Environmental
Human Health
&
An increase in other
environmental impacts has a
Causal

MIT HSR/Regions Group Archila and Carlson Chapter 1 - CLIOS Representation of the Northeast Corridor
1-20
Impacts Environmental
Sustainability
deleterious effect on human
health and sustainability
(average, negative)
32 Energy
Generation
Infrastructure
Air Emissions An increase in energy
generation infrastructure
generally increases air
emissions; however, the
proportionality of the increase
depends on the mix of energy
sources used (average, positive)
Causal
33 Energy
Generation
Infrastructure
Other
Environmental
Impacts
An increase in energy
generation infrastructure
generally increases other
environmental impacts;
however, the proportionality of
the increase depends on the mix
of energy sources used
(average, positive)
Causal
34 Energy
Transmission
Infrastructure
Energy Output Improved energy transmission
infrastructure provides better
coverage and reliability of
energy (strong, positive)
Causal
35 Human Health
&
Environmental
Sustainability
Economic
Activity
Healthy citizens increase the
potential for economic activity
inside a society. Environmental
sustainability allows long-term
economic activity (average,
positive)
Causal
36 Energy
Investment
Energy
Generation
Infrastructure
Energy investment is necessary
in order to enhance energy
generation infrastructure for
any given mode (strong,
positive)
Causal
37 Energy
Investment
Energy
Transmission
Infrastructure
Investment in energy
transmission infrastructure
determines the actual
distribution of the electrical
grid (strong, positive)
Causal
38 Energy Policies Energy Energy policies regulate the Causal
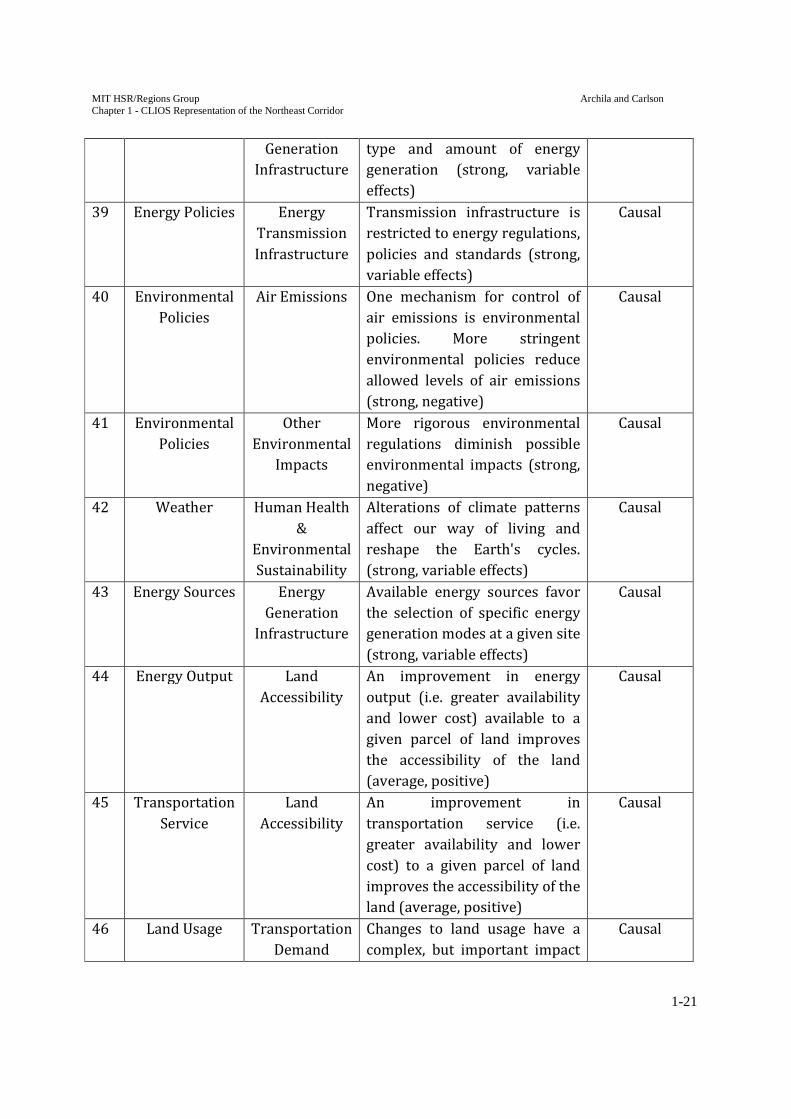
MIT HSR/Regions Group Archila and Carlson Chapter 1 - CLIOS Representation of the Northeast Corridor
1-21
Generation
Infrastructure
type and amount of energy
generation (strong, variable
effects)
39 Energy Policies Energy
Transmission
Infrastructure
Transmission infrastructure is
restricted to energy regulations,
policies and standards (strong,
variable effects)
Causal
40 Environmental
Policies
Air Emissions One mechanism for control of
air emissions is environmental
policies. More stringent
environmental policies reduce
allowed levels of air emissions
(strong, negative)
Causal
41 Environmental
Policies
Other
Environmental
Impacts
More rigorous environmental
regulations diminish possible
environmental impacts (strong,
negative)
Causal
42 Weather Human Health
&
Environmental
Sustainability
Alterations of climate patterns
affect our way of living and
reshape the Earth's cycles.
(strong, variable effects)
Causal
43 Energy Sources Energy
Generation
Infrastructure
Available energy sources favor
the selection of specific energy
generation modes at a given site
(strong, variable effects)
Causal
44 Energy Output Land
Accessibility
An improvement in energy
output (i.e. greater availability
and lower cost) available to a
given parcel of land improves
the accessibility of the land
(average, positive)
Causal
45 Transportation
Service
Land
Accessibility
An improvement in
transportation service (i.e.
greater availability and lower
cost) to a given parcel of land
improves the accessibility of the
land (average, positive)
Causal
46 Land Usage Transportation
Demand
Changes to land usage have a
complex, but important impact
Causal
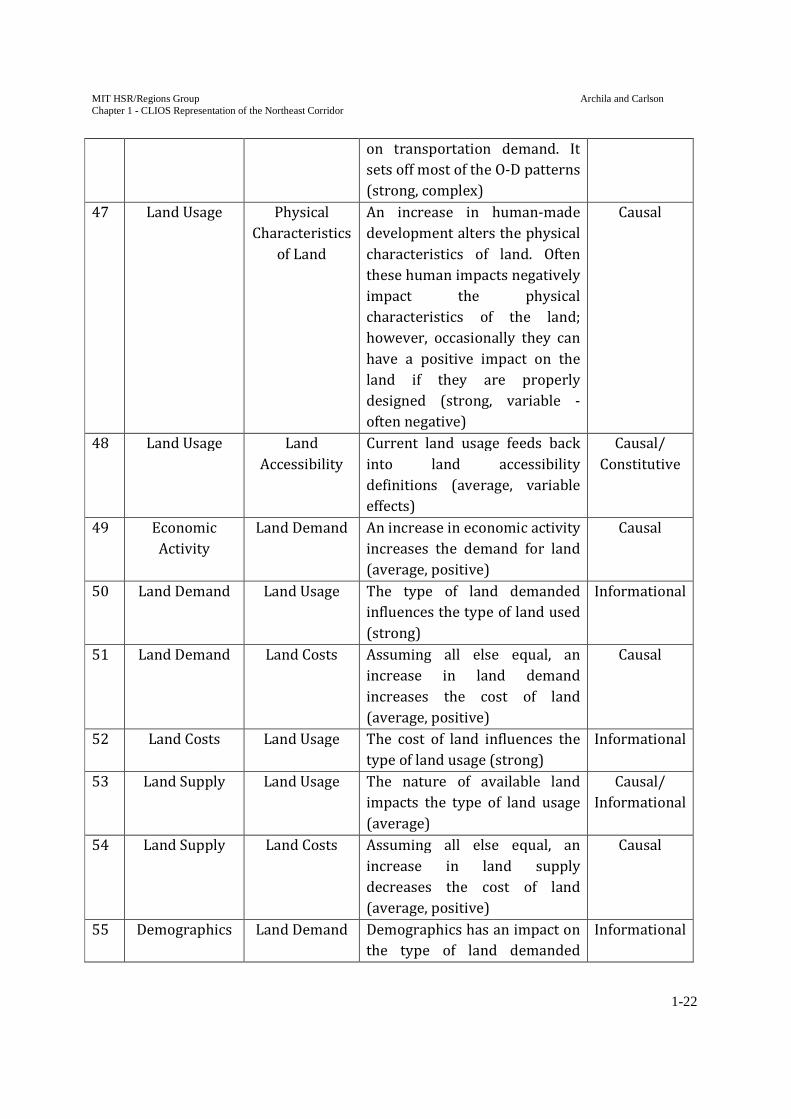
MIT HSR/Regions Group Archila and Carlson Chapter 1 - CLIOS Representation of the Northeast Corridor
1-22
on transportation demand. It
sets off most of the O-D patterns
(strong, complex)
47 Land Usage Physical
Characteristics
of Land
An increase in human-made
development alters the physical
characteristics of land. Often
these human impacts negatively
impact the physical
characteristics of the land;
however, occasionally they can
have a positive impact on the
land if they are properly
designed (strong, variable -
often negative)
Causal
48 Land Usage Land
Accessibility
Current land usage feeds back
into land accessibility
definitions (average, variable
effects)
Causal/
Constitutive
49 Economic
Activity
Land Demand An increase in economic activity
increases the demand for land
(average, positive)
Causal
50 Land Demand Land Usage The type of land demanded
influences the type of land used
(strong)
Informational
51 Land Demand Land Costs Assuming all else equal, an
increase in land demand
increases the cost of land
(average, positive)
Causal
52 Land Costs Land Usage The cost of land influences the
type of land usage (strong)
Informational
53 Land Supply Land Usage The nature of available land
impacts the type of land usage
(average)
Causal/
Informational
54 Land Supply Land Costs Assuming all else equal, an
increase in land supply
decreases the cost of land
(average, positive)
Causal
55 Demographics Land Demand Demographics has an impact on
the type of land demanded
Informational

MIT HSR/Regions Group Archila and Carlson Chapter 1 - CLIOS Representation of the Northeast Corridor
1-23
(average)
56 Physical
Characteristics
of Land
Land Supply The physical characteristics of
the land describe the land
supply (average)
Constitutive
57 Land
Accessibility
Land Supply Accessibility is a characteristic
of the land supply (average)
Constitutive
58 Environmental
Policies
Land Supply Environmental policies restrict
how a parcel of land can be
used (average-strong)
Informational
59 Land Use
Policies
Land Supply Land use policies restrict how a
parcel of land can be used
(average-strong)
Informational
60 Natural
Characteristics
of Land
Physical
Characteristics
of Land
Natural characteristics of the
land define the initial
characteristics of the land and
constrain further physical
changes to the land (strong)
Informational
61 Energy Output Firm's Costs &
Capacity
An improvement in energy
output (i.e. an increase in
availability and a decrease in
cost) improves the capacity and
cost functions of firms (average,
positive)
Causal
62 Transportation
Service
Firm's Costs &
Capacity
An improvement in
transportation service (i.e. an
increase in availability and a
decrease in cost) improves the
capacity and cost functions of
firms (average, positive)
Causal
63 Transport
Revenues
Private
Investment
An increase in transport
revenues increases the
likelihood of private sector
involvement (average, positive)
Financial
64 Land Usage Firm's Costs &
Capacity
An improvement in land usage
(e.g. an increase in the
availability of an appropriate
land type and a decrease in
costs) improves the capacity
and cost of operation of a firm.
Causal

MIT HSR/Regions Group Archila and Carlson Chapter 1 - CLIOS Representation of the Northeast Corridor
1-24
Similarly, a change in the cost
and capacity of the firm as a
result of changes to land usage
and other factors can cause it to
relocate, and thus impact land
usage. (weak, bi-directional)
65 Land Usage Demand for
Goods &
Services
Specific land usage and O-D
patterns may increase or
decrease the need for services.
If the demand for specific
goods, services is sufficiently
high, it could favor new land
usage patterns, however, this
would be on the long-term
(weak on a time scale, bi-
directional, complex)
Causal
66 Economic
Activity
Transportation
Demand
An increase in economic activity
increases the demand for
transportation (average,
positive)
Causal
67 Economic
Activity
Private
Investment
An increase in economic activity
encourages more private
investment (average, positive)
Causal
68 Private
Investment
Capital An increase in private
investment increases the
availability of capital (average,
positive)
Causal
69 Firm's Costs &
Capacity
Economic
Activity
The capacity of the firms sets an
upper bound for the economic
activity, while lower costs favor
increments in production
(average, positive)
Causal
70 Foreign
Investment
Capital An increase in foreign
investment increases the
availability of capital (average,
positive)
Causal
71 Demand for
Goods &
Services
Economic
Activity
Assuming all else equal, an
increase in the demand for
goods and services increases
Causal

MIT HSR/Regions Group Archila and Carlson Chapter 1 - CLIOS Representation of the Northeast Corridor
1-25
economic activity (strong,
positive)
72 Labor Firm's Costs &
Capacity
An improvement in the
availability and cost of labor
improves a firm's cost and
capacity (strong, positive)
Causal
73 Labor Demand for
Goods &
Services
As a the wages and employment
of labor increases, so does the
demand for goods and services
(average, positive)
Causal
74 Capital Firm's Costs &
Capacity
An improvement in the
availability and cost of capital
improves a firm's cost and
capacity (strong, positive)
Causal
75 Federal and
State Fiscal
Policies
Energy Output The way in which governments
spend their energy budget sets
boundaries to energy output
(strong)
Causal
76 Federal and
State Fiscal
Policies
Transportation
Service
Adequate allocation of
government funds improves
transportation service (average,
complex)
Causal
77 Federal and
State Fiscal
Policies
Capital More allocation of
governmental funds increase
access to capital (average,
positive)
Causal
78 Taxes Firm's Costs &
Capacity
An increase in taxes increases
the cost of operating a firm
(strong, positive)
Causal
79 Taxes Foreign
Investment
Taxes pose restrictions to
foreign investment (average,
negative)
Causal
80 Taxes Labor An increase in taxes decreases
the real income of individuals
(strong, negative)
Causal
81 Foreign
Economies
Foreign
Investment
An improvement in foreign
economies allows for an
increase in foreign investment,
but does not necessarily suggest
Causal
MIT HSR/Regions Group Archila and Carlson Chapter 1 - CLIOS Representation of the Northeast Corridor
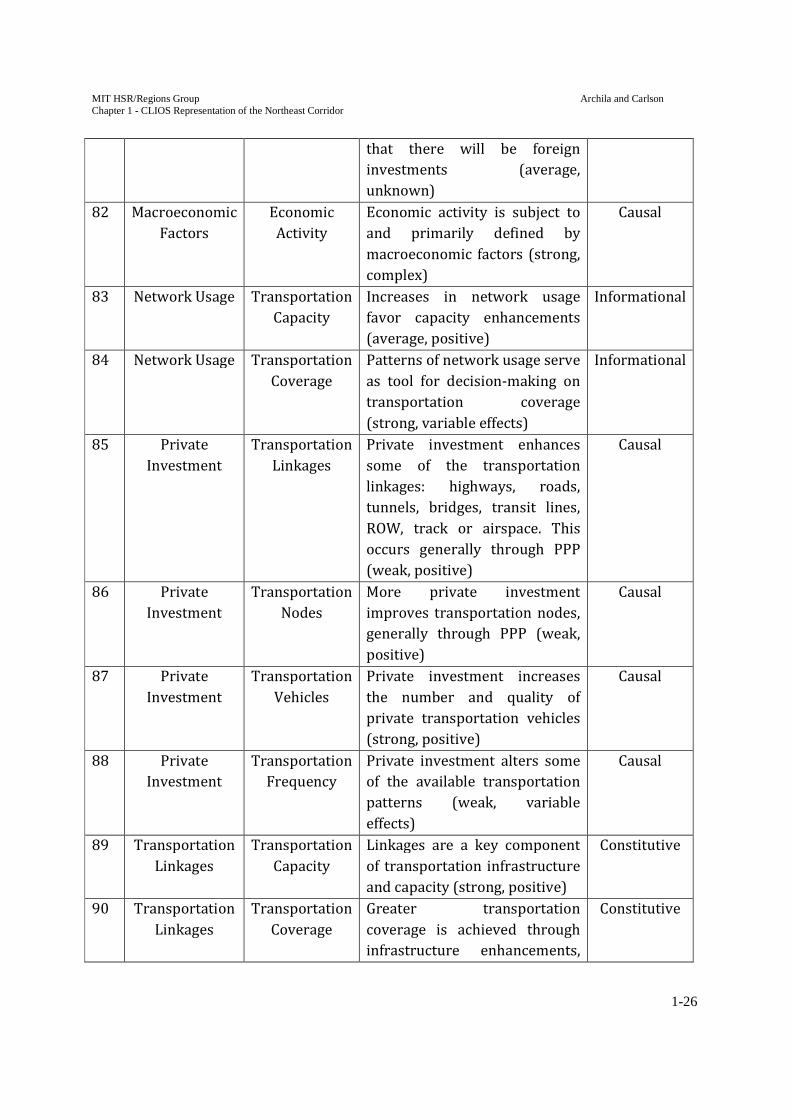
1-26
that there will be foreign
investments (average,
unknown)
82 Macroeconomic
Factors
Economic
Activity
Economic activity is subject to
and primarily defined by
macroeconomic factors (strong,
complex)
Causal
83 Network Usage Transportation
Capacity
Increases in network usage
favor capacity enhancements
(average, positive)
Informational
84 Network Usage Transportation
Coverage
Patterns of network usage serve
as tool for decision-making on
transportation coverage
(strong, variable effects)
Informational
85 Private
Investment
Transportation
Linkages
Private investment enhances
some of the transportation
linkages: highways, roads,
tunnels, bridges, transit lines,
ROW, track or airspace. This
occurs generally through PPP
(weak, positive)
Causal
86 Private
Investment
Transportation
Nodes
More private investment
improves transportation nodes,
generally through PPP (weak,
positive)
Causal
87 Private
Investment
Transportation
Vehicles
Private investment increases
the number and quality of
private transportation vehicles
(strong, positive)
Causal
88 Private
Investment
Transportation
Frequency
Private investment alters some
of the available transportation
patterns (weak, variable
effects)
Causal
89 Transportation
Linkages
Transportation
Capacity
Linkages are a key component
of transportation infrastructure
and capacity (strong, positive)
Constitutive
90 Transportation
Linkages
Transportation
Coverage
Greater transportation
coverage is achieved through
infrastructure enhancements,
Constitutive
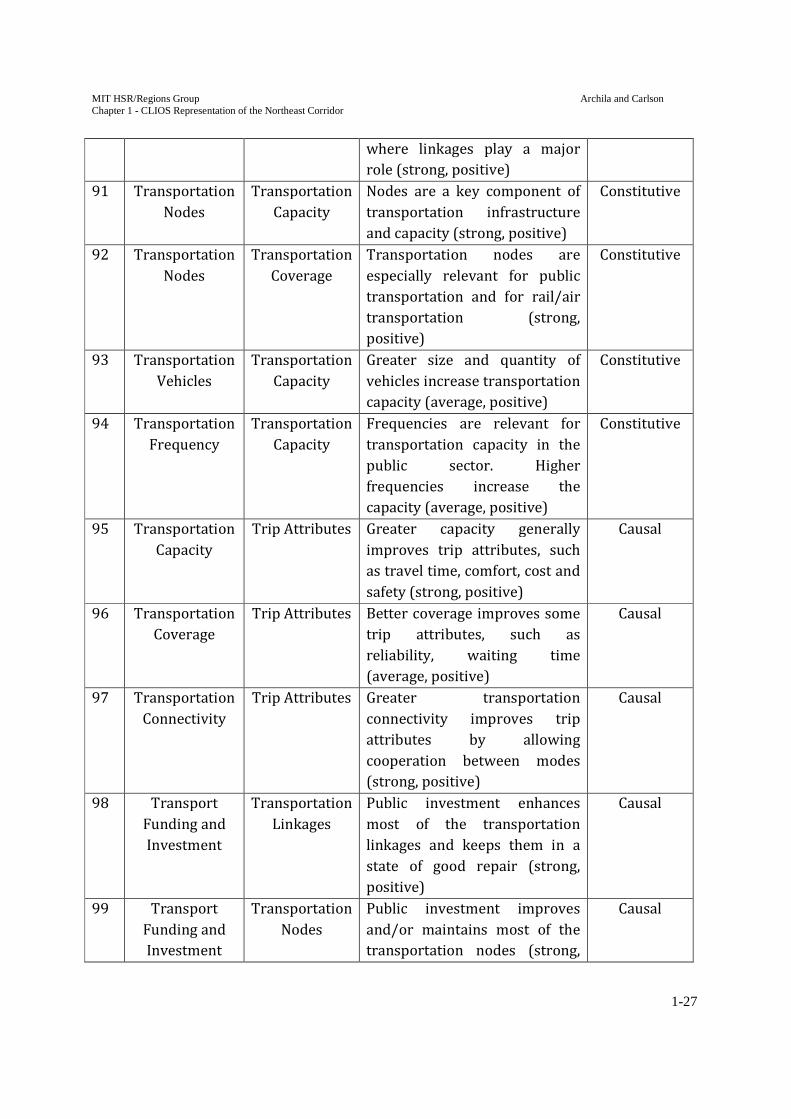
MIT HSR/Regions Group Archila and Carlson Chapter 1 - CLIOS Representation of the Northeast Corridor
1-27
where linkages play a major
role (strong, positive)
91 Transportation
Nodes
Transportation
Capacity
Nodes are a key component of
transportation infrastructure
and capacity (strong, positive)
Constitutive
92 Transportation
Nodes
Transportation
Coverage
Transportation nodes are
especially relevant for public
transportation and for rail/air
transportation (strong,
positive)
Constitutive
93 Transportation
Vehicles
Transportation
Capacity
Greater size and quantity of
vehicles increase transportation
capacity (average, positive)
Constitutive
94 Transportation
Frequency
Transportation
Capacity
Frequencies are relevant for
transportation capacity in the
public sector. Higher
frequencies increase the
capacity (average, positive)
Constitutive
95 Transportation
Capacity
Trip Attributes Greater capacity generally
improves trip attributes, such
as travel time, comfort, cost and
safety (strong, positive)
Causal
96 Transportation
Coverage
Trip Attributes Better coverage improves some
trip attributes, such as
reliability, waiting time
(average, positive)
Causal
97 Transportation
Connectivity
Trip Attributes Greater transportation
connectivity improves trip
attributes by allowing
cooperation between modes
(strong, positive)
Causal
98 Transport
Funding and
Investment
Transportation
Linkages
Public investment enhances
most of the transportation
linkages and keeps them in a
state of good repair (strong,
positive)
Causal
99 Transport
Funding and
Investment
Transportation
Nodes
Public investment improves
and/or maintains most of the
transportation nodes (strong,
Causal

MIT HSR/Regions Group Archila and Carlson Chapter 1 - CLIOS Representation of the Northeast Corridor
1-28
positive)
100 Transport
Funding and
Investment
Transportation
Vehicles
Public investment increases the
number and quality of public
transportation vehicles (strong,
positive)
Causal
101 Transport
Funding and
Investment
Transportation
Frequency
Public investment alters some
of the available transportation
patterns (average, positive)
Causal
102 Taxes Transport
Funding and
Investment
Taxes are the main source of
the Highway Trust Fund and
other public funds (strong,
positive)
Causal
103 Inter-Modal
Transportation
Integration
Policies
Transportation
Connectivity
Transportation connectivity
across modes is improved
through policy alignments for
each mode (strong, positive)
Causal

MIT HSR/Regions Group Archila and Carlson Chapter 1 - CLIOS Representation of the Northeast Corridor
1-29
INSTITUTIONAL SPHERE
Part of the CLIOS representation stage involves describing actors on the institutional
sphere, including “identifying [their] important characteristics, such as their power or
mandate over different parts of the physical subsystems, their interests in the subsystems,
their expertise and resources and their positions with regards to different strategic
alternatives” (Sussman et al. 2009). For the purposes of the CLIOS representation of the
Northeast Corridor, the actors on the institutional sphere have been arranged into three
subgroups: (1) government; (2) private sector companies; and (3) transportation users.
Figure 1.6 shows the actors on the NEC institutional sphere – each of the actors
represented is described in more detail below.
Figure 1.6: CLIOS Institutional Sphere Representation (with Physical Domain)

MIT HSR/Regions Group Archila and Carlson Chapter 1 - CLIOS Representation of the Northeast Corridor
1-30
GOVERNMENT
FEDERAL GOVERNMENT
Legislative Branch
United States Congress
The U.S. Congress is the legislative branch of the federal government based in Washington,
D.C. It is a bicameral legislature comprised of the Senate and House of Representatives.
Each of the 435 directly-elected members of Congress in the House of Representatives is
elected to two-year terms. The distribution of house seats across the U.S. is done by
population. Each of 100 directly-elected senators serves six year terms (although only
about one-third of seats are up for election every two years). There are two senators from
every state. Although each of the chambers of Congress has unique powers, in general,
both must be in agreement for laws to pass.
As a result of Congress’ ability to appropriate funding, it is one of the most important actors
on the institutional sphere. Any federal funding for high-speed rail has to pass through
Congress. Although leadership from the executive branch of government (the President
and his or her cabinet) can influence the chances of a funding bill being approved by
Congress, the distribution of political-affiliation in both chambers can also have a strong
impact on its chances. For example, although President Obama was initially successful in
having his High-Speed Intercity Passenger Rail Program passed into law as part of the
American Recovery and Reinvestment Act of 2009, after a change in the political makeup of
Congress in 2010, efforts are currently underway to recall any unspent funding.
Executive Branch
United States Environmental Protection Agency (USEPA)
One of the missions of the USEPA is to ensure “all Americans are protected from significant
risks to human health and the environment where they live, learn and work”
(http://www.epa.gov). The USEPA accomplishes this goal, by, among other activities,
developing and enforcing environmental regulations in the U.S. Although the USEPA does
not deal with transportation issues directly, it would likely be concerned with the impacts
associated with NEC investment from the perspective of increases or decreases to air
pollutant emissions and impacts to water quality, for example.

MIT HSR/Regions Group Archila and Carlson Chapter 1 - CLIOS Representation of the Northeast Corridor
1-31
United States Department of Commerce
According to its website, “The U.S. Department of Commerce promotes job creation,
economic growth, sustainable development and improved standards of living for all
Americans by working in partnership with businesses, universities, communities and our
nation’s workers” (http://www.commerce.gov). If a decision were made to develop high-
speed rail in the U.S., the Department of Commerce may be interested in promoting the
development and export of U.S. high-speed rail technology, as well as securing access to
high-speed rail technology from abroad, for example.
United States Department of Energy
According to its website, “the mission of the Energy Department is to ensure America’s
security and prosperity by addressing its energy, environmental and nuclear challenges
through transformative science and technology solutions” (http://www.energy.gov). The
Department of Energy (DOE) policies could influence NEC investment decisions by
impacting the relative costs of different sources of energy (such as electricity generated
using different raw materials, and gasoline and diesel). As a result, not only would it be
important to evaluate the source and amount of energy required for high-speed rail in the
NEC, it would be important to evaluate the tradeoffs from an energy consumption
perspective of increasing rail ridership at the expense of auto and airline travel, as these
two modes use different sources of energy.
United States Department of Transportation (USDOT)
According to its website, the mission of the United States Department of Transportation is
to “serve the United States by ensuring a fast, safe, efficient, accessible and convenient
transportation system that meets our vital national interests and enhances the quality of
life of the American people, today and into the future” (http://www.dot.gov). The USDOT
is a cabinet-level agency, and comprises several subagencies, which include the Federal
Railroad Administration (FRA), the Federal Transit Administration (FTA), the Federal
Aviation Administration (FAA), and the Federal Highway Administration (FHWA). The
USDOT, through these agencies (in particular, the FRA) is the federal department most
directly concerned with the Northeast Corridor.
Federal Railroad Administration (FRA)
The FRA has the most direct control (of all federal agencies) over the NEC. Although in
1985 it transferred management control to Amtrak for all NEC upgrades (as a result of
provisions in the Passenger Railroad Rebuilding Act of 1980), it still is responsible for
distributing funds for NEC upgrades and overseeing its management. The FRA is also
responsible for developing and enforcing regulations that pertain to freight and passenger
rail transport. For example, the FRA is responsible for developing regulations that pertain
to track and (rail) car standards, which would impact the cost of any high-speed rail
project.

MIT HSR/Regions Group Archila and Carlson Chapter 1 - CLIOS Representation of the Northeast Corridor
1-32
Federal Transit Administration (FTA)
The FTA provides funding and oversight for mass-transit programs (including commuter
rail), but cannot provide funding to for intercity rail transportation. However, a major
component of high-speed rail projects is ensuring appropriate transit-connections to and
from passenger stations. As a result, the FTA should be included when considering
stakeholders during the CLIOS process.
Federal Aviation Administration (FAA)
The FAA is responsible for overseeing the aviation industry in the U.S., including airlines
and airports. Although it does not directly impact the NEC rail infrastructure, a decision to
invest in high-speed rail in the NEC would likely impact air traffic volumes at northeast
airports. Therefore, any rail policy and investment decisions should consider potential
impacts to air travel demand and aviation policy.
Federal Highway Administration (FHWA)
The FHWA is responsible for developing and overseeing the federal interstate highway
network. Although its policies do not directly impact the NEC rail infrastructure, a decision
to invest in high-speed rail would likely impact highway traffic on northeast highways. As
a result, any rail policy and investment decisions should consider potential impacts to auto
travel demand and highway policy.
STATE GOVERNMENTS
From Boston to Washington, D.C. via New York City, the Northeast Corridor passes through
the nine states – including Massachusetts (MA), Rhode Island (RI), Connecticut (CT), New
York (NY), New Jersey (NJ), Pennsylvania (PA), Delaware (DE), Maryland (MD) and Virginia
(VA) – and the District of Columbia. Currently, there are no formal organizations or
institutionalized processes that allow states to make collective decisions regarding the
NEC. Given that each of state has its own goals for the NEC and will be impacted differently
by any improvements, understanding how each of the states will be impacted by each the
strategic alternatives will be a critical part of the CLIOS Process.
Additionally, differing goals and political views between state governments and the federal
government result in complex relationships between these actors on the institutional
sphere. The recent decisions of Florida, Ohio and Wisconsin to return approximately $3.6
billion in federal funding to build high-speed rail lines in their states illustrate the
difficulties faced by the federal government in setting up the High-Speed Intercity
Passenger Rail Program (HSIPR) (FRA 2010, 2011a). Some of the reasons that states
provided for returning these funds include concerns regarding cost overruns and the
desire to invest these funds in other transportation priorities (Scott 2011). Nonetheless,
there still appears to be strong support from some states for high-speed rail development.

MIT HSR/Regions Group Archila and Carlson Chapter 1 - CLIOS Representation of the Northeast Corridor
1-33
When the FRA opened a new competition to reassign Florida’s $2.4 billion worth of
returned funding, approximately $10 billion worth of proposals were received from states
and Amtrak for high-speed rail projects. According to the FRA (2011b), projects along the
NEC received approximately $795 million, with additional funds being directed towards
improvements on some of the northeastern branch lines that connect to the NEC. Although
there is still support for high-speed rail in the northeast, the polarized view of high-speed
rail between states will make it difficult for the federal government to create a nationwide
high-speed rail program.
LOCAL GOVERNMENTS
Whilst the decision to implement high-speed rail in the NEC will be driven from federal and
state levels of government, local governments will still play a significant role in ensuring
the viability of the system. Local governments might include municipal governments,
county governments, metropolitan planning organizations and regional councils. Although
the power of each of these levels of government varies from state to state, in general they
serve important transportation planning and land-use governance roles. As a result,
engaging these levels of government in the planning process for HSR is critical for ensuring
successful implementation of the system.
AMTRAK
The Rail Passenger Service Act of 1970 created Amtrak (more formally known as the
National Railroad Passenger Corporation) to take over money-losing intercity passenger
rail services from freight railroad companies (USGAO 2004). According to Amtrak, it
operates 305 weekday intercity trains over 21,100 route miles (70% of which is not owned
by Amtrak) and employs 21,100 people. In 2010, it had $2.51 billion in revenue and $3.74
billion in expense, which works out to a farebox recovery ratio of about 67%. According to
Amtrak, it has the highest farebox recovery ratio of all passenger railroads in the U.S.
(Amtrak, National Factsheet FY 2010).
Amtrak operates several train services over the NEC, including long-distance trains. Its
core NEC routes include Regional and high-speed Acela Express services between Boston
and Washington, D.C. via New York. These two services have annual riderships of
8.107 million and 3.219 million passengers, respectively (Amtrak, Northeast Corridor Fact
Sheet FY 2010).
Amtrak owns the majority of the NEC infrastructure. Amtrak acquired the entire segment
of the NEC from Washington, D.C. to New York City and the segment from New Haven, CT to
the Massachusetts-Rhode Island border in 1976 as a result of the Railroad Revitalization
and Regulatory Reform (4R) Act. Since 1985 (as a result of the Passenger Railroad
Rebuilding Act of 1980), has also been responsible for managing infrastructure upgrades

MIT HSR/Regions Group Archila and Carlson Chapter 1 - CLIOS Representation of the Northeast Corridor
1-34
over its portion of the NEC. However, over the past decades, concerns have been raised
over Amtrak’s ability to adequately manage significant infrastructure projects, which has
been noted in several United States General Accounting Office reports. As a result, better
understanding the past and future role of Amtrak will be critical to developing potential
strategic alternatives for the Northeast Corridor.
One of the critical questions that need to be answered in developing strategic alternatives
is the role of Amtrak or lack thereof. Other organizations are in the mix including an
organization designed explicitly for the purpose of developing HSR in the NEC. This all
highlights the fact that the strategic alternatives are not limited to the network, vehicles
and services offered but also includes organizational design. The CLIOS process allows us
to consider such strategic alternatives.
COMMUTER RAIL AGENCIES
There are currently eight commuter rail agencies operating over some portion of the NEC.
Although Amtrak trains represent the majority of train miles traveled, commuter trains
represent over 90% of all train trips on the NEC. The eight commuter agencies include:
• The Massachusetts Bay Transportation Authority (MBTA)
• The Connecticut Department of Transportation Shore Line East (SLE)
• The Metropolitan Transportation Authority Metro-North Railroad (MNR)
• The Metropolitan Transportation Authority Long Island Rail Road (LIRR)
• New Jersey Transit (NJT)
• The Southeastern Pennsylvania Transportation Authority (SEPTA)
• The Maryland Transit Administration MARC (MARC)
• Virginia Railway Express (VRE)
Of these eight agencies, only the MBTA and MNR own the track over which it operates. The
MBTA owns the NEC segment from Boston South Station to the Massachusetts-Rhode
Island border (which is operated and maintained by Amtrak) and the MNR owns and
operates the NEC segment from New York City to the New York-Connecticut border. The
MNR also operates the NEC segment from the New York-Connecticut border to New Haven,
CT, which is owned by the Connecticut Department of Transportation.
In the past, concerns have been raised that the requirements of commuter rail agencies
(and freight rail companies) have often not been addressed when considering increases to
inter-city passenger service. For example, going back to the 1970s, then Secretary of
Transportation Brock Adams had the “Northeast Corridor Improvement Project:
Redirection Study” written in response to shortcomings of the Northeast Corridor draft
Programmatic Environmental Impact Statement in addressing the concerns of commuter
rail agencies and freight railroad companies. The influence of and impact on commuter rail
agencies must certainly be considered when developing any of the strategic alternatives.
MIT HSR/Regions Group Archila and Carlson Chapter 1 - CLIOS Representation of the Northeast Corridor
1-35
URBAN PUBLIC TRANSPORTATION ORGANIZATIONS
Transportation to and from high-speed rail stations is an important component of the
door-to-door travel time experienced by users of the system. As a result, providing high-
quality transit access to high-speed rail stations will be an important component of the
overall system design. The following paragraph notes some of the most important transit
operators along the NEC. Ensuring that they can provide access to high-speed rail stations
and quality service in general will need to be considered in any significant investment in
the NEC.
In Boston, the Massachusetts Bay Transportation Authority (MBTA) operates transit
services, including subway, bus, commuter rail and ferry. In New York City, the
Metropolitan Transportation Authority (MTA) provides most bus, subway and commuter
rail services. The MTA Long Island Rail Road and Metro-North Railroad collectively own
the largest commuter rail network in the U.S. with over 250 stations and 20 lines.
Additionally, after Boston, the MTA has the oldest subway system in the U.S. New Jersey
Transit also provides commuter rail services into New York City, but primarily serves the
state of New Jersey as opposed to New York. In the Philadelphia-area, the Southeastern
Pennsylvania Transportation Authority (SEPTA) operates buses, trains, rapid transit, and
trolleys. Additionally, it has the third-oldest subway system in the U.S. New Jersey Transit
also provides some service from Atlantic City, NJ to Philadelphia. In Baltimore, the
Maryland Transit Administration provides public transit services. Baltimore also has a
publicly-funded, privately-operated shuttle bus service called the Charm City Circulator,
which offers free rides on three routes. In Washington, D.C., the Washington Metropolitan
Area Transit Authority (WMATA) provides urban transportation services (including
subway and bus service). Additionally, several commuter rail services converge in
Washington, D.C., including the Maryland Transit Administration MARC trains and the
Virginia Railway Express.
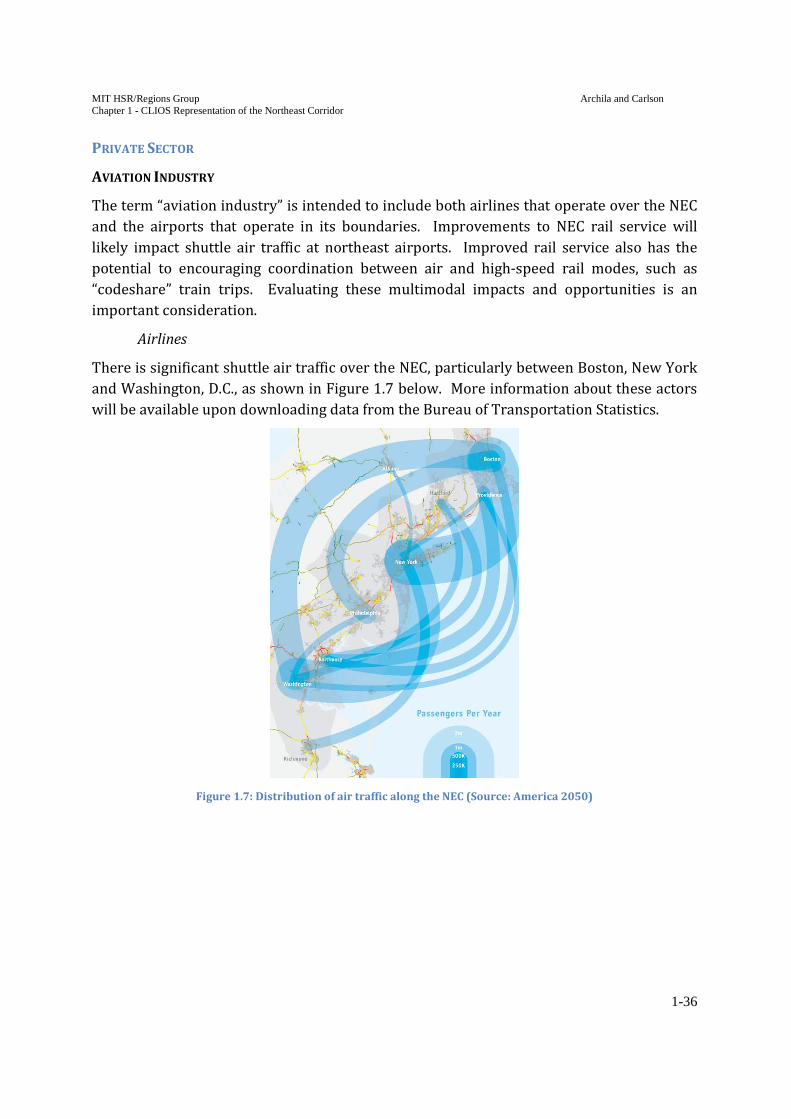
MIT HSR/Regions Group Archila and Carlson Chapter 1 - CLIOS Representation of the Northeast Corridor
1-36
PRIVATE SECTOR
AVIATION INDUSTRY
The term “aviation industry” is intended to include both airlines that operate over the NEC
and the airports that operate in its boundaries. Improvements to NEC rail service will
likely impact shuttle air traffic at northeast airports. Improved rail service also has the
potential to encouraging coordination between air and high-speed rail modes, such as
“codeshare” train trips. Evaluating these multimodal impacts and opportunities is an
important consideration.
Airlines
There is significant shuttle air traffic over the NEC, particularly between Boston, New York
and Washington, D.C., as shown in Figure 1.7 below. More information about these actors
will be available upon downloading data from the Bureau of Transportation Statistics.
Figure 1.7: Distribution of air traffic along the NEC (Source: America 2050)

MIT HSR/Regions Group Archila and Carlson Chapter 1 - CLIOS Representation of the Northeast Corridor
1-37
Airports
There are 13 major airports that serve the NEC area, including: Manchester-Boston
Regional Airport (MHT), Boston Logan International Airport (BOS), T.F. Green Airport
(PVD), Bradley International Airport (BDL), John F. Kennedy International Airport (JFK),
LaGuardia Airport (LGA), Newark Liberty International Airport (EWR), Long Island
McArthur Airport (ISP), Westchester County Airport (HPN), Philadelphia International
Airport (PHL), Baltimore/Washington International Thurgood Marshall Airport (BWI),
Ronald Reagan Washington National Airport (DCA), and Washington Dulles International
Airport (IAD).
According to the FAA (2007), John F. Kennedy International Airport (JFK), LaGuardia
Airport (LGA), Newark Liberty International Airport (EWR) and Philadelphia International
Airport (PHL) will not have sufficient airspace capacity by 2025 even if planned
improvements (such a runway extensions, airspace reconfiguration, etc.) are completed.
The same report indicates that Boston Logan International Airport (BOS), T.F. Green
Airport (PVD) and Washington Dulles International Airport (IAD) will have sufficient
capacity, but only if improvements are completed. As a result, considering the impact of
high-speed rail on airport usage should be considered when evaluating the strategic
alternatives.
INTERCITY BUS OPERATORS
There are several intercity bus operators in the Boston to Washington, D.C. corridor,
including: Boltbus, Greyhound, Peter Pan Bus, DC2NY, Vamoose Bus, Megabus, Washington
Deluxe, Eastern Travel, New Century, Fung Wah Bus and Lucky Star Bus.
PRIVATE CONSORTIUMS
As any high-speed rail development project on the Northeast Corridor would likely involve
some type of public-private partnership (P3), the influence of and impact on any private
consortium that would be called upon to finance, design, build, operate and/or maintain
NEC high-speed rail should be considered during the CLIOS process.
FREIGHT RAILROAD COMPANIES
Currently, seven freight railroads, including Conrail Shared Assets Corporation, Providence
and Worcester (P & W), Pan Am Southern, Canadian Pacific, Connecticut Southern, Norfolk
Southern and CSX Transportation, have trackage rights over some portion of the NEC, and
collectively operate approximately 50 trains per day over the corridor.
As noted above in the commuter rail description, in the past, concerns have been raised
that the requirements of commuter rail agencies and freight rail companies have often not
been addressed when considering increases to inter-city passenger service. Operating

MIT HSR/Regions Group Archila and Carlson Chapter 1 - CLIOS Representation of the Northeast Corridor
1-38
slower freight trains over the Northeast Corridor poses operational challenges and reduces
capacity to run higher-speed trains. However, when developing high-speed passenger rail
on shared corridors, care must be taken to develop an efficient passenger rail system that
does not harm the freight railroads’ abilities to move goods efficiently on their networks in
order to retain their business.
TRUCKING COMPANIES
Private trucking companies that ship to and from areas along the NEC may be impacted by
development of high-speed rail. For example, improving NEC passenger rail service could
divert auto traffic from nearby highways; thus helping to alleviate traffic for truck
deliveries. However, improving (or negatively affecting) freight rail service could
potentially divert freight traffic from (or to, respectively) trucking services.
PRIVATE LANDOWNERS
Although the conceptual framework will not evaluate the impact of individual landowners
on the development of HSR, private landowners could restrict the ability of the HSR
developer to acquire right-of-way. Although governments could use eminent domain to
force landowners to sell their property, this tool could significantly extend the length of the
project due to litigation. While for the most part, HSR should be constructed within existing
right-of-ways, coming up with some indicators to evaluate impacts on private landowners
and methods to engage them in the planning process is an important consideration.
TRANSPORT USERS
INTERCITY PASSENGERS
The intercity passengers category is intended to represent users of the NEC completing
longer trips (greater than 75 miles, for example).
COMMUTER PASSENGERS
The commuter passengers category is intended to represent users of NEC completing
shorter trips (less than 75 miles, for example), who primarily use the commuter rail
services.
FREIGHT USERS (SHIPPERS/RECEIVERS)
The freight users category is intended to represent commercial and industrial users along
the NEC that rely on the freight railroads and trucks to ship and deliver their goods and
products.

MIT HSR/Regions Group Archila and Carlson Chapter 1 - CLIOS Representation of the Northeast Corridor
1-39
DISCUSSION OF LINKS BETWEEN COMPONENTS IN THE PHYSICAL DOMAIN AND ACTORS ON THE
INSTITUTIONAL SPHERE
Once the components on the physical domain have been defined and interconnected with
Class 1 links, and the actors on the institutional sphere have been identified, the next step
of the representation involves connecting components in the physical domain with actors
on the institutional sphere using Class 2 links. In order to facilitate this process, a matrix
has been constructed to show how the actors connect with components, and whether the
influence along these links flows from actor to component (A), component to actor (C), or
whether the influence is bi-directional (B). This Actor – Component (Class 2) Links Matrix
is included as a separate file.
MIT HSR/Regions Group Archila and Carlson Chapter 1 - CLIOS Representation of the Northeast Corridor
1-40
REFERENCES
Federal Aviation Administration (FAA). 2007. Capacity Needs for the National Airspace
System: An Analysis of Airports and Metropolitan Area Demand and Operational Capacity
in the Future. United States Department of Transportation, Washington, D.C.
Federal Railroad Administration (FRA). 2010. U.S. Department of Transportation Redirects
$1.195 Billion in High-Speed Rail Funds. http://www.fra.dot.gov/Pages/press-
releases/231.shtml. Accessed 16 October 2011.
Federal Railroad Administration (FRA). 2011a. Statement of U.S. Transportation Secretary
Ray LaHood on High-Speed Rail. http://www.fra.dot.gov/roa/press_releases/fp_DOT44-
11.shtml. Accessed 16 October 2011.
Federal Railroad Administration (FRA). 2011b. U.S. Transportation Secretary LaHood
Announces $2 Billion for High-Speed Intercity Rail Projects to Grow Jobs, Boost U.S.
Manufacturing and Transform Travel in America
http://www.fra.dot.gov/roa/press_releases/fp_DOT_57-11.shtml. Accessed 16 October
2011.
Scott, R. 2011. Florida Governor Rick Scott Rejects Federal High Speed Rail.
http://www.flgov.com/2011/02/16/florida-governor-rick-scott-rejects-federal-high-
speed-rail/. Accessed 16 October 2011.
Sussman, J. et al. 2009. The CLIOS Process: A User’s Guide – February 2009.
United States General Accounting Office (USGAO). 2004. Intercity Passenger Rail: Amtrak’s
Management of Northeast Corridor Improvements Demonstrates Need for Applying Best
Practices. GAO-04-94, United States General Accounting Office, Washington, D.C.

Component - Component (Class 1) Links Matrix
COMPONENTS
Transportation Subsystem
Energy / Environmental Subsystem
Land Use Subsystem
Economic Subsystem
Multi-M
odal Transportation Subsystem
Number of appearances
Transportation Demand
Energy Output
Transportation Service
Modal Split
Air Em
issions
Trip Attributes
Network U
sage
Transport Revenues
Land Usage
Economic Activity
Private Investment
Transportation InfrastructureCongestionFuel Prices
Other Environm
ental Impacts
Energy Generation Infrastructure
Energy Transmission Infrastructure
Human Health &
Environmental Sustainability
Land Demand
Land Costs
Land Supply
Demographics
Physical Characteristics of Land
Land Accessibility
Firm's Costs &
Capacity
Foreign Investment
Demand for G
oods & ServicesLaborCapital
Transportation Linkages
Transportation Nodes
Transportation Vehicles
Transportation Frequency
Transportation Capacity
Transportation Coverage
Transportation Connectivity
Transport Funding and Investment
Transport Operations Subsidy
Fuel Tax
Energy Investment
Energy Policies
Environmental Policies
Land Use Policies
Federal and State Fiscal PoliciesTaxes
Inter-Modal Transportation Integration Policies
Weather
Global Fuel Prices
Energy Sources
Natural Characteristics of Land
Foreign Economies
Macroeconom
ic Factors
SUBSYSTEMS 1 2 3 4 5 6 7 8 9 10 11 12 13 14 15 16 17 18 19 20 21 22 23 24 25 26 27 28 29 30 31 32 33 34 35 36 37 38 39 40 41 42 43 44 45 46 47 48 49 50 51 52
# COMPONENT TransportationEnergy/EnvLand UseEconomicMulti-modalTOTAL 1 2 3 4 5 6 7 8 9 10 11 12 13 14 15 16 17 18 19 20 21 22 23 24 25 26 27 28 29 30 31 32 33 34 35 36 37 38 39 40 41 42 43 44 45 46 47 48 49 50 51 52
1 Transportation Demand 1 1 1 3 1 1 2
2 Energy Output 1 1 1 1 4 1 1 1 1 4
3 Transportation Service 1 1 1 3 1 1 1 3
4 Modal Split 1 1 2 1 1
5 Air Emissions 1 1 2 1 1
6 Trip Attributes 1 1 2 1 1 2
7 Network Usage 1 1 2 1 1 1 1 1 5
8 Transport Revenues 1 1 2 1 1 1 3
9 Land Usage 1 1 1 3 1 1 1 1 1 1 1 7
10 Economic Activity 1 1 1 3 1 1 1 1 1 5
11 Private Investment 1 1 2 1 1 1 1 1 5
12 Transportation Infrastructure 1 1 1 1
13 Congestion 1 1 1 1
14 Fuel Prices 1 1 1 1
15 Other Environmental Impacts 1 1 1 1
16 Energy Generation Infrastructure 1 1 1 1 1 3
17 Energy Transmission Infrastructure 1 1 1 1 2
18 Human Health & Environmental Sustainability 1 1 1 1
19 Land Demand 1 1 1 1 2
20 Land Costs 1 1 1 1
21 Land Supply 1 1 1 1 2
22 Demographics 1 1 1 1
23 Physical Characteristics of Land 1 1 1 1
24 Land Accessibility 1 1 1 1
25 Firm's Costs & Capacity 1 1 1 1 2
26 Foreign Investment 1 1 1 1
27 Demand for Goods & Services 1 1 1 1 2
28 Labor 1 1 1 1 2
29 Capital 1 1 1 1
30 Transportation Linkages 1 1 1 1 2
31 Transportation Nodes 1 1 1 1 2
32 Transportation Vehicles 1 1 1 1
33 Transportation Frequency 1 1 1 1
34 Transportation Capacity 1 1 1 1
35 Transportation Coverage 1 1 1 1
36 Transportation Connectivity 1 1 1 1
37 Transport Funding and Investment 1 1 2 1 1 1 1 1 1 6
38 Transport Operations Subsidy 1 1 1 1
39 Fuel Tax 1 1 1 1 1 3
40 Energy Investment 1 1 1 1 2
41 Energy Policies 1 1 1 1 2
42 Environmental Policies 1 1 2 1 1 1 3
43 Land Use Policies 1 1 1 1
44 Federal and State Fiscal Policies 1 1 1 1 1 3
45 Taxes 1 1 2 1 1 1 1 4
46 Inter-Modal Transportation Integration Policies 1 1 1 1
47 Weather 1 1 2 1 1 1 3
48 Global Fuel Prices 1 1 1 1
49 Energy Sources 1 1 1 1
50 Natural Characteristics of Land 1 1 1 1
51 Foreign Economies 1 1 1 1
52 Macroeconomic Factors 1 1 1 1
TOTAL 16 13 14 15 15 3 3 5 3 3 7 2 2 6 4 2 1 2 2 3 5 4 3 2 2 4 0 2 3 6 2 2 1 3 2 2 2 2 5 3 1 3 0 0 0 0 0 0 0 0 0 0 0 0 0 0 0
Components / subsystem Number of links ending at the component
Number of links originating from the component
COMPONENTS
SUBSYSTEMS

Actor - Component (Class 2) Links Matrix
(Only components with Class 2 links are shown)
COMPONENTS
Common Drivers (Regular) Components Policy Levers
Transportation Demand
Energy Output
Transportation ServiceModal Split
Air Em
issions
Trip Attributes
Transport Revenues
Land Usage
Economic Activity
Private Investment
Transportation InfrastructureCongestionFuel Prices
Other Environm
ental Impacts
Energy Generation Infrastructure
Energy Transmission Infrastructure
Human Health &
Environmental Sustainability
Land Demand
Land Accessibility
Firm's Costs &
Capacity
Foreign Investment
Demand for G
oods & ServicesLaborCapital
Transportation Linkages
Transportation Nodes
Transportation Vehicles
Transportation Frequency
Transport Funding and Investment
Transport Operations Subsidy
Fuel Tax
Energy Investment
Energy Policies
Environmental Policies
Land Use Policies
Federal and State Fiscal PoliciesTaxes
Inter-Modal Transportation Integration Policies
1 2 3 4 5 6 8 9 10 11 12 13 14 15 16 17 18 19 24 25 26 27 28 29 30 31 32 33 37 38 39 40 41 42 43 44 45 46
ACTORS
# Government
1 Congress A A A A A A
2 State Governments A A A A A A A
3 Local Governments C C A A A A C
4 USEPA C C A A C
5 US Department of Commerce B A C
6 US Department of Energy C C C A A C C
7 USDOT A C C C A
8 FRA A C C C B
9 FTA A C C C B
10 FHWA A C C C B
11 FAA A C C C B
12 Amtrak C A C A A C A A A A A A C C C C B
13 Commuter Rail Agencies C A C A A C A A A A A A C C C C B
14 Urban Public Transportation Organizations C A C A A C A A A A A A C C C C B
Private Sector
15 Freight Railroad Companies A C A A C A A A A A C C C
16 Intercity Bus Operators A C A C A A A A C C C C
17 Trucking Industry A C A C A A A A C C C
18 Airline Industry A C A A C A A A A C C C C
19 Private Consortiums C A C A A A A A A C C
20 Private Land Owners C C C C C
Transport Users
21 Commuters A A C C C C C C A C A A C C
22 Intercity Travelers A A C C C C C C A C A A C C C
23 Freight Users A A C C C C C A C C C C
Key
A: Actor influences component
B: Bi-directional influence
C: Component influences actor
ACTORS

MIT HSR/Regions Group Carlson, Archila and Stein
Chapter 2 – Northeast Corridor goals, objectives and performance measures
2-1
Chapter 2
Northeast Corridor goals, objectives and performance
measures S. Joel Carlson | Andrés F. Archila | Naomi Stein _________________________________________________________________________________________________________
CONTENTS
Methodology for the development of NEC goals, objectives and performance measures
Goals, objectives and performance measures identified for the NEC
Transportation system performance
External impacts of the transportation system
Organizational structure effectiveness
Preliminary matrix of NEC institutional actors and objectives
References
METHODOLOGY FOR THE DEVELOPMENT OF NEC GOALS, OBJECTIVES AND PERFORMANCE MEASURES
Once the Representation Stage of the CLIOS Process is completed, the focus of the analysis
shifts from a descriptive to a prescriptive treatment of the system in Stage 2 – Design,
Evaluation and Selection. The purpose of this stage of the analysis is to develop “a concrete
vision of the desired future state of the system, which is prescribed by the refined goals”
(Sussman et al. 2009). Based on these goals, strategic alternatives are identified and
designed to improve system performance. Performance measures are also developed to
gauge the success with which the strategic alternatives improve the performance of the
system.
1. Performance measures have been developed using a three-step process
typical of performance management approaches used in the transportation
industry1:
2. Develop overarching goals that identify the desired future state of the
system.
3. Develop “measurable” objectives, each of which describes an outcome that
satisfies a given goal.
4. Develop performance measures, each of which gauge the success with which
a given objective has been met.
1 Lance Neumann. Introduction to Performance Management. MIT 1.201 course lecture,
November 17, 2011.

MIT HSR/Regions Group Carlson, Archila and Stein
Chapter 2 – Northeast Corridor goals, objectives and performance measures
2-2
Although the advantage of this approach is that it clearly links performance measures to a
set of desired outcomes, it does not explicitly consider whether data and/or analytical
methods are available to determine these performance measures. As noted by Pickrell and
Neumann (2001), lack of available data and analytical methods may preclude calculating a
performance measure. As a result, once a set of desired performance measures have been
identified, further investigation is still required to collect appropriate data and identify
analytical methods. If either the necessary data or analytical methods are not available for a
given performance measure, then these data need to be collected or analytical methods
developed. Alternatively, if the resources required to complete these tasks would be
prohibitive, then the goals, objectives and performance measures need to be altered to
reflect available information and tools.
All of the tasks related to the development of goals, objectives and performance measures
take place during Step 6 of the CLIOS Process. Therefore, based on the above approach,
Step 6 comprises five sub-steps. This process can be summarized as shown in Figure 2.1
below.
At this point in the project, we have completed steps (a), (b) and (c), and have begun
collecting data and identifying analytical methods. However, one of the most significant
challenges involved with creating a set of performance measures for the NEC in a
multimodal context is identifying performance measures that can compare the
performance of each mode (i.e. are mode neutral) and that can measure overall system
performance (i.e. are multimodal measures). Whilst mode-specific measures abound (such
as pavement roughness for highways, etc.), by contrast, very few mode-neutral or
multimodal measures exist. Furthermore, even in cases in which on the surface a mode-
neutral measure exists (such as delay time per passenger-mile to measure congestion), the
available data, calculation methods and/or assumptions used may differ between modes.
As a result, a comparison or aggregation of multiple modes may not be useful. Nonetheless,
a. Refine system goals
b. Develop objectives
c. Identify performance
measures
i. Collect data
ii. Identify analytical
methods
If data and/or analytical methods are not available (and will not be collected or developed, respectively), revise
goals, objectives and/or performance measures
Verify compatibility
Proceed
Figure 2.1: Step 6 of the CLIOS Process – procedure for the development of goals, objectives and performance measures

MIT HSR/Regions Group Carlson, Archila and Stein
Chapter 2 – Northeast Corridor goals, objectives and performance measures
2-3
when possible, mode-neutral or multimodal measures have been identified. Further
investigation will be required, however, in order to confirm the availability of data and
compatibility of the available data between modes.
The goals, objectives and performance measures identified for the NEC are documented in
the subsequent text. For each of the goals identified, a table has been created which lists the
corresponding objectives and performance measures. Finally, each of the performance
measures has been related to a different actor on the NEC institutional sphere. Additional
notes regarding the goals, objectives and performance measures have been listed where
appropriate for additional explanation.
Although we have not noted a time element associated with each of the goals, objectives or
performance measures, we will need to consider the timeframe over which performance
improvements will occur when evaluating the bundles of strategic alternatives. We will
need to consider the time-value of the benefits: that is, a benefit received now is worth
more than the same benefit received several years in the future. Considering the time-value
of benefits (and costs) will be particularly important for evaluating the bundles of strategic
alternatives for the NEC, as each of them will produce benefits and incur costs over
different timeframes. For example, fully implementing international-quality HSR could take
upwards of 20 years and require great expense, but produce significant benefits as
compared to incremental HSR. However, incremental HSR could be implemented more
quickly (at lower cost), and therefore, potential benefits could be realized much sooner. As
a result, although most of the objectives do not make reference to the importance of a time
element, we will consider the time-value associated with the benefit realized (or cost
incurred) during our evaluation.
In addition to considering the time-value associated with improvements to the
performance measures, we will also consider the tradeoffs associated with improving each
of the performance measures. Even though we list objectives that begin with active verbs
such as, “increase,” “decrease,” “minimize,” and “maximize,” we recognize that positively
affecting one performance measure to achieve an objective might negatively impact
another performance measure. As a result, we wish to emphasize that, during our
evaluation of the bundles of strategic alternatives, we will not attempt to optimize only one
performance measure at the expense of the others. Rather, we will consider how a change
in a given performance measure correlates to changes in the other performance measures,
and by extension, how the different actors on the institutional sphere will be impacted by
the net effect of these changes.

MIT HSR/Regions Group Carlson, Archila and Stein
Chapter 2 – Northeast Corridor goals, objectives and performance measures
2-4
GOALS, OBJECTIVES AND PERFORMANCE MEASURES IDENTIFIED FOR THE NEC
In creating the goals for this project, we have considered the August 18, 2011 project
proposal to ITPS, which stated the need to identify “investment strategies that will lead to
an intermodal, multimodal, and sustainable transportation system for the Northeast
Corridor.” Additionally, we have also considered the strategic goals of the US Department of
Transportation, including:
� SAFETY: Improve public health and safety by reducing transportation-related
fatalities and injuries.
� STATE OF GOOD REPAIR: Ensure the U.S. proactively maintains its critical
transportation infrastructure in a state of good repair.
� ECONOMIC COMPETITIVENESS: Promote transportation policies and investments
that bring lasting and equitable economic benefits to the Nation and its citizens.
� LIVABLE COMMUNITIES: Foster livable communities through place-based policies
and investments that increase transportation choices and access to transportation
services.
� ENVIRONMENTAL SUSTAINABILITY: Advance environmentally sustainable policies
and investments that reduce carbon and other harmful emissions from transportation
sources.
(US DOT 2010)
The US DOT also has an organizational excellence goal, which is to “[d]evelop a diverse and
collaborative workforce that will enable the Department to advance a transportation
system that serves the Nation’s long-term social, economic, security, and environmental
needs.”
Using these goals as an overarching framework, we are proposing goals, objectives and
performance measures for the NEC that fall into three categories: (1) Transportation
system performance; (2) External impacts of the transportation system; and (3)
Organizational structure effectiveness. Goals, objectives and performance measures under
“Transportation system performance” focus narrowly on the direct benefits to the
transportation system and its users that would result from an investment. Specifically, they
will attempt to relate the mobility, state-of-good repair and safety of the transportation
system to the investment required. By contrast, goals, objectives and performance
measures under “External impacts of the transportation system” are intended to gauge
more broadly the sustainability of the transportation system considering the economy,
environment and social equity. The final set of goals, objectives and performance measures,
unlike the first two sets, is intended to focus primarily on the implementation of HSR. They
attempt to capture the objectives associated with implementing different organizational
structures for NEC HSR. Whilst to the end user, the nature of the NEC organizational

MIT HSR/Regions Group Carlson, Archila and Stein
Chapter 2 – Northeast Corridor goals, objectives and performance measures
2-5
structure is largely irrelevant (beyond its ability to deliver rail services effectively), to other
actors (such as NEC train operators) and decision-makers, these objectives and related
performance measures are important metrics. Collectively, the goals identified under these
three categories appear to be congruent with the strategic goals of US DOT and NEC
transportation operators.
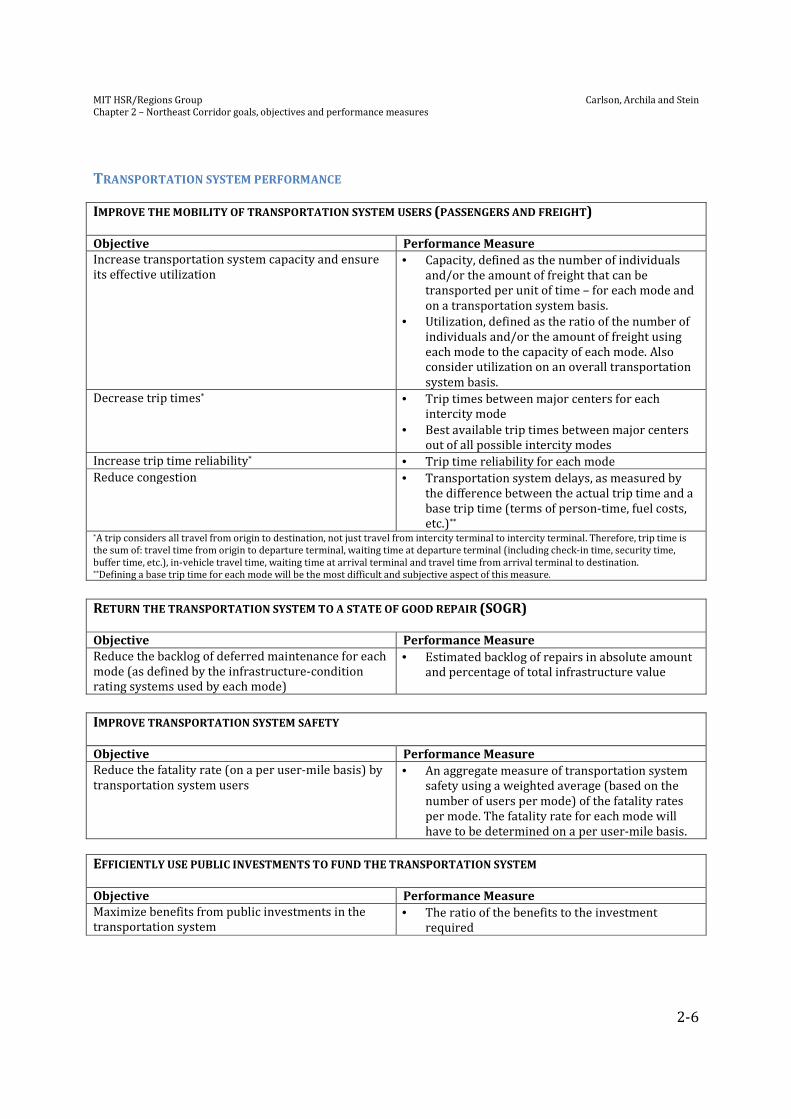
MIT HSR/Regions Group Carlson, Archila and Stein
Chapter 2 – Northeast Corridor goals, objectives and performance measures
2-6
TRANSPORTATION SYSTEM PERFORMANCE
IMPROVE THE MOBILITY OF TRANSPORTATION SYSTEM USERS (PASSENGERS AND FREIGHT)
Objective Performance Measure
Increase transportation system capacity and ensure
its effective utilization • Capacity, defined as the number of individuals
and/or the amount of freight that can be
transported per unit of time – for each mode and
on a transportation system basis.
• Utilization, defined as the ratio of the number of
individuals and/or the amount of freight using
each mode to the capacity of each mode. Also
consider utilization on an overall transportation
system basis.
Decrease trip times* • Trip times between major centers for each
intercity mode
• Best available trip times between major centers
out of all possible intercity modes
Increase trip time reliability* • Trip time reliability for each mode
Reduce congestion • Transportation system delays, as measured by
the difference between the actual trip time and a
base trip time (terms of person-time, fuel costs,
etc.)** *A trip considers all travel from origin to destination, not just travel from intercity terminal to intercity terminal. Therefore, trip time is
the sum of: travel time from origin to departure terminal, waiting time at departure terminal (including check-in time, security time,
buffer time, etc.), in-vehicle travel time, waiting time at arrival terminal and travel time from arrival terminal to destination. **Defining a base trip time for each mode will be the most difficult and subjective aspect of this measure.
RETURN THE TRANSPORTATION SYSTEM TO A STATE OF GOOD REPAIR (SOGR)
Objective Performance Measure
Reduce the backlog of deferred maintenance for each
mode (as defined by the infrastructure-condition
rating systems used by each mode)
• Estimated backlog of repairs in absolute amount
and percentage of total infrastructure value
IMPROVE TRANSPORTATION SYSTEM SAFETY
Objective Performance Measure
Reduce the fatality rate (on a per user-mile basis) by
transportation system users • An aggregate measure of transportation system
safety using a weighted average (based on the
number of users per mode) of the fatality rates
per mode. The fatality rate for each mode will
have to be determined on a per user-mile basis.
EFFICIENTLY USE PUBLIC INVESTMENTS TO FUND THE TRANSPORTATION SYSTEM
Objective Performance Measure
Maximize benefits from public investments in the
transportation system • The ratio of the benefits to the investment
required

MIT HSR/Regions Group Carlson, Archila and Stein
Chapter 2 – Northeast Corridor goals, objectives and performance measures
2-7
EXTERNAL IMPACTS OF THE TRANSPORTATION SYSTEM PROMOTE ECONOMIC GROWTH
Objective Performance Measure
Increase accessibility of labour force participants to
firms (jobs); increase accessibility of firms to labour
force participants
• Number of firms (jobs) within a certain trip time
of a population center on the NEC
• Number of labour force participants within a
certain trip time of business districts on the NEC
Increase the productivity of firms in all sectors of the
economy as a result of improvements to the
transportation system+
• Firm productivity
Promote short- and long-term jobs creation (as a
result of transportation system investments)# • Number of jobs created
Stimulate real estate development • Change in land value correlated to transportation
system development +Research is this field shows a correlation between agglomeration caused by transportation and productivity (Graham 2007). #The intent of this objective and corresponding performance measure is to consider the number of jobs that will be created within the
northeast U.S. (and the U.S., if possible) as a result of transportation investments in the NEC. It is not intended to suggest that the goal of a
transportation system investment should be to maximize job creation at the expense of generating inefficiencies.
INCREASE ENVIRONMENTAL SUSTAINABILITY
Objective Performance Measure
Reduce greenhouse gas (including CO2 and
equivalent greenhouse gases) emissions related to
the transportation sector
• CO2e (carbon dioxide equivalent) emissions
Reduce emissions of other air pollutants related to
the transportation sector • Air emissions
Reduce energy consumption by the transportation
sector • Consumption of petroleum-based products by
the transportation sector
• Consumption of other fuels required for
electricity production required by the
transportation sector (on a per energy source
basis)
• Consumption of fuels that are sourced from
outside of the US
Minimize the spatial footprint of the transportation
system, particularly on areas of high-environmental
sensitivity
• Area and characteristics of land required by
transportation projects
ENSURE SOCIAL EQUITY
Objective Performance Measure
Ensure that the net benefits of transportation system
improvements are evenly distributed spatially (on
local, regional and national scales) and by
socioeconomic class
• Consider the other performance measures on a
disaggregate basis when possible. For example,
when measuring job creation, the spatial
distribution and socioeconomic class of jobs
created should also be measured in addition to
the aggregate measure.

MIT HSR/Regions Group Carlson, Archila and Stein
Chapter 2 – Northeast Corridor goals, objectives and performance measures
2-8
ORGANIZATIONAL STRUCTURE EFFECTIVENESS
DEVELOP AN EFFECTIVE ORGANIZATIONAL STRUCTURE
Objective Performance Measure
Create an organizational structure that will minimize
time required for project implementation • Expected time required for project
implementation, including the time required to
institute the organizational structure
Create an organizational structure that will allow the
needs of all NEC operators (intercity passenger,
commuter and freight) to be considered during
transportation investments
• The “power” (in the context of the Mitchell
stakeholder typology) of each of the NEC
operators to meet its own needs and interests
Create an organizational structure that will promote
the optimal use of NEC infrastructure from both
construction and operational perspectives (Adapted
from Thompson, 2005)
• Financial transparency to the public
• Ability of the organization to control and
document costs required to construct, operate
and maintain the NEC rail infrastructure
• Ability of the organization to distribute slots to
different classes of operators (intercity
passenger, commuter and freight) to optimize
the use of rail system capacity
MIT HSR/Regions Group Carlson, Archila and Stein
Chapter 2 – Northeast Corridor goals, objectives and performance measures
2-9
PRELIMINARY MATRIX OF NEC INSTITUTIONAL ACTORS AND OBJECTIVES
One of the elements of the conceptual framework described in the initial August 18, 2011
project proposal is a, “matrix identifying which performance measures are important to
which stakeholders.” In keeping with the intent of this requirement, we have created a
matrix that relates institutional actors from the CLIOS representation (stakeholders) to the
objectives identified above. We are proposing this refined approach as relating actors to
objectives results in a stronger and more meaningful relationship with which to pursue
further analysis. Objectives describe desired future outcomes, whereas performance
measures only provide methods with which to gauge whether those outcomes are being
achieved. As a result, relating actors to objectives provides insight into how each actor
hopes to improve (or not improve) the system. For example, Amtrak is likely interested in
reducing trip time for intercity passenger rail travel, but airlines are more likely interested
in maintaining the status-quo travel time for intercity rail travel in order to maintain their
competitive advantage2. Such a relationship would not be as clear if performance measures
were considered; objectives provide more insight.
We have created a preliminary matrix of actors versus objectives, which is attached to this
section of the report. If an actor is concerned about a given objective, a “U” or an “M” is
entered into the corresponding cell. The “U” and “M” notation indicate whether an actor is
primarily concerned about the objective from a unimodal (U) or multimodal (M)
perspective. The notation considers two aspects of an actor’s interest in the objective: (1)
whether an actor wishes to achieve an objective through unimodal (U) or multimodal (M)
investments in the transportation system; and (2) whether an actor is primarily interested
in performance improvements for a given mode (U) or performance improvements on a
transportation system basis (M). For example, in the case of the objective to “Decrease trip
times,” Amtrak primarily wishes to consider investments in intercity passenger rail and
likely only measures its own travel time performance; therefore, a “U” is entered in the
appropriate cell. By contrast, the US DOT is concerned with improving trip times through
investments in all modes and considers the overall transportation system performance;
therefore, an “M” is entered in the appropriate cell.
The indication that an actor is primarily interested in the fulfillment an objective from a
unimodal perspective (as denoted by the “U”) is not intended to imply that this actor is not
concerned with transportation investments and performance improvements in other
modes. For example, as described in an example above, airlines are likely not only
2 Whilst Amtrak undoubtedly wishes to improve intercity passenger rail trip time, the
counter-position of the airlines in this example is intended for illustration purposes.
Further research into the airlines position on HSR in the NEC is required.

MIT HSR/Regions Group Carlson, Archila and Stein
Chapter 2 – Northeast Corridor goals, objectives and performance measures
2-10
concerned with improving their trip time performance, and but may in fact be against
improving the trip time performance of other modes (such as by developing HSR).
However, they are primarily interested improving air transportation performance. As a
result, the “U” notation is not intended to suggest that a given actor is uninterested in
developments in other modes, but that its primary focus is on one mode in particular.
This matrix will be a starting point for further evaluation of the relationship between
actors and objectives. At this point, only the strongest links between actors and objectives
have been noted. For example, whilst transportation users may be concerned with reducing
the backlog of deferred maintenance, the relationship is somewhat indirect, as they are
more concerned that they can complete their trip as quickly and safely as possible3.
Therefore, no relationship between these actors and this objective has been indicated in
the attached matrix. Given the subjective nature of identifying these relationships, we are
proposing to approach further actor (stakeholder) analysis using the Mitchell et al.
stakeholder typology presented in their 1997 paper “Toward a Theory of Stakeholder
Identification and Salience: Defining the Principle of Who and What Really Counts.” A
précis of this paper has been included in this work package entitled, “Stakeholder Analysis -
Salience and Decision-Making.” Given the complexities of the institutional sphere of the
NEC and the qualitative nature of this type of evaluation, this typology will help formalize
further stakeholder analysis.
3 This example also highlights the challenge faced by transportation agencies in securing
adequate funding to maintain existing infrastructure, as routine maintenance (or lack
thereof) is not as visible to the public as constructing new transportation infrastructure.
MIT HSR/Regions Group Carlson, Archila and Stein
Chapter 2 – Northeast Corridor goals, objectives and performance measures
2-11
REFERENCES
Graham, D.J. 2007. Agglomeration, Productivity and Transport Investment. Journal of
Transport Economics and Policy, 41: 317-344.
Pickrell, S. and Neumann, L. 2001. Use of Performance Measures in Transportation Decision
Making. In Performance Measures to Improve Transportation Systems and Agency
Operations. Report of a Conference, Irvine, California, October 29 - November 1, 2000.
Transportation Research Board, Washington, D.C., pp. 17-33.
Sussman, J. et al. 2009. The CLIOS Process: A User’s Guide – February 2009.
Thompson, L.S. 2005. Options for the Federal Ownership of Northeast Corridor (NEC)
Infrastructure.
US DOT. 2010. US DOT Strategic Plan FY 2010 – FY 2015 (Draft). US DOT: Washington, DC.

Stakeholder - Objective MatrixVersion 2
Increase transportation system capacity and ensure its effective
utilizationDecrease trip times
Increase trip time reliabilityReduce congestion
Reduce the backlog of deferred maintenance for each mode
Reduce the fatality rate (on per user-mile basis) by transportation system
users
Maximize benefits from public investments in the transportation system
Increase accessibility of labour force participants to firms (jobs);
increase accessibility of firms to labour force participants
Increase the productivity of firms in all sectors as a result of
improvements to the transportation system
Maximize the number of short- and long-term jobs created in the
transportation industry within the northeast United States
Stimulate real estate development
Reduce greenhouse gas emissions
Reduce emissions of other air pollutants related to the transportation
sector
Reduce energy consumption by the transportation sector
Minimize the spatial footprint of the transportation system, particularly
on areas of high-environmental sensitivity
Ensure that the net benefits of transportation system improvements are
evenly distributed spatially and by socioeconomic class
Create an organizational structure that will minimize the time required
for project implementation
Create an organizational structure that will allow the needs of all NEC
operators to be considered during transportation investments
Create an organizational structure that will promote the optimal use of
NEC infrastructure from both construction and operational perspectives
1 2 3 4 5 6 8 9 10 11 12 13 14 15 16 17 18 19 20
AC
TOR
S
# Government1 Congress M M M M M M M M M M M M M M M M M M2 State Governments M M M M M M M M M M M M M M M M M M M3 Local Governments M M M M M M M M M M M M M M M M M M M4 USEPA M M M5 US Department of Commerce M M M6 US Department of Energy M7 USDOT M M M M M M M8 FRA U U U U U U M M M9 FTA U U U U U U M M M
10 FHWA U U U U U U11 FAA U U U U U U12 Amtrak U U U U U U U U U13 Commuter Rail Agencies U U U U U U U U U14 Urban Public Transportation Organizations U U U U U U
Private Sector15 Freight Railroad Companies U U U U U U U U U16 Intercity Bus Operators U U U U U U17 Trucking Industry U U U U U U18 Airline Industry U U U U U U19 Private Consortiums U U U20 Private Land Owners M M
Transport Users21 Commuters M M M M M M M M22 Intercity Travelers M M M M M M M M23 Freight Users M M M M M M M M
KeyU: Stakeholder concerned with objective from a unimodal
perspective (where applicable)M: Stakeholder concerned with objective from a multimodal
perspective (where applicable)
AC
TOR
S

MIT HSR/Regions Group Carlson Chapter 3 - Northeast Corridor Bundles of Strategic Alternatives
3-1
Chapter 3
Proposed Northeast Corridor bundles of strategic alternatives S. Joel Carlson
_________________________________________________________________________________________________________
CONTENTS
Methodology for the development of the bundles of strategic alternatives
Strategic alternatives and decisions for the NEC
Additional alternatives excluded from the bundles
Recommended bundles of strategic alternatives
METHODOLOGY FOR THE DEVELOPMENT OF THE BUNDLES OF STRATEGIC ALTERNATIVES
Once the Representation Stage of the CLIOS Process is completed, the focus of the analysis
shifts from a descriptive to a prescriptive treatment of the system in Stage 2 – Design,
Evaluation and Selection. During this second stage, strategic alternatives intended to better
the performance of the system are identified, designed and evaluated. According to
Sussman et al. (2009), these strategic alternatives can fall under three broad categories: (1)
physical changes, which involve modifications to components on the physical domain; (2)
policy-driven changes, which involve modifications to policy levers in the physical domain
by actors on the institutional sphere; and (3) actor-based changes, which involve
modification to the structure of the actors on the institutional sphere or how the actors on
the institutional sphere interact with components in the physical domain. All three
categories of strategic alternatives were considered for implementation on the Northeast
Corridor (NEC). Once a suitable set of strategic alternatives are developed, they can be
combined together to form a “bundle” of strategic alternatives.
Because there are many potential bundles that could be applied to the NEC, a decision-tree
approach was used to help identify and classify strategic alternatives, and merge strategic
alternatives into bundles. Before strategic alternatives were identified, a set of decisions –
each of which represent a point on the decision tree at which we must select one
alternative from a given choice-set – were created. Strategic alternatives that can be
selected at each decision were then identified. All of the potential strategic alternatives for
a given decision (given the previous alternatives chosen) will be referred to as the decision
choice-set. At each decision, the analyst selects one alternative (or choice), and the set of all
these alternatives forms a bundle, which can then be evaluated using the conceptual
framework developed. Figure 3.1, below, shows this structure as applied to the NEC. The
following summary lists the above definitions and provides an example from the
referenced figure:
MIT HSR/Regions Group Carlson Chapter 3 - Northeast Corridor Bundles of Strategic Alternatives
3-2
Strategic alternative: A strategic alternative is a modification to the system
intended to improve its performance. (For example, in Figure 3.1 below, the light blue boxes are strategic alternatives.)
Decision: In order to help structure the design of the bundles of strategic alternatives, a decision is a point at which the analyst must select one strategic alternative out of a given choice-set. (For example, in Figure 3.1 below, each of the grey layers represents a decision.)
Decision choice-set: Each decision has a choice-set contain potential strategic alternatives. (For example, in Figure 3.1 below, the choice set for the Technology decision given the initial state of the system is {international-quality HSR, incremental HSR}.)
Choice: A choice is the selected strategic alternative at each decision. (For example, in Figure 3.1 below, the branch represented by “Bundle 1” contains the choice “international-quality HSR” selected at the Technology decision.)
Bundles of strategic
alternatives (“bundle”):
A bundle is a collection of choices (strategic alternatives) made at each decision. (For example, in Figure 3.1 below, “Bundle 1” is the branch of choices [strategic alternatives] from the “Initial State” to the [1] box)
The decisions, strategic alternatives and bundles identified for the NEC in Figure 3.1 will be
described in more detail in subsequent text. However, we recognize that this diagram is
not intended to represent all the possible strategic alternatives that are available for the
NEC. Firstly, given that there is a great variation in the scope of the decisions that can be
considered for the NEC – from macro-level alternatives concerning potential organizational
structures to micro-level alternatives regarding specific safety technologies that could be
implemented (for example) – we are proposing to look at only four of the most high-level
decisions. Secondly, the potential choice-set of each decision has been limited to at most
two key alternatives. Although in most cases, the choice-set of a decision contains many
strategic alternatives, often the distinctions between several of the alternatives are subtle,
and the probabilities of choosing some of the possible alternatives are low. As a result,
multiple alternatives have been merged together or excluded from the analysis in order to
focus on the most salient and probable strategic alternatives.
MIT HSR/Regions Group Carlson Chapter 3 - Northeast Corridor Bundles of Strategic Alternatives
3-3
STRATEGIC ALTERNATIVES AND DECISIONS FOR THE NEC
We have developed four potential bundles of strategic alternatives for ITPS’ consideration,
from which we (ITPS and MIT jointly) will select two for further consideration. The
conceptual framework will then be applied to these two bundles as a proof of concept of
the CLIOS Process during the second half of this project (December 1, 2011 to February 29,
2012).
The bundles of strategic alternatives presented include four decisions as shown in Figure
3.1: (1) Technology; (2) Infrastructure organizational structure; (3) Vertical
integration/separation; and (4) Competitive structure of intercity train operations. These
decisions have been arranged in a hierarchical structure, with Technology as the first
decision for the analyst to make and Competitive structure as the last decision. (The
meaning and choice-set of each of these decisions will be described below.)
The hierarchy chosen is not intended to limit other possible ways to look at the problem. As
noted by Sussman et al. (2009), system performance can be considered from the physical
domain outwards (e.g. looking at how a technological change could improve overall system
performance) or alternatively, from the institutional sphere inwards (e.g. looking at how
policy changes could improve overall system performance). In this case, by selecting
Technology as our first decision, we have chosen to emphasize how the implementation of
different types of high-speed rail systems would affect the choice of institutional structure.
Alternatively, we could have selected decisions related to the institutional structure first in
order to emphasize how these decisions impact the implementation of different types of
HSR technologies. However, during the process of coming up with strategic alternatives, we
felt that the strategic alternatives available for the Technology decision were the most
distinct.
TECHNOLOGY
We consider two strategic alternatives in the choice-set for Technology: international-
quality HSR and incremental HSR.
International-quality refers to developing a high-speed rail system similar to the Japanese
Shinkansen or the French TGV on a primarily dedicated track alignment. The trains
operating on this system would consistently reach speeds of over 200 mph (miles per
hour), and as a result, trips times along the corridor would be significantly reduced.
Although most of the NEC intercity traffic would shift to this new alignment, existing
commuter rail operators and regional intercity trains would operate along the existing
alignment. As a result, this strategic alternative would also include any required capital
investments required to bring the existing NEC alignment up to a state-of-good repair and
any upgrades required to increase capacity for (primarily) commuter rail operators, but
would not include any significant investments in decreasing travel times. An international-
MIT HSR/Regions Group Carlson Chapter 3 - Northeast Corridor Bundles of Strategic Alternatives
3-4
quality HSR in the NEC would look similar to the visions proposed by Amtrak (2010) and
the University of Pennsylvania School of Design (2011).
Incremental HSR refers to upgrading the existing NEC alignment gradually to reduce trip
times. The improvements to train speeds and trip times would be modest (as compared to
the international-quality strategic alternative). This strategic alternative would also include
all of the required upgrades to bring the existing NEC corridor up to a state of good repair
and any required capacity upgrades to account for increased intercity and commuter rail
traffic. This strategic alternative will assume that the existing alignment (with minor
modifications) will be used. As a result, it will be important to investigate the feasible limit
of decreases to travel times on this existing corridor. The incremental approach to high-
speed rail would look similar to the upgrades required in the NEC Infrastructure Master
Plan (2010).
Implementing either of these options involves a significant amount of uncertainty. Both
strategic alternatives will require significant investments (in the order of $50 billion for
incremental to over $100 billion for international-quality) to fully improve or build out the
system. However, as noted in Thompson (2005), upgrading the NEC has been compared to
performing open-heart surgery on an elderly patient, and, as a result, any cost estimates
are still subject to large errors. Additionally, (in particular) for the case of international-
quality HSR, ridership forecasts are also subject to large errors as there has been no similar
implementation of HSR in the US to date. Because uncertainty will dominate the decision-
making involved with either alternative, we will discuss methods during the second half of
this research to allocate risk and incorporate flexibility during the implementation of the
system. For example, we will consider different methods allocating risk during project
implementation through the appropriate use of public-private partnerships. Additionally,
for the international-quality HSR strategic alternative (in particular), we will consider how
the system could be constructed in phases in order to mitigate risks associated with
uncertain ridership and construction costs. Discussions regarding uncertainty will also be
extended to the other strategic alternatives as appropriate.
INFRASTRUCTURE ORGANIZATIONAL STRUCTURE
There are two strategic alternatives listed in the Infrastructure organizational structure
choice-set given the selection of either international-quality HSR or incremental HSR:
Amtrak, and an alternative public ownership (structure) with private involvement.
The first alternative (“Amtrak”) proposes that Amtrak continue to own most1 of the NEC
infrastructure and take the lead in developing a new international-quality HSR system or in
1 The MTA Metro-North Railway and the Connecticut Department of Transportation currently own the NEC from New Haven, CT to New Rochelle, NY. The Boston MBTA owns
MIT HSR/Regions Group Carlson Chapter 3 - Northeast Corridor Bundles of Strategic Alternatives
3-5
incrementally upgrading the existing NEC alignment. Furthermore, this strategic
alternative also proposes that the internal organizational structure of Amtrak largely stay
the same2, although it assumes that Amtrak would significantly improve its accounting of
NEC infrastructure costs and revenues.
The second strategic alternative proposes that an alternative public owner (alternative in
the sense of anything other than Amtrak) takes over the existing NEC infrastructure and
either spearheads developing a new international-quality HSR system or incrementally
upgrading the existing NEC alignment. A public owner could take on many forms, including
a regional public benefit corporation, an interstate compact or a new federal agency, for
example. Because the distinction between these strategic alternatives is subtle at this level
of analysis, the focus will be on the differences between Amtrak and an alternative public
owner. This alternative will also include public partnerships with the private sector for
project finance, construction, operation and maintenance. However, although we will
discuss these public-private partnership opportunities related to this alternative, we will
emphasize the public sector will take the leading role on the project.
We also considered a strategic alternative for private delivery of an international-quality
HSR system and private ownership of the existing NEC. However, we felt that these
strategic alternatives, in which the private sector takes the lead in developing a new HSR
system, are largely infeasible. As Thompson (2005) notes, whilst the private sector is fully
capable of managing the NEC (as can be demonstrated by the competence of the North-
American freight railroads), most of the traffic over the corridor is passenger service,
which will require some level of subsidy. Furthermore, the scope of the project, particularly
in the case of international-quality HSR, means that the project will need to be broken
down into several smaller work packages. As a result, we felt that the public sector would
still play a significant role as the overarching project manager for any HSR project
irrespective of private sector involvement.
One important consideration that will need to be discussed regardless of the strategic
alternative chosen will be how to best integrate planning decisions on the MTA Metro-
North Railway- and MBTA-owned segments of the NEC within the overall upgrade plan, as
well as how scheduling and train dispatching might be coordinated with the rest of the
NEC. For example, the federal government could purchase these sections of right-of-way
and track and place them under the management of either Amtrak or another public owner.
Alternatively, these sections of track could continue to be maintained by their current
owners, but a formal committee could be set up to discuss infrastructure upgrade plans
the portion of the NEC within Massachusetts; however, Amtrak is contracted to maintain to maintain and operate this section. 2 We do not plan on discussing the potential of creating multiple subsidiaries under one Amtrak holding company.

MIT HSR/Regions Group Carlson Chapter 3 - Northeast Corridor Bundles of Strategic Alternatives
3-6
along the NEC. Considering this issue is particularly important in the case of the
incremental upgrade plan, as a new alignment that bypasses these other owners’ territories
will likely not be constructed to accommodate intercity passenger travel. Therefore,
regardless of the NEC infrastructure ownership structure chosen, we will also plan to
discuss approaches to dealing with the current segmented ownership structure of the NEC.
VERTICAL INTEGRATION/SEPARATION
This decision has two alternatives within its choice-set: vertical integration and vertical
separation. Vertical integration refers to having ownership and management of both track
infrastructure and train operations handled one organization, whereas vertical separation
refers to having the ownership and maintenance of track infrastructure handled by one
organization and train operations handled by one or several other organizations.
If Amtrak (without separate subsidiaries for train operations and infrastructure
management) were chosen to own the NEC infrastructure at the previous decision, then
Amtrak will most likely operate intercity passenger service over the NEC as well. As a
result, choosing Amtrak as the infrastructure manager limits the choice-set of the two
subsequent decisions to “vertically integrated” and “one operator (Amtrak).”
However, if an alternative public owner were selected to own the NEC infrastructure, then
train operations and infrastructure ownership could either be vertically integrated or
separated. For example, the public owner could create a vertically integrated system by
contracting with a private firm to operate and maintain the infrastructure and operate the
intercity passenger train service. We, however, are proposing to consider the case in which
the public owner chooses to keep infrastructure management separate from train
operations. In this case, the public owner would contract with one firm to operate and
maintain the infrastructure, and another firm (or firms) would operate trains. We selected
this alternative in order to best distinguish from bundles that include Amtrak operating as
a vertically integrated company (as described above). (As a result, in Figure 3.1 below, the
vertically integrated strategic alternative is not shown for clarity.)
One important consideration within this decision would be the setting of access fees for
operators, as amount of this access fee can have a significant impact on the competitive
structure for not only intercity passenger rail operators, but also commuter and freight
railroads. These access fees will therefore be discussed within the context of the decision to
pursue vertical separation or integration of infrastructure.
COMPETITIVE STRUCTURE OF INTERCITY TRAIN OPERATIONS
In many respects, the Competitive structure of intercity train operations (“Competitive
structure”) flows out of the decisions made at previous levels. If Amtrak is selected as the
organization to own and manage the NEC infrastructure, intercity passenger train
operators will likely be limited to Amtrak. However, if alternative public ownership with
MIT HSR/Regions Group Carlson Chapter 3 - Northeast Corridor Bundles of Strategic Alternatives
3-7
vertical separation is selected, there could be one or several intercity train operators on the
NEC. The public owner of the infrastructure could potentially force this decision by signing
a contract with one intercity operator to provide service. Conversely, in the bundles that
we have proposed, we have selected to evaluate the case in which there is competition
between multiple intercity passenger train operators. Although the public infrastructure
owner could not force multiple intercity operators to enter the market, it could be
interesting to evaluate whether increased rail-rail competition increases the overall
competitiveness of rail (or improves cooperation) with other modes.
ADDITIONAL STRATEGIC ALTERNATIVES EXCLUDED FROM THE BUNDLES
In addition to the strategic alternatives presented above and in Figure 3.1, there are many
more strategic alternatives (and hence, decisions) that can be applied to the NEC. However,
during the development of the bundles of strategic alternatives, we have identified
subsequent decisions after “Competitive structure” as lower-level, more detail oriented
decisions. As a result, during the initial application of the conceptual framework, we will
only discuss subsequent decisions in broad terms as necessary.
Out of all of the possible lower-level decisions, two of the most significant include route
selection and service plan. Route selection has a strong influence on many aspects of the
system including overall construction cost, intercity travel time, passenger demand,
environmental impacts, etc. Different service plans, such as offering direct Boston to
Washington, D.C. service, airport services, commuting services, etc. can have a significant
impact on the overall competitiveness of the system as well. Having said that, evaluating
different route choice and service strategic alternatives will require significantly more in
depth study to fully appreciate the differences between alternatives.
In addition to these two strategic alternatives, it is worth noting that there are a significant
number of even more finer, detailed oriented strategic alternatives that can be considered
in the future. For example, HSR system safety could be an important topic worthy of
developing strategic alternatives around, particularly given the FRA’s emphasis on
crashworthiness of rolling stock much more than other international high-speed rail
regulators. However, issues such as these, whilst important, focus much more on smaller-
scope engineering decisions requiring detailed analysis, and have thus been excluded from
the initial set of strategic alternatives.
RECOMMENDED BUNDLES OF STRATEGIC ALTERNATIVES
We have identified four bundles of strategic alternatives, as shown in Figure 3.1. Each
branch in this figure, labeled from (1) to (4), represent a different bundle of strategic
alternatives that could be considered. For example, Bundle (1) represents the set of

MIT HSR/Regions Group Carlson Chapter 3 - Northeast Corridor Bundles of Strategic Alternatives
3-8
alternatives {International-quality HSR, Amtrak, Vertical integration, One operator
(Amtrak)}.
Many of the bundles are similar to existing proposals for HSR in the NEC. Bundle (1)
represents the implementation of an international-quality HSR system and organizational
structure similar to the plan detailed in Amtrak’s Vision for High-Speed Rail in the
Northeast Corridor report (2010). It would be an interesting bundle to consider as few
independent sources (other than Amtrak) have investigated having Amtrak take the lead
on developing an international-quality system. Bundle (2) is similar to the University of
Pennsylvania’s School of Design proposal (2011), in which they recommend having a
regional public benefit corporation take the lead on developing international-quality HSR.
Bundle (3), in which Amtrak remains the primary owner of the NEC and develops HSR
incrementally, would largely resemble the plan outlined in the 2010 NEC Infrastructure
Master Plan. This bundle is the closest strategic alternative to maintaining the “status-quo”
on the NEC. Finally, although the physical upgrades to the NEC in Bundle (4) would be
similar to those of Bundle (3), it would consider alternative ownership structure similar to
those discussed or recommended in the University of Pennsylvania’s School of Design
Proposal (2011), Robins (2006) and Thompson (2005).
We are open to evaluating any two of the bundles identified; however, there are tradeoffs
associated with selecting different combinations of bundles. If we were to consider Bundle
(1) and Bundle (4), or Bundle (2) and Bundle (3), we would be able to apply the conceptual
framework to evaluate distinctions at both the Technology decision and Infrastructure
organizational structure decision. As a result, selecting either of these pairs of bundles
would allow us to demonstrate the ability of the CLIOS Process to evaluate alternatives
applied to both the physical domain and the institutional sphere. In other words, we would
consider the relative merits of selecting international-quality HSR versus incremental HSR,
while accounting for the different institutional environment in which the systems would
develop. We, therefore, believe that selecting either Bundle (1) and Bundle (4), or Bundle
(2) and Bundle (3) would provide a good proof-of-concept of the CLIOS Process.
However, selecting either of these pairs of bundles would not allow us to evaluate the
relative merits of the strategic alternatives available at each decision. For example, if
Bundle (1) and Bundle (4) were selected, we would compare an international-quality HSR
system owned by Amtrak with an incremental system owned by an alternative public
owner. Because the strategic alternatives at both decisions are different, we would be less
able to evaluate the relative merits of selecting international-quality HSR or incremental
HSR under a given ownership structure. Alternatively, we would not be able to evaluate the
relative merits of selecting a certain ownership structure given a certain technology choice.
Therefore, if ITPS is interested primarily in one of the decisions, then the strategic
alternative at the other decision should be fixed. For example, if ITPS is interested in
evaluating the relative merits of international-quality HSR versus incremental HSR, we

MIT HSR/Regions Group Carlson Chapter 3 - Northeast Corridor Bundles of Strategic Alternatives
3-9
would recommend selecting Bundles (1) and (3), or Bundles (2) and (4). If ITPS is
interested in considering the differences between potential ownership structures, then
Bundles (1) and (2), or Bundles (3) and (4) should be selected.
The only combination of bundles that would not be as interesting to consider would be
those pairs that only consider differences between Infrastructure organizational structure
strategic alternatives (i.e. the last two pairs described above). Whilst the Infrastructure
organizational structure, Vertical integration/separation and Competitive structure
decisions are important, the Infrastructure organizational structure decision has already
been extensively discussed in documents such as Thompson (2005) and Robins (2006),
and the subsequent decisions regarding Vertical integration/separation and Competitive
structure largely flow out of the chosen organizational structure. Furthermore, although
the CLIOS process would provide some additional insight into these decisions, our
evaluation would only likely require a small portion of the CLIOS representation, and the
difference between the results in each case would be subtle. Therefore, we would
recommend against selecting Bundles (1) and (3) or Bundles (3) and (4) for evaluation
together.
In order to summarize the above discussion, Table 3.1 below provides a list of the
combination of bundles that we would recommend or not recommend selecting for
evaluation during the second half of this research project.
Table 3.1: Recommended and not recommended bundles of strategic alternatives
Recommended pairs of bundles Pairs of bundles not recommended
• Bundles (1) and (4) • Bundles (2) and (3) • Bundles (1) and (3) • Bundles (2) and (4)
• Bundles (1) and (2) • Bundles (3) and (4)

MIT HSR/Regions Group Carlson Chapter 3 - Northeast Corridor Bundles of Strategic Alternatives
3-10
REFERENCES
Amtrak. 2010. Vision for High-Speed Rail in the Northeast Corridor. Amtrak: Washington,
D.C.
NEC Master Plan Working Group. 2010. The Northeast Corridor Infrastructure Master Plan.
Amtrak: Washington, DC.
PennDesign. 2011. High-Speed Rail in the Northeast Megaregion: From Vision to Reality.
University of Pennsylvania School of Design: Philadelphia, PA.
Robins, M.E. 2006. Northeast Corridor Action Plan: A Call for a New Federal-State
Partnership. Alan M. Voorhees Transportation Center: New Brunswick, NJ.
Sussman, J. et al. 2009. The CLIOS Process: A User’s Guide – February 2009.
Thompson, L.S. 2005. Options for the Federal Ownership of Northeast Corridor (NEC)
Infrastructure.

MIT HSR/Regions Group Carlson Chapter 3 - Northeast Corridor Bundles of Strategic Alternatives
3-11
Additional Lower-Level Strategic Alternatives
Figure 3.1: Proposed bundles of strategic alternatives for the NEC

MIT HSR/Regions Group Pena, Archila and Carlson
Chapter 4- Next steps in the CLIOS representation: Component connectivity and path impact
4-1
Chapter 4
Next steps in the CLIOS representation: Component
connectivity and path impact Maite Peña-Alcaraz | Andrés F. Archila | S. Joel Archila
CONTENTS
Introduction
Connectivity matrix
Component connectivity appropriateness check
Identification of feasible paths
Speed, Strength and Impact of Paths
A Short Proof of Reasonableness
Insights and conclusions
INTRODUCTION
This work is intended to provide an independent check to the CLIOS representation, as a
first proof of concept. We made every effort to assure independence. The validation of the
CLIOS representation is based on expert opinion. Having different members of the team
working on the project, one developing the CLIOS representation, and another verifying it,
have allowed us to be confident of the representation developed.
As part of the work to keep this analysis independent of the CLIOS representation
development, the part of the MIT HSR/Regions Group involved in the definition of the
CLIOS representation developed class 1 (considering only links connecting different
components) and class 2 (considering also links connecting actors and components)
connectivity matrices. Then, the other part of the group carried out the connectivity
analysis. We first developed a list of important connections between components that we
expect to have in the system. Then, we analyze how these expected connections are
included in the representation, via the class 1 links, and the class 2 links later. The fact that
we need class 2 links to account for all the expected connections confirm that an analysis
considering the physical domain only without the interactions with the institutional sphere
is misleading.
The next step after validating the CLIOS representation has been to analyze the relative
importance of each path in the system. We expect to have different paths with different
levels of importance in terms of the causality effects on the CLIOS system. In the last
subsections of this chapter we have tried to address this intuition in a formal way, defining

MIT HSR/Regions Group Pena, Archila and Carlson
Chapter 4- Next steps in the CLIOS representation: Component connectivity and path impact
4-2
whether the connections are fast or slow, and whether they are strong or weak to develop a
combined measure of the importance of the connection.
CONNECTIVITY MATRIX
The connectivity matrix was developed to indicate whether two components are connected
and, if so, how many links are in the shortest path that connects them. The matrix was
created in MATLAB by taking as input the component-component (class 1) links matrix
from the CLIOS representation (see chapter 1). Details about the algorithm are included in
appendix C.
Connectivity and directionality between any pair of components can be determined and
tested with the connectivity matrix. In this context, connectivity includes directionality, as
it is different to say “component A (start point) is connected to component B (endpoint)”
than to say “component B (start point) is connected to component A (endpoint)”. In some
cases, both are true.
Table 4.1 and Table 4.2 show the connectivity matrices for class 1, and class 1 and class 2
links respectively. In particular, the number contained in a cell in row A and column B
represents the minimum number of links connecting component A (start point) and
component B (endpoint). Note that multiple paths can connect two components.
This matrix offers a first, direct proof of concept of the CLIOS representation in that it
ensures that components that should be connected are connected, and those that are not
connected are, in fact, not connected. Note again that the determination of which
components should (or should not) be connected is based on our collective opinion, as
experts and advance students of transportation.
COMPONENT CONNECTIVITY APPROPRIATENESS CHECK
The objective of this section is to perform this proof of concept of the CLIOS representation
analyze the connectivity matrix and the different paths connecting components. In
particular, we are interested not only in determining if the connections between
components are appropriate, but also in determining if the paths connecting the
components are reasonable.
The methodology that we have followed to analyze the connectivity between components
included the development of a list of connections that we expect to have in the system.
After that, we have analyzed through which components and links we may find those

MIT HSR/Regions Group Pena, Archila and Carlson
Chapter 4- Next steps in the CLIOS representation: Component connectivity and path impact
4-3
connections, within the physical domain first (class 1 links) and later through the
institutional sphere (including class 2 links in the analysis)1.
EXPECTED CONNECTIONS
In this subsection we present a list of expected connections in the system. As an additional
measure to ensure independency, we did not use the name of the components used for the
CLIOS representation. Instead, we developed a list of concepts (items that might affect or
be affected by other items). The initial list developed includes those connections that are
usually considered on public transit environments (Sussman, 2000; Wilson, 2012):
1. The economic situation should impact public and private investment (both national and
foreign)
2. The cost of constructing HSR should also impact public and private investment
3. Political and social HSR (or in general, transportation) support should impact private
and foreign investment
4. Public and private investment or in general, transport funding and investment, should
impact HSR infrastructure, and hence trip attributes
5. The economic situation should affect the investment in HSR and the political support. It
should also affect the transportation demand
6. Congestion in any transportation mode should impact public support
7. Environmental policies should affect energy policies and transportation policies, as well
as transportation planning
8. The weather, the environmental situation, air emissions and human health should have
an effect on the environmental policies
9. Trip attributes should impact modal split and transportation demand
10. Transportation infrastructure, as well as transportation service and operation should
impact transportation capacity
11. Transportation capacity, as well as transportation demand, should impact congestion
12. Energy output (energy mode, availability, reliability and cost) should impact the energy
prices
1 Another way to check the CLIOS representation could have been the development of a list
of all components and organizations by the part of the group involved in the design of the
CLIOS representation. Then the other part of the group could have determined which the
expected connections are, and double-check them
MIT HSR/Regions Group Pena, Archila and Carlson
Chapter 4- Next steps in the CLIOS representation: Component connectivity and path impact
4-4
13. The energy price and in general, fuel price, should impact modal split and
transportation demand
14. Inter-modal transportation integration policies should affect trip attributes
15. Land usage and land demand should be affected by the transportation system. At the
same time, the land usage should affect the transportation demand.
CLASS 1 CONNECTIONS ANALYSIS
We may find these connections through the following paths:
1. The economic situation should impact public and private investment (both
national and foreign):
This impact has been considered within the CLIOS representation through the links from
Macroeconomic Factors to Economic Activity and from then to Private Investment. The
public investment (represented within the component Transport Funding and Investment)
is affected only by Taxes and Transport Revenue, which are affected by the economic
situation. There is also one path between the Macroeconomic Factors component and the
Economic Activity component and Transport Funding and Investment through the
components Transportation Demand, Network Usage, Transportation Revenue and
Transport Funding and Investment.
2. The cost of constructing HSR should also impact public and private investment:
Technology improvements can be captured through the Firm’s Cost and Capacity. Firm’s
Cost and Capacity impact Public and Private Investment through Economic Activity,
Transportation Demand, Network Usage and Transport Revenues.
3. Political and social HSR (or in general, transportation) support should impact
private and foreign investment:
Transport Demand captures social HSR support. This demand will impact the Network
Usage when the technology is available, that will affect Transport Revenues, which affects
the Economic Activity and Private Investment. However, there is no path using only class 1
links that shows that Transportation Demand will affect Foreign Investment.
The components Federal and State Fiscal Policies and Taxes represent the political support
to HSR. There is a link between Taxes and Foreign Investment. Federal and State Fiscal
Policies and Taxes also affect Private Investment indirectly. However, there is no path using
only class 1 links between Federal and State Fiscal Policies and Foreign Investment.
4. Public and private investment or in general, transport funding and investment,
should impact HSR infrastructure, and hence trip attributes:
MIT HSR/Regions Group Pena, Archila and Carlson
Chapter 4- Next steps in the CLIOS representation: Component connectivity and path impact
4-5
This impact has been captured in several paths connecting Public Investment to
Transportation Nodes, Linkages and Vehicles, Transportation Capacity from there and Trip
Attributes, as well as paths connecting Private Investment with Transportation Nodes,
Linkages and Vehicles, Transportation Capacity and Trip Attributes.
5. The economic situation should affect the political support. It should also affect
the transportation demand:
There are some paths connecting the economic situation (Economic Activity, Capital or
Macroeconomic Factors) with the political support for HSR in this case through the
Transport Funding and Investment component. There are also several paths connecting
Economic Activity and Transportation Demand.
6. Congestion in any transportation mode should impact public support:
The Congestion component in the CLIOS Process is directly affecting the Transportation
Demand component that captures, as we claimed before, the public support.
7. Environmental policies should affect energy policies and transportation policies,
as well as transportation planning:
There is no path using only class 1 links connecting the Environmental Policies component
with the Energy Policies component. There is no path using only class 1 links between
Environmental Policies and Intermodal-Integration Policies either. There is a path
connecting Transport Funding and Investment using class 1 links going through Air
Emissions, Human Health and Environmental Sustainability, Economic Activity,
Transportation Demand and Network Usage, and Transportation Revenue.
8. The weather, the environmental situation, air emissions and human health
should have an effect on the environmental policies:
There is no component with an impact through class 1 links on the Environmental Policies
component.
9. Trip attributes should impact modal split and transportation demand:
The impact of Trip Attributes on Modal Split has been captured in several paths. There is
also a connection between Trip Attributes and Transportation Demand.
10. Transportation infrastructure, as well as transportation service and operation
should impact transportation capacity:
Transportation infrastructure is captured by the Nodes, Linkages and Vehicles, which have
a direct impact in the Transportation Capacity component. The Network Usage and
Transportation Frequency components capture the transportation operation, and also
affect the Transportation Capacity component.

MIT HSR/Regions Group Pena, Archila and Carlson
Chapter 4- Next steps in the CLIOS representation: Component connectivity and path impact
4-6
11. Transportation capacity, as well as transportation demand, should impact
congestion:
The Transportation Capacity and the Transportation Demand component affect Congestion
through the Network Usage component.
12. Energy output should impact the energy prices:
There is no connection between the Energy Output component and the Global Fuel Prices or
the Fuel Cost and Availability components through class 1 links.
13. The energy price and in general, fuel price, should impact modal split and
transportation demand:
The Modal Split and the Transportation Demand components are affected by the Global
Fuel Prices, Fuel Prices and Energy Output components through the Trip Attributes
component.
14. Inter-modal transportation integration policies should affect trip attributes:
There is a path connecting Inter-Modal Integration Policies with Connectivity and with Trip
Attributes afterwards.
15. Land usage and land demand should be affected by the transportation system. At
the same time, the land usage should affect the transportation demand:
The Land Accessibility component is affected by the Transportation Service component, so
the Land Supply, the Land Cost and the Land Usage components will be affected by
Transportation Service too. At the same time, Land Usage impact directly on the
Transportation Demand.
CLASS 2 CONNECTIONS ANALYSIS
In the previous subsection, we highlighted five groups of missing connections in the
physical domain where the team experience suggested there should be one. In this
subsection, we analyze if the components highlighted are connected through paths
containing class 1 links but also class 2 links (links connecting either different components
or actors and components):
1. Connection between Transportation Demand and Foreign Investment:
Considering also class 2 links, there is a path of five links connecting Transportation
Demand and Foreign Investment.
2. Connection between Federal and State Fiscal Policies and Foreign Investment:
In this case, there is also a path of two links connecting Federal and State Fiscal Policies and
Foreign Investment.

MIT HSR/Regions Group Pena, Archila and Carlson
Chapter 4- Next steps in the CLIOS representation: Component connectivity and path impact
4-7
3. Connection between the Environmental Policies component with the Energy
Policies component and connection between Environmental Policies and
Intermodal Transportation Cooperation Policies:
In this case there are paths with three and two components respectively connecting
Environmental Policies and Energy Policies; and Environmental Policies and Multimodal
Transportation Cooperation Polices.
4. Connection between the Weather, Humal Health & Environmental Sustainability
and the Air Emissions components with the Environmental Policies component:
Using class 2 links, we find a five-links long path from Weather to Environmental Policies,
another five-links long path from Human Health & Environmental Sustainability and
Environmental Policies and a two-links long path from Air Emissions to Environmental
Policies.
5. Connection between the Energy Output component and the Global Fuel Prices or
the Fuel Prices components:
In this case there is also a path from Energy Output to Fuel Cost and Availability using class
2 links. In this case the path goes through other four components.
IDENTIFICATION OF FEASIBLE PATHS
Although the graphical version of the CLIOS representation allows identifying some paths
in the system, it is impossible to observe all the possible paths. Likewise, the connectivity
matrix only shows which components are connected to one another via other components
but not the specific path or paths that join them. In general terms, neither the graphical
CLIOS representation nor the connectivity matrix identify or assess the paths in the system.
To address this problem, the research team developed algorithms and criteria to identify
and classify the paths in the system.
This analysis was restricted to the Physical Domain; therefore actors on the Institutional
Sphere are excluded. Three matrices are the inputs to the algorithm. The first matrix is the
class 1 links matrix from the CLIOS representation. Two additional input matrices with
values of the “speed” and “strength” of class 1 links were assigned and presented using the
same format as the class 1 links matrix. The “speed” of a link represents how fast the
variation of the initial component produces an impact on the final component, under the
ceteris paribus assumption. The “strength” of a link represents the proportionality of the
effect of the initial component in the end component of the link. “Speed” reflects the
transient effect of the link, whereas “strength” reflects the steady state effect of the link.
The values for speed and strength were based on the descriptions of the links in the CLIOS
representation (chapter 1) and on the collective opinion of the research team, as experts
and advanced students of transportation. In order to simultaneously consider the effects of
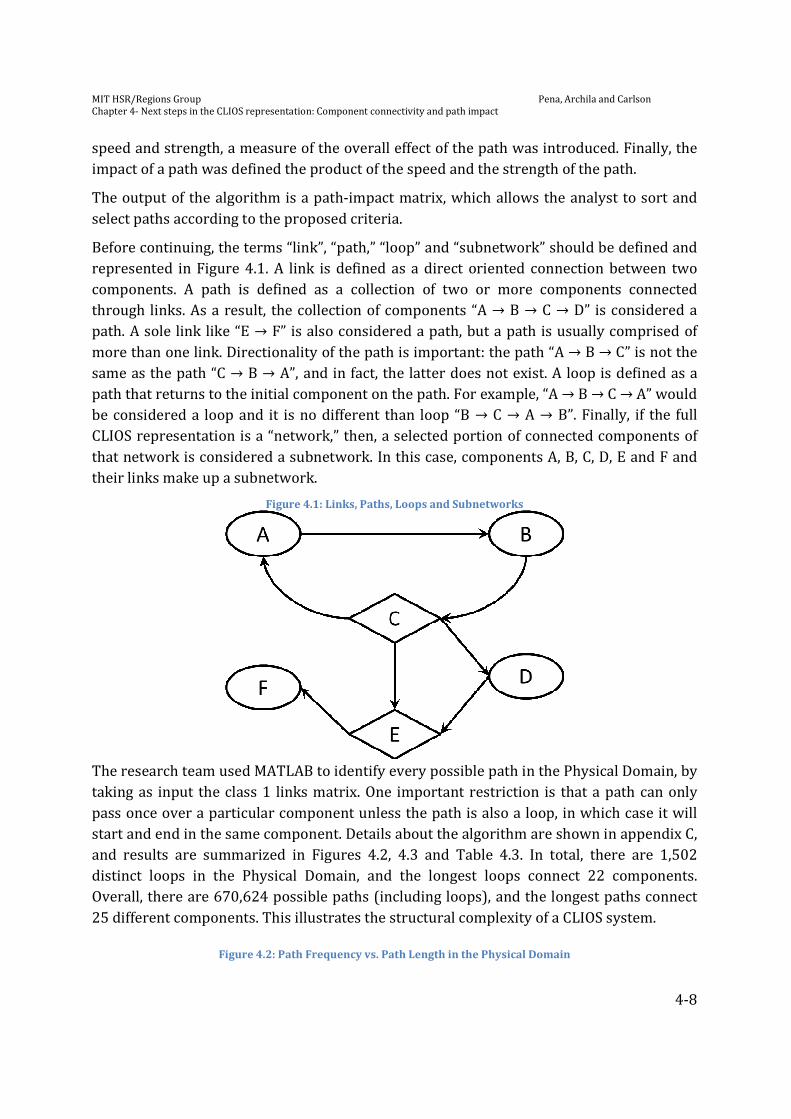
MIT HSR/Regions Group Pena, Archila and Carlson
Chapter 4- Next steps in the CLIOS representation: Component connectivity and path impact
4-8
speed and strength, a measure of the overall effect of the path was introduced. Finally, the
impact of a path was defined the product of the speed and the strength of the path.
The output of the algorithm is a path-impact matrix, which allows the analyst to sort and
select paths according to the proposed criteria.
Before continuing, the terms “link”, “path,” “loop” and “subnetwork” should be defined and
represented in Figure 4.1. A link is defined as a direct oriented connection between two
components. A path is defined as a collection of two or more components connected
through links. As a result, the collection of components “A → B → C → D” is considered a
path. A sole link like “E → F” is also considered a path, but a path is usually comprised of
more than one link. Directionality of the path is important: the path “A → B → C” is not the
same as the path “C → B → A”, and in fact, the latter does not exist. A loop is deGined as a
path that returns to the initial component on the path. For example, “A → B → C → A” would
be considered a loop and it is no different than loop “B → C → A → B”. Finally, if the full
CLIOS representation is a “network,” then, a selected portion of connected components of
that network is considered a subnetwork. In this case, components A, B, C, D, E and F and
their links make up a subnetwork.
Figure 4.1: Links, Paths, Loops and Subnetworks
The research team used MATLAB to identify every possible path in the Physical Domain, by
taking as input the class 1 links matrix. One important restriction is that a path can only
pass once over a particular component unless the path is also a loop, in which case it will
start and end in the same component. Details about the algorithm are shown in appendix C,
and results are summarized in Figures 4.2, 4.3 and Table 4.3. In total, there are 1,502
distinct loops in the Physical Domain, and the longest loops connect 22 components.
Overall, there are 670,624 possible paths (including loops), and the longest paths connect
25 different components. This illustrates the structural complexity of a CLIOS system.
Figure 4.2: Path Frequency vs. Path Length in the Physical Domain
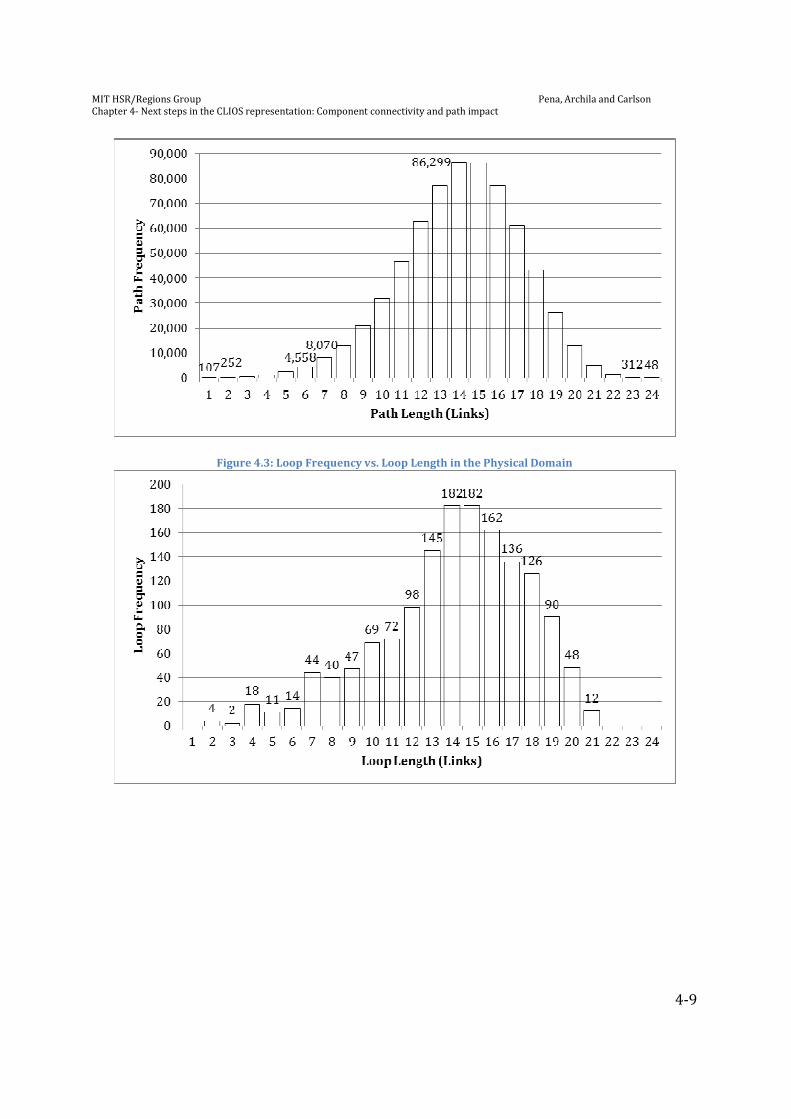
MIT HSR/Regions Group Pena, Archila and Carlson
Chapter 4- Next steps in the CLIOS representation: Component connectivity and path impact
4-9
Figure 4.3: Loop Frequency vs. Loop Length in the Physical Domain

MIT HSR/Regions Group Pena, Archila and Carlson Chapter 4 – Next steps in the CLIOS representation: Component connectivity and path impact
4-10
Length Loops Paths Cumulative
2 0 107
(1-link) 107
3 4 252 359
4 2 559 918
5 18 1,175 2,093
6 11 2,374 4,467
7 14 4,558 9,025
8 44 8,070 17,095
9 40 13,120 30,215
10 47 20,805 51,020
11 69 32,021 83,041
12 72 46,653 129,694
13 98 62,732 192,426
Length Loops Paths Cumulative
14 145 77,119 269,545
15 182 86,299 355,844
16 182 86,228 442,072
17 162 77,180 519,252
18 136 61,301 580,553
19 126 43,325 623,878
20 90 26,448 650,326
21 48 13,226 663,552
22 12 5,234 668,786
23 0 1,478 670,264
24 0 312 670,576
25 0 48 670,624
TOTAL 1,502 670,624
Table 4.3: Paths and Loops in the Physical Domain
SPEED, STRENGTH AND IMPACT OF PATHS
After determining the feasible paths, the path-impact matrix was constructed. This
matrix characterizes the speed, strength and impact of each path. The process for
constructing the path-impact matrix follows three steps.
FIRST STEP
The first step is to assign values for the strength and speed of individual links and
present them as two distinct input matrices built upon the class 1 links matrix.
These matrices are shown at the end of this chapter.
The links were classified according to speed as “fast”, “average” or “slow”, where fast
means that the effects that component A produces on component B take 0 to 2 years
to propagate; average, 2 to 8 years; and slow, 8 or more years. This classification
relates to the period of the election cycles in the USA in that "fast" represents the
time between two congressional elections, "average" represents up to two
presidential administration periods (the longest term a president can hold), and
"slow" represents a period longer than that. Numerically, this step will be completed
using a scale from 0 to 1, where 3/3=1 represents a fast link, 2/3 an average link,
and 1/3 a slow link.
The links were classified according to strength by considering the proportionality of
the effect of the initial component in the final component of the link. A “strong” link
between any given component A and a component B occurs when a change in
component A causes a proportional change in component B; a “medium” link occurs
when the change in component A causes an moderately proportional change in

MIT HSR/Regions Group Pena, Archila and Carlson Chapter 4 – Next steps in the CLIOS representation: Component connectivity and path impact
4-11
component B; and a “weak” link is one in which a change in component A has only a
modest effect on component B. Numerically, this step will be completed using a
scale from 0 to 1, where 3/3=1 represents a strong link, 2/3 a medium link, and 1/3
a weak link.
Speed / Strength Strong Medium Weak
Fast (1, 1) (1, 2/3) (1, 1/3)
Average (2/3, 1) (2/3, 2/3) (2/3, 1/3)
Slow (1/3, 1) (1/3, 2/3) (1/3, 1/3)
Table 4.4: Classification of Links According to Speed and Strength
SECOND STEP
The second step is to determine the speed and strength of the overall path with two
rules. As a first rule, the speed of a path is the minimum of the speeds of its links (i.e.
the slowest link will characterize a path), as the slowest link will limit the rate at
which the effect propagates through the overall path. This propagation is done
simultaneously rather than sequentially. Imagine, for the sake of example, that A→ B
is a slow link and B→ C is a fast link in the path “A → B → C”. If A changes abruptly, B
starts changing immediately but subtly. Simultaneously, C starts changing abruptly,
relative to B, but subtly, relative to A. It would take almost the same time for B to
react to the changes in A as it would take for C to react to changes in B that are
induced by A.
As a second rule, the strength of a path is the product of the strengths of its links, as
stronger links can generally counter-act weaker links. Inevitably, this rule favors
shorter links over longer links.
THIRD STEP
The third step is to determine the impact of a path. Although the effects of strength
and speed may be considered individually, it is necessary to identify those paths
that are predominantly strong and fast, or strong but not so slow. Weak paths that
act fast are not so interesting because their effects are small and in the short term,
whereas strong paths that are relatively slow may have significant effects in the long
term. These effects are most relevant to infrastructure projects.
Paths Strong Weak
Fast ++ -
Slow + -- Table 4.5: Desired Paths for Analysis
Increasing
Increasing

MIT HSR/Regions Group Pena, Archila and Carlson Chapter 4 – Next steps in the CLIOS representation: Component connectivity and path impact
4-12
In order to simultaneously consider the effects of speed and strength, paths were
ranked based on impact. The impact of each path is defined as the product of the
speed and the strength of the path, which is an intended measure of the overall
effect of the path. Impact is analogous to the concept of mechanical power, where
mechanical power equals the dot product of force and velocity
(Power=Force*Velocity).
Figure 4.4 shows how average speed, strength and impact of paths evolve as path
length increases. Impact is correlated to strong links that may vary at a wider range
of speeds, so it is a reasonable measure for identifying paths with characteristics
shown in Table 4.4.
Figure 4.4: Average Speed, Strength and Impact of Paths in the Physical Domain
For practical reasons, the maximum length of the paths analyzed in subsequent
chapters is limited to 6 links (i.e. 7 components), in which case there are more than
9,000 possible paths throughout the Physical Domain. Also, for paths longer than 6
links, the average impact is below 0.1 while the number of feasible paths increases
considerably and becomes unmanageable. A third reason for restricting the analysis
is that paths longer than 6 links are comprised of paths shorter than 6, which are
likely to be identified in the subnetworks (to be explained in the next chapter), and
thus are being considered already. Finally, the vast majority of the paths longer than
6 links have impacts lower than 0.2, and although they make up for 99.4% of the
feasible paths in the Physical Domain, their contribution to the high impact paths
(greater than>0.5) is negligible, as shown in Figure 4.5.

MIT HSR/Regions Group Pena, Archila and Carlson Chapter 4 – Next steps in the CLIOS representation: Component connectivity and path impact
4-13
Figure 4.5: Path-Impact Frequency in the Physical Domain
After the path-impact matrix is complete, it can be used for identifying the high-
impact paths. It shows for each path its components, strength, speed and impact,
and allows the analyst to sort and select paths according to each of these categories.
A SHORT PROOF OF REASONABLENESS
A short proof of reasonableness was performed by selecting the paths with the
highest and lowest possible impacts, and looking for unexpected relationships. In
the first part, 57 paths with impact equal to 1 and comprised of more than one link
were selected and analyzed. Most highest-impact paths were comprised of
components in the transportation subsystem and in the multi-modal transportation
subsystem, which evidenced strong, well known relationships between
transportation demand, trip attributes, modal split and network usage. These paths
also highlighted important connections between subsystems, such as transportation
and environmental and transportation and land use subsystems.
In the second part, the lowest-impact paths comprised of more than one link were
selected and analyzed for unexpected relationships. These paths showed convoluted
relationships between components in several subsystems and weak connections,
such as Energy Output to Transportation Demand, Firm’s Costs and Capacity to Trip
Attributes or Labor to Modal Split.
MIT HSR/Regions Group Pena, Archila and Carlson Chapter 4 – Next steps in the CLIOS representation: Component connectivity and path impact
4-14
CONCLUSIONS
Along the previous section we have considered many links within paths connecting
different components that we expected to be connected. A further analysis of the
connections and the paths among components has highlighted two interesting
issues:
Firstly, there are components that are not connected in the Physical Domain
(through class 1 links) but are connected when we consider the Institutional Sphere.
That fact reminds that both systems, the Physical Domain and the Institutional
Sphere, are required to correctly understand the NEC.
Secondly, we have been able to find all the connections that, as experts and advance
students of transportation; we expected to have in the CLIOS system. The fact that
these connections have been defined by the members of the HSR/Regions Group
that were not involved in the creation of the CLIOS representation, allows us to be
confident of the representation developed.
As shown in this chapter, the team identified every possible path in the Physical
Domain of the CLIOS representation. Because the number of paths is so large, the
team developed classification criteria for scoping the analysis. Speed, strength and
impact were reasonable indicators of a path’s performance and allowed us sort and
identify potentially interesting paths in the Physical Domain.
In this chapter, we proved the reasonableness of the CLIOS representation. In the
next chapter, we use the path-impact matrix as a tool to identify, select, and analyze
the most important paths in the CLIOS representation. This will allow us to
understand in more depth the complexity of the CLIOS system.
REFERENCES
Wilson, N., (2012). Public Transportation Systems Class Notes (Course 1.258). MIT:
Cambridge, MA.
Sussman, J., (2000). Introduction to Transportation Systems, Artech House Inc.,
Boston, MA.
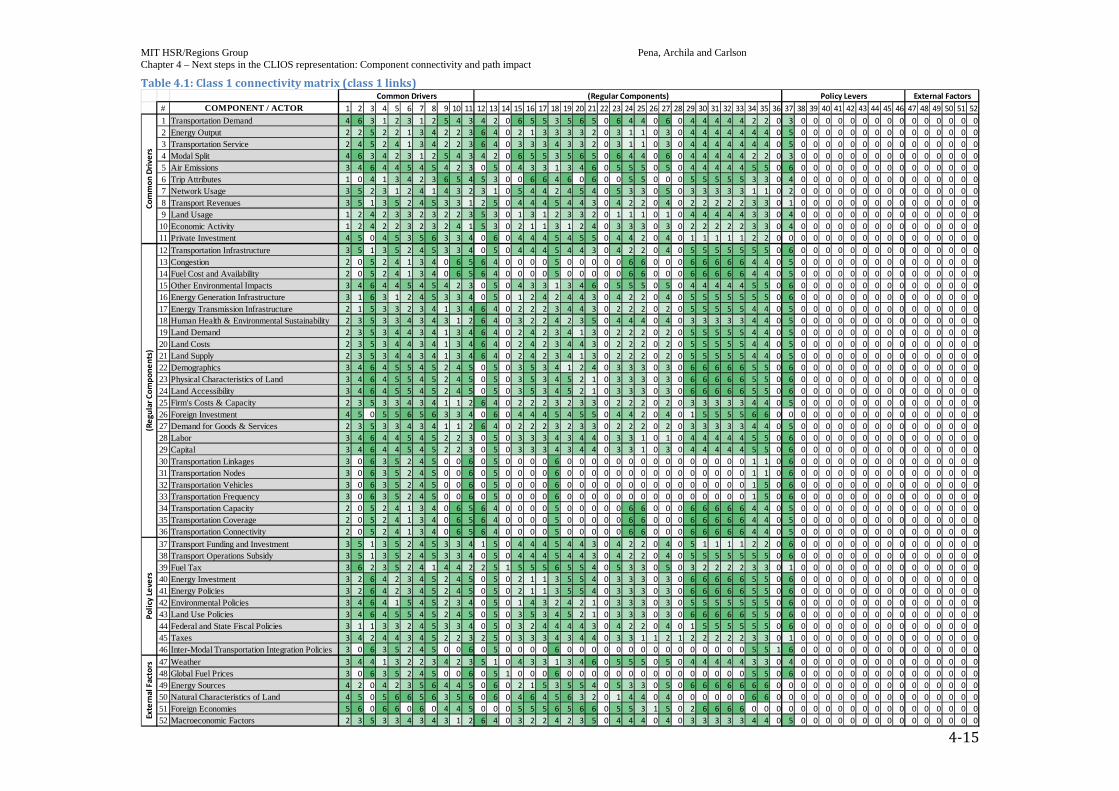
MIT HSR/Regions Group Pena, Archila and Carlson Chapter 4 – Next steps in the CLIOS representation: Component connectivity and path impact
4-15
Table 4.1: Class 1 connectivity matrix (class 1 links)
# COMPONENT / ACTOR 1 2 3 4 5 6 7 8 9 10 11 12 13 14 15 16 17 18 19 20 21 22 23 24 25 26 27 28 29 30 31 32 33 34 35 36 37 38 39 40 41 42 43 44 45 46 47 48 49 50 51 52
1 Transportation Demand 4 6 3 1 2 3 1 2 5 4 3 4 2 0 6 5 5 3 5 6 5 0 6 4 4 0 6 0 4 4 4 4 4 2 2 0 3 0 0 0 0 0 0 0 0 0 0 0 0 0 0 0
2 Energy Output 2 2 5 2 2 1 3 4 2 2 3 6 4 0 2 1 3 3 3 3 2 0 3 1 1 0 3 0 4 4 4 4 4 4 4 0 5 0 0 0 0 0 0 0 0 0 0 0 0 0 0 0
3 Transportation Service 2 4 5 2 4 1 3 4 2 2 3 6 4 0 3 3 3 4 3 3 2 0 3 1 1 0 3 0 4 4 4 4 4 4 4 0 5 0 0 0 0 0 0 0 0 0 0 0 0 0 0 0
4 Modal Split 4 6 3 4 2 3 1 2 5 4 3 4 2 0 6 5 5 3 5 6 5 0 6 4 4 0 6 0 4 4 4 4 4 2 2 0 3 0 0 0 0 0 0 0 0 0 0 0 0 0 0 0
5 Air Emissions 3 4 6 4 4 5 4 5 4 2 3 0 5 0 4 3 3 1 3 4 6 0 5 5 5 0 5 0 4 4 4 4 4 5 5 0 6 0 0 0 0 0 0 0 0 0 0 0 0 0 0 0
6 Trip Attributes 1 0 4 1 3 4 2 3 6 5 4 5 3 0 0 6 6 4 6 0 6 0 0 5 5 0 0 0 5 5 5 5 5 3 3 0 4 0 0 0 0 0 0 0 0 0 0 0 0 0 0 0
7 Network Usage 3 5 2 3 1 2 4 1 4 3 2 3 1 0 5 4 4 2 4 5 4 0 5 3 3 0 5 0 3 3 3 3 3 1 1 0 2 0 0 0 0 0 0 0 0 0 0 0 0 0 0 0
8 Transport Revenues 3 5 1 3 5 2 4 5 3 3 1 2 5 0 4 4 4 5 4 4 3 0 4 2 2 0 4 0 2 2 2 2 2 3 3 0 1 0 0 0 0 0 0 0 0 0 0 0 0 0 0 0
9 Land Usage 1 2 4 2 3 3 2 3 2 2 3 5 3 0 1 3 1 2 3 3 2 0 1 1 1 0 1 0 4 4 4 4 4 3 3 0 4 0 0 0 0 0 0 0 0 0 0 0 0 0 0 0
10 Economic Activity 1 2 4 2 2 3 2 3 2 4 1 5 3 0 2 1 1 3 1 2 4 0 3 3 3 0 3 0 2 2 2 2 2 3 3 0 4 0 0 0 0 0 0 0 0 0 0 0 0 0 0 0
11 Private Investment 4 5 0 4 5 3 5 6 3 3 4 0 6 0 4 4 4 5 4 5 5 0 4 4 2 0 4 0 1 1 1 1 1 2 2 0 0 0 0 0 0 0 0 0 0 0 0 0 0 0 0 0
12 Transportation Infrastructure 3 5 1 3 5 2 4 5 3 3 4 0 5 0 4 4 4 5 4 4 3 0 4 2 2 0 4 0 5 5 5 5 5 5 5 0 6 0 0 0 0 0 0 0 0 0 0 0 0 0 0 0
13 Congestion 2 0 5 2 4 1 3 4 0 6 5 6 4 0 0 0 0 5 0 0 0 0 0 6 6 0 0 0 6 6 6 6 6 4 4 0 5 0 0 0 0 0 0 0 0 0 0 0 0 0 0 0
14 Fuel Cost and Availability 2 0 5 2 4 1 3 4 0 6 5 6 4 0 0 0 0 5 0 0 0 0 0 6 6 0 0 0 6 6 6 6 6 4 4 0 5 0 0 0 0 0 0 0 0 0 0 0 0 0 0 0
15 Other Environmental Impacts 3 4 6 4 4 5 4 5 4 2 3 0 5 0 4 3 3 1 3 4 6 0 5 5 5 0 5 0 4 4 4 4 4 5 5 0 6 0 0 0 0 0 0 0 0 0 0 0 0 0 0 0
16 Energy Generation Infrastructure 3 1 6 3 1 2 4 5 3 3 4 0 5 0 1 2 4 2 4 4 3 0 4 2 2 0 4 0 5 5 5 5 5 5 5 0 6 0 0 0 0 0 0 0 0 0 0 0 0 0 0 0
17 Energy Transmission Infrastructure 2 1 5 3 3 2 3 4 1 3 4 6 4 0 2 2 2 3 4 4 3 0 2 2 2 0 2 0 5 5 5 5 5 4 4 0 5 0 0 0 0 0 0 0 0 0 0 0 0 0 0 0
18 Human Health & Environmental Sustainability 2 3 5 3 3 4 3 4 3 1 2 6 4 0 3 2 2 4 2 3 5 0 4 4 4 0 4 0 3 3 3 3 3 4 4 0 5 0 0 0 0 0 0 0 0 0 0 0 0 0 0 0
19 Land Demand 2 3 5 3 4 4 3 4 1 3 4 6 4 0 2 4 2 3 4 1 3 0 2 2 2 0 2 0 5 5 5 5 5 4 4 0 5 0 0 0 0 0 0 0 0 0 0 0 0 0 0 0
20 Land Costs 2 3 5 3 4 4 3 4 1 3 4 6 4 0 2 4 2 3 4 4 3 0 2 2 2 0 2 0 5 5 5 5 5 4 4 0 5 0 0 0 0 0 0 0 0 0 0 0 0 0 0 0
21 Land Supply 2 3 5 3 4 4 3 4 1 3 4 6 4 0 2 4 2 3 4 1 3 0 2 2 2 0 2 0 5 5 5 5 5 4 4 0 5 0 0 0 0 0 0 0 0 0 0 0 0 0 0 0
22 Demographics 3 4 6 4 5 5 4 5 2 4 5 0 5 0 3 5 3 4 1 2 4 0 3 3 3 0 3 0 6 6 6 6 6 5 5 0 6 0 0 0 0 0 0 0 0 0 0 0 0 0 0 0
23 Physical Characteristics of Land 3 4 6 4 5 5 4 5 2 4 5 0 5 0 3 5 3 4 5 2 1 0 3 3 3 0 3 0 6 6 6 6 6 5 5 0 6 0 0 0 0 0 0 0 0 0 0 0 0 0 0 0
24 Land Accessibility 3 4 6 4 5 5 4 5 2 4 5 0 5 0 3 5 3 4 5 2 1 0 3 3 3 0 3 0 6 6 6 6 6 5 5 0 6 0 0 0 0 0 0 0 0 0 0 0 0 0 0 0
25 Firm's Costs & Capacity 2 3 5 3 3 4 3 4 1 1 2 6 4 0 2 2 2 3 2 3 3 0 2 2 2 0 2 0 3 3 3 3 3 4 4 0 5 0 0 0 0 0 0 0 0 0 0 0 0 0 0 0
26 Foreign Investment 4 5 0 5 5 6 5 6 3 3 4 0 6 0 4 4 4 5 4 5 5 0 4 4 2 0 4 0 1 5 5 5 5 6 6 0 0 0 0 0 0 0 0 0 0 0 0 0 0 0 0 0
27 Demand for Goods & Services 2 3 5 3 3 4 3 4 1 1 2 6 4 0 2 2 2 3 2 3 3 0 2 2 2 0 2 0 3 3 3 3 3 4 4 0 5 0 0 0 0 0 0 0 0 0 0 0 0 0 0 0
28 Labor 3 4 6 4 4 5 4 5 2 2 3 0 5 0 3 3 3 4 3 4 4 0 3 3 1 0 1 0 4 4 4 4 4 5 5 0 6 0 0 0 0 0 0 0 0 0 0 0 0 0 0 0
29 Capital 3 4 6 4 4 5 4 5 2 2 3 0 5 0 3 3 3 4 3 4 4 0 3 3 1 0 3 0 4 4 4 4 4 5 5 0 6 0 0 0 0 0 0 0 0 0 0 0 0 0 0 0
30 Transportation Linkages 3 0 6 3 5 2 4 5 0 0 6 0 5 0 0 0 0 6 0 0 0 0 0 0 0 0 0 0 0 0 0 0 0 1 1 0 6 0 0 0 0 0 0 0 0 0 0 0 0 0 0 0
31 Transportation Nodes 3 0 6 3 5 2 4 5 0 0 6 0 5 0 0 0 0 6 0 0 0 0 0 0 0 0 0 0 0 0 0 0 0 1 1 0 6 0 0 0 0 0 0 0 0 0 0 0 0 0 0 0
32 Transportation Vehicles 3 0 6 3 5 2 4 5 0 0 6 0 5 0 0 0 0 6 0 0 0 0 0 0 0 0 0 0 0 0 0 0 0 1 5 0 6 0 0 0 0 0 0 0 0 0 0 0 0 0 0 0
33 Transportation Frequency 3 0 6 3 5 2 4 5 0 0 6 0 5 0 0 0 0 6 0 0 0 0 0 0 0 0 0 0 0 0 0 0 0 1 5 0 6 0 0 0 0 0 0 0 0 0 0 0 0 0 0 0
34 Transportation Capacity 2 0 5 2 4 1 3 4 0 6 5 6 4 0 0 0 0 5 0 0 0 0 0 6 6 0 0 0 6 6 6 6 6 4 4 0 5 0 0 0 0 0 0 0 0 0 0 0 0 0 0 0
35 Transportation Coverage 2 0 5 2 4 1 3 4 0 6 5 6 4 0 0 0 0 5 0 0 0 0 0 6 6 0 0 0 6 6 6 6 6 4 4 0 5 0 0 0 0 0 0 0 0 0 0 0 0 0 0 0
36 Transportation Connectivity 2 0 5 2 4 1 3 4 0 6 5 6 4 0 0 0 0 5 0 0 0 0 0 6 6 0 0 0 6 6 6 6 6 4 4 0 5 0 0 0 0 0 0 0 0 0 0 0 0 0 0 0
37 Transport Funding and Investment 3 5 1 3 5 2 4 5 3 3 4 1 5 0 4 4 4 5 4 4 3 0 4 2 2 0 4 0 5 1 1 1 1 2 2 0 6 0 0 0 0 0 0 0 0 0 0 0 0 0 0 0
38 Transport Operations Subsidy 3 5 1 3 5 2 4 5 3 3 4 0 5 0 4 4 4 5 4 4 3 0 4 2 2 0 4 0 5 5 5 5 5 5 5 0 6 0 0 0 0 0 0 0 0 0 0 0 0 0 0 0
39 Fuel Tax 3 6 2 3 5 2 4 1 4 4 2 2 5 1 5 5 5 6 5 5 4 0 5 3 3 0 5 0 3 2 2 2 2 3 3 0 1 0 0 0 0 0 0 0 0 0 0 0 0 0 0 0
40 Energy Investment 3 2 6 4 2 3 4 5 2 4 5 0 5 0 2 1 1 3 5 5 4 0 3 3 3 0 3 0 6 6 6 6 6 5 5 0 6 0 0 0 0 0 0 0 0 0 0 0 0 0 0 0
41 Energy Policies 3 2 6 4 2 3 4 5 2 4 5 0 5 0 2 1 1 3 5 5 4 0 3 3 3 0 3 0 6 6 6 6 6 5 5 0 6 0 0 0 0 0 0 0 0 0 0 0 0 0 0 0
42 Environmental Policies 3 4 6 4 1 5 4 5 2 3 4 0 5 0 1 4 3 2 4 2 1 0 3 3 3 0 3 0 5 5 5 5 5 5 5 0 6 0 0 0 0 0 0 0 0 0 0 0 0 0 0 0
43 Land Use Policies 3 4 6 4 5 5 4 5 2 4 5 0 5 0 3 5 3 4 5 2 1 0 3 3 3 0 3 0 6 6 6 6 6 5 5 0 6 0 0 0 0 0 0 0 0 0 0 0 0 0 0 0
44 Federal and State Fiscal Policies 3 1 1 3 3 2 4 5 3 3 4 0 5 0 3 2 4 4 4 4 3 0 4 2 2 0 4 0 1 5 5 5 5 5 5 0 6 0 0 0 0 0 0 0 0 0 0 0 0 0 0 0
45 Taxes 3 4 2 4 4 3 4 5 2 2 3 2 5 0 3 3 3 4 3 4 4 0 3 3 1 1 2 1 2 2 2 2 2 3 3 0 1 0 0 0 0 0 0 0 0 0 0 0 0 0 0 0
46 Inter-Modal Transportation Integration Policies3 0 6 3 5 2 4 5 0 0 6 0 5 0 0 0 0 6 0 0 0 0 0 0 0 0 0 0 0 0 0 0 0 5 5 1 6 0 0 0 0 0 0 0 0 0 0 0 0 0 0 0
47 Weather 3 4 4 1 3 2 2 3 4 2 3 5 1 0 4 3 3 1 3 4 6 0 5 5 5 0 5 0 4 4 4 4 4 3 3 0 4 0 0 0 0 0 0 0 0 0 0 0 0 0 0 0
48 Global Fuel Prices 3 0 6 3 5 2 4 5 0 0 6 0 5 1 0 0 0 6 0 0 0 0 0 0 0 0 0 0 0 0 0 0 0 5 5 0 6 0 0 0 0 0 0 0 0 0 0 0 0 0 0 0
49 Energy Sources 4 2 0 4 2 3 5 6 4 4 5 0 6 0 2 1 5 3 5 5 4 0 5 3 3 0 5 0 6 6 6 6 6 6 6 0 0 0 0 0 0 0 0 0 0 0 0 0 0 0 0 0
50 Natural Characteristics of Land 4 5 0 5 6 6 5 6 3 5 6 0 6 0 4 6 4 5 6 3 2 0 1 4 4 0 4 0 0 0 0 0 0 6 6 0 0 0 0 0 0 0 0 0 0 0 0 0 0 0 0 0
51 Foreign Economies 5 6 0 6 6 0 6 0 4 4 5 0 0 0 5 5 5 6 5 6 6 0 5 5 3 1 5 0 2 6 6 6 6 0 0 0 0 0 0 0 0 0 0 0 0 0 0 0 0 0 0 0
52 Macroeconomic Factors 2 3 5 3 3 4 3 4 3 1 2 6 4 0 3 2 2 4 2 3 5 0 4 4 4 0 4 0 3 3 3 3 3 4 4 0 5 0 0 0 0 0 0 0 0 0 0 0 0 0 0 0
Policy Levers External Factors
Ex
tern
al
Fa
cto
rsP
oli
cy L
ev
ers
(Re
gu
lar
Co
mp
on
en
ts)
Co
mm
on
Dri
ve
rs
Common Drivers (Regular Components)

MIT HSR/Regions Group Pena, Archila and Carlson Chapter 4 – Next steps in the CLIOS representation: Component connectivity and path impact
4-16
Table 4.2: Class 2 connectivity matrix (class 1 and class 2 links)
# COMPONENT / ACTOR 1 2 3 4 5 6 7 8 9 10 11 12 13 14 15 16 17 18 19 20 21 22 23 24 25 26 27 28 29 30 31 32 33 34 35 36 37 38 39 40 41 42 43 44 45 46 47 48 49 50 51 52 53 54 55 56 57 58 59 60 61 62 63 64 65 66 67 68 69 70 71 72 73 74 75
1 Transportation Demand 4 6 3 1 2 3 1 2 5 4 3 4 2 0 4 5 5 3 4 5 5 0 6 4 4 5 4 4 4 4 4 4 4 2 2 5 3 6 6 6 6 4 4 0 0 4 0 0 0 0 0 0 0 0 5 3 4 5 5 5 5 5 5 3 3 3 3 3 3 3 3 5 3 3 3
2 Energy Output 2 2 2 2 2 1 3 4 2 2 2 2 4 5 2 1 3 3 3 3 2 0 3 1 1 4 3 3 2 2 2 2 2 3 3 3 2 4 4 2 2 4 4 0 0 2 0 0 0 0 0 0 0 0 3 3 3 1 5 3 3 3 3 1 1 1 5 3 5 3 1 2 2 2 2
3 Transportation Service 2 4 5 2 4 1 3 4 2 2 3 5 4 5 3 3 3 4 3 3 2 0 3 1 1 5 3 3 4 4 4 4 4 4 4 0 4 4 4 5 5 5 4 0 0 6 0 0 0 0 0 0 0 0 3 4 4 4 5 5 5 5 5 5 5 5 5 5 5 5 5 4 2 2 2
4 Modal Split 4 6 3 4 2 3 1 2 5 4 3 4 2 0 4 5 5 3 4 5 5 0 6 4 4 5 4 4 4 4 4 4 4 2 2 5 3 6 6 6 6 4 4 0 0 4 0 0 0 0 0 0 0 0 5 3 4 5 5 5 5 5 5 3 3 3 3 3 3 3 3 5 3 3 3
5 Air Emissions 2 4 4 2 3 5 3 4 3 2 3 4 4 5 3 3 3 1 2 3 3 0 4 4 3 5 2 2 4 4 4 4 4 4 4 5 4 4 4 4 4 2 2 0 0 4 0 0 0 0 0 0 0 0 3 1 4 3 3 3 3 3 3 3 3 3 3 3 3 3 3 3 1 1 1
6 Trip Attributes 1 5 4 1 3 4 2 3 3 3 4 5 3 6 4 4 4 4 2 3 5 0 4 4 3 6 2 2 5 5 5 5 5 3 3 6 4 5 5 6 6 5 5 0 0 5 0 0 0 0 0 0 0 0 4 4 5 5 6 6 6 6 6 4 4 4 4 4 4 4 4 5 1 1 1
7 Network Usage 3 5 2 3 1 2 4 1 4 3 2 3 1 6 3 4 4 2 3 4 4 0 5 3 3 4 3 3 3 3 3 3 3 1 1 4 2 5 5 5 5 3 3 0 0 3 0 0 0 0 0 0 0 0 4 2 3 4 4 4 4 4 4 2 2 2 2 2 2 2 2 4 2 2 2
8 Transport Revenues 3 5 1 3 5 2 4 5 3 3 1 2 5 6 2 4 4 3 4 4 3 0 4 2 2 3 4 4 2 2 2 2 2 3 3 3 1 5 5 6 6 4 4 0 0 2 0 0 0 0 0 0 0 0 4 3 2 5 5 3 3 3 3 1 1 1 1 1 1 1 1 5 3 3 3
9 Land Usage 1 2 3 2 3 3 2 3 2 2 3 3 3 3 1 3 1 2 3 3 2 0 1 1 1 5 1 3 4 3 3 3 3 3 3 5 2 2 2 3 3 3 2 0 0 4 0 0 0 0 0 0 0 0 1 2 4 2 3 3 3 3 3 3 3 3 3 3 3 3 3 2 2 2 2
10 Economic Activity 1 2 3 2 2 3 2 3 2 4 1 3 3 3 2 1 1 3 1 2 3 0 3 3 3 3 3 4 2 2 2 2 2 3 3 5 2 2 2 3 3 4 2 0 0 4 0 0 0 0 0 0 0 0 1 3 2 2 3 3 3 3 3 3 3 3 3 3 3 3 3 2 3 3 3
11 Private Investment 4 5 6 4 5 3 5 6 3 3 2 6 6 6 4 4 4 5 4 5 5 0 4 4 2 2 4 5 1 1 1 1 1 2 2 0 5 5 5 6 6 6 5 0 0 0 0 0 0 0 0 0 0 0 4 5 1 5 6 6 6 6 6 6 6 6 6 6 6 6 6 5 4 4 3
12 Transportation Infrastructure 3 5 1 3 5 2 4 5 3 3 4 6 5 6 4 4 4 5 4 4 3 0 4 2 2 6 4 4 5 5 5 5 5 5 5 0 5 5 5 6 6 6 5 0 0 0 0 0 0 0 0 0 0 0 4 5 5 5 6 6 6 6 6 6 6 6 6 6 6 6 6 5 3 3 3
13 Congestion 2 5 5 2 4 1 3 4 3 3 4 6 4 6 4 4 4 5 2 3 5 0 4 4 3 6 2 2 5 5 5 5 5 4 4 0 5 5 5 6 6 6 5 0 0 6 0 0 0 0 0 0 0 0 4 5 5 5 6 6 6 6 6 5 5 5 5 5 5 5 5 5 1 1 1
14 Fuel Cost and Availability 2 5 2 2 4 1 3 4 3 3 2 2 4 6 2 4 4 3 2 3 4 0 4 3 3 4 2 2 3 2 2 2 2 3 3 3 2 5 5 6 6 4 4 0 0 2 0 0 0 0 0 0 0 0 4 3 3 5 5 3 3 3 3 1 1 1 1 1 1 1 5 5 1 1 1
15 Other Environmental Impacts 2 4 4 2 3 5 3 4 3 2 3 4 4 5 3 3 3 1 2 3 3 0 4 4 3 5 2 2 4 4 4 4 4 4 4 5 4 4 4 4 4 2 2 0 0 4 0 0 0 0 0 0 0 0 3 1 4 3 3 3 3 3 3 3 3 3 3 3 3 3 3 3 1 1 1
16 Energy Generation Infrastructure 3 1 3 3 1 2 4 5 3 3 3 3 5 6 1 2 3 2 3 4 3 0 4 2 2 5 3 3 3 3 3 3 3 4 4 4 3 5 5 2 2 3 3 0 0 3 0 0 0 0 0 0 0 0 4 2 4 1 4 4 4 4 4 2 2 2 4 4 4 4 2 1 2 2 2
17 Energy Transmission Infrastructure 2 1 3 3 3 2 3 4 1 3 3 3 4 4 2 2 2 3 4 4 3 0 2 2 2 5 2 4 3 3 3 3 3 4 4 4 3 3 3 2 2 4 3 0 0 3 0 0 0 0 0 0 0 0 2 3 4 1 4 4 4 4 4 2 2 2 4 4 4 4 2 1 3 3 3
18 Human Health & Environmental Sustainability 2 3 4 2 3 4 3 4 3 1 2 4 4 4 3 2 2 4 2 3 4 0 4 4 3 4 2 2 3 3 3 3 3 4 4 6 3 3 3 4 4 5 3 0 0 5 0 0 0 0 0 0 0 0 2 4 3 3 4 4 4 4 4 4 4 4 4 4 4 4 4 3 1 1 4
19 Land Demand 2 3 4 3 4 4 3 4 1 3 4 4 4 4 2 4 2 3 4 1 3 0 2 2 2 6 2 4 5 4 4 4 4 4 4 6 3 3 3 4 4 4 3 0 0 5 0 0 0 0 0 0 0 0 2 3 5 3 4 4 4 4 4 4 4 4 4 4 4 4 4 3 3 3 3
20 Land Costs 2 3 4 3 4 4 3 4 1 3 4 4 4 4 2 4 2 3 4 4 3 0 2 2 2 6 2 4 5 4 4 4 4 4 4 6 3 3 3 4 4 4 3 0 0 5 0 0 0 0 0 0 0 0 2 3 5 3 4 4 4 4 4 4 4 4 4 4 4 4 4 3 3 3 3
21 Land Supply 2 3 4 3 4 4 3 4 1 3 4 4 4 4 2 4 2 3 4 1 3 0 2 2 2 6 2 4 5 4 4 4 4 4 4 6 3 3 3 4 4 4 3 0 0 5 0 0 0 0 0 0 0 0 2 3 5 3 4 4 4 4 4 4 4 4 4 4 4 4 4 3 3 3 3
22 Demographics 3 4 5 4 5 5 4 5 2 4 5 5 5 5 3 5 3 4 1 2 4 0 3 3 3 0 3 5 6 5 5 5 5 5 5 0 4 4 4 5 5 5 4 0 0 6 0 0 0 0 0 0 0 0 3 4 6 4 5 5 5 5 5 5 5 5 5 5 5 5 5 4 4 4 4
23 Physical Characteristics of Land 3 4 5 4 5 5 4 5 2 4 5 5 5 5 3 5 3 4 5 2 1 0 3 3 3 0 3 5 6 5 5 5 5 5 5 0 4 4 4 5 5 5 4 0 0 6 0 0 0 0 0 0 0 0 3 4 6 4 5 5 5 5 5 5 5 5 5 5 5 5 5 4 4 4 4
24 Land Accessibility 2 4 5 2 4 5 3 4 2 3 4 5 4 5 3 4 3 4 2 2 1 0 3 3 3 6 2 2 5 5 5 5 5 4 4 0 4 4 4 5 5 5 4 0 0 6 0 0 0 0 0 0 0 0 3 4 5 4 5 5 5 5 5 5 5 5 5 5 5 5 5 4 1 1 1
25 Firm's Costs & Capacity 2 3 4 2 3 4 3 4 1 1 2 4 4 4 2 2 2 3 2 3 3 0 2 2 2 4 2 4 3 3 3 3 3 4 4 6 3 3 3 4 4 4 3 0 0 5 0 0 0 0 0 0 0 0 2 3 3 3 4 4 4 4 4 4 4 4 4 4 4 4 4 3 3 3 1
26 Foreign Investment 4 5 6 4 5 6 5 6 3 3 4 6 6 6 4 4 4 5 4 5 5 0 4 4 2 6 4 6 1 5 5 5 5 6 6 0 5 5 5 6 6 6 5 0 0 0 0 0 0 0 0 0 0 0 4 5 5 5 6 6 6 6 6 6 6 6 6 6 6 6 6 5 5 5 3
27 Demand for Goods & Services 2 3 4 3 3 4 3 4 1 1 2 4 4 4 2 2 2 3 2 3 3 0 2 2 2 4 2 4 3 3 3 3 3 4 4 6 3 3 3 4 4 4 3 0 0 5 0 0 0 0 0 0 0 0 2 3 3 3 4 4 4 4 4 4 4 4 4 4 4 4 4 3 3 3 3
28 Labor 3 4 5 3 4 5 4 5 2 2 3 5 5 5 3 3 3 4 3 4 4 0 3 3 1 5 1 5 4 4 4 4 4 5 5 0 4 4 4 5 5 5 4 0 0 6 0 0 0 0 0 0 0 0 3 4 4 4 5 5 5 5 5 5 5 5 5 5 5 5 5 4 4 4 2
29 Capital 3 4 5 3 4 5 4 5 2 2 3 5 5 5 3 3 3 4 3 4 4 0 3 3 1 5 3 5 4 4 4 4 4 5 5 0 4 4 4 5 5 5 4 0 0 6 0 0 0 0 0 0 0 0 3 4 4 4 5 5 5 5 5 5 5 5 5 5 5 5 5 4 4 4 2
30 Transportation Linkages 3 0 6 3 5 2 4 5 5 5 6 0 5 0 6 6 6 6 4 5 0 0 6 6 5 0 4 4 0 0 0 0 0 1 1 0 6 0 0 0 0 0 0 0 0 0 0 0 0 0 0 0 0 0 6 6 0 0 0 0 0 0 0 6 6 6 6 6 6 6 6 0 3 3 3
31 Transportation Nodes 3 0 6 3 5 2 4 5 5 5 6 0 5 0 6 6 6 6 4 5 0 0 6 6 5 0 4 4 0 0 0 0 0 1 1 0 6 0 0 0 0 0 0 0 0 0 0 0 0 0 0 0 0 0 6 6 0 0 0 0 0 0 0 6 6 6 6 6 6 6 6 0 3 3 3
32 Transportation Vehicles 3 0 6 3 5 2 4 5 5 5 6 0 5 0 6 6 6 6 4 5 0 0 6 6 5 0 4 4 0 0 0 0 0 1 5 0 6 0 0 0 0 0 0 0 0 0 0 0 0 0 0 0 0 0 6 6 0 0 0 0 0 0 0 6 6 6 6 6 6 6 6 0 3 3 3
33 Transportation Frequency 3 0 6 3 5 2 4 5 5 5 6 0 5 0 6 6 6 6 4 5 0 0 6 6 5 0 4 4 0 0 0 0 0 1 5 0 6 0 0 0 0 0 0 0 0 0 0 0 0 0 0 0 0 0 6 6 0 0 0 0 0 0 0 6 6 6 6 6 6 6 6 0 3 3 3
34 Transportation Capacity 2 6 5 2 4 1 3 4 4 4 5 6 4 0 5 5 5 5 3 4 6 0 5 5 4 0 3 3 6 6 6 6 6 4 4 0 5 6 6 0 0 6 6 0 0 6 0 0 0 0 0 0 0 0 5 5 6 6 0 0 0 0 0 5 5 5 5 5 5 5 5 6 2 2 2
35 Transportation Coverage 2 6 5 2 4 1 3 4 4 4 5 6 4 0 5 5 5 5 3 4 6 0 5 5 4 0 3 3 6 6 6 6 6 4 4 0 5 6 6 0 0 6 6 0 0 6 0 0 0 0 0 0 0 0 5 5 6 6 0 0 0 0 0 5 5 5 5 5 5 5 5 6 2 2 2
36 Transportation Connectivity 2 6 5 2 4 1 3 4 4 4 5 6 4 0 5 5 5 5 3 4 6 0 5 5 4 0 3 3 6 6 6 6 6 4 4 0 5 6 6 0 0 6 6 0 0 6 0 0 0 0 0 0 0 0 5 5 6 6 0 0 0 0 0 5 5 5 5 5 5 5 5 6 2 2 2
37 Transport Funding and Investment 3 5 1 3 5 2 4 5 3 3 4 1 5 6 4 4 4 5 4 4 3 0 4 2 2 6 4 4 5 1 1 1 1 2 2 0 5 5 5 6 6 6 5 0 0 0 0 0 0 0 0 0 0 0 4 5 5 5 6 6 6 6 6 6 6 6 6 6 6 6 6 5 3 3 3
38 Transport Operations Subsidy 3 5 1 3 5 2 4 5 3 3 4 6 5 6 4 4 4 5 4 4 3 0 4 2 2 6 4 4 5 5 5 5 5 5 5 0 5 5 5 6 6 6 5 0 0 0 0 0 0 0 0 0 0 0 4 5 5 5 6 6 6 6 6 6 6 6 6 6 6 6 6 5 3 3 3
39 Fuel Tax 2 5 2 2 4 2 3 1 3 3 2 2 4 1 2 4 4 3 2 3 4 0 4 3 3 4 2 2 3 2 2 2 2 3 3 3 1 5 5 6 6 4 4 0 0 2 0 0 0 0 0 0 0 0 4 3 3 5 5 3 3 3 3 1 1 1 1 1 1 1 2 5 1 1 1
40 Energy Investment 3 2 4 4 2 3 4 5 2 4 4 4 5 5 2 1 1 3 4 5 4 0 3 3 3 6 3 4 4 4 4 4 4 5 5 5 4 4 4 3 3 4 4 0 0 4 0 0 0 0 0 0 0 0 3 3 5 2 5 5 5 5 5 3 3 3 5 5 5 5 3 2 3 3 3
41 Energy Policies 3 2 4 4 2 3 4 5 2 4 4 4 5 5 2 1 1 3 4 5 4 0 3 3 3 6 3 4 4 4 4 4 4 5 5 5 4 4 4 3 3 4 4 0 0 4 0 0 0 0 0 0 0 0 3 3 5 2 5 5 5 5 5 3 3 3 5 5 5 5 3 2 3 3 3
42 Environmental Policies 3 4 2 3 1 3 4 5 2 3 2 2 5 5 1 3 3 2 3 2 1 0 3 3 3 4 3 3 2 2 2 2 2 3 3 3 2 4 4 2 2 3 3 0 0 2 0 0 0 0 0 0 0 0 3 2 3 1 1 1 1 1 1 1 1 1 1 1 1 1 1 1 2 2 2
43 Land Use Policies 3 4 2 4 5 3 4 5 2 4 2 2 5 5 2 5 3 3 4 2 1 0 3 3 3 4 3 4 3 2 2 2 2 3 3 3 2 4 4 5 5 4 4 0 0 2 0 0 0 0 0 0 0 0 3 3 3 4 1 1 1 1 1 1 1 1 5 3 5 3 5 1 3 3 3
44 Federal and State Fiscal Policies 3 1 1 3 3 2 4 3 3 3 2 2 5 3 2 2 3 3 4 4 3 0 4 2 2 2 4 4 1 2 2 2 2 3 3 3 2 2 2 2 2 2 2 0 0 2 0 0 0 0 0 0 0 0 1 1 1 1 1 1 1 1 1 1 1 1 3 3 3 3 2 3 3 3 3
45 Taxes 2 4 2 2 4 3 3 4 2 2 2 2 4 5 2 3 3 3 2 3 4 0 3 3 1 1 2 1 2 2 2 2 2 3 3 0 1 4 4 5 5 4 4 0 0 6 0 0 0 0 0 0 0 0 3 3 3 4 5 5 5 5 5 5 5 5 1 1 1 1 1 1 1 1 1
46 Inter-Modal Transportation Integration Policies2 5 2 2 4 2 3 4 3 3 2 2 4 6 2 4 4 3 2 3 4 0 4 3 3 4 2 2 3 2 2 2 2 3 3 1 2 5 5 6 6 4 4 0 0 2 0 0 0 0 0 0 0 0 4 3 3 5 5 1 1 1 1 1 1 1 5 1 5 1 5 5 3 1 3
47 Weather 3 4 4 1 3 2 2 3 4 2 3 5 1 5 4 3 3 1 3 4 5 0 5 5 4 5 3 3 4 4 4 4 4 3 3 6 4 4 4 5 5 5 4 0 0 5 0 0 0 0 0 0 0 0 3 4 4 4 5 5 5 5 5 4 4 4 4 4 4 4 4 4 2 2 2
48 Global Fuel Prices 3 6 3 3 5 2 4 5 4 4 3 3 5 1 3 5 5 4 3 4 5 0 5 4 4 5 3 3 4 3 3 3 3 4 4 4 3 6 6 0 0 5 5 0 0 3 0 0 0 0 0 0 0 0 5 4 4 6 6 4 4 4 4 2 2 2 2 2 2 2 6 6 2 2 2
49 Energy Sources 4 2 4 4 2 3 5 6 4 4 4 4 6 0 2 1 4 3 4 5 4 0 5 3 3 6 4 4 4 4 4 4 4 5 5 5 4 6 6 3 3 4 4 0 0 4 0 0 0 0 0 0 0 0 5 3 5 2 5 5 5 5 5 3 3 3 5 5 5 5 3 2 3 3 3
50 Natural Characteristics of Land 4 5 6 5 6 6 5 6 3 5 6 6 6 6 4 6 4 5 6 3 2 0 1 4 4 0 4 6 0 6 6 6 6 6 6 0 5 5 5 6 6 6 5 0 0 0 0 0 0 0 0 0 0 0 4 5 0 5 6 6 6 6 6 6 6 6 6 6 6 6 6 5 5 5 5
51 Foreign Economies 5 6 0 5 6 0 6 0 4 4 5 0 0 0 5 5 5 6 5 6 6 0 5 5 3 1 5 0 2 6 6 6 6 0 0 0 6 6 6 0 0 0 6 0 0 0 0 0 0 0 0 0 0 0 5 6 6 6 0 0 0 0 0 0 0 0 0 0 0 0 0 6 6 6 4
52 Macroeconomic Factors 2 3 4 3 3 4 3 4 3 1 2 4 4 4 3 2 2 4 2 3 4 0 4 4 4 4 4 5 3 3 3 3 3 4 4 6 3 3 3 4 4 5 3 0 0 5 0 0 0 0 0 0 0 0 2 4 3 3 4 4 4 4 4 4 4 4 4 4 4 4 4 3 4 4 4
53 Congress 3 2 2 3 4 3 4 2 3 3 3 2 5 2 3 3 4 4 3 4 4 0 4 3 2 1 3 2 2 2 2 2 2 3 3 4 1 1 1 3 3 3 3 1 1 3 0 0 0 0 0 0 0 0 2 2 2 2 2 2 2 2 2 2 2 2 2 2 2 2 2 2 2 2 2
54 State Governments 3 2 2 3 4 3 4 2 3 3 3 2 5 2 3 3 4 4 3 3 2 0 4 3 2 1 3 2 2 2 2 2 2 3 3 4 1 1 1 3 3 3 1 1 1 3 0 0 0 0 0 0 0 0 2 2 2 2 2 2 2 2 2 2 2 2 2 2 2 2 2 2 2 2 2
55 Local Governments 3 5 2 3 5 3 4 2 3 4 3 2 5 2 3 5 4 4 3 3 2 0 4 3 3 5 3 3 4 2 2 2 2 3 3 4 1 1 1 6 6 5 1 0 0 3 0 0 0 0 0 0 0 0 4 4 4 5 2 2 2 2 2 2 2 2 2 2 2 2 3 2 2 2 2
56 USEPA 4 5 3 4 2 4 5 6 3 4 3 3 6 6 2 4 4 3 4 3 2 0 4 4 4 5 4 4 3 3 3 3 3 4 4 4 3 5 5 3 3 1 1 0 0 3 0 0 0 0 0 0 0 0 4 3 4 2 2 2 2 2 2 2 2 2 2 2 2 2 2 2 3 3 3
57 US Department of Commerce 5 6 0 5 6 4 6 0 4 4 1 0 0 0 5 5 5 6 5 6 6 0 5 5 3 1 5 6 2 2 2 2 2 3 3 0 6 6 6 0 0 0 6 0 0 0 0 0 0 0 0 0 0 0 5 6 2 6 0 0 0 0 0 0 0 0 0 0 0 0 0 6 5 5 4
58 US Department of Energy 4 3 5 5 3 4 5 6 3 5 5 5 6 6 3 2 2 4 5 6 5 0 4 4 4 0 4 5 5 5 5 5 5 6 6 6 5 5 5 1 1 5 5 0 0 5 0 0 0 0 0 0 0 0 4 4 6 3 6 6 6 6 6 4 4 4 6 6 6 6 4 3 4 4 4
59 USDOT 3 6 2 3 5 3 4 5 4 4 3 2 5 0 3 5 5 4 3 4 4 0 5 3 3 5 3 3 4 2 2 2 2 3 3 2 1 6 6 0 0 5 5 0 0 1 0 0 0 0 0 0 0 0 5 4 4 6 6 2 2 2 2 2 2 2 6 2 6 2 6 6 4 2 4
60 FRA 3 6 2 3 5 3 4 5 4 4 3 2 5 0 3 5 5 4 3 4 4 0 5 3 3 5 3 3 4 2 2 2 2 3 3 2 1 6 6 0 0 5 5 0 0 1 0 0 0 0 0 0 0 0 5 4 4 6 6 2 2 2 2 2 2 2 6 2 6 2 6 6 4 2 4
61 FTA 3 6 2 3 5 3 4 5 4 4 3 2 5 0 3 5 5 4 3 4 4 0 5 3 3 5 3 3 4 2 2 2 2 3 3 2 1 6 6 0 0 5 5 0 0 1 0 0 0 0 0 0 0 0 5 4 4 6 6 2 2 2 2 2 2 2 6 2 6 2 6 6 4 2 4
62 FHWA 3 6 2 3 5 3 4 5 4 4 3 2 5 0 3 5 5 4 3 4 4 0 5 3 3 5 3 3 4 2 2 2 2 3 3 2 1 6 6 0 0 5 5 0 0 1 0 0 0 0 0 0 0 0 5 4 4 6 6 2 2 2 2 2 2 2 6 2 6 2 6 6 4 2 4
63 FAA 3 6 2 3 5 3 4 5 4 4 3 2 5 0 3 5 5 4 3 4 4 0 5 3 3 5 3 3 4 2 2 2 2 3 3 2 1 6 6 0 0 5 5 0 0 1 0 0 0 0 0 0 0 0 5 4 4 6 6 2 2 2 2 2 2 2 6 2 6 2 6 6 4 2 4
64 Amtrak 3 5 1 3 4 2 4 5 3 3 1 1 5 6 1 4 4 2 3 4 3 0 4 2 2 3 3 3 2 1 1 1 1 2 2 2 1 5 5 5 5 3 3 0 0 1 0 0 0 0 0 0 0 0 4 2 2 4 4 2 2 2 2 2 2 2 4 2 4 2 4 4 2 2 2
65 Commuter Rail Agencies 3 5 1 3 4 2 4 5 3 3 1 1 5 6 1 4 4 2 3 4 3 0 4 2 2 3 3 3 2 1 1 1 1 2 2 2 1 5 5 5 5 3 3 0 0 1 0 0 0 0 0 0 0 0 4 2 2 4 4 2 2 2 2 2 2 2 4 2 4 2 4 4 2 2 2
66 Urban Public Transportation Organizations 3 5 1 3 4 2 4 5 3 3 1 1 5 6 1 4 4 2 3 4 3 0 4 2 2 3 3 3 2 1 1 1 1 2 2 2 1 5 5 5 5 3 3 0 0 1 0 0 0 0 0 0 0 0 4 2 2 4 4 2 2 2 2 2 2 2 4 2 4 2 4 4 2 2 2
67 Freight Railroad Companies 3 5 1 3 4 2 4 5 3 3 1 1 5 6 1 4 4 2 3 4 3 0 4 2 2 3 3 3 2 1 1 1 1 2 2 6 5 5 5 5 5 3 3 0 0 5 0 0 0 0 0 0 0 0 4 2 2 4 4 4 4 4 4 4 4 4 4 4 4 4 4 4 2 2 2
68 Intercity Bus Operators 3 5 1 3 4 2 4 5 3 3 1 5 5 6 1 4 4 2 3 4 3 0 4 2 2 3 3 3 2 2 1 1 1 2 2 6 5 5 5 5 5 3 3 0 0 5 0 0 0 0 0 0 0 0 4 2 2 4 4 4 4 4 4 4 4 4 4 4 4 4 4 4 2 2 2
69 Trucking Industry 3 5 1 3 4 2 4 5 3 3 1 5 5 6 1 4 4 2 3 4 3 0 4 2 2 3 3 3 2 2 1 1 1 2 2 6 5 5 5 5 5 3 3 0 0 5 0 0 0 0 0 0 0 0 4 2 2 4 4 4 4 4 4 4 4 4 4 4 4 4 4 4 2 2 2
70 Airline Industry 3 5 1 3 4 2 4 5 3 3 1 1 5 6 1 4 4 2 3 4 3 0 4 2 2 3 3 3 2 2 1 1 1 2 2 6 5 5 5 5 5 3 3 0 0 5 0 0 0 0 0 0 0 0 4 2 2 4 4 4 4 4 4 4 4 4 4 4 4 4 4 4 2 2 2
71 Private Consortiums 3 5 1 3 5 2 4 5 3 3 1 6 5 6 4 4 4 5 4 4 3 0 4 2 2 3 4 4 1 1 1 1 1 2 2 0 5 5 5 6 6 6 5 0 0 0 0 0 0 0 0 0 0 0 4 5 2 5 6 6 6 6 6 6 6 6 6 6 6 6 6 5 3 3 3
72 Private Land Owners 0 0 0 0 0 0 0 0 0 0 0 0 0 0 0 0 0 0 0 0 0 0 0 0 0 0 0 0 0 0 0 0 0 0 0 0 0 0 0 0 0 0 0 0 0 0 0 0 0 0 0 0 0 0 0 0 0 0 0 0 0 0 0 0 0 0 0 0 0 0 0 0 0 0 0
73 Commuters 1 4 4 1 3 4 2 3 2 2 3 5 3 5 3 3 3 4 1 2 4 0 3 3 2 5 1 1 4 4 4 4 4 3 3 6 4 4 4 5 5 5 4 0 0 5 0 0 0 0 0 0 0 0 3 4 4 4 5 5 5 5 5 4 4 4 4 4 4 4 4 4 4 4 3
74 Intercity Travelers 1 4 4 1 3 4 2 3 2 2 3 5 3 5 3 3 3 4 1 2 4 0 3 3 2 5 1 1 4 4 4 4 4 3 3 6 4 4 4 5 5 5 4 0 0 5 0 0 0 0 0 0 0 0 3 4 4 4 5 5 5 5 5 4 4 4 4 4 4 4 4 4 4 4 3
75 Freight Users 1 4 4 1 3 4 2 3 2 4 4 5 3 5 3 5 3 4 1 2 4 0 3 3 3 6 3 5 5 5 5 5 5 3 3 6 4 4 4 5 5 5 4 0 0 5 0 0 0 0 0 0 0 0 3 4 5 4 5 5 5 5 5 4 4 4 4 4 4 4 4 4 4 4 4
(Re
gu
lar
Co
mp
on
en
ts)
Po
licy
Le
ve
rsE
xte
rna
l F
act
ors
Act
ors
Common Drivers (Regular Components) Policy Levers External Factors Actors
Co
mm
on
Dri
ve
rs

MIT HSR/Regions Group Carlson, Archila and Pena Chapter 5 – Discussion of high-‐impact paths and their implications on the bundles of strategic alternatives
5-‐1
Chapter 5 Discussion of high-‐impact paths and their implications on the bundles of strategic alternatives S. Joel Carlson | Andrés F. Archila | Maite Peña-‐Alcaraz _________________________________________________________________________________________________________
CONTENTS
Introduction
Selected bundles of strategic alternatives
Methodology and motivations for identifying Subnetworks
The “Basic Cycle -‐ Central Spine”
Transportation Revenues and the Fuel Tax Cycle
Relationship between public and private investment and Capacity
Inter-‐Modal Transportation Policies and Transportation Connectivity
Congestion
Economic Activity
“Low-‐Impact” paths
Summary of insights, further thoughts and conclusion
References
INTRODUCTION
In Chapter 4, we described the process for assigning values for the strength and speed of the individual links in the CLIOS Representation, and how to calculate the strength, speed and impact of paths through the network. The purpose of Chapter 5 is to identify some of the “high-‐impact” paths in the CLIOS Representation and to use them to discuss not only how they can be used to distinguish between the bundles of strategic alternatives, but how they can help identify and discuss broader, multimodal transportation issues. In the text, we have highlighted some of the insights that we have discovered as a result of this process in italics, and have also summarized them at the end of this document.
SELECTED BUNDLES OF STRATEGIC ALTERNATIVES
We first would like to summarize the contents of the two bundles of strategic alternatives that we (MIT and JITI) jointly selected for study. The bundles of strategic alternatives that
MIT HSR/Regions Group Carlson, Archila and Pena Chapter 5 – Discussion of high-‐impact paths and their implications on the bundles of strategic alternatives
5-‐2
we selected are also described in more detail in Chapter 3, and the naming convention (“bundle <number>”) relate to the numbering system found in that chapter.
Bundle 3, which represents the “status quo,” is similar to the plan outlined in the NEC Infrastructure Master Plan (2010). This plan involves restoring the existing alignment of the NEC to a state-‐of-‐good-‐repair and incrementally upgrading both the capacity and average track speed. No new international-‐quality high-‐speed alignment would be constructed. As a result, there would only be modest increases in train frequency and modest decreases in trip time. In this bundle, Amtrak would remain the primary owner of the NEC infrastructure. As a result, the relationship between infrastructure operations and train operations would remain vertically integrated1, and Amtrak would continue to be the sole operator of intercity passenger rail service on the NEC. The NEC Infrastructure Master Plan estimates the cost of such a bundle to be about $52 billion2. However, this cost does not include the cost of building new tunnels into Manhattan, as the NEC Infrastructure Master Plan was released before the cancellation of New Jersey’s Access to the Region’s Core (ARC) project.3
Bundle 2 is a radical departure from the current status quo on the NEC and is similar to the University of Pennsylvania School of Design (PennDesign) proposal (2011). It includes constructing a new international-‐quality high-‐speed alignment capable of allowing trains to reach speeds of up to 220 miles per hour. Although this new alignment will share the right-‐of-‐way and some key stations with the existing NEC rail alignment, in some locations, particularly north of New York, a new right-‐of-‐way will be required.4 For example, north of New York, Amtrak Vision for (international-‐quality) High-‐Speed Rail document (2010) proposes a route that travels inland via Hartford, whereas PennDesign proposes a similar route that also travels via Hartford but tunnels under Long Island Sound into New York. In bundle 2, the institutional structure will also be significantly different from bundle 3. Amtrak will be replaced by a public entity to control NEC infrastructure, and multiple intercity passenger train operators will be allowed to offer service because there will be vertical separation between the infrastructure and train operators. The PennDesign (2011) 1 From Chapter 3 the following definitions of vertical integration/separation were used: “Vertical integration refers to having ownership and management of both track infrastructure and train operations handled one organization, whereas vertical separation refers to having the ownership and maintenance of track infrastructure handled by one organization, and train operations handled by one or several other organizations.” 2 As a convention, nominal (year-‐of-‐expenditure) dollars will be used in this report, unless otherwise noted. 3 McGeehan, P. 2010. Christie Halts Train Tunnel, Citing Cost. http://www.nytimes.com/2010/10/08/nyregion/08tunnel.html. Access February 17, 2012. 4It will, of course, share an alignment with existing highway and railroad rights-‐of-‐way, where feasible.

MIT HSR/Regions Group Carlson, Archila and Pena Chapter 5 – Discussion of high-‐impact paths and their implications on the bundles of strategic alternatives
5-‐3
indicates that the direct construction cost of this proposal is $102 billion and Amtrak (2011) suggests that a similar, international-‐quality high-‐speed rail alignment would cost $117 billion (2010$). Amtrak (2010) does note that $6.33 billion would be saved from the NEC Infrastructure Master Plan if an international-‐quality system were chosen; however, as far as the authors can tell, both the PennDesign and Amtrak proposals exclude the costs of the NEC Infrastructure Master Plan, which would likely still be required in order to continue to offer commuter rail service and to provide intercity passenger service to stops that are not connected by the new higher-‐speed alignment.
METHODOLOGY AND MOTIVATIONS FOR IDENTIFYING SUBNETWORKS
The MATLAB procedure provided several thousand high-‐impact paths through the CLIOS Representation, many of which were only subtly different. As a result, once we had ranked paths in descending order based on impact, several members of the research team individually identified five to ten of the paths with the highest impact. We then compared notes and collectively listed what we thought were the highest-‐impact paths from the CLIOS Representation. Although we generally used the numerical value of impact of each of the paths to decide which ones we wanted to discuss, we also used our own judgment to decide which paths might yield the most insights. The identification of paths by consensus helped to ensure that we had selected a fairly representative cross-‐section of the thousands of high-‐impact paths.
Initially, when we started this process of identifying the high-‐impact paths from the CLIOS Representation, we planned on identifying simple chains of components (i.e. component A would lead to component B, which would then lead to component C, and so on). In other words, we expected to identify that each path would start at one given component, and end at another given component. However, we discovered that many of the high-‐impact paths and loops included many of the same components over and over again. Given that we felt that this repeated overlap of the same components was in itself an insight, we felt that illustrating several of the paths and loops on the same diagram illustrated this overlap better. Additionally, we also found it difficult to arbitrarily decide where a high-‐impact path started and ended, and, as a result, we decided to combine different paths into the same diagram. We have termed this collection of paths as “subnetwork” (i.e. a subset of the larger CLIOS Representation).
In general, we tried to create each of the subnetworks based on some central component or theme. In total, we have identified six important subnetworks to discuss based around the following central themes:
§ The “Basic Cycle -‐ Central Spine”
§ Transportation Revenues and Fuel Tax Cycle

MIT HSR/Regions Group Carlson, Archila and Pena Chapter 5 – Discussion of high-‐impact paths and their implications on the bundles of strategic alternatives
5-‐4
§ The relationship between public and private investment and Capacity
§ Inter-‐Modal Transportation Policies and Transportation Connectivity
§ Congestion
§ Economic activity impacts
For each of the subnetworks identified, we first discussed the insights that they provide from a general, multimodal perspective. We then considered how bundles 2 and 3, if they were put into action, would play out based on the relationships identified in each of the subnetworks. Based on this discussion, we attempted to pull out insights, which are highlighted in italics.
That said, the subnetworks on their own do not produce the insights that we have listed; rather, they allow us to organize our thoughts about the CLIOS system in a concise manner. The high-‐impact subnetworks themselves initially show us what components are connected by fast and strong paths. We then incorporate our research and knowledge of CLIOS systems to see how different ideas and issues might be related. The subnetworks, along with our research, also serve as a useful starting point to think about what issues have not been have been thought about as much before. Finally, we use the subnetworks along with our knowledge of the bundles of strategic alternatives to think about how different components might be affected. The subnetworks therefore provide a useful tool with which to synthesize our thoughts into insights related to high-‐speed rail in the NEC.
Some of the insights that we gleaned from the subnetworks are more novel, while others are more commonly known. Both types of insights are useful: the more novel ones provide, perhaps, a fresh look at the NEC, while the more commonly-‐known ones provide us with a “check” to ensure that the CLIOS Representation can explain obvious relationships. The former provide a more subtle “proof-‐of-‐usefulness,” whereas the latter ones provide a “proof-‐of-‐concept.” Both are important: if the more obvious insights are wrong, then the more novel ones are likely wrong too. Additionally, even the more modest insights allow us to distinguish between the bundles. Finally, even the more obvious insights, such as the idea that intermodal connectivity is important as it potentially affects air emissions, are still useful as they highlight areas for further research. As a result, we have highlighted any comments that might be useful for either purpose.
Before continuing, we would like to refresh the reader about the notation used in the CLIOS Representation. Figure 5.1 below provides the names and corresponding shapes of the different types of components used in the CLIOS Representation.

MIT HSR/Regions Group Carlson, Archila and Pena Chapter 5 – Discussion of high-‐impact paths and their implications on the bundles of strategic alternatives
5-‐5
Figure 5.1: Components used in the CLIOS Representation (Source: Sussman et al. 2009)
THE “BASIC CYCLE -‐ CENTRAL SPINE”
Figure 5.2: The “Basic Cycle -‐ Central Spine” subnetwork
Once we added the speed and strength to each of the links in the CLIOS representation, we discovered that the paths and loops shown in this subnetwork (Figure 5.2) have some of the strongest and fastest acting links. Most of the components identified on these paths and loops are from the Transportation Subsystem; however, since many of the components are common drivers, they can affect (or be affected by) components from other subsystems.
Starting at the policy-‐lever “Transportation Funding and Investment,” every path through this subnetwork must go through Trip Attributes, Modal Split and Network Usage. Furthermore, many of the other high-‐impact paths identified from the larger CLIOS
MIT HSR/Regions Group Carlson, Archila and Pena Chapter 5 – Discussion of high-‐impact paths and their implications on the bundles of strategic alternatives
5-‐6
Representation go through these same components. The importance of these three components – Trip Attributes, Modal Split and Network Usage – which relate primarily to steps three (determining modal split) and four (assigning flows to the network) of a typical four-‐step transportation demand forecasting model, indicate that special attention needs to be given to determining how transportation users’ preferences influence their choice of mode. Given that international-‐quality high-‐speed has never been implemented in the US, users’ preferences are largely unknown. Furthermore, demand studies are going to have to rely on stated-‐preferences data, which means that there could be significant response bias because users have to predict their behavior. Even though there is significant uncertainty associated with predicting the demand for high-‐speed rail, in the reports that propose high-‐speed rail in the NEC (Amtrak [2010] and PennDesign [2011]), only point estimates are generally given. As a result, greater effort needs to be made by those groups working on developing high-‐speed rail to communicate the uncertainties associated with predicting user behavior, and how they intend and hedge against the uncertainties.
Implications on the bundles of strategic alternatives
If bundle 3 were implemented, there is less uncertainty associated with the expected Network Usage of the rail system, as the Trip Attributes will only be improved modestly and gradually (i.e. each improvement will only involve reductions in travel time on the order of a few minutes or the increase in train frequency by one or two trains per day). However, significantly more care should be taken when estimating the expected Modal Split for high-‐speed rail under bundle 2, as there would be a significant and distinct change in the Trip Attributes. Over-‐estimation could lead to potential losses for the high-‐speed rail operator, as the company may have invested too heavily in rolling stock for the ultimate level of demand. Under-‐estimation could also create issues, as the train operator might lose-‐out on revenues, which are much needed given the large investment in equipment required. Furthermore, it could discourage more users from using high-‐speed rail if a larger number of potential users are turned away. As a result, appropriate methods to deal with uncertain levels of demand, such as flexibility, should be incorporated into bundle 2. Flexibility will be discussed in more detail in Chapter 9. In general, flexibility is a life-‐cycle property that allows a system to evolve over time dynamically to respond to changing conditions.

MIT HSR/Regions Group Carlson, Archila and Pena Chapter 5 – Discussion of high-‐impact paths and their implications on the bundles of strategic alternatives
5-‐7
TRANSPORTATION REVENUES AND THE FUEL TAX CYCLE
Figure 5.3: Transportation Revenues and the Fuel Tax Cycle subnetwork
The loops and paths in this subnetwork (Figure 5.3) highlight the relationship between Transportation Funding and Investment and Transportation Revenues that can potentially reinforce to create a virtuous cycle for continuing to improve the transportation system. However, the components within these paths and loops indicate that there are several caveats associated with that statement.
In the US, an 18.4 cent/gallon Fuel Tax is levied on gasoline sales. There is also a similar diesel tax. The revenues from the Fuel Tax (i.e. paid by highway users) are put into an account known as the Highway Trust Fund that can then be used to pay for future upgrades to the highway system. In other words, the Fuel Tax was the fee collected from users to pay for highway (and to a much lesser extent, urban mass transit) infrastructure upgrades. It is currently the dominant funding mechanism used in the US. However, some US States are currently experimenting with other funding mechanisms. Dunn (2010) notes that both the Seattle-‐region and Oregon have experimented with distance-‐based charges. Rep. Earl Blumenauer (of Oregon) also discussed vehicle-‐miles traveled charges during a session at
MIT HSR/Regions Group Carlson, Archila and Pena Chapter 5 – Discussion of high-‐impact paths and their implications on the bundles of strategic alternatives
5-‐8
the Transportation Research Board’s 2012 Annual Meeting. As a result, although the fuel tax is the current funding mechanism used in the US, it may change in the future.
For most of its history, the fuel tax/Highway Trust Fund funding mechanism created a virtuous cycle of transportation system funding. New infrastructure was constructed, which would lead to higher Network Usage, which would then lead to greater Transportation Revenues (i.e. Fuel Tax) collected, which would then lead to more funding for future infrastructure upgrades. However, in recent years, this cycle has no longer been virtuous, as the Fuel Tax, which is an excise tax (i.e. is charged per gallon as opposed to as a percentage of the cost), has not been raised in over ten years, whilst both construction costs and vehicle fuel economy have increased significantly.
Although the Fuel Tax only applies primarily to travel by highway vehicles, considering changes to the Fuel Tax is an important policy debate that also has significant implications for high-‐speed rail. As shown in the Figure 5.3, Fuel Tax directly impacts Fuel Cost and Availability, which then impacts the Trip Attributes by raising the price for auto travel. Although the US population strongly prefers auto travel, if the cost of auto travel rises, then a portion of auto users might change to alternative modes. A change in Modal Split might take several years to occur after an increase in the Fuel Tax (which might take several years to implement due to the political difficulties associated with increasing taxes). However, given that highway transportation is responsible for 89 percent of all trips on the NEC, or around 142 million per year, and intercity passenger rail only handles 13 million passengers per year (Amtrak 2010), any modest diversion from auto transportation could have a significant impact on the number of passengers handled by any upgraded high-‐speed rail system. Furthermore, in addition to the potential of diverting more passengers to rail, an increased Fuel Tax could also give train operators (and thus, infrastructure operators) more flexibility in terms of setting their fares (and access charges) respectively. Given the significant number of auto users on the NEC, the potential effects of changes to the fuel tax (in magnitude and structure) on high-‐speed rail demand and pricing should be carefully considered in any subsequent analysis.
The Fuel Tax paths in the CLIOS Representation also highlight some questions that are directly applicable to high-‐speed rail: how will high-‐speed rail in the NEC capture revenue from its users to fund infrastructure development? Will high-‐speed rail operations provide sufficient revenue to cover the cost of infrastructure, or can it just be profitable “above-‐the-‐rail” (i.e. should users be expected to pay the fully-‐allocated costs of the infrastructure, or just the marginal costs)? Clear answers to these policy questions are needed. Otherwise, if high-‐speed rail is implemented in the NEC without having these questions answered, it runs the risk of returning to the same state that it is in now: one in which annual funding is determined by the political process of Federal and State governments, which has allowed for the gradual deterioration of the corridor. Although the CLIOS Representation does include components that are intended to account for high-‐speed rail infrastructure pricing
MIT HSR/Regions Group Carlson, Archila and Pena Chapter 5 – Discussion of high-‐impact paths and their implications on the bundles of strategic alternatives
5-‐9
and funding policy (such as Transportation Service and Transportation Funding and Investment), the current challenges associated with the fuel tax funding mechanism (which are highlighted by their own paths in this subnetwork) emphasize that high-‐speed rail pricing and funding policy needs further consideration.
Implications on the bundles of strategic alternatives
In both bundle 2 and bundle 3, the key revenue-‐capture mechanism for train operators will be ticket purchases. The train operators can then use the revenue from ticket sales to pay infrastructure access charges. In bundle 3, Amtrak acts as a vertically integrated company and therefore does both of these tasks. As a result, there is little transparency in terms of how much of the infrastructure cost Amtrak is actually covering, nor is there much data to verify how Amtrak should set infrastructure access charges for other operators (such as freight or commuter rail) that use the NEC. By contrast, in bundle 2, as the infrastructure operator and the train operators are separate entities, there will likely be more transparency associated with how the infrastructure operator sets its access charges, and by extension, how much of the ongoing cost of maintaining the infrastructure the train operators actually cover.
Thompson (2005) points out that establishing appropriate infrastructure charges can be a difficult activity, especially in the absence of appropriate accounting data. Given that NEC rail infrastructure is shared by intercity passenger, commuter and freight train companies, the added cost of having a vertically separated company (as in bundle 2) could be at least partly justified based on the transparency it provides in terms of the access fees the infrastructure owner would charge. Alternatively, Amtrak could potentially separate its accounting of NEC infrastructure and operations in order to provide similar information; however, there is still the potential for argument over the types of costs Amtrak includes in its accounting of NEC costs.
If bundle 2 were implemented, the competition between the existing rail network and the new dedicated alignment complicates the pricing of the new high-‐speed service. Frugal users who do not have time constraints might choose to use the existing lower-‐speed service rather than pay a price premium for the new service. Therefore, the potential for the existing, likely less expensive, rail service to capture demand needs to be considered when pricing the new international-‐quality high-‐speed rail service.

MIT HSR/Regions Group Carlson, Archila and Pena Chapter 5 – Discussion of high-‐impact paths and their implications on the bundles of strategic alternatives
5-‐10
RELATIONSHIP BETWEEN PUBLIC AND PRIVATE INVESTMENT AND CAPACITY
Figure 5.4: Relationship between public and private investment and Capacity
This subnetwork (Figure 5.4) highlights how Transportation Capacity is a key factor that affects trip attributes. It primarily acts as a constraint: for example, service frequency cannot be increased past beyond the available infrastructure capacity (i.e. “Transportation Linkages”5 and “Transportation Nodes”, and to a lesser extent, the available rolling stock (i.e. “Transportation Vehicles”6). Additionally, level-‐of-‐service (expressed as travel time, reliability, or some combination thereof) also decreases as Network Usage gradually approaches Capacity. This occurrence can be represented using the typical “hockey-‐stick” shaped curve, as shown below in Figure 5.5 (Sussman 2000).
5 “Transportation Linkages” refers to roads, highways, railway tracks, airways, etc. and do not have any relationship with the “links” used in the CLIOS Representation. In this chapter, the term “linkages” (as opposed to links) is used consistently to describe transportation infrastructure. 6 “Transportation vehicles” includes autos as well as rolling stock and airplanes, etc.

MIT HSR/Regions Group Carlson, Archila and Pena Chapter 5 – Discussion of high-‐impact paths and their implications on the bundles of strategic alternatives
5-‐11
Figure 5.5: Level of service versus volume (Source: Sussman 2000)
Currently, on the NEC, there are several capacity constraints that prevent Amtrak from increasing intercity passenger rail service, most notably the access tunnels across the Hudson River into Manhattan in New York. There are also other capacity constraints at several location: majors stations (e.g. Boston South Station, New York Penn Station and Washington Union Station), moveable bridges in Connecticut, the Baltimore and Potomac Tunnels in Baltimore and the Metro-‐North owned segment in Connecticut and New York. Figure 5.6 and 5.7 highlight some of these capacity constraints.
Given these capacity constraints, Andrew Wood, Assistant Vice-‐President, Amtrak, recently noted at the Transportation Research Board’s 2012 Annual Meeting in Washington, DC that adding capacity is more of a driving factor behind developing high-‐speed rail in the NEC than “high-‐speed”. As he notes in the following video (http://www.youtube.com/watch?v=Fv8eY-‐MTG_M), “high-‐capacity” rail might be a better term to use to describe the objective behind improvements to intercity passenger rail infrastructure in the NEC.7
This subnetwork also reveals an implicit assumption in the CLIOS representation: public funding (i.e. Transportation Funding and Investment) appears to have a greater impact on Capacity, as it can be used to add more Transportation Linkages, Nodes and Vehicles, whereas private funding (i.e. Private Investment) appears to primarily act through vehicles. In other words, our implicit modeling assumption is that the public sector has a much stronger role to play in funding infrastructure development than the private sector, and 7 The desire to implement international-‐quality high-‐speed rail in the NEC to increase rail capacity is consistent with the Japanese decision to build the original Tokaido Shinkansen line due to the capacity limitations of the existing narrow gauge lines. Smith (2003) notes that in 1956, tickets for a trip between Tokyo and Osaka, which would be put on sale one month in advance, would often sell out in less than ten minutes.

MIT HSR/Regions Group Carlson, Archila and Pena Chapter 5 – Discussion of high-‐impact paths and their implications on the bundles of strategic alternatives
5-‐12
that the private sector has a larger role to play in train operations. This assumption does not mean that the private sector will not play a role in the development of infrastructure through public-‐private partnerships, for example, (i.e. the full CLIOS representation does show a connection between private investment and Transportation Nodes and Linkages), but, rather, the public-‐sector will play a dominant role, at least initially, in developing NEC transportation infrastructure. Given that, in general, adding Transportation Linkages and Nodes can increase capacity more than adding transportation vehicles, public-‐sector involvement appears to have a more significant role in increasing capacity than the private sector.
This assumption appears to be a good “best judgment” at this point in time for several reasons. Firstly, much of the existing infrastructure in the NEC is not in a state-‐of-‐good-‐repair and, therefore, significant investment is required to address this issue before both capacity upgrades and true high-‐speed development can begin. The private sector would likely not wish to participate in such projects in which there is no revenue source other than ensuring the long-‐term operation of the corridor. Secondly, commuter rail operators dominate train traffic on the NEC infrastructure in terms of number of daily trains and riders. 8 Given that these operators are generally more interested in social-‐benefit maximization rather than revenue maximization, bringing in private infrastructure investors may prove challenging if commuter rail operators are unwilling (or unable) to pay sufficient access fees to private investors. As a result, strong public support and funding is likely required to develop infrastructure, at least in the short-‐term. Nonetheless, further research is required to more fully understand the role that the private sector can (and would like to play) in developing transportation infrastructure in the NEC.9
Another important insight from this subnetwork is that, although Transportation Funding and Investment can be used to help encourage transportation users to choose modes that output fewer emissions (such as high-‐speed rail – the Union of Concerned Scientists [2008] currently notes that the motorcoach and train are the two most environmentally friendly ways for up to two travelers to take a trip of around 500 miles), adding capacity ultimately leads to more air emissions as transportation users fill up all the available capacity. For example, Regina Clewlow10 has found that the introduction of high-‐speed rail Europe,
8 According to the NEC Infrastructure Master Plan (2010) commuter trains account for 93% of all daily trains, 95% of all riders and 53% of all train-‐miles traveled. 9 At the Transportation Research Board’s AR010 Intercity Passenger Rail Committee Meeting on January 23, 2012, the topic of private sector involvement in high-‐speed rail development was brought up as an important topic for further research. 10 Presentation by Regina Clewlow to research group. Energy Implications of High-‐Speed Passenger Transportation: Examining Aviation, High-‐Speed Rail, and their Climate Impacts, November 22, 2011.

MIT HSR/Regions Group Carlson, Archila and Pena Chapter 5 – Discussion of high-‐impact paths and their implications on the bundles of strategic alternatives
5-‐13
which has reduced the amount of short-‐haul air travel, has helped facilitate the growth of medium-‐haul air travel by freeing up capacity. As a result, even though there were air emission savings from the reduction in short-‐haul air travel, the additional air emissions from the medium-‐haul air travel result in a net increase in air emissions. Improving high-‐speed rail service, whilst it will help encourage lower air emissions per transportation user, ultimately allows for more transportation use, which could increase air emissions in absolute terms. A lot of focus gets put on how high-‐speed rail generally emits fewer air emissions per passenger, but there is less discussion on this overall increase in air emissions resulting from the improvement to the transportation system.
Implications for the bundles of strategic alternatives
Regardless of whether decision-‐makers choose to proceed with bundle 2 or bundle 3, significant investment will be required (primarily by the Federal Government) to bring the existing NEC up to a state-‐of-‐good-‐repair and increase capacity in several areas. The NEC Infrastructure Master Plan (2010) indicates that $8.8 billion is required to bring the NEC up to a state-‐of-‐good-‐repair today (i.e. including only backlogged maintenance and excluding future annual maintenance). Although the state-‐of-‐good-‐repair upgrades would apply to the existing alignment, since bundle 2 would share some of this infrastructure (such as the access tunnels into Manhattan), both bundle 2 and 3 require this deteriorating infrastructure is addressed. Additionally, some capacity related projects would be related to both bundles. For example, in New York and New Jersey, Amtrak is leading the development “Gateway Project,” which involves constructing new tunnels and bridges between New York and New Jersey to significant increase capacity available for intercity passenger rail south of New York City to Washington, DC.11 As a result, bundle 2 and bundle 3 have significant overlap in terms of state-‐of-‐good-‐repair and capacity upgrades.
The status-‐quo bundle, bundle 3, provides limited increases to capacity on the NEC. Although bundle 3 will involve some capacity upgrades as a result of the major projects around New York and some of the other major stations, growth of intercity passenger rail will still be constrained by having to share its alignment with significant (and growing) commuter rail traffic. Currently, as can be seen in Figure 5.6 and 5.7 below, there are still several areas where current traffic volumes exceed 75 percent of practical capacity and Amtrak (2010) notes that by 2030, rail demand on the NEC would be greater than the capacity provided by bundle 3. According to Amtrak’s (2010) estimates, intercity passenger rail riders would stagnate between around 20 and 25 million passengers per year from 2030 to 2050. Therefore, whilst rail traffic can grow under bundle 3, capacity limitations prevent it from diverting a significant proportion of transportation users from other 11Rouse, K. 2011. Amtrak president details Gateway Project at Rutgers lecture. http://www.northjersey.com/news/020811_Amtrak_president_details_Gateway_Project_at_Rutgers_lecture.html. Accessed February 16, 2012.

MIT HSR/Regions Group Carlson, Archila and Pena Chapter 5 – Discussion of high-‐impact paths and their implications on the bundles of strategic alternatives
5-‐14
modes, even if Trip Attributes related to the other modes (such as longer, less reliable trip times due to congestion, increases to the Fuel Tax) otherwise encourage transportation users to switch to rail.
Figure 5.6: Current and 2030 rail traffic volumes on the NEC and areas of capacity limitations (Data source: NEC
Master Plan Working group 2010)
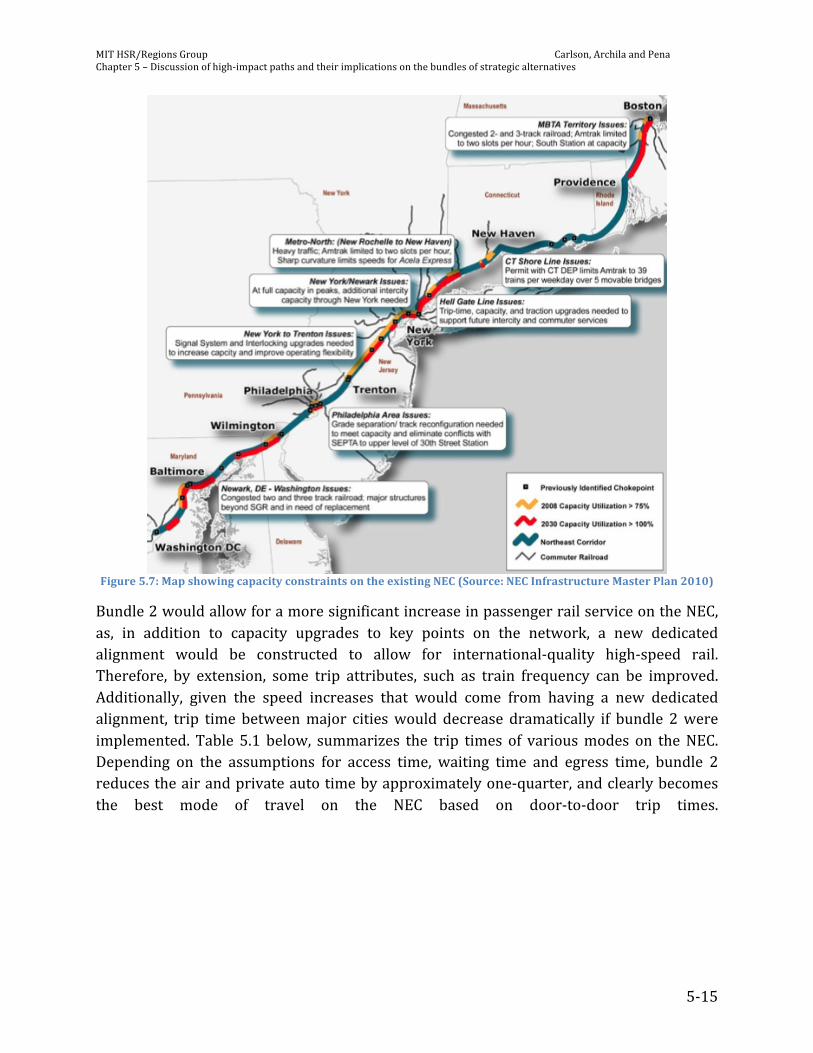
MIT HSR/Regions Group Carlson, Archila and Pena Chapter 5 – Discussion of high-‐impact paths and their implications on the bundles of strategic alternatives
5-‐15
Figure 5.7: Map showing capacity constraints on the existing NEC (Source: NEC Infrastructure Master Plan 2010)
Bundle 2 would allow for a more significant increase in passenger rail service on the NEC, as, in addition to capacity upgrades to key points on the network, a new dedicated alignment would be constructed to allow for international-‐quality high-‐speed rail. Therefore, by extension, some trip attributes, such as train frequency can be improved. Additionally, given the speed increases that would come from having a new dedicated alignment, trip time between major cities would decrease dramatically if bundle 2 were implemented. Table 5.1 below, summarizes the trip times of various modes on the NEC. Depending on the assumptions for access time, waiting time and egress time, bundle 2 reduces the air and private auto time by approximately one-‐quarter, and clearly becomes the best mode of travel on the NEC based on door-‐to-‐door trip times.

MIT HSR/Regions Group Carlson, Archila and Pena Chapter 5 – Discussion of high-‐impact paths and their implications on the bundles of strategic alternatives
5-‐16
Table 5.1: Summary of trip times by mode on the NEC
(h:mm) Bundle 2 (rail) Bundle 3 (rail) Air Private Auto BOS-‐NYC 2:53 4:38 3:51 4:00 NYC-‐BOS 3:06 3:51 3:45 4:23
Notes: 1. 60 minutes of check-‐in, security and waiting time was added to the scheduled duration an of air trip. 2. 30 minutes of waiting time was added to the scheduled duration a rail trip. 3. 45 minutes of access time, and 45 minutes of egress time was added to the scheduled duration of an
air trip. 4. 30 minutes of access time and 30 minutes of egress time was added to the scheduled duration a rail
trip. 5. The scheduled trip duration (station-‐to-‐station) for bundle 2 was taken from Amtrak (2010). 6. The scheduled trip duration (station-‐to-‐station) of bundle 3 was taken from the NEC Infrastructure
Master Plan (2010). 7. The scheduled duration of air flights (gate-‐to-‐gate) was determined to be the median scheduled flight
duration of a US Airways flights on February 22, 2012. All New York airports were considered, but only DCA in Washington, DC was considered.
8. The private auto travel time was taken as the lowest possible travel time on Google Maps from departures and destinations in the downtown of the respective cities.
9. Only the direction of travel noted in far left column was considered. Given that bundle 2 would dramatically alter the trip attributes for travel between major centers on the NEC (even from a multimodal context), there will likely be a significant diversion of users from air, and a lesser extent auto, onto intercity rail transportation. Amtrak (2010) currently estimates that under “Baseline Growth,” international-‐quality high-‐speed rail in the NEC could attract 34 million passengers by 2040, a 21 million increase over ridership today, and that there would be sufficient capacity by 2050 to accommodate 52 million riders. It also predicts that the Modal Share of highway trips (the actual units are not clearly stated in the report) would drop to around 50 percent depending on the segment (from its current share at 89 percent). Unlike bundle 3, bundle 2 has the ability to absorb a significant proportion of NEC travel demand.
In addition to being able to increase intercity passenger rail ridership significantly, adding a new dedicated high-‐speed rail tracks provides commuter and freight users greater opportunity to use the existing tracks to increase their services.
One issue associated with providing this new capacity with such good trip attributes is that it potentially induces a significant amount of new demand. For example, Amtrak (2010) estimates that induced “new travelers” will make up 30 percent of the overall increase in demand for international-‐quality high-‐speed rail. Whilst allowing more people to travel has positive economic benefits,12 it also increases the amount of Air Emissions. Even though
12 Melibaeva et al. (2010) note that induced new demand is “critical” for generating economic growth.

MIT HSR/Regions Group Carlson, Archila and Pena Chapter 5 – Discussion of high-‐impact paths and their implications on the bundles of strategic alternatives
5-‐17
high-‐speed rail is relatively energy efficient, the induced “new travelers” negate some or all of these benefits. This issue is not specifically related to high-‐speed rail; consideration needs to be given to the larger, multimodal issue of how much transportation capacity and mobility can sustainably be provided. Although, arguably, high-‐speed rail in the NEC can add much needed capacity to the NEC transportation system, it cannot be regarded as a “silver-‐bullet” solution. Other policy alternatives to help change behavior and limit transportation demand, such as congestion pricing or carbon taxes, and/or the development of new technology, such as the introduction of a significant supply of a low-‐carbon, renewable fuel source, need to be developed and employed.
INTER-‐MODAL TRANSPORTATION POLICIES AND TRANSPORTATION CONNECTIVITY
Figure 5.8: Inter-‐Modal Transportation Policies and Transportation Connectivity subnetwork
The high-‐impact paths in this subnetwork (Figure 5.8) indicate the important role of Inter-‐modal Transportation Integration Policies. The paths in this subnetwork show that Inter-‐modal Transportation Policies can have an impact on Human Health and Environmental Sustainability, Congestion and Transportation Revenues.

MIT HSR/Regions Group Carlson, Archila and Pena Chapter 5 – Discussion of high-‐impact paths and their implications on the bundles of strategic alternatives
5-‐18
Inter-‐modal Transportation Integration Policies first affects Transportation Connectivity (i.e. the ease with which users can change between different transportation modes). By improving Transportation Connectivity through appropriate Inter-‐modal Integration Policies, users can optimize the Trip Attributes for their entire trip by choosing the most appropriate modes for each leg. If transportation modes are not well connected, users will typically choose the one mode that is most convenient for most of their trip. For example, if international-‐quality high-‐speed rail were implemented on the NEC, taking the train from Boston to New York to catch a flight to Europe might the most appropriate choice for a potential transportation user. However, if connecting between the train station and airport in New York takes a lot of time, then the transportation user would likely fly to New York to catch his or her connecting flight. Even though taking the train would get the user from Boston to New York faster than flying (as it is generally quicker to access Boston South Station than it is to access Logan International Airport), the connection time in New York defeats this advantage. Therefore, Transportation Connectivity can have a significant impact on Trip Attributes, which then affects the Modal Split and Network Usage.
The larger implications of this connectivity is that, by giving transportation users the ability to choose the best mode for each leg of their trip, air emissions can potentially be reduced on a per traveler-‐trip basis. For example, if there is good connectivity between the airports and the rail network, users are more likely to take the train for the short-‐haul part of their journeys within the NEC (particularly if international-‐quality high-‐speed rail were introduced), and use air travel for the longer-‐haul part of their journey. Since high-‐speed rail generally produces fewer air emissions than short-‐haul air travel, and there is generally no suitable alternative to long-‐haul air transportation, transportation users would be using the more efficient modes for each part of their trip.
Implications for the bundles of strategic alternatives
Currently, there is good connectivity between the intercity rail system and public transit at the larger stations along the NEC. However, there are currently no co-‐ticketing arrangements between Amtrak and any of the public transit operators along the route (as far as the authors are aware). As one speaker at the Transportation Research Board’s AR010 Intercity Passenger Rail Committee Meeting (on January 23, 2012) mentioned, co-‐ticketing arrangements (and/or appropriate placed ticketing machines) reduce the transfer time between different rail services, particularly if travelers on one mode has to exit the platform area of a station and enter the main concourse to purchase the ticket for the remaining part of their trip.

MIT HSR/Regions Group Carlson, Archila and Pena Chapter 5 – Discussion of high-‐impact paths and their implications on the bundles of strategic alternatives
5-‐19
The existing NEC rail system has stations at Newark International Airport (EWR) and Baltimore Thurgood Marshall Airport (BWI). Continental Airlines currently offers limited codeshare service with Amtrak out of EWR.13
The most significant improvement to Inter-‐Modal Transportation Integration Policies under bundle 3 could be improved co-‐ticketing arrangements between Amtrak and public transit operators; in particular, ensuring that transfers between Amtrak trains and commuter trains, which share the same platform area, do not require travelers to exit and reenter the platform area to purchase a continuing ticket. Airlines and Amtrak will unlikely see any benefit to improving co-‐ticketing arrangements under bundle 3, as air travel is still significantly faster between many of the larger cities on the NEC.
Under bundle 2, there could be significant changes to Inter-‐modal Transportation Integration Policies. Firstly, the two main proposals for international-‐quality high-‐speed rail in the NEC both include additional airport stops along their alignments. The Amtrak (2010) proposal contains an additional airport stop at New York Westchester County White Plains Airport (HPN) and Philadelphia International Airport (PHL). The PennDesign (2011) study contains an additional stop at Long Island MacArthur Airport (ISP), JFK International Airport in New York (JFK) and PHL. The additional connections to the larger international airports of JFK and PHL, as well as the existing connections at EWR and BWI, could allow more travelers to use high-‐speed rail for the short-‐haul portion of their trips along the NEC and connect to the larger airports for the longer-‐haul portion of their trips.
Secondly, given that international quality high-‐speed rail trip times would now be competitive with short-‐haul air travel along the NEC, there is the potential for more codeshare arrangements to develop between airlines and train operators. Furthermore, given that bundle 2 allows for open competition between train operators, airlines might wish to offer their own high-‐speed rail service along the corridor. Although each airline would likely not wish to offer their own service, alliances of airlines (such as United/Continental/US Airways -‐ Star Alliance) might wish to offer high-‐speed rail services to help feed their long-‐haul air network. By offering their own train service, they could be satisfied with the overall quality-‐of-‐service offered to passengers.
Thirdly, the connections between the high-‐speed rail network and airports along the NEC under bundle 2 could create a more resilient14 transportation system in the NEC. If poor weather prevents airlines from flying regional flights, airlines could have travel rebooking agreements with train operators to allow passengers to travel via rail instead. In Canada, VIA Rail and Air Canada currently have an agreement that allows air passengers to travel with VIA Rail if their flight is cancelled. Such agreements would help lessen the congestion 13 http://www.continental.com/web/en-‐US/content/company/alliance/amtrak.aspx 14 Resilience is a life-‐cycle property of a system that is characterized by the ability to recover from unexpected events.

MIT HSR/Regions Group Carlson, Archila and Pena Chapter 5 – Discussion of high-‐impact paths and their implications on the bundles of strategic alternatives
5-‐20
that often occurs after a major snowstorm15. It would also allow airlines and airports to ensure that long-‐haul air flights could depart, which would help avoid having the congestion caused by a major weather event in the northeast propagate across the country. The upgrades proposed in bundle 3 would not provide sufficient capacity to allow for a larger proportion of air travelers to travel by train.
Fourthly, whilst international-‐quality high-‐speed rail in the NEC would draw traffic away from regional short-‐haul air travel, airlines could focus more on providing longer-‐haul flights with the limited airport capacity available, which are generally more profitable. Additionally, the flexibility of high-‐speed rail to provide more stops along the corridor, combined with the stations at airports, could potentially allow more passengers to be fed into the airlines’ networks. As a result, it could be hypothesized that providing high-‐speed rail could potentially improve airline revenues, although further study would be required to support this last point.
There are two broad insights that come out of these points. The first insight is that bundle 2 offers more opportunity to promote inter-‐modal integration and thus change travel behavior in the NEC. The second insight is that implementing inter-‐modal connectivity requires thinking about relatively small details of a user’s trip that are potentially unique to a given situation. For example, it is not sufficient to just have the airport connected to the rail network and have the schedule set up to minimize transfer times (although these factors are important), in order to encourage people to transfer between modes, but there must be some consideration to how individuals purchase tickets, check-‐in, deal with their luggage, etc. The small details of inter-‐modal connectivity likely have disproportionate effects on the amount of travelers who will transfer between modes.
15http://www.aircanada.com/en/travelinfo/delays/pop_viarail.html

MIT HSR/Regions Group Carlson, Archila and Pena Chapter 5 – Discussion of high-‐impact paths and their implications on the bundles of strategic alternatives
5-‐21
CONGESTION
Figure 5.9: Congestion subnetwork
The paths and loops in Figure 5.9 illustrate interesting relationships between Congestion and Air Emissions. In the short-‐term, congestion leads to more air emissions. However, in the longer-‐term, congestion might have the opposite effect, at least for specific modes. Since congestion of a given mode results in poorer Trip Attributes, the Modal Split will change and fewer people will use that mode. If the mode that travelers switch to outputs a lower amount of air emissions per traveler, then the amount of air emissions will decrease, and vice-‐versa. For example, if no expansion is done to highways, then congestion of the highway system might encourage users to switch other modes to make their trips between cities. If a user switches to using high-‐speed rail, then, in general, air emissions would be reduced as high-‐speed rail is typically more efficient than driving (according to information from UCS 2008).
Implications for the bundles of strategic alternatives
Under bundle 3, rail traffic on the NEC will continue to be congested and trip time reliability for train travel will likely continue to suffer as a result. Furthermore, there is
MIT HSR/Regions Group Carlson, Archila and Pena Chapter 5 – Discussion of high-‐impact paths and their implications on the bundles of strategic alternatives
5-‐22
little additional capacity for additional service frequency to be added to the NEC. Given that trains are more fuel efficient than automobiles or short-‐haul air transportation, the benefits associated with the loop described above will not be achieved; in fact, the opposite result might happen: as travelers on the NEC may no longer be able to find a reasonably-‐priced train seat (or any seat at all for that matter), the current transportation users of rail might choose other modes. Such an effect is already occurring with the premium Acela Express service: tickets for this higher-‐speed/higher-‐quality service are often $50 to over $100 more expensive than slower Northeast Regional Trains.
Under bundle 2, the current congestion experienced by intercity passenger trains on the NEC will be reduced more significantly than under bundle 3. Furthermore, there will be additional infrastructure capacity that will allow for the expansion of intercity passenger rail service. As a result, there will generally be more frequent and reliable service, which will lead to a mode shift towards greater use of high-‐speed rail. Given that air and auto travel will likely remain fairly congested as there are fewer opportunities to upgrade airport and highway capacity, the reliable travel times provided by high-‐speed rail could further encourage transportation users to use high-‐speed rail instead of air or auto travel.
In order to prevent significant congestion on a vertically-‐separated international-‐quality high-‐speed rail network from occurring, care must be taken in designing the rewards structure of the infrastructure operator, as it might have the tendency to over commit its infrastructure to operators in order to increase revenues from access charges, resulting in more delayed trains. For example, if access charges were priced based on units of train-‐miles, then the infrastructure operator would be incentivized to raise revenues by encouraging operators to add trains. However, adding more trains to the network could cause delays to other operators, which would not be internalized by the infrastructure operator. By contrast, this issue would not occur under a vertically integrated company, as the train operator would have to internalize the “costs” of increasing congestion on the network (such as reduced passenger revenue, increasing delay costs, etc.).

MIT HSR/Regions Group Carlson, Archila and Pena Chapter 5 – Discussion of high-‐impact paths and their implications on the bundles of strategic alternatives
5-‐23
ECONOMIC ACTIVITY
Figure 5.10: Economic Activity subnetwork
The paths on the Economic Activity subnetwork (Figure 5.10) highlight the importance of Macroeconomic Factors and Economic Activity on Transportation Revenues, Air Emissions and Human Health and Environmental Sustainability and Congestion. In general, as Economic Activity increases Transportation Demand across all modes, Transportation Revenues, Air Emissions and Congestion will all increase as well. As Transportation Demand affects the Modal Split, not all of the modes may necessarily experience increases in these components as Transportation Demand increases; however, in general, the aforementioned relationship will hold.
The relationships between Economic Activity and Air Emissions highlight one of the challenges associated with achieving a sustainable transportation system: that is, what is the appropriate balance between allowing economic growth and maintaining air emissions to a “reasonable” level? In the long-‐term, new technologies that improve the efficiency of transportation vehicles and energy generation plants will help lower air emissions, but in the short-‐term, economic growth leads to an increase in air emissions.
Implications for the bundles of strategic alternatives
If there is significant economic growth, only bundle 2 will allow for intercity passenger rail to absorb a significant portion of the new Transportation Demand; the capacity constraints associated with bundle 3 prevent intercity passenger rail from absorbing anything more than a modest increase in Transportation Demand. As a result, if bundle 3 is implemented, then any new transportation users will likely use auto or short-‐haul air transportation,

MIT HSR/Regions Group Carlson, Archila and Pena Chapter 5 – Discussion of high-‐impact paths and their implications on the bundles of strategic alternatives
5-‐24
which will lead to more Congestion and Air Emissions. However, if bundle 2 were implemented, then the intercity rail transportation could likely accommodate some of this demand, and whilst air emissions and congestion would increase, they would not increase as quickly as under bundle 3.
If economic activity is still lackluster, then there will likely not be any significant increases in Transportation Demand. As a result, there could be the risk if bundle 2 were implemented that it would not be economically viable while the economy is still weak, particularly if not enough users divert from other modes to use the rail system. Given that the political process is based around relatively short cycles, politicians might be too quick to respond to this perceived “failure” of the new system, before the economy has a chance to recover. Patience in the political process would be required to implement bundle 2 (in particular); however, it is unclear whether such patience would be available given the current political situation.
“LOW-‐IMPACT” PATHS
The paths identified in the above subnetworks were some of the fastest and strongest paths in the overall CLIOS Representation. They provide some insight into some of the larger issues related to transportation systems as well as a way to help distinguish the bundles of strategic alternatives.
The paths that do not appear in the above subnetworks also provide some insight into the CLIOS system. For example, in the CLIOS Representation, there is a path that leads from Transportation Funding and Investment to Economic Activity, but it does not show up in the list of high-‐impact paths. As proponents of transportation projects often attempt to bolster their position based on the potential wider economic benefits of a project, the absence of a high-‐impact path between Transportation Funding and Investment and Economic Activity is illuminating.
We believe that the presence of a relatively low-‐impact path between Transportation Funding and Investment and Economic Activity seems to indicate that there is a lot of uncertainty associated with assessing the wider economic impacts of transportation projects. (Wider economic benefits are those that are not included in user and producer benefits from a project). While transportation projects can have a positive impact on the economy (as indicated by the presence of the path), given that the transportation system in the NEC is already very well developed, the magnitude any wider economic benefits that would result from high-‐speed rail development is unclear. Unlike in the past, where transportation projects have resulted in a orders of magnitude reduction in travel time or cost (such as the intercontinental railway or the interstate highway system), even international quality high-‐speed rail only offers a modest decrease in trip time and likely relatively little cost savings over air travel. Additionally, there is a lot of debate
MIT HSR/Regions Group Carlson, Archila and Pena Chapter 5 – Discussion of high-‐impact paths and their implications on the bundles of strategic alternatives
5-‐25
surrounding the analysis techniques used to account for regional economic benefits as noted in Chapter 10. Furthermore, even if a careful study could determine that there are wider economic benefits, attempting to assess the distribution of the benefits is challenging. For example, international-‐quality high-‐speed rail may help the larger cities on the NEC, but harm the smaller ones not connected by high-‐speed rail. Melibaeva et al. (2010), in their study of megaregions with high-‐speed rail, found that in some instances, the economic growth was not distributed evenly, resulting in “winners” and “losers.” Finally, economic benefits resulting from the development of high-‐speed rail might take several years to develop. As a result, the fact that the path between Transportation Funding and Investment and Economic is low-‐impact does not necessarily mean that these effects are not important, but rather reflects the challenges associated with assessing the wider economic benefits associated with transportation projects.
Under bundle 3, there would likely be only modest wider economic benefits (if any), there would not be any significant changes to the travel time between major centers. However, under bundle 2, significant wider economic benefits might be possible. For example, Amtrak (2010) currently estimates that there would be a $7.3 billion (2010$) in wider economic benefits (from increases in “market productivity”) between 2010 and 2060 from implementing international-‐quality high-‐speed rail. However, there is little information in the report to assess the methodology used to determine this value.
SUMMARY OF INSIGHTS, FURTHER THOUGHTS AND CONCLUSION
Our analysis of the CLIOS Representation using MATLAB allowed us to identify some of the most important paths in the network. These paths were combined into several subnetworks, which were then used to better understand some of the general issues associated with implementing high-‐speed rail in the NEC as well as some of the key differences between the two bundles of strategic alternatives.
The three most commonly found components in all of the paths were Trip Attributes, Modal Split and Network Usage. The prevalence of these components in the high-‐impact paths highlights that a strong understanding of how different Trip Attributes will affect the Modal Split in the NEC is a key step in forecasting demand for high-‐speed rail. Therefore, particular attention should be given to the models that were used to calculate the modal split when studying different reports. Additionally, given that international-‐quality high-‐speed rail has not been implemented in the US, there needs to be greater communication of the uncertainties associated with predicting demand and how groups that are implementing high-‐speed rail intend to manage those uncertainties.
In the US, the current fuel tax system currently does not generate enough revenue to cover the expenses of all of the programs it is intended to fund. Changes to the fuel tax (both in magnitude and structurally) which would change the overall cost of driving an auto, could

MIT HSR/Regions Group Carlson, Archila and Pena Chapter 5 – Discussion of high-‐impact paths and their implications on the bundles of strategic alternatives
5-‐26
then change the modal split. Such changes are currently being contemplated, and pilot projects have been undertaken in Oregon and Seattle (Dunn 2010). Given the significant amount of vehicle traffic on NEC highways, even a modest diversion of vehicle traffic to high-‐speed rail represents a significant number of transportation users in absolute terms. As a result, changes to the structure of the fuel tax should be regarded as a source of uncertainty, and thus be carefully considered in any subsequent analysis.
An overarching conclusion from the above two paragraphs is that uncertainty dominates when it comes to estimating demand, particularly for international-‐quality high-‐speed rail: user preferences for international-‐quality high-‐speed rail are still unknown, and other uncertain factors, such as changes to the fuel tax, varying economic conditions for example, affect demand. As a result, appropriate strategies to deal with different levels of demand by dynamically responding to varying conditions, such as incorporating flexibility into the bundles, need to be considered. Flexibility, which is a life-‐cycle property that allows systems to evolve over time, will be discussed more in Chapter 9.
Papers such as Thompson (2005) have discussed rail infrastructure pricing policy in the US in the NEC; however, there does appear to be significant numerical analysis on the issue. If pricing policy for the NEC is not thought about in more detail, any future upgrades run the risk of not being appropriately maintained, if funding is left up to the political process. As a result, an analysis of pricing policy and an assessment of the expected level of government funding to maintain infrastructure needs to be undertaken to ensure that funding expectations are well known in advance. Additionally, the competition between the existing rail service and a new international-‐quality rail service needs to be considered, which further complicates any policy analysis.
In many respects, overcoming capacity limitations of the rail system in the NEC is of greater concern than the increasing speed of service. Currently, Amtrak is limited in terms of the number of trains per day that it can offer, which reduces the potential of increasing service frequency, and hence demand.16 Bundle 3 offers only modest upgrades in capacity, and as a result, future growth of intercity rail passengers is constrained. By contrast, bundle 2 offers significant opportunity to increase ridership on high-‐speed rail. It would also allow commuter and freight operators on the NEC to increase the frequency of service that they provide.
16 The major stations along the route are at or nearing capacity. New York Penn Station and its access tunnels under the North and East Rivers are currently at capacity. In addition, Amtrak is limited to two train slots per hour on the MNR portion of the corridor, and is also limited to 39 trains per day over some moveable bridges in Connecticut due to US Coast Guard and Connecticut Department of Environmental Protection regulations (NEC Infrastructure Master Plan 2010).

MIT HSR/Regions Group Carlson, Archila and Pena Chapter 5 – Discussion of high-‐impact paths and their implications on the bundles of strategic alternatives
5-‐27
One issue with providing additional transportation capacity and improved transportation service in general (as would be the case under bundle 2) is that it allows more for more new “induced” trips on the NEC. Whilst facilitating more travel on the NEC doubtless has economic benefits, these new trips result in more air emissions and, in the long-‐term, potentially more congestion, which counteracts the reduction of Air Emissions from users that switch from less energy efficient modes. Similarly, if economic activity is allowed to increase, then air emissions also increase as a result of increases to the usage of the transportation system. As a result, high-‐speed rail cannot be regarded as a “silver-‐bullet” solution. Other methods to reduce air emissions, such as policies to manage demand, or the development of new technologies (which help improve energy efficiency), need to be developed and implemented. Of course, this issue is not specific to high-‐speed rail; the issue of how much transportation mobility to provide is a larger, multimodal issue. Furthermore, the way in which capacity is added can alter the environmental effects.
For example, improving inter-‐modal connectivity has the potential to make the transportation system more efficient in the NEC. Under bundle 3, however, there is unlikely to be any significant changes to the physical connectivity between modes (e.g. train stations at airports, etc.), but there is the potential for improved co-‐ticketing arrangements between public transit and Amtrak to improve the travel time of the overall trip. Bundle 2 offers significantly more opportunities for physical connectivity between modes, such as having stations at airports, as well as improved co-‐ticketing/codeshare arrangements with airlines. Transportation users would then have more ability to choose the most efficient mode for each leg of their journey. However, in order to ensure that users make inter-‐modal transfers, relatively minor details associated with the transfers, such as where users purchase tickets, how they check-‐in, etc., need to be considered.
Congestion has both short-‐ and long-‐term effects. In the short-‐term, it increases air emissions. However, in the long-‐term, it encourages behavioral change: users are likely to gradually shift towards modes that have less congestion. If bundle 3 is implemented, intercity passenger rail will likely continue to be fairly congested and delay prone, and as a result, fewer transportation users are likely to change modes to rail. By contrast, if bundle 2 is implemented, then more users are likely to use high-‐speed rail, as highway and air transportation modes are likely more congested.
Some of the paths that are not high-‐impact also offer insight into the CLIOS system. For example, although “wider economic benefits” are often quoted as a reason to pursue transportation projects, a strong or fast path with this result did not show up. However, the absence of this path from the list of high-‐impact paths may be more a result of the challenges associated with attempting to quantify these benefits and the fact that any benefits generally take many years to accrue.

MIT HSR/Regions Group Carlson, Archila and Pena Chapter 5 – Discussion of high-‐impact paths and their implications on the bundles of strategic alternatives
5-‐28
One of the challenges associated with pursuing bundle 2 (in particular) is that the political process might not be sufficiently patient to wait for high-‐speed rail to properly develop, particularly if the economy is still in a recession, for example, and demand for high-‐speed rail does not develop immediately. Whilst appropriate institutional structures might be able to moderate the effects of a fickle political process, it is unclear whether the current or future political situation will be patient enough to allow high-‐speed rail to develop. The next bullet below highlights that the short-‐run effects of transportation projects might be very different from the long-‐run effects, which is a well-‐known characteristic of CLIOS systems.
One of the general aspects of many of the insights is that short-‐run effects might be different from long-‐run effects. For example, initially the fuel tax provided sufficient funding to expand the US highway network, but now that vehicle fuel efficiency and resistance towards raising the fuel tax is increasing (particularly in light of the poor economic situation), the fuel tax no longer provides sufficient funding to ensure the state-‐of-‐good-‐repair of infrastructure. Technological and societal changes over time have meant that the fuel tax will have to evolve; however there is no internal mechanism within the policy to allow it to do so (for example, there could have been a law that requires the fuel tax to be re-‐examined every five years), and therefore, changes to the fuel tax are now controlled by the political process. As a result, any policies surrounding high-‐speed rail (including the decision whether to implement it or not) need to consider a long-‐term perspective.
Given that a long-‐term perspective is required to implement high-‐speed rail, life-‐cycle properties, such as flexibility, which provide opportunities to change the system over time in response to new situations, need to be considered. However, flexibility can also be a liability, however, if it allows the political process to react too quickly to negative conditions. (For example, a new international-‐quality high-‐speed rail system could be constructed in phases. However, if the first phase of the system is not successful at attracting demand immediately [because of a poor economy, for example], the political process might try to cancel continuing the implementation entirely, instead of waiting for the demand to develop before continuing). The benefits and drawbacks of flexibility will be discussed in more detail in Chapter 9.
There are other potential insights that might be gleaned from the CLIOS Representation. Some of the insights that were identified were more obvious, and others were less so. The ability of the CLIOS system to produce “obvious” insights can be considered one aspect of the “proof” of concept, as we were able to show that our representation is calibrated to approximate reality. In addition, the ability for the CLIOS Representation to produce less obvious insights indicates that we were able to apply the representation to think about the system in a new way, which is a more subtle “proof-‐of-‐usefulness.”

MIT HSR/Regions Group Carlson, Archila and Pena Chapter 5 – Discussion of high-‐impact paths and their implications on the bundles of strategic alternatives
5-‐29
More importantly, the CLIOS Representation provided us a framework with which to organize our thinking, and thus think more deeply about issues related to the NEC. Given that the NEC has been well-‐studied, it is not obvious where to look for new insights. Some of the important insights related to the NEC, such as the potential impact of changes to the fuel tax on intercity rail demand, the lack of clarity regarding high-‐speed rail pricing policy, the notion that capacity is the driving factor behind upgrades, and the counterintuitive nature of transportation air emissions that would result from the introduction of high-‐speed rail, would likely not have been thought about in such an organized fashion without the CLIOS Representation. Now that some of the important issues related to the NEC have been identified, the iterative nature of the CLIOS Process allows us to focus in on specific areas as necessary in more detail.
In the next chapter, we will attempt to use some of these high-‐impact subnetworks to help us identify “driving forces” that we can use to develop scenarios of the future. Scenarios are intended to help us better understand how each of the bundles would play out under different conditions. With this new information, we hope to be able to learn how we can modify the CLIOS Representation so that it can account for a range of possible futures. Additionally, we also hope to identify ways in which we can modify the bundles of strategic alternatives (by including flexibility in the bundles, for example), so that they can better evolve with dynamic changes that will occur in the future.
REFERENCES
Amtrak. 2010. Vision for High-‐Speed Rail in the Northeast Corridor. Amtrak: Washington, DC.
Dunn, T.P. 2010. The Geography of Strategy: An Exploration of Alternative Frameworks for Transportation Infrastructure Strategy Development. MIT PhD dissertation.
Melibaeva, S., Sussman, J. and Dunn, T. 2010. Comparative Study of High-‐Speed Passenger Rail Deployment in Megaregion Corridors: Current Experiences and Future Opportunities. Massachusetts Institute of Technology Engineering Systems Division Working Paper Series ESD-‐WP-‐2010-‐09.
NEC Master Plan Working Group. 2010. The Northeast Corridor Infrastructure Master Plan. Amtrak: Washington, DC.
PennDesign. 2011. High-‐Speed Rail in the Northeast Megaregion: From Vision to Reality. University of Pennsylvania School of Design: Philadelphia, PA.
Smith, R.A. 2003. The Japanese Shinkansen: Catalyst for the renaissance of rail. The Journal of Transportation History 24/2.
Sussman, J. 2000. Introduction to Transportation Systems. Artech House: Boston, MA.

MIT HSR/Regions Group Carlson, Archila and Pena Chapter 5 – Discussion of high-‐impact paths and their implications on the bundles of strategic alternatives
5-‐30
Sussman, J. et al. 2009. The CLIOS Process: A User’s Guide – February 2009.
Union of Concerned Scientists (UCS). 2008. Getting There Greener: The Guide to Your Lower-‐Carbon Vacation. UCS: Cambridge, MA.

MIT HSR/Regions Group Pena and Carlson Chapter 6 – Development of scenarios
6-1
Chapter 6
Development of scenarios Maite Peña-Alcaraz | S. Joel Carlson
CONTENTS
Introduction to the use of scenarios
Development of scenarios
Evolution of the bundles under each scenario
Insights and conclusions
INTRODUCTION TO THE USE OF SCENARIOS
According to (Schwartz, 1996), there are some important features about scenarios:
1) Scenarios are “stories about the way the world might turn out”, but “[are not] predictions
of the future”, nor extrapolations of the past either
2) Scenarios are “tools for ordering one’s perception about alternative future environments
in which one’s decision might be played out.”
3) These scenarios “might be rational.”
4) “Scenarios have to do with the driving forces of the system, that is, the key factors that will
determine or drive the outcome of the system.”
According to (Parson et al., 2007), scenarios might be:
1) “Representative of the possible situations that we might find in the future.”
2) Scenarios “can help inform decisions that involve high stakes and poorly characterized
uncertainty.”
3) Scenarios can serve many purposes. “[They can] help inform specific decisions, or can
provide inputs to assessments, models that need specification of potential future
conditions”. “[They can] also provide various forms of indirect decision support, such as
clarifying an issue’s importance, framing a decision agenda, shaking up habitual thinking,
stimulating creativity, clarifying points of agreement and disagreement, identifying and
engaging needed participants, or providing a structure for analysis of potential future
decisions.’
In this particular case, we are not using scenarios to determine how our decisions
(bundles) might be played out under any possible future situation; we want to use them as

MIT HSR/Regions Group Pena and Carlson Chapter 6 – Development of scenarios
6-2
a decision support tool, that is, as a proof of usefulness of the CLIOS representation. We have
a representation of the system; and we claim that it is right; now we want to analyze if this
representation would be helpful for decision making in the NEC.
In order to do that, we have analyzed first if the CLIOS representation is helpful for
developing scenarios, and we have studied afterwards if these scenarios allow us to
distinguish between the strategic bundles. In particular, we have analyzed the CLIOS
representation to identify the driving forces, trying to capture the most critical aspects of
the CLIOS representation. Then, the scenarios have been designed to be sensitive to those
driving forces. We have then used the high-impact paths and the connectivity matrices to
determine how we might expect the system to evolve under the scenarios, to finally be able
to analyze which will be the specific evolution for each bundle.
For this project, we do not intend to develop scenarios representatives of each plausible
situation in which we might find ourselves in the future. We have instead chosen three
different scenarios in a way that we have “positive” and “negative” outcomes, to try out
decisions in the direction of slowing the investments on HSR and in the direction of
investing more on the projects. In particular, with the scenarios we have tried to address
poorly characterized uncertainties that are difficult to address using other methods.
Since we have different decision periods, we have developed scenarios for the time in
between those decisions periods, so in our scenarios, we make decisions only using
information that we would have available.
The rest of the chapter is structured as follows: in the next section, we present how we
have used the CLIOS representation to inform the development of the scenarios. In the
following section we look at the bundles of strategic alternatives in the context of scenarios.
We analyze what scenarios tell us about the bundles.
DEVELOPMENT OF SCENARIOS
As noted above, the scenarios should address the evolution of the driving forces of the
system. An examination of the CLIOS representation, the connectivity matrix, and the speed
and strength of the connections allow us to identify the most critical components of the
NEC and to relate them to different driving forces:

MIT HSR/Regions Group Pena and Carlson Chapter 6 – Development of scenarios
6-3
Components Driving forces
Macroeconomic Factors (Labor,
Capital)
Economic Activity
Foreign Economies
Economic growth
Transport Funding and
Investment
Federal and State Fiscal
Policies
Taxes
Political support
Congestion Congestion
Transportation Infrastructure
Transportation Service
Technological change
Transportation Demand
Modal Split
Public perception
Environmental Policies
Weather
Environmental changes
Global Fuel Prices
Energy Sources
Energy
Transport Funding and
Investment
Funding sources
Multi-modal Transportation
Integration Policies
Multi-modal cooperation
Land Usage
Land Demand
Land Cost
Changes in land use
Transportation Demand
Demand for Goods & Sevices
Modal Split
Social attitude towards the
environment
Table 6.1: Critical components of the system and driving forces
We can imagine different situations in which these driving forces might be affected:
• Economic growth (what if economic growth stops and unemployment increases?,
what if there is a big recession in Europe?)
• Political support (that might be caused by the election of different presidents,
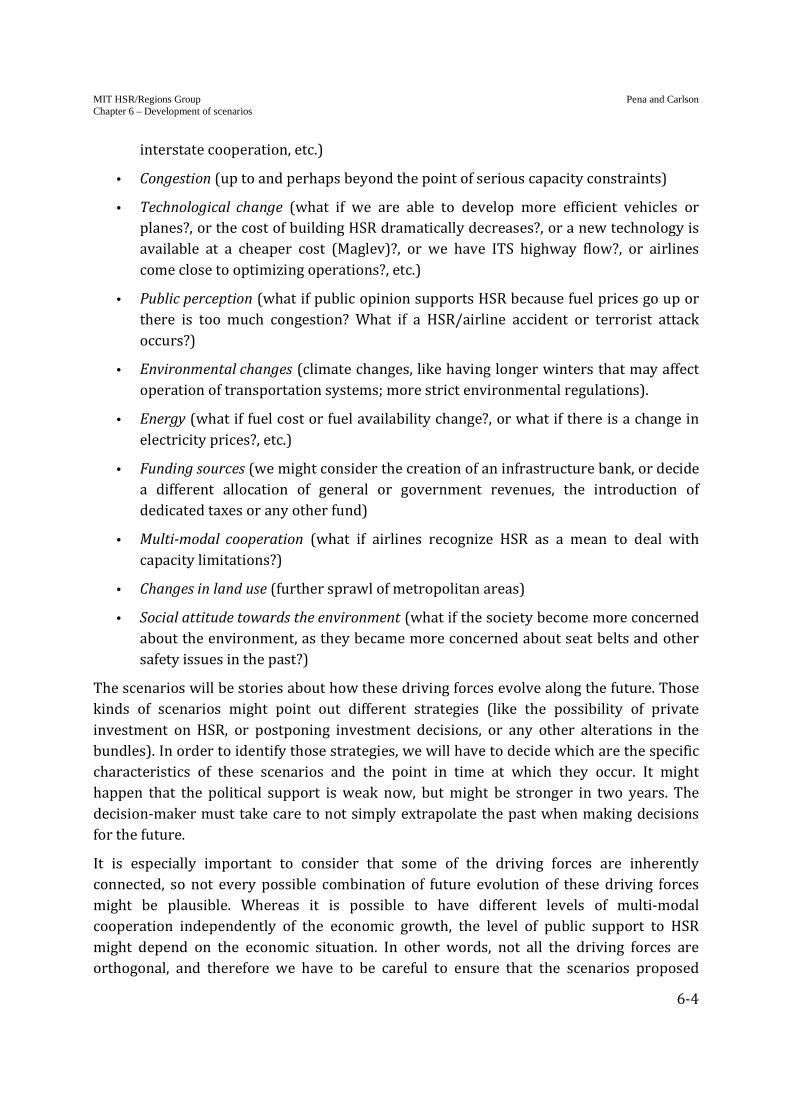
MIT HSR/Regions Group Pena and Carlson Chapter 6 – Development of scenarios
6-4
interstate cooperation, etc.)
• Congestion (up to and perhaps beyond the point of serious capacity constraints)
• Technological change (what if we are able to develop more efficient vehicles or
planes?, or the cost of building HSR dramatically decreases?, or a new technology is
available at a cheaper cost (Maglev)?, or we have ITS highway flow?, or airlines
come close to optimizing operations?, etc.)
• Public perception (what if public opinion supports HSR because fuel prices go up or
there is too much congestion? What if a HSR/airline accident or terrorist attack
occurs?)
• Environmental changes (climate changes, like having longer winters that may affect
operation of transportation systems; more strict environmental regulations).
• Energy (what if fuel cost or fuel availability change?, or what if there is a change in
electricity prices?, etc.)
• Funding sources (we might consider the creation of an infrastructure bank, or decide
a different allocation of general or government revenues, the introduction of
dedicated taxes or any other fund)
• Multi-modal cooperation (what if airlines recognize HSR as a mean to deal with
capacity limitations?)
• Changes in land use (further sprawl of metropolitan areas)
• Social attitude towards the environment (what if the society become more concerned
about the environment, as they became more concerned about seat belts and other
safety issues in the past?)
The scenarios will be stories about how these driving forces evolve along the future. Those
kinds of scenarios might point out different strategies (like the possibility of private
investment on HSR, or postponing investment decisions, or any other alterations in the
bundles). In order to identify those strategies, we will have to decide which are the specific
characteristics of these scenarios and the point in time at which they occur. It might
happen that the political support is weak now, but might be stronger in two years. The
decision-maker must take care to not simply extrapolate the past when making decisions
for the future.
It is especially important to consider that some of the driving forces are inherently
connected, so not every possible combination of future evolution of these driving forces
might be plausible. Whereas it is possible to have different levels of multi-modal
cooperation independently of the economic growth, the level of public support to HSR
might depend on the economic situation. In other words, not all the driving forces are
orthogonal, and therefore we have to be careful to ensure that the scenarios proposed

MIT HSR/Regions Group Pena and Carlson Chapter 6 – Development of scenarios
6-5
make sense. CLIOS high-impact paths can help to identify which driving forces are
independent and which are interrelated.
With that in mind, we have developed scenarios that answer the evolution of each of those
driving forces. We propose to consider three possible scenarios.
• Scenario 1: For this scenario we will assume that the US presents a very slow economic
growth (due to a recession in other countries), but at the same time there is a strong
political support to high speed rail.
• Scenario 2: For this scenario we will assume that the US presents a rapid economic
growth and, at the same time, the transportation system is really congested. However,
there is little political support to HSR projects.
• Scenario 3: For this scenario we will assume that we have some years of medium
economic growth, and there is a new technology that allows a dramatic reduction of the
cost of HSR.
In the next subsections each scenario has been developed considering five different
decision stages. In particular, we assume that decisions about the system might be
implemented on time 0 (now, before US presidential elections), time 1 (in two years, before
next US House and Senate elections), time 2 (in four years, just before next presidential
elections), time 3 (in eight years, just before the following presidential elections), and in
time 4 (in sixteen years). We specify how the scenarios chosen evolve in the periods
between those decision stages, so in our scenario world decision makers make decisions
without using information that they do not have available at that time. We have included
the evolution of the driving forces of the system at each period of time as a summary of
each scenario.
SCENARIO 1
For this scenario President Obama wins the elections of November 2012, ensuring political
support to HSR during the next years in the US. However, there is a substantial economic
recession in Europe. The European countries are unable to manage the situation. As a
result, the Euro (European currency) disappears by the beginning of 2013. This recession
causes a severe economic recession in the US too. The Democrats win the House and Senate
election in 2014 too.
At the same time, different environmental agencies around the world start announcing that
climate change has been accelerated. This event together with a succession of natural
disasters (strong hurricanes) between 2012 and 2016 raises public concern about
environment. New clean air and carbon tax legislation is approved by the beginning of
2015.
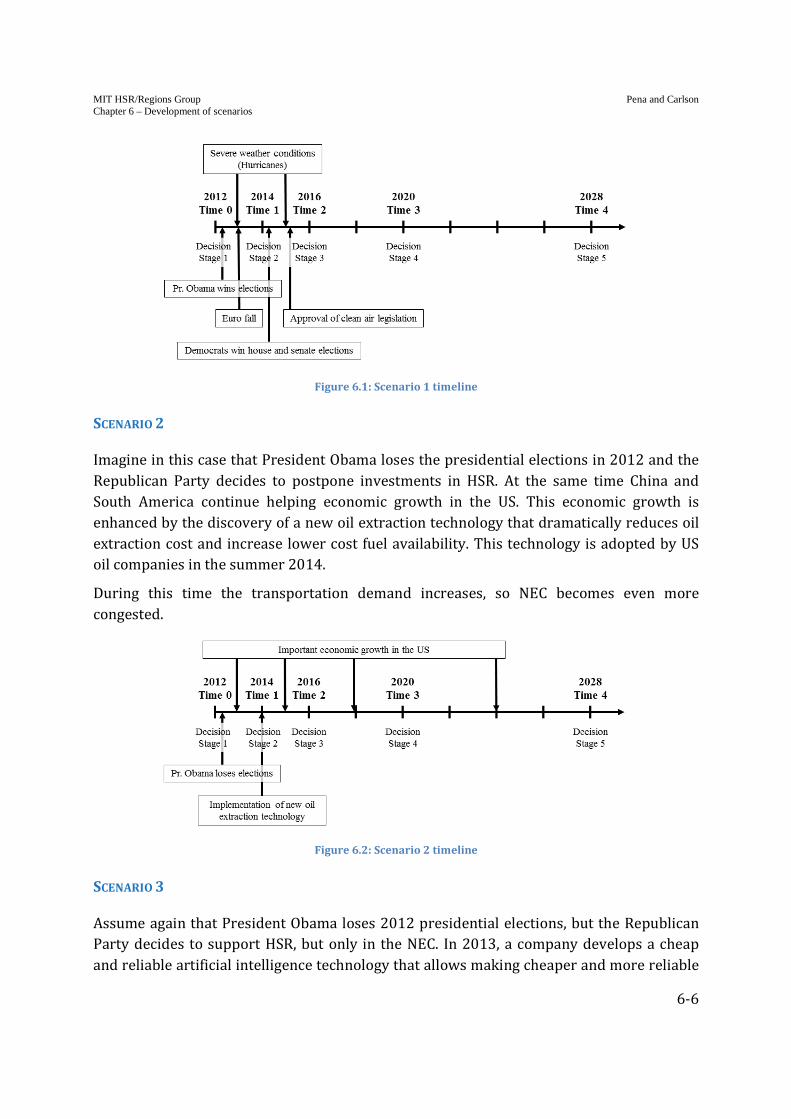
MIT HSR/Regions Group Pena and Carlson Chapter 6 – Development of scenarios
6-6
Figure 6.1: Scenario 1 timeline
SCENARIO 2
Imagine in this case that President Obama loses the presidential elections in 2012 and the
Republican Party decides to postpone investments in HSR. At the same time China and
South America continue helping economic growth in the US. This economic growth is
enhanced by the discovery of a new oil extraction technology that dramatically reduces oil
extraction cost and increase lower cost fuel availability. This technology is adopted by US
oil companies in the summer 2014.
During this time the transportation demand increases, so NEC becomes even more
congested.
Figure 6.2: Scenario 2 timeline
SCENARIO 3
Assume again that President Obama loses 2012 presidential elections, but the Republican
Party decides to support HSR, but only in the NEC. In 2013, a company develops a cheap
and reliable artificial intelligence technology that allows making cheaper and more reliable

MIT HSR/Regions Group Pena and Carlson Chapter 6 – Development of scenarios
6-7
robots. As a result the construction of HSR becomes faster and cheaper and less workers
are required.
After two years of economic recession between 2012 and 2014, the US economy starts
presenting a modest economic growth. In 2017, the US Government decides to create a
dedicated infrastructure fund.
Figure 6.3: Scenario 3 timeline
We should note that the CLIOS representation has been particularly helpful to us in
identifying appropriate scenarios, since, as we might expect, most of the driving forces
represent components that have a major impact on the system through the high-impact
paths like: economic growth (economic activity, macroeconomic situation), political
support and funding sources (transport funding and investment, taxes), congestion, multi-
modal cooperation (multi-modal transportation integration policies), and land use mainly.
In the definition of the scenarios, we have tried to incorporate the interaction of different
driving forces to avoid considering only optimistic or pessimistic scenarios that might lead
to obvious conclusions. That is why different levels of political support has been combined
with different levels of economic growth, and with other instant actions of different driving
forces like energy (availability of a new extraction technology), weather and environment,
new technologies, etc.
As we already mentioned, many of the driving forces are profoundly interrelated, so not
every possible combination of future evolutions of them might be plausible a priori. In
particular, the economic situation might affect the level of political support or commitment
with HSR projects. Therefore, there might be some concern with scenarios 1 and 2, where
we present situations in which there is high political support to HSR under an economic
recession environment (scenario 1) or there is low political support to HSR under a
positive economic growth environment (scenario 2). Scenario 1 seems a plausible
extrapolation of the current situation into the future. Scenario 2, on the other hand, might
be considered not very probable a priori. However, there might be two reasons justifying
why a scenario like this might occur. Firstly, given the current economic situation,

MIT HSR/Regions Group Pena and Carlson Chapter 6 – Development of scenarios
6-8
politicians might need several years of positive economic trend to get convinced that the
economy is actually growing. Secondly, we might expect that a new politician prefers to
postpone investment in transportation to be able to develop and have credit from his own
“transportation project” instead of continuing with President Obama’s vision of HSR.
Tables 2.2, 2.3 and 2.4 present the details of the evolution of the scenarios along the time
periods considering interactions between components through some of the CLIOS high-
impact paths. + or – represent the sign of the effect on the driving force (– economic growth
means that there is an economic recession, whereas + economic growth means that there is
a (positive) economic growth). The size of the sign, as well as the number of signs used,
represents the strength of the effect. / represents that the effect in the driving force is not
important.
Table 6.2: Scenario 1

MIT HSR/Regions Group Pena and Carlson Chapter 6 – Development of scenarios
6-9
Table 6.3: Scenario 2
Table 6.4: Scenario 3

MIT HSR/Regions Group Pena and Carlson Chapter 6 – Development of scenarios
6-10
EVOLUTION OF THE BUNDLES UNDER EACH SCENARIO
In the previous section, we developed scenarios using the framework proposed by
Schwartz (1996). In this section, we are considering how each of the bundles described in
chapter 3 would evolve under the scenarios identified.
The performance of the bundles under different scenarios would determine whether we
could differentiate between the bundles in a similar fashion to how we were able to
differentiate between them using the CLIOS Representation. We also wished to see whether
we could identify new insights from the process of applying the bundles to the different
scenarios that would help us to refine the CLIOS Representation. In addition, recognizing
that the process of implementing HSR in the NEC could take place over many years, we
wanted to see whether it would be worthwhile to consider flexibilities in the bundles of
strategic alternatives, which would allow the bundles to be altered under changing
circumstances that might play out. Finally, we hoped that the imaginative nature of the
scenario planning process would help us to think more creatively about the NEC.
SCENARIO 1
This scenario is characterized by a strong political support for HSR caused by the re-
election of President Obama, and by an economic recession in the US caused by a recession
in Europe. Under this scenario, we might expect low levels of economic activity, which will
cause a decrease in transportation demand and hence in the congestion level of the NEC. At
the same time, the adoption of a strict environmental regulation (e.g. a cap and trade policy
on emissions or a carbon tax) might on the one hand, increase the budget available to
invest in transportation, but on the other hand, discourage even more transportation
demand, which would likely decrease air emissions, congestion and transport revenues.
Imagine that under these circumstances, President Obama commits to bundle 3, the status
quo. If a clear strategy is adopted, we might see modest but tangible improvements along
NEC services. Even though the economic situation is not promising during the early time
periods, President Obama’s support for HSR projects would help ensure that adequate
funds are committed to bundle 3. After the first time periods, we might expect stronger
support for HSR in the NEC for two reasons. Firstly, there will have been tangible
improvements on the corridor, which will have a direct impact on the trip attributes and
hence in the modal split and the railway transportation demand. Secondly, the adoption of
strict environmental legislation through the adoption of cap and trade policies on
emissions will also favor social support to more efficient transport system. Therefore,
although the results coming from bundle 3 will be modest, President Obama’s support for
the bundle will ensure that tangible improvements to intercity passenger rail will result,
which would ultimately encourage more funding for an international-quality HSR system.

MIT HSR/Regions Group Pena and Carlson Chapter 6 – Development of scenarios
6-11
If President Obama commits to proceeding with bundle 2 instead, the difficulty of raising
funds for the project given the economic recession, together with the fact that the
investment of these funds might be spread out over the US (since the political agenda will
not have NEC as a target) will generate a situation in which it would be very difficult to
make tangible movements towards an international-quality HSR corridor. Furthermore,
because there will be little federal funding available for HSR, there may be limited
cooperation amongst the northeast states to develop an appropriate alternative ownership
structure. Ultimately, lack of progress might mean that in five years’ time there is
increasing opposition to construct HSR in the NEC.
SCENARIO 2
The main characteristics of this scenario are the Republican politician’s decision to
postpone HSR investment in the US, as well as an important economic growth during the
time period considered. The first implication of economic optimism in the US due to the
economic growth of other countries in South America and Asia will be an increase in
economic activity, and hence, transportation demand starting in the initial time period. An
increase in transportation demand in the NEC will automatically imply a higher level of
congestion in an already congested corridor. In this environment, different national and
foreign companies would be willing to invest in railway technology, although the political
situation has to be favorable to that in order to allow the spread of public-private
partnerships. Furthermore, as the CLIOS representation has highlighted, private
investment has more impact in the vehicles than in the infrastructure. In addition, the
adoption of a new oil extraction technology that lower fuel prices in 2014 will support a
highway based transport system.
Under this situation, the assumption that politicians decide to postpone railway
investments, the adoption of bundle 3 (the status-quo) without adequate funding will likely
lead to a degradation of intercity passenger rail. The lack of adequate and consistent
funding would also hamper Amtrak’s ability to properly manage upgrades to NEC as it will
have to: (a) constantly lobby for funds and (b) constantly be changing the sequencing of
projects to match available funds. If Republican’s are in power, they might use Amtrak’s
weakened state in one of two ways. They might try to break up Amtrak and create a new
institutional structure on the NEC. Alternatively, they might pursue a strategy of highway
expansion. Furthermore, the adoption of the oil extraction technology in the US might
challenge railway investment during some years, further supporting the construction of
more highways and the support of a car-based transportation.
Under this scenario, the adoption of bundle 2 will not be feasible. It is not possible to
postpone railway investment and, at the same time, promote an international standards
HSR project.

MIT HSR/Regions Group Pena and Carlson Chapter 6 – Development of scenarios
6-12
SCENARIO 3
Scenario 3 is characterized by a political support for HSR in the NEC, and by a modest
economic recovery. The development of an artificial intelligence technology that allows
lowering the cost of constructing HSR will make infrastructure investment more appealing,
though the project will not create as many jobs as predicted. However, the companies
might benefit from that situation, enhancing economic activity and creating jobs in other
industries. The economic growth will also promote economic activity and higher levels of
transportation demand. In this case, transportation benefits will increase, due to low
construction cost, and high ridership levels. These revenues, together with the creation of
dedicated infrastructure funds, may have a positive impact on transportation
infrastructures.
The adoption of bundle 3 in this situation will lead to modest, tangible improvements in the
NEC. However, the recovery of the economy will cause an increase in transportation
demand, making NEC even more congested. Under this situation, the corridor will continue
to be constrained.
The adoption of bundle 2 in this case will likely be successful. During the first period of
limited (or negative) economic growth, NEC will benefit from government support over
other possible railway corridors; the support from the institutional sphere, somehow
willing to accept anything but Amtrak; and the advantages of the new technologies, that
will lower the cost of constructing the international standard HSR lines. We might expect to
observe big increases in transportation demand, due to the economic activity and the
improvements in transportation infrastructure. This situation will provide a unique
opportunity to develop intermodal transportation operation policies that will benefit all
transportation stakeholders, having an impact again in the economy, and users, that will
benefit from an international quality transport system.
Table 2 presents a summary of the evolution of the bundles of strategic alternatives under
each scenario.

MIT HSR/Regions Group Pena and Carlson Chapter 6 – Development of scenarios
6-13
Bundles
Bundle 2
Bundle 3
(Status quo)
Sc
en
ar
ios
Scenario 1
• Difficult to achieve international-quality HSR
• Increasing opposition to HSR due to lack of results
• Modest but tangible improvements along NEC
• Stronger support to HSR
Scenario 2
• Not feasible • Commitment to car-
based transport system (highways)
• Degradation of intercity passenger rail
• Amtrak degradation Commitment to car-based transport system (highways)
Scenario 3
• Success of international-quality HSR
• Transportation demand and benefits increase
• Modest but tangible improvements along NEC
• Constrained NEC (in terms of capacity)
Table 6.5: Evolution of the bundles under each scenario
INSIGHTS AND CONCLUSIONS
Although the scenarios are fairly brief and require further refinement, when we considered
the bundles in the context of the scenarios, we were able to clearly differentiate between
the different bundles of strategic alternatives.
There were instances in which the scenarios provided us with insights that were congruent
with those derived directly from the CLIOS Representation in chapter 5. For example, if the
economy is growing and there is a significant demand for travel, bundle 3 will be unable to
accommodate the generated transportation demand. The discussion in chapter 5, based on
data from an Amtrak report, highlights the capacity constraints associated with
incrementally upgrading the NEC.
In other cases, as the scenarios allowed us to consider contrasting futures in which some of
the driving forces are strong in one but weak in the other, we were able to discover new
insights by changing our inherent assumptions and reconsidering the subnetworks within
the CLIOS Representation. For example, if the economy is weak, but political support is
fairly strong, bundle 3 would likely perform better, as there would be modest but tangible
improvements to high-speed rail that could demonstrate Amtrak’s competence at
MIT HSR/Regions Group Pena and Carlson Chapter 6 – Development of scenarios
6-14
managing large-projects. Although under good economic conditions bundle 2 might
perform better, under poor conditions bundle 2 might stall because of insufficient funding.
In summary, the scenario planning process was thus a useful complement to the CLIOS
representation. The CLIOS representation framework has been useful to develop the
scenarios, and the analysis of the bundles from the context of scenarios has allowed us to
get further insights about the NEC. In future research we propose to extend the scenario
analysis developed for this project. In particular, we think that the consideration of more
scenarios that can be by themselves representative of most of the future possible situation
can be especially helpful to identify how the performance of the bundles will turn out. At
the same time, we believe that the study of scenarios that specifically deal with some of the
driving forces identified (as energy, multi-modal cooperation, or changes in the land use,
for example) could provide further insights. It would also be interesting to use the
scenarios to propose further refinements to the CLIOS representation.
Finally, there were also some instances in which there might be a transition between the
two bundles, which could justify including flexibility in the bundles. For example, under
Scenario 1 above, after several years of successfully improving high-speed rail
incrementally, there might be the opportunity for greater investment in an international-
quality system. Therefore, we feel that it is worthwhile to consider how flexibility could be
implemented in order to improve the ability to change aspects of the bundles over time.
Designing flexibility into the bundles will be considered in more depth in chapter 7.
REFERENCES
Parson E.A., Burkett V.R., Fisher-Vanden K., Keith D., Mearns L., Pitcher H., Rosenzweig C.,
Webster M., (2007). Global-Change Scenarios: Their Development and Use.
Schwartz P., (1996). The Art of the Long View.
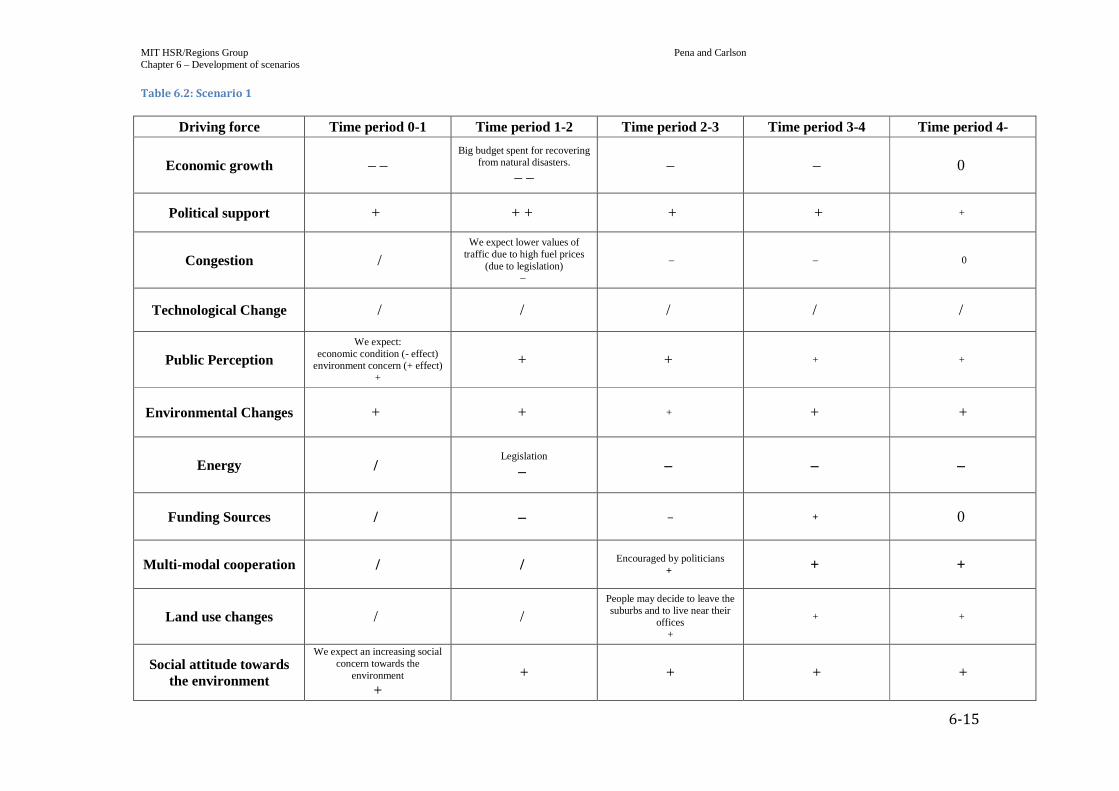
MIT HSR/Regions Group Pena and Carlson Chapter 6 – Development of scenarios
6-15
Table 6.2: Scenario 1
Driving force Time period 0-1 Time period 1-2 Time period 2-3 Time period 3-4 Time period 4-
Economic growth – – Big budget spent for recovering
from natural disasters.
– – – – 0
Political support + + + + + +
Congestion / We expect lower values of
traffic due to high fuel prices (due to legislation)
–
– – 0
Technological Change / / / / /
Public Perception We expect:
economic condition (- effect) environment concern (+ effect)
+
+ + + +
Environmental Changes + + + + +
Energy / Legislation
– – – –
Funding Sources / – – + 0
Multi-modal cooperation / / Encouraged by politicians + + +
Land use changes / / People may decide to leave the suburbs and to live near their
offices +
+ +
Social attitude towards the environment
We expect an increasing social concern towards the
environment
+ + + + +
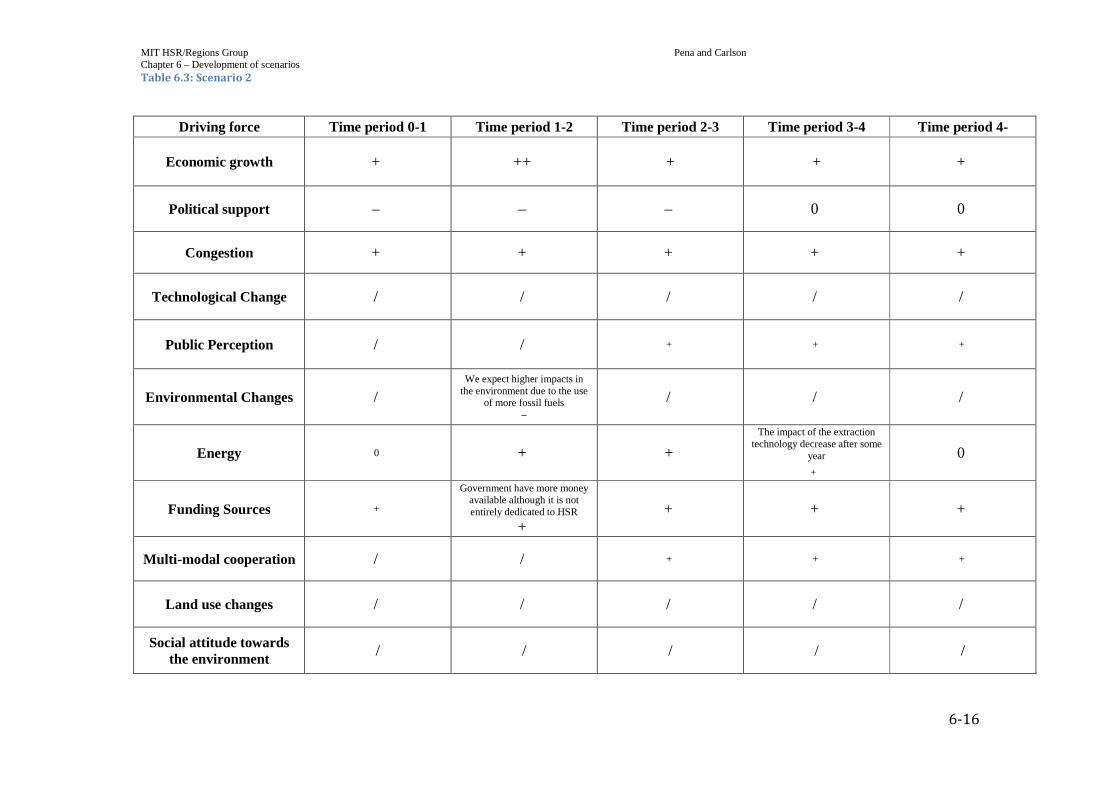
MIT HSR/Regions Group Pena and Carlson Chapter 6 – Development of scenarios
6-16
Table 6.3: Scenario 2
Driving force Time period 0-1 Time period 1-2 Time period 2-3 Time period 3-4 Time period 4-
Economic growth + ++ + + +
Political support – – – 0 0
Congestion + + + + +
Technological Change / / / / /
Public Perception / / + + +
Environmental Changes / We expect higher impacts in
the environment due to the use of more fossil fuels
–
/ / /
Energy 0 + +
The impact of the extraction technology decrease after some
year
+ 0
Funding Sources +
Government have more money available although it is not entirely dedicated to HSR
+ + + +
Multi-modal cooperation / / + + +
Land use changes / / / / /
Social attitude towards the environment / / / / /
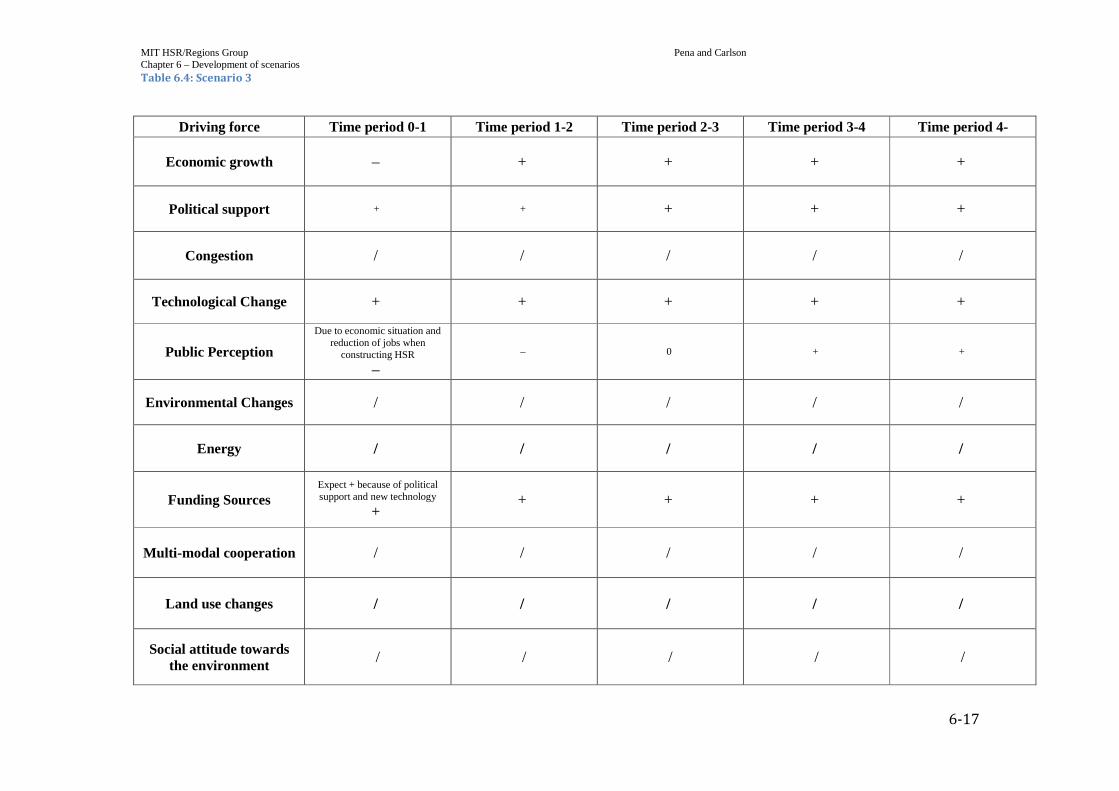
MIT HSR/Regions Group Pena and Carlson Chapter 6 – Development of scenarios
6-17
Table 6.4: Scenario 3
Driving force Time period 0-1 Time period 1-2 Time period 2-3 Time period 3-4 Time period 4-
Economic growth – + + + +
Political support + + + + +
Congestion / / / / /
Technological Change + + + + +
Public Perception
Due to economic situation and reduction of jobs when
constructing HSR
– – 0 + +
Environmental Changes / / / / /
Energy / / / / /
Funding Sources Expect + because of political support and new technology
+ + + + +
Multi-modal cooperation / / / / /
Land use changes / / / / /
Social attitude towards the environment
/ / / / /

MIT HSR/Regions Group Carlson and Pena Chapter 7 – Adding flexibility to the bundles of strategic alternatives
7-1
Chapter 7
Adding flexibility to the bundles of strategic alternatives S. Joel Carlson | Maite Peña-Alcaraz
CONTENTS
Introduction
Introduction to flexibility
Institutional flexibility
Technological flexibility
Intermodal connectivity flexibility
Using flexibility in the bundles based on different scenarios of the future
Conclusion
References
INTRODUCTION
“1930 will be a splendid employment year.” – U.S. Department of Labor, New Year’s Forecast in 1929, just before the market crash
on October 29.1 As the above quote highlights, predicting the future is difficult, even for short-term
horizons. In Chapter 5 and Chapter 6, we recognize that, given the significant uncertainties
associated with forecasting many driving factors (such as the economy), the success of the
each of the bundles of strategic alternatives is difficult to predict. The success of high-speed
rail is particularly susceptible to these uncertainties due to the high capital costs (on the
order of $100 billion) that are ultimately required to implement the system. While we can
attempt to reduce these uncertainties, we cannot control all of the changes that could
potentially occur. As a result, in this chapter, we explore how flexibility can be used to
achieve better outcomes for high-speed rail, by allowing decision-makers the ability to
respond dynamically to different realizations of the future.
We will first introduce the concept of flexibility that was alluded to in previous chapters
and explain how it fits together with the overall CLIOS Process and scenario planning. We
will then describe several possible types of flexibilities that could be included in the
1 Retrieved from http://www.gold-eagle.com/editorials_01/seymour062001.html on February 28, 2012.

MIT HSR/Regions Group Carlson and Pena Chapter 7 – Adding flexibility to the bundles of strategic alternatives
7-2
bundles of strategic alternatives. Finally, we will try to apply the different types of
flexibility described to the bundles of strategic alternatives based on the scenarios that we
developed in Chapter 6.
INTRODUCTION TO FLEXIBILITY
In Peter Schwartz’s (1996) book on scenario planning, The Art of the Long View, he notes
that the goal of scenario planning is to “make strategic decisions that will be sound for all
possible futures.” In other words, he views scenario planning as a method to create robust
strategic decisions. In Sussman et al. (2009), robustness is defined as the “ability of the
bundles of strategic alternatives to perform reasonably well under different futures.” A
robust bundle may or may not perform extremely well under any given scenario, but will
generally perform well across all scenarios.
The implicit assumption behind creating a robust bundle is that once a bundle is
implemented, it cannot be changed. As a result, the bundle must be designed such that at
time the bundle is implemented (which will be defined as t = 0), it must already incorporate
strategic alternatives that will perform reasonably well under all future scenarios. For
example, when a new portion of an urban area is being constructed, stormwater tunnels
are constructed in order to allow rainwater from the surface to be drained from the street
and into natural waterways. When they are constructed, the deepest tunnels are tens of
meters below ground, and therefore, cannot easily be expanded. Therefore, in practice, they
are constructed larger than what is necessary to accommodate the flow initially calculated
by the designer. In other words, a factor of safety is applied to the pipe design in case the
future scenario is different from what is predicted by the pipe designer (e.g. the urban area
expands more than expected, the climate becomes wetter, or the ground is more covered
with impermeable material such as asphalt – all of which lead to greater than expected
flows).
Whilst robustness is an important life-cycle property for systems heavily dependent on
infrastructure, which cannot be easily changed, there are challenges associated with only
using robustness as a method to deal with the uncertainty associated with the future. Most
notably, implementing robustness requires the designers to over-design the system,
potentially at a higher-capital cost, even if the extra features or capacity are never needed.
In the case of the stormwater tunnel example provided above, a situation might never arise
in which the extra capacity of the tunnel is required for additional flows, yet the additional
capital cost has already been spent. Even worse, the shifting land-use patterns could mean
that the population moves away from the area, resulting in lower flows, yet the ongoing
operational costs of the large tunnel still exist for the city to contend with, and there are
potentially new demands in another area of the city. These two scenarios considered
potential “status-quo” and “negative” scenarios, but what about if a more positive scenario

MIT HSR/Regions Group Carlson and Pena Chapter 7 – Adding flexibility to the bundles of strategic alternatives
7-3
occurs, and more people move to the area than expected? If the city did not leave sufficient
right-of-way for development, then the city might have to restrict growth in the area
because a new tunnel is required in order to accommodate the larger flows. Ultimately, a
robust plan often requires significantly more capital and operating costs, and even so,
might not be able to accommodate some future situations.
A life-cycle property related to robustness – flexibility – if implemented correctly,
addresses some of the limitations associated with robustness by allowing the system to
adapt to changing circumstances over time (de Neufville and Scholtes 2011). Like
robustness, the property of flexibility is likely more easily understood by way of example
adapted from de Neufville and Scholtes (2011). A mall is being constructed, and the owners
of the mall are also constructing an adjacent parking garage to accommodate patrons of the
mall. The consultants for the owners forecast that demand for parking will be such that
within ten years six stories will be needed. The owners of the mall could take two
approaches: (1) construct a six story parking garage right away or (2) construct a four
story parking garage with additional structural capacity to accommodate six, or even eight
or ten stories in total later on, as demand does or does not materialize. The first approach
could be considered to be the robust approach: if demand is somewhat lower than
expected, the consultants still figure the owners can make a slight profit from parking fees,
and if demand is higher than expected, the owners should be able to make a good profit,
although the capacity of the parking garage will prevent the profit from being even greater.
The second approach could be considered to be the flexible approach. Although the second
approach would be more expensive than a standard four story garage due to the increased
structural capacity required, it would likely not require as much capital expenditure
initially as the six story garage. If the flexible approach were taken and the demand was
lower than expected, then the owners would likely be able to make a modest profit (as they
spent less on capital expenditures) than under the robust approach. Alternatively, if
demand were better than expected, then the owners could add on additional stories as
required, capturing more profit than under the robust approach (particularly if they built
in enough structural capacity for eight or ten stories). Although the example is
oversimplified, it illustrates the key difference between a robust approach and a flexible
approach. While including both robustness and flexibility in the system design requires
spending more, a flexible approach assumes that rational managers will reconfigure the
system over time – as permitted by the system design – to account for changing
circumstances.
The above example also highlights how flexibility can be used advantageously to overcome
the “flaw of averages”: “Why ‘average inputs’ [from a point estimate do not] lead an
‘average outcome’ (de Neufville and Scholtes 2011). If the robust alternative were
implemented and demand were lower than expected, then the owners would likely suffer a
significant loss; however, if demand is higher than expected, then the owners might only
MIT HSR/Regions Group Carlson and Pena Chapter 7 – Adding flexibility to the bundles of strategic alternatives
7-4
realize a modest profit. If the flexible approach is used, and demand were lower than
expected, then the owner would likely suffer a modest loss; however, if demand were
higher than expected, the owners could add more stories to their garage and achieve a
larger profit. In the robust case, the “expected profit” (from a probabilistic sense)2
assuming that demand is equally distributed, is likely negative, as the larger loss offsets the
modest profit, even though the owners predict based on their point estimate of demand
that they will make a profit. Conversely, in the flexible approach, the expected profit is
likely slightly positive, as the larger profit more than offsets the modest loss, even though
the ‘most-likely’ estimate for demand remains the same. Given that the future forecast
actually a range of possible values (not just a point estimate), “flexibility provides a two-
fold advantage: it limits possible losses and increases possible gains;” the latter of the two is
often not considered as much as the downside losses (de Neufville and Scholtes 2011 –
emphasis added).
Not designing in flexibility does not specifically preclude a rational manager from making
changes to the system. For example, even if the above building were only built with the
structural capacity for six stories, the owners of the parking garage could still add on
additional stories to the building if they retrofit the existing building to increase its
strength. However, the cost of doing so is likely order of magnitudes higher than if the
additional structure capacity were just incorporated into the building in the first place as
some demolitions would likely need to occur to build new foundations and
superstructures, and cars would likely be prevented from parking in large portions of the
garage during construction. As a result, if flexibility is not explicitly designed-into a project
at the outset, the cost of undertaking certain actions is often too high to be considered
under many circumstances.
There are significant uncertainties associated with implementing high-speed rail in the
Northeast Corridor (NEC); we believe that flexibility is a tool that can help manage these
uncertainties. Furthermore, given that the implementation of high-speed rail in the NEC
would require several decades, there will be several points in time when decision-makers
can (and will) make decisions that will alter the bundles that were originally envisioned.
For example, whilst decision-makers might begin by implementing bundle 3 (the “status-
quo” bundle), at some point in the future, they may recognize the need for international-
2 Expected value is the sum (over all outcomes) of the value of an outcome multiplied by its probability. For example, if we were to roll a six-sided fair die and put one dollar multiplied by the number landing face-up on the die into a pot, the expected value of money in the pot after one role would be E[$ in pot] = 1/6 * [$1 + $2 + $3 + $4 + $5 + $6] = $3.50 (as the probability of having any one side land face up is 1/6). (This example is also found in de Neufville and Scholtes [2011]).
MIT HSR/Regions Group Carlson and Pena Chapter 7 – Adding flexibility to the bundles of strategic alternatives
7-5
quality high-speed rail and begin implementing bundle 2.3 Using the CLIOS Process and
other frameworks, we hope to identify desirable types of flexibility and under what
circumstances they can (and will) be designed-into the bundles of strategic alternatives.
Otherwise, considering the bundles as static is potentially oversimplifying the problem and
leading to missed opportunities for insights.
In addition to the CLIOS Process, where appropriate, we have used the “real options”
framework developed by de Neufville to think about flexibility in the system. The definition
of a real option (provided in McConnell [2007]) is the “the right, but not the obligation, [for
the option holder] to take some action at a future date at a predetermined price.” In other
words, can a potential option holder (decision-maker) pay extra now in order to create or
maintain the possibility of taking a potential action in the future.
The parking garage example above can be used to illustrate the concept of a real option.
The owners of the mall have decided to build a parking garage using the flexible approach –
they are going to build a four story garage with the structural capacity to add on an
additional four stories later, for a total of eight stories. Building in the extra structural
capacity into the four-story parking garage to accommodate future expansion costs 25
percent more than a four story parking garage without any capability for expansion. By
spending the extra 25 percent, the owners have purchased a real option (i.e. designed-in
flexibility). As real option holders, they now have the ability (but not the obligation) to
increase the number of stories on their building (i.e. to exercise their option). Of course, the
price of the upgrades may not be known precisely in advance, but the owners of the
building likely have a cost estimate from the consultants that provides them with
reasonable certainty regarding the future costs.
These last points could be subject to debate, however. What if there is significant,
unexpected inflation in the construction industry that drastically changes the cost
estimate? What if new zoning regulations prevent the owners from exercising their option
to add on more stories to the parking garage? Even in the case of this relatively simple real
option, events could occur that either change the cost of exercising the option or prevent
the owners from exercising it altogether. In the case of the NEC, which is far more complex
than this simple example, although the flexibility being discussed follows the same basic
principles, there are significant complications that require additional consideration. The
real options that could be applied in the NEC are “complex.”
McConnell (2007) highlights some of the distinguishing features between “standard” real
options and “complex” real options and notes that every part of the definition of a
“standard” real option can be called into question. These differences are highlighted in
Figure 7.1 below. Many of the features of “complex” real options are applicable to the NEC.
3 In the previous chapter, we noted that under Scenario 1, if bundle 3 were implemented, there might be the opportunity to transition to bundle 2.

MIT HSR/Regions Group Carlson and Pena Chapter 7 – Adding flexibility to the bundles of strategic alternatives
7-6
Firstly, there is fragmentation associated with the option holder on the NEC. Amtrak or
another entity (“anything-but-Amtrak”) would be in charge of the project implementation,
and hence, whether to design-in or exercise any flexibility. However, purchasing an option
would require funding from both federal and state governments, each of which might
oppose providing funding for these purposes. Therefore, whilst Amtrak or this other entity
might see value in purchasing and exercising an option, politics may preclude exercising
the option. Secondly, there may be multiple “actions” that need to take place for an option
to be exercised. For example, one potential flexibility being contemplated for the NEC is
implementing new international-quality high-speed rail in geographic phases. For example,
it may be preferable to implement international-quality high-speed rail from New York to
Philadelphia first to ensure that demand is sufficient, the technology works appropriately,
etc. before deciding whether or not to continue with the rest of the construction. Designing-
in this type of flexibility would require not only careful design of the contracts related to
infrastructure design, construction and operation, but also careful design of the contracts
related to train operations. Thirdly, in the case of the NEC, the flexibility being considered
might change over time. Initially, for example, if incremental high-speed rail is
implemented, the initial future action would be to upgrade to international-quality high-
speed rail. However, if ten years pass and international-quality high-speed rail still has not
been implemented, maglev technology might be the appropriate technology to pursue.
Finally, with any of the flexibilities that are being considered for the NEC, there is no way to
know how much it will cost to exercise the flexibility when it is built in at the outset. Not
only might costs change dramatically due to inflation (or deflation), there may be
significant political “costs” associated with exercising a real option. As a result, given these
challenges associated with complex real options, both significant quantitative and
qualitative analysis techniques are required to evaluate the benefits and drawbacks
associated with designing-in and exercising flexibility in the bundles of strategic
alternatives for the NEC.

MIT HSR/Regions Group Carlson and Pena Chapter 7 – Adding flexibility to the bundles of strategic alternatives
7-7
Figure 7.1: Key differences between "standard" and "complex" real options (Source: McConnell 2007)
With these challenges in mind, we have identified potential opportunities to design-in
flexibility in the bundles of strategic alternatives. The flexibilities identified relate to
different aspects decision levels presented when the bundles of strategic alternatives were
created (in Chapter 3), including: technology, institutional structure, vertical
separation/integration and competitive structure. Some of these potential flexibilities focus
more on the technology choices available with which to implement high-speed rail (i.e.
international-quality versus incremental) and how they could be applied in the NEC. Other
flexibilities focus on the institutional structures.
In order to identify these flexibilities, we used the thinking that came out of: (1) our
discussion of the high-impact subnetworks in Chapter 5, and (2) our thoughts about the
range of possible futures (and how the bundles would perform) based on the scenario
planning exercise in Chapter 6. We used the insights that came out of these chapters
regarding challenges and uncertainties associated with implementing high-speed rail, along
with our own research and judgment about what might be feasible, to identify several
categories of flexibilities. The following section identifies flexibilities that could be
designed-into the bundles,4 and discusses why they might be useful and when they might
be exercised. In another section of this chapter, we then try to consider how the flexibilities
discussed below would play out in the different scenarios identified in Chapter 6.
4 We considered only those flexibilities that were generally consistent bundles 2 and 3. Some modifications to these bundles would be required to design-in the flexibilities that we identified; however, the flexibilities themselves do not create entirely new bundles.

MIT HSR/Regions Group Carlson and Pena Chapter 7 – Adding flexibility to the bundles of strategic alternatives
7-8
INSTITUTIONAL FLEXIBILITY
One of the most significant subjects of debate regarding high-speed rail in the NEC is
whether Amtrak or another alternative entity should be responsible for the
implementation of infrastructure upgrades. Many have expressed concern regarding
Amtrak’s past and future ability to manage infrastructure upgrades to the NEC. Thompson
(2005) notes that, “it would be hard to call Amtrak’s stewardship of the NEC infrastructure
a success” and Representative John Mica, Chair of the House of Representatives
Transportation and Infrastructure Committee, noted in a recent article that “Amtrak
doesn’t have the capability of developing, nor the confidence to receive the financing from
Congress, nor the ability to truly operate good high-speed service.”5 Furthermore,
commuter rail operators, which operate significantly more trains per day than Amtrak,
have expressed concerns that their needs are not being met by Amtrak (Thompson 2005).6
That said, Amtrak currently owns most of the NEC infrastructure and already operates
higher-speed Acela service, and therefore could begin the process of upgrading NEC
infrastructure and service immediately. Implementing an alternative public ownership
structure, such as the “regional public benefit corporation” proposed by the University of
Pennsylvania School of Design (PennDesign 2011) could take months if not years of
negotiations to set up, which would hold up improving high-speed rail service in the NEC.
In summary, there appears to be a need to ensure that an appropriate institutional
structure is in place that can appropriately manage the significant capital investment
projects that will be required in the NEC and balance the needs of all NEC users. Arguably,
Amtrak, in its current state (as represented in Bundle 3), may not be best suited to handle
these tasks, but has the advantage of being already in place and able to begin implementing
any upgrades. It may be possible to design-in flexibility within Amtrak that allows for (but
does not require) a transition into a new organizational structure independent of Amtrak.
Some of this flexibility could be designed-in immediately, while some of it could be
included at a later date. Additionally, some of the flexibility presented could also have
inherent value, even if the flexibility is never exercised.
Firstly, Amtrak could completely separate NEC infrastructure and train operations financial
reporting into separate business lines, in a similar fashion to what Amtrak (2005)
proposed in in “Strategic Reforms Initiative and FY06 Grant Request.” In other words, NEC
5 Caruso, L. 2011. 'Soviet-Style' Amtrak Seeks to Prove It Can Run 220-MPH Trains. http://transportation.house.gov/news/PRArticle.aspx?NewsID=1267. Accessed on February 14, 2012. 6 Recently, however, there have been signs of increasing cooperation, with the NEC Infrastructure Master Plan, for example, representing a concerted effort on the part of commuter rail operators and Amtrak to identify infrastructure upgrades required on the NEC.

MIT HSR/Regions Group Carlson and Pena Chapter 7 – Adding flexibility to the bundles of strategic alternatives
7-9
infrastructure and train operations would operate as their own self-contained businesses
within Amtrak, and thus allow actors to better understand the profitability of each portion
of the business7. (To the authors’ best knowledge, Amtrak does not yet report the financial
performance of NEC infrastructure or operations in this fashion). This action has inherent
benefits: it would allow Amtrak management to better manage the operations of the NEC
and it would provide greater transparency to other institutional actors. Commuter rail
operators would have greater knowledge, which would be useful for negotiating with
Amtrak regarding access fees, for example.
This accounting separation provides some flexibility, as the knowledge gained regarding
the profitability of NEC operations and Amtrak’s other services provides the US DOT, FRA
and the Federal Government new information to justify further reorganizing Amtrak. For
example, the Federal government could exercise the option by reorganizing Amtrak’s
different profit centers into subsidiaries of an overall holding company, similar to an
alternative considered by the Amtrak Reform Council (2001). The holding company would
maintain overall responsibility to interact with the government on issues related to rail
policy, and the respective subsidiaries would focus more on operations. The
aforementioned flexibility of reorganizing Amtrak from accounting profit centers to
completely separate subsidiaries is “complex,” however: the costs of doing so are not
defined when purchasing or exercising the option, and there are likely to be different
opinions among stakeholders about whether to exercise the option. Nonetheless,
accounting separation within Amtrak provides some flexibility by making it easier to
reorganize Amtrak in the future.
Reorganizing Amtrak into a company with separate subsidiaries also creates some
additional flexibility. If Amtrak is not “successful”8 at managing NEC infrastructure
upgrades and/or operations (e.g. if projects are behind schedule or over budget or if the
quality of service that it is providing is not adequate) or if situations arise in which Amtrak
is not the best suited to manage the NEC infrastructure (which will be discussed in more
detail below), the Federal Government has some ability to exercise an option to take the
individual subsidiaries and create a new public company (or companies) for NEC
infrastructure and train operations. Once again, this option is complex; for example,
although Amtrak has separate subsidiaries, labor agreements may be signed for all of the
subsidiaries collectively. Additionally, there are likely to be some actors that disagree with
exercising the option, which will prevent or delay the decision to exercise the option.
7 Train operations do not need to be separated from infrastructure ownership and management. A vertically integrated approach could be pursued instead. In much of the text, we did not discuss whether train operations and infrastructure management should be integrated or separated be chosen. Both alternatives can be considered. 8 The definition of “successful” would be dependent on the view of each institutional actor.

MIT HSR/Regions Group Carlson and Pena Chapter 7 – Adding flexibility to the bundles of strategic alternatives
7-10
Although some of the more obvious triggers to exercise the flexibility mentioned above
relate to Amtrak’s project management ability, there are other potential situations, outside
of Amtrak’s control, in which it would be appropriate to exercise some of flexibility
discussed above. We identified some of these potential issues using the CLIOS
representation and scenario planning techniques. For example, with increases in
congestion in the NEC, there may be a greater push towards multimodal cooperation in the
NEC. (The CLIOS process identified both congestion and inter-modal cooperation policies
as important components). While Amtrak may be doing a good job managing the NEC,
northeastern states might collectively decide that they need greater control over NEC rail
infrastructure to coordinate intercity rail-commuter rail plans. However, as of right now,
there have been only the beginnings of coordination among the northeastern states
(starting with the NEC Infrastructure Master Plan). As a result, designing-in flexibility
within Amtrak to have the option to eventually have state control of infrastructure would
allow Amtrak to begin developing improved high-speed rail in the NEC, but also provides a
opportunity in the future for states to take control of the subsidiary that manages NEC
infrastructure. The CLIOS and scenario planning processes can therefore help identify
appropriate types of flexibility and under what circumstances it might be appropriate to
exercise the flexibility.
There would be advantages and disadvantages to such a flexible approach, some of which
are applicable to providing flexibility in general. The first advantage is that Amtrak could
begin upgrading infrastructure almost immediately. However, the flexibility in the
approach would provide decision-makers some ability to make changes if Amtrak is not
providing adequate program management or otherwise providing poor service. If an
alternative public-ownership structure were pursued immediately, years might go by
before any actual upgrades (incremental or otherwise) take place on the NEC. The second
advantage is that it provides stakeholders ability to compromise. Splitting Amtrak into
separate entities acknowledges the views of both Amtrak supporters (as Amtrak will still
exist) and detractors (as the flexibility provides some potential to reopen the debate about
the future role of Amtrak). One final advantage of this approach is that it allows decision-
makers to gradually change the ownership structure of the NEC and test additional reforms
without having to jump completely to a radically different ownership structure.
There are some disadvantages to this approach, however. Firstly, although many of the
proposals above have inherent value, designing-in and exercising flexibility costs
something. For example, there is added cost to separating the accounting of Amtrak into
profit centers based on NEC operations that may not be needed if Amtrak is otherwise
operating well. Secondly, providing flexibility extends the debate over the future
institutional structure of the NEC. Whilst in the short-term decision makers might be
appeased by the compromise reached, in the long-term, some that are in favor of more
action might reopen the debate over the future role of Amtrak. By contrast, if a completely
MIT HSR/Regions Group Carlson and Pena Chapter 7 – Adding flexibility to the bundles of strategic alternatives
7-11
new company were introduced to manage the NEC, there would likely be no debate over
the future role of that company. As a result, those stakeholders who are stronger
supporters of one vision or the other may view a flexible approach as a threat to achieving
their objectives. One additional disadvantage some of the stakeholders might perceive of
this flexible approach is that change the culture within Amtrak might not radically change,
as some of the institutional reorganization would occur more gradually.
Further research is required to identify some of the key challenges associated considering a
more flexible and fluid approach to transitioning between ownership structures on the
NEC. Nonetheless, we believe there is merit to considering flexibility within the larger
question of how a new institutional organization structure different from Amtrak might
develop. There have been significant efforts to develop and evaluate “conceptual”
ownership structures (PennDesign 2011, Thompson 2005, Robins 2006, ARC 2001).
However, with the exception of Thompson (2005) – which provided a checklist that
outlines the practical steps that would be required to transition into a new ownership
structure – very little work has been done to understand how a new NEC ownership
structure would actually be developed given the positions of the actors on the institutional
sphere. We believe that considering flexibility within the organizational structure is one
pragmatic way to think about the actual process of creating an effective organizational
structure for the NEC.
Modest flexibilities could also be designed into bundle 2. Although initially bundle 2
proposes using a vertically separated ownership structure (in which the infrastructure
owner would be different from the train service providers), flexibility could be designed
into the bundle to allow the infrastructure owner to “buy-back” the access rights of the
train operators midway through their contracts if the train operators are not providing
adequate service. Alternatively, the contract between the public owner and the train
operators could be set up to allow for the cancelling of trackage rights if the train operators
are not providing adequate service. For example, given that in bundle 2, there are multiple
train operators, some of them might not be coordinating with public transit operators and
airlines, resulting in poor intermodal connectivity and, therefore, potentially less than
expected use of the rail system. Alternatively, the intense competition between operators
might lead to poorer overall service quality, which makes high-speed rail less able to
compete with other modes of transportation. Including the ability to buy-back the trackage
rights of these operators would allow the operator to limit the competition on the corridor
if necessary, which would hopefully improve service quality. If the public owner bought-
back all of the access rights, and it could sign a contract with only one operator to provide
service, such that there is no longer any competition in the market, but only for the market
Another form of flexibility that could be designed-into bundle 2 is a well-defined
institutional separation between the public oversight functions within the organization,
and day-to-day infrastructure operations (such as dispatching) and maintenance functions.

MIT HSR/Regions Group Carlson and Pena Chapter 7 – Adding flexibility to the bundles of strategic alternatives
7-12
If, in the future, the infrastructure operator is profitable and there is a desire to sell the
infrastructure operator to the private sector, well-defined separation between the
oversight functions and actual operations and maintenance functions of the existing
organizational structure would make it easier to turn over the latter entities to the private
sector, while still having a public sector oversight group to deal with any remaining
coordination issues. Additionally, any contracts with train operators would also have to
allow for this possibility. Although this flexibility might be useful, it is likely less likely to be
exercised in the short-term as the public sector ownership structure might still be in long-
term agreements with the design-finance-build consortiums responsible for constructing
the new international-quality alignments.
The following Table 7.1 summarizes the institutional structure flexibilities discussed above.
The first column describes what is meant by “designing-in” the flexibility into the bundles
of strategic alternatives for each of the options identified above, and the second column
describes the result from exercising the flexibility. Each row identifies one of the
flexibilities identified above.
Table 7.1: Summary of institutional structure flexibilities
Design-in flexibility Exercise flexibility
Bundle 3 Institute accounting separation within Amtrak and separate NEC operations into separate business units
Separate NEC operations into separate subsidiaries of a larger Amtrak holding company
Separate NEC operations into separate subsidiaries of a larger Amtrak holding company
Take NEC subsidiaries and place them under a new public ownership structure
Bundle 2 Negotiate contracts with train operators that allows public owner to buy-back access rights or cancel access rights if train operators are not providing an adequate level-of-service
Buy-back/cancel access rights from train operators, and sign a contract with only one operator to offer service on the NEC
Design the organizational structure such that there is a well-defined separation between oversight functions and day-to-day operating functions
Include in any contracts with private-partners the ability to sell any assets to the private sector
Sell operating functions to private sector
TECHNOLOGICAL FLEXIBILITY
Another type of flexibility that could be designed-into bundles 2 and 3 is the option to
change from implementing international-quality high-speed rail to incremental high-speed
rail and vice-versa.

MIT HSR/Regions Group Carlson and Pena Chapter 7 – Adding flexibility to the bundles of strategic alternatives
7-13
If bundle 3 were implemented, a flexible approach would focus on upgrades that would
benefit both international-quality and incremental high-speed rail systems. Some examples
of these projects include expanding the capacity of New York Penn Station and its access
tunnels and increasing the capacity of Boston South Station. In addition to upgrading the
NEC infrastructure incrementally, the planning, permitting and design processes associated
with international-quality high-speed rail could be pursued. If this process were to start
soon even if funding is uncertain, in the future, implementing international-quality high-
speed rail would not be delayed (as much) by regulatory and design issues.
However, there are risks involved with starting the planning, permitting and design
process too early: if funding does not become available in the short-term, there would
likely need to be significant rework done as situations will have changed in the long-term.
For example, if maglev, or a similar advanced technology become cheaply available before
international-quality high-speed rail is implemented, the planning and design process
would likely have be undertaken again to consider these alternatives. As a result, failing to
exercise this option in the long-term could result in needless expense, but in general, the
planning and design process is relatively inexpensive compared to actual construction
costs.
If bundle 2 were chosen initially, flexibility could be designed-in by allowing the
construction of the new alignment in phases. For example, a section from New York to
Philadelphia could be constructed first, and high-speed rail could run between the two
cities. Furthermore, by connecting the new alignment with the existing network, the trip
time for train travel between New York and Washington would also be reduced. Amtrak
(2010) presents a potential phasing scheme in their report, which is included as Figure 7.2.

MIT HSR/Regions Group Carlson and Pena Chapter 7 – Adding flexibility to the bundles of strategic alternatives
7-14
Figure 7.2: Potential phasing scheme of international-quality high-speed rail (Source: Amtrak 2010)
Before continuing, we note that the idea of phasing the construction of an international-
quality high-speed rail alignment is not a new idea. However, we believe that more
emphasis needs to be given to the idea of phasing for the flexibility it provides.
Implementing international-quality high-speed rail in the NEC does not need to be looked
at as an overall project that will only improve the transportation system if over $100 billion
is spent, but rather, as a series of “smaller” projects that – individually – can improve the
NEC transportation system.9
There are several useful ways that the flexibility from phasing the construction of
international-quality high-speed rail can be exercised, all of which could be useful in a
9 For example, an international case of this type of flexibility occurs in the French TGV system. Travelers taking a TGV trip between Paris and Nice will travel on an international-quality high-speed rail alignment between Paris and Marseille, but, while staying on the same train, will travel on a conventional rail network between Marseille and Nice. Even though the international-quality link does not go all the way to Nice (and may not be built for several years), the upgraded link still provides value to those travelers continuing to Nice.

MIT HSR/Regions Group Carlson and Pena Chapter 7 – Adding flexibility to the bundles of strategic alternatives
7-15
specific situation. For the purposes of the rest of this discussion, we will assume that the
infrastructure owner of the NEC has built an international-quality high-speed rail
alignment from New York to Philadelphia, and trains continuing to Washington, DC and
vice-versa can use the new alignment. Some specific upgrades to capacity south of
Philadelphia have also been completed, such as fixing the Baltimore and Potomac tunnels
in Baltimore, completing station capacity upgrades in Washington, DC and installing an
upgraded catenary system on the existing alignment.
The “optimistic” outcome of this situation is that demand for the higher-speed trip between
Philadelphia and New York is strong, and that demand for service between Washington, DC
and New York also grows. In addition, ideally the construction of the upgrades finishes on
time and within budget, although if the new service is successful, then these factors are
somewhat less critical. By attracting new ridership to this new international-quality
segment, a new group of transportation users that support high-speed rail will be created.
As a result, not only has the first phase of the operation demonstrated that international-
quality high-speed rail can attract sufficient demand, it has also generated the support of a
large group of travelers that can now be considered to be an actor with a legitimate claim
to see the successful continued operation and perhaps expansion of international-quality
high-speed rail. Collectively, these two factors combine to create more support to
implement the next phases of international-quality high-speed rail. Given that the next
phases of the implementation (particularly between New York and Boston, because of the
new right-of-way required) are likely more challenging, this support will likely prove
useful to moving the rest of the project forward.
By contrast, if a “pessimistic” outcome occurs and demand for the service is weak, or there
is an economic recession that prevents further expansion of the international-quality high-
speed rail network, the flexibility that comes from constructing the new alignment in
phases is also useful, as the infrastructure owner implementing the new alignment has the
option to stop expanding the new international-quality alignment. There is still value
associated with only completing the first phase, but further losses are prevented. As a
result, flexibility allows the infrastructure owner to take advantage of larger than expected
demand, but reduces the probability of larger losses.
There are risks, however, with implementing international-quality high-speed rail in
phases. Even if the high-speed rail system turns out to capture a large portion of the
demand, there might still be detractors of high-speed rail that wish to prevent it from going
ahead. Conversely, if it does not succeed at capturing a large share of the demand and is
deemed a “failure,” detractors might also be able to associate a stigma with high-speed rail
and large public-works projects in general such that other future large transportation
projects that could be successful are not pursued. However, being able to make tangible
progress and going back to bundle 3, the status quo, will certainly minimize the damage of
a failure like the one presented. As a result, although flexibility mitigates potential
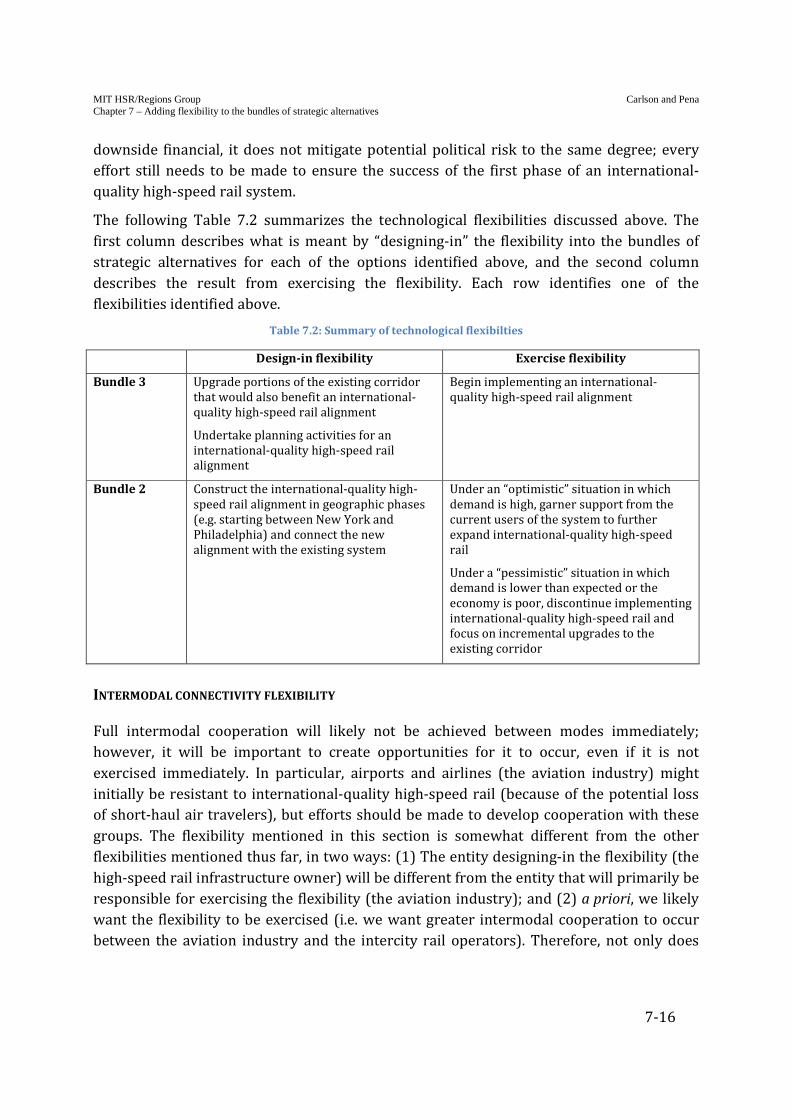
MIT HSR/Regions Group Carlson and Pena Chapter 7 – Adding flexibility to the bundles of strategic alternatives
7-16
downside financial, it does not mitigate potential political risk to the same degree; every
effort still needs to be made to ensure the success of the first phase of an international-
quality high-speed rail system.
The following Table 7.2 summarizes the technological flexibilities discussed above. The
first column describes what is meant by “designing-in” the flexibility into the bundles of
strategic alternatives for each of the options identified above, and the second column
describes the result from exercising the flexibility. Each row identifies one of the
flexibilities identified above.
Table 7.2: Summary of technological flexibilties
Design-in flexibility Exercise flexibility
Bundle 3 Upgrade portions of the existing corridor that would also benefit an international-quality high-speed rail alignment
Undertake planning activities for an international-quality high-speed rail alignment
Begin implementing an international-quality high-speed rail alignment
Bundle 2 Construct the international-quality high-speed rail alignment in geographic phases (e.g. starting between New York and Philadelphia) and connect the new alignment with the existing system
Under an “optimistic” situation in which demand is high, garner support from the current users of the system to further expand international-quality high-speed rail
Under a “pessimistic” situation in which demand is lower than expected or the economy is poor, discontinue implementing international-quality high-speed rail and focus on incremental upgrades to the existing corridor
INTERMODAL CONNECTIVITY FLEXIBILITY
Full intermodal cooperation will likely not be achieved between modes immediately;
however, it will be important to create opportunities for it to occur, even if it is not
exercised immediately. In particular, airports and airlines (the aviation industry) might
initially be resistant to international-quality high-speed rail (because of the potential loss
of short-haul air travelers), but efforts should be made to develop cooperation with these
groups. The flexibility mentioned in this section is somewhat different from the other
flexibilities mentioned thus far, in two ways: (1) The entity designing-in the flexibility (the
high-speed rail infrastructure owner) will be different from the entity that will primarily be
responsible for exercising the flexibility (the aviation industry); and (2) a priori, we likely
want the flexibility to be exercised (i.e. we want greater intermodal cooperation to occur
between the aviation industry and the intercity rail operators). Therefore, not only does
MIT HSR/Regions Group Carlson and Pena Chapter 7 – Adding flexibility to the bundles of strategic alternatives
7-17
the flexibility need to be designed-in, but also steps need to be taken to encourage that it is
exercised.
For example, if bundle 2 were implemented, it would be important to connect NEC corridor
airports to the new rail system alignment, even if airlines are reluctant to coordinate with
the rail system. From Chapter 5, the two main proposals for international-quality high-
speed rail in the NEC both include additional airport stops along their alignments. The
Amtrak (2010) proposal contains an additional airport stop at New York Westchester
County White Plains Airport (HPN) and Philadelphia International Airport (PHL). The
PennDesign (2011) study contains an additional stop at Long Island MacArthur Airport
(ISP), JFK International Airport in New York (JFK) and PHL. Although connecting these
airports to the new alignment is subject to tradeoffs (both in terms of what airports and
stations to provide, as well as cost), these intermodal connections would provide airlines
and the high-speed rail operator(s) reason to pursue cooperation agreements (such as
codeshare train trips, for example). Although the aviation industry might initially be
resistant to high-speed rail, good physical connectivity between airports and the rail
system should still be pursued.
Additionally, steps should be taken to ensure that this cooperation develops between the
aviation industry and high-speed rail operators both before and after high-speed rail is
constructed. Firstly, the high-speed rail infrastructure authority, when it is planning the
new alignment, should try to reach out to the aviation industry to give them the
opportunity to provide useful input into the planning process. Secondly, some research
should be undertaken to study how implementing high-speed rail would benefit or harm
air passenger demand, and how airports and airlines can best respond. For example,
Clewlow found that in Europe, high-speed rail has helped free up capacity for the growth of
low-cost, medium-haul air travel by reducing the demand (and hence number of flights) for
short-haul routes.10 Further research should be undertaken to better understand the
benefits and drawbacks to airlines associated with increasing use of high-speed rail in the
NEC. These steps will hopefully ensure that intermodal connectivity fully develops (i.e. that
after the physical connections are in place between the rail system and airports, that
airlines and rail operators cooperate to offer better transfers between the two systems).
Although in the above explanation, we considered bundle 2, flexibility could also be
implemented in bundle 3 except that new physical connectivity between airports and the
high-speed rail system would not be provided be provided; as a result, the flexibility that is
provided is not as useful immediately. However, if bundle 2 were later implemented, the
10 Regina Clewlow, in a presentation to the research group at MIT, “Energy Implications of High-Speed Passenger Transportation: Examining Aviation, High-Speed Rail, and their Climate Impacts” on November 22, 2012.

MIT HSR/Regions Group Carlson and Pena Chapter 7 – Adding flexibility to the bundles of strategic alternatives
7-18
earlier efforts to engage the aviation industry would become more useful, as additional
physical connectivity could be provided.
The following Table 7.3 summarizes the intermodal connectivity flexibilities discussed
above. The first column describes what is meant by “designing-in” the flexibility into the
bundles of strategic alternatives for each of the options identified above, and the second
column describes the result from exercising the flexibility. Each row identifies one of the
flexibilities identified above.
Table 7.3: Summary of intermodal connectivity flexibilities
Design-in flexibility Exercise flexibility
Bundle 3 Pursue cooperation with airlines and other modes of transportation by including them in the planning process
Conduct further research on the implications of international-quality high-speed rail on the demand for air travel
The airlines and/or public transit operators decide to cooperate more with high-speed rail operators.
Bundle 2 Provide physical connectivity between NEC airports and the new international-quality high-speed rail alignment
Include the aviation industry in the planning process for the new corridor
Conduct further research on the implications of international-quality high-speed rail on the demand for air travel
Airlines (and the high-speed rail train operator) decide to cooperate more (e.g. offer codeshares, etc.)
USING FLEXIBILITY IN THE BUNDLES BASED ON DIFFERENT SCENARIOS OF THE FUTURE
In this section, we present how the flexibility options may be played out under a given
scenario. In particular, we want to show the differences between designing-in flexibility
and exercising the flexibility in those cases in which the circumstances are suitable.
Tables 7.4 and 7.5 show a plausible set of flexibility options to design-in and exercise for
each of the two bundles proposed in Chapter 3, and under each scenario developed in
Chapter 6. The main advantage provided by the inclusion of flexibility in the bundles is that
the decision maker may be able to alter the bundles to better adapt to the circumstances.
In particular, the economic recession situation presented in scenario 1 can be handled
delaying many of the investment decisions under bundles 2 and 3. In addition, since these
investments are planned to obtain tangible results with the resources used, social and
political support to HSR along the period can be ensured. Under scenario 2, despite the
political support at the first time period might not be as positive as needed, the increase of
the demand caused by both the economic growth and the enhancement of the economic
activity and by the improvement of trip attributes obtained with careful planned initial

MIT HSR/Regions Group Carlson and Pena Chapter 7 – Adding flexibility to the bundles of strategic alternatives
7-19
investments in HSR, will ensure higher levels of political support in the next time periods.
Finally, under scenario 3, the dramatic decrease of HSR construction cost, together with the
economic recovery might impulse the investment on international-standard HSR.
The way to interpret tables 7.4 and 7.5 is the following: each of the tables is divided in two
pages. The first row of table 7.4 (pages 7-22 and 7-23) represents which flexibilities are
designed in bundle 2 under scenario 1 at different time periods. In particular, we cannot
exercise any flexibility at time 0 (now) because we have not designed in the bundles any
flexibility yet. At time 0 (now) the decision maker will not have any information about the
scenario, so the decisions of the flexibilities to design in the bundle will be identical for
each scenario. In this case, different types of institutional (IF), technological (TF) and
intermodal cooperation (ICF) flexibilities are designed into the bundle. In the first time
period, after having some information about how the situation have evolved, and after two
years of economic recession, the decision maker might decide to exercise the technological
flexibility (TF) designed, and focus exclusively in constructing HSR from New York to
Philadelphia. The situation will still be similar to the initial situation, so they might not
identify new flexibilities to design in the bundles. In time period 2 (four years later), since
the economic recession continues, the decision makers might want to design new
flexibilities in the bundle to be able to stop the construction of international-standards HSR
and to continue with bundle 3 (upgrade the system) instead. This flexibility will be
exercised in time period 3, when decision makers will also design in new technological
flexibilities allowing to focus on those upgrades that might be especially helpful in case that
they are able to continue constructing international-standard HSR in the future. The last
column in table 7.4 presents the evolution of the system that we might expect to observe
after the last decision stage.
CONCLUSION
Given that the bundles of strategic alternatives will be implemented over several decades,
we felt that it was important to think of how the bundles could evolve in the future to
respond to new situations. We also recognize that a bundle will not be implemented at time
zero and remain unchanged until it is fully implemented: rational managers will likely
make changes to the bundles over time. Finally, we wanted to think about whether high-
speed rail itself would provide greater opportunities in the future to improve the
transportation system to respond to changing conditions.
In order to think about how the bundles of strategic alternatives might change over time,
we identified different types of flexibilities that could be designed-into the bundles of
strategic alternatives, using the “real options” framework developed by de Neufville et al.
With real options a potential option holder (decision-maker) may pay extra now in order to
create or maintain the possibility of taking a potential action in the future. We recognize,

MIT HSR/Regions Group Carlson and Pena Chapter 7 – Adding flexibility to the bundles of strategic alternatives
7-20
however, that all of the flexibilities discussed in this document are “complex,” as described
by McConnell (2007). In some of the flexibilities considered, the entities that design-in and
exercise the option might be different; in others, the price to exercise the option might be
unknown. As a result, we know that while many of the flexibilities that we identified in this
chapter might sound good in theory, there are potentially hurdles associated with applying
them in practice.
In order to identify some desired flexibility, we used the thinking resulting from the
discussion of the high-impact subnetworks, the development of the scenarios of the future
and the simulation of the bundles of strategic alternatives within the scenarios. We then
used the insights that we gleaned from these techniques, as well as our own research and
judgment about what might be feasible, to identify potential flexibilities in the bundles.
We first looked at how flexibility could be designed-into the strategic alternatives related
to the institutional structure, recognizing that there is significant debate regarding Amtrak’s
ability to manage upgrades to the NEC. We identify that there might be several ways to
break Amtrak into separate entities (such as one for NEC Infrastructure Management and
another for NEC Train Operations), which would provide decision-makers greater ability to
create a new “anything-but-Amtrak” institutional structure if they choose to exercise that
option. However, it allows Amtrak to begin trying to implement high-speed rail in the NEC
almost immediately, without having to wait as long for a new institutional structure to be
put in place first.
We then considered technological flexibility, and options to phase the construction of both
an incremental or international-quality high-speed rail system. In the case of international-
quality high-speed rail in particular, there is significant uncertainty regarding future
demand. If demand were much lower than expected, the infrastructure owner would not
incur as big of losses (as trying to build out the system all at once), as the infrastructure
owner could stop construction of the new international-quality alignment. There would
still be inherent value to this construction, however, as trains would be able to run on the
new alignment for part of the route (from Philadelphia to New York, for example), and thus
trip time would be reduced. If demand were higher than expected, then the new riders of
the high-speed rail system would represent a new stakeholder group who could push for
the further expansion of the system.
Thirdly, we discussed possible flexibility that could be included to encourage intermodal
connectivity to develop. Initially, the aviation industry might resist the development of
high-speed rail; however efforts should still be made to ensure that there is physical
connectivity between the rail system and airports. To encourage airlines to exercise the
flexibility and pursue greater cooperation with high-speed rail operations, there should be
greater study of the potential benefits or harm that high-speed rail might have on the
demand of airlines.
MIT HSR/Regions Group Carlson and Pena Chapter 7 – Adding flexibility to the bundles of strategic alternatives
7-21
The possibility of adapting the bundles to new situations by designing-in different types of
flexibility and exercising them when the circumstances are appropriate allows us to get
reasonable results. Compared to the results obtained in Chapter 6, in which the evolution of
the bundles were hardly conditioned to the evolution of the future, flexibility will allow the
decision maker to get tangible results under each possible future realization of the different
uncertainties.
Ultimately, we feel that scenario planning and the “real options” flexibility framework have
allowed us to think more deeply about the future and how high-speed rail might fit in. For
the first phase of this project, we have typically used the insights from the CLIOS
representation to help guide the scenario planning and flexibility-identification techniques.
In a future phase of this process, we would like to use these techniques to help guide the
development of the CLIOS representation, therefore creating a virtuous cycle of creative
thinking that will ultimately allow us to think more deeply about the NEC and help us to
develop new insights.
This chapter concludes the bulk of the research activities for this phase of the project. The
next chapter discusses some of the important quantitative models that would potentially
need to be considered in further research activities.
REFERENCES
Amtrak. 2005. Strategic Reform Initiatives and FY06 Grant Request. Amtrak: Washington,
DC.
Amtrak. 2010. Vision for High-Speed Rail in the Northeast Corridor. Amtrak: Washington,
D.C.
Amtrak Reform Council. 2001. Intercity Rail Passenger Service in America: Status,
Problems and Options for Reform. Amtrak Reform Council: Washington, DC.
de Neufville, R. and Scholtes, S. 2011. Flexibility in Engineering Design. MIT Press:
Cambridge, MA.
Gordon, D. 1991. Steering a New Course: Transportation, Energy and the Environment.
Union of Concerned Scientists.
McConnell, J.B. 2007. A Life-Cycle Flexibility Frameworkfor Designing, Evaluating and
Managing "Complex" Real Options: Case Studies in Urban Transportation and Aircraft
Systems. MIT PhD dissertation.
NEC Master Plan Working Group. 2010. The Northeast Corridor Infrastructure Master Plan.
Amtrak: Washington, DC.

MIT HSR/Regions Group Carlson and Pena Chapter 7 – Adding flexibility to the bundles of strategic alternatives
7-22
PennDesign. 2011. High-Speed Rail in the Northeast Megaregion: From Vision to Reality.
University of Pennsylvania School of Design: Philadelphia, PA.
Robins, M.E. 2006. Northeast Corridor Action Plan: A Call for a New Federal-State
Partnership. Alan M. Voorhees Transportation Center: New Brunswick, NJ.
Sussman, J. et al. 2009. The CLIOS Process: A User’s Guide – February 2009.
Schwartz, P. 1996. The Art of the Long View: Planning for the Future in an Uncertain World.
Doubleday: New York, NY.
Thompson, L.S. 2005. Options for the Federal Ownership of Northeast Corridor (NEC)
Infrastructure.
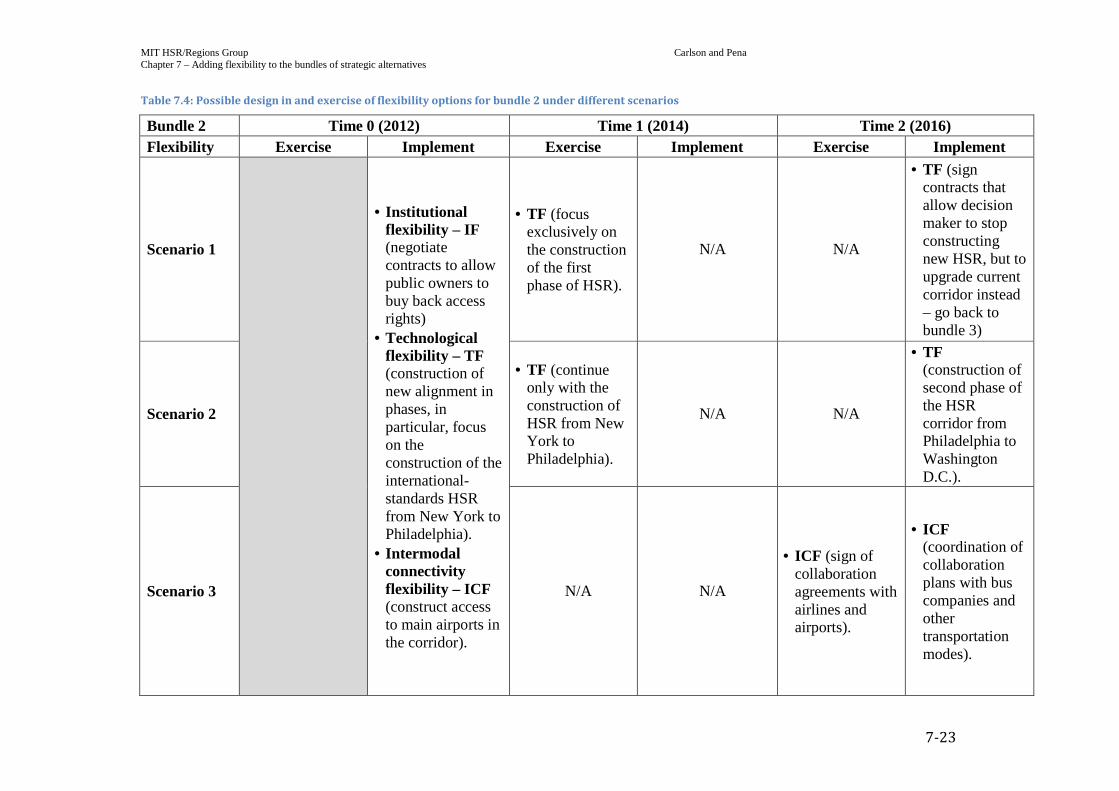
MIT HSR/Regions Group Carlson and Pena Chapter 7 – Adding flexibility to the bundles of strategic alternatives
7-23
Table 7.4: Possible design in and exercise of flexibility options for bundle 2 under different scenarios
Bundle 2 Time 0 (2012) Time 1 (2014) Time 2 (2016) Flexibility Exercise Implement Exercise Implement Exercise Implement
Scenario 1
• Institutional flexibility – IF (negotiate contracts to allow public owners to buy back access rights)
• Technological flexibility – TF (construction of new alignment in phases, in particular, focus on the construction of the international-standards HSR from New York to Philadelphia).
• Intermodal connectivity flexibility – ICF (construct access to main airports in the corridor).
• TF (focus exclusively on the construction of the first phase of HSR).
N/A N/A
• TF (sign contracts that allow decision maker to stop constructing new HSR, but to upgrade current corridor instead – go back to bundle 3)
Scenario 2
• TF (continue only with the construction of HSR from New York to Philadelphia).
N/A N/A
• TF (construction of second phase of the HSR corridor from Philadelphia to Washington D.C.).
Scenario 3 N/A N/A
• ICF (sign of collaboration agreements with airlines and airports).
• ICF (coordination of collaboration plans with bus companies and other transportation modes).

MIT HSR/Regions Group Carlson and Pena Chapter 7 – Adding flexibility to the bundles of strategic alternatives
7-24
Table 7.4: Possible design in and exercise of flexibility options for bundle 2 under different scenarios
Bundle 2 Time 3 (2020) Time 4 (2028) Future Evolution
Flexibility Exercise Design in Exercise Design in
Scenario 1
• TF (go back to bundle 3, commitment with successive upgrades of the NEC).
• TF (start upgrading the system on those points in which the upgrades might be helpful for future construction of HSR).
N/A N/A
• Although the economic situation is not favorable to proceed with HSR, there will be social and political support to railway transportation, allowing HSR in the future.
Scenario 2
• TF (focus on the construction of the second phase of the HSR corridor from Philadelphia to Washington D.C.).
• TF (continue with the construction of the HSR corridor from Boston to New York).
• TF (continue with the construction of the HSR corridor).
• ICF (sign of collaboration agreements with airlines and airports).
• ICF (coordination of collaboration plans with bus companies and other transportation modes).
• After the success of different HSR phases, and the identification of intermodal cooperation opportunities, the transportation service in NEC will improve, and so the transportation demand.
Scenario 3
• ICF (cooperation plans with bus companies for services from Washington D.C. to North Carolina and other parts of the NEC).
• TF (continue with the construction of the second phase of the HSR corridor from Philadelphia to Washington D.C.).
• TF (focus on the construction of the second phase of the HSR corridor).
• TF (continue with the construction of the HSR corridor from Boston to New York)
• ICF (agreement with bus companies for services from Boston to Maine).
• Complete success of HSR implementation. The construction of this corridor will inspire the construction of other HSR corridors in the US.
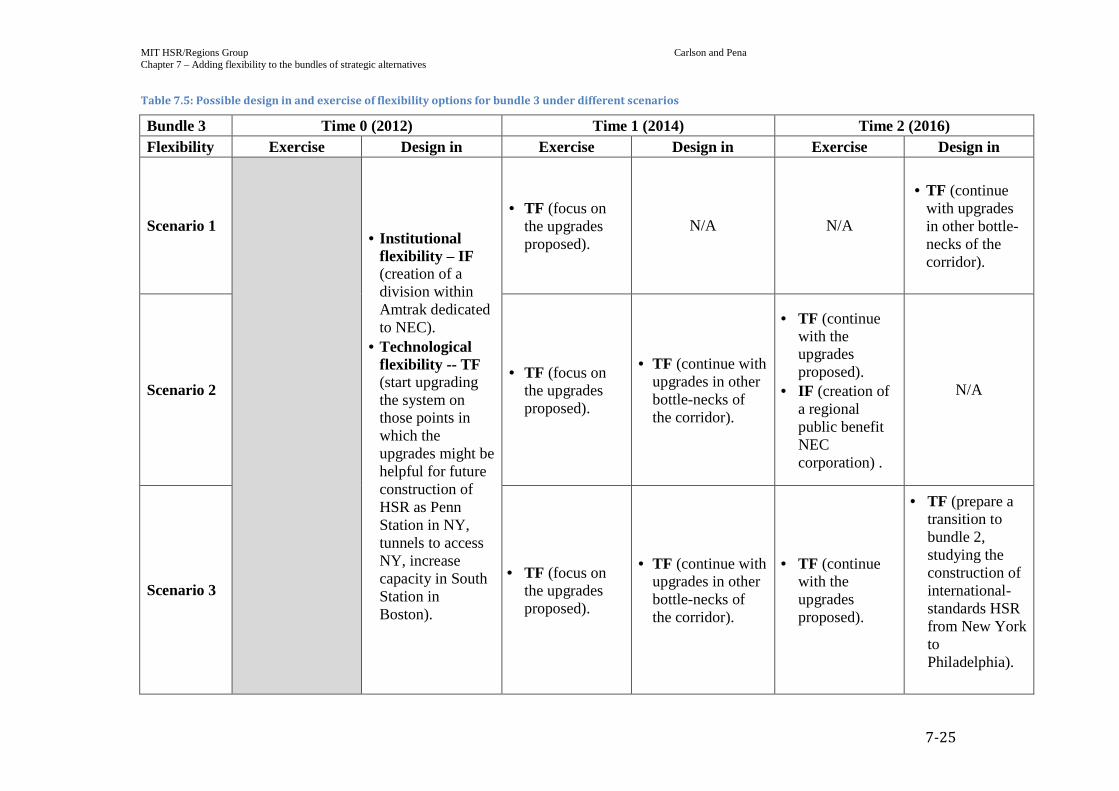
MIT HSR/Regions Group Carlson and Pena Chapter 7 – Adding flexibility to the bundles of strategic alternatives
7-25
Table 7.5: Possible design in and exercise of flexibility options for bundle 3 under different scenarios
Bundle 3 Time 0 (2012) Time 1 (2014) Time 2 (2016) Flexibility Exercise Design in Exercise Design in Exercise Design in
Scenario 1
• Institutional flexibility – IF (creation of a division within Amtrak dedicated to NEC).
• Technological flexibility -- TF (start upgrading the system on those points in which the upgrades might be helpful for future construction of HSR as Penn Station in NY, tunnels to access NY, increase capacity in South Station in Boston).
• TF (focus on the upgrades proposed).
N/A N/A
• TF (continue with upgrades in other bottle-necks of the corridor).
Scenario 2 • TF (focus on
the upgrades proposed).
• TF (continue with upgrades in other bottle-necks of the corridor).
• TF (continue with the upgrades proposed).
• IF (creation of a regional public benefit NEC corporation) .
N/A
Scenario 3 • TF (focus on
the upgrades proposed).
• TF (continue with upgrades in other bottle-necks of the corridor).
• TF (continue with the upgrades proposed).
• TF (prepare a transition to bundle 2, studying the construction of international-standards HSR from New York to Philadelphia).
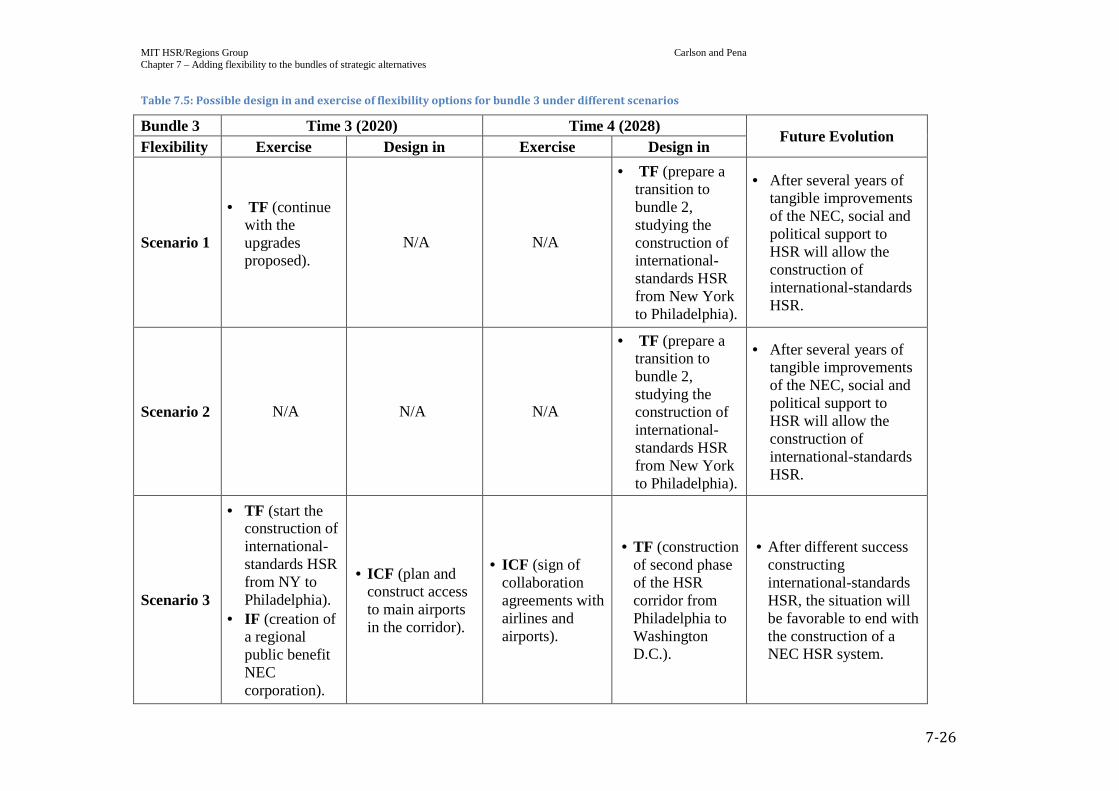
MIT HSR/Regions Group Carlson and Pena Chapter 7 – Adding flexibility to the bundles of strategic alternatives
7-26
Table 7.5: Possible design in and exercise of flexibility options for bundle 3 under different scenarios
Bundle 3 Time 3 (2020) Time 4 (2028) Future Evolution
Flexibility Exercise Design in Exercise Design in
Scenario 1
• TF (continue with the upgrades proposed).
N/A N/A
• TF (prepare a transition to bundle 2, studying the construction of international-standards HSR from New York to Philadelphia).
• After several years of tangible improvements of the NEC, social and political support to HSR will allow the construction of international-standards HSR.
Scenario 2 N/A N/A N/A
• TF (prepare a transition to bundle 2, studying the construction of international-standards HSR from New York to Philadelphia).
• After several years of tangible improvements of the NEC, social and political support to HSR will allow the construction of international-standards HSR.
Scenario 3
• TF (start the construction of international-standards HSR from NY to Philadelphia).
• IF (creation of a regional public benefit NEC corporation).
• ICF (plan and construct access to main airports in the corridor).
• ICF (sign of collaboration agreements with airlines and airports).
• TF (construction of second phase of the HSR corridor from Philadelphia to Washington D.C.).
• After different success constructing international-standards HSR, the situation will be favorable to end with the construction of a NEC HSR system.

MIT HSR/Regions Group Carlson, Archila and Pena Chapter 8 – Quantitative models needed for detailed analysis
8-1
Chapter 8
Quantitative models needed for detailed analysis S. Joel Carlson | Andrés F. Archila | Maite Peña-Alcaraz
CONTENTS
Introduction
Demand forecasting model
Benefits model
Cost model
Energy consumption/air emissions model
Regional economic model
Other “technical” models
Economic (Benefit-Cost) Analysis
Financial Analysis
References
INTRODUCTION
In the initial, August 17, 2011 project proposal to JITI, we outlined six parts to be included
in the “conceptual framework.” Item (6.) of this list stated that the conceptual framework
would “[identify the] quantitative models needed to study costs, demand, economic and
environmental impacts.” This document provides a summary of the quantitative models,
qualitative frameworks and other evaluation techniques needed to further study the
Northeast Corridor (NEC). Before introducing these models, however, we would like to
provide the distinction between the terms “framework,” and “model,” and explain how the
two fit together in the CLIOS Process.
Although the terms model and framework may appear to have interchangeable meaning,
they are intended to present two different types of analysis techniques. According to
Sussman (2000), a model is a “mathematical representation of reality that is quantitative in
nature.” For example, a demand-forecasting model, which is intended to represent the
transportation-related choices made by individuals, would be considered a model, as it is a
quantitative representation of reality. By comparison, a framework is defined as a “way
[usually qualitative] of organizing our thinking about a complex system – not necessarily
numerically, but in an organized form” (Sussman 2000). For example, the Mitchell

MIT HSR/Regions Group Carlson, Archila and Pena Chapter 8 – Quantitative models needed for detailed analysis
8-2
Stakeholder typology presented in the interim report is a framework, as it provides a
qualitative methodology with which to study the relationship between stakeholders. In a
similar fashion, the conceptual framework, which incorporates the CLIOS representation
and the models and frameworks identified in this document, provide us a way to organize
our study of the NEC.
Up to this point in the research, the contents of the conceptual framework are almost
exclusively qualitative. We have developed a CLIOS representation, bundles of strategic
alternatives and a set of goals, objectives and performance measures by blending
information gleaned from a literature review of information about the NEC and of the
behaviour of the transportation, the land-use, economic, environment and energy systems,
with our own knowledge and judgment. Given that the transportation system in the NEC
has been extensively studied, we have initially tried to use this high-level qualitative
approach in order to help us better understand and develop fresh insights into the NEC
transportation system. As we develop these insights and wish to study them further, we
will begin using some of the more detailed models identified in this chapter.
The models that we have listed are intended to represent a fairly comprehensive list that
would be required to study high-speed rail in the NEC in more depth. However, in some
cases, it is likely not feasible to undertake some of the studies that would be required to
implement some of the models identified in this chapter given the significant amount of
resources required. As a result, where possible, an example of a study that includes a given
model would provide has been presented. Nonetheless, there is potentially greater benefit
in considering whether the model and assumptions used in the identified studies were the
most appropriate with which to study the NEC. Additionally, there is benefit to considering
which models are most relevant to which stakeholders in order to further refine the CLIOS
Representation.
Regardless of the model being considered, we will also need to be cognizant of the
significant uncertainties associated with the estimate they produce. To give an example of
the significant uncertainty associated with the forecasts associated with a project of this
magnitude, Bain (2009) found that the actual traffic volumes during the first year of
operation 104 international toll roads fell between 14% and 151% of the traffic volume
predicted by traffic and revenue studies. Furthermore, this study found that, on average,
actual traffic volumes turned out to be only 77% of the predicted traffic demand. Given that
the demand for international-equality high-speed rail is untested in the US, it is reasonable
to assume that the magnitude of the uncertainty associated with the predicted high-speed
rail demand (and other important estimates) will be similar to that shown by Bain with
regard to toll roads. As a result, we will be sure to keep in mind that a point estimates are
not sufficient given the significant levels of uncertainty associated with implementing high-
speed rail.

MIT HSR/Regions Group Carlson, Archila and Pena Chapter 8 – Quantitative models needed for detailed analysis
8-3
DEMAND FORECASTING MODEL
Any subsequent quantitative analysis of high-speed rail in the NEC would require an
appropriate demand-forecasting model. It is likely the most important analysis tool
required for subsequent study, as its outputs provide inputs to most of the other models.
The most exhaustive method to forecast demand involves using some variation of a four-
step planning study. The four steps of this technique include: (1) Trip generation –
quantifying the trip production (i.e. from households) and trip attraction (i.e. to
businesses) in each zone; (2) Trip distribution – using the generalized cost between zones
to develop an origin-destination (O-D) matrix of trips between zones; (3) Modal split –
using a logic discrete choice model or similar technique based on the utility of each mode to
determine the likelihood of an individual selecting a given mode; and (4) Network
assignment – assigning a given trip on a given mode to a link on the network. The California
High-Speed Rail Project used a similar approach to this for their 2012 Business Plan, except
that the first two steps used involved determining trip frequency and destination choice
(Parsons Brinkerhoff 2011a). This technique also often uses stated preference surveys to
assess traveller preference for the future hypothetical service.
Another approach used by FRA (1997) to forecast demand for a new high-speed speed
ground transportation (HSGT) system1 included three steps: (1) Project likely traffic
volumes for all existing traffic modes (i.e. excluding high-speed ground transportation); (2)
Apply a diversion model based on the utilities of each mode to estimate the expected
demand for HSGT; and (3) Estimate the induced demand due to the introduction of HSGT.
Although this approach is somewhat less onerous as the four-step model, it still requires a
significant amount of data and the development and calibration of several models.
Given the significant amounts of data and analysis work required to complete a demand
study, forecasts from other sources will likely be required to complete this project. In
addition to the FRA (1997) Commercial Feasibility Study for HSGT noted above, both
Amtrak (“Vision for High-speed Rail”) (2010) and the University of Pennsylvania School of
Design (PennDesign) (2011) have conducted planning studies to assess the demand for
international high-speed rail in the NEC based on their own proposals. Both the FRA (1997)
and the Amtrak (2010) study present aggregate results, whereas the University of
Pennsylvania study (2010) provides a more disaggregate breakdown of trips generated per
city and of modal split in the appendix. Whilst these studies focus more on international-
quality high-speed rail, the NEC Master Plan Working Group “Northeast Corridor
1 The term high-speed ground transportation is intended to refer to traditional steel-
wheels-on-steel-rails high-speed rail as well as magnetic levitation (maglev) technologies.
Given that we are not assessing maglev technology, at least at this stage in the research
project, where the term HSGT is used, it can be read to just include high-speed rail.

MIT HSR/Regions Group Carlson, Archila and Pena Chapter 8 – Quantitative models needed for detailed analysis
8-4
Infrastructure Master Plan” (2010) provides a forecast of future demand for incremental
high-speed rail on the NEC.
BENEFITS MODEL
Once the demand for the system has been forecasted, the social benefits resulting from the
implementation of high-speed rail need to be computed. FRA (1997) defines the following
categories of direct benefits that can be used to assess a potential HSGT project:
“Benefits to HSGT users,” which is composed of the:
“Benefits for which users must pay,” which equals the revenue gained by
the high-speed rail operator through fares; and,
“The users’ consumer surplus,” which represents the difference between
the generalized costs2 those users of a new HSGT system would be willing to
pay and the generalized cost that they actually pay, summed over all users.
“Benefits to the public at large” which include all benefits received by the public at
large who are not users of the HSGT system, such as a reduction in congestion on
competing modes, a reduction in environmental emissions, etc.
Other than the revenue benefits, which will be discussed in more depth under “Financial
Analysis”, the primary benefits resulting from a faster mode of transportation come from
the trip time savings. This type of savings falls under the category of “the users’ consumer
surplus.” In order to value these savings, an estimation of the value of time (VOT) of the
travellers is required, which is a function of3:
• Trip purpose (e.g. leisure, business, commuting)
• Trip segment (walk, wait, in-vehicle time)
• Vehicle type (e.g. truck versus auto)
• Socioeconomic group
• Relative time savings (i.e. a 5 minute time savings is more significant on a 30 minute
trip than a 5 minute savings on a 2 hour trip)
2 The generalized cost includes factors such as travel time, reliability, fare, etc.
3 Adapted from: Lance Neumann. MIT 1.201 – Project Evaluation Lecture, December 1,
2011.

MIT HSR/Regions Group Carlson, Archila and Pena Chapter 8 – Quantitative models needed for detailed analysis
8-5
By creating a model to combine the demand for each of the modes with the estimated
VOTs, the change in consumer surplus resulting from the implementation of high-speed rail
can be calculated.4
Another social benefit from implementing high-speed rail is a reduction in transportation
accidents (and hence fatalities, injuries and property damage), which is a benefit to the
public at large. A model to calculate this benefit would include the respective demands for
each of the modes, the accident rate per mode, and a monetary valuation of the benefit per
accident avoided.
The FRA (1997), Amtrak (2010) and PennDesign (2011) have all created benefits models to
study high-speed rail in the NEC. The PennDesign’s study (2010) provides the most
background information regarding the assumptions used in their study.
Creating a benefits model would be a significant undertaking. However, there will be some
merit to assessing the assumptions used by each of these studies, and also to further
refining the CLIOS-based conceptual framework to understand what benefits are important
to what stakeholders.
COST MODEL
Cost models are required to development cost estimates for the construction and operating
cost of a potential high-speed rail system.
There are three broad categories of costing models that can be used to develop a cost
estimate: accounting, engineering and econometric. The accounting model records costs
from an operating system and assigns these costs to a given activity. Given that a true high-
speed rail line is not operating in the NEC, this methodology has limited applicability to this
project, other than as a potential source of information for other estimate techniques.
Engineering techniques, “use[s] knowledge of technology, operations, and prices and
quantities of inputs” in order to determine a cost estimate constructing and operating the
system. For example, an engineering estimate of construction costs would try to quantify
all the components in a design, and using the cost of each component, develop an estimate
of the total system cost. Finally, econometric models use statistical approaches to estimate
the cost of a system given a certain set of variables. Unlike in an engineering estimate, the
4 Although this explanation seems to imply that calculating the value of time is a
straightforward procedure, as VOT varies significantly between individuals, determining
appropriate VOT values to use in the analysis could be a challenging procedure in its own
right.

MIT HSR/Regions Group Carlson, Archila and Pena Chapter 8 – Quantitative models needed for detailed analysis
8-6
variables in an econometric model are generally aggregated significantly (e.g. it includes
costs of “labor” or “capital” – which have limited physical significance) 5.
During the next phase of the project, a set of high-level models that blend aspects of
engineering cost estimates (in that it does take into account the physical characteristics of
the system) and econometric estimates (in that it aggregates the costs of the important
variables significantly) are required to estimate the capital, operating and maintenance
costs. In these models, broad explanatory variables would be used, such as “route-
kilometers of track” or “speed of service” in order to assign a cost to the different strategic
alternatives. Unit costs identified in some of the reports below or from systems
internationally could be used to help calibrate the model. In order to complete these cost
estimates, the strategic alternatives first need to be refined to include specific routes and
service plans. Once these aspects of the strategic alternatives are defined, the values of the
explanatory variables, such as the length of the corridor, trainset miles, etc. can be
measured. Inputting these values into these models would then produce capital, operating
and maintenance cost estimates.
FRA (1997), Amtrak (2010), the NEC Infrastructure Master Plan Working Group (2010)
and the PennDesign include a cost estimation of their proposals for high-speed rail in the
NEC. The FRA (1997) and Amtrak (2010) studies provide largely aggregate information
regarding the costs of the alternative that they proposed. The NEC Infrastructure Master
Plan contains cost estimations for specific upgrades to the NEC to return the existing
infrastructure to a state of good repair and increase the capacity as necessary to
accommodate commuter, intercity and freight rail growth. Finally, whilst the PennDesign
(2011) study does not include all the intermediate steps of their engineering cost study, the
authors do include a listing of the unit infrastructure costs that were used in the appendix
of the document.
The California High-Speed Rail Authority has also produced several reports regarding the
cost of their system. Whilst the data from infrastructure costs might not be directly
applicable to the NEC, the operating and maintenance costs could potential serve as a
source for estimating the values for the NEC. Parsons Brinkerhoff (2011b) provides some
high-level operating cost estimates based on broad categories such as trainset mile, route
mile, number of stations, etc., that could also be useful on the NEC. Some care needs to be
taken when using these values, however, given the highly politicized nature of the cost
estimates in California.
5 Source: Lance Neumann. MIT 1.201 – Transportation Costs and Impacts I Lecture, October 4, 2011.

MIT HSR/Regions Group Carlson, Archila and Pena Chapter 8 – Quantitative models needed for detailed analysis
8-7
ENERGY CONSUMPTION/AIR EMISSIONS MODEL
Energy use and air emissions are important metrics with which to evaluate the
performance of a transportation project. In particular, a reduction in air emissions as
travellers switch to less energy intensive modes is an important social benefit worthy of
inclusion in cost-benefit analysis.
In order to conduct a first-order analysis of the impacts on energy consumption and air
emissions related to implementing high-speed rail, we would apply a similar methodology
to that outlined in UCS (2008). Firstly, we would determine the energy consumption of a
vehicle of each mode (i.e. in kilowatt-hours per vehicle-kilometer). Secondly, we would
relate that energy consumption to a given fuel type and use the carbon intensity of the fuel
(including any carbon associated with its extraction, processing and transport) to calculate
the carbon emissions per vehicle-kilometer (of a given mode). Thirdly, we would divide
these carbon dioxide emissions by the vehicle load factor in order to calculate the average
carbon dioxide emissions per passenger-kilometer for a given mode6. Finally, using the
expected demand for each of the modes, we would determine the total quantity of energy
consumption and carbon dioxide emissions.
A similar procedure could be used to calculate the quantity of other air pollutants, such as
NOx, SOx, carbon monoxide (CO), volatile organic compounds (VOCs), lead (Pb) and
particulate matter (PM) for example, provided sufficient data is available. In addition, there
may be data available to monetize the benefits resulting from a reduction in air emissions.
Amtrak (2010) and FRA (1997) discuss and include emissions/energy savings in their
reports. The PennDesign (2011) also included emissions/energy savings in their report,
and also included a thorough description of their methodology in an appendix. The authors
of the report indicated that they used figures from the aforementioned UCS (2008) report.
REGIONAL ECONOMIC MODEL
The most significant benefits resulting from any transportation project are the travel time
savings that result when travellers’ trip times are reduced. However, there are potentially
other regional economic benefits that can potentially result from improved transportation
infrastructure. These benefits (or costs) can also be significant, and therefore, it is
important to account for them in the benefit-cost analysis. However, Vickerman (2007)
notes that the identification and evaluation of wider benefits of transportation investment
“continues to cause debate and controversy.” Therefore, whilst these benefits may be
important, the techniques to quantify these benefits are still undergoing significant
research. Additionally, even if it is possible to estimate the benefits that would result from a
6 The assumption of a load factor is one of the most subjective parts of the evaluation.

MIT HSR/Regions Group Carlson, Archila and Pena Chapter 8 – Quantitative models needed for detailed analysis
8-8
project, the economic growth from high-speed rail projects is often not evenly distributed
(Melibaeva et al. 2011). As a result, accounting for these wider benefits inaccurately (by
double counting benefits, for example) could potentially distort the benefit-cost evaluation
as much as failing to account for them in the analysis.
The UK Department for Transport (DfT) (2005) created an evaluation framework that that
appears to have done a good job in ensuring that the wider benefits or costs have not been
double counted. Within this framework the DfT lists four potential wider benefits (or
costs):
• “agglomeration externality” – Includes a transportation project’s impact on the
“effective density” of employment, which considers the number of jobs in a given
area as well as in nearby areas. Research by Graham (2007) shows a correlation
between effective density and productivity.
• “impact of transport in improving competition” – Considers a transportation
project’s impact on improving competition between firms. The DfT paper notes that
this benefit is likely negligible (in the UK) due to the presence of an already well-
developed transportation system.
• “presence of imperfect competition in transport-using industries” – Accounts for the
increase in competition between transportation firms as a result of a new
transportation project.
• “economic benefits of increased employment and productivity, arising from
commuting time savings” – Accounts for the benefit to society from a travel time
savings by commuters in addition to the benefit to the individual. In the case of
commuter travel, the value of time used considers only the “post-tax wages and the
value of leisure time.” Therefore, there is still additional benefits from to society
from taxes as a result of an individual using less time to commute. Business travel is
not included in this wider benefit, as the value of time considers the average wage of
individuals pre-tax.
The DfT (2005) technical paper also identifies several models that can be used to calculate
these benefits.
Given that there are several approaches and models available to evaluate the wider
economic benefits of a project (in addition to the one noted above), before selecting and
including any model into the evaluation, a thorough review of relevant research is
required. Otherwise, failing to appropriately justify the inclusion of an analysis technique
into the evaluation could potentially lead to scepticism regarding the overall results of the
evaluation.
The aforementioned FRA, Amtrak and PennDesign studies all discuss and/or include some
wider economic benefits into their studies. However, none of these studies proposes a

MIT HSR/Regions Group Carlson, Archila and Pena Chapter 8 – Quantitative models needed for detailed analysis
8-9
framework or model with which to study the wider economic benefits of high-speed rail in
more depth.
OTHER “TECHNICAL” MODELS
This category is intended to represent those models that would be used to study the
technical characteristics of a potential high-speed rail system. Examples of such models
include capacity studies to determine how many trains per day a corridor can
accommodate or alignment studies to determine the speed at which a passenger train
could travel over a section of track.
Technical models require a deeper understanding of the engineering properties of the
system, and as a result, are generally outside the scope of this or subsequent research.
However, whilst we will not be conducting these studies, we will need to keep in mind the
general principles associated with these models. For example, in the case of a capacity
model, we will need to consider the impacts that operating different types of trains at
different speeds on a corridor generally diminishes available capacity. In the case of an
alignment model, we will need to keep in mind the relationship between curve radius and
train speed (and the resulting costs of the system, etc.). In other words, information from
these technical models tells us under what conditions different strategic alternatives are
feasible.
Technical limitations (including maximum capacity and speed) will be of greatest concern
when considering incremental high-speed rail, as this alternative (at least, as currently
defined) explicitly excludes the possibility of building a completely new alignment. The
NEC Infrastructure Master Plan Working Group (2010) includes a thorough review of some
of the capacity limitations and other technical limitations associated with the current
alignment of the NEC, and we plan on including the results from this, and other studies that
become available, in any subsequent research.
ECONOMIC (BENEFIT-COST) ANALYSIS
An important part of any subsequent evaluation of high-speed rail in the NEC should
include an appropriate benefit-cost evaluation. Benefit-cost analysis (and financial analysis,
below) are not “models,” but rather tools to help summarize the results from different
models and evaluate different strategic alternatives.
The purpose of including benefit-cost evaluation is to determine whether high-speed rail is
a good investment – it is not intended to determine whether the project is financially
viable. The result of the benefit-cost analysis is also not intended to replace any multi-
criteria analysis techniques that would be required, but rather to be one of many
performance metrics that will be considered simultaneously.

MIT HSR/Regions Group Carlson, Archila and Pena Chapter 8 – Quantitative models needed for detailed analysis
8-10
The most likely metrics to evaluate this project would be net present value (NPV) or
benefit-cost ratio (BCR). NPV represents the difference between the present value of the
benefits and costs related associated with the project; the BCR represents the ratio of the
present value of the benefits to the costs.
The first step of such an analysis would be to identify and calculate the relevant social
benefits, such as the direct time saving benefits, environmental benefits and wider
economic benefits, and costs, such as the capital cost and operating cost, associated with
the project. Once the stream benefits and costs have been have been calculated for each
year of the project, they must be converted to present values using an appropriate discount
factor. In a public-sector project, the discount rate is intended to represent the
“opportunity costs of taking funds out of the private economy.” The US Office of
Management and Budget recommends a 7% real discount rate for public projects in the
US.7 Amtrak (2010) and PennDesign (2011) used 7% and 3% discount rate in determining
the benefit-cost ratio of their proposals; the latter figure was allowed under the U.S. TIGER
stimulus grants8. Given that the discount rate can have a very significant impact on the
outcome of the evaluation, stakeholders are sensitive to the selection of a discount rate.
Therefore, some sensitivity analysis should be performed to analyze the impact of different
discount rates on the viability of the project.
FRA (1997), Amtrak (2010) and the PennDesign (2011) have undertaken benefit-cost
analyses on their respective proposals for high-speed rail in the NEC. However, the
benefits, costs and assumptions used in each proposal vary, which make direct
comparisons difficult. If a benefit-cost analysis cannot be undertaken directly, it will be
important to consider the assumptions used by each study if their results are included. The
PennDesign (2011) provides the most detailed information related the benefits and costs
that they included in their study. The FRA (1997) breaks out the benefits and costs based
on whether they will be accrued to the public at large or to the users of the HSGT system
(as per the categories provided in the “Benefit models” portion of the report). This
methodology provides one way to consider the social equity associated with a high-speed
rail project.
7 Adapted from: Lance Neumann. MIT 1.201 – Project Evaluation Lecture, December 1,
2011.
8 Office of the Assistant Secretary for Transportation Policy, US DOT. 2011. Preparing a
Benefit-Cost Analysis for a USDOT TIGER Grant. Available online at:
http://www.dot.gov/tiger/application-resources.html.

MIT HSR/Regions Group Carlson, Archila and Pena Chapter 8 – Quantitative models needed for detailed analysis
8-11
FINANCIAL ANALYSIS
The purpose of financial analysis is to determine whether a high-speed rail project is
financially viable (i.e. determining financing methods for the project) – it is not intended to
determine whether the project is a good investment. This type of analysis is particularly
important given that the capital costs associated with an international quality high-speed
rail system could run on the order of $100 billion, much of which would need to be
incurred before any revenue is realized by the system.
Unlike in benefit-cost analysis, in which the stream of social benefits and costs associated
with a project are computed, the first step of a financial analysis would be to calculate the
stream of cash flows (revenues and costs) directly associated with the project. The
revenues would be based on the product of the forecasted demand and the expected fare
price of the high-speed rail service. In the case of a vertically separated institutional
environment (such as in bundle 2) some additional consideration would also need to be
given to the policy that will be used to set track access fees. The capital and operating cost
of the service would be determined using the methods outlined in the “Cost model” section
of this document. Using this stream of cash flows, we could then assess potential financing
techniques (such as government grants and loans, bonds, and public-private financing
techniques) that could be used to “convert” the stream of future revenues into sources of
funds to pay for the initial capital expenditures. Part of such an analysis would be
determining the eligibility of the high-speed rail project to participate in various federal
and state funding/financing programs, and whether any programs would need to be
expanded or created to be able to adequately finance the project. It should also consider
potential public-private partnership mechanisms as a method to finance the project.
Finally, innovative value capture mechanisms resulting from the increase in private land
values should also be considered as a mechanism to finance high-speed rail (Huang and
Sussman 2011). In addition, this analysis should also evaluate the amount of government
subsidies required to construct and operate the service. Subsidies, particularly operating
subsidies, are an extremely political issue in the US; as a result, a careful evaluation of
government in the project is required.
The PennDesign (2011) proposal includes a thorough financial analysis, including pro
forma income statements for a proposed high-speed rail operation. The authors of this
report also include a thorough description of financing mechanisms for high-speed rail in
the NEC. By comparison, there is only limited discussion of financing mechanisms in the
other proposals highlighted in this document. However, based on presentations from
Amtrak and discussions with various members of industry, Amtrak is currently having
KPMG prepare a business plan that is intended to explain how Amtrak proposes to finance
the expansion of international quality high-speed rail. Amtrak is tentatively planning to
release this report during the second or third quarter of this year.

MIT HSR/Regions Group Carlson, Archila and Pena Chapter 8 – Quantitative models needed for detailed analysis
8-12
In addition to considering the financial viability of high-speed rail upgrades, some
consideration needs to be given to the financial impacts on other modes from that would
result from the funding of high-speed rail. Huang (2011) notes that the financing of high-
speed rail has resulted in less funding for other transportation modes, which is referred to
as the “crowding-out” effect. This crowding out effect could be detrimental if it means that
insufficient funds are available for other important transportation projects, such as urban
transit projects. As a result, financial analysis needs to be undertaken from a multimodal
perspective.
REFERENCES
Amtrak. 2010. Vision for High-Speed Rail in the Northeast Corridor. Amtrak: Washington,
DC.
Bain, R. 2009. Error and optimism bias in toll road traffic forecasts. Transportation, 36(5):
469-482.
Graham, D.J. 2007. Agglomeration, Productivity and Transport Investment. Journal of
Transport Economics and Policy, 41: 317-344.
Huang, T. 2011. Financial Impacts of and Financing Methods for High-Speed Rail in
Portugal. Massachusetts Institute of Technology Master’s Thesis.
Huang, T. and Sussman, J.M. 2011. Financing methods for high-speed rail with applications
to Portugal. Massachusetts Institute of Technology Engineering Systems Division Working
Paper Series ESD-WP-2011-09.
Melibaeva, S., Sussman, J. and Dunn, T. 2010. Comparative Study of High-Speed Passenger
Rail Deployment in Megaregion Corridors: Current Experiences and Future Opportunities.
Massachusetts Institute of Technology Engineering Systems Division Working Paper Series
ESD-WP-2010-09.
NEC Master Plan Working Group. 2010. The Northeast Corridor Infrastructure Master Plan.
Amtrak: Washington, DC.
Parsons Brinkerhoff. 2011a. Ridership and Revenue Model: Development, Application, and
Project-Level EIR/EIS Forecasts. California High-Speed Rail Authority.
Parsons Brinkerhoff. 2011b. Estimating High-Speed Train Operating & Maintenance Cost
for the CA HSRA 2012 Business Plan. California High-Speed Rail Authority.
PennDesign. 2011. High-Speed Rail in the Northeast Megaregion: From Vision to Reality.
University of Pennsylvania School of Design: Philadelphia, PA.
Sussman, J. 2000. Introduction to Transportation Systems. Artech House: Boston, MA.
Sussman, J. et al. 2009. The CLIOS Process: A User’s Guide – February 2009.

MIT HSR/Regions Group Carlson, Archila and Pena Chapter 8 – Quantitative models needed for detailed analysis
8-13
UK Department for Transport (DfT). 2005. Transport, Wider Economic Benefits, and
Impacts on GDP. Discussion Paper.
US Department of Transportation Federal Railroad Administration (FRA). 1997. High-
Speed Ground Transportation for America. US Department of Transportation: Washington,
D.C.
Vickerman, R. 2007. Recent Evolution of Research into the Wider Economic Benefits of
Transport Infrastructure Investment. Joint Transport Research Centre Discussion Paper
No. 2007-9.

MIT HSR/Regions Group Sussman et al. Appendix A – CLIOS Process teaching note
A-1
Appendix A
CLIOS Process teaching note Joseph M. Sussman et al.

ESD.04 CLIOS USER’S GUIDE A-2
THE “CLIOS PROCESS”
A USER’S GUIDE
Professor Joseph M. Sussman, Director, CLIOS Process Research Team Dr. Rebecca S. Dodder Dr.Joshua B. McConnell
Dr. Ali Mostashari Dr. Sgouris Sgouridis
February 19, 2009 MIT © 2007
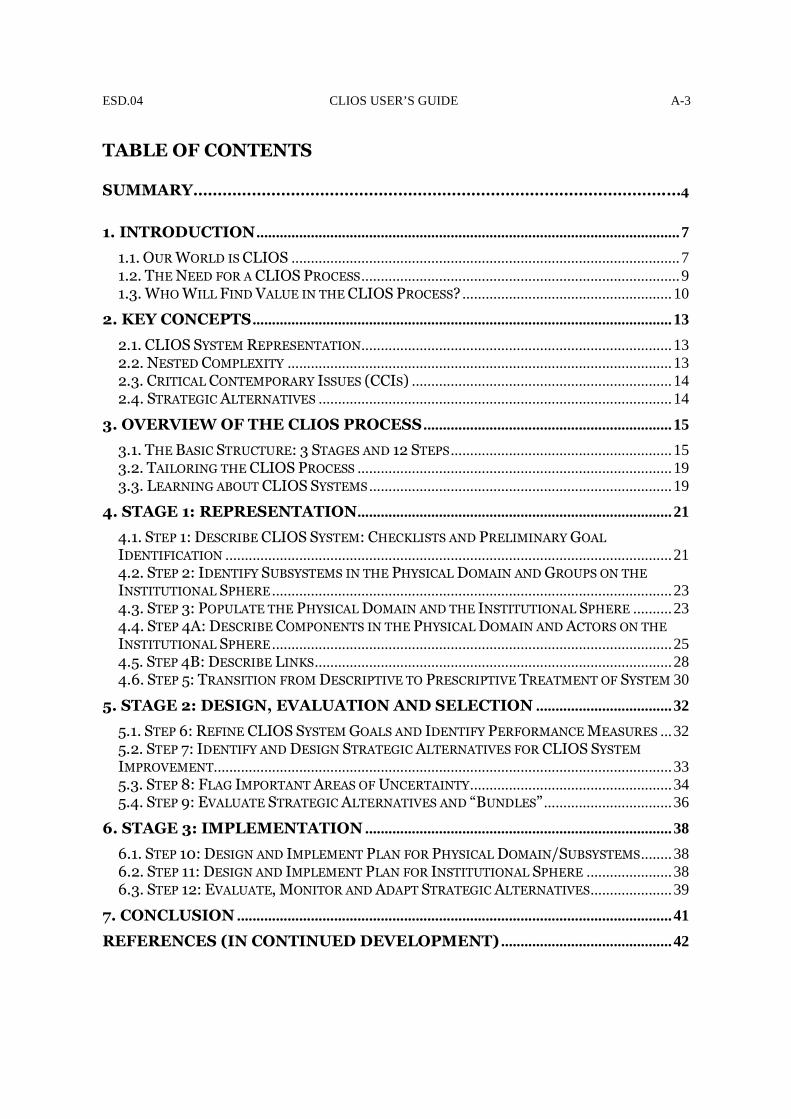
ESD.04 CLIOS USER’S GUIDE A-3
TABLE OF CONTENTS SUMMARY…………………………………………………………………………………….…4
1. INTRODUCTION ............................................................................................................. 7
1.1. OUR WORLD IS CLIOS .................................................................................................... 7 1.2. THE NEED FOR A CLIOS PROCESS .................................................................................. 9 1.3. WHO WILL FIND VALUE IN THE CLIOS PROCESS? ...................................................... 10
2. KEY CONCEPTS ............................................................................................................ 13
2.1. CLIOS SYSTEM REPRESENTATION ................................................................................ 13 2.2. NESTED COMPLEXITY ................................................................................................... 13 2.3. CRITICAL CONTEMPORARY ISSUES (CCIS) ................................................................... 14 2.4. STRATEGIC ALTERNATIVES ........................................................................................... 14
3. OVERVIEW OF THE CLIOS PROCESS ................................................................ 15
3.1. THE BASIC STRUCTURE: 3 STAGES AND 12 STEPS ......................................................... 15 3.2. TAILORING THE CLIOS PROCESS ................................................................................. 19 3.3. LEARNING ABOUT CLIOS SYSTEMS .............................................................................. 19
4. STAGE 1: REPRESENTATION ................................................................................. 21
4.1. STEP 1: DESCRIBE CLIOS SYSTEM: CHECKLISTS AND PRELIMINARY GOAL IDENTIFICATION ................................................................................................................... 21 4.2. STEP 2: IDENTIFY SUBSYSTEMS IN THE PHYSICAL DOMAIN AND GROUPS ON THE INSTITUTIONAL SPHERE ....................................................................................................... 23 4.3. STEP 3: POPULATE THE PHYSICAL DOMAIN AND THE INSTITUTIONAL SPHERE .......... 23 4.4. STEP 4A: DESCRIBE COMPONENTS IN THE PHYSICAL DOMAIN AND ACTORS ON THE INSTITUTIONAL SPHERE ....................................................................................................... 25 4.5. STEP 4B: DESCRIBE LINKS ............................................................................................ 28 4.6. STEP 5: TRANSITION FROM DESCRIPTIVE TO PRESCRIPTIVE TREATMENT OF SYSTEM 30
5. STAGE 2: DESIGN, EVALUATION AND SELECTION ................................... 32
5.1. STEP 6: REFINE CLIOS SYSTEM GOALS AND IDENTIFY PERFORMANCE MEASURES ... 32 5.2. STEP 7: IDENTIFY AND DESIGN STRATEGIC ALTERNATIVES FOR CLIOS SYSTEM
IMPROVEMENT ...................................................................................................................... 33 5.3. STEP 8: FLAG IMPORTANT AREAS OF UNCERTAINTY .................................................... 34 5.4. STEP 9: EVALUATE STRATEGIC ALTERNATIVES AND “BUNDLES” ................................. 36
6. STAGE 3: IMPLEMENTATION ............................................................................... 38
6.1. STEP 10: DESIGN AND IMPLEMENT PLAN FOR PHYSICAL DOMAIN/SUBSYSTEMS ........ 38 6.2. STEP 11: DESIGN AND IMPLEMENT PLAN FOR INSTITUTIONAL SPHERE ...................... 38 6.3. STEP 12: EVALUATE, MONITOR AND ADAPT STRATEGIC ALTERNATIVES ..................... 39
7. CONCLUSION ................................................................................................................ 41
REFERENCES (IN CONTINUED DEVELOPMENT) ............................................ 42

ESD.04 CLIOS USER’S GUIDE A-4
LIST OF TABLES TABLE 1: SUMMARY OF THREE STAGES .................................................................................... 15 TABLE 2: SAMPLE QUESTIONS TO BE ANSWERED IN EACH CLIOS PROCESS STAGE ................... 16 TABLE 3: PERFORMANCE OF BUNDLES ACROSS DIFFERENT FUTURES ....................................... 37 LIST OF FIGURES FIGURE 1: A CLIOS SYSTEM CONSISTS OF A PHYSICAL DOMAIN (MADE UP OF SUBSYSTEMS), ... 9 FIGURE 2: THE TWELVE STEPS OF THE CLIOS PROCESS .......................................................... 17 FIGURE 3: ITERATION IN THE CLIOS PROCESS ......................................................................... 18 FIGURE 4: LEARNING CONTINUUM IN THE CLIOS PROCESS ..................................................... 20 FIGURE 5: CLIOS SYSTEM CHECKLISTS ................................................................................... 22 FIGURE 6: POPULATING THE SUBSYSTEM DIAGRAMS ............................................................... 24 FIGURE 7: ILLUSTRATION OF STEP 3 FOR A TRANSPORTATION SYSTEM EXAMPLE ..................... 25 FIGURE 8: SUGGESTED CLIOS SYSTEM DIAGRAM COMPONENT SHAPES ................................... 25 FIGURE 9: SOME SUGGESTED LINK SHAPES FOR CLIOS SUBSYSTEM DIAGRAMS ....................... 29 FIGURE 10: EXAMPLE OF A CLIOS SYSTEM DIAGRAM AT THE END OF STEP 4 .......................... 30

ESD.04 CLIOS USER’S GUIDE A-5
When we try to pick out anything by itself, we find it hitched to everything else in the universe John Muir
SUMMARY
omplex, large-scale, interconnected, open, sociotechnical (CLIOS) Systems are a class of engineering systems with wide-ranging social and environmental impacts.
Because of the many interacting subsystems, the uncertainty in subsystem behavior and interaction, and the degree of human agency involved, the behavior of a CLIOS System is difficult to predict and often counterintuitive. These attributes make it difficult to represent and study CLIOS Systems. We have developed a CLIOS Process to help study such systems. The CLIOS Process can be used as an organizing mechanism for understanding a CLIOS System’s underlying structure and behavior, identifying and deploying strategic alternatives for improving the system’s performance, and monitoring the performance of those strategic alternatives. Moreover, it is an iterative process that allows for continuous learning about the system by both studying and intervening in the system. A key motivation behind the need for a CLIOS Process is the presence of “nested complexity,” which results when a physical domain is nested within and interacts with an institutional sphere, where both are complex. The study of CLIOS Systems requires the use of a variety of models and frameworks, with quantitative engineering and economic models being used for the physical domain, and qualitative frameworks for understanding institutional, organizational and stakeholder behavior being used for the institutional sphere. An important aspect of the CLIOS Process is the integration of the analyses of the physical domain and institutional sphere, and the development of strategic alternatives for both. The CLIOS Process consists of three stages: 1. Representation of the CLIOS System structure and behavior, 2. Design, Evaluation and Selection of CLIOS System strategic alternatives, and 3. Implementation of the selected strategic alternatives. The representation stage is primarily diagrammatic in nature. Diagrams are used to represent the structure and behavior of the CLIOS System by graphically illustrating the system components and interactions in the physical domain, on the institutional sphere, and between them. An accompanying text describing and explaining the CLIOS System diagrams is often helpful. The CLIOS Process can be thought of as a Christmas tree and its ornaments; the tree represents the overall process and the ornaments represent the specific tools (e.g. benefit-cost analysis, probabilistic risk assessment, system simulations, stakeholder analysis, scenario planning, design structure matrices, etc.) that one can use for specific steps in the overall process. This paper describes the overall CLIOS Process and particular regimes of tools that can be used in the study of CLIOS Systems. The appendix highlights tools that can be used for more advanced analyses of CLIOS systems.
C

ESD.04 CLIOS USER’S GUIDE A-6
With the CLIOS Process, our intent is: (1) to provide a structure for undertaking the analysis, (2) increase the amount of rigor and validity in the analysis, and (3) facilitate the identification of alternatives that are relevant to the actors on the institutional sphere. The CLIOS Process is designed to be a modular process that can be customized and expanded as needed.1 While the CLIOS Process has a specific macro-structure, its inherent flexibility allows different analysts to tailor the process to their specific needs We suggest that the CLIOS Process provides an innovative systems approach that represents the entire system – physical and institutional – in an integrated form. The CLIOS Process explicitly includes the institutional world as part of the system, recognizing that changes to existing institutional structures are not only a strategic alternative, but are often necessary in order to implement other strategic alternatives to improve system performance. The purpose of this paper is to serve as an introduction to the CLIOS Process and to guide interested students, researchers, and analysts on how to successfully apply it in ways that both structure and add value to their analysis. In Section 1 we explain what we mean by a CLIOS System and indicate the situations for which the CLIOS Process would be most applicable. Section 2 reviews some of the key concepts that are extensively used in the CLIOS Process. The CLIOS Process itself is explained step by step in Sections 3 to 6. Finally, the Appendix directs the reader to a number of potential models and frameworks that can be used to address various aspects of the system’s analysis on an as-needed basis.
1 For example, research is ongoing on (i) incorporating stakeholder perspectives throughout the CLIOS Process and (ii)
developing and valuing flexible strategic alternatives.

ESD.04 CLIOS USER’S GUIDE A-7
1. INTRODUCTION
1.1. Our World is CLIOS
Our world is complex, large-scale, interconnected, open and sociotechnical (CLIOS). The term “CLIOS System” was conceived as a way to capture the salient characteristics of a class of engineering systems with wide-ranging economic, social, political and environmental impacts that are of growing interest to researchers, decisionmakers, policy makers and stakeholders. The CLIOS framework provides a way to describe, understand, study, and ultimately, to improve the performance of a wide range of systems. Systems that can be described and analyzed as CLIOS Systems include air traffic control systems, the global energy/climate system, the National Missile Defense system and the eBay online trading system (Magee and de Weck, 2002; Zuckerman, 2002). The boundaries of CLIOS Systems are often defined by an existing or impending problem, such as the reduction of air pollutant emissions from transportation systems in megacities, or the transport and storage of spent nuclear fuel from nuclear power plants. We begin by defining the primary characteristics of CLIOS Systems. Complex: A system is “complex” when it is composed of a group of interrelated components and subsystems (those terms will be defined more rigorously later), for which the degree and nature of the relationships between them is imperfectly known, with varying directionality, magnitude and time-scales of interactions. While there are many types of complexities defined in the literature (Sussman 2002, Lloyd 2002), we are primarily concerned with four types of complexities for CLIOS Systems:
� Structural Complexity (also known as combinatorial or detail complexity) exists when the system consists of a large number of interconnected parts.
� Behavioral complexity (also referred to as dynamic complexity) exists when
predictions of system outputs or behavior is difficult. This can be found even in systems with low structural complexity when their parts interact over time in closely-coupled feedback loops. Even if we understand the internal behavior of individual subsystems and components, our lack of understanding of the relationships between these components and subsystems leads to difficulties in making predictions of overall CLIOS System behavior. Emergence is a specific example of behavioral complexity in which the laws or rules governing the behavior or individual components are simple, but the patterns of overall behavior that result are complex and usually surprising (Holland, 1998).
� Nested Complexity is a concept that suggests a complex “physical/technical” system
embedded within an institutional system (which we will later refer to as an institutional sphere). Moreover, the institutional system exhibits structural and behavioral complexity in its own right. The two-way interactions between the physical/technical and institutional systems create “nested complexity.”

ESD.04 CLIOS USER’S GUIDE A-8
� Evaluative Complexity reflects the multi-stakeholder environment in which CLIOS
Systems exist – different stakeholders value different aspects of system performance in different ways, making decision-making difficult. Simply put, what may be good performance to one stakeholder, may not be good performance to another stakeholder. Even if one could make good predictions about the behavior of the CLIOS System when strategic alternatives are implemented, evaluative complexity means it is still difficult to make a decision about what to do.
Large-Scale: CLIOS Systems have impacts that are large in magnitude, and often long-lived and of “large-scale” geographical extent. For this reason, as we argue later, CLIOS Systems are often related to Critical Contemporary Issues. Interconnected: CLIOS Systems are often interconnected with other sociotechnical systems. As an example, one could point to the relationships between transportation systems, energy systems and the global climate system. Open: CLIOS Systems explicitly include social, political and economic aspects (Sussman, 2000) beyond the technical or “engineered” system; we are concerned about system performance on these dimensions. Sociotechnical: To distinguish CLIOS Systems from systems in which we may consider only technical aspects (such as complex computer programs) or purely social systems in which technology is not a central consideration (such as the social security system), we emphasize their sociotechnical nature. Technology plays a central role in CLIOS Systems, as does the social context within which the system is operating. We think of a CLIOS System as consisting of a physical domain – with interconnected physical subsystems – embedded in an institutional sphere (i.e. nested complexity). This is illustrated in Figure 1. Therefore, when we speak of a CLIOS System, we refer both to the physical and the institutional aspects of the system; we include both domains. Here, subsystems refer to major parts of the physical domain. We visualize the subsystems as being divided into distinct layers, but with interconnections between the subsystems (or “layers”). As we will see, the choice of how to divide the physical domain into logical subsystems is up to the analyst and will depend on the issues and problems that motivate the analysis. Components (the small circles on the subsystem layers) are the basic units that make up a subsystem; links among them represent their interconnections. The institutional sphere includes actors and organizations (i.e. the institutional stakeholders) that influence and affect (and are affected by) one or all of the subsystems.

ESD.04 CLIOS USER’S GUIDE A-9
Figure 1: A CLIOS System consists of a physical domain (made up of subsystems),
embedded in an institutional sphere.
As an example, a CLIOS representation of sustainable mobility may include the following subsystems in the physical domain: transportation, environment, energy, economy, and land-use. The transportation subsystem could incorporate components such as: private auto fleet, congestion, freight transportation demand, etc. Finally, the institutional sphere (in the U.S. context) would include agencies like the U.S. Department of Transportation (DOT), Environmental Protection Agency (EPA), and Department of Energy (DOE), along with advocacy groups, auto manufacturing companies, etc. Finally, the programs and regulations specified in the Clean Air Act would be an example of policy linkages from an organization on the institutional sphere (EPA) to components within the transportation and environment subsystems.
1.2. The Need for a CLIOS Process The primary motivation for this paper is the authors’ perception that there is a need for a new process for both analyzing and managing the complex sociotechnical systems that are at the core of many of society’s most intractable contemporary problems. Its value lies in its clearly structured process for approaching problems related to CLIOS Systems, starting the user at the very basic and simple description of the system, and leading the user step by step through a learning process of increasing complexity and depth (see Figure 4). The CLIOS Process can lead the user from problem and goal identification to implementation and adaptation of strategic alternatives, with an explicit systems approach to both analyzing and addressing problems. Because of the many subsystems involved, the uncertainty in the behavior of the subsystems and their interactions, and the degree of human agency involved, the behavior of CLIOS Systems is difficult to predict and often counterintuitive (i.e., exhibiting behavioral complexity). This holds true even when subsystem behavior is readily predictable. One of
Subsystem 3
Subsystem 2
Subsystem 1 Physical Domain
Institutional Sphere
Component
CLIOS System boundary
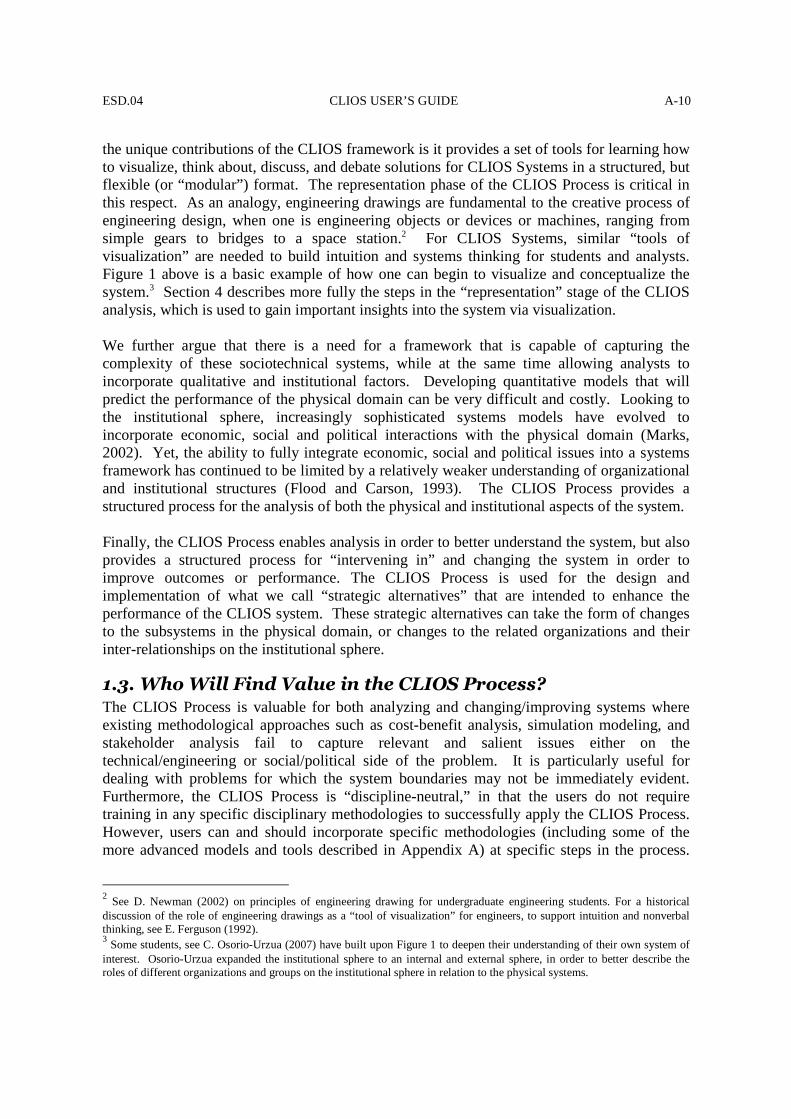
ESD.04 CLIOS USER’S GUIDE A-10
the unique contributions of the CLIOS framework is it provides a set of tools for learning how to visualize, think about, discuss, and debate solutions for CLIOS Systems in a structured, but flexible (or “modular”) format. The representation phase of the CLIOS Process is critical in this respect. As an analogy, engineering drawings are fundamental to the creative process of engineering design, when one is engineering objects or devices or machines, ranging from simple gears to bridges to a space station.2 For CLIOS Systems, similar “tools of visualization” are needed to build intuition and systems thinking for students and analysts. Figure 1 above is a basic example of how one can begin to visualize and conceptualize the system.3 Section 4 describes more fully the steps in the “representation” stage of the CLIOS analysis, which is used to gain important insights into the system via visualization. We further argue that there is a need for a framework that is capable of capturing the complexity of these sociotechnical systems, while at the same time allowing analysts to incorporate qualitative and institutional factors. Developing quantitative models that will predict the performance of the physical domain can be very difficult and costly. Looking to the institutional sphere, increasingly sophisticated systems models have evolved to incorporate economic, social and political interactions with the physical domain (Marks, 2002). Yet, the ability to fully integrate economic, social and political issues into a systems framework has continued to be limited by a relatively weaker understanding of organizational and institutional structures (Flood and Carson, 1993). The CLIOS Process provides a structured process for the analysis of both the physical and institutional aspects of the system. Finally, the CLIOS Process enables analysis in order to better understand the system, but also provides a structured process for “intervening in” and changing the system in order to improve outcomes or performance. The CLIOS Process is used for the design and implementation of what we call “strategic alternatives” that are intended to enhance the performance of the CLIOS system. These strategic alternatives can take the form of changes to the subsystems in the physical domain, or changes to the related organizations and their inter-relationships on the institutional sphere.
1.3. Who Will Find Value in the CLIOS Process? The CLIOS Process is valuable for both analyzing and changing/improving systems where existing methodological approaches such as cost-benefit analysis, simulation modeling, and stakeholder analysis fail to capture relevant and salient issues either on the technical/engineering or social/political side of the problem. It is particularly useful for dealing with problems for which the system boundaries may not be immediately evident. Furthermore, the CLIOS Process is “discipline-neutral,” in that the users do not require training in any specific disciplinary methodologies to successfully apply the CLIOS Process. However, users can and should incorporate specific methodologies (including some of the more advanced models and tools described in Appendix A) at specific steps in the process.
2 See D. Newman (2002) on principles of engineering drawing for undergraduate engineering students. For a historical
discussion of the role of engineering drawings as a “tool of visualization” for engineers, to support intuition and nonverbal thinking, see E. Ferguson (1992). 3 Some students, see C. Osorio-Urzua (2007) have built upon Figure 1 to deepen their understanding of their own system of
interest. Osorio-Urzua expanded the institutional sphere to an internal and external sphere, in order to better describe the roles of different organizations and groups on the institutional sphere in relation to the physical systems.

ESD.04 CLIOS USER’S GUIDE A-11
What the CLIOS Process does require is a strong systems-thinking approach by the individual or group undertaking the analysis. As suggested above, the CLIOS Process can be carried out either by individuals or by groups. Potential users of the CLIOS Process include the following: Students/Researchers: The CLIOS Process has been used for class projects – at both the graduate and undergraduate level – as a pedagogical tool, training students to approach and analyze engineering systems holistically.4 It has also been used as a research framework for master’s theses and doctoral dissertations for understanding systems that can be characterized as CLIOS Systems.5 These theses have not only applied the CLIOS Process, but have illustrated the modularity of the CLIOS Process itself. Indeed, several students have extended and deepened the CLIOS Process in order to better understand their own CLIOS systems. Decisionmakers: In addition to its research and pedagogical role, the CLIOS Process can also be employed by public or private sector decisionmakers, with responsibility for one or more components of a subsystem, to change and improve the system. Stakeholders: Citizens, private sector actors, non-profit organizations and advocacy groups that are affected for good or ill by the CLIOS System, can also use the CLIOS Process in a more participatory format to attempt to influence its performance. In CLIOS terms, both decisionmakers and stakeholders “populate” the institutional sphere. Experts/Analysts: Individuals or groups that provide analysis and recommendations to decisionmakers and stakeholders are the fourth group of potential users of the CLIOS Process. These experts/analysts may be a part of the CLIOS System (i.e., as employees of an organization on the institutional sphere) or retained to study the CLIOS System as consultants (and therefore do not “populate” the institutional sphere, but provide advice to decisionmakers or stakeholders that do “populate” the institutional sphere). Part of the value is that all of these individuals/groups can work together on the CLIOS Process. For clarity, this paper outlines and describes the CLIOS Process as though it were being carried out by a single analyst. Yet, in practice, participation by stakeholders and decisionmakers using the CLIOS Process as a collaborative group process will (or should) occur (Mostashari, 2005). It is envisioned that the CLIOS Process could create a forum where stakeholders systematically raise and elaborate upon their concerns, so that these concerns could be adequately addressed by decisionmakers and policymakers, without losing the understanding of the systems as a whole. For example, in the context of the unsustainable patterns of metropolitan development, Innes (1997) notes that “efforts to intervene have been made by one or another set of interests, each grasping the elephant by only one of its parts and misunderstanding the whole.” This is not uncommon in the policy world as a multitude of agents have an influence on individual subsystems in a larger, complex and interconnected system, thus leading to unintended consequences on the other subsystems. Clearer frameworks for understanding systems holistically could enable decisionmakers to better see their function as “part of a complex system of linked factors in the physical environmental 4 Moses (2006), for example, stresses a holistic approach as “fundamental” to Engineering Systems. 5 Kometer (2005), Ward (2005), Mostashari (2005), and Osorio-Urzua (2007) are some examples.

ESD.04 CLIOS USER’S GUIDE A-12
and the governmental context” (Innes, 1997). We suggest that the CLIOS Process supports this effort.

ESD.04 CLIOS USER’S GUIDE A-13
2. KEY CONCEPTS
2.1. CLIOS System Representation
The CLIOS Process begins with a “representation” of the CLIOS System both diagrammatically as well as with supporting text. The motivation for the representation is to convey the structural relationships and direction of influence between the components within a CLIOS system and subsystems. In this sense, the CLIOS system representation is an organizing mechanism for mapping out the system’s underlying structure and behavior – a precursor to identifying strategic alternatives for improving the system’s performance. We will look at representation in more detail when we go through the steps of the CLIOS Process. As noted earlier, the CLIOS Process can be applied by individuals or groups. When carried out by a group, it can generate a shared and more complete understanding of the system among various decisionmakers, analysts and stakeholders, each bringing to bear their own perspectives, knowledge, preferences and values. Because the representation is primarily qualitative in nature, the CLIOS Process allows for the participation of a range of actors with different levels of expertise.
2.2. Nested Complexity As previously noted, a key motivation for a CLIOS Process is the characteristic of “nested complexity” present in all CLIOS systems. According to this concept, a CLIOS System is comprised of a complex physical domain, which follows quantitative principles that can be approximated by engineering and economic models, surrounded by a “messier” institutional sphere (see Figure 1). On the sphere is the organizational and institutional network of policymakers, firms, non-governmental organizations, and stakeholders that together comprise the institutions that interact with the physical domain.6 Analyzing this sphere of organizations and institutions requires various methodologies – usually qualitative in nature and often more participatory, such as evaluation of stakeholder perspectives and organizational analysis. We therefore have “nested complexity” when the physical domain is being affected or managed, loosely speaking, by a complex organizational and policymaking system. However, while we make a distinction between the physical domain and institutional sphere – we also need to understand the connections between the physical domain and institutional spheres. Indeed, an important step in the CLIOS System representation is to identify and characterize these links. Understanding nested complexity is a necessary step in moving towards better integrating institutional design with technical design.
6 We realize that representing the physical and institutional spheres in this manner – more structured and quantifiable
physical domains, compared to messier, more chaotic, and more complex, human-based institutional spheres – runs the risk of overstating the dichotomy between systems composed of “things” and systems composed of “people.” This discussion has been taken up by researchers from many disciplines; we would refer the reader to Almond and Genco, 1977 and Flood and Carson, 1993 (in particular, pp. 251-2).
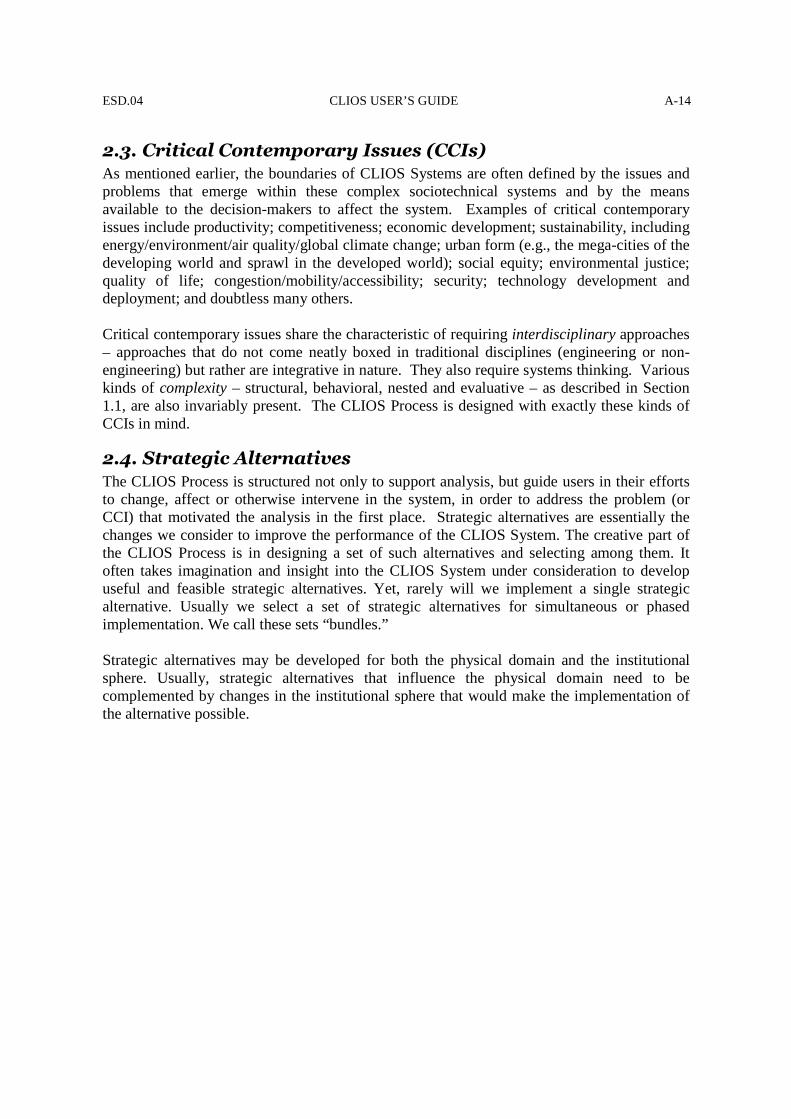
ESD.04 CLIOS USER’S GUIDE A-14
2.3. Critical Contemporary Issues (CCIs) As mentioned earlier, the boundaries of CLIOS Systems are often defined by the issues and problems that emerge within these complex sociotechnical systems and by the means available to the decision-makers to affect the system. Examples of critical contemporary issues include productivity; competitiveness; economic development; sustainability, including energy/environment/air quality/global climate change; urban form (e.g., the mega-cities of the developing world and sprawl in the developed world); social equity; environmental justice; quality of life; congestion/mobility/accessibility; security; technology development and deployment; and doubtless many others. Critical contemporary issues share the characteristic of requiring interdisciplinary approaches – approaches that do not come neatly boxed in traditional disciplines (engineering or non-engineering) but rather are integrative in nature. They also require systems thinking. Various kinds of complexity – structural, behavioral, nested and evaluative – as described in Section 1.1, are also invariably present. The CLIOS Process is designed with exactly these kinds of CCIs in mind.
2.4. Strategic Alternatives
The CLIOS Process is structured not only to support analysis, but guide users in their efforts to change, affect or otherwise intervene in the system, in order to address the problem (or CCI) that motivated the analysis in the first place. Strategic alternatives are essentially the changes we consider to improve the performance of the CLIOS System. The creative part of the CLIOS Process is in designing a set of such alternatives and selecting among them. It often takes imagination and insight into the CLIOS System under consideration to develop useful and feasible strategic alternatives. Yet, rarely will we implement a single strategic alternative. Usually we select a set of strategic alternatives for simultaneous or phased implementation. We call these sets “bundles.” Strategic alternatives may be developed for both the physical domain and the institutional sphere. Usually, strategic alternatives that influence the physical domain need to be complemented by changes in the institutional sphere that would make the implementation of the alternative possible.

ESD.04 CLIOS USER’S GUIDE A-15
3. OVERVIEW OF THE CLIOS PROCESS We will now walk through the CLIOS Process step-by-step, presenting the basic or “barebones” structure of the CLIOS Process. At several points in our discussion, we will also describe ways in which the CLIOS Process can be “tailored” by utilizing additional methods, both quantitative and qualitative, at various steps in the process. In order to maintain clarity, we will differentiate between what the authors consider to be (a) the core of the CLIOS Process, (b) examples of how to carry out specific steps in the CLIOS Process, and (c) specific models and frameworks that can be used to “tailor” the CLIOS Process.
3.1. The Basic Structure: 3 Stages and 12 Steps The CLIOS Process is composed of twelve steps, divided into three stages (see Figure 2). The three stages are: Representation; Design, Evaluation and Selection; and Implementation. In Stage One – Representation – the CLIOS System representation is created and considered in terms of both its structure and behavior. In this stage, we also establish preliminary goals for the CLIOS System – i.e. in what ways do we want to improve its performance. In Stage Two – Design, Evaluation and Selection –strategic alternatives for performance improvements to the physical domain and institutional sphere are designed, evaluated and finally some are selected. In Stage Three – Implementation – implementation plans for the physical domain and the institutional sphere are designed and refined. An overview of the three stages is shown in Table 1.
Table 1: Summary of Three Stages
Stage Key Ideas Outputs Representation � Understanding and visualizing the
structure and behavior � Establishing preliminary goals
System description, issue identification, goal identification, and structural representation
Design, Evaluation, and Selection
� Refining goals aimed at improvement of the CLIOS System
� Developing bundles of strategic alternatives
Identification of performance measures, identification and design of strategic alternatives, evaluation of bundles of strategic alternatives, and selection of the best performing bundle(s).
Implementation � Implementing bundles of strategic alternatives
� Following-through – changing and monitoring the performance of the CLIOS System
Implementation strategy for strategic alternatives in the physical domain and the institutional sphere, actual implementation of alternatives, and post-implementation evaluation.
In using the CLIOS Process, the analyst will often need to pose questions at each stage similar to those shown in Table 2 below.

ESD.04 CLIOS USER’S GUIDE A-16
Table 2: Sample questions to be answered in each CLIOS Process Stage
In Stage One, regarding the representation of the CLIOS System structure, we can ask questions such as the following: � Can we break out the physical domain into relatively independent subsystems? � What are the technical, economic, and social aspects of each subsystem? � What are the main components of each identified subsystem? � How do the physical subsystems relate to the institutional sphere? � What are the main actor groups and who are the key individual actors/organizations on the
institutional sphere that impact the physical domain or are affected by it? Also in Stage One, regarding the representation of the behavior of the CLIOS System, we can ask: � What is the degree and nature of the connections between subsystems? � Are the connections weak or strong? � Are there important feedback loops connecting subsystems? � What insights can we gain into emergent behavior? In both the structural and behavioral representation of the system, the analyst is guided by the issues and goals of the system, which help to bound the system and highlight the characteristics most relevant to the problem(s) motivating the analysis.
Turning to the design, evaluation, and selection in Stage Two, we look at both how different strategic alternatives change system performance as well as preferences of different stakeholders. � How is performance measured for the entire CLIOS System as well as the physical
subsystems? � How do key stakeholders and decisionmakers measure or rank different types of performance? � What are the tradeoffs among the various dimensions of performance (e.g. cost vs.
performance) � What strategic alternatives can lead to improved performance? � How can we combine or “bundle” strategic alternatives to improve the system? � Which bundle is selected for implementation?
Finally, reaching Stage Three, implementation of the CLIOS Process, we can ask the following: � How do these performance improvements actually get implemented, if at all? � What compromises have to be made in the name of implementation? � What actors/organizations on the institutional sphere have an influence on the parts of the
system targeted for intervention? How are these actors/organizations related to each other? � Do the types of policies made by different organizations on the institutional sphere reinforce or
counter each other? � Under the current institutional structure, can organizations manage the system to achieve target
levels of performance?
In summary, the first stage is used to understand structural, behavioral, nested, and evaluative complexity; the second stage is used to create and evaluate strategic alternatives for improving system performance; and the final stage brings various alternatives for the physical and institutional systems together to form and implement a feasible strategy or plan for improving the CLIOS System. One of the differences of the CLIOS Process from other system approaches is that the strategic alternatives for implementation may include changes to both the physical and institutional systems.

ESD.04 CLIOS USER’S GUIDE A-17
We now present the full CLIOS Process in Figure 2. The twelve steps are coded by the shading of the boxes to indicate whether they are part of the representation; design, evaluation and selection; or implementation stage. Step 5 indicates more of a transition, than a “step” per se in the analysis. This marks the key transition from a descriptive treatment (trying to understand) to a prescriptive treatment (trying to intervene, change, improve) of the system.
Figure 2: The Twelve Steps of the CLIOS Process
PHASES STEPS
REPRESENTATION
DESIGN, EVALUATION, & SELECTION
IMPLEMENTATION & ADAPTATION
2. Identify Subsystems in Physical Domain & Groups
on Institutional Sphere
1. Describe CLIOS System: Checklists & Preliminary
Goal Identification
3. Populate the Physical Domain & Institutional
Sphere
5. Transition from Descriptive to Prescriptive Treatment of System
6. Refine CLIOS System Goals & Identify
Performance Measures
7. Identify & Design Strategic Alternatives for System
Improvements
8. Identify Important Areas of Uncertainty
9. Evaluate Strategic Alternatives & Select
“Bundles”
10. Physical Domain / Subsystems
11. Institutional Sphere
12. Evaluate, Monitor & Adapt Strategic Alternatives
for CLIOS System
Design and Implement Plan for:
4A. Describe Components 4B. Describe Links
Plan and Implement Changes to…

ESD.04 CLIOS USER’S GUIDE A-18
Many of the steps in the process are concurrent. For example, one identifies and describes both the components and the links between those components at the same time (Steps 4A and 4B). Steps 7 and 8 will also occur more or less simultaneously. As one identifies and analyzes strategic alternatives to change the CLIOS system, additional uncertainties may begin to surface. In other words, as one thinks about how to “tinker with” the system, it often becomes clear that one does not fully understand the ways that the whole system will react in response to this “tinkering,” both in the short and long run. The reader should bear in mind that while we show the CLIOS Process as a set of ordered steps, we emphasize that this is an iterative process, and not a rigid, once-through process. Indeed, as shown in Figure 3, there are several important points where iteration can occur. As we go through the steps of the CLIOS Process, we will highlight where and how iteration back to earlier steps can be done (having labeled some of these iterations as A, B, and so on, for reference).
Figure 3: Iteration in the CLIOS Process
A
B C
D
E
2. Identify Subsystems in Physical Domain & Groups
on Institutional Sphere
1. Describe CLIOS System: Checklists & Preliminary
Goal Identification
3. Populate the Physical Domain & Institutional
Sphere
5. Transition from Descriptive to Prescriptive Treatment of System
6. Refine CLIOS System Goals & Identify
Performance Measures
7. Identify & Design Strategic Alternatives for System
Improvements
8. Identify Important Areas of Uncertainty
9. Evaluate Strategic Alternatives & Select
“Bundles”
10. Physical Domain / Subsystems
11. Institutional Sphere
12. Evaluate, Monitor & Adapt Strategic Alternatives
for CLIOS System
Design and Implement Plan for:
4A. Describe Components 4B. Describe Links
F
G
Plan and Implement Changes to…
ESD.04 CLIOS USER’S GUIDE A-19
3.2. Tailoring the CLIOS Process The above discussion sketches out the basic structure for the CLIOS Process. However, we have noted earlier that this is a flexible and modular process. Additional tools and methods of analysis can be used to support the twelve steps introduced in Figure 2. As a useful analogy for understanding the modularity of the CLIOS Process, one can say that the CLIOS Process is structured like a Christmas tree. Its overall structure allows for quantitative and qualitative analytical tools (we call these “models” and “frameworks”), which are suitable for each stage/step to be “attached” to the CLIOS Process like ornaments on a tree. When conducting the CLIOS Process, one therefore has the opportunity to tailor the process according to the needs and abilities of the users – whether students, decisionmakers, experts/analysts or stakeholders. Presented later in this paper (Appendix A) is an overview of various tools (or “ornaments”) and how these tools can be selected to “hang on to the CLIOS Process Christmas tree.” How one decides to decorate the tree depends on the particular CLIOS System in question, the motivation for the analysis and the level of analytical sophistication desired. The selection and use of these tools will also depend upon the training and background of the individual or group undertaking the CLIOS Process, the data available, and the amount of time that can be dedicated to the CLIOS Process, among other factors. For this reason, we suggest that it is a flexible process.
MODELS AND FRAMEWORKS As a note on how to read this user’s guide, as we describe the steps in the CLIOS Process, we use separate boxes such as this box in order to highlight where specific models or frameworks – the “ornaments” on the CLIOS Process “Christmas tree” – can be applied to help the analysts through one or more steps in the process. Although additional models and frameworks can be applied to support the analysis of most of the steps in the CLIOS Process, they will be most useful beginning after Step 5, when we transition from a descriptive to prescriptive treatment of the CLIOS System.
3.3. Learning about CLIOS Systems In essence, the CLIOS Process is set up as an approach to learn about CLIOS systems and structure analyses in a way that enables continuous learning for students, decisionmakers, and stakeholders. The learning process occurs regardless of whether the CLIOS Process is carried out by individuals or a group. Figure 4 illustrates how the understanding of the CLIOS System should evolve as one progresses through the 12 steps of the CLIOS Process.

ESD.04 CLIOS USER’S GUIDE A-20
Figure 4: Learning Continuum in the CLIOS Process
Again, it is important to highlight Step 5 as a transition point in the CLIOS Process as one shifts from a mode of describing and understanding the system, to a more “prescriptive” mode in which one analyzes how to change (and hopefully improve!) the system. However, because this is an iterative process, even during the “prescriptive” mode, one’s descriptive understanding of the system can change. The analysts can update their understanding of the system structure and behavior, decide how to better “bound” the system, and appreciate its key uncertainties, as they assess different possibilities for improving the system.
First order understanding of CLIOS System Mental mapping of physical & institutional systems General insights regarding CLIOS System structure & behavior More detailed & quantitative understanding of system behavior Deeper understanding of and appreciation for system possibilities, limits, uncertainties, and sensitivities Updating of prior beliefs/models regarding system goals, structure, & behavior
2. Identify Subsystems in Physical Domain & Groups
on Institutional Sphere
1. Describe CLIOS System: Checklists & Preliminary
Goal Identification
3. Populate the Physical Domain & Institutional
Sphere
5. Transition from Descriptive to Prescriptive Treatment of System
6. Refine CLIOS System Goals & Identify
Performance Measures
7. Identify & Design Strategic Alternatives for System
Improvements
8. Identify Important Areas of Uncertainty
9. Evaluate Strategic Alternatives & Select
“Bundles”
10. Physical Domain / Subsystems
11. Institutional Sphere
12. Evaluate, Monitor & Adapt Strategic Alternatives
for CLIOS System
Design and Implement Plan for:
4A. Describe Components 4B. Describe Links
ESD.04 CLIOS USER’S GUIDE A-21
4. STAGE 1: REPRESENTATION The representation stage aids in the understanding of the complete CLIOS System by examining the structures and behaviors of the physical subsystems and institutional sphere and the interactions between them. The CLIOS Process usually uses a combination of diagrams and text to capture the critical aspects of the CLIOS System and present them in an easy-to-comprehend format. This allows the users of the CLIOS Process to understand the CLIOS System and establishes the basis for completing the second and third stages of the CLIOS Process. When the CLIOS Process is carried out by a group of analysts, decisionmakers, and stakeholders, the representation stage is used to create a common understanding of the system among these actors. In this manner, the issues and goals associated with the CLIOS System can be reasonably discussed based on a good understanding of its basic characteristics. Some agreement on the issues and goals will be necessary to be able to successfully create and, ultimately, implement strategic alternatives for system performance improvements in later stages. While all the stakeholders may not agree about goals at this early representation stage, it is not too early to start building a common understanding that can lead, we hope, to consensus in the later stages. In the steps below, we present one approach to complex system representation. It is, by no means, the only way. It may not even be the best way for all CLIOS Systems. However, this approach has proven useful in the CLIOS System representations that have been conducted to date. Because this approach to the CLIOS Process is flexible, it allows for creativity on the part of the users of the CLIOS Process, as to how to develop their system representations.
4.1. Step 1: Describe CLIOS System: Checklists and Preliminary Goal Identification In developing the CLIOS System representation, we first create several checklists to serve as a high-level examination of the CLIOS System, as shown in Figure 5. The lists should address the question: “what is it about the system that makes it interesting?” (Puccia and Levins, 1985). One can draw upon a wide range of sources: academic articles and books, popular press, reports published by government, business, non-governmental organizations, etc. Understanding the historical context and development of the system can also be useful for insights regarding current issues, challenges, and recurring themes or issues. For example, earlier attempts to change and improve the system, whether successes or failures, can highlight certain structures or dynamics within the system. It is particularly useful if the CLIOS Process user has previous experience with the CLIOS System under study, or with other related systems, and can bring that experience to bear on the checklists and preliminary goal identification. The first of the checklists is the characteristics checklist that may relate to: (a) the temporal and geographic scale of the system, (b) the core technologies and systems, (c) the natural physical conditions that affect or are affected by the system, (d) the key economic and market factors, (e) important social or political factors or controversies related to the system and (f) the historical development and context of the CLIOS System.

ESD.04 CLIOS USER’S GUIDE A-22
The second checklist captures opportunities, issues and challenges – those aspects of the CLIOS System for which we may seek constructive improvements through strategic alternatives in Stage 2. Finally, in the third checklist, we identify preliminary system goals, which often relate to the opportunities, issues and challenges found in the second checklist. The initial checklists for the CLIOS System serve as a valuable basis for the rest of the analysis. In particular, as we continue to develop the CLIOS System representation, we can return to these checklists to identify any major issues that have been omitted. The checklists should capture the concerns and needs of a broad set of stakeholders, including policy makers, system managers and operators, customers and so forth. As the CLIOS Process is intended to facilitate better performance of the system, one has to ask “What are the management and policy questions that need to be addressed?” and “What are the goals for the CLIOS System?”
Figure 5: CLIOS System Checklists This first step also implicitly bounds the CLIOS System, at least preliminarily. Given that CLIOS is an iterative process, boundaries are expected to expand and/or contract as the CLIOS Process advances and focuses more clearly. Redefining the system boundaries in later iterations may actually signal a shift in the analysts’ mental models of the system, as suggested by Figure 4. Our first example where iteration may occur, identified as “A” in Figure 3, is the iteration that occurs between Step 1 and Step 6. In Step 1, some preliminary system goals are identified as the overarching description of the CLIOS System is developed. However, these goals will be revisited in greater depth in Step 6 (Refine CLIOS System Goals and Identify Performance Measures). This occurs in Stage 2, after the CLIOS System representation has been developed, and the user better understands the system. Specifying system goals via performance measures (in Step 6) may lead one to revisit the system goals as originally conceived (in Step 1). Note that this iteration is bidirectional. Upon reaching Step 6, another review of the checklists in Step 1 will ensure that no relevant characteristics, opportunities, issues and challenges have been omitted from the analysis.
Characteristics Checklist
Opportunities/Issues/ Challenges Checklist
Preliminary CLIOS System Goals
Checklist
ESD.04 CLIOS USER’S GUIDE A-23
4.2. Step 2: Identify Subsystems in the Physical Domain and Groups on the Institutional Sphere To outline the general structure of the CLIOS System, we determine (a) which major subsystems make up the physical domain of the CLIOS System, (b) who the main actor groups are on the institutional sphere and (c) how they relate to one another on a macro-level. This is essentially establishing the structure as illustrated in Figure 1. One useful way to identify these subsystems and actor groups is by grouping the issues identified in the first step into different categories. Another approach is to organize the subsystems according to their common technological characteristics, functions or how they fulfill the needs of the various actor groups on the institutional sphere. For the Physical Domain: Our approach to learning about the CLIOS System and organizing one’s ideas about how the system works, is to parse the physical system into subsystems, map out the structure of those subsystems (which can be envisioned as layers), and finally identify the key linkages between subsystems. This is a difficult process, but worthwhile in that many of the insights into the structure and behavior of the CLIOS System will come through, while thinking about how it can be subdivided into the different layers. For the Institutional Sphere: We then identify major actor groups on the institutional sphere. The general categories may include government agencies, private sector firms, citizen groups, independent expert/advisory entities and so forth. This can be derived from the checklists in terms of who manages the system, who is affected by it, who attempts to influence it and, in general, who worries about it.
4.3. Step 3: Populate the Physical Domain and the Institutional Sphere Populating the Physical Domain: In this step, we employ the type of basic subsystem diagram common in systems sciences, “defined as having components and relations that may be represented (at least in principle) as a network-type diagram with nodes representing components and lines the relationships” (Flood and Carson, 1993). Initial CLIOS subsystem diagrams are created by detailing each subsystem – for example, passenger transportation, land use, the environment, etc. – and identifying the major components in each subsystem and the links indicating influence of components on each other. Sometimes a component can be common to more than one subsystem. In these cases the component is called a common driver. We will discuss the different types of components later in this paper. Figure 6 shows the populated subsystems and the concept of the common driver linking those subsystems.

ESD.04 CLIOS USER’S GUIDE A-24
Figure 6: Populating the Subsystem Diagrams7
While the subsystem diagrams help to represent the CLIOS System, the use of this type of diagram can quickly reach its limit. There is a cognitive upper bound to the number of “components” that can be represented within such a diagram, while still providing an opportunity for insight for the creator or user of the diagram.8 However, remaining within this cognitive limit can result in oversimplification of the system – that is, too few components that are too “macro” in nature to be of value leaving some of its subsystems poorly represented. One technique that can be used for increasing the resolution of the system representation without creating overcrowded diagrams is expanding. Expanding focuses on critical components and magnifies their functions into separate diagrams for more detailed study. This is shown in Figure 7.
MODELS AND FRAMEWORKS Different representation techniques can be used and depends on the analysts’ preferences. For example, the Design Structure Matrix (DSM) is one alternative to the diagrammatic approach shown here.
It is left to the discretion of the CLIOS Process users to decide which approach is more appropriate for their objectives. In this paper, we suggest the construction of system diagrams as one way to usefully represent the system, but by no means do we consider this as the sole or the optimal method for all CLIOS Process applications. The nomenclature that is introduced here, however, can be useful for communication purposes as a common language irrespective of which representation method is used.
7 The reader may notice similarities of the system representation as described in Step 3 of the CLIOS Process and other
methods such as system dynamics and object-process methodology (OPM). 8 From the authors’ experiences, a single subsystem diagram should contain approximately 20 components—because of
cognitive limits--although that number may be substantially more or less depending upon the preferences of the analyst.
Subsystem 1
Subsystem 2
Subsystem 3
Subsystem 4
Com
mon D
river Com
mon
Driver
Component Link
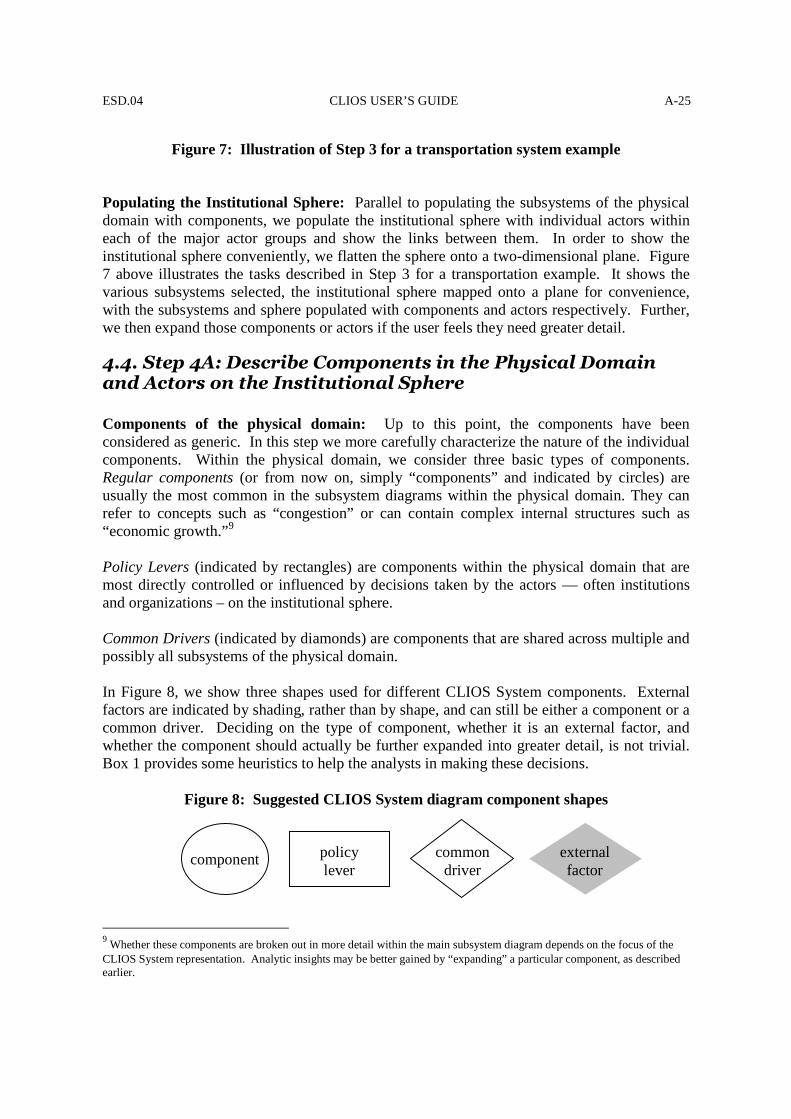
ESD.04 CLIOS USER’S GUIDE A-25
Figure 7: Illustration of Step 3 for a transportation system example Populating the Institutional Sphere: Parallel to populating the subsystems of the physical domain with components, we populate the institutional sphere with individual actors within each of the major actor groups and show the links between them. In order to show the institutional sphere conveniently, we flatten the sphere onto a two-dimensional plane. Figure 7 above illustrates the tasks described in Step 3 for a transportation example. It shows the various subsystems selected, the institutional sphere mapped onto a plane for convenience, with the subsystems and sphere populated with components and actors respectively. Further, we then expand those components or actors if the user feels they need greater detail.
4.4. Step 4A: Describe Components in the Physical Domain and Actors on the Institutional Sphere Components of the physical domain: Up to this point, the components have been considered as generic. In this step we more carefully characterize the nature of the individual components. Within the physical domain, we consider three basic types of components. Regular components (or from now on, simply “components” and indicated by circles) are usually the most common in the subsystem diagrams within the physical domain. They can refer to concepts such as “congestion” or can contain complex internal structures such as “economic growth.”9 Policy Levers (indicated by rectangles) are components within the physical domain that are most directly controlled or influenced by decisions taken by the actors — often institutions and organizations – on the institutional sphere. Common Drivers (indicated by diamonds) are components that are shared across multiple and possibly all subsystems of the physical domain. In Figure 8, we show three shapes used for different CLIOS System components. External factors are indicated by shading, rather than by shape, and can still be either a component or a common driver. Deciding on the type of component, whether it is an external factor, and whether the component should actually be further expanded into greater detail, is not trivial. Box 1 provides some heuristics to help the analysts in making these decisions.
Figure 8: Suggested CLIOS System diagram component shapes
9 Whether these components are broken out in more detail within the main subsystem diagram depends on the focus of the
CLIOS System representation. Analytic insights may be better gained by “expanding” a particular component, as described earlier.
component policy lever
common driver
external factor
ESD.04 CLIOS USER’S GUIDE A-26
Returning to the idea of nested complexity, the policy levers are those components that directly link the actors on the institutional sphere to the subsystems in the physical domain. The common drivers, on the other hand, emerge from the process of dividing the system into separate subsystems. They are important components that “drive” the behavior of more than one of the subsystems. The common drivers are important both for understanding the behavior of the CLIOS System as well for implementing changes to the system (during later stages in the CLIOS Process). Many common drivers are also external factors that are exogenous to the physical domain. They may constitute major sources of uncertainty, since they impact the physical domain at several different subsystems. The uncertainty of common drivers, for example, population and economic growth, will have to be taken into account in any evaluation of strategic alternatives for system improvements. Actors on the institutional sphere: In parallel to describing the components in the physical domain, we also describe the actors on the institutional sphere. In describing the actors, we can identify important characteristics, such as their power or mandate over different parts of the physical subsystems, their interests in the subsystems, their expertise and resources and their positions with regards to different potential strategic alternatives.

ESD.04 CLIOS USER’S GUIDE A-27
Box 1: A note on heuristics for scaling and bounding the CLIOS System
As we introduce the basic concepts of the CLIOS Process’ representation stage in general terms, there are many specific questions the reader might ask. Where is the boundary of the CLIOS System? How does one break up the physical domain into subsystems? When should a component in a physical subsystem be expanded into subcomponents? Similarly, when should an organization on the institutional sphere be broken up into sub-organizations?
In Step 3 of the CLIOS Process we need to begin to explicitly address these questions. These are all difficult questions. Indeed, there is no right answer to them. As Maier and Rechtin note, system analysis is more of an art rather than science; hence, analysts are expected to use heuristics and their experience to make these choices. A second reason is that any answer to these is dependent on the scale and scope at which we want to consider the CLIOS System and indeed that can change as the analysis advances. As mentioned previously, these changes are indicative of shifting mental models and possibly precursors to important insights (as shown in Figure 4). That being said, there are heuristics that the analyst can use to support these decisions. We describe some of these below. However, caveat emptor – as with all heuristics, they can be contradictory, not universally applicable, and certainly the list is not exhaustive.
1. The analysis needs to take into account the actual scale of the system (spatial and temporal), and the magnitude and scope of its impacts, physical, economical, political or social. This will not only determine where the system boundaries are drawn, but also which subsystems and components will be included.
� Components are the units of analysis for the appropriate level of detail – scale – of the system. For a general transportation system example, vehicles are components and would probably not be analyzed further.
� The scale of the system is determined by whether any meaningful additional insight can be gained through further analysis. There is no need to break down cars into auto parts even if these may play a role in the system (e.g. catalytic converters for reducing pollutants) unless additional insight is gained by doing so.
2. The boundary of a CLIOS System is also determined by what the analysts consider as feasible strategic alternatives. Therefore some macro-level economic and social factors may well fall outside the boundary of the system but would be part of the “relevant environment,” affecting and in some cases affected by the CLIOS System. As will be discussed later, scenario building will be one tool to think systematically about these linkages between the CLIOS System and the relevant environment.
3. Ideally, system boundaries should not reflect ideological convictions and preconceived mental models of the analyst. This is a key reason that a team with members with differing mental models, rather than a single analyst, should ideally work on the CLIOS Process.
4. External factors usually influence the CLIOS System unidirectionally. For a typical urban transportation system, the global economy (an external factor) affects the local economy (a system component and probably a common driver). No component in the urban transportation system can meaningfully affect the global economy and the global economy is too massive to be affected by the local economy of a typical urban area.
5. “Think outside of the box.” Innovative solutions usually lie out of conventional boundaries. Avoiding restrictive boundary setting may facilitate better strategic alternatives.
� Start by representing the big picture. Detail can be added as needed as the CLIOS Process proceeds by using techniques such as expanding or by adding subsystems as necessary.
� System boundaries can be altered as the CLIOS Process unfolds. It is usually easier to narrow the boundaries than it is to expand them, so think broadly at the outset.
ESD.04 CLIOS USER’S GUIDE A-28
4.5. Step 4B: Describe Links As the components are characterized and divided into different types, we also in parallel need to characterize the nature of the several kinds of links. Link notation needs to be consistent; if they represent different things, one should use different diagrammatic components (Flood and Carson, 1993). In the diagrams used in the CLIOS System representation, these links will be largely qualitative. Generally, the links should indicate directionality of influence and feedback loops,10 as well as the magnitude of influence (big/important or small/marginal impacts on the adjoining components). Other possible characteristics to include in the notation for the links could be the timeframe of influence (short-, medium-, or long-term lags), the functional form of the influence (linear/non-linear functions of various forms or threshold effects, step functions), continuous or discontinuous (under what conditions the link is active or inactive), and uncertainty of the effect of one component upon another (including uncertainty in all of the above characteristics). In thinking about the linkages, a key aspect of the CLIOS System representation is to develop a framework for thinking about and describing the links in the system. We identify here three classes of links:
(a) Class 1: links between components in a subsystem, (b) Class 2: links between components in a subsystem and actors on the institutional
sphere (also called “projections”) and (c) Class 3: links between actors on the institutional sphere.
There are several approaches appropriate to each class of links. Generally the links within the physical domain (Class 1) can be analyzed using engineering- and microeconomics-based methods, and will often be quantifiable. Regarding the links from the institutional sphere to the physical subsystems (Class 2, or projections), quantitative analysis is less useful, since human agency and organizational and stakeholders’ interests come into play as they attempt to induce changes in the physical domain. Finally, there are the interactions that take place within the institutional sphere itself (Class 3). Understanding this class of links requires methods drawing upon theories of organizations, institutions, politics and policy. While the interactions within the physical domain and within the institutional spheres more readily fall under the domain of more traditional disciplinary perspectives, we would argue that the interactions between the institutional sphere and physical subsystems are more interdisciplinary and of particular interest to the evolving field of Engineering Systems. Borrowing a phrase from Karl Popper (1972), “obviously what we want is to understand how such non-physical things as purposes, deliberations, plans, decisions, theories, intentions and values, can play a part in bringing about physical changes in the physical world” (cited in Almond and Genco (1977), emphasis in original). In Figure 9 we show some suggested link notation. Components can have weak, average, or strong links to other components. Links can be one way or bi-directional. One can also have links that are positive or negative in their influence on the other component. 10
We suggest that feedback loops in which one component has a feedback loop directly back onto itself would not be used in a CLIOS System representation. Instead, the intervening components need to be identified, to provide insight into the chain of causality that creates this feedback.

ESD.04 CLIOS USER’S GUIDE A-29
Figure 9: Some suggested link shapes for CLIOS subsystem diagrams
LINK SHAPE Class 1 (link between components of physical subsystems) Class 3 (link between actors on the institutional sphere)
Class 2 (links “projecting” interactions between the institutional sphere and the physical domain)
Weak
Average
Strong
Bi-directional
Positive (increase in component A results in increase in component B)
Negative (increase in component A results in decrease in component B)
Different types of links can be identified based on what “goods” they carry from one component/actor to another. These include:
� Causal: Shows causation between two components, two actors, or a component and an actor.
� Informational: Shows information/decision flow between two actors or two components
� Financial: Shows flow of financial resources between two actors � Control: Usually associated with relations among organizations/institutions, and
between organizations and the physical domain; can be advisory or hierarchical. � Mass Transfer: Shows flow of materials between two components � Energy Transfer: Shows flow of energy between two components
The exact shape or notation for the components and the links, or the level of detail in describing the types of links, is solely the decision of the analysts or decisionmaker following the CLIOS Process. What is most important is that the analyst does follow a systematic process of thinking through and attempting to classify the links in their systems. In that manner, the analysts will learn more about the CLIOS system, and gain intuition regarding its structure and behavior (refer again to Figure 4). The diagrams are not as important as the thinking that went into making the diagrams! To quote Edward Tufte. “The act of arranging information becomes an act of insight” Now, having described our suggested notation for the CLIOS System representation, we show a CLIOS System representation in Figure 10.
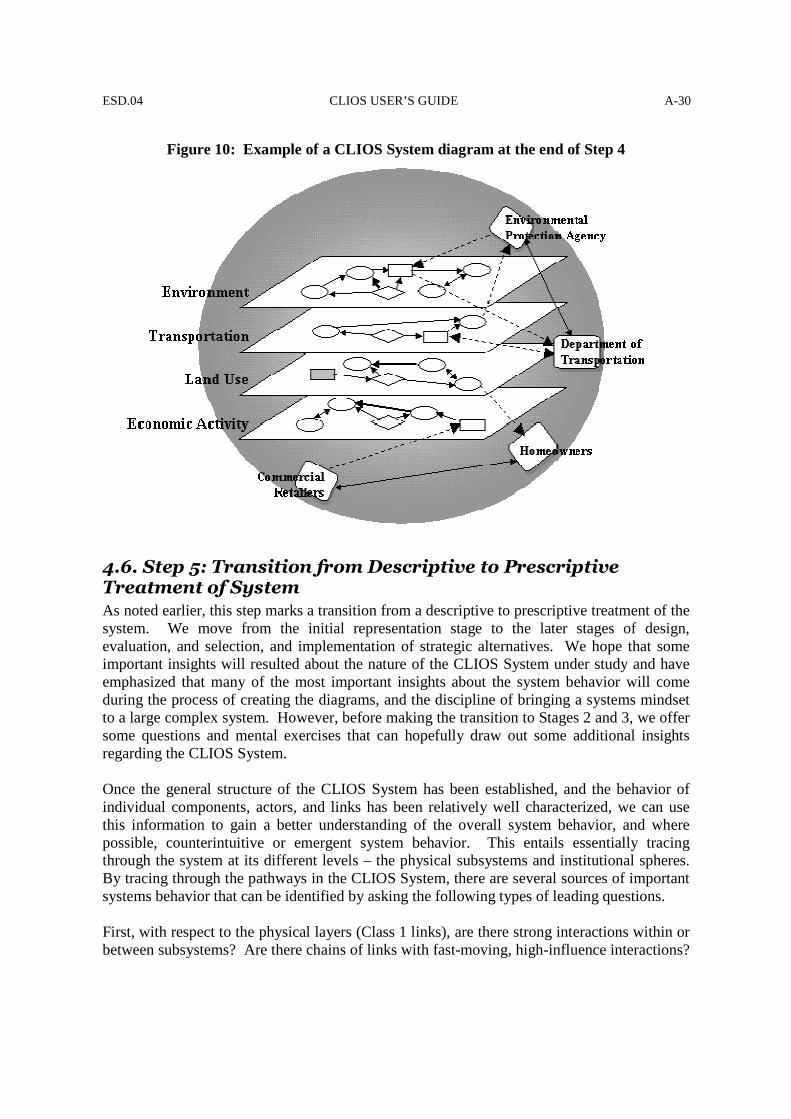
ESD.04 CLIOS USER’S GUIDE A-30
Figure 10: Example of a CLIOS System diagram at the end of Step 4
4.6. Step 5: Transition from Descriptive to Prescriptive Treatment of System As noted earlier, this step marks a transition from a descriptive to prescriptive treatment of the system. We move from the initial representation stage to the later stages of design, evaluation, and selection, and implementation of strategic alternatives. We hope that some important insights will resulted about the nature of the CLIOS System under study and have emphasized that many of the most important insights about the system behavior will come during the process of creating the diagrams, and the discipline of bringing a systems mindset to a large complex system. However, before making the transition to Stages 2 and 3, we offer some questions and mental exercises that can hopefully draw out some additional insights regarding the CLIOS System. Once the general structure of the CLIOS System has been established, and the behavior of individual components, actors, and links has been relatively well characterized, we can use this information to gain a better understanding of the overall system behavior, and where possible, counterintuitive or emergent system behavior. This entails essentially tracing through the system at its different levels – the physical subsystems and institutional spheres. By tracing through the pathways in the CLIOS System, there are several sources of important systems behavior that can be identified by asking the following types of leading questions. First, with respect to the physical layers (Class 1 links), are there strong interactions within or between subsystems? Are there chains of links with fast-moving, high-influence interactions?
ESD.04 CLIOS USER’S GUIDE A-31
Are some of the paths of links strongly non-linear and/or irreversible in their impact? Finally, can strong positive or negative feedback loops be identified? Second, looking at the links between the institutional sphere and the physical subsystems (Class 2 links or projections), can we identify components within the physical domains that are influenced by many different organizations in the institutional sphere? If so, are the organizations pushing the system in the same direction, or is there competition among organizations in the direction of influence? Alternatively, do some organizations on the institutional sphere have an influence on many components within the physical domain? Finally, within the institutional sphere itself (Class 3 links), are the relationships between organizations characterized by conflict or cooperation? Are there any high-influence interactions or particularly strong organizations that have direct impacts on many other organizations within the institutional sphere? What is the hierarchical structure of the institutional sphere, and are there strong command-and-control relations among the organizations and/or are they more loosely coupled? What is the nature of interaction between several organizations that all influence the same subsystems within the physical domain? In this stage, rather than attempting to quantify the relationships, the focus should be more on simply “getting the sign right” (Marks, 2002) or understanding the direction of change through a series of complex and uncertain chains of links. Furthermore, here we may also begin to develop a catalogue of issues and possible strategic alternatives for the CLIOS System. The idea is that in a CLIOS System representation, certain links – fast, large magnitude, irreversible, etc. – should raise a warning flag that there could be a potential problem (or opportunity) arising from this link or sequence of links, forming a loop, which can create a “vicious” or “virtuous” cycle. In addition to these high impact links or chains of links, certain components may be pulled in two directions simultaneously by two different loops. These loops can be purely within the physical domain, but are also likely to arise when different actors on the institutional sphere have an influence on the same components within the physical domain. Thinking carefully through these questions can generate some insights regarding how to improve the system, some of the key uncertainties, and possible implementation issues that may arise. We now move to Stage 2.

ESD.04 CLIOS USER’S GUIDE A-32
5. STAGE 2: DESIGN, EVALUATION AND SELECTION Having considered the CLIOS System from the standpoint of its structure and behavior during the Representation stage, the next stage focuses on the design, evaluation, and selection aspects of the CLIOS Process. We therefore begin to consider in greater depth the evaluative complexity of the CLIOS System, in order to identify opportunities for improving both the physical domain and the institutional sphere. This culminates in the development of a robust bundle of strategic alternatives. Among these strategic alternatives may be organizational and institutional changes that may be necessary to meet the CLIOS System goals (defined in Step 1, and to be reconsidered in Step 6). As part of Stage 2, we can also proceed with using the appropriate (quantitative) models using the refined system goals and the identified performance measures as guidance for model scope and scale. These models should be validated to evaluate the current state of the system; they will subsequently serve as a basis for comparing strategic alternatives. The models can be the quantitative analog of the qualitative representation built in the representation stage, or can be constructed from scratch simply using insights from the qualitative representation. Two basic model categories can be used: case-specific (i.e., models that track limited facets of the CLIOS System on the component or subsystem level; in our transportation example a traffic simulation would be such a model) and system-wide (i.e., models that aim to describe interactions at the CLIOS system level, such as a system dynamics simulation that combines economic, environmental and transportation interactions). Ideally, the system-wide models should integrate inputs from the independent models in a system representation consistent with the qualitative insights that are gained from Stage 1.
5.1. Step 6: Refine CLIOS System Goals and Identify Performance Measures Entering the second stage of the CLIOS Process, it is necessary to refine the preliminary goals developed in Step 1 to reflect the knowledge and insight gained at this point in the process. The Representation Stage should have revealed the needs and perspectives of the stakeholders more clearly and captured the opportunities and issues of the CLIOS system under study. This additional information can be used to refocus the preliminary goals into a concise, normative view of what the desired future state of the system should be, and give the analyst an idea of which goals are attainable and realistic and which goals may need to be modified in the face of reality. The concrete vision of the desired future state of the system, as prescribed by the refined goals, can then be used to identify performance measures that mark the progress from the current to the desired future state. Usually, these performance measures would be properties of components in the physical domain. Performance measures for CLIOS Systems are often difficult to define, and it is not uncommon that consensus fails to be reached on even how to measure or prioritize different performance measures. In this sense, we are confronted with the evaluative complexity inherent in CLIOS Systems. “Performance” will depend heavily upon the viewpoint of the various stakeholders.
ESD.04 CLIOS USER’S GUIDE A-33
A
MODELS AND FRAMEWORKS: A useful way of tying together the needs/goals of the stakeholders with the identified performance measures is by the Needs-Metrics Matrix as described by Ulrich and Eppinger.
One may even find that difficulties in defining performance measures that capture all of the phenomena of interest lead one to revisit Step 1, to challenge the initial description, preliminary goals, and boundaries of the CLIOS System. This is another
example of the need to iterate throughout the CLIOS Process.
Box 2: Examples of performance measures in CLIOS System components for the case of urban transportation
In the case of urban transportation, certain common drivers such as economic development are important performance measures for many stakeholders. First, these measures reflect the economic health of the city. Also, economic growth depends in part upon the efficacy of the transportation system to bring goods to customers, customers to stores and employees to work. Therefore, economic health can indirectly reflect a well-functioning transportation system. Policy levers can also be performance measures in themselves. For example, the level of investment in public transport can be viewed as a performance measure, although it actually measures the financial inputs to the system, and not necessarily the output of that investment (e.g. better roads, cleaner bus fleets). Of course, regular components such as congestion or human health, which may not be common drivers or policy levers, can be performance measures as well.
5.2. Step 7: Identify and Design Strategic Alternatives for CLIOS System Improvement The establishment of better-refined goals and performance measures naturally leads to questions about how CLIOS System performance can be improved through strategic alternatives. This is a creative step in the CLIOS Process where imagination in developing strategic alternatives is to be valued and out-of-the-box thinking and brainstorming is often a key to success. Considering what kinds of strategic alternatives have worked well in similar CLIOS Systems can be helpful. This step is meant to bring out a wide range of (even if only remotely reasonable) alternatives. Broad and creative thinking is valued here. Detailed evaluation, selection and, of course, elimination of strategic alternatives will come later in Step 9. Performance improvements through strategic alternatives can take three forms. Thinking about nested complexity, we can characterize strategic alternatives as: • physical changes involving direct modification of components in the physical domain
(e.g. expansion of a highway or the construction of a new rail line in our urban transportation example),
• policy-driven changes involving the policy lever projections from the institutional sphere on the physical domain (e.g., a vehicle trade-in policy or congestion pricing in the urban transportation example) and
• actor-based – architectural changes of the institutional sphere either within actors or between actors (e.g. a structural change in the EPA or a change in the way the EPA interacts with DOT on the institutional sphere of a U.S. transportation CLIOS System).

ESD.04 CLIOS USER’S GUIDE A-34
B
Thinking through system performance from the inner physical layers to the outer institutional sphere is a more bottom-up systems engineering approach, in which we look first at the physical domain and ask how the subsystems in the physical domain – through changes to the components or perhaps, in some cases, changes to the links between components – can lead to better performance. This approach often leads to more technology-driven strategic alternatives relating directly to the physical domain (physical strategic alternatives). In many cases, in order to achieve changes in the physical domain, policy-driven strategic alternatives need to be considered. These strategic alternatives may rely on incentives or disincentives such as taxes, subsidies, voluntary agreements, and restrictions on certain behaviors. Implicit in these types of alternatives is usually an assumption about how a policy change, initiated by actors on the institutional sphere, will cascade through the physical domain, and what changes in the performance measure will occur. Following this process can also reveal where strategic alternatives of this kind are counterproductive, diminishing the performance in other parts of the system. Finally, an important part of Step 7 should be to evaluate the institutional arrangements (sometimes referred to as the institutional “architecture”11) that govern the management of the CLIOS System and then devise strategic alternatives that change these arrangements, in order to support the CLIOS System goals. The institutional sphere can be investigated to highlight the interventions that need to be made on the institutional sphere to accomplish those changes to the physical domain (actor-based strategic alternative).
This is also a step for revisiting the CLIOS representation beginning with Step 2, in which the subsystems in the physical domain and major actor groups on the institutional sphere are first identified. As one considers strategic alternatives, it may
be necessary to modify some of the earlier CLIOS representation to include additional actors or components, or even subsystems and actor groups, that were originally “left out” and that may be necessary to achieve specific performance measures and attain CLIOS System goals.
5.3. Step 8: Flag Important Areas of Uncertainty A parallel activity to the identification of strategic alternatives for CLIOS System performance improvements is to look for uncertainties in the anticipated performance of the CLIOS System, both at the subsystem and the CLIOS System level. In identifying the important uncertainties, one can rely on the insights gained in Stage 1 and Step 6, in which we looked for chains of strong interactions, areas of conflict between stakeholders, or emergent behavior resulting from feedback loops. For example, we should look carefully at individual links or loops that had large magnitude, fast-moving, non-linear or irreversible influences on other components within the system.
11
We often use the term “architecture” to denote organizational interactions among the actors on the institutional sphere of the CLIOS System. This definition is adapted from Sussman and Conklin (2001), where a regional architecture is defined “as a methodology for designing organizational interactions among the various agencies and private-sector firms that would participate in providing transportation services of any type at a regional scale.” Indeed, one can consider a regional architecture as a special case of an architecture, where the CLIOS System is a regional transportation system.

ESD.04 CLIOS USER’S GUIDE A-35
C
The common drivers, given their importance to the performance of a CLIOS System, are another key area that can affect CLIOS System uncertainty. Common drivers in our urban transportation example would include GDP and population, both of which can be highly uncertain, especially in the long-term. Since these factors can simultaneously influence different subsystems in different ways, the overall impact of the common drivers can be difficult to ascertain. Sensitivity analysis exercises can be useful here. These common drivers can have a particularly strong influence on the physical domain when one considers the longer-run evolution of the CLIOS System. For example, whether an economy (a) grows only gradually, with occasional sharp downturns, or (b) suddenly takes off, can radically influence the entire CLIOS System through changes in demand for goods and services, including transportation and energy, levels of investment available, changes in land use patterns, supply and demand for different types of technologies, and the relative value placed on the environment and economic growth. Finally, while flagging important areas of uncertainty, we should also consider the impact of external factors, such as macroeconomic growth, and national and international political trends that link a CLIOS system to an even broader system. For this reason, we need to use models and frameworks for understanding uncertainty in open systems.
MODELS AND FRAMEWORKS A promising qualitative methodology for identifying key uncertainties and understanding their impact on the CLIOS System is scenario planning as developed by Royal Dutch/Shell in the years leading up to the oil shocks of the 1970s. Ged Davis, head of Shell’s Scenarios Team, defines scenarios as “coherent, credible stories about alternative futures” (Davis, 2002). Scenarios are used in the corporate context to make decisions in a complex and uncertain environment by fostering a new way of thinking about the future and its impact on strategy. Scenario planning has continued to evolve finding applications in a wide range of contexts besides corporate strategy. Quantitative approaches are of value as well in this step of the CLIOS Process. They include estimation of probabilities for events in the CLIOS System and the use of risk assessment to identify and quantify their expected impacts. Another way of approaching uncertainty is exemplified by real options used to value flexibility and flexible strategic alternatives. One could create more flexible strategic alternatives, which could be modified as an uncertain future played out. McConnell (2005) describes ways that life-cycle flexibility can be integrated into the CLIOS Process.
This may be another important point for iteration back to Step 2. As uncertainties are identified, it may be necessary to reconsider the boundaries of the CLIOS System and how the subsystems in the physical domain and groups on the
institutional sphere appear in the CLIOS representation. It may be that subsystems are characterized in ways that do not help the analyst understand and deal with the key uncertainties. One may also find that important groups on the institutional sphere were
ESD.04 CLIOS USER’S GUIDE A-36
missing or poorly characterized. Therefore, revisiting the diagrams in Steps 2 and onward may be useful for better understanding uncertainties.
5.4. Step 9: Evaluate Strategic Alternatives and “Bundles”
In this step, the individual strategic alternatives that were generated in Step 7 are evaluated using the models developed in Step 6 or additional models if need be. Also, we can return here to the insights gained in Stage 1. Usually, each alternative is examined with regards to how it impacts the CLIOS System, especially for the performance area(s) that it was designed for. The case-specific models are usually adequate for this evaluation. If the strategic alternative is causing the intended performance measure(s) to deteriorate then the strategic alternative usually should be withdrawn from further consideration (or perhaps modified). Further, even for strategic alternatives that are narrowly targeted on specific subsystems or components, the systemic impacts of all strategic alternatives need to be considered, particularly if specific alternatives targeting one performance measure can spillover to other performance measures producing unintended consequences. The value of flexibility in the strategic alternative design, as identified in Step 8, should also be considered at this point.
MODELS AND FRAMEWORKS: Cost-benefit analysis is a well-established tool for comparing, as one would expect, the costs and benefits of different alternatives. This is a well-established and common tool, when applied rigorously and with an understanding of its inherent limitations (specifically, having to reduce a number of disparate costs and benefits to a monetary equivalent). The use of trade-off analysis is an alternative approach which allows comparison of strategic alternatives across difference performance measures. A large number of alternatives can be compared in this manner, and there is no need to reduce performance measures to a single measure. As the name suggests, it allows decisionmakers to clearly see the tradeoffs between alternatives across various dimensions of performance.
Given system complexity, it would be unusual if a single strategic alternative could be deployed and meet CLIOS System goals. In other words, there is no silver bullet for CLIOS Systems. However, by combining strategic alternatives into bundles, the analyst may accomplish two objectives. First, one can mitigate and/or compensate for negative impacts. Given the interconnectedness of the CLIOS System, improvements along one dimension of performance may degrade performance in other areas of the system. Therefore, one should look for alternatives that can either attenuate those negative impacts, or compensate those actors and stakeholders on the institutional sphere that are negatively impacted, by including strategic alternatives that address their needs, even though these alternatives might not have made the initial cut. Second, different combinations of strategic alternatives can improve the robustness of the overall bundle. We here define robustness as the ability of bundles of strategic alternatives to perform reasonably well under different futures. For example, combinations of alternatives can provide insurance against extreme changes or shocks to the system, such as major shifts

ESD.04 CLIOS USER’S GUIDE A-37
in the common drivers. The system-wide models from Step 6 and the uncertainty considerations from Step 8 are critical in the evaluation of bundles of strategic alternatives. Seeking a robust bundle is a different approach than that of identifying a so-called “optimal” bundle, which may only perform optimally under a constrained set of conditions. In fact, we argue that achieving “optimal performance” is an unrealistic goal for a CLIOS System. Given the range of performance measures involved, different stakeholder views and trade-offs needed to obtain the necessary support for implementation, simply finding a feasible bundle (one that works and can be implemented) may be an achievement in itself. One way of displaying robustness is with a matrix, where the columns represent different futures and the rows represent bundles of strategic alternatives; then we can see how the bundles perform compared across a range of futures.
Table 3: Performance of Bundles across Different Futures Future1 Future2 Future3
Bundle 1 + − ++ Bundle 2 + ++ + Bundle 3 + 0 +
Where we see positive outcomes in each of the futures (Bundle 2, in the example), that bundle is then considered robust. In this case, the choice is straightforward. However, if choosing between Bundle 1 and 3, this would depend upon the desire to avoid negative outcomes, in which case Bundle 3 would be preferable, even though Bundle 1 performs well in two out of the three futures, and extremely well in one of the futures. In further developing and refining both strategic alternatives and implementation plans, as will be described below, the focus should be on combining strategic alternatives that can make bundles more robust and implementable across the entire set of possible futures. We note that implicit in characterizing the overall “performance” of a bundle, is weighing the various “performance measures” identified earlier. Evaluative complexity suggests that different stakeholders will see this weighing differently. So, while for illustrative purposes we refer to overall “performance,” we should realize that agreeing on it will often be non-trivial in practice.

ESD.04 CLIOS USER’S GUIDE A-38
6. STAGE 3: IMPLEMENTATION Once a bundle of promising strategic alternatives is identified, the next crucial (but often overlooked) action is to design a plan for implementation. Many analyses come to an end at Step 9 with a list of recommendations, but with little guidance as to what obstacles might arise in the implementation of the recommended actions, or how the political realities will affect the actual deployment. Steps 10 and 11 (shown as parallel steps) are meant to address this common shortcoming. Step 10 focuses on how to implement the strategic alternatives that are related to the physical domain, while Step 11 focuses on how to implement the strategic alternatives on the institutional sphere. Akin to project management, but at a higher level, the implementation plans developed in Steps 10 and 11 would often include deployment budget/financial requirements, actor champion and contingency planning in case some strategic alternatives fail or are not implemented on time. While we separate the two steps to emphasize the need to consider both areas, ideally the two steps will create a common implementation plan where the strategic alternatives for the physical domain and those for the institutional sphere are mutually supportive.
6.1. Step 10: Design and Implement Plan for Physical Domain/Subsystems As mentioned above, this part of the plan for implementation concentrates on the physical and policy-driven types of strategic alternatives in the physical domain. In developing the plan, it is important to consider how each strategic alternative fits with the others. Are they independent or are some prerequisite for the success of the others? Are there enough resources to proceed with all strategic alternatives or do additional fund-raising mechanisms need to be considered? Is the projected time horizon for achieving the CLIOS System goals reasonable based on the ability to implement each alternative? How is implementation affected by failures in meeting the targets of specific strategic alternatives? An additional consideration when we create a plan is focusing on all of the performance measures and the trade-offs among them. Neglecting certain performance measures, especially those measures which are highly valued by certain actors on the institutional sphere, can make the bundle deployment vulnerable to strong resistance from groups that feel that their interests are threatened. This highlights another key task in developing a strategy for implementation, which is the use of the CLIOS System representation to identify which actor is going to implement, monitor and enforce which strategic alternative (i.e., who will be the champion for each strategic alternative?), as well as who has the potential to impede its implementation. These considerations will inform the parallel Step 11.
6.2. Step 11: Design and Implement Plan for Institutional Sphere Strategic alternatives developed earlier in Step 9 include needed changes to the structure of individual actors (e.g. organizations) and the relationships among them. In Step 11, we design a plan for implementation of these actor-based changes. Designing a plan for implementation requires a comprehensive understanding of the characteristics of the

ESD.04 CLIOS USER’S GUIDE A-39
institutional sphere. We consider Step 11 to be a parallel activity to Step 10, with a plan for implementing actor-based changes explicitly being a central part of the overarching implementation plan. When creating a plan for how the institutional architecture can be modified along the lines drawn from the actor-based strategic alternatives of the chosen bundle, due consideration should be given to the actors’ individual and collective goals. By studying actors on the institutional sphere to assess how each strategic alternative affects their interests, one can try to identify both the proponents and opponents of various strategic alternatives. This consideration is central to Step 11 by returning to the issue of mitigation or compensation; one can consider the building of coalitions that will overcome resistance created from the opponents (See Appendix A on the political science concepts of Olsonian and Stiglerian system characteristics). A well-crafted implementation plan for the institutional sphere notwithstanding, institutional changes may work against the goals of some organizations, and generate not only external conflict among organizations, but also internal conflict as organizations attempt to adapt to new institutional interactions. While organizations must “change internally as well as in their institutional interactions with other organizations,” it is also true that “organizations, by their very nature, change slowly” (Sussman, 2000), and we need to be realistic in our time frames for improving our CLIOS System when changes to the institutional sphere are among our strategic alternatives.
6.3. Step 12: Evaluate, Monitor and Adapt Strategic Alternatives Finally, once bundles of strategic alternatives have been implemented, the next step is to monitor and observe outcomes, both in the short and long run. In particular, one should be careful to identify any unanticipated “side effects” such as degradation in the performance of one subsystem due to strategic alternatives targeted at improving a different subsystem. Indeed, creating the capability to monitor key aspects of the CLIOS system, its subsystems and their components can and should be included as part of the plan for implementation in Steps 10 and 11. Step 9 and Step 12 should be considered as complements of one another. While Step 9 represented the ex-ante evaluation of how well bundles of strategic alternatives should perform, Step 12 represents the ex-post evaluation of how well those bundles did perform. Because Step 12 is our final step in the CLIOS Process, it is also a critical point for additional iteration to earlier steps. We highlight four points of iteration here, starting with the iteration back to Step 9. If the strategic alternatives failed to achieve improved system performance, one can return to Step 9, and reevaluate the individual strategic alternatives, or consider different bundles of options that can overcome any problems with the original bundles that were implemented. For example, if a bundle of transportation options worked relatively well, but did not meet their expected performance measures, one can consider adding additional strategic alternatives, perhaps in the area of land use changes, to improve their performance through
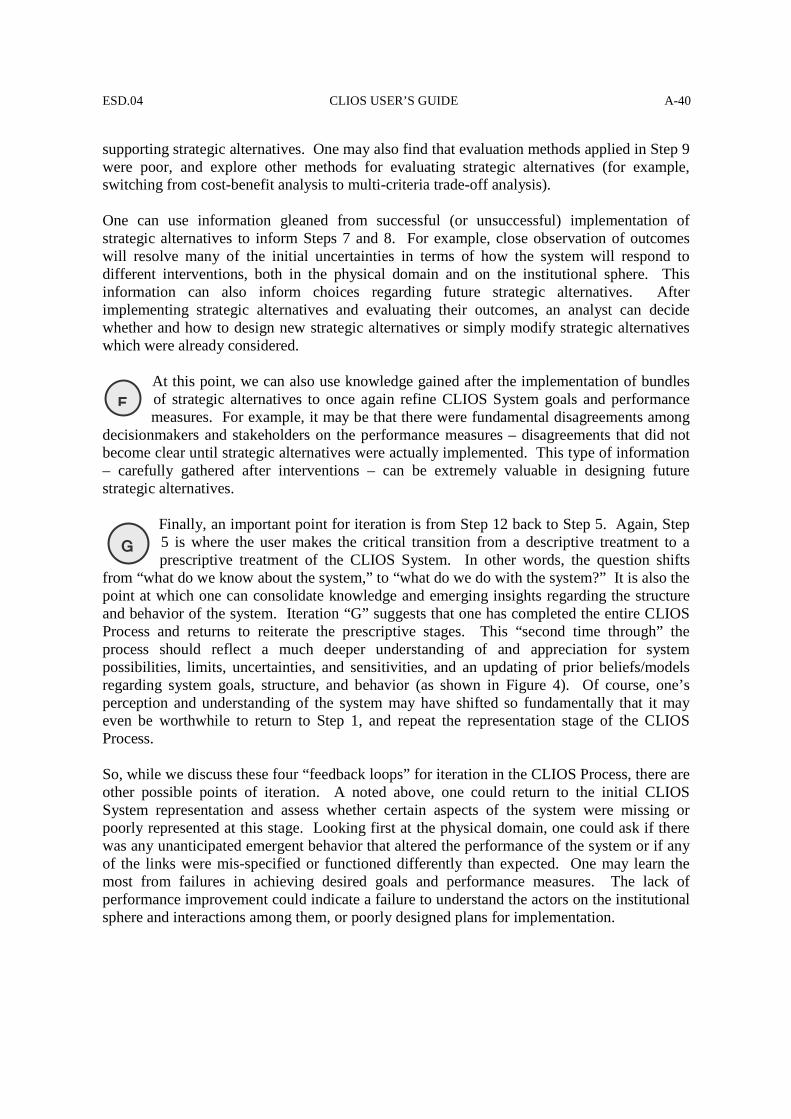
ESD.04 CLIOS USER’S GUIDE A-40
F
G
supporting strategic alternatives. One may also find that evaluation methods applied in Step 9 were poor, and explore other methods for evaluating strategic alternatives (for example, switching from cost-benefit analysis to multi-criteria trade-off analysis). One can use information gleaned from successful (or unsuccessful) implementation of strategic alternatives to inform Steps 7 and 8. For example, close observation of outcomes will resolve many of the initial uncertainties in terms of how the system will respond to different interventions, both in the physical domain and on the institutional sphere. This information can also inform choices regarding future strategic alternatives. After implementing strategic alternatives and evaluating their outcomes, an analyst can decide whether and how to design new strategic alternatives or simply modify strategic alternatives which were already considered.
At this point, we can also use knowledge gained after the implementation of bundles of strategic alternatives to once again refine CLIOS System goals and performance measures. For example, it may be that there were fundamental disagreements among
decisionmakers and stakeholders on the performance measures – disagreements that did not become clear until strategic alternatives were actually implemented. This type of information – carefully gathered after interventions – can be extremely valuable in designing future strategic alternatives.
Finally, an important point for iteration is from Step 12 back to Step 5. Again, Step 5 is where the user makes the critical transition from a descriptive treatment to a prescriptive treatment of the CLIOS System. In other words, the question shifts
from “what do we know about the system,” to “what do we do with the system?” It is also the point at which one can consolidate knowledge and emerging insights regarding the structure and behavior of the system. Iteration “G” suggests that one has completed the entire CLIOS Process and returns to reiterate the prescriptive stages. This “second time through” the process should reflect a much deeper understanding of and appreciation for system possibilities, limits, uncertainties, and sensitivities, and an updating of prior beliefs/models regarding system goals, structure, and behavior (as shown in Figure 4). Of course, one’s perception and understanding of the system may have shifted so fundamentally that it may even be worthwhile to return to Step 1, and repeat the representation stage of the CLIOS Process. So, while we discuss these four “feedback loops” for iteration in the CLIOS Process, there are other possible points of iteration. A noted above, one could return to the initial CLIOS System representation and assess whether certain aspects of the system were missing or poorly represented at this stage. Looking first at the physical domain, one could ask if there was any unanticipated emergent behavior that altered the performance of the system or if any of the links were mis-specified or functioned differently than expected. One may learn the most from failures in achieving desired goals and performance measures. The lack of performance improvement could indicate a failure to understand the actors on the institutional sphere and interactions among them, or poorly designed plans for implementation.

ESD.04 CLIOS USER’S GUIDE A-41
7. Conclusion
his completes our discussion of the basic CLIOS Process. We hope you will find it of value in studying complex sociotechnical systems and seeking means to improve their
performance in ways that are implementable. While we have come to the end of our description of the CLIOS Process, we emphasize one last time the fact that the user will doubtless have the need to iterate back through the process multiple times as understanding grows and conditions change.
T

ESD.04 CLIOS USER’S GUIDE A-42
References (in continued development)
Almond, G.A. and S.J. Genco. 1977. “Clocks, Clocks, and the Study of Politics.” World Politics 29(4) pp. 489-522.
Ferguson, E.S. 1992. Engineering and the Mind’s Eye. Cambridge, MA: MIT Press.
Flood, R.L. and E.R. Carson. 1993. Dealing with Complexity: An Introduction to the Theory and Application of Systems Science. New York: Plenum Press.
Holland, J.H. 1998. Emergence: from chaos to order. Reading, MA: Perseus Books.
Lloyd, S. 2002. “Complex Systems: A Review.” Proceedings of the ESD Internal Symposium. May 29-30, Cambridge, MA.
Magee, C. and L. de Weck. 2002. “An Attempt at Complex System Classification.” Proceedings of the ESD Internal Symposium. May 29-30, Cambridge, MA.
Marks, D. 2002. “The Evolving Role of Systems Analysis in Process and Methods in Large-Scale Public Socio-Technical Systems.” Proceedings of the ESD Internal Symposium. May 29-30, Cambridge, MA.
Moses, J. 2006. “Foundational Issues in Engineering Systems: A Framing Paper.” Engineering Systems Division Monograph. March 29-31.
Newman, D.J. 2002. Interactive Aerospace Engineering and Design. New York: McGraw-Hill.
Puccia, C.J. and R. Levins. 1985. Qualitative Modeling of Complex Systems. Cambridge, MA: Harvard University Press.
Sussman, J. 2002. “Collected Views on Complexity in Systems.” Proceedings of the ESD Internal Symposium. May 29-30, Cambridge, MA.
Sussman, J. 2000. “Toward Engineering Systems as a Discipline.” MIT Engineering Systems Division Working Paper Series. ESD-WP-2000-01.
Sussman, J. and R. Dodder. 2002. “The Concept of a ‘CLIOS Analysis’ Illustrated by the Mexico City Case.” Proceedings of the ESD Internal Symposium. May 29-30, Cambridge, MA.
Zuckerman, B. 2002. “Defining Engineering Systems: Investigating National Missile Defense.” Proceedings of the ESD Internal Symposium. May 29-30, Cambridge, MA.
THESES
Kometer, Michael
Mostashari, Ali
Sgouridis, Sgouris
Osorio, Carlos
McConnell, Joshua
Ward, John
A D E

MIT HSR/Regions Group Stein Appendix B – Stakeholder Analysis – Salience and Decision-Making
B-‐1
Appendix B Stakeholder Analysis -‐ Salience and Decision-‐Making Naomi Stein
While our initial CLIOS representation includes a matrix that communicates the relationship between the entities on the institutional sphere and the physical elements within the physical domain, the further development of detailed alternatives will merit additional analysis of stakeholder influence and interests. One of the key complexities of the Northeast Corridor is the political and institutional legacy of existing rail ownership and operations. In fact, the four bundles presented in this report are defined partially in institutional and organizational terms. Therefore, to pursue key insights into the sociotechnical system of the Northeast Corridor, it will be helpful to develop a more in-‐depth understanding of stakeholder priorities and incentives, as they relate to the two example bundles. One way to approach this analysis would be to adopt the stakeholder typology presented by Mitchell et al. in their 1997 paper, “Toward a Theory of Stakeholder Identification and Salience: Defining the Principle of Who and What Really Counts.” As the title indicates, the focus of this particular methodology is not only on identification of involved parties (those with the potential to influence or be influenced by HSR1) but also on an evaluation of each stakeholder’s salience or relevance to the decision-‐maker from whose perspective the analysis is conducted. The Mitchell method is pragmatic: it acknowledges that there is no such thing as a decision made within a political vacuum and seeks to clarify the ways in which the claims of various stakeholders can have significant, and perhaps even definitive impact on the feasibility and detailed characteristics of a plan. Mitchell identifies three relevant characteristics of stakeholders; power, legitimacy, and urgency; and categorizes stakeholders based on the number and combination of these criteria that each stakeholder possesses (Figure B.1). All of these attributes apply to the relationship of a stakeholder to another entity. Power is the ability of a stakeholder to impose its will in a relationship. Legitimacy is a socially constructive normative concept—it is the generally perceived assumption that a stakeholder has a proper claim within a relationship. The source of legitimacy can range from contractual or legal rights (land ownership, for example) to at-‐risk status or moral interests (e.g. environmental justice communities). Finally, urgency is the degree to which stakeholder’s claims call for immediate action. This is a function both of the time-‐sensitivity of an issue and of whether the stakeholder considers the issue to be of vital importance. 1 This has already been captured in our Actor-‐Component (Class 2) Links Matrix
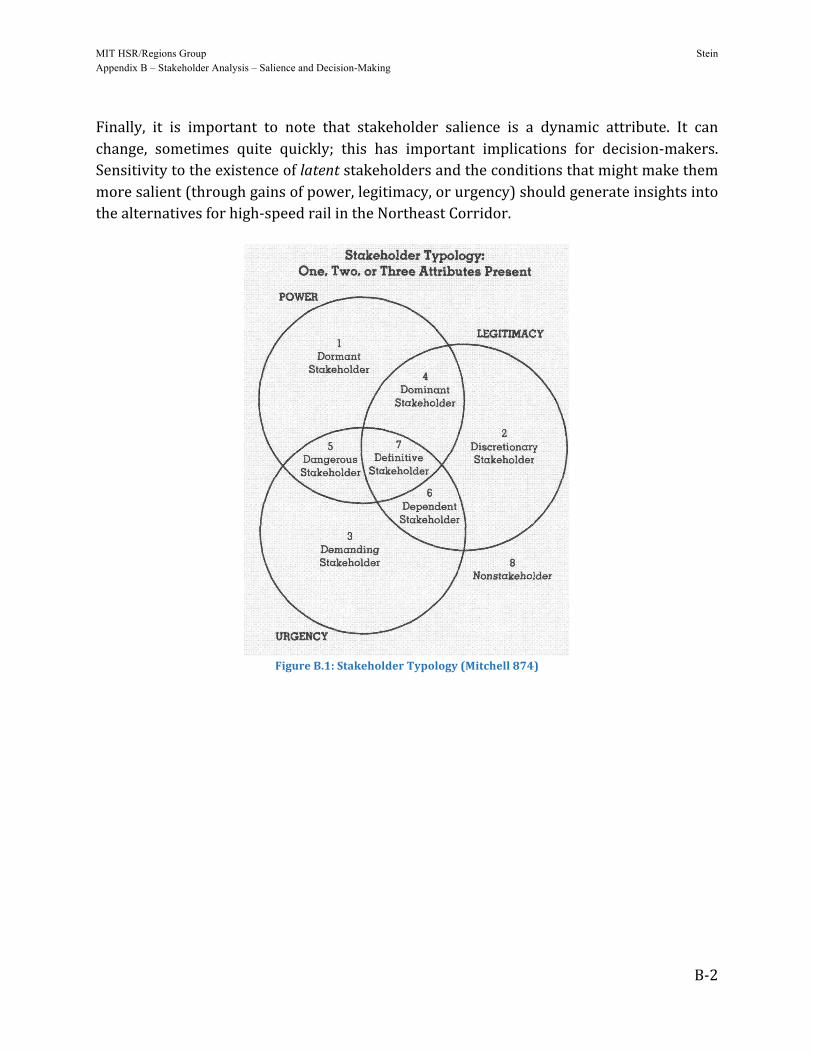
MIT HSR/Regions Group Stein Appendix B – Stakeholder Analysis – Salience and Decision-Making
B-‐2
Finally, it is important to note that stakeholder salience is a dynamic attribute. It can change, sometimes quite quickly; this has important implications for decision-‐makers. Sensitivity to the existence of latent stakeholders and the conditions that might make them more salient (through gains of power, legitimacy, or urgency) should generate insights into the alternatives for high-‐speed rail in the Northeast Corridor.
Reproduced with permission of the copyright owner. Further reproduction prohibited without permission.
874 Academy of Management Review
FIGURE 2Stakeholder Typology:
One, Two, or Three Attributes Present
8Nonstakeholder
October
Latent Stakeholders
With limited time, energy, and other resources to track stakeholderbehavior and to manage relationships, managers may well do nothingabout stakeholders they believe possess only one of the identifying at-tributes, and managers may not even go so far as to recognize thosestakeholders' existence. Similarly, latent stakeholders are not likely togive any attention or acknowledgment to the firm. Hence:
Proposition 1a: Stakeholder salience will be low whereonly one of the stakeholder attributes-power, legiti-macy, and urgency-is perceived by managers to bepresent.
In the next few paragraphs we discuss the reasoning behind this expec-tation as it applies to each class of latent stakeholder, and we also dis-cuss the implications for managers.
Dormant stakeholders. The relevant attribute of a dormant stake-holder is power. Dormant stakeholders possess power to impose their willon a firm. but by not haVing a legitimate relationship or an urgent claim,
Figure B.1: Stakeholder Typology (Mitchell 874)

MIT HSR/Regions Group Stein Appendix B – Stakeholder Analysis – Salience and Decision-Making
B-‐3
REFERENCES
Ronald K Mitchell; Bradley R Agle; Donna J Wood. Academy of Management. The Academy of Management Review; Oct 1997; 22, 4; ABI/INFORM Global, pg. 853-‐886

MIT HSR/Regions Group Archila and Pena Appendix C- MATLAB Algorithm for Characterizing Paths
C-1
Appendix C
MATLAB Algorithm for Characterizing Paths Andrés F. Archila | Maite Peña-Alcaraz
INTRODUCTION
This appendix shows the MATLAB algorithm for identifying feasible paths and computing
their speed, strength and impact in the Physical Domain of the CLIOS Representation,
according to the method proposed in chapter 5.
The algorithm has been divided in three stages. Before each stage, the relevant notation is
defined, although basic programming operators are not explained.
Please note that matrices are represented by capital letters, whereas lower case letters
represent scalars.
STAGE 1: IMPORT MATRICES FROM SPREADSHEETS
Definitions:
- ‘cliosdatain.xlsx’ is a spreadsheet which contains the class-1-links, speed and
strength matrices in separate sheets labeled as ‘inputs’, ‘speed’ and ‘strength’.
- ‘submatrix’ is a predefined range of cells in each sheet, which frames the input
matrices.
- A1 is the class-1-links matrix.
- B1 is the speed matrix. Every value is divided by 3, as described in chapter 5.
- C1 is the strength matrix. Every value is divided by 3, as described in chapter 5.
Code:
A1=xlsread('cliosdatain.xlsx', 'inputs', 'submatrix');
B1=xlsread('cliosdatain.xlsx', 'speed', 'submatrix');
B1=B1/3;
C1=xlsread('cliosdatain.xlsx', 'strength', 'submatrix');
C1=C1/3;

MIT HSR/Regions Group Archila and Pena Appendix C- MATLAB Algorithm for Characterizing Paths
C-2
STAGE 2: DETERMINE FEASIBLE PATHS
This is a modular procedure that takes A1 as input. Only the first three modules are shown,
but the rest are written in the inductive way shown below.
Definitions:
- n= Number of components in the Physical Domain.
- A2= 2-column matrix with feasible paths that connect up to two components, i.e.
links. This matrix includes the number of the initial component in column 1 and the
end component in column 2.
- A‘x’= x-column matrix with feasible paths that connect up to x components. Each
row represents a feasible path. This matrix includes the number of the initial
component in column 1, the number of the second component in column 2, and so
on, until the number of the end component is stored in column x.
- k= counter for the number of paths in each matrix.
- a‘x’= a variable that stores the number of rows (i.e. feasible paths) in matrix A‘x’
- i, j, l= inner counters.
Code:
n=52;
A2 is generated. If there’s a link between components ‘i’ and ‘j’, then ‘i’ is stored as the
initial component of this path and j is stored as the end component of the path.
A2=zeros(10,2); k=1; for i=1:n for j=1:n if (A1(i,j)~=0) A2(k,1)=i; A2(k,2)=j; k=k+1; end end end a2=k-1;
A3 is generated. For every row in A2, if there’s a link between the end component, i.e. A2 (i,
2), and ‘j’, then ‘j’ is included in the path and is now the end component of the new,
extended path. These 3-component long paths are stored in matrix A3.
A3=zeros(10,3); k=1;

MIT HSR/Regions Group Archila and Pena Appendix C- MATLAB Algorithm for Characterizing Paths
C-3
for i=1:a2 for j=1:n if (A1(A2(i,2),j)~=0) A3(k,1)=A2(i,1); A3(k,2)=A2(i,2); A3(k,3)=j; k=k+1; end end end a3=k-1;
A4 is generated. For every row in A3, if there’s a link between the end component, i.e. A3 (i,
3), and ‘j’, then ‘j’ is included in the path and it is now the end component of the new,
extended path. A new restriction is added, which forbids selecting loops for creating new
paths or including previously visited components in the new paths. These 4-component
long paths are stored in matrix A4.
A4=zeros(10,4); k=1; for i=1:a3 for j=1:n if (A1(A3(i,3),j)~=0 && A3(i,1)~=A3(i,3 ) && A3(i,2)~=j) for l=1:3 A4(k,l)=A3(i,l); end A4(k,4)=j; k=k+1; end end end a4=k-1;
A‘x’ is generated. For every row in A‘x-1’, if there’s a link between the end component, i.e.
A‘x-1’ (i, x-1), and ‘j’, then ‘j’ is included in the path and it is now the end component of the
new, extended path. The same restriction as before is included, which forbids selecting
loops for creating new paths or including previously visited components in the new paths.
These x-component long paths are stored in matrix A‘x’.
A ‘x’ =zeros(10, x); k=1; for i=1:a ’x-1’ for j=1:n if (A1(A ’x-1’ (i, x-1 ),j)~=0 && A ’x-1’ (i,1)~=A ’x-1’ (i, x-1 ) && A ‘x-1’ (i,2)~=j &&… && A ‘x-1’ (i, x-2 )~=j) for l=1: x-1

MIT HSR/Regions Group Archila and Pena Appendix C- MATLAB Algorithm for Characterizing Paths
C-4
A ‘x’ (k,l)=A ‘x-1’ (i,l); end A ‘x’ (k, x)=j; k=k+1; end end end a ‘x’ =k-1;
Notes:
This process is repeated until no new paths are created. For this particular class-1 links
matrix, the limit is A25. For A26, there are now new paths.
Note that each A‘x’ matrix has initially 10 rows. However, the program automatically adds
new rows as necessary.
STAGE 3: DETERMINE SPEED, STRENGTH AND IMPACT OF PATHS
This is a modular procedure that takes B1, C1 and the previously generated matrices as
input. Only the first two modules are shown, but the rest are written in the inductive way
shown below.
Definitions:
- m= number of paths in the Physical Domain.
- P= m by 3 matrix with the speed, strength and impact of the paths in the Physical
Domain.
- i, j= inner counters.
- k= counter for the number of paths in the Physical Domain.
- A= m by 25 matrix which compiles every path in the Physical Domain.
Code: m=a2+a3+… + … +a24+a25; P=zeros(m,3); A=zeros(m,25); k=1;
Speed and strength are computed for every 2-component long path, i.e. link, and stored in
the first and second columns of matrix P. For this case, the speed and strength correspond
to the values stored in B1 and C1. Matrices A2 to A25 are compiled in a new matrix called A.
for i=1:a2 P(k,1)=B1(A2(i,1),A2(i,2));

MIT HSR/Regions Group Archila and Pena Appendix C- MATLAB Algorithm for Characterizing Paths
C-5
P(k,2)=C1(A2(i,1),A2(i,2)); A(k,1)=A2(i,1); A(k,2)=A2(i,2); k=k+1; end
Next, speed and strength are computed for every 3-component long path. The initial value
for the speed of a path is 1. Then, this value is tested against the speed of every link in the
path, and the minimum value is stored as the value of the speed of the path. Likewise, the
initial value for the strength of a path is 1. Then, this value is multiplied by the strength of
every link in the path, and stored as the value of the strength of the path. Finally, matrix A3
is assembled into matrix A.
for i=1:a3 P(k,1)=1; for j=1:2 P(k,1)=min(P(k,1),B1(A3(i,j),A3(i,j+1)) ); end P(k,2)=1; for j=1:2 P(k,2)=P(k,2)*C1(A3(i,j),A3(i,j+1)); end for j=1:3 A(k,j)=A3(i,j); end k=k+1; end
The same procedure is followed for the remaining A‘x’ matrices. Note that after each
module, counter k is no restarted. This permits the correct assembly of matrices A and P.
for i=1:a ‘x’ P(k,1)=1; for j=1: x-1 P(k,1)=min(P(k,1),B1(A ‘x’ (i,j),A ‘x’ (i,j+1))); end P(k,2)=1; for j=1: x-1 P(k,2)=P(k,2)*C1(A ‘x’ (i,j),A ‘x’ (i,j+1)); end for j=1: x A(k,j)=A ‘x’ (i,j);

MIT HSR/Regions Group Archila and Pena Appendix C- MATLAB Algorithm for Characterizing Paths
C-6
end k=k+1; end
Finally the impact of the paths is computed by multiplying the corresponding values in
columns 1 and 2.
for i=1:m P(i,3)=P(i,1)*P(i,2); end
Top Related