


Languages
Pages
Legal

Copyright © 1998-2021, Jean-Paul Rodrigue, Dept. of Global Studies & Geography, Hofstra University, Hempstead, NY, 11549 USA.
You may use the figures within for educational purposes only. No modification or redistribution permitted.For more information: https://transportgeography.org/
Transportation Modes(Part I)
CHAPTER 5
Copyright © 1998-2021, Dr. Jean-Paul Rodrigue, Dept. of Global Studies & Geography, Hofstra University. For personal or classroom use ONLY. This material (including graphics) is not public domain and cannot be published, in whole or in part, in ANY form (printed or electronic) and on any media without consent. This includes conference presentations. Permission MUST be requested prior to use.
Usage Conditions• DO NOT COPY, TRANSLATE OR REDISTRIBUTE THIS DOCUMENT.
• The contents of this document can be freely used for personal or classroom use ONLY.
• Although the material contained in this document is freely available, it is not public domain. Its contents, in whole or in part (including graphics and datasets), cannot be copied and published in ANY form (printed or electronic) without consent.
• If you have accessed this document through a third party (such as a content farm), keep in mind that this party is illegally redistributing this content. Please refer to the true source (https://transportgeography.org/) instead of the third party.
• Permission to use any graphic material herein in any form of publication, such as an article, a book or a conference presentation, on any media must be requested prior to use.
• Information cited from this document should be referred as: Rodrigue, J-P et al. (2020) The Geography of Transport Systems, Hofstra University, Department of Global Studies & Geography, https://transportgeography.org/.
Copyright © 1998-2021, Dr. Jean-Paul Rodrigue, Dept. of Global Studies & Geography, Hofstra University. For personal or classroom use ONLY. This material (including graphics) is not public domain and cannot be published, in whole or in part, in ANY form (printed or electronic) and on any media without consent. This includes conference presentations. Permission MUST be requested prior to use.
Table of Contents
Copyright © 1998-2021, Dr. Jean-Paul Rodrigue, Dept. of Global Studies & Geography, Hofstra University. For personal or classroom use ONLY. This material (including graphics) is not public domain and cannot be published, in whole or in part, in ANY form (printed or electronic) and on any media without consent. This includes conference presentations. Permission MUST be requested prior to use.
Transportation Modes, Modal Competition and Modal Shift
Copyright © 1998-2021, Dr. Jean-Paul Rodrigue, Dept. of Global Studies & Geography, Hofstra University. For personal or classroom use ONLY. This material (including graphics) is not public domain and cannot be published, in whole or in part, in ANY form (printed or electronic) and on any media without consent. This includes conference presentations. Permission MUST be requested prior to use.

Main Passenger Modal Options
Copyright © 1998-2021, Dr. Jean-Paul Rodrigue, Dept. of Global Studies & Geography, Hofstra University. For personal or classroom use ONLY. This material (including graphics) is not public domain and cannot be published, in whole or in part, in ANY form (printed or electronic) and on any media without consent. This includes conference presentations. Permission MUST be requested prior to use.
Air Road Rail Maritime
Scheduled
Charter
Car
Taxi
Van/Bus
Motorcycle
Bicycle
Walking
Intercity
HSR
Transit
Subway
Commuter
LRT
Monorail
Ferry
Cruise
RoRo
High Speed

Main Freight Modal Options
Copyright © 1998-2021, Dr. Jean-Paul Rodrigue, Dept. of Global Studies & Geography, Hofstra University. For personal or classroom use ONLY. This material (including graphics) is not public domain and cannot be published, in whole or in part, in ANY form (printed or electronic) and on any media without consent. This includes conference presentations. Permission MUST be requested prior to use.
Air Truck Rail Maritime PipelineInland /
Coastal
Package
Heavy
Freighter
Bellyhold
Package Unit Train Break-bulk River/Sea Pipeline
Less than
truckload (LTL)
Truckload
(TL)
Dry van
Tank
Flatbet
Curtainside
Reefer
Hopper
Open top
Chassis
Carload
Intermodal
Boxcar
Tank car
Flat car
Reefer
Hopper
Gondola
TOFC
Domestic
Liquid bulk
RoRo
Dry bulk
Container
ISO Container
Reefer
Flatrack
Tank
Container
Tow
Tank barge
Deck barge
Hopper barge
Oil
Gas
Water

Load of the Global Transport System by Mode
Tons Tons-km Revenue (2004)
Road ? 6,000 to 8,500 billion tons-km
$796 billion
Rail 8,930 million tons 7,773 billion tons-km $330 billion
Maritime 6,758 million tons (loaded)6,787 million tons (unloaded)
44,474 billion tons-km $484 billion
Copyright © 1998-2021, Dr. Jean-Paul Rodrigue, Dept. of Global Studies & Geography, Hofstra University. For personal or classroom use ONLY. This material (including graphics) is not public domain and cannot be published, in whole or in part, in ANY form (printed or electronic) and on any media without consent. This includes conference presentations. Permission MUST be requested prior to use.

Performance Comparison for Selected Freight Modes
Copyright © 1998-2021, Dr. Jean-Paul Rodrigue, Dept. of Global Studies & Geography, Hofstra University. For personal or classroom use ONLY. This material (including graphics) is not public domain and cannot be published, in whole or in part, in ANY form (printed or electronic) and on any media without consent. This includes conference presentations. Permission MUST be requested prior to use.
Barge
Hopper car
100 car train unit
Semi-trailer truck
1500 Tons / 50-100 TEU52,500 Bushels453,600 Gallons
100 Tons / 4 to 5.3 TEU3,500 Bushels30,240 Gallons
10,000 Tons / 400 to 530 TEU350,000 Bushels3,024,000 Gallons
26 Tons / 2.65 TEU910 Bushels7,865 Gallons9,000 for a tanker truck
57.7 (865 for 15 bargesin tow)18 to 40 (intermodal)
2.0 (intermodal) to 3.8
385
1
Panamax containership5,000 TEU 2,116
VLCC
300,000 tons2 million barrels of oil
747-400F
100-125 tons
(Depending on freight
density and range)
9,330
5
Capacity Truck EquivalencyVehicle
Doublestackrail car
100 car intermodal train
Infrastructure
Navigation channels, canals, terminals
Tracks, yards and terminals
Roads, parking lots and docking bays
Navigation channels, canals, terminals
Air corridors, airfields

Copyright © 1998-2021, Dr. Jean-Paul Rodrigue, Dept. of Global Studies & Geography, Hofstra University. For personal or classroom use ONLY. This material (including graphics) is not public domain and cannot be published, in whole or in part, in ANY form (printed or electronic) and on any media without consent. This includes conference presentations. Permission MUST be requested prior to use.
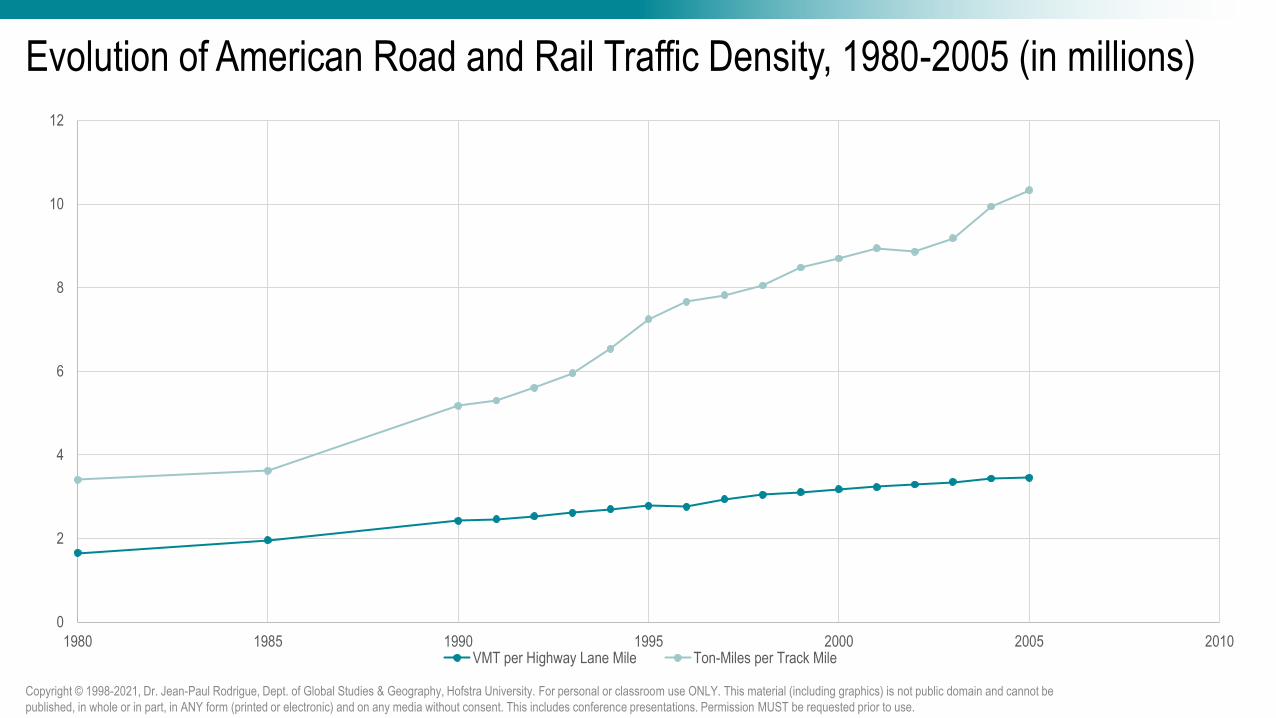
Evolution of American Road and Rail Traffic Density, 1980-2005 (in millions)
0
2
4
6
8
10
12
1980 1985 1990 1995 2000 2005 2010VMT per Highway Lane Mile Ton-Miles per Track Mile
Copyright © 1998-2021, Dr. Jean-Paul Rodrigue, Dept. of Global Studies & Geography, Hofstra University. For personal or classroom use ONLY. This material (including graphics) is not public domain and cannot be published, in whole or in part, in ANY form (printed or electronic) and on any media without consent. This includes conference presentations. Permission MUST be requested prior to use.
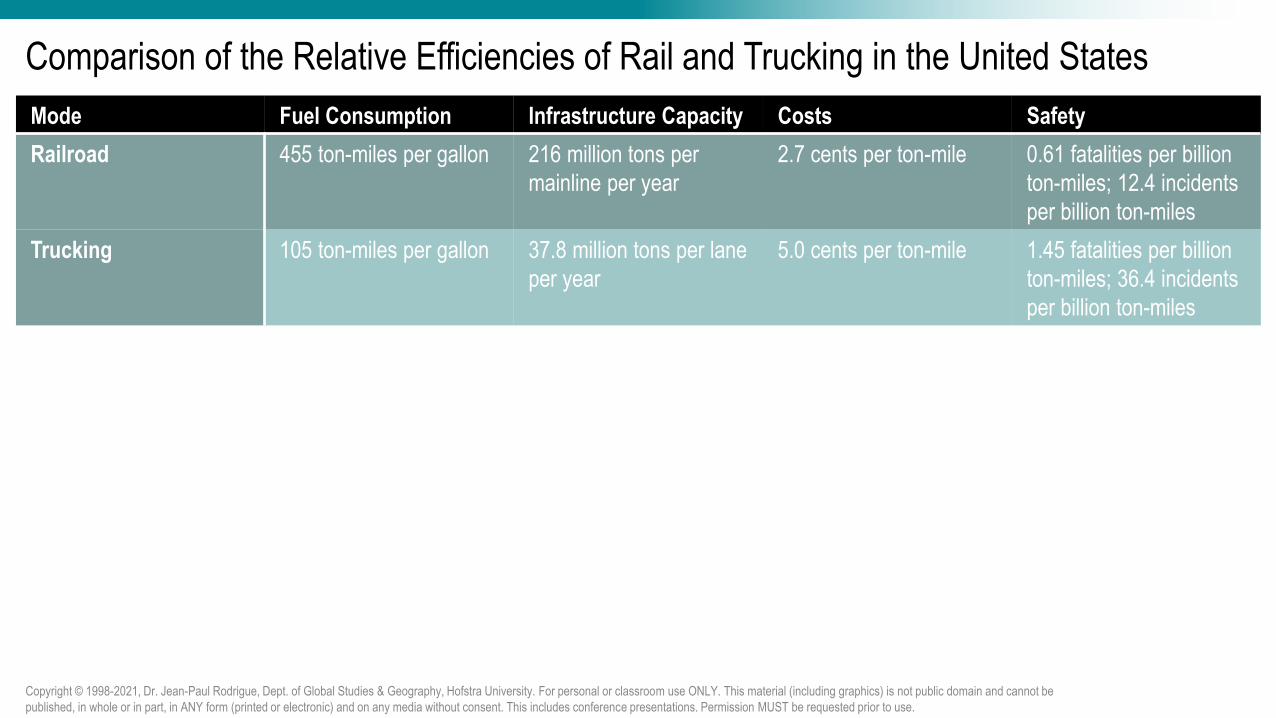
Comparison of the Relative Efficiencies of Rail and Trucking in the United States
Mode Fuel Consumption Infrastructure Capacity Costs Safety
Railroad 455 ton-miles per gallon 216 million tons per mainline per year
2.7 cents per ton-mile 0.61 fatalities per billion ton-miles; 12.4 incidents per billion ton-miles
Trucking 105 ton-miles per gallon 37.8 million tons per lane per year
5.0 cents per ton-mile 1.45 fatalities per billion ton-miles; 36.4 incidents per billion ton-miles
Copyright © 1998-2021, Dr. Jean-Paul Rodrigue, Dept. of Global Studies & Geography, Hofstra University. For personal or classroom use ONLY. This material (including graphics) is not public domain and cannot be published, in whole or in part, in ANY form (printed or electronic) and on any media without consent. This includes conference presentations. Permission MUST be requested prior to use.
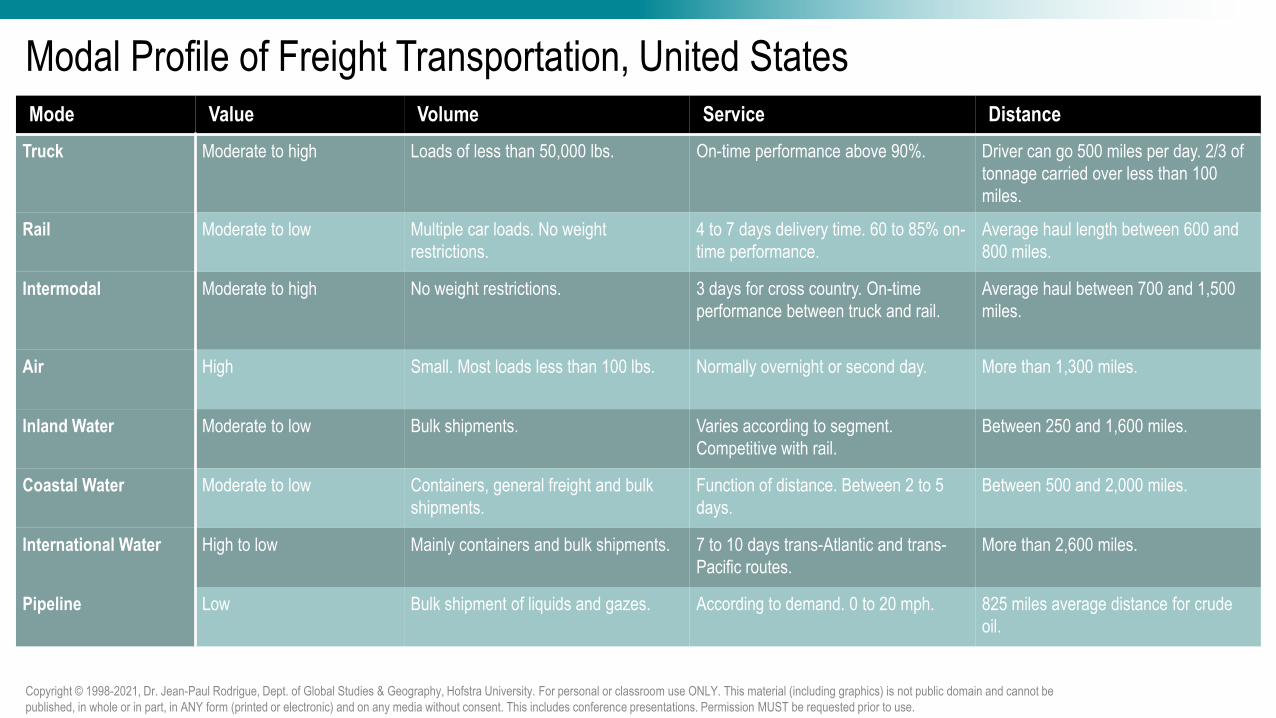
Modal Profile of Freight Transportation, United StatesMode Value Volume Service Distance
Truck Moderate to high Loads of less than 50,000 lbs. On-time performance above 90%. Driver can go 500 miles per day. 2/3 of tonnage carried over less than 100 miles.
Rail Moderate to low Multiple car loads. No weight restrictions.
4 to 7 days delivery time. 60 to 85% on-time performance.
Average haul length between 600 and 800 miles.
Intermodal Moderate to high No weight restrictions. 3 days for cross country. On-time performance between truck and rail.
Average haul between 700 and 1,500 miles.
Air High Small. Most loads less than 100 lbs. Normally overnight or second day. More than 1,300 miles.
Inland Water Moderate to low Bulk shipments. Varies according to segment. Competitive with rail.
Between 250 and 1,600 miles.
Coastal Water Moderate to low Containers, general freight and bulk shipments.
Function of distance. Between 2 to 5 days.
Between 500 and 2,000 miles.
International Water High to low Mainly containers and bulk shipments. 7 to 10 days trans-Atlantic and trans-Pacific routes.
More than 2,600 miles.
Pipeline Low Bulk shipment of liquids and gazes. According to demand. 0 to 20 mph. 825 miles average distance for crude oil.
Copyright © 1998-2021, Dr. Jean-Paul Rodrigue, Dept. of Global Studies & Geography, Hofstra University. For personal or classroom use ONLY. This material (including graphics) is not public domain and cannot be published, in whole or in part, in ANY form (printed or electronic) and on any media without consent. This includes conference presentations. Permission MUST be requested prior to use.

Distance, Modal Choice and Transport Costs
Copyright © 1998-2021, Dr. Jean-Paul Rodrigue, Dept. of Global Studies & Geography, Hofstra University. For personal or classroom use ONLY. This material (including graphics) is not public domain and cannot be published, in whole or in part, in ANY form (printed or electronic) and on any media without consent. This includes conference presentations. Permission MUST be requested prior to use.
Distance
Tran
spo
rt c
ost
s p
er u
nit
D1 D2
C1C2
C3ROAD
RAIL MARITIME
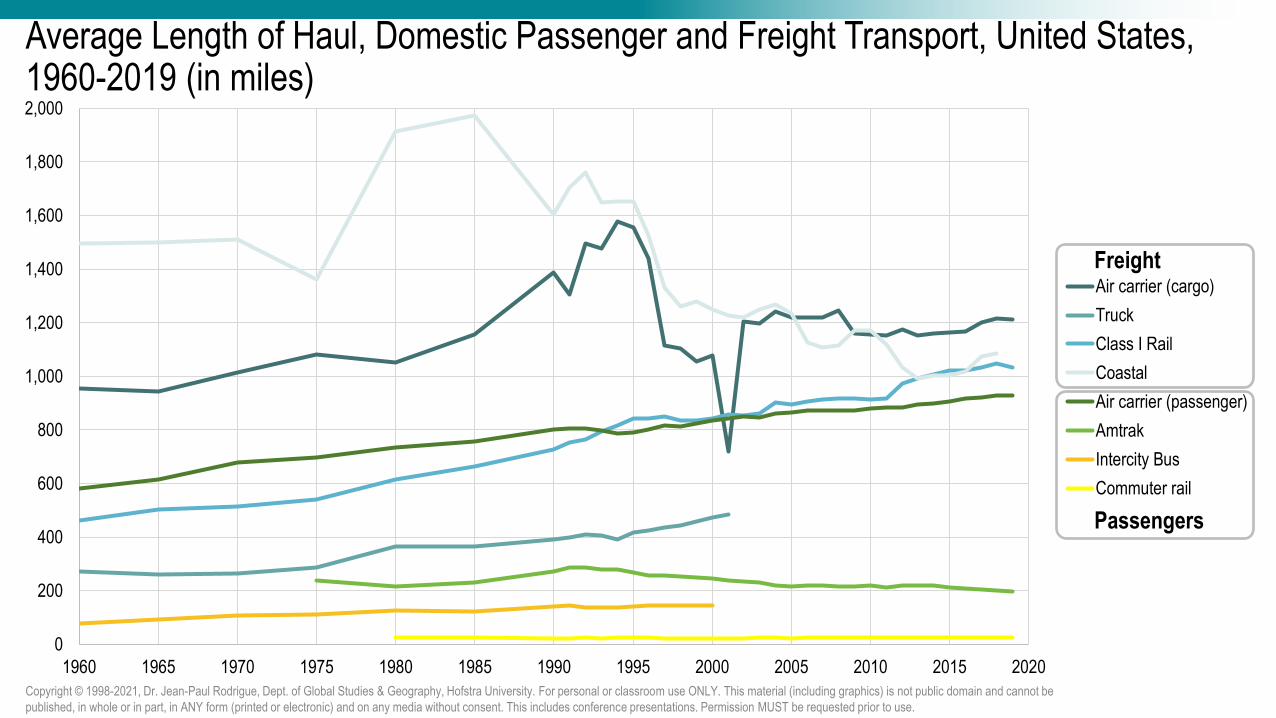
Average Length of Haul, Domestic Passenger and Freight Transport, United States, 1960-2019 (in miles)
Copyright © 1998-2021, Dr. Jean-Paul Rodrigue, Dept. of Global Studies & Geography, Hofstra University. For personal or classroom use ONLY. This material (including graphics) is not public domain and cannot be published, in whole or in part, in ANY form (printed or electronic) and on any media without consent. This includes conference presentations. Permission MUST be requested prior to use.
Freight
Passengers
0
200
400
600
800
1,000
1,200
1,400
1,600
1,800
2,000
1960 1965 1970 1975 1980 1985 1990 1995 2000 2005 2010 2015 2020
Air carrier (cargo)
Truck
Class I Rail
Coastal
Air carrier (passenger)
Amtrak
Intercity Bus
Commuter rail
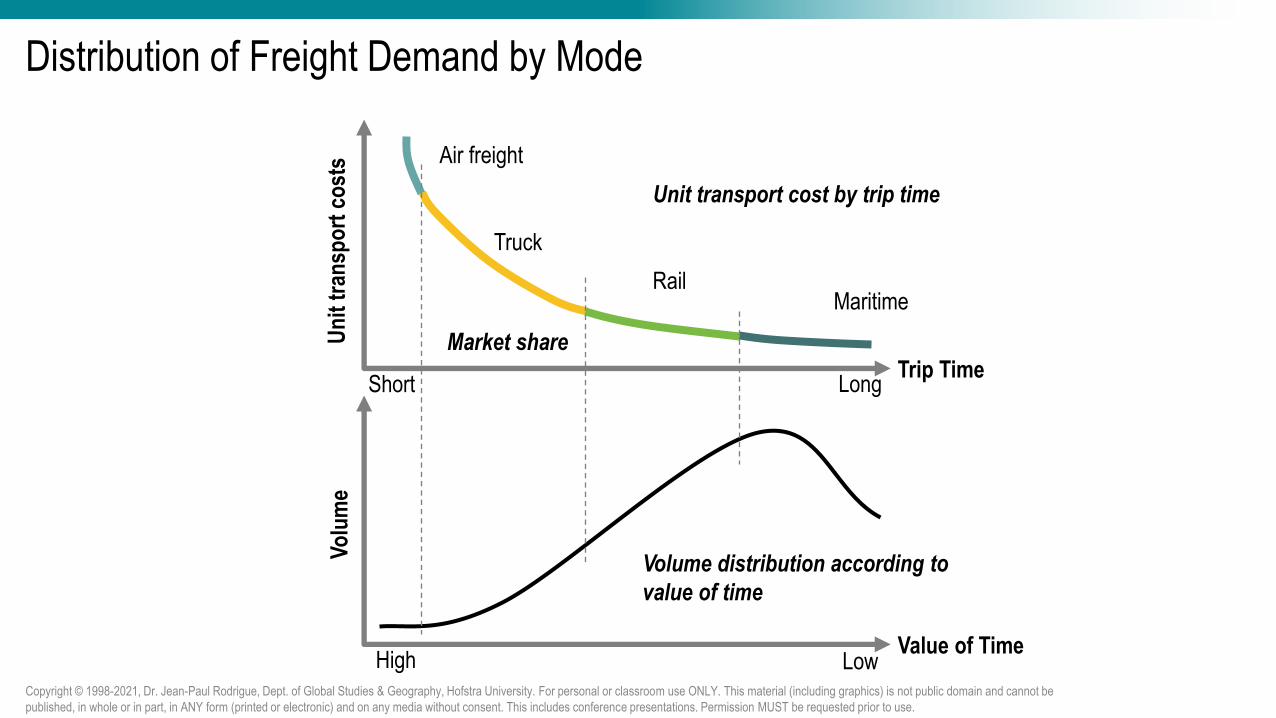
Distribution of Freight Demand by Mode
Copyright © 1998-2021, Dr. Jean-Paul Rodrigue, Dept. of Global Studies & Geography, Hofstra University. For personal or classroom use ONLY. This material (including graphics) is not public domain and cannot be published, in whole or in part, in ANY form (printed or electronic) and on any media without consent. This includes conference presentations. Permission MUST be requested prior to use.
Un
it t
ran
spo
rt c
ost
s
Trip Time
Vo
lum
e
Value of Time
Air freight
Truck
RailMaritime
Volume distribution according to
value of time
Unit transport cost by trip time
Market share
Short
High
Long
Low
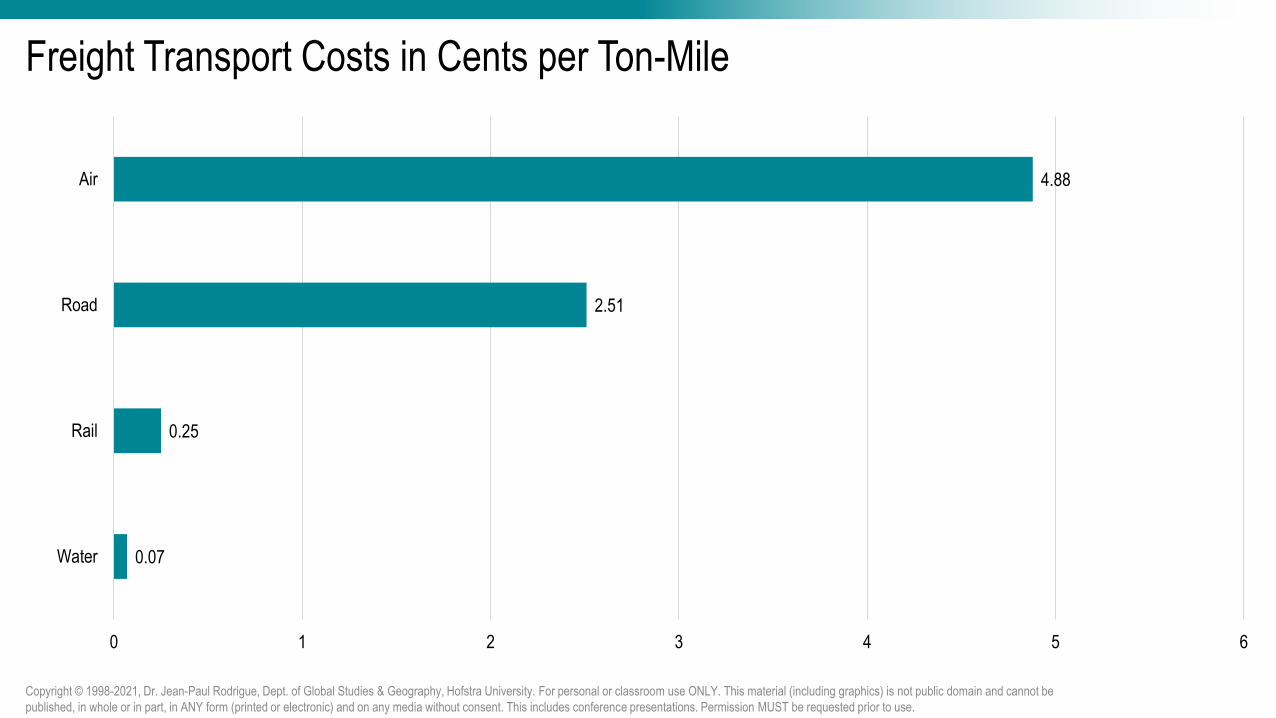
Freight Transport Costs in Cents per Ton-Mile
0.07
0.25
2.51
4.88
0 1 2 3 4 5 6
Water
Rail
Road
Air
Copyright © 1998-2021, Dr. Jean-Paul Rodrigue, Dept. of Global Studies & Geography, Hofstra University. For personal or classroom use ONLY. This material (including graphics) is not public domain and cannot be published, in whole or in part, in ANY form (printed or electronic) and on any media without consent. This includes conference presentations. Permission MUST be requested prior to use.
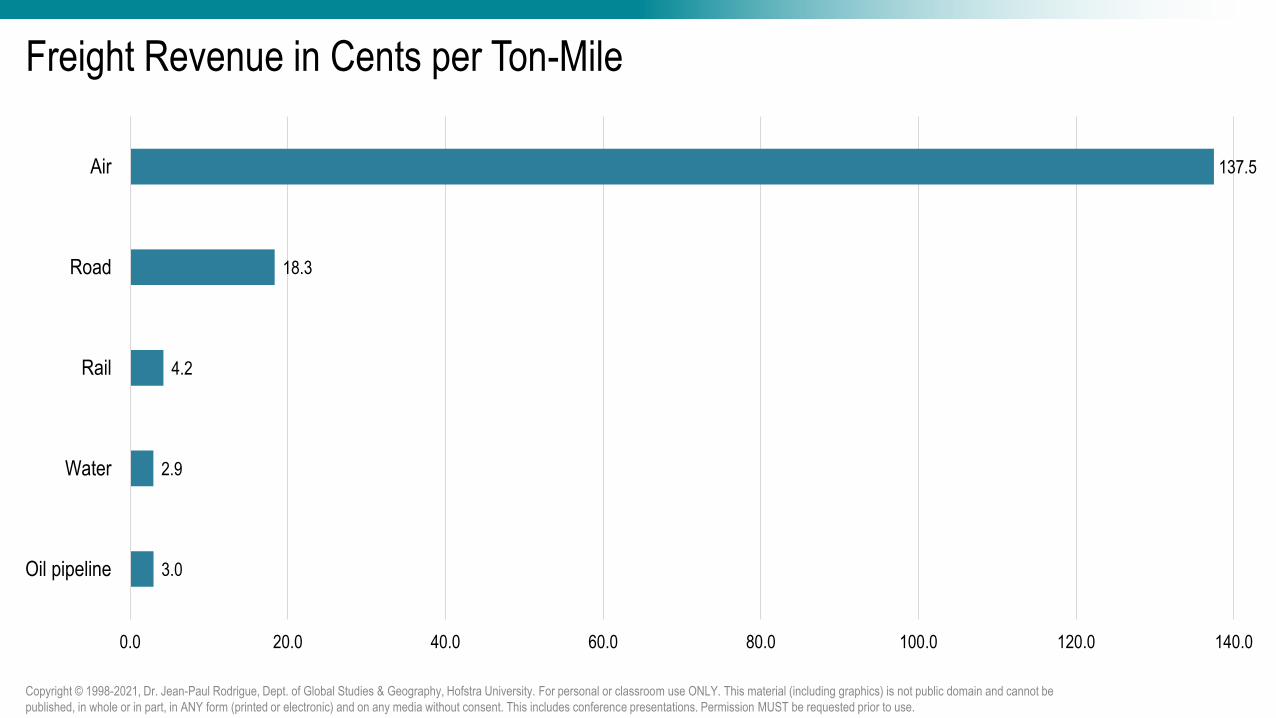
Freight Revenue in Cents per Ton-Mile
3.0
2.9
4.2
18.3
137.5
0.0 20.0 40.0 60.0 80.0 100.0 120.0 140.0
Oil pipeline
Water
Rail
Road
Air
Copyright © 1998-2021, Dr. Jean-Paul Rodrigue, Dept. of Global Studies & Geography, Hofstra University. For personal or classroom use ONLY. This material (including graphics) is not public domain and cannot be published, in whole or in part, in ANY form (printed or electronic) and on any media without consent. This includes conference presentations. Permission MUST be requested prior to use.
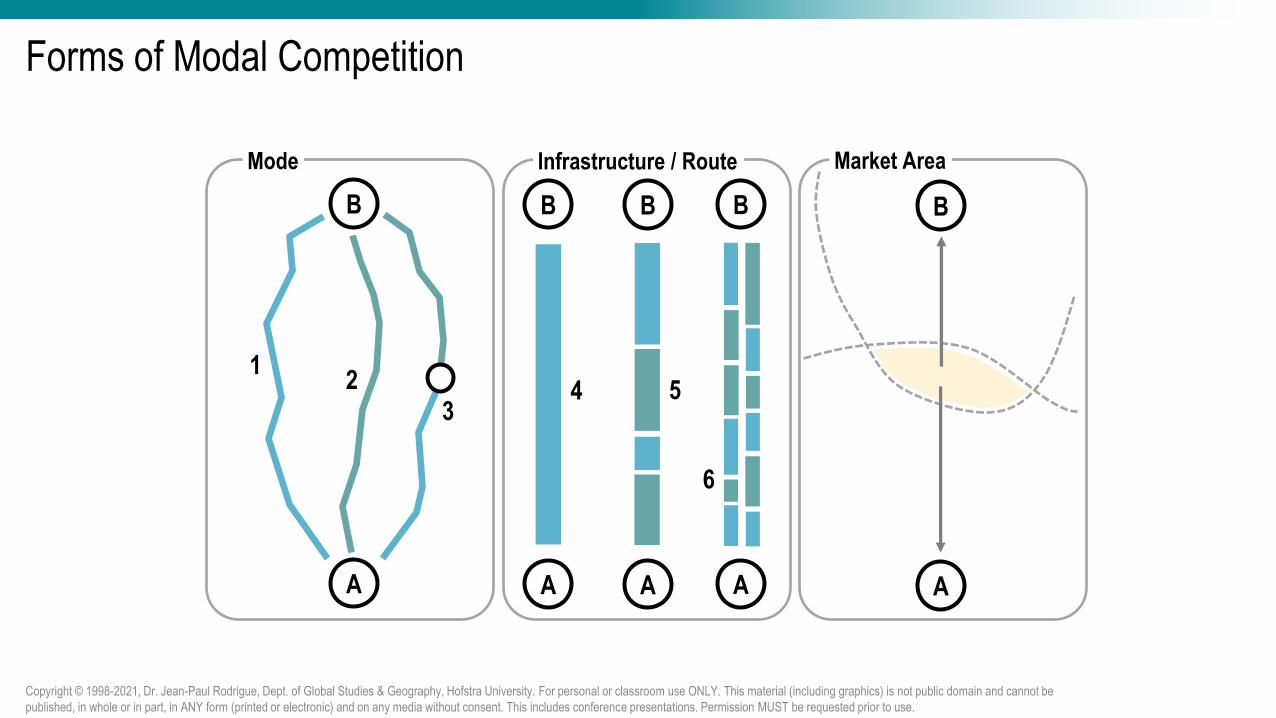
Forms of Modal Competition
Copyright © 1998-2021, Dr. Jean-Paul Rodrigue, Dept. of Global Studies & Geography, Hofstra University. For personal or classroom use ONLY. This material (including graphics) is not public domain and cannot be published, in whole or in part, in ANY form (printed or electronic) and on any media without consent. This includes conference presentations. Permission MUST be requested prior to use.
A
B
12
3
A
B
A
B
A
B
4 5
6
A
B
Mode Infrastructure / Route Market Area
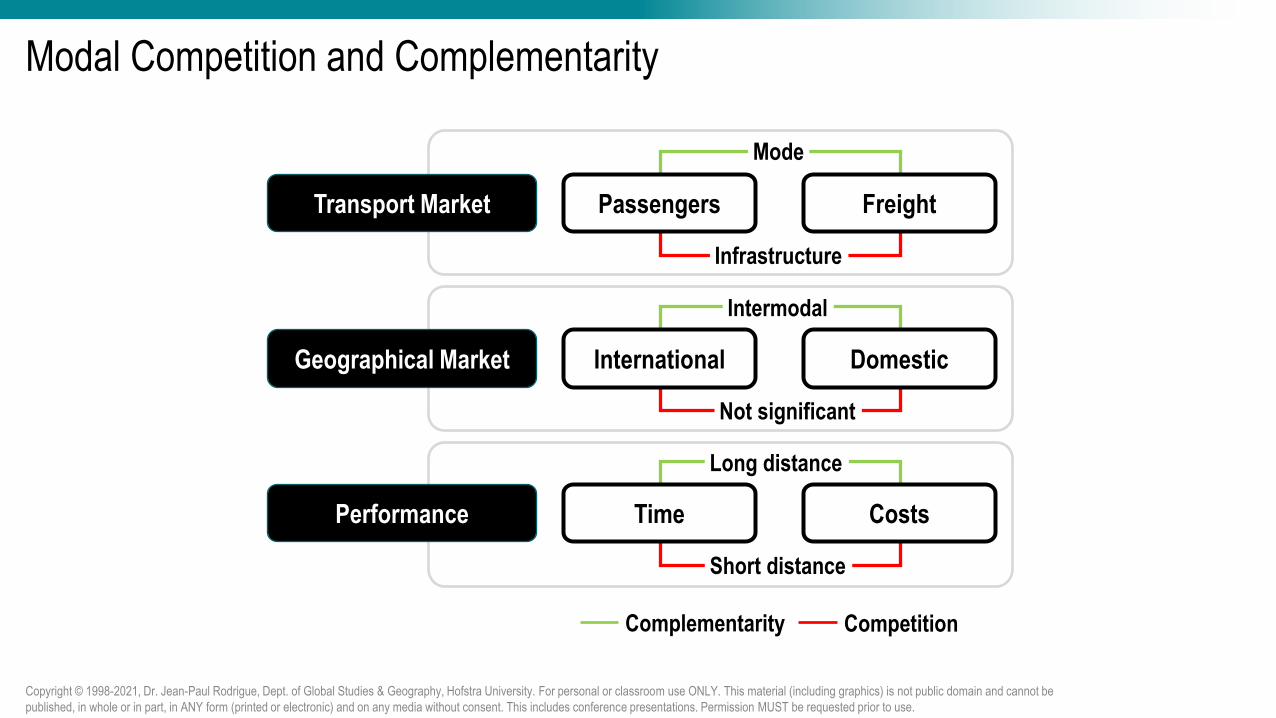
Modal Competition and Complementarity
Copyright © 1998-2021, Dr. Jean-Paul Rodrigue, Dept. of Global Studies & Geography, Hofstra University. For personal or classroom use ONLY. This material (including graphics) is not public domain and cannot be published, in whole or in part, in ANY form (printed or electronic) and on any media without consent. This includes conference presentations. Permission MUST be requested prior to use.
Transport Market
Geographical Market
Performance
Complementarity Competition
Mode
Infrastructure
Intermodal
Not significant
Long distance
Short distance
Passengers Freight
International Domestic
Time Costs

Four Travel Options between New York and Boston, 2004
Mode Price (one way) Time
LimoLiner (luxury bus) $69 4 hours
Acela (Amtrak train) $99 3 hours
Greyhound bus $30 4 hours
Air Shuttle $128 1 hour (plus check in)
Copyright © 1998-2021, Dr. Jean-Paul Rodrigue, Dept. of Global Studies & Geography, Hofstra University. For personal or classroom use ONLY. This material (including graphics) is not public domain and cannot be published, in whole or in part, in ANY form (printed or electronic) and on any media without consent. This includes conference presentations. Permission MUST be requested prior to use.
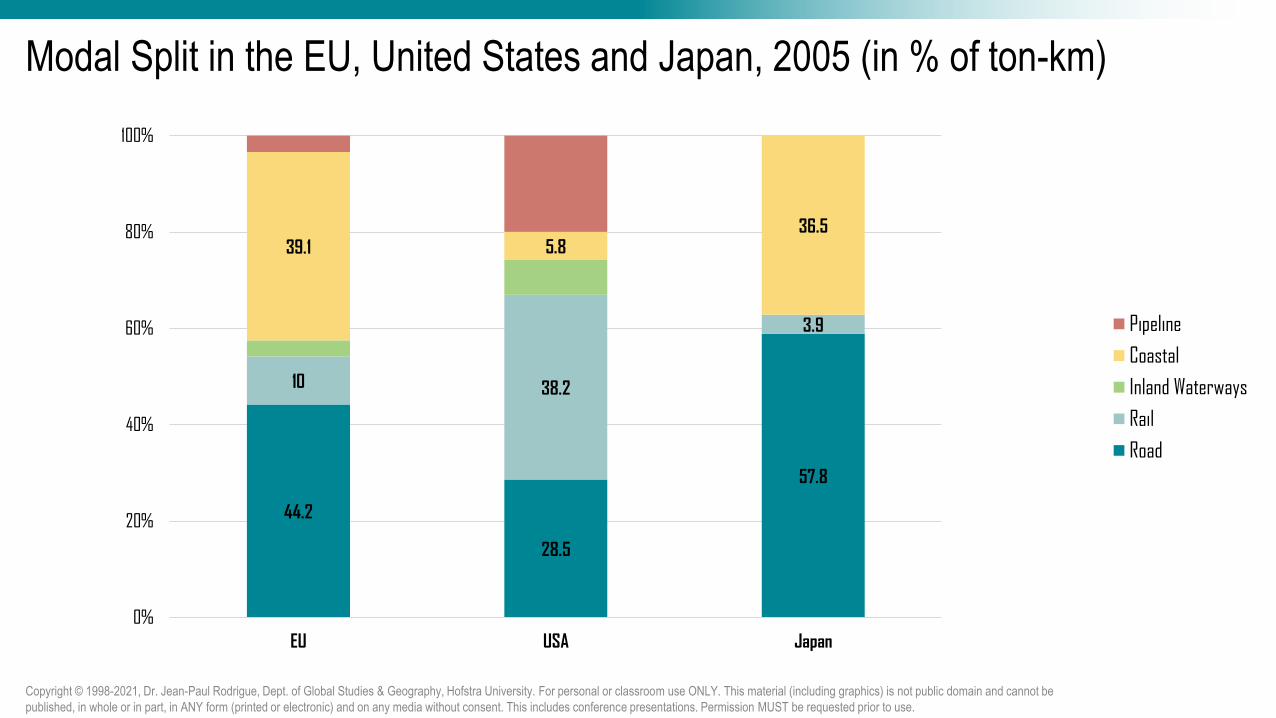
Modal Split in the EU, United States and Japan, 2005 (in % of ton-km)
44.2
28.5
57.8
10 38.2
3.9
39.1 5.836.5
0%
20%
40%
60%
80%
100%
EU USA Japan
Pipeline
Coastal
Inland Waterways
Rail
Road
Copyright © 1998-2021, Dr. Jean-Paul Rodrigue, Dept. of Global Studies & Geography, Hofstra University. For personal or classroom use ONLY. This material (including graphics) is not public domain and cannot be published, in whole or in part, in ANY form (printed or electronic) and on any media without consent. This includes conference presentations. Permission MUST be requested prior to use.

Modal Share of Freight Transportation, Selected Countries, 2008 (in % of ton-kms)
0%
10%
20%
30%
40%
50%
60%
70%
80%
90%
100%
EU27 United States China Russia Japan
Inland waterways
Sea
Pipelines
Road
Rail
Copyright © 1998-2021, Dr. Jean-Paul Rodrigue, Dept. of Global Studies & Geography, Hofstra University. For personal or classroom use ONLY. This material (including graphics) is not public domain and cannot be published, in whole or in part, in ANY form (printed or electronic) and on any media without consent. This includes conference presentations. Permission MUST be requested prior to use.
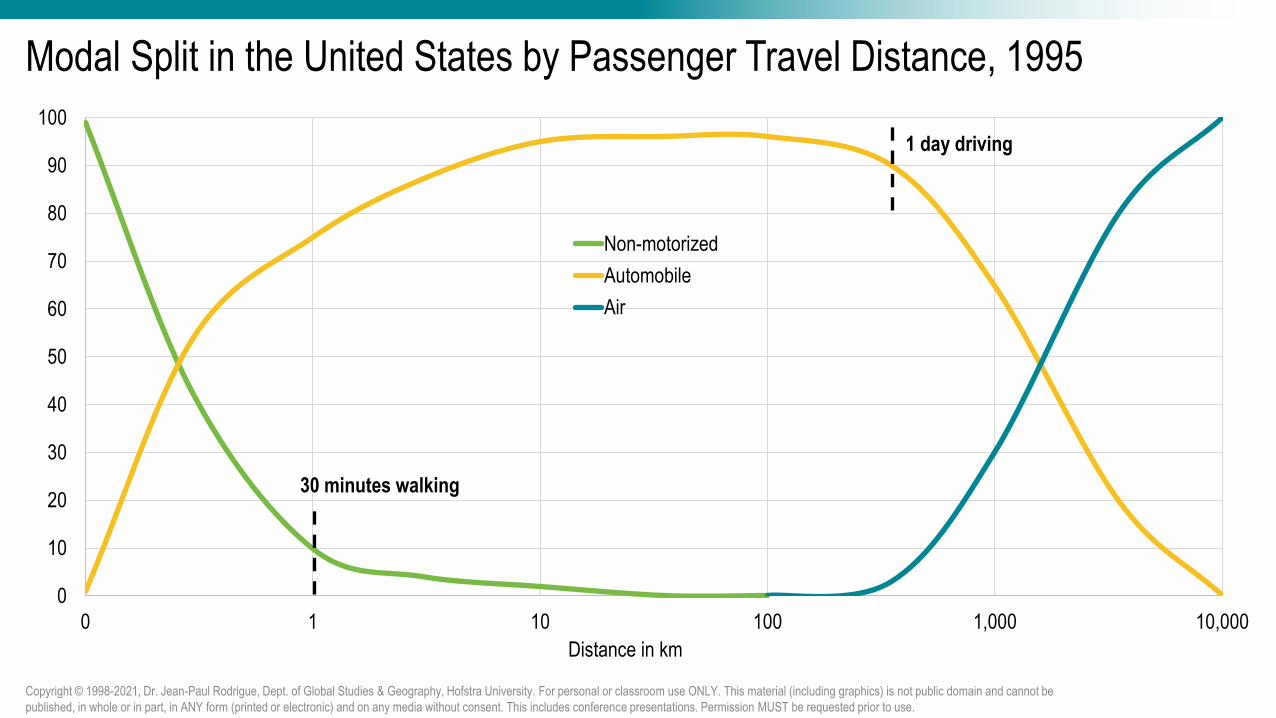
Modal Split in the United States by Passenger Travel Distance, 1995
0
10
20
30
40
50
60
70
80
90
100
0 1 10 100 1,000 10,000
Distance in km
Non-motorized
Automobile
Air
30 minutes walking
1 day driving
Copyright © 1998-2021, Dr. Jean-Paul Rodrigue, Dept. of Global Studies & Geography, Hofstra University. For personal or classroom use ONLY. This material (including graphics) is not public domain and cannot be published, in whole or in part, in ANY form (printed or electronic) and on any media without consent. This includes conference presentations. Permission MUST be requested prior to use.
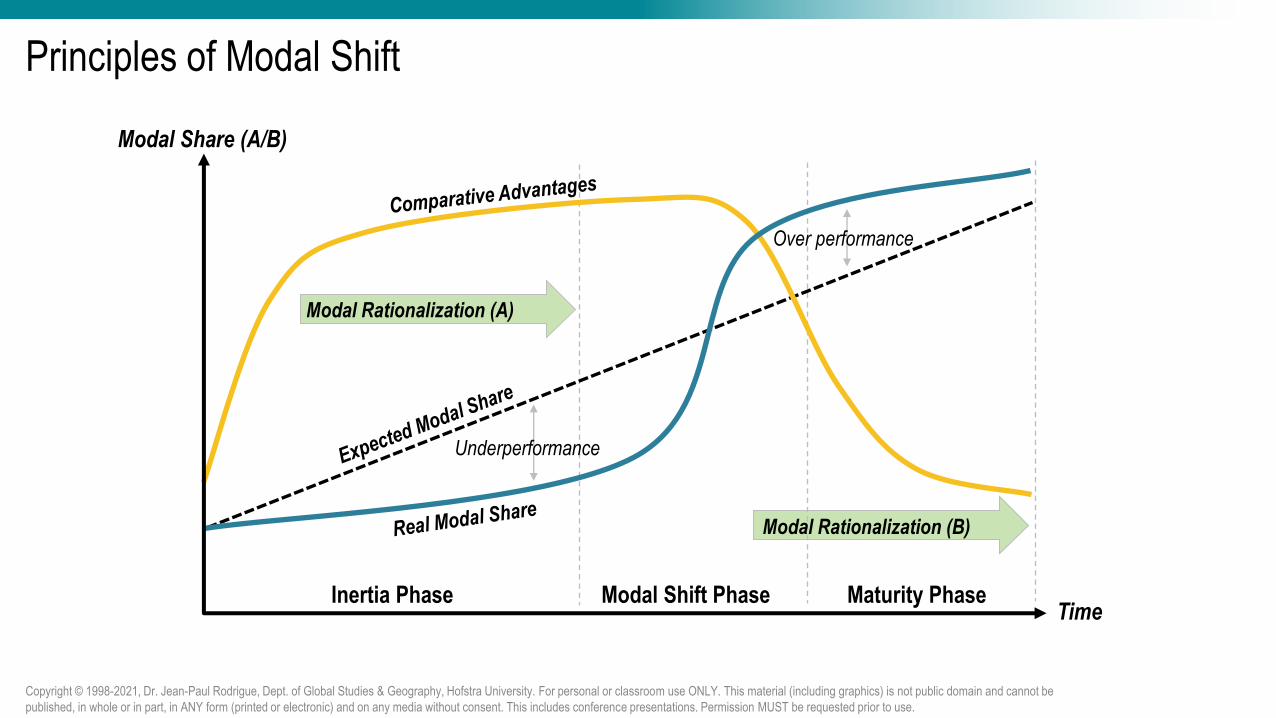
Principles of Modal Shift
Copyright © 1998-2021, Dr. Jean-Paul Rodrigue, Dept. of Global Studies & Geography, Hofstra University. For personal or classroom use ONLY. This material (including graphics) is not public domain and cannot be published, in whole or in part, in ANY form (printed or electronic) and on any media without consent. This includes conference presentations. Permission MUST be requested prior to use.
Modal Share (A/B)
Time
Modal Rationalization (A)
Inertia Phase Modal Shift Phase Maturity Phase
Underperformance
Over performance
Modal Rationalization (B)
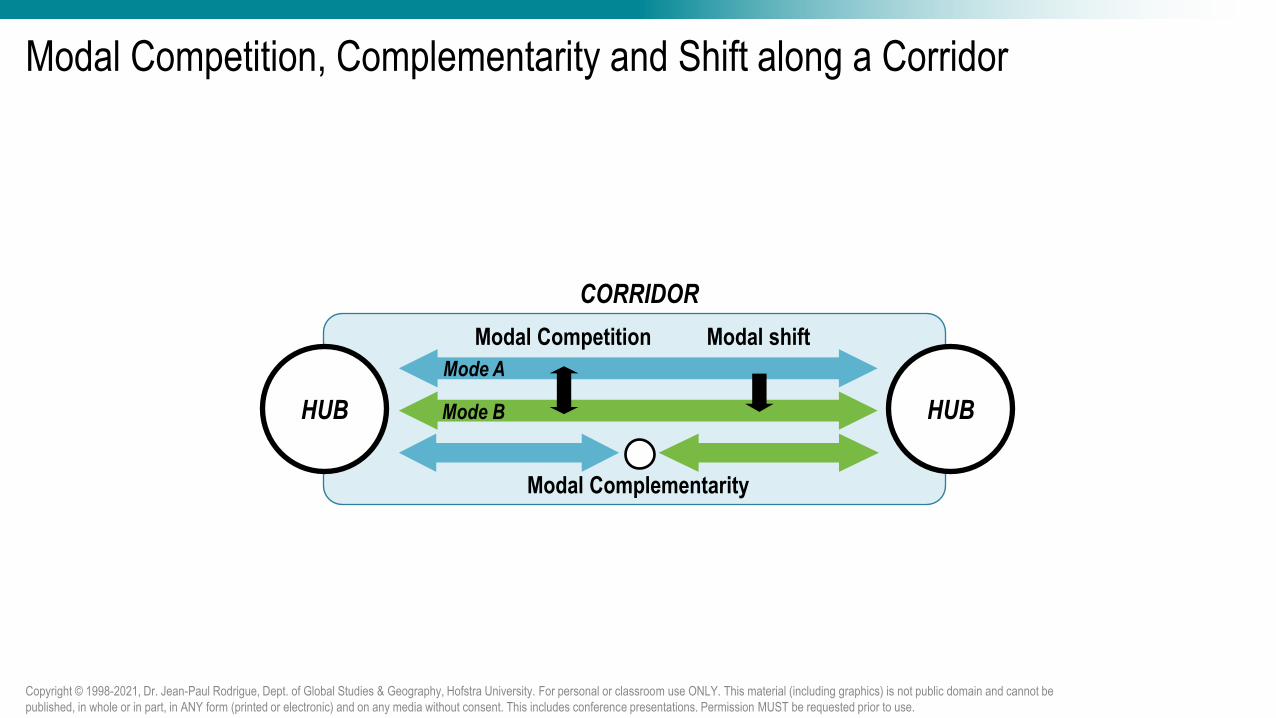
Modal Competition, Complementarity and Shift along a Corridor
Copyright © 1998-2021, Dr. Jean-Paul Rodrigue, Dept. of Global Studies & Geography, Hofstra University. For personal or classroom use ONLY. This material (including graphics) is not public domain and cannot be published, in whole or in part, in ANY form (printed or electronic) and on any media without consent. This includes conference presentations. Permission MUST be requested prior to use.
Modal Competition
Modal Complementarity
Modal shift
HUB HUB
Mode A
Mode B
CORRIDOR
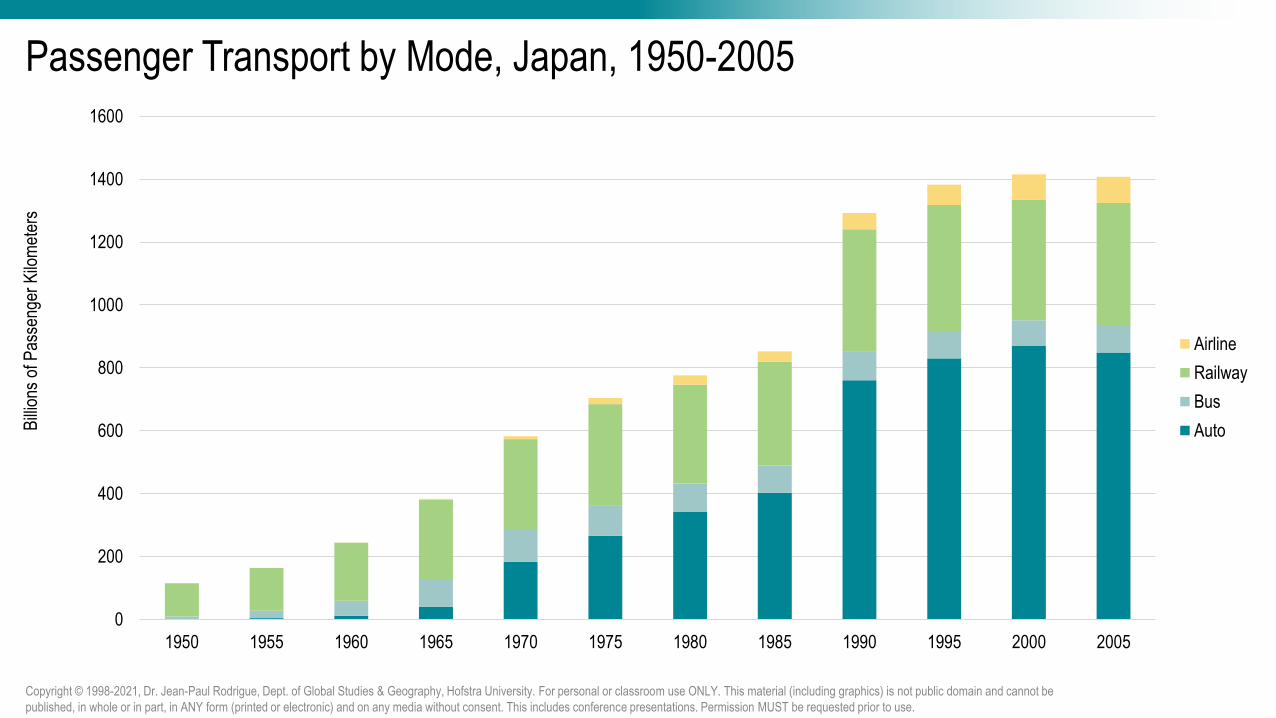
Passenger Transport by Mode, Japan, 1950-2005
0
200
400
600
800
1000
1200
1400
1600
1950 1955 1960 1965 1970 1975 1980 1985 1990 1995 2000 2005
Bill
ions
of P
asse
nger
Kilo
met
ers
Airline
Railway
Bus
Auto
Copyright © 1998-2021, Dr. Jean-Paul Rodrigue, Dept. of Global Studies & Geography, Hofstra University. For personal or classroom use ONLY. This material (including graphics) is not public domain and cannot be published, in whole or in part, in ANY form (printed or electronic) and on any media without consent. This includes conference presentations. Permission MUST be requested prior to use.

Modal Shift in China, 1980-2005
32%
53%
60%35%
12%
0%
20%
40%
60%
80%
100%
1980 2005
Share of Passengers-km by Mode
Highways Railways Waterways Airports
10%21%
71% 51%
19%27%
0%
20%
40%
60%
80%
100%
1980 2005
Share of Ton-km by Mode
Highways Railways Waterways Airports
Copyright © 1998-2021, Dr. Jean-Paul Rodrigue, Dept. of Global Studies & Geography, Hofstra University. For personal or classroom use ONLY. This material (including graphics) is not public domain and cannot be published, in whole or in part, in ANY form (printed or electronic) and on any media without consent. This includes conference presentations. Permission MUST be requested prior to use.

Road Transportation
Copyright © 1998-2021, Dr. Jean-Paul Rodrigue, Dept. of Global Studies & Geography, Hofstra University. For personal or classroom use ONLY. This material (including graphics) is not public domain and cannot be published, in whole or in part, in ANY form (printed or electronic) and on any media without consent. This includes conference presentations. Permission MUST be requested prior to use.
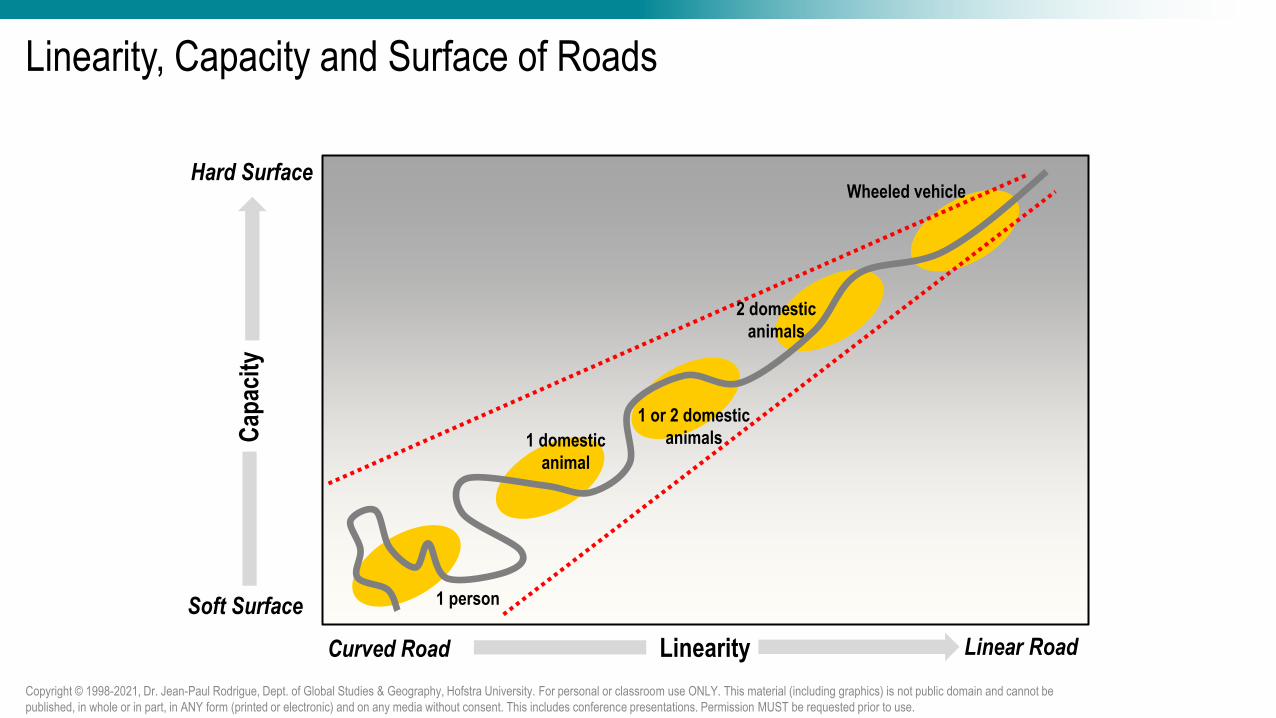
Linearity, Capacity and Surface of Roads
Copyright © 1998-2021, Dr. Jean-Paul Rodrigue, Dept. of Global Studies & Geography, Hofstra University. For personal or classroom use ONLY. This material (including graphics) is not public domain and cannot be published, in whole or in part, in ANY form (printed or electronic) and on any media without consent. This includes conference presentations. Permission MUST be requested prior to use.
Cap
acit
y
Linearity
1 person
1 domestic
animal
Wheeled vehicle
1 or 2 domestic
animals
2 domestic
animals
Hard Surface
Soft Surface
Linear RoadCurved Road

World Road Network
Copyright © 1998-2021, Dr. Jean-Paul Rodrigue, Dept. of Global Studies & Geography, Hofstra University. For personal or classroom use ONLY. This material (including graphics) is not public domain and cannot be published, in whole or in part, in ANY form (printed or electronic) and on any media without consent. This includes conference presentations. Permission MUST be requested prior to use.
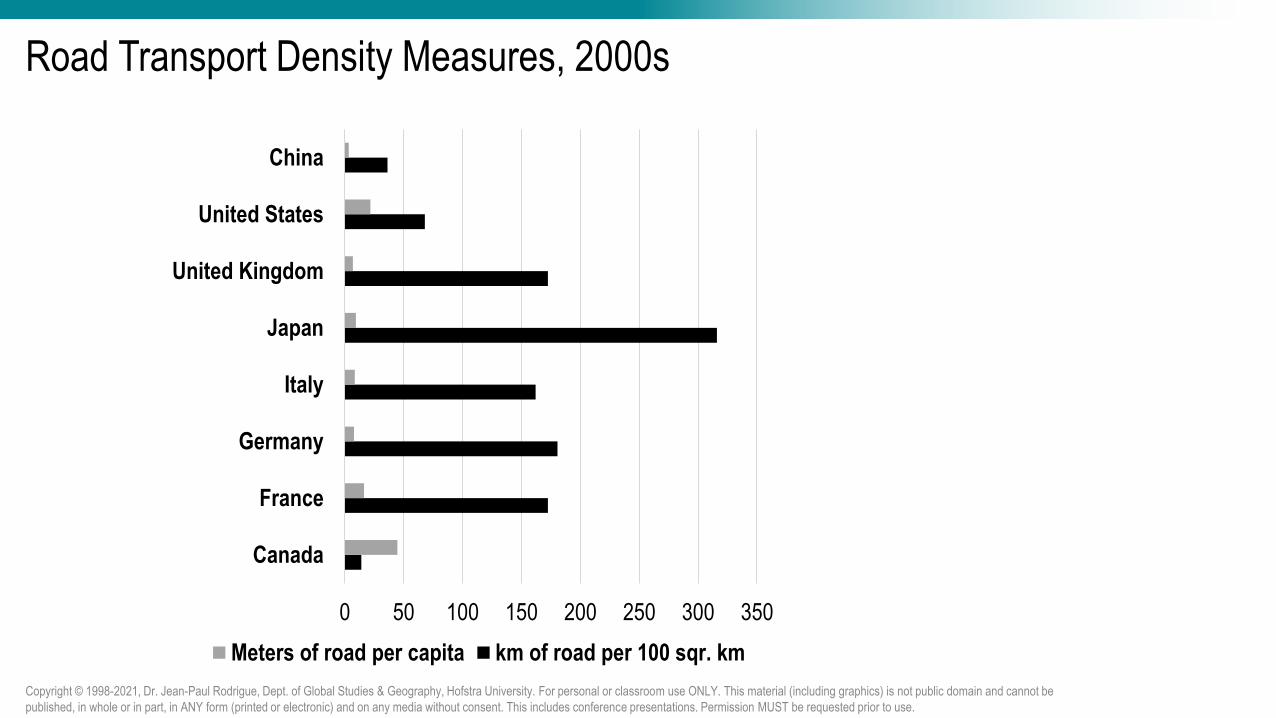
Road Transport Density Measures, 2000s
0 50 100 150 200 250 300 350
Canada
France
Germany
Italy
Japan
United Kingdom
United States
China
Meters of road per capita km of road per 100 sqr. km
Copyright © 1998-2021, Dr. Jean-Paul Rodrigue, Dept. of Global Studies & Geography, Hofstra University. For personal or classroom use ONLY. This material (including graphics) is not public domain and cannot be published, in whole or in part, in ANY form (printed or electronic) and on any media without consent. This includes conference presentations. Permission MUST be requested prior to use.
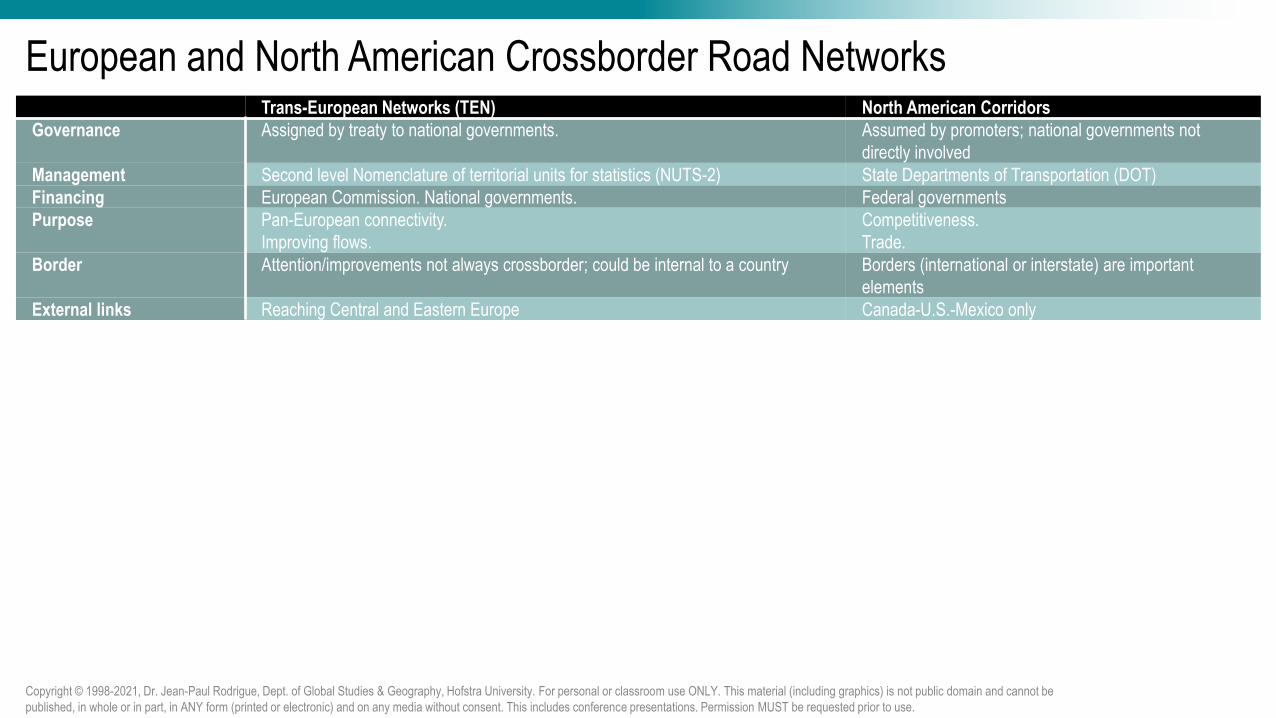
European and North American Crossborder Road NetworksTrans-European Networks (TEN) North American Corridors
Governance Assigned by treaty to national governments. Assumed by promoters; national governments not directly involved
Management Second level Nomenclature of territorial units for statistics (NUTS-2) State Departments of Transportation (DOT)Financing European Commission. National governments. Federal governmentsPurpose Pan-European connectivity.
Improving flows.Competitiveness.Trade.
Border Attention/improvements not always crossborder; could be internal to a country Borders (international or interstate) are important elements
External links Reaching Central and Eastern Europe Canada-U.S.-Mexico only
Copyright © 1998-2021, Dr. Jean-Paul Rodrigue, Dept. of Global Studies & Geography, Hofstra University. For personal or classroom use ONLY. This material (including graphics) is not public domain and cannot be published, in whole or in part, in ANY form (printed or electronic) and on any media without consent. This includes conference presentations. Permission MUST be requested prior to use.
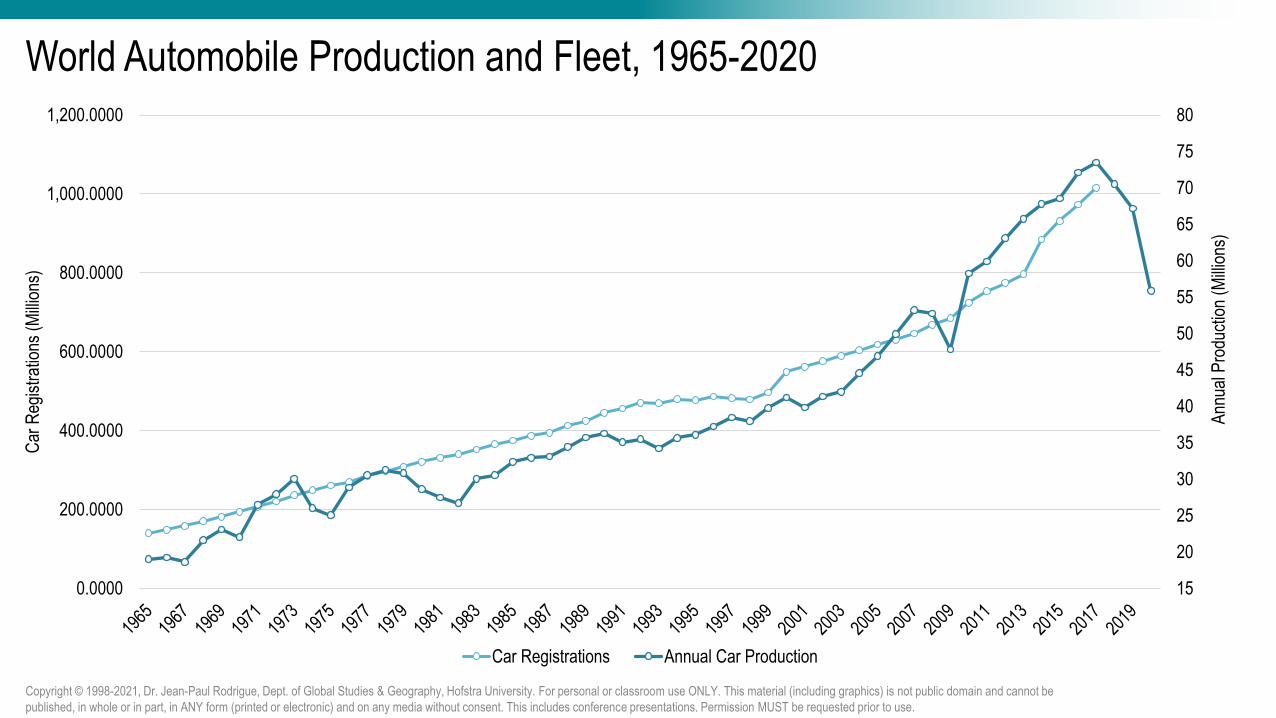
World Automobile Production and Fleet, 1965-2020
15
20
25
30
35
40
45
50
55
60
65
70
75
80
0.0000
200.0000
400.0000
600.0000
800.0000
1,000.0000
1,200.0000
Ann
ual P
rodu
ctio
n (M
illio
ns)
Car
Reg
istr
atio
ns (M
illio
ns)
Car Registrations Annual Car Production
Copyright © 1998-2021, Dr. Jean-Paul Rodrigue, Dept. of Global Studies & Geography, Hofstra University. For personal or classroom use ONLY. This material (including graphics) is not public domain and cannot be published, in whole or in part, in ANY form (printed or electronic) and on any media without consent. This includes conference presentations. Permission MUST be requested prior to use.
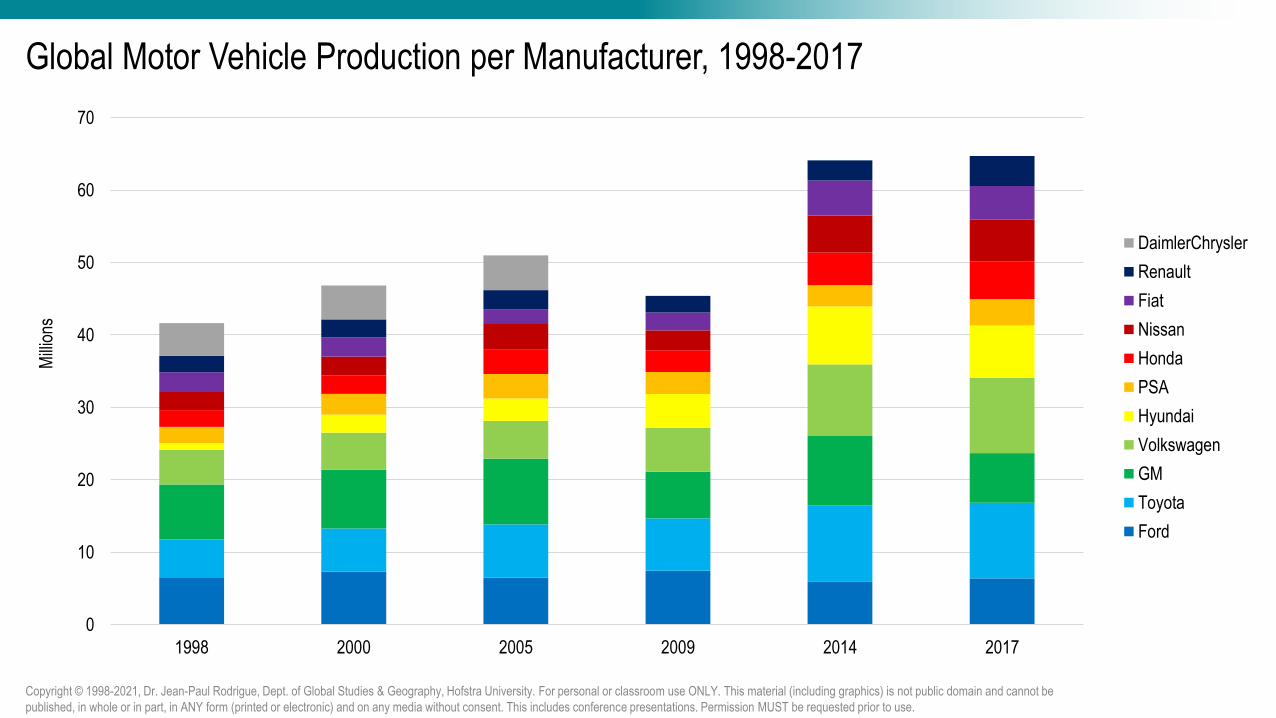
Global Motor Vehicle Production per Manufacturer, 1998-2017
0
10
20
30
40
50
60
70
1998 2000 2005 2009 2014 2017
Mill
ions
DaimlerChrysler
Renault
Fiat
Nissan
Honda
PSA
Hyundai
Volkswagen
GM
Toyota
Ford
Copyright © 1998-2021, Dr. Jean-Paul Rodrigue, Dept. of Global Studies & Geography, Hofstra University. For personal or classroom use ONLY. This material (including graphics) is not public domain and cannot be published, in whole or in part, in ANY form (printed or electronic) and on any media without consent. This includes conference presentations. Permission MUST be requested prior to use.
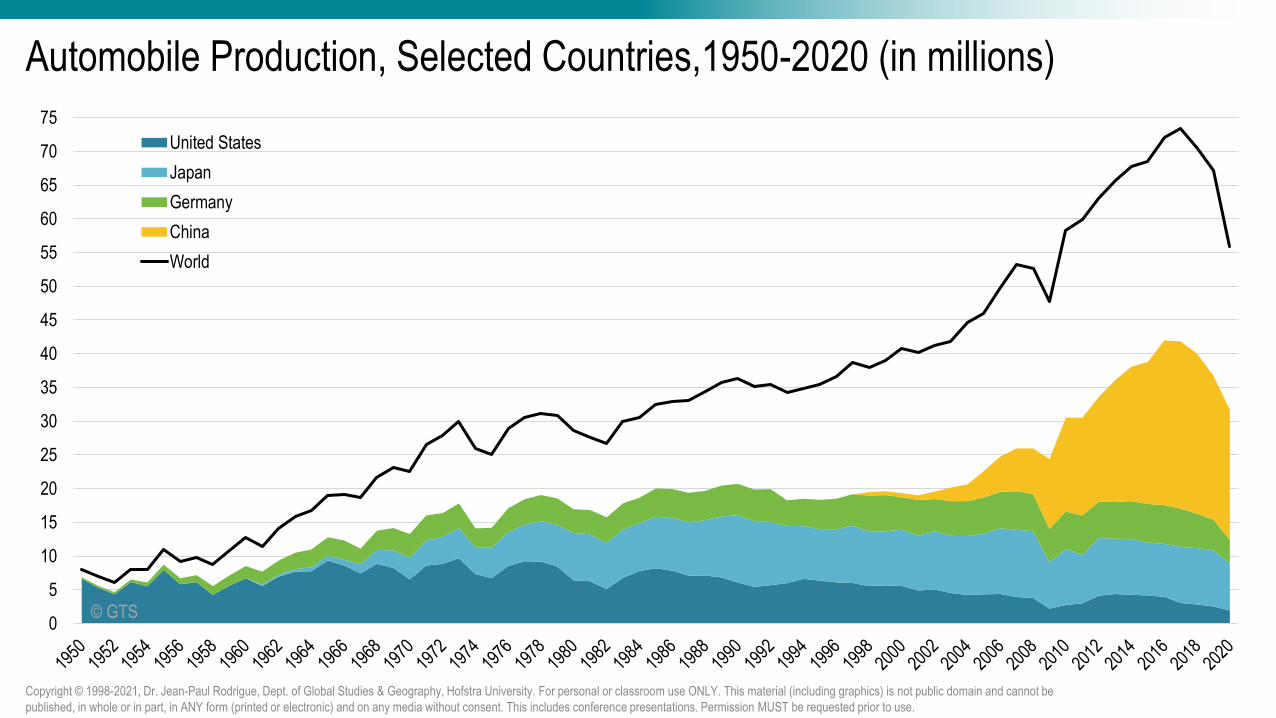
Automobile Production, Selected Countries,1950-2020 (in millions)
0
5
10
15
20
25
30
35
40
45
50
55
60
65
70
75
United States
Japan
Germany
China
World
Copyright © 1998-2021, Dr. Jean-Paul Rodrigue, Dept. of Global Studies & Geography, Hofstra University. For personal or classroom use ONLY. This material (including graphics) is not public domain and cannot be published, in whole or in part, in ANY form (printed or electronic) and on any media without consent. This includes conference presentations. Permission MUST be requested prior to use.
© GTS

The Interstate Highway System
Copyright © 1998-2021, Dr. Jean-Paul Rodrigue, Dept. of Global Studies & Geography, Hofstra University. For personal or classroom use ONLY. This material (including graphics) is not public domain and cannot be published, in whole or in part, in ANY form (printed or electronic) and on any media without consent. This includes conference presentations. Permission MUST be requested prior to use.
Copyright © 1998-2021, Dr. Jean-Paul Rodrigue, Dept. of Global Studies & Geography, Hofstra University. For personal or classroom use ONLY. This material (including graphics) is not public domain and cannot be published, in whole or in part, in ANY form (printed or electronic) and on any media without consent. This includes conference presentations. Permission MUST be requested prior to use.

Length of the Interstate Highway System and of the Chinese Expressway System, 1959-2018 (in km)
-10,000
10,000
30,000
50,000
70,000
90,000
110,000
130,000
150,000
1955 1960 1965 1970 1975 1980 1985 1990 1995 2000 2005 2010 2015 2020
United States (Interstate) China (Expressways)
Copyright © 1998-2021, Dr. Jean-Paul Rodrigue, Dept. of Global Studies & Geography, Hofstra University. For personal or classroom use ONLY. This material (including graphics) is not public domain and cannot be published, in whole or in part, in ANY form (printed or electronic) and on any media without consent. This includes conference presentations. Permission MUST be requested prior to use.
Copyright © 1998-2021, Dr. Jean-Paul Rodrigue, Dept. of Global Studies & Geography, Hofstra University. For personal or classroom use ONLY. This material (including graphics) is not public domain and cannot be published, in whole or in part, in ANY form (printed or electronic) and on any media without consent. This includes conference presentations. Permission MUST be requested prior to use.
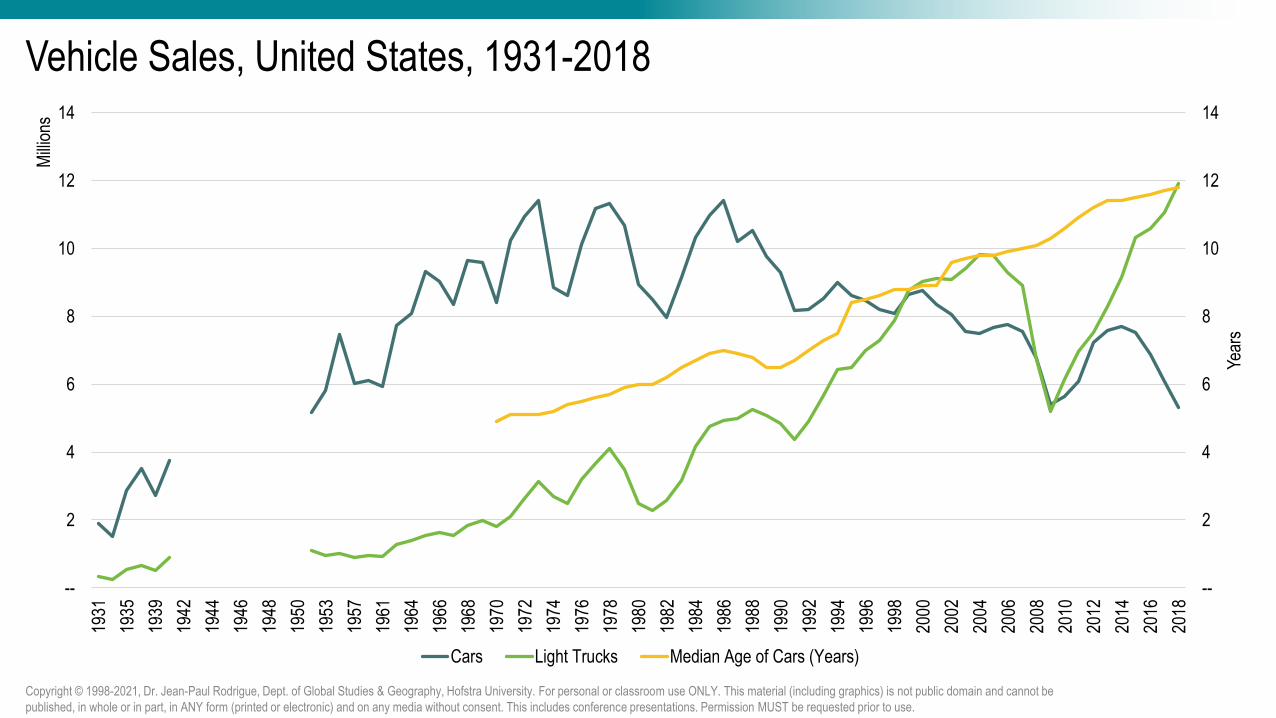
Vehicle Sales, United States, 1931-2018
--
2
4
6
8
10
12
14
--
2
4
6
8
10
12
1419
31
1935
1939
1942
1944
1946
1948
1950
1953
1957
1961
1964
1966
1968
1970
1972
1974
1976
1978
1980
1982
1984
1986
1988
1990
1992
1994
1996
1998
2000
2002
2004
2006
2008
2010
2012
2014
2016
2018
Year
s
Mill
ions
Cars Light Trucks Median Age of Cars (Years)
Copyright © 1998-2021, Dr. Jean-Paul Rodrigue, Dept. of Global Studies & Geography, Hofstra University. For personal or classroom use ONLY. This material (including graphics) is not public domain and cannot be published, in whole or in part, in ANY form (printed or electronic) and on any media without consent. This includes conference presentations. Permission MUST be requested prior to use.
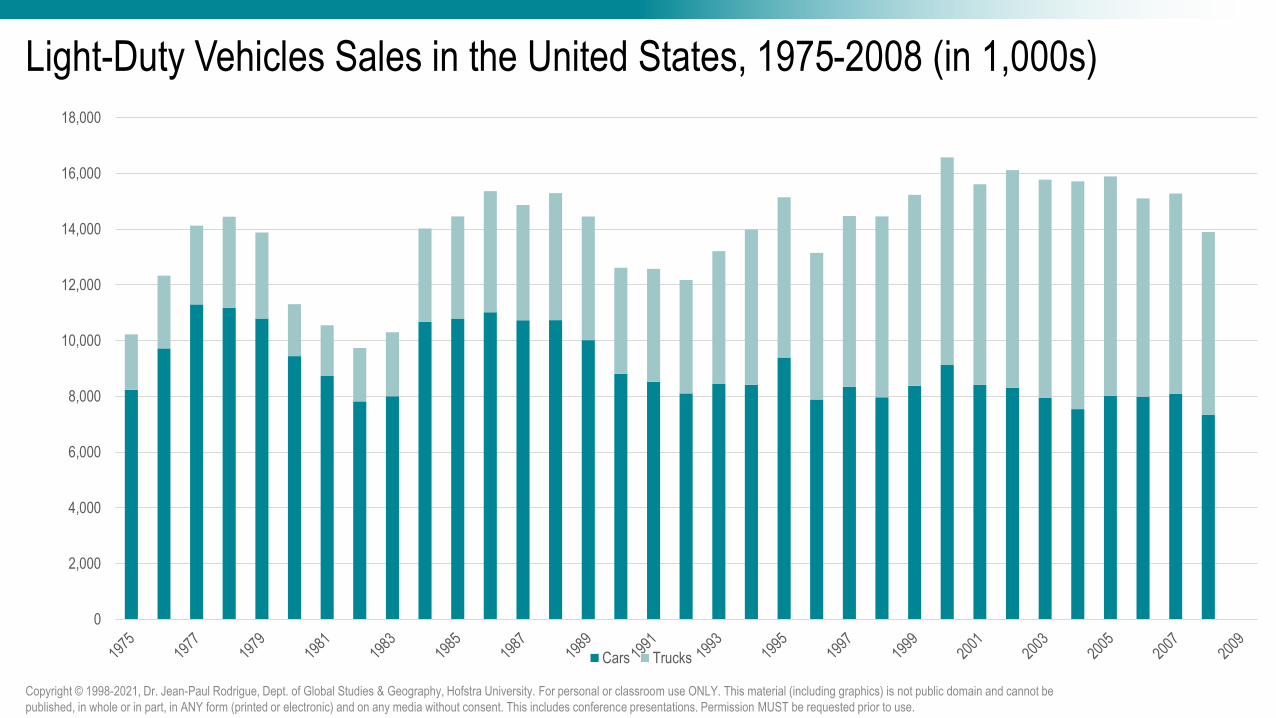
Light-Duty Vehicles Sales in the United States, 1975-2008 (in 1,000s)
0
2,000
4,000
6,000
8,000
10,000
12,000
14,000
16,000
18,000
Cars Trucks
Copyright © 1998-2021, Dr. Jean-Paul Rodrigue, Dept. of Global Studies & Geography, Hofstra University. For personal or classroom use ONLY. This material (including graphics) is not public domain and cannot be published, in whole or in part, in ANY form (printed or electronic) and on any media without consent. This includes conference presentations. Permission MUST be requested prior to use.

Distribution of Car Trips by Travelled Distance, United States
0
10
20
30
40
50
60
70
80
90
100
0 10 20 30 40 50 60 70 80 90 100
Cum
ulat
ive
Trip
s (%
)
Distance (Miles)
Copyright © 1998-2021, Dr. Jean-Paul Rodrigue, Dept. of Global Studies & Geography, Hofstra University. For personal or classroom use ONLY. This material (including graphics) is not public domain and cannot be published, in whole or in part, in ANY form (printed or electronic) and on any media without consent. This includes conference presentations. Permission MUST be requested prior to use.
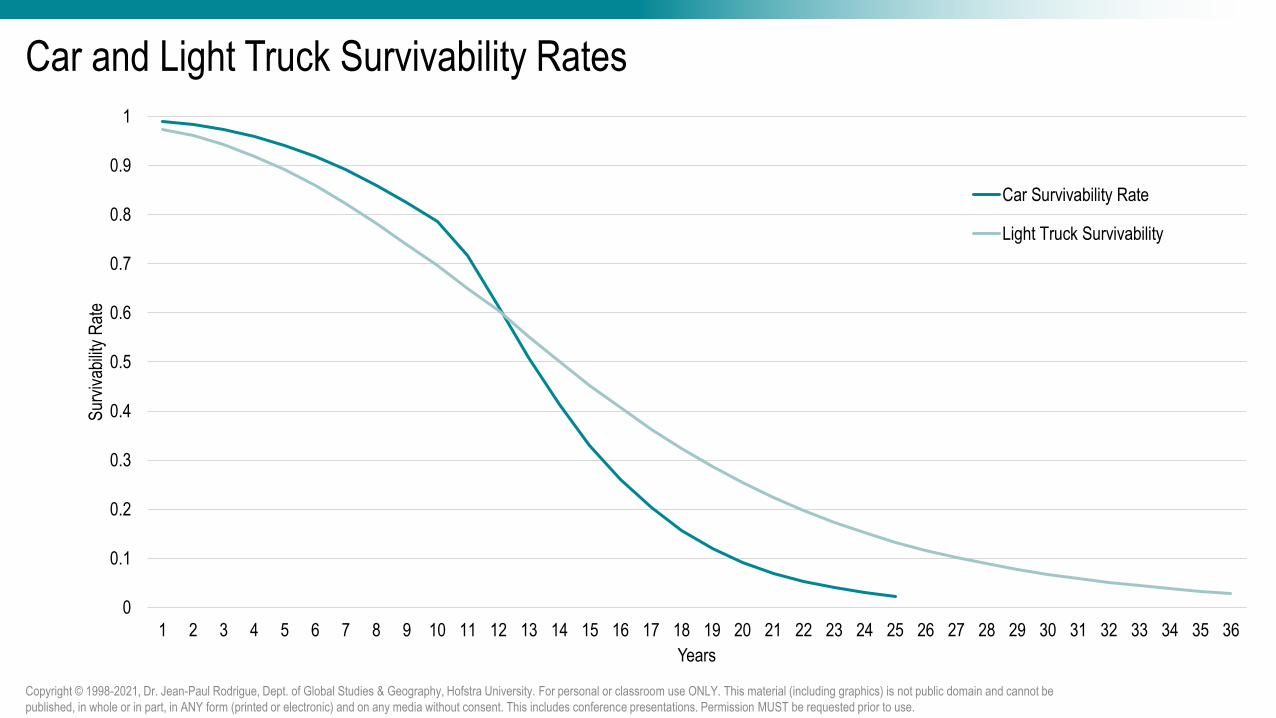
Car and Light Truck Survivability Rates
0
0.1
0.2
0.3
0.4
0.5
0.6
0.7
0.8
0.9
1
1 2 3 4 5 6 7 8 9 10 11 12 13 14 15 16 17 18 19 20 21 22 23 24 25 26 27 28 29 30 31 32 33 34 35 36
Sur
viva
bilit
y R
ate
Years
Car Survivability Rate
Light Truck Survivability
Copyright © 1998-2021, Dr. Jean-Paul Rodrigue, Dept. of Global Studies & Geography, Hofstra University. For personal or classroom use ONLY. This material (including graphics) is not public domain and cannot be published, in whole or in part, in ANY form (printed or electronic) and on any media without consent. This includes conference presentations. Permission MUST be requested prior to use.
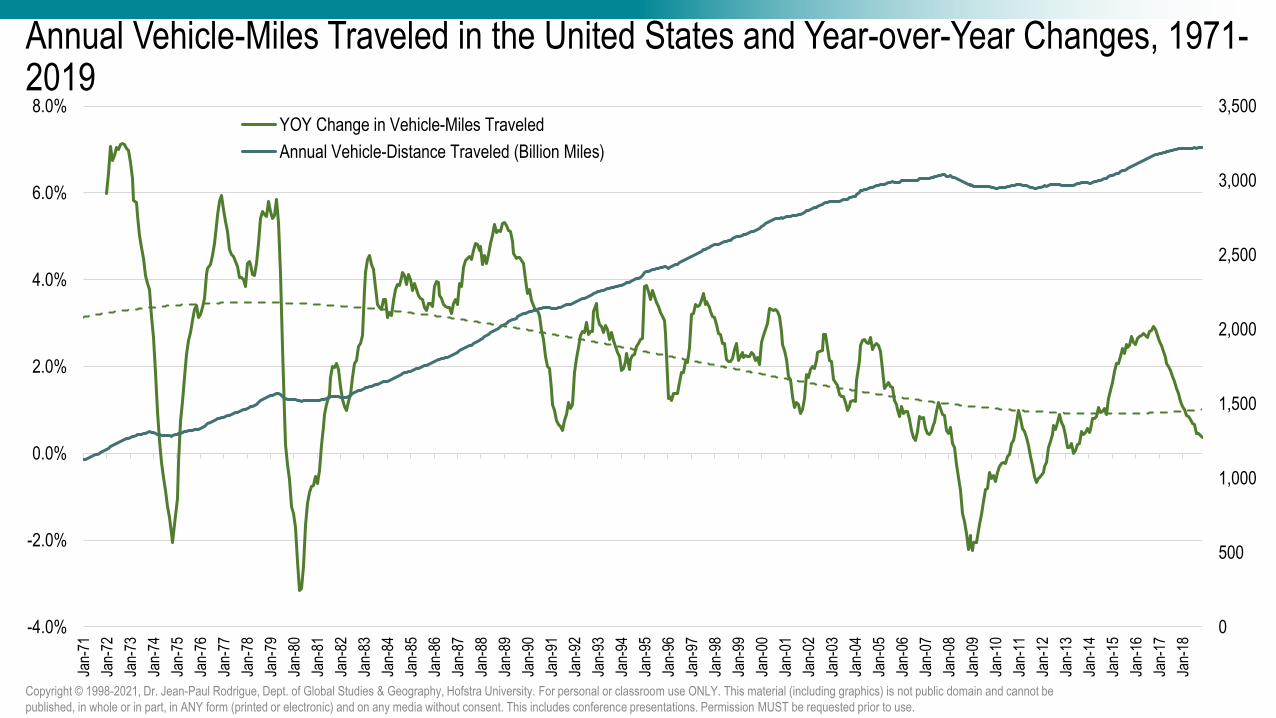
Annual Vehicle-Miles Traveled in the United States and Year-over-Year Changes, 1971-2019
0
500
1,000
1,500
2,000
2,500
3,000
3,500
-4.0%
-2.0%
0.0%
2.0%
4.0%
6.0%
8.0%
Jan-
71
Jan-
72
Jan-
73
Jan-
74
Jan-
75
Jan-
76
Jan-
77
Jan-
78
Jan-
79
Jan-
80
Jan-
81
Jan-
82
Jan-
83
Jan-
84
Jan-
85
Jan-
86
Jan-
87
Jan-
88
Jan-
89
Jan-
90
Jan-
91
Jan-
92
Jan-
93
Jan-
94
Jan-
95
Jan-
96
Jan-
97
Jan-
98
Jan-
99
Jan-
00
Jan-
01
Jan-
02
Jan-
03
Jan-
04
Jan-
05
Jan-
06
Jan-
07
Jan-
08
Jan-
09
Jan-
10
Jan-
11
Jan-
12
Jan-
13
Jan-
14
Jan-
15
Jan-
16
Jan-
17
Jan-
18
YOY Change in Vehicle-Miles Traveled
Annual Vehicle-Distance Traveled (Billion Miles)
Copyright © 1998-2021, Dr. Jean-Paul Rodrigue, Dept. of Global Studies & Geography, Hofstra University. For personal or classroom use ONLY. This material (including graphics) is not public domain and cannot be published, in whole or in part, in ANY form (printed or electronic) and on any media without consent. This includes conference presentations. Permission MUST be requested prior to use.
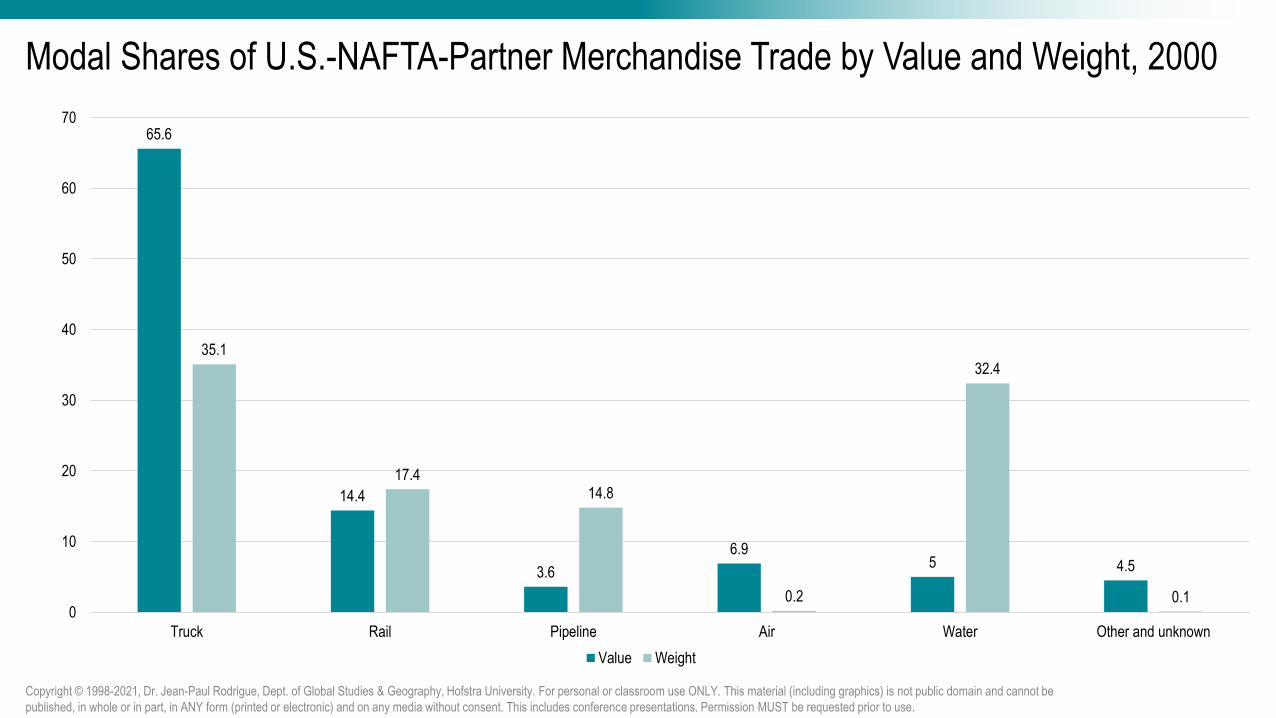
Modal Shares of U.S.-NAFTA-Partner Merchandise Trade by Value and Weight, 2000
65.6
14.4
3.6
6.95 4.5
35.1
17.414.8
0.2
32.4
0.10
10
20
30
40
50
60
70
Truck Rail Pipeline Air Water Other and unknown
Value Weight
Copyright © 1998-2021, Dr. Jean-Paul Rodrigue, Dept. of Global Studies & Geography, Hofstra University. For personal or classroom use ONLY. This material (including graphics) is not public domain and cannot be published, in whole or in part, in ANY form (printed or electronic) and on any media without consent. This includes conference presentations. Permission MUST be requested prior to use.

Cost Structure of Trucking, United States, 2006
26.6%
22.4%
3.4%5.7%
29.1%
3.8%
9.0%
Wages & Benefits
Fuel & Maintenance
Insurance
Depreciation
Rent & Purchase
Other
Profit
Copyright © 1998-2021, Dr. Jean-Paul Rodrigue, Dept. of Global Studies & Geography, Hofstra University. For personal or classroom use ONLY. This material (including graphics) is not public domain and cannot be published, in whole or in part, in ANY form (printed or electronic) and on any media without consent. This includes conference presentations. Permission MUST be requested prior to use.
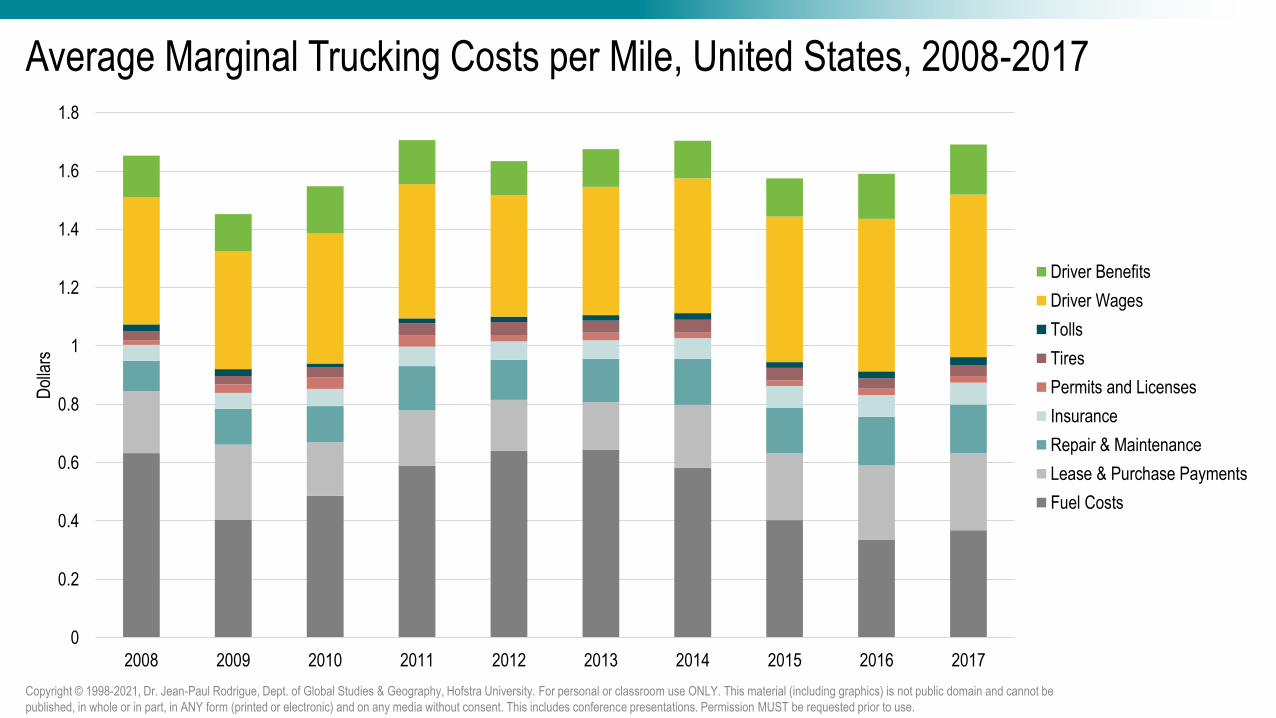
Average Marginal Trucking Costs per Mile, United States, 2008-2017
0
0.2
0.4
0.6
0.8
1
1.2
1.4
1.6
1.8
2008 2009 2010 2011 2012 2013 2014 2015 2016 2017
Dol
lars
Driver Benefits
Driver Wages
Tolls
Tires
Permits and Licenses
Insurance
Repair & Maintenance
Lease & Purchase Payments
Fuel Costs
Copyright © 1998-2021, Dr. Jean-Paul Rodrigue, Dept. of Global Studies & Geography, Hofstra University. For personal or classroom use ONLY. This material (including graphics) is not public domain and cannot be published, in whole or in part, in ANY form (printed or electronic) and on any media without consent. This includes conference presentations. Permission MUST be requested prior to use.
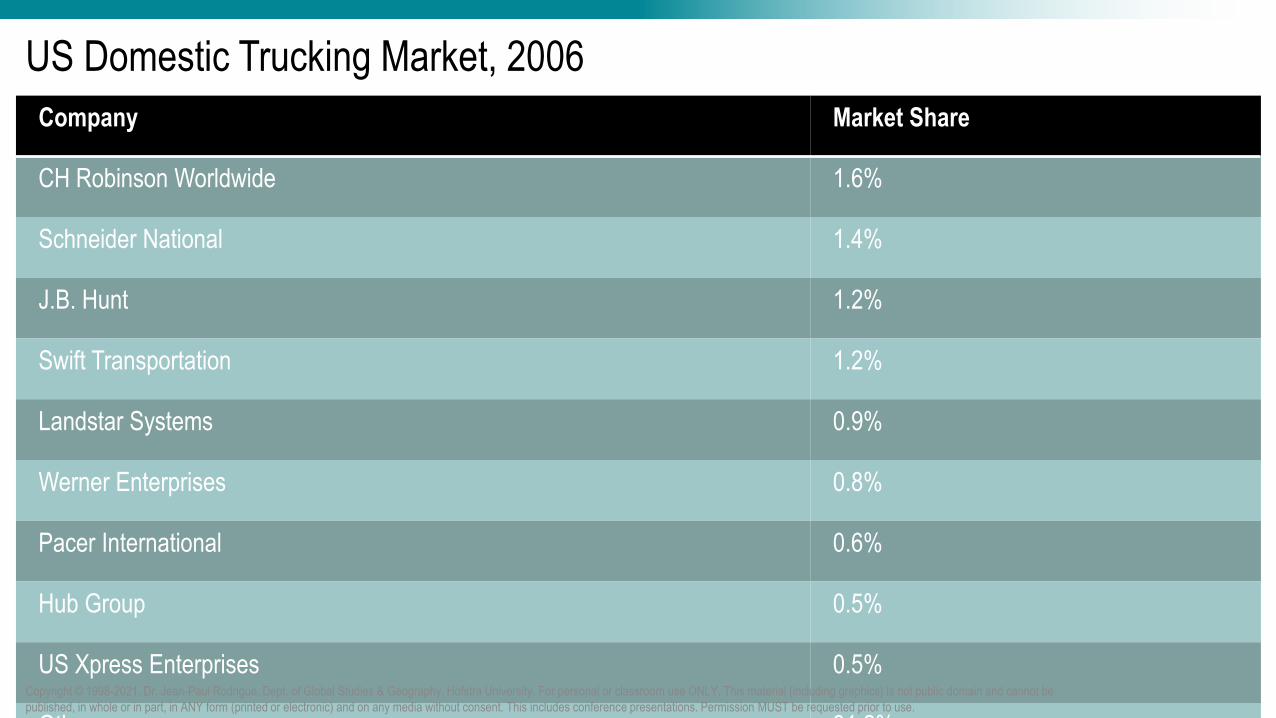
US Domestic Trucking Market, 2006
Company Market Share
CH Robinson Worldwide 1.6%
Schneider National 1.4%
J.B. Hunt 1.2%
Swift Transportation 1.2%
Landstar Systems 0.9%
Werner Enterprises 0.8%
Pacer International 0.6%
Hub Group 0.5%
US Xpress Enterprises 0.5%
Others 91.2%
Copyright © 1998-2021, Dr. Jean-Paul Rodrigue, Dept. of Global Studies & Geography, Hofstra University. For personal or classroom use ONLY. This material (including graphics) is not public domain and cannot be published, in whole or in part, in ANY form (printed or electronic) and on any media without consent. This includes conference presentations. Permission MUST be requested prior to use.
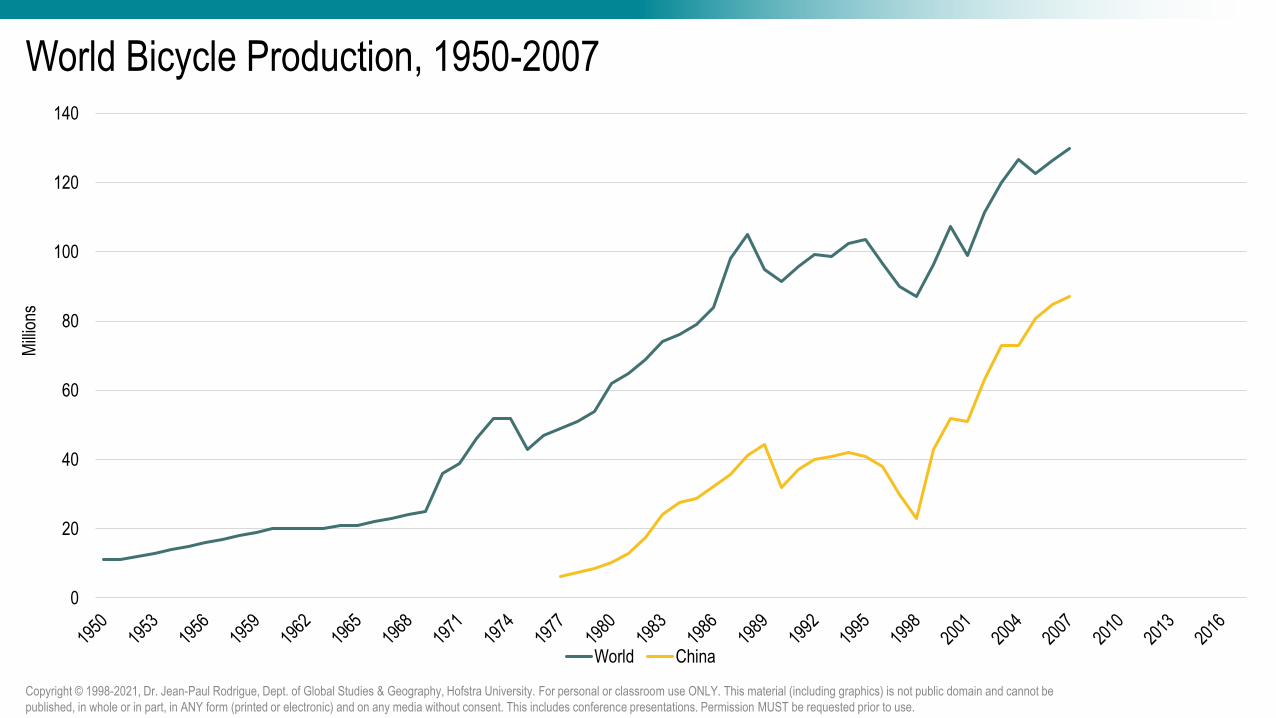
World Bicycle Production, 1950-2007
0
20
40
60
80
100
120
140
Mill
ions
World China
Copyright © 1998-2021, Dr. Jean-Paul Rodrigue, Dept. of Global Studies & Geography, Hofstra University. For personal or classroom use ONLY. This material (including graphics) is not public domain and cannot be published, in whole or in part, in ANY form (printed or electronic) and on any media without consent. This includes conference presentations. Permission MUST be requested prior to use.
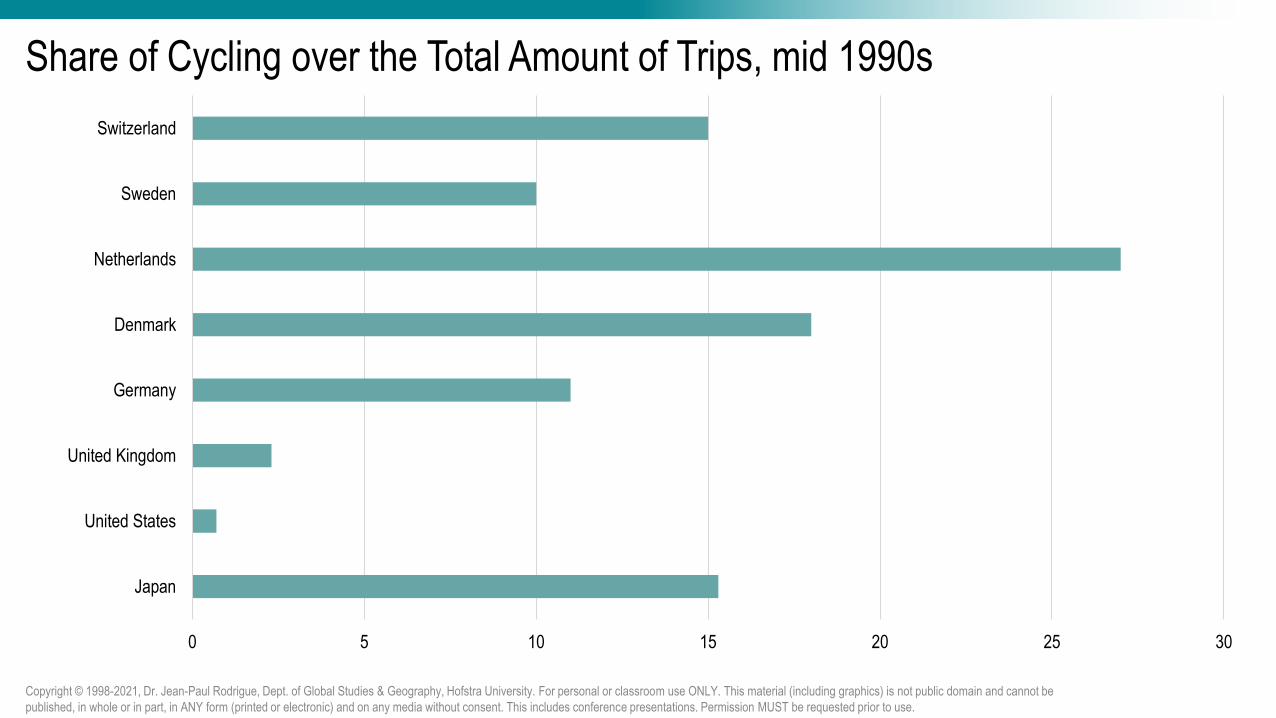
Share of Cycling over the Total Amount of Trips, mid 1990s
0 5 10 15 20 25 30
Japan
United States
United Kingdom
Germany
Denmark
Netherlands
Sweden
Switzerland
Copyright © 1998-2021, Dr. Jean-Paul Rodrigue, Dept. of Global Studies & Geography, Hofstra University. For personal or classroom use ONLY. This material (including graphics) is not public domain and cannot be published, in whole or in part, in ANY form (printed or electronic) and on any media without consent. This includes conference presentations. Permission MUST be requested prior to use.
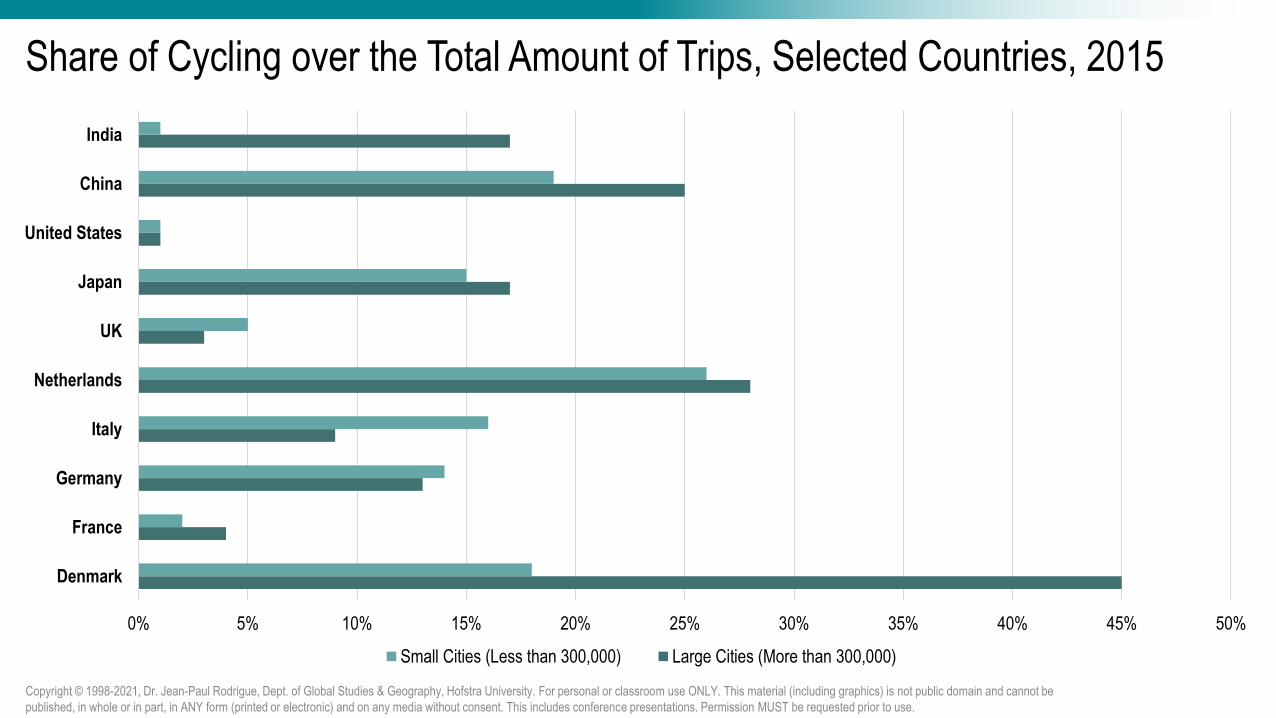
Share of Cycling over the Total Amount of Trips, Selected Countries, 2015
0% 5% 10% 15% 20% 25% 30% 35% 40% 45% 50%
Denmark
France
Germany
Italy
Netherlands
UK
Japan
United States
China
India
Small Cities (Less than 300,000) Large Cities (More than 300,000)
Copyright © 1998-2021, Dr. Jean-Paul Rodrigue, Dept. of Global Studies & Geography, Hofstra University. For personal or classroom use ONLY. This material (including graphics) is not public domain and cannot be published, in whole or in part, in ANY form (printed or electronic) and on any media without consent. This includes conference presentations. Permission MUST be requested prior to use.
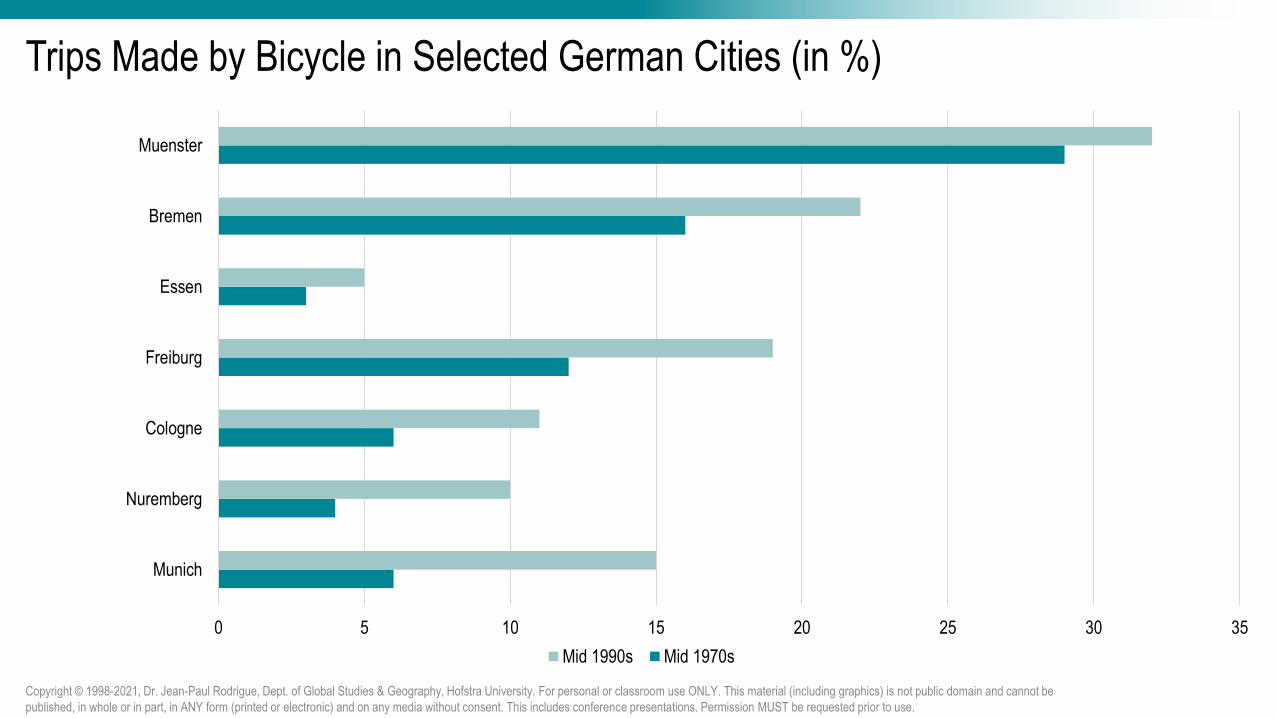
Trips Made by Bicycle in Selected German Cities (in %)
0 5 10 15 20 25 30 35
Munich
Nuremberg
Cologne
Freiburg
Essen
Bremen
Muenster
Mid 1990s Mid 1970s
Copyright © 1998-2021, Dr. Jean-Paul Rodrigue, Dept. of Global Studies & Geography, Hofstra University. For personal or classroom use ONLY. This material (including graphics) is not public domain and cannot be published, in whole or in part, in ANY form (printed or electronic) and on any media without consent. This includes conference presentations. Permission MUST be requested prior to use.
Rail Transportation
Copyright © 1998-2021, Dr. Jean-Paul Rodrigue, Dept. of Global Studies & Geography, Hofstra University. For personal or classroom use ONLY. This material (including graphics) is not public domain and cannot be published, in whole or in part, in ANY form (printed or electronic) and on any media without consent. This includes conference presentations. Permission MUST be requested prior to use.

World Rail Network and Rail Systems
Copyright © 1998-2021, Dr. Jean-Paul Rodrigue, Dept. of Global Studies & Geography, Hofstra University. For personal or classroom use ONLY. This material (including graphics) is not public domain and cannot be published, in whole or in part, in ANY form (printed or electronic) and on any media without consent. This includes conference presentations. Permission MUST be requested prior to use.

Geographical Settings of Rail Lines
Copyright © 1998-2021, Dr. Jean-Paul Rodrigue, Dept. of Global Studies & Geography, Hofstra University. For personal or classroom use ONLY. This material (including graphics) is not public domain and cannot be published, in whole or in part, in ANY form (printed or electronic) and on any media without consent. This includes conference presentations. Permission MUST be requested prior to use.
Penetration lines Regional networks Transcontinental lines

Geographical Settings of Rail Lines (Greyscale)
Copyright © 1998-2021, Dr. Jean-Paul Rodrigue, Dept. of Global Studies & Geography, Hofstra University. For personal or classroom use ONLY. This material (including graphics) is not public domain and cannot be published, in whole or in part, in ANY form (printed or electronic) and on any media without consent. This includes conference presentations. Permission MUST be requested prior to use.
Penetration Lines Regional Networks Transcontinental Lines

Economic Rationale of Rail Transportation
Market Area Longest service area for inland transport (average length of 1,300 km).Service both the passengers and freight markets.Intermodal integration favored market segmentation and specialization.
Capacity A wagon can carry 50 to 100 tons of freight.Economies of scale (unit trains and doublestacking).
Costs High construction and maintenance costs.High operating costs: labor (60%), locomotives (16%) and fuel & equipment (24%).Shipping costs decrease with distance and load.Transshipments and train assembly increase costs.
Benefits Accelerated industrialization.Support agricultural and energy supply systems.Intermodal connecting with international trade.
Regulation Conventionally highly dependent from government subsidies.Government financing, mainly for the sake of national economic imperatives.From regulation to deregulation.Private ownership and operations.
Copyright © 1998-2021, Dr. Jean-Paul Rodrigue, Dept. of Global Studies & Geography, Hofstra University. For personal or classroom use ONLY. This material (including graphics) is not public domain and cannot be published, in whole or in part, in ANY form (printed or electronic) and on any media without consent. This includes conference presentations. Permission MUST be requested prior to use.

Length of the Main Rail Gauge Systems, 2008 (in km)
678,288
154,956
99,762
96,030
70,810
16,654
0 200,000 400,000 600,000 800,000
Standard Gauge (1435 mm)
Russian Gauge (1520-4 mm)
Indian Gauge (1676 mm)
Cape Gauge (1067 mm)
Meter Gauge (1000 mm)
Iberian Gauge (1668 mm)
Copyright © 1998-2021, Dr. Jean-Paul Rodrigue, Dept. of Global Studies & Geography, Hofstra University. For personal or classroom use ONLY. This material (including graphics) is not public domain and cannot be published, in whole or in part, in ANY form (printed or electronic) and on any media without consent. This includes conference presentations. Permission MUST be requested prior to use.
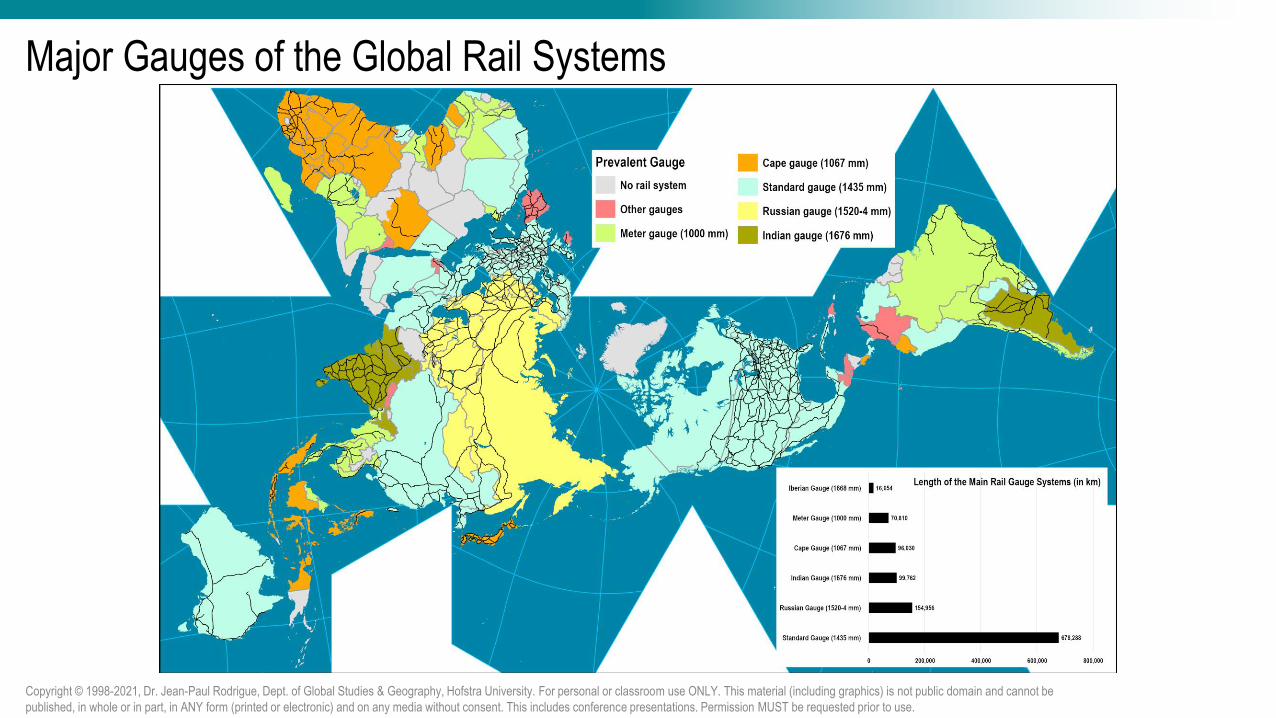
Major Gauges of the Global Rail Systems
Copyright © 1998-2021, Dr. Jean-Paul Rodrigue, Dept. of Global Studies & Geography, Hofstra University. For personal or classroom use ONLY. This material (including graphics) is not public domain and cannot be published, in whole or in part, in ANY form (printed or electronic) and on any media without consent. This includes conference presentations. Permission MUST be requested prior to use.
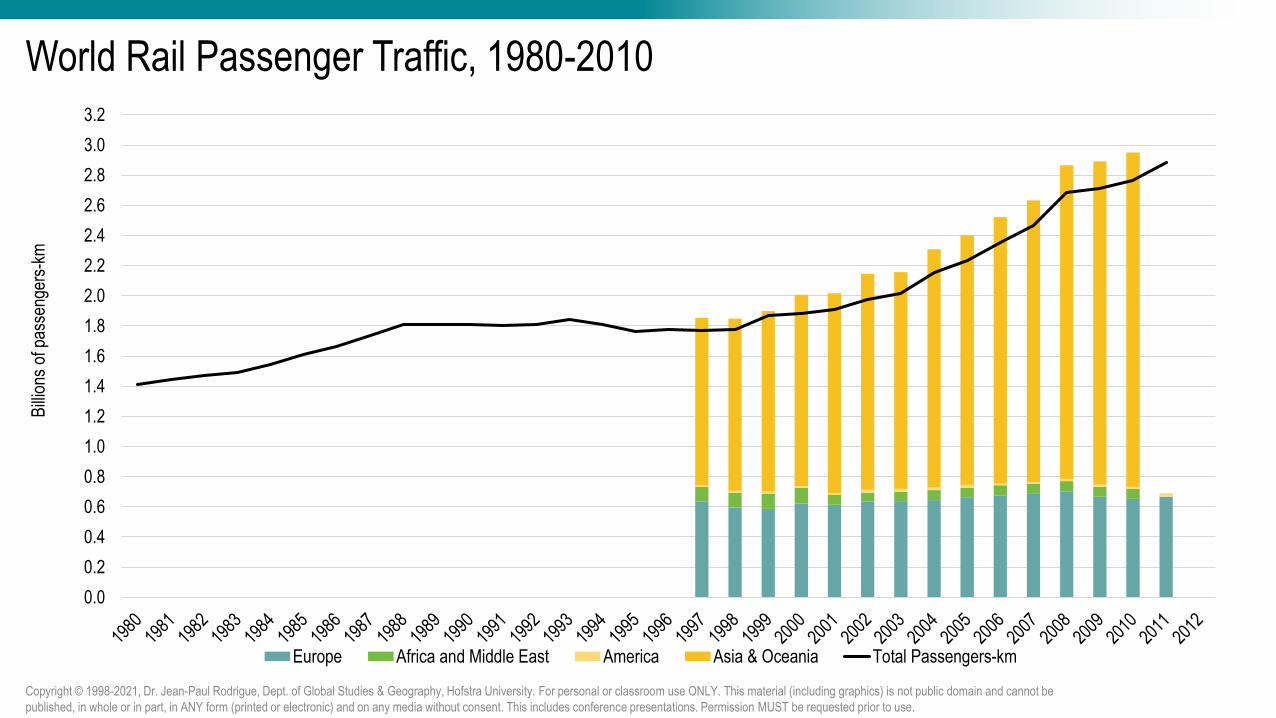
World Rail Passenger Traffic, 1980-2010
0.0
0.2
0.4
0.6
0.8
1.0
1.2
1.4
1.6
1.8
2.0
2.2
2.4
2.6
2.8
3.0
3.2
Bill
ions
of p
asse
nger
s-km
Europe Africa and Middle East America Asia & Oceania Total Passengers-km
Copyright © 1998-2021, Dr. Jean-Paul Rodrigue, Dept. of Global Studies & Geography, Hofstra University. For personal or classroom use ONLY. This material (including graphics) is not public domain and cannot be published, in whole or in part, in ANY form (printed or electronic) and on any media without consent. This includes conference presentations. Permission MUST be requested prior to use.
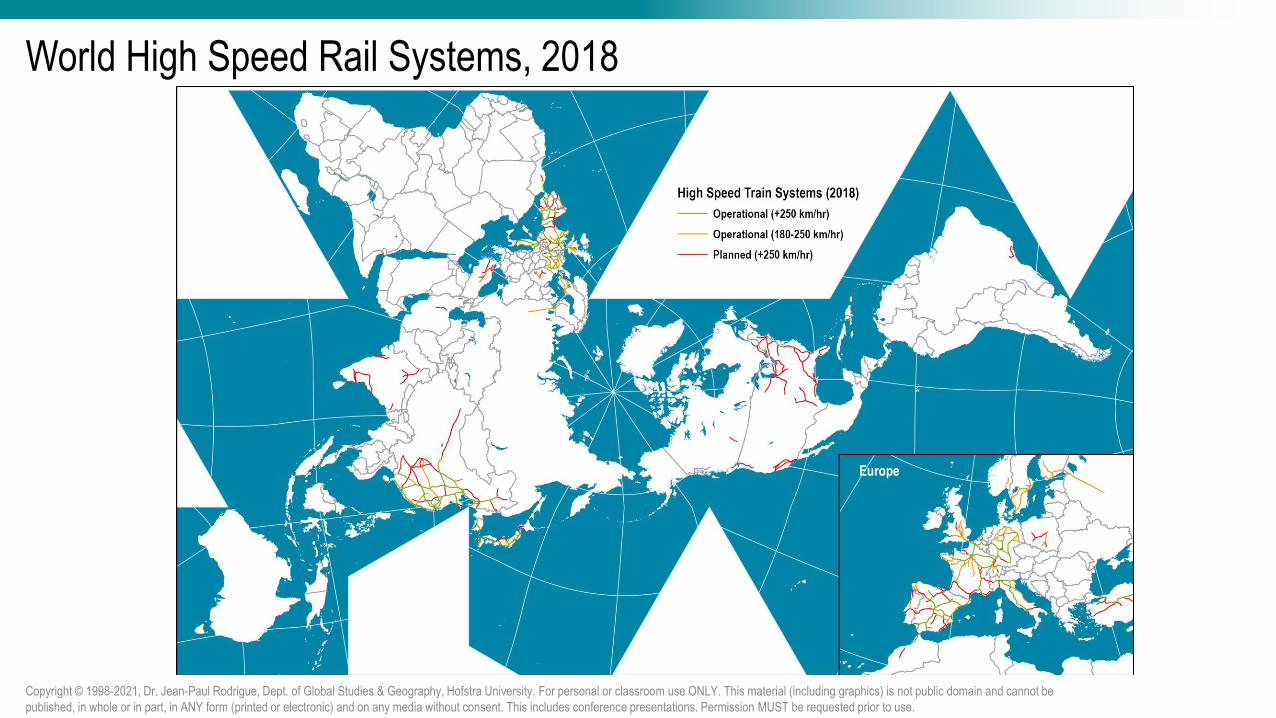
World High Speed Rail Systems, 2018
Copyright © 1998-2021, Dr. Jean-Paul Rodrigue, Dept. of Global Studies & Geography, Hofstra University. For personal or classroom use ONLY. This material (including graphics) is not public domain and cannot be published, in whole or in part, in ANY form (printed or electronic) and on any media without consent. This includes conference presentations. Permission MUST be requested prior to use.

World Rail Freight Traffic, 1997-2010
0
2,000
4,000
6,000
8,000
10,000
12,000
14,000
1997 1998 1999 2001 2002 2003 2004 2005 2006 2007 2008 2009 2010 2015 2018
Bill
ions
of t
ons-
km
Asia
America
Africa and Middle East
Russia
Europe
Copyright © 1998-2021, Dr. Jean-Paul Rodrigue, Dept. of Global Studies & Geography, Hofstra University. For personal or classroom use ONLY. This material (including graphics) is not public domain and cannot be published, in whole or in part, in ANY form (printed or electronic) and on any media without consent. This includes conference presentations. Permission MUST be requested prior to use.
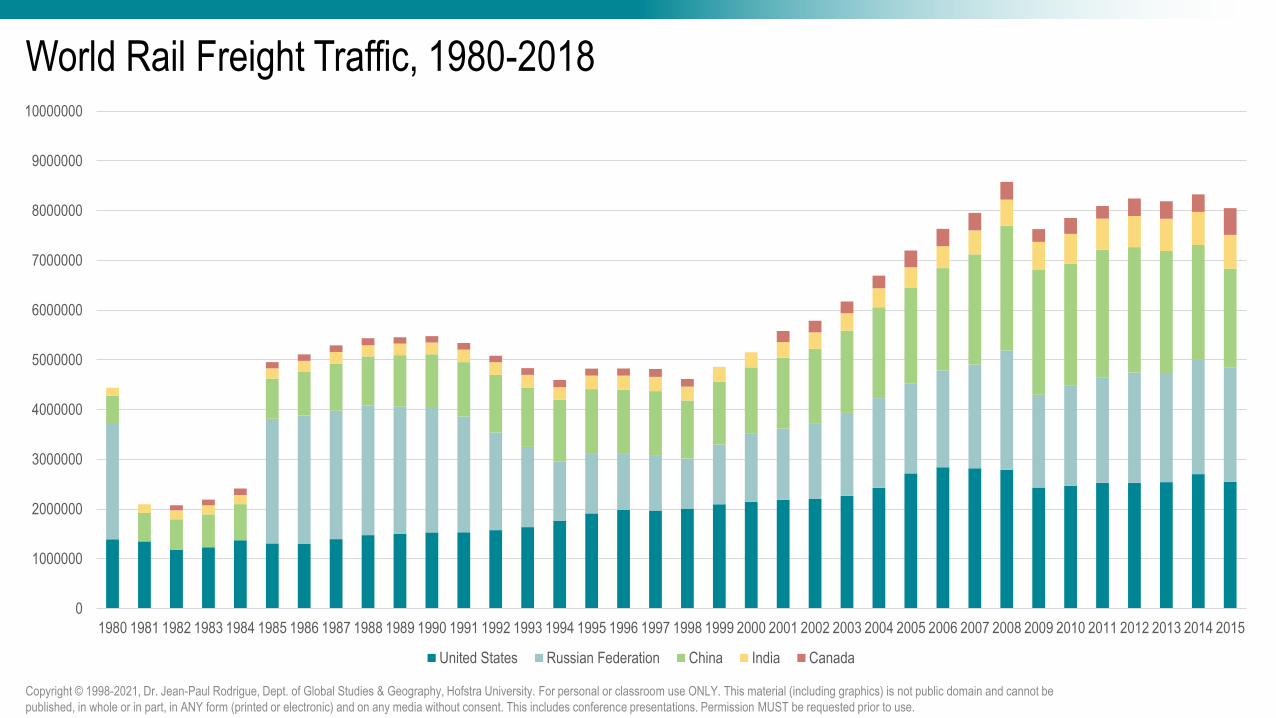
World Rail Freight Traffic, 1980-2018
0
1000000
2000000
3000000
4000000
5000000
6000000
7000000
8000000
9000000
10000000
1980 1981 1982 1983 1984 1985 1986 1987 1988 1989 1990 1991 1992 1993 1994 1995 1996 1997 1998 1999 2000 2001 2002 2003 2004 2005 2006 2007 2008 2009 2010 2011 2012 2013 2014 2015
United States Russian Federation China India Canada
Copyright © 1998-2021, Dr. Jean-Paul Rodrigue, Dept. of Global Studies & Geography, Hofstra University. For personal or classroom use ONLY. This material (including graphics) is not public domain and cannot be published, in whole or in part, in ANY form (printed or electronic) and on any media without consent. This includes conference presentations. Permission MUST be requested prior to use.
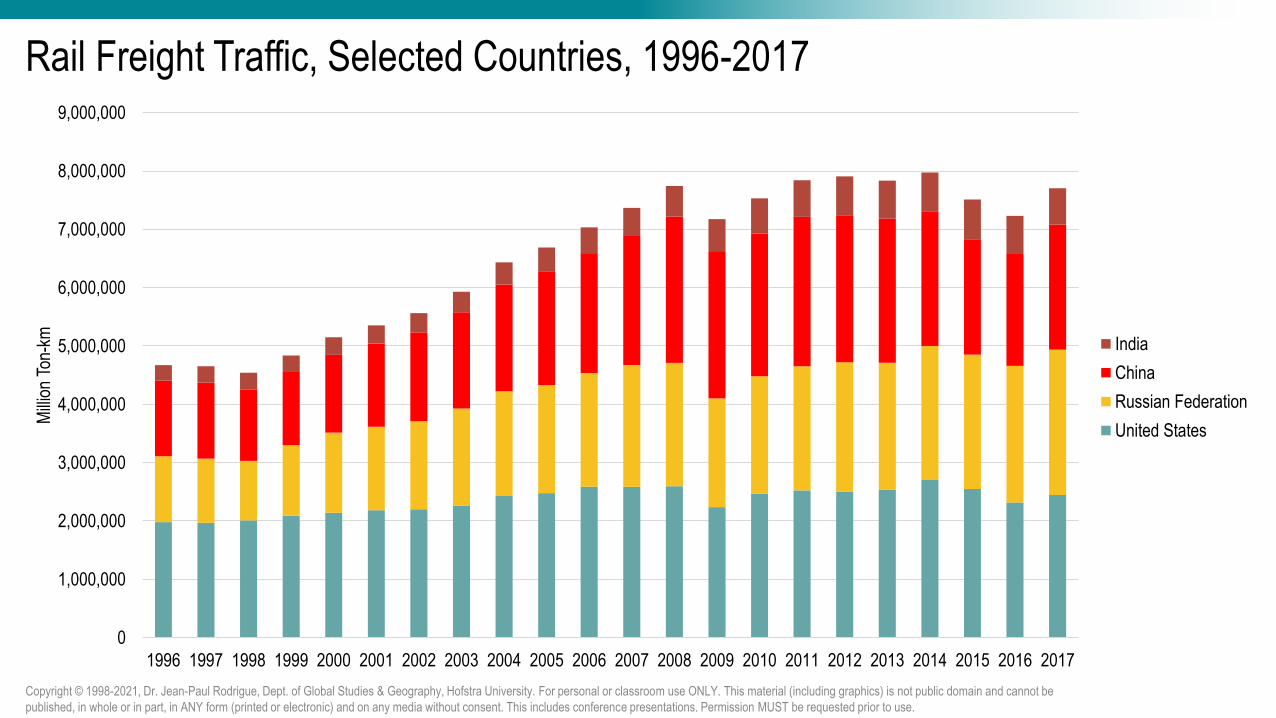
Rail Freight Traffic, Selected Countries, 1996-2017
0
1,000,000
2,000,000
3,000,000
4,000,000
5,000,000
6,000,000
7,000,000
8,000,000
9,000,000
1996 1997 1998 1999 2000 2001 2002 2003 2004 2005 2006 2007 2008 2009 2010 2011 2012 2013 2014 2015 2016 2017
Mill
ion
Ton-
km India
China
Russian Federation
United States
Copyright © 1998-2021, Dr. Jean-Paul Rodrigue, Dept. of Global Studies & Geography, Hofstra University. For personal or classroom use ONLY. This material (including graphics) is not public domain and cannot be published, in whole or in part, in ANY form (printed or electronic) and on any media without consent. This includes conference presentations. Permission MUST be requested prior to use.

World Rail Freight Traffic, 2015
Copyright © 1998-2021, Dr. Jean-Paul Rodrigue, Dept. of Global Studies & Geography, Hofstra University. For personal or classroom use ONLY. This material (including graphics) is not public domain and cannot be published, in whole or in part, in ANY form (printed or electronic) and on any media without consent. This includes conference presentations. Permission MUST be requested prior to use.
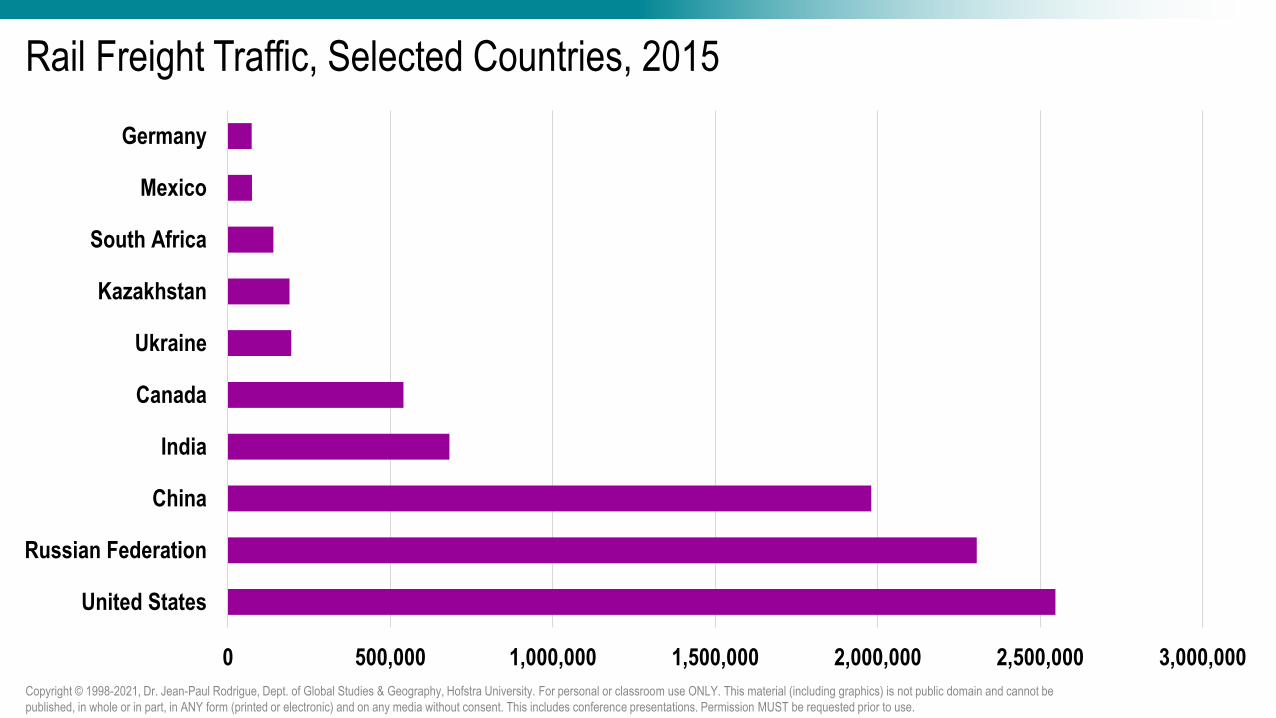
Rail Freight Traffic, Selected Countries, 2015
0 500,000 1,000,000 1,500,000 2,000,000 2,500,000 3,000,000
United States
Russian Federation
China
India
Canada
Ukraine
Kazakhstan
South Africa
Mexico
Germany
Copyright © 1998-2021, Dr. Jean-Paul Rodrigue, Dept. of Global Studies & Geography, Hofstra University. For personal or classroom use ONLY. This material (including graphics) is not public domain and cannot be published, in whole or in part, in ANY form (printed or electronic) and on any media without consent. This includes conference presentations. Permission MUST be requested prior to use.

World Rail Passenger Traffic, 2015
Copyright © 1998-2021, Dr. Jean-Paul Rodrigue, Dept. of Global Studies & Geography, Hofstra University. For personal or classroom use ONLY. This material (including graphics) is not public domain and cannot be published, in whole or in part, in ANY form (printed or electronic) and on any media without consent. This includes conference presentations. Permission MUST be requested prior to use.
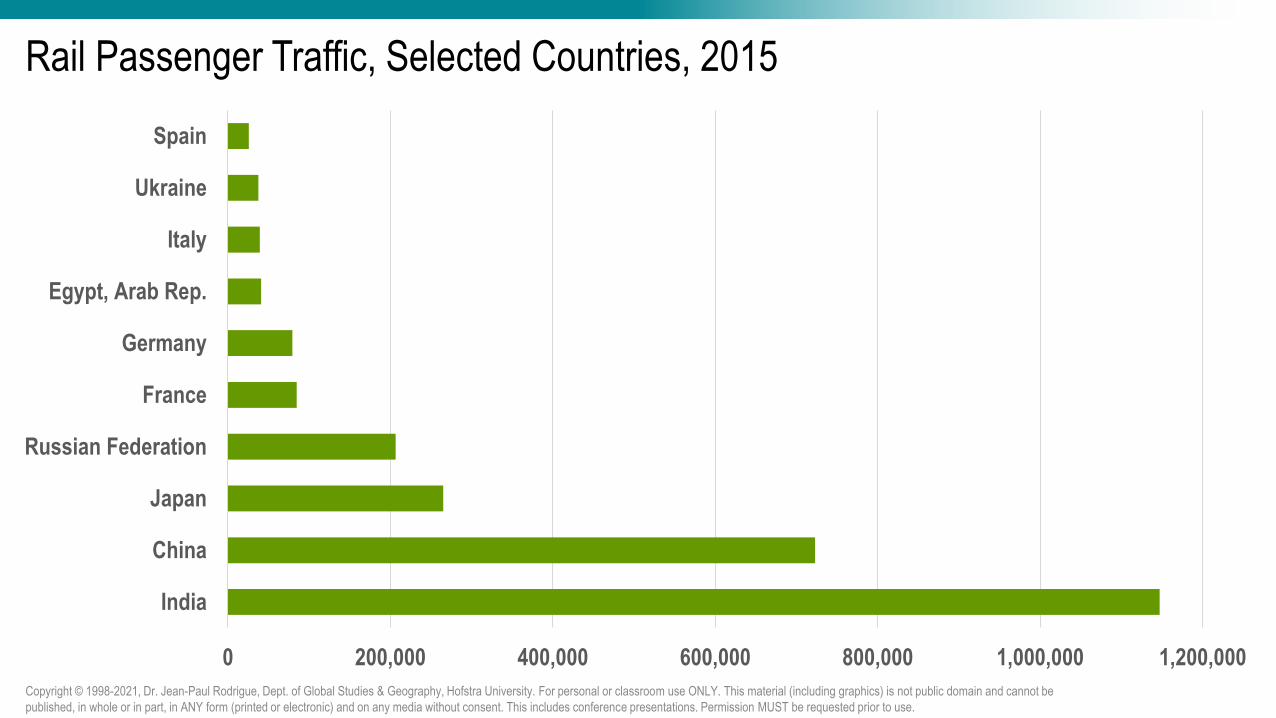
Rail Passenger Traffic, Selected Countries, 2015
0 200,000 400,000 600,000 800,000 1,000,000 1,200,000
India
China
Japan
Russian Federation
France
Germany
Egypt, Arab Rep.
Italy
Ukraine
Spain
Copyright © 1998-2021, Dr. Jean-Paul Rodrigue, Dept. of Global Studies & Geography, Hofstra University. For personal or classroom use ONLY. This material (including graphics) is not public domain and cannot be published, in whole or in part, in ANY form (printed or electronic) and on any media without consent. This includes conference presentations. Permission MUST be requested prior to use.
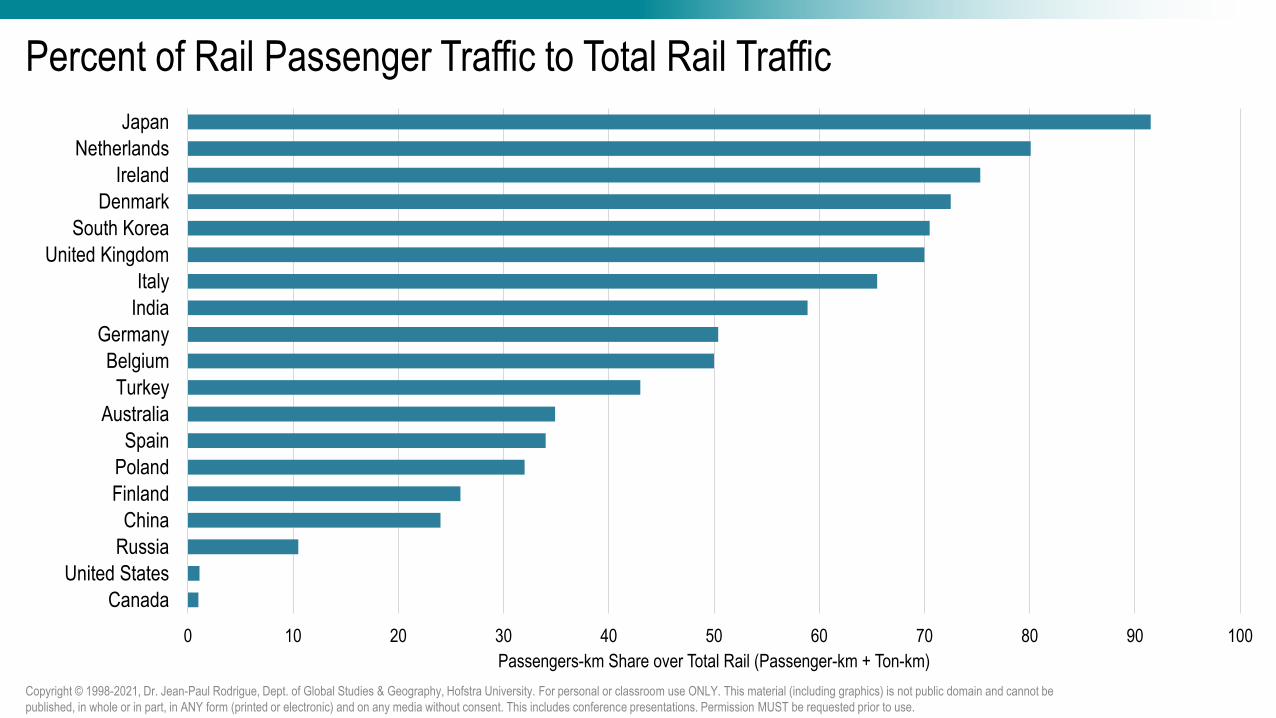
Percent of Rail Passenger Traffic to Total Rail Traffic
0 10 20 30 40 50 60 70 80 90 100
Canada
United States
Russia
China
Finland
Poland
Spain
Australia
Turkey
Belgium
Germany
India
Italy
United Kingdom
South Korea
Denmark
Ireland
Netherlands
Japan
Passengers-km Share over Total Rail (Passenger-km + Ton-km)
Copyright © 1998-2021, Dr. Jean-Paul Rodrigue, Dept. of Global Studies & Geography, Hofstra University. For personal or classroom use ONLY. This material (including graphics) is not public domain and cannot be published, in whole or in part, in ANY form (printed or electronic) and on any media without consent. This includes conference presentations. Permission MUST be requested prior to use.

Passenger Journeys on the British Rail Network, 1921-2007 (millions)
600
700
800
900
1000
1100
1200
1300
140019
21
1924
1927
1930
1933
1936
1939
1942
1945
1948
1951
1954
1957
1960
1963
1966
1969
1972
1975
1978
1981
1984
1987
1990
1993
1996
1999
2002
2005
Copyright © 1998-2021, Dr. Jean-Paul Rodrigue, Dept. of Global Studies & Geography, Hofstra University. For personal or classroom use ONLY. This material (including graphics) is not public domain and cannot be published, in whole or in part, in ANY form (printed or electronic) and on any media without consent. This includes conference presentations. Permission MUST be requested prior to use.

Spatial Performance of Rail and Road Transportation
2
4
6
8
10
12
14
0
50,000
100,000
150,000
200,000
250,000
300,000
350,000
Rail Road
Spa
tial P
erfo
rman
ce
Sur
face
and
Cap
acity
Surface used (m2/km)
Capacity (ton-km/day)
Spatial Performance (ton-km/m2/day)
Copyright © 1998-2021, Dr. Jean-Paul Rodrigue, Dept. of Global Studies & Geography, Hofstra University. For personal or classroom use ONLY. This material (including graphics) is not public domain and cannot be published, in whole or in part, in ANY form (printed or electronic) and on any media without consent. This includes conference presentations. Permission MUST be requested prior to use.

Major Segments of the Rail Freight Market
Segment Description Commodities Share of volume
Single Wagon Customer using a few wagonsChemicals, Vehicles and Machinery
50 %
Full / Block TrainCustomer has enough goods to fill a train
Coal and Steel, Construction materials
35 %
IntermodalTransportation by container: the container or trailer is lifted on the wagon
Finished goods, Containerized goods
15 %
Copyright © 1998-2021, Dr. Jean-Paul Rodrigue, Dept. of Global Studies & Geography, Hofstra University. For personal or classroom use ONLY. This material (including graphics) is not public domain and cannot be published, in whole or in part, in ANY form (printed or electronic) and on any media without consent. This includes conference presentations. Permission MUST be requested prior to use.

Operating Revenue of Major North American Railroads, 2007 (million U.S. dollars)
0 2,000 4,000 6,000 8,000 10,000 12,000 14,000 16,000
UP
BNSF
NS
CSX
CN
CP
KCS
FXE
KCSM
Copyright © 1998-2021, Dr. Jean-Paul Rodrigue, Dept. of Global Studies & Geography, Hofstra University. For personal or classroom use ONLY. This material (including graphics) is not public domain and cannot be published, in whole or in part, in ANY form (printed or electronic) and on any media without consent. This includes conference presentations. Permission MUST be requested prior to use.

Capital Expenditures as % of Revenue
0 2 4 6 8 10 12 14 16 18 20
Food
Transportation equipment
Petroleum and coal products
Wood products
Fabricated metal products
Average (manufacturing)
Chemicals
Paper
Non-metallic minerals
Electric utilities
Class I Rail
Copyright © 1998-2021, Dr. Jean-Paul Rodrigue, Dept. of Global Studies & Geography, Hofstra University. For personal or classroom use ONLY. This material (including graphics) is not public domain and cannot be published, in whole or in part, in ANY form (printed or electronic) and on any media without consent. This includes conference presentations. Permission MUST be requested prior to use.

Rail Track Mileage and Number of Class I Rail Carriers, United States, 1830-2017
0
20
40
60
80
100
120
140
160
180
200
0
25,000
50,000
75,000
100,000
125,000
150,000
175,000
200,000
225,000
250,000
275,000
1830 1850 1870 1890 1910 1930 1950 1970 1990 2010
Num
ber
of C
lass
I R
ail C
arrie
rs
Mile
s of
Roa
ds O
wne
d
Rand McNally (1897) ICC AAR/BTS (Class I Only) Class I Rail Carriers
Copyright © 1998-2021, Dr. Jean-Paul Rodrigue, Dept. of Global Studies & Geography, Hofstra University. For personal or classroom use ONLY. This material (including graphics) is not public domain and cannot be published, in whole or in part, in ANY form (printed or electronic) and on any media without consent. This includes conference presentations. Permission MUST be requested prior to use.

Commodity Carried by Class I American Railways, 2016
Coal, 491.7
Grain, 149.4
Lumber & wood, 24.5Pulp & paper,
31.3
Chemicals, 174.4
Primary metals, 41.3
Stone, sand & gravel, 129.1
Motor vehicles, 22.3
Misc. shipments, 118.9
Crude oil, 20.6
Petroleum products, 54.6
Waste & scrap, 39.6
Food, 98.8
Other, 157.1
Tons (millions)
Coal, 9.1
Grain, 5.6
Lumber & wood, 1.9
Pulp & paper, 2.2
Chemicals, 9.9
Primary metals, 2.1
Stone, sand & gravel, 2.4
Motor vehicles,
5.5
Misc. shipments, 8.8
Crude oil, 1.1
Petroleum products, 2.7
Waste & scrap, 1.2
Food, 5.6
Other, 7.2
Revenue ($ billions)
Copyright © 1998-2021, Dr. Jean-Paul Rodrigue, Dept. of Global Studies & Geography, Hofstra University. For personal or classroom use ONLY. This material (including graphics) is not public domain and cannot be published, in whole or in part, in ANY form (printed or electronic) and on any media without consent. This includes conference presentations. Permission MUST be requested prior to use.

Canadian Crude Oil Exports by Rail, 2012-2020 (in barrels per day)
0
50,000
100,000
150,000
200,000
250,000
300,000
350,000
400,000
450,000
Copyright © 1998-2021, Dr. Jean-Paul Rodrigue, Dept. of Global Studies & Geography, Hofstra University. For personal or classroom use ONLY. This material (including graphics) is not public domain and cannot be published, in whole or in part, in ANY form (printed or electronic) and on any media without consent. This includes conference presentations. Permission MUST be requested prior to use.

The North American Intermodal Rail Transport System
Copyright © 1998-2021, Dr. Jean-Paul Rodrigue, Dept. of Global Studies & Geography, Hofstra University. For personal or classroom use ONLY. This material (including graphics) is not public domain and cannot be published, in whole or in part, in ANY form (printed or electronic) and on any media without consent. This includes conference presentations. Permission MUST be requested prior to use.

Ownership of Major North American Rail Lines, 2017
Copyright © 1998-2021, Dr. Jean-Paul Rodrigue, Dept. of Global Studies & Geography, Hofstra University. For personal or classroom use ONLY. This material (including graphics) is not public domain and cannot be published, in whole or in part, in ANY form (printed or electronic) and on any media without consent. This includes conference presentations. Permission MUST be requested prior to use.

Market Share of US Intermodal Rail, 2006
43.9
41.8
20.5
25.9
14.1
9.4
15.6
17.1
3.4
3.5
0% 10% 20% 30% 40% 50% 60% 70% 80% 90% 100%
Domestic
International
BNSF Union Pacific CSX Norfolk Southern CN Others
Copyright © 1998-2021, Dr. Jean-Paul Rodrigue, Dept. of Global Studies & Geography, Hofstra University. For personal or classroom use ONLY. This material (including graphics) is not public domain and cannot be published, in whole or in part, in ANY form (printed or electronic) and on any media without consent. This includes conference presentations. Permission MUST be requested prior to use.

Major North American Rail Corridors Improved since 2000
Copyright © 1998-2021, Dr. Jean-Paul Rodrigue, Dept. of Global Studies & Geography, Hofstra University. For personal or classroom use ONLY. This material (including graphics) is not public domain and cannot be published, in whole or in part, in ANY form (printed or electronic) and on any media without consent. This includes conference presentations. Permission MUST be requested prior to use.

Average Speed of Class I Railroads, 1945-2015
15
20
25
30
35
40
45
1945 1955 1965 1975 1985 1995 2005 2015
Kilo
met
ers
per
hour
Copyright © 1998-2021, Dr. Jean-Paul Rodrigue, Dept. of Global Studies & Geography, Hofstra University. For personal or classroom use ONLY. This material (including graphics) is not public domain and cannot be published, in whole or in part, in ANY form (printed or electronic) and on any media without consent. This includes conference presentations. Permission MUST be requested prior to use.

Rail Freight Volumes Transported in the United States, 1960-2015
0
0.2
0.4
0.6
0.8
1
1.2
0
200,000
400,000
600,000
800,000
1,000,000
1,200,000
1,400,000
1,600,000
1,800,000
2,000,000
19601965197019751980198519901991199219931994199519961997199819992000200120022003200420052006200720082009201020112012201320142015
Ton-miles
Copyright © 1998-2021, Dr. Jean-Paul Rodrigue, Dept. of Global Studies & Geography, Hofstra University. For personal or classroom use ONLY. This material (including graphics) is not public domain and cannot be published, in whole or in part, in ANY form (printed or electronic) and on any media without consent. This includes conference presentations. Permission MUST be requested prior to use.

Rail Volume and Fuel Consumption, United States, 1980-2008 (1980=100)
0
50
100
150
200
250
1980 1981 1982 1983 1984 1985 1986 1987 1988 1989 1990 1991 1992 1993 1994 1995 1996 1997 1998 1999 2000 2001 2002 2003 2004 2005 2006 2007 2008
Rail volume Rail fuel consumption
Copyright © 1998-2021, Dr. Jean-Paul Rodrigue, Dept. of Global Studies & Geography, Hofstra University. For personal or classroom use ONLY. This material (including graphics) is not public domain and cannot be published, in whole or in part, in ANY form (printed or electronic) and on any media without consent. This includes conference presentations. Permission MUST be requested prior to use.

American Intermodal Rail Traffic, 1988-2016
0
2
4
6
8
10
12
1419
88
1989
1990
1991
1992
1993
1994
1995
1996
1997
1998
1999
2000
2001
2002
2003
2004
2005
2006
2007
2008
2009
2010
2011
2012
2013
2014
2015
2016
2017
Mill
ions
Containers (COFC) Trailers (TOFC)
Copyright © 1998-2021, Dr. Jean-Paul Rodrigue, Dept. of Global Studies & Geography, Hofstra University. For personal or classroom use ONLY. This material (including graphics) is not public domain and cannot be published, in whole or in part, in ANY form (printed or electronic) and on any media without consent. This includes conference presentations. Permission MUST be requested prior to use.

Composition of the North American Intermodal Rail Fleet
0%
10%
20%
30%
40%
50%
60%
70%
80%
90%
100%
1981 1986 1991 1996 2001
Single-stack all-purpose
Single-stack (COFC)
Single-stack (TOFC)
Double-stack (COFC)
Copyright © 1998-2021, Dr. Jean-Paul Rodrigue, Dept. of Global Studies & Geography, Hofstra University. For personal or classroom use ONLY. This material (including graphics) is not public domain and cannot be published, in whole or in part, in ANY form (printed or electronic) and on any media without consent. This includes conference presentations. Permission MUST be requested prior to use.

Composition of the TTX Railcar Fleet, 2013
35.5%
6.8%29.8%
11.0%
3.7%
5.4%
4.7%
1.8% 1.3%
Double-stack
Conventional Intermodal
Automotive
Boxcars
Centerbeam
Bulkhead
Chain Tie-down
Gondolas
All-other
Copyright © 1998-2021, Dr. Jean-Paul Rodrigue, Dept. of Global Studies & Geography, Hofstra University. For personal or classroom use ONLY. This material (including graphics) is not public domain and cannot be published, in whole or in part, in ANY form (printed or electronic) and on any media without consent. This includes conference presentations. Permission MUST be requested prior to use.

Canadian Intermodal Rail Traffic, 1970-2016
0
0.5
1
1.5
2
2.5
3
3.5
0
5
10
15
20
25
30
3519
70
1980
1984
1985
1986
1987
1988
1989
1990
1991
1992
1993
1994
1995
1996
1997
1998
1999
2000
2001
2002
2003
2004
2005
2006
2007
2008
2009
2010
2011
2012
2013
2014
2015
2016
Mill
ions
of U
nits
Mill
ions
of T
ons
COFC TOFC COFC TOFC
Copyright © 1998-2021, Dr. Jean-Paul Rodrigue, Dept. of Global Studies & Geography, Hofstra University. For personal or classroom use ONLY. This material (including graphics) is not public domain and cannot be published, in whole or in part, in ANY form (printed or electronic) and on any media without consent. This includes conference presentations. Permission MUST be requested prior to use.

Average Freight Train Length, United States
0
20
40
60
80
100
120
140
160
180
Auto Bulk General Merchandise IntermodalEastern Railroads (CSX, NS) Western Railroads (BNSF, UP)
Copyright © 1998-2021, Dr. Jean-Paul Rodrigue, Dept. of Global Studies & Geography, Hofstra University. For personal or classroom use ONLY. This material (including graphics) is not public domain and cannot be published, in whole or in part, in ANY form (printed or electronic) and on any media without consent. This includes conference presentations. Permission MUST be requested prior to use.

Types and Functions of Rail Freight Corridors
Copyright © 1998-2021, Dr. Jean-Paul Rodrigue, Dept. of Global Studies & Geography, Hofstra University. For personal or classroom use ONLY. This material (including graphics) is not public domain and cannot be published, in whole or in part, in ANY form (printed or electronic) and on any media without consent. This includes conference presentations. Permission MUST be requested prior to use.
Type
Short distance (within a
gateway / hub)
Hinterland access (between a
gateway and its market area)
Landbridge (between
gateways)
Circum-hemispheric
(between gateways with a
maritime segment)
Function Example
Modal shift, improved
capacity and throughput
Expand market area, reduce
distribution costs &
congestion
Long distance container
flows, continuity of global
commodity chains
Integrated global transport
chains
Switch carrying; Alameda
Corridor; Panama Canal
Railway
Rail shuttles; Satellite
terminals; Inland ports
North American landbridge;
Eurasian landbridge
“Belt and Road Initiative”

Under Construction
Copyright © 1998-2021, Dr. Jean-Paul Rodrigue, Dept. of Global Studies & Geography, Hofstra University. For personal or classroom use ONLY. This material (including graphics) is not public domain and cannot be published, in whole or in part, in ANY form (printed or electronic) and on any media without consent. This includes conference presentations. Permission MUST be requested prior to use.

The Alameda Rail Corridor
Copyright © 1998-2021, Dr. Jean-Paul Rodrigue, Dept. of Global Studies & Geography, Hofstra University. For personal or classroom use ONLY. This material (including graphics) is not public domain and cannot be published, in whole or in part, in ANY form (printed or electronic) and on any media without consent. This includes conference presentations. Permission MUST be requested prior to use.

Number of Trains Running Through the Alameda Corridor per Year and Containers Handled by the San Pedro Bay Port Cluster, 2002-2018
10,2
59
14,5
58
15,9
72
17,3
06 19,9
24
17,8
37
16,1
05
13,0
48
14,1
77
15,1
96
15,3
32
16,4
84
17,0
61
13,9
88
12,5
82
13,4
36
13,8
89
0
2
4
6
8
10
12
14
16
18
0
5,000
10,000
15,000
20,000
25,000
2002 2003 2004 2005 2006 2007 2008 2009 2010 2011 2012 2013 2014 2015 2016 2017 2018
San
Ped
ro B
ay P
orts
(T
EU
)
Mill
ions
Trai
ns p
er Y
ear
Trains per Year San Pedro Bay Ports (TEU)
Copyright © 1998-2021, Dr. Jean-Paul Rodrigue, Dept. of Global Studies & Geography, Hofstra University. For personal or classroom use ONLY. This material (including graphics) is not public domain and cannot be published, in whole or in part, in ANY form (printed or electronic) and on any media without consent. This includes conference presentations. Permission MUST be requested prior to use.

San Pedro Bay Port Container Distribution
51.4%
20.4%
8.5%
11.3%
8.5%
Truck to/from DC (regional)
Direct to rail (national)
Truck to/from near dock (national)
Truck to/from off dock (national)
Truck to/from DC then to rail (national)
Copyright © 1998-2021, Dr. Jean-Paul Rodrigue, Dept. of Global Studies & Geography, Hofstra University. For personal or classroom use ONLY. This material (including graphics) is not public domain and cannot be published, in whole or in part, in ANY form (printed or electronic) and on any media without consent. This includes conference presentations. Permission MUST be requested prior to use.

Development of High-Speed Train Traffic, Largest Markets,1964-2017
0
100
200
300
400
500
600
700
800
900
Bill
ions
of P
asse
nger
-km
s
China
Spain
Italy
Germany
Korea
France
Japan
Copyright © 1998-2021, Dr. Jean-Paul Rodrigue, Dept. of Global Studies & Geography, Hofstra University. For personal or classroom use ONLY. This material (including graphics) is not public domain and cannot be published, in whole or in part, in ANY form (printed or electronic) and on any media without consent. This includes conference presentations. Permission MUST be requested prior to use.

Restructuring Effects of High-Speed Rail
Copyright © 1998-2021, Dr. Jean-Paul Rodrigue, Dept. of Global Studies & Geography, Hofstra University. For personal or classroom use ONLY. This material (including graphics) is not public domain and cannot be published, in whole or in part, in ANY form (printed or electronic) and on any media without consent. This includes conference presentations. Permission MUST be requested prior to use.
Intercity lineRail station
High speed rail lineHigh speed rail station
Closed intercity lineClosed rail station
A
B

Comparison Between European, North American and Pacific Asian Railways
Issue Europe North America Pacific Asia
OrganisationSeparation of infrastructure from operations (for accountancy purposes)
Separation by region (markets)(private companies and concessions of vertically integrated companies)
Infrastructure and operations publicly owned
Market focus Passenger oriented Freight oriented Passenger oriented
Ownership
Infrastructure mainly publicly owned with a few exceptions (e.g. UK). Freight equipment and terminals increasingly privately owned and operated.
Private Public
Distances Short to medium Medium to long Short to long
Copyright © 1998-2021, Dr. Jean-Paul Rodrigue, Dept. of Global Studies & Geography, Hofstra University. For personal or classroom use ONLY. This material (including graphics) is not public domain and cannot be published, in whole or in part, in ANY form (printed or electronic) and on any media without consent. This includes conference presentations. Permission MUST be requested prior to use.

European Union United StatesOwnership of rail infrastructure
Close to 90% state owned Entirely private
Technical characteristics
Low axle load (standard 22,5t), electric traction limiting height of loads, differences among EU countries (loading gauge, track gauge, power supply standards)
High axle load (standard 36t), no electric traction, max. axle weight 31,8t, national railroad infrastructure standards (USA and Canada)
Capacity 400-750 meter in length, single stack, 80-120 TEU or 40-60 semitrailers
1300-3000m in length, double-stack, 250-600 TEU or 120-280 semitrailers
Operators 10 large operators 6 large class I operators
Competition Strong competition limited by informal national and political regulations
Semi oligopolistic competition according to regions
Operations Dense network with numerous long and short-distance corridors. Average intermodal train distance ca. 500km. Sea containers and short-sea containers distribution in rail shuttle.
Large network with main long-distance corridors from gatewayports.Average intermodal train distance 1000-1200km (US West) and 2500-3500km (US East).Sea containers distribution in port-hinterland trains.After transloading to domestic containers and semitrailers distribution in port-hinterland trains.Domestic containers and semitrailers in mostly in West- East directions.
Copyright © 1998-2021, Dr. Jean-Paul Rodrigue, Dept. of Global Studies & Geography, Hofstra University. For personal or classroom use ONLY. This material (including graphics) is not public domain and cannot be published, in whole or in part, in ANY form (printed or electronic) and on any media without consent. This includes conference presentations. Permission MUST be requested prior to use.

Main Advantages of Railway Infrastructure Investment
Group Benefit Description
Public sector Lower highway congestion and maintenance
Potential substitution effect. Each intermodal train can take 280 trucks off the roadways, while each bulk and merchandise train can remove up to 500 trucks. Every passenger train displaces hundreds of automobiles.
Improved safety and security Freight railroads are safer than trucks. Railroads have one-fourth the rate of fatalities of trucks for intercity transportation, on a per ton-mile basis.
Economic growth Economies of scale provide long distance transport services at a lower cost.
Environment On average, railroads are three or more times more fuel efficient than trucks.
Shippers Lower transit times Reduced transit times lower shippers’ costs by lowering the inventory carrying costs of the transported goods.
Lower logistics costs Due to economies of scale, freight rail can provide long-haul transportation services at a lower rate than trucks.
Improved reliability Expanded rail capacity lowers the variability in transit time by reducing the uncertainty created from delays. Improved transportation on-time performance lowers manufacturing costs, both from reducing stock-outs and shut-downs, and from the ability to safely maintain lower inventory levels.
Rail operators Increased ridership or traffic Expanding freight capacity can increase the revenue of the freight railroads through increased business opportunities.
Improved reliability Expanded rail capacity lowers the variability in transit time by reducing the uncertainty created from delays.
Copyright © 1998-2021, Dr. Jean-Paul Rodrigue, Dept. of Global Studies & Geography, Hofstra University. For personal or classroom use ONLY. This material (including graphics) is not public domain and cannot be published, in whole or in part, in ANY form (printed or electronic) and on any media without consent. This includes conference presentations. Permission MUST be requested prior to use.

Major Oil Pipelines
Copyright © 1998-2021, Dr. Jean-Paul Rodrigue, Dept. of Global Studies & Geography, Hofstra University. For personal or classroom use ONLY. This material (including graphics) is not public domain and cannot be published, in whole or in part, in ANY form (printed or electronic) and on any media without consent. This includes conference presentations. Permission MUST be requested prior to use.

Oil and Gas Pipelines Mileage in the United States, 1960-2017
0
200,000
400,000
600,000
800,000
1,000,000
1,200,000
1,400,000
1,600,000
1,800,000
1960 1970 1980 1990 1992 1994 1996 1998 2000 2002 2004 2006 2008 2010 2012 2014 2016
Oil pipeline Gas pipeline
Copyright © 1998-2021, Dr. Jean-Paul Rodrigue, Dept. of Global Studies & Geography, Hofstra University. For personal or classroom use ONLY. This material (including graphics) is not public domain and cannot be published, in whole or in part, in ANY form (printed or electronic) and on any media without consent. This includes conference presentations. Permission MUST be requested prior to use.

Copyright © 1998-2021, Dr. Jean-Paul Rodrigue, Dept. of Global Studies & Geography, Hofstra University. For personal or classroom use ONLY. This material (including graphics) is not public domain and cannot be published, in whole or in part, in ANY form (printed or electronic) and on any media without consent. This includes conference presentations. Permission MUST be requested prior to use.

Maritime Transport
Copyright © 1998-2021, Dr. Jean-Paul Rodrigue, Dept. of Global Studies & Geography, Hofstra University. For personal or classroom use ONLY. This material (including graphics) is not public domain and cannot be published, in whole or in part, in ANY form (printed or electronic) and on any media without consent. This includes conference presentations. Permission MUST be requested prior to use.

International Seaborne Trade and Exports of Goods, 1955-2019
0.0
0.5
1.0
1.5
2.0
2.5
0
1
2
3
4
5
6
7
8
9
10
11
12
13
14
15
16
17
18
19
20
Sea
born
e Tr
ade
& E
xpor
ts o
f Goo
ds
Seaborne Trade (billions of tons of goods loaded) - Left Axis
Exports of Goods (trillions at current $US) - Left Axis
Ratio Exports / Seaborne Trade - Right Axis
Copyright © 1998-2021, Dr. Jean-Paul Rodrigue, Dept. of Global Studies & Geography, Hofstra University. For personal or classroom use ONLY. This material (including graphics) is not public domain and cannot be published, in whole or in part, in ANY form (printed or electronic) and on any media without consent. This includes conference presentations. Permission MUST be requested prior to use.
© GTS

Selected Changes in Maritime Shipping, 1980-2017
0
0.5
1
1.5
2
2.5
3
3.5
1980 1985 1990 1995 2000 2005 2010 2015 2020
Container / General cargo
Foreign / National flag
Dry / Liquid cargo
Transportation / Inventory
Ratios
Copyright © 1998-2021, Dr. Jean-Paul Rodrigue, Dept. of Global Studies & Geography, Hofstra University. For personal or classroom use ONLY. This material (including graphics) is not public domain and cannot be published, in whole or in part, in ANY form (printed or electronic) and on any media without consent. This includes conference presentations. Permission MUST be requested prior to use.

Domains of Maritime Circulation
Copyright © 1998-2021, Dr. Jean-Paul Rodrigue, Dept. of Global Studies & Geography, Hofstra University. For personal or classroom use ONLY. This material (including graphics) is not public domain and cannot be published, in whole or in part, in ANY form (printed or electronic) and on any media without consent. This includes conference presentations. Permission MUST be requested prior to use.

Main Maritime Shipping Routes and Chokepoints
Copyright © 1998-2021, Dr. Jean-Paul Rodrigue, Dept. of Global Studies & Geography, Hofstra University. For personal or classroom use ONLY. This material (including graphics) is not public domain and cannot be published, in whole or in part, in ANY form (printed or electronic) and on any media without consent. This includes conference presentations. Permission MUST be requested prior to use.

The Scales of Analysis of Maritime Transportation
Copyright © 1998-2021, Dr. Jean-Paul Rodrigue, Dept. of Global Studies & Geography, Hofstra University. For personal or classroom use ONLY. This material (including graphics) is not public domain and cannot be published, in whole or in part, in ANY form (printed or electronic) and on any media without consent. This includes conference presentations. Permission MUST be requested prior to use.
Global Maritime Transport System
Deep Sea Services
Maritime Range
Short Sea / Feeder Services
Port Cluster / Region / Hinterland
Port
Terminal
Global
Regional
Local

Container Traffic per Maritime Range, 1980-2015
0
100
200
300
400
500
600
700
1990 1995 2000 2005 2010 2015
Mill
ions
of T
EU
s
Container Traffic by Range
0%
10%
20%
30%
40%
50%
60%
70%
80%
90%
100%
1990 1995 2000 2005 2010 2015
Share of Container Traffic by Range
Other
7. Caribbean Basin
21. South Asia
5. ECNA
26. Japan
14. West Mediterranean
6. WCNA
21. Middle East
13. Northern Europe
23. Yellow Sea
24. Central China
22. Southeast Asia
25. Southern China / Taiwan
Copyright © 1998-2021, Dr. Jean-Paul Rodrigue, Dept. of Global Studies & Geography, Hofstra University. For personal or classroom use ONLY. This material (including graphics) is not public domain and cannot be published, in whole or in part, in ANY form (printed or electronic) and on any media without consent. This includes conference presentations. Permission MUST be requested prior to use.

Container Traffic per Maritime Range, 1980-2015
0
100
200
300
400
500
600
700
1990 1995 2000 2005 2010 2015
Mill
ions
of T
EU
s
Container Traffic
0%
10%
20%
30%
40%
50%
60%
70%
80%
90%
100%
1990-951995-002000-052005-102010-15
Absolute Growth by 5 Year Period
Other
8. Caribbean Basin
22. South Asia
5. ECNA
27. Japan
15. West Mediterranean
6. WCNA
21. Middle East
14. Northern Europe
24. Yellow Sea
25. Central China
23. Southeast Asia
26. Southern China / Taiwan
Copyright © 1998-2021, Dr. Jean-Paul Rodrigue, Dept. of Global Studies & Geography, Hofstra University. For personal or classroom use ONLY. This material (including graphics) is not public domain and cannot be published, in whole or in part, in ANY form (printed or electronic) and on any media without consent. This includes conference presentations. Permission MUST be requested prior to use.

Container Port Rank / Size Distribution by Major Maritime Range, 2015
0%
10%
20%
30%
40%
50%
26. Southern China / Taiwan
0%
10%
20%
30%
40%
50%
23. Southeast Asia
0%
10%
20%
30%
40%
50%
25. Central China
0%
10%
20%
30%
40%
50%
24. Yellow Sea
0%
10%
20%
30%
40%
50%
14. Northern Europe
0%
10%
20%
30%
40%
50%
21. Middle East
0%
10%
20%
30%
40%
50%
6. North American West Coast
0%
10%
20%
30%
40%
50%
15. West Mediterranean
0%
10%
20%
30%
40%
50%
5. North American East Coast
N=15
97.9 M TEU
G=0.57
N=25
90.1 M TEU
G=0.65
N=11
70.6 M TEU
G=0.73
N=15
82.1 M TEU
G=0.57
N=8
40.9 M TEU
G=0.48
N=16
35.9 M TEU
G=0.64
N=11
29.5 M TEU
G=0.38
N=19
26.3 M TEU
G=0.53
N=22
27.1 M TEU
G=0.52
Copyright © 1998-2021, Dr. Jean-Paul Rodrigue, Dept. of Global Studies & Geography, Hofstra University. For personal or classroom use ONLY. This material (including graphics) is not public domain and cannot be published, in whole or in part, in ANY form (printed or electronic) and on any media without consent. This includes conference presentations. Permission MUST be requested prior to use.

Types of Maritime Routes
Copyright © 1998-2021, Dr. Jean-Paul Rodrigue, Dept. of Global Studies & Geography, Hofstra University. For personal or classroom use ONLY. This material (including graphics) is not public domain and cannot be published, in whole or in part, in ANY form (printed or electronic) and on any media without consent. This includes conference presentations. Permission MUST be requested prior to use.
• Point to point services.• Empty backhauls.• Common for bulk freight
shipping.
• Sequential shipping services between two maritime ranges (seaboards).• Balancing the number of port calls
and the frequency of services.• Can rely on transshipment hubs
between ranges.
• Servicing a sequence of ports along several ranges.• Pendulum services.• Round-the-world services.• Small number of ports per range
are serviced.• Transshipment hubs connecting
with regional services.
Port-to-Port Inter-Range Multi-Ranges
RTW
Pendulum

Length of the Major Inland Waterway Systems, 2000
0 20,000 40,000 60,000 80,000 100,000 120,000 140,000
Russia
China
United States
Western Europe
KM
Less than 2.75 m
More than 2.75 m
Copyright © 1998-2021, Dr. Jean-Paul Rodrigue, Dept. of Global Studies & Geography, Hofstra University. For personal or classroom use ONLY. This material (including graphics) is not public domain and cannot be published, in whole or in part, in ANY form (printed or electronic) and on any media without consent. This includes conference presentations. Permission MUST be requested prior to use.

Length of the Major Inland Waterway Systems
0 20,000 40,000 60,000 80,000 100,000 120,000 140,000
China
Russia
European Union
Brazil
United States
Indonesia
Colombia
Vietnam
Copyright © 1998-2021, Dr. Jean-Paul Rodrigue, Dept. of Global Studies & Geography, Hofstra University. For personal or classroom use ONLY. This material (including graphics) is not public domain and cannot be published, in whole or in part, in ANY form (printed or electronic) and on any media without consent. This includes conference presentations. Permission MUST be requested prior to use.

Largest Ships by Category
Copyright © 1998-2021, Dr. Jean-Paul Rodrigue, Dept. of Global Studies & Geography, Hofstra University. For personal or classroom use ONLY. This material (including graphics) is not public domain and cannot be published, in whole or in part, in ANY form (printed or electronic) and on any media without consent. This includes conference presentations. Permission MUST be requested prior to use.
Containership
MSC Oscar (2015) LOA: 394 mBeam: 59 mDraft: 16 mTEU: 19,224
Ultra Large
Crude Carrier
LOA: 380 mBeam: 68 mDraft: 24.5 mDWT: 442,000 t
TI Europe (2003)
MS Ore Brazil (2011)Bulk Carrier
LOA: 362 mBeam: 65 mDraft: 23 mDWT: 402,000 t
Cruise Ship
Oasis of the Seas (2009) LOA: 362 mBeam: 60.5 mDraft: 9.3 mPassengers: 5,400

Liner Shipping Services by Trade Route, 2012
86
69
52
49
43
41
32
30
29
23
22
19
10
0 10 20 30 40 50 60 70 80 90 100
Far East- Mid- East/South Asia
Far East- North America
Europe- Mid- East/ South Asia
West Africa
North Europe- Far East
Far East- Mediterranean
West Coast South America
Australasia
East Coast South America
South Africa
North Europe- North America
Mediterranean- North America
North America-Mid-East/South Asia
Copyright © 1998-2021, Dr. Jean-Paul Rodrigue, Dept. of Global Studies & Geography, Hofstra University. For personal or classroom use ONLY. This material (including graphics) is not public domain and cannot be published, in whole or in part, in ANY form (printed or electronic) and on any media without consent. This includes conference presentations. Permission MUST be requested prior to use.

Ton-miles Shipped by Maritime Transportation, 1970-2014 (in billions)
0
10,000
20,000
30,000
40,000
50,000
60,000
1970 1980 1985 1990 1995 1999 2000 2001 2002 2003 2004 2005 2006 2007 2008 2009 2010 2011 2012 2013 2014
Container
Other Dry Cargoes
Bauxite & Phosphate
Grain
Coal
Iron Ore
Gas
Oil
Copyright © 1998-2021, Dr. Jean-Paul Rodrigue, Dept. of Global Studies & Geography, Hofstra University. For personal or classroom use ONLY. This material (including graphics) is not public domain and cannot be published, in whole or in part, in ANY form (printed or electronic) and on any media without consent. This includes conference presentations. Permission MUST be requested prior to use.

World Seaborne Trade by Cargo Type, 1970-2018
0
10,000
20,000
30,000
40,000
50,000
60,000
70,000
1970 1980 1985 1990 1995 2000 2001 2002 2003 2004 2005 2006 2007 2008 2009 2010 2011 2012 2013 2014 2015 2016 2017 2018
Ton-
mile
s (b
illio
ns) Other
Major dry bulks
Container
Oil
Gas
Chemicals
Copyright © 1998-2021, Dr. Jean-Paul Rodrigue, Dept. of Global Studies & Geography, Hofstra University. For personal or classroom use ONLY. This material (including graphics) is not public domain and cannot be published, in whole or in part, in ANY form (printed or electronic) and on any media without consent. This includes conference presentations. Permission MUST be requested prior to use.

Registered World Fleet, 1914-2019
0
2000
4000
6000
8000
10000
12000
14000
16000
0
200,000
400,000
600,000
800,000
1,000,000
1,200,000
1,400,000
1,600,000
1910 1930 1950 1970 1990 2010
Number of ships
Total gross tonnage (1,000s)
Average tonnage
Copyright © 1998-2021, Dr. Jean-Paul Rodrigue, Dept. of Global Studies & Geography, Hofstra University. For personal or classroom use ONLY. This material (including graphics) is not public domain and cannot be published, in whole or in part, in ANY form (printed or electronic) and on any media without consent. This includes conference presentations. Permission MUST be requested prior to use.

Composition of the Global Fleet, 1980-2019 (Share of deadweight tons)
0%
10%
20%
30%
40%
50%
60%
70%
80%
90%
100%19
80
1981
1982
1983
1984
1985
1986
1987
1988
1989
1990
1991
1992
1993
1994
1995
1996
1997
1998
1999
2000
2001
2002
2003
2004
2005
2006
2007
2008
2009
2010
2011
2012
2013
2014
2015
2016
2017
2018
2019
Other Container Ship General Cargo Ship Dry Bulk Carrier Oil Tanker
Copyright © 1998-2021, Dr. Jean-Paul Rodrigue, Dept. of Global Studies & Geography, Hofstra University. For personal or classroom use ONLY. This material (including graphics) is not public domain and cannot be published, in whole or in part, in ANY form (printed or electronic) and on any media without consent. This includes conference presentations. Permission MUST be requested prior to use.

Changes in the World Container Fleet, 1990-2014
-1,500,000
-1,000,000
-500,000
0
500,000
1,000,000
1,500,000
2,000,000
2,500,000
3,000,000
3,500,000
0
5,000,000
10,000,000
15,000,000
20,000,000
25,000,000
30,000,000
35,000,000
40,000,000
1990 1991 1992 1993 1994 1995 1996 1997 1998 1999 2000 2001 2002 2003 2004 2005 2006 2007 2008 2009 2010 2011 2012 2013 2014
End-year fleet size Fleet addition Fleet replaced
Copyright © 1998-2021, Dr. Jean-Paul Rodrigue, Dept. of Global Studies & Geography, Hofstra University. For personal or classroom use ONLY. This material (including graphics) is not public domain and cannot be published, in whole or in part, in ANY form (printed or electronic) and on any media without consent. This includes conference presentations. Permission MUST be requested prior to use.

Flexibility and Specialization of Major Ship Designs
Copyright © 1998-2021, Dr. Jean-Paul Rodrigue, Dept. of Global Studies & Geography, Hofstra University. For personal or classroom use ONLY. This material (including graphics) is not public domain and cannot be published, in whole or in part, in ANY form (printed or electronic) and on any media without consent. This includes conference presentations. Permission MUST be requested prior to use.
Functional Openness
Co
mm
erci
al O
pen
nes
s
LNG/LPG
Crude Tanker
Cellular containership
Passenger ferry
Reefer ship
Bulk carrier
General cargo ship
Vehicle carrier
Product tanker
Chemical tanker
General ferry
RO-RO ship
Size variations
Extensive
Limited

Vessel Size Groups (in dead weight tons)
0 100,000 200,000 300,000 400,000 500,000
ULCC
VLCC
Suezmax
Aframax
ULOC
VLOC
Capesize
Panamax
Handymax
Handy
Crude Oil Tankers Dry Bulk Carriers
Copyright © 1998-2021, Dr. Jean-Paul Rodrigue, Dept. of Global Studies & Geography, Hofstra University. For personal or classroom use ONLY. This material (including graphics) is not public domain and cannot be published, in whole or in part, in ANY form (printed or electronic) and on any media without consent. This includes conference presentations. Permission MUST be requested prior to use.

Evolution of Containerships
Copyright © 1998-2021, Dr. Jean-Paul Rodrigue, Dept. of Global Studies & Geography, Hofstra University. For personal or classroom use ONLY. This material (including graphics) is not public domain and cannot be published, in whole or in part, in ANY form (printed or electronic) and on any media without consent. This includes conference presentations. Permission MUST be requested prior to use.
Early Containerships (1956-)
Panamax (1980-)
Post Panamax I (1988-)
New-Panamax (2014-)
Fully Cellular (1970-)
Panamax Max (1985-)
Post Panamax II (2000-)
500 – 800 TEU
1,000 – 2,500 TEU
3,000 – 3,400 TEU
3,400 – 4,500 TEU
4,000 – 6,000 TEU
6,000 – 8,500 TEU
12,500 TEU
200x20x9
137x17x9
215x20x10
250x32x12.5
(LOA – Beam – Draft)
19-20
10
6
6
9
17
5
9
15
6
8
5
613
10
8
64
Containers across
Containers high below deck
meters
Containers high on deck
4
5
4
300x40x13
290x32x12.5
340x43x14.5
366x49x15.2
17 bays
17 bays
20 bays
22 bays
A
B
C
D

Evolution of Containerships
Copyright © 1998-2021, Dr. Jean-Paul Rodrigue, Dept. of Global Studies & Geography, Hofstra University. For personal or classroom use ONLY. This material (including graphics) is not public domain and cannot be published, in whole or in part, in ANY form (printed or electronic) and on any media without consent. This includes conference presentations. Permission MUST be requested prior to use.
VLCS (2006-)
ULCS (2013-)
11,000 - 15,000 TEU
18,000 – 21,000 TEU
10
8
23
400x59x16
397x56x15.5
10
8
22
24 bays
MGX-24 (2019-)
21,000 – 25,000 TEU
10
8
24
24 bays
23 bays
400x61x16
E

The Largest Available Containership, 1970-2019 (in TEUs)
0
5,000
10,000
15,000
20,000
25,000
Shi
p S
ize
in T
EU
Copyright © 1998-2021, Dr. Jean-Paul Rodrigue, Dept. of Global Studies & Geography, Hofstra University. For personal or classroom use ONLY. This material (including graphics) is not public domain and cannot be published, in whole or in part, in ANY form (printed or electronic) and on any media without consent. This includes conference presentations. Permission MUST be requested prior to use.
L “Lica” Class(3,400 TEU) R “Regina” Class
(6,000 TEU)
S “Sovereign” Class(8,000 TEU)
E “Emma” Class(12,500 TEU)
“Triple E” Class(18,000 TEU)
C10 Class
(4,500 TEU)

Characteristics of Some Historical ContainershipsYear Name Capacity (TEU) Yard Length (m) Width (m) Draft (m) Speed (knots)
1956 Ideal X 58 US 174.2 23.6 8.0 18.0
1968 Elbe Express 730 B&V 171.0 24.5 7.9 20.0
1970 Sealand Navigator 2,361 247.6 27.5 11.1
1972 Liverpool Bay 2,961 B&V 248.6 32.3 13.0 23.0
1981 Frankfurt Express 3,430 HDW 271.0 32.3 11.5 23.0
1991 Hanover Express 4,407 Samsung 281.6 32.3 13.5 23.0
1995 APL China 4,832 HDW 262.0 40.0 12.0 24.6
1996 Regina Maersk 6,700 Odense 302.3 42.8 12.2 24.6
1998 Sovereign Maersk 8,200 Odense 332.0 42.8 14.5 24.7
2001 Hamburg Express 7,506 Hyundai 304.0 42.8 14.5 25.0
2003 OOCL Shenzhen 8,063 Samsung 319.0 42.8 14.5 25.2
2005 MSC Pamela 9,200 Samsung 321.0 45.6 15.0 25.0
2006 Emma Maersk 14,700 Odense 397.0 56.0 16.0 24.5
2009 MSC Beatrice 13,798 Samsung 366.1 51.2 15.0 25.2
2012 MSC Marco Polo 16,000 Daewoo 396.0 53.6 16.0 25.1
2013 Maersk Mc-Kinney Møller 18,270 Daewoo 399.0 59 14.5 23.0
2015 MSC Oscar 19.224 Daewoo 395.5 59 16.0 22.8
Copyright © 1998-2021, Dr. Jean-Paul Rodrigue, Dept. of Global Studies & Geography, Hofstra University. For personal or classroom use ONLY. This material (including graphics) is not public domain and cannot be published, in whole or in part, in ANY form (printed or electronic) and on any media without consent. This includes conference presentations. Permission MUST be requested prior to use.

Average Draft by Containership Capacity
4
6
8
10
12
14
16
181,
000
2,00
0
3,00
0
4,00
0
5,00
0
6,00
0
7,00
0
8,00
0
9,00
0
10,0
00
11,0
00
12,0
00
13,0
00
14,0
00
16,0
00
18,0
00
20,0
00
Dra
ft in
Met
ers
Ship Capacity in TEU
Copyright © 1998-2021, Dr. Jean-Paul Rodrigue, Dept. of Global Studies & Geography, Hofstra University. For personal or classroom use ONLY. This material (including graphics) is not public domain and cannot be published, in whole or in part, in ANY form (printed or electronic) and on any media without consent. This includes conference presentations. Permission MUST be requested prior to use.
Panamax
New Panamax
Suezmax

Average TEU per Port Call by Containership Size along a Maritime Range
0
2,000
4,000
6,000
8,000
10,000
12,000
0 2,000 4,000 6,000 8,000 10,000 12,000 14,000 16,000 18,000 20,000
TE
Us
per
Por
t Cal
l
Containership Capacity (TEUs)
Minimum Required
3 Calls
4 Calls
5 Calls
Copyright © 1998-2021, Dr. Jean-Paul Rodrigue, Dept. of Global Studies & Geography, Hofstra University. For personal or classroom use ONLY. This material (including graphics) is not public domain and cannot be published, in whole or in part, in ANY form (printed or electronic) and on any media without consent. This includes conference presentations. Permission MUST be requested prior to use.

World Merchant Fleet, Tonnage Registered per Ship Size, 1985-2000
0
100,000
200,000
300,000
400,000
500,000
600,000
1985 1990 1995 2000
Gro
ss T
ons Over 100,000
50,000- 99,999
20,000- 49,999
10,000- 19,999
4,000-9,999
500-3,999
100-499
Copyright © 1998-2021, Dr. Jean-Paul Rodrigue, Dept. of Global Studies & Geography, Hofstra University. For personal or classroom use ONLY. This material (including graphics) is not public domain and cannot be published, in whole or in part, in ANY form (printed or electronic) and on any media without consent. This includes conference presentations. Permission MUST be requested prior to use.

World Merchant Fleet, Tonnage Registered per Ship Size, 1970-2017
0
200,000
400,000
600,000
800,000
1,000,000
1,200,000
1,400,000
1970 1975 1980 1985 1990 1995 2000 2005 2010 2015 2017
Tons
(10
00s)
Small (GT<500) Medium (500<25,000GT) Large (25,000<60,000GT) Very Large (GT>60,000) Total
Copyright © 1998-2021, Dr. Jean-Paul Rodrigue, Dept. of Global Studies & Geography, Hofstra University. For personal or classroom use ONLY. This material (including graphics) is not public domain and cannot be published, in whole or in part, in ANY form (printed or electronic) and on any media without consent. This includes conference presentations. Permission MUST be requested prior to use.

Evolution of the World’s Containerized Carrying Capacity, 1980-2018
0
5
10
15
20
25
1980 1990 1996 2007 2010 2018
TE
Us
(Mill
ion)
Post-Panamax
Panamax
Other
Copyright © 1998-2021, Dr. Jean-Paul Rodrigue, Dept. of Global Studies & Geography, Hofstra University. For personal or classroom use ONLY. This material (including graphics) is not public domain and cannot be published, in whole or in part, in ANY form (printed or electronic) and on any media without consent. This includes conference presentations. Permission MUST be requested prior to use.

World Cellular Container Fleet, 2015-2018
0
100
200
300
400
500
600
700
800
900
0
500,000
1,000,000
1,500,000
2,000,000
2,500,000
3,000,000
3,500,000
4,000,000
4,500,000
Num
ber
of S
hips
Tota
l Cap
acity
TEU (2015) TEU (2018) Ships (2015) Ships (2018)
Copyright © 1998-2021, Dr. Jean-Paul Rodrigue, Dept. of Global Studies & Geography, Hofstra University. For personal or classroom use ONLY. This material (including graphics) is not public domain and cannot be published, in whole or in part, in ANY form (printed or electronic) and on any media without consent. This includes conference presentations. Permission MUST be requested prior to use.

Operating Costs of Panamax and Post-Panamax Containerships (in USD)
$0
$2
$4
$6
$8
$10
$12
$14
$16
Panamax (4,000 TEU) Post-Panamax (6,000 TEU) Post-Panamax Plus (10,000 TEU)
Mill
ions
Port charges
Fuel
Administration
Stores and lubes
Insurance
Repair and maintenance
Manning
Copyright © 1998-2021, Dr. Jean-Paul Rodrigue, Dept. of Global Studies & Geography, Hofstra University. For personal or classroom use ONLY. This material (including graphics) is not public domain and cannot be published, in whole or in part, in ANY form (printed or electronic) and on any media without consent. This includes conference presentations. Permission MUST be requested prior to use.

Tonnage by Country of Registry, 2013
0 50,000 100,000 150,000 200,000 250,000 300,000 350,000
Panama
Liberia
Marshall Islands
Hong Kong
Singapore
Greece
Malta
Bahamas
China
Cyprus
Thousands of DWT
Dry bulk Container Tanker General Cargo RO/RO
Copyright © 1998-2021, Dr. Jean-Paul Rodrigue, Dept. of Global Studies & Geography, Hofstra University. For personal or classroom use ONLY. This material (including graphics) is not public domain and cannot be published, in whole or in part, in ANY form (printed or electronic) and on any media without consent. This includes conference presentations. Permission MUST be requested prior to use.

Slow Steaming
Copyright © 1998-2021, Dr. Jean-Paul Rodrigue, Dept. of Global Studies & Geography, Hofstra University. For personal or classroom use ONLY. This material (including graphics) is not public domain and cannot be published, in whole or in part, in ANY form (printed or electronic) and on any media without consent. This includes conference presentations. Permission MUST be requested prior to use.

Share of Foreign-flagged Deadweight Tonnage, 1989-2017
25
30
35
40
45
50
55
60
65
70
75
1989 1991 1993 1995 1997 1999 2001 2003 2005 2007 2009 2011 2013 2015 2017
Copyright © 1998-2021, Dr. Jean-Paul Rodrigue, Dept. of Global Studies & Geography, Hofstra University. For personal or classroom use ONLY. This material (including graphics) is not public domain and cannot be published, in whole or in part, in ANY form (printed or electronic) and on any media without consent. This includes conference presentations. Permission MUST be requested prior to use.

Maritime Shipping Characteristics (to be updated)Tramping Liner Shipping
Transportation Demand
Number of shippers Few Many
Quantity Large Small
Density High (weight) Low (volume)
Unit value Low High
Regularity Low High
Transportation Supply
Contract Vessel Freight (bill of lading)
Vessels Liquid and bulk General cargo
Frequency Low High
Implications
Freight Liquid and main bulk commodities Minor bulk and general cargo (containerized)
Services Supply / demand regulation Prior to demand
Freight elasticity Low Low
Main markets Developing / developed countries Developed / developed countries
Share in Maritime Transport (2000)
Tons 70% 30%
Value 20% 80%
Copyright © 1998-2021, Dr. Jean-Paul Rodrigue, Dept. of Global Studies & Geography, Hofstra University. For personal or classroom use ONLY. This material (including graphics) is not public domain and cannot be published, in whole or in part, in ANY form (printed or electronic) and on any media without consent. This includes conference presentations. Permission MUST be requested prior to use.

Types of Maritime CargoCommodity type Examples Maritime Transshipment Inland distribution
Liquid
A) Normal pressure and temperature Crude oil, most oil products, wine, slurried coal Pump/pipe Pipeline
B) Other pressure and temperature Liquefied gases (LNG, LPG), heavy oils, latex, bitumen, vegetable oils
Pumps, temperature controlled pipelines Temperature controlled pipelines
Dry Bulk
A) Flowing Grain, sugar, powders (alumina, cement) Pneumatic / suction, conveyor, grabs Pipes, conveyors, barge, rail wagon, lorry
B) Irregular Coal, iron ores, non-ferrous ores, phosphate rock
Grab, conveyor Conveyor, barge, rail wagon, lorry
Neo Bulk Forest products, steel products, baled scrap Lift-on/lift-off, roll-on/roll-off Barge, rail wagon, lorry
Wheeled Units Cars, lorries, rail wagons Roll-on/roll-off Rail wagon, lorry
Refrigerated/chilled cargo Meat, fruit, dairy produce Lift-on/lift-off Rail wagon, lorry
Copyright © 1998-2021, Dr. Jean-Paul Rodrigue, Dept. of Global Studies & Geography, Hofstra University. For personal or classroom use ONLY. This material (including graphics) is not public domain and cannot be published, in whole or in part, in ANY form (printed or electronic) and on any media without consent. This includes conference presentations. Permission MUST be requested prior to use.

Types of Maritime Cargo
General CargoBreak Bulk
Bulk Cargo
Neo Bulk
Containerized
Liquid Bulk
Dry Bulk
Unitized Cargo
Loose Cargo
Drums, bags, pallets, boxes
Lumber, paper, steel, vehicles
Containers
Petroleum, LNG, chemicals, vegetal oils
Coal, iron ore, grains, bauxite, sand
35% of tonnage
40% of tonnage
13% of tonnage
7% of tonnage
5% of tonnage
Pumps and pipelines (1.1 to 1.3 days average port time)
Grabs / suction and conveyors (2.7 days average port time)
Lift-on/lift-off, roll-on/roll-off (1.0 day average port time)
Lift-on/lift-off (1.0 day average port time)
Lift-on/lift-off (0.9 days average port time)
Copyright © 1998-2021, Dr. Jean-Paul Rodrigue, Dept. of Global Studies & Geography, Hofstra University. For personal or classroom use ONLY. This material (including graphics) is not public domain and cannot be published, in whole or in part, in ANY form (printed or electronic) and on any media without consent. This includes conference presentations. Permission MUST be requested prior to use.

Cargo, Trade and Ship Characteristics
Cargo Type Trade Characteristics Vessel Size
General Cargo
Conventional Varied small consignments, Numerous consignees, Slow handling rates, Various routes, Numerous ports
Small
Unitized (containers) More uniform cargo, Rapid handling, Many ports Medium to large
Dry Bulk
Grain Small to medium consignments, Varied handling rates, Many restrictive ports Small to medium
Ores/coal Large consignments, Long hauls, Moderate handling rates, Specialized terminals, Few ports
Medium to very large
Liquid
Crude oil Very large consignments, Long hauls, Few routes, Specialized terminals, Few ports Very large to ultra large
Oil products Small shipments, Numerous consignees, Many ports Small to medium
Copyright © 1998-2021, Dr. Jean-Paul Rodrigue, Dept. of Global Studies & Geography, Hofstra University. For personal or classroom use ONLY. This material (including graphics) is not public domain and cannot be published, in whole or in part, in ANY form (printed or electronic) and on any media without consent. This includes conference presentations. Permission MUST be requested prior to use.

World Tonnage by Cargo Vessel Type, 1970-2012 (in millions dwt)
0
200
400
600
800
1,000
1,200
1,400
1,600
1970 1980 1985 1990 1995 2000 2001 2002 2003 2004 2005 2006 2007 2008 2009 2010 2011 2012
Other
Containerships
General cargo
Dry Bulk
Oil tankers
Copyright © 1998-2021, Dr. Jean-Paul Rodrigue, Dept. of Global Studies & Geography, Hofstra University. For personal or classroom use ONLY. This material (including graphics) is not public domain and cannot be published, in whole or in part, in ANY form (printed or electronic) and on any media without consent. This includes conference presentations. Permission MUST be requested prior to use.

International Seaborne Trade, 1980-2015 (millions of tons loaded)
0
2,000
4,000
6,000
8,000
10,000
12,000
1980 1985 1990 1995 2000 2005 2010 2011 2012 2013 2014 2015 2016 2017 2018
Oil and gas
5 Main Bulk
Other Dry Cargo
Container
Copyright © 1998-2021, Dr. Jean-Paul Rodrigue, Dept. of Global Studies & Geography, Hofstra University. For personal or classroom use ONLY. This material (including graphics) is not public domain and cannot be published, in whole or in part, in ANY form (printed or electronic) and on any media without consent. This includes conference presentations. Permission MUST be requested prior to use.

Tons Shipped by Maritime Transportation, 1980-2005 (in millions metric tons)
0
1,000
2,000
3,000
4,000
5,000
6,000
7,000Crude OilOil ProductsIron OreCoalGrainOther Cargo
Copyright © 1998-2021, Dr. Jean-Paul Rodrigue, Dept. of Global Studies & Geography, Hofstra University. For personal or classroom use ONLY. This material (including graphics) is not public domain and cannot be published, in whole or in part, in ANY form (printed or electronic) and on any media without consent. This includes conference presentations. Permission MUST be requested prior to use.

Maritime Engagement of the 15 largest Traders, 2000 (in %)
0.0% 2.0% 4.0% 6.0% 8.0% 10.0% 12.0% 14.0% 16.0%
United States
Germany
Japan
United Kingdom
France
Canada
China
Italy
Hong Kong, China
Netherlands
Belgium
Mexico
Korea, Rep. of
Taipei, Chinese
SingaporeShare of world fleet in terms of dwt
Share of world trade (exports + imports)
Copyright © 1998-2021, Dr. Jean-Paul Rodrigue, Dept. of Global Studies & Geography, Hofstra University. For personal or classroom use ONLY. This material (including graphics) is not public domain and cannot be published, in whole or in part, in ANY form (printed or electronic) and on any media without consent. This includes conference presentations. Permission MUST be requested prior to use.

Characteristics of Short Sea Shipping Services
Characteristics Regional Short Sea Services Feeder Services Ferry Services
Market Regional or intra-corporation cargo Feeder cargo (from/to deepseaservices)
Regional cargo over short distances
Frequency Fixed schedule with low frequency Shipping line schedule Fixed schedule with high frequency
Service orientation Regional loop Transshipment hubs Point to point
Operations Lift-on/Lift-off (Lo/Lo); Roll-on/Roll-off (Ro/Ro)
Lift-on/Lift-off (Lo/Lo) Roll-on/Roll-off (Ro/Ro)
Cargo type Containers, break bulk, Ro/Ro Containers Trucks, trailers, passengers
Infrastructure
Requirements
Shore-side cranes, warehouses and container storage areas
Shore-side cranes and container storage areas
Minimal (quays), particularly if vessels have self-sustaining ramps
Competition Road and rail transport (if present) Direct port calls. Ferry services. Road and air transport (if present). Feeder services.
Copyright © 1998-2021, Dr. Jean-Paul Rodrigue, Dept. of Global Studies & Geography, Hofstra University. For personal or classroom use ONLY. This material (including graphics) is not public domain and cannot be published, in whole or in part, in ANY form (printed or electronic) and on any media without consent. This includes conference presentations. Permission MUST be requested prior to use.

Short Sea Shipping Services Network Configuration
Copyright © 1998-2021, Dr. Jean-Paul Rodrigue, Dept. of Global Studies & Geography, Hofstra University. For personal or classroom use ONLY. This material (including graphics) is not public domain and cannot be published, in whole or in part, in ANY form (printed or electronic) and on any media without consent. This includes conference presentations. Permission MUST be requested prior to use.
Regional Short Sea Services Feeder Services Ferry Services

The European Short Sea Shipping Market
Copyright © 1998-2021, Dr. Jean-Paul Rodrigue, Dept. of Global Studies & Geography, Hofstra University. For personal or classroom use ONLY. This material (including graphics) is not public domain and cannot be published, in whole or in part, in ANY form (printed or electronic) and on any media without consent. This includes conference presentations. Permission MUST be requested prior to use.
536443
581
130
256
Mediterranean
Atlantic
Ocean
Black Sea
Baltic
North
Sea125 Cargo Carried (Million tons)
Main Short Sea Shipping Corridor
FromCargo Transited(Million tons)
To
72
42
60
74
123
84
5650
75
210
134
52
43
41
61
56
51
110
59

The North American Short Sea Shipping Market
Copyright © 1998-2021, Dr. Jean-Paul Rodrigue, Dept. of Global Studies & Geography, Hofstra University. For personal or classroom use ONLY. This material (including graphics) is not public domain and cannot be published, in whole or in part, in ANY form (printed or electronic) and on any media without consent. This includes conference presentations. Permission MUST be requested prior to use.
125 Cargo Carried (Million tons)
Main (marginal) Short Sea Shipping Route
Cargo Transited(Million tons)
NortheasternSeaboard
Gulf Coast
Alaska Maritimes
157Great Lakes
St. Lawrence Seaway
Welland Canal
CaribbeanTransshipment
Triangle
32
35

Container Traffic Handled by Main Caribbean Sub Regions
0 1 2 3 4 5 6 7 8 9 10
Western Caribbean
Greater Antilles
Florida
Southern Caribbean
Eastern Caribbean
Millions
2010
2015
Copyright © 1998-2021, Dr. Jean-Paul Rodrigue, Dept. of Global Studies & Geography, Hofstra University. For personal or classroom use ONLY. This material (including graphics) is not public domain and cannot be published, in whole or in part, in ANY form (printed or electronic) and on any media without consent. This includes conference presentations. Permission MUST be requested prior to use.

Largest Ports of the Caribbean
0 500,000 1,000,000 1,500,000 2,000,000 2,500,000 3,000,000 3,500,000 4,000,000
Colon
Cartagena
Kingston
Freeport
San Juan
Puerto Limon
Port Everglades
Miami
Jacksonville
Puerto Caucedo
Puerto Cortes
Santo Tomas de Castilla
Puerto Cabello
Puerto Barrios
Rio Haina
Port of Spain
Palm Beach
Mariel
Point Lisas
Fort-de-France
Hinterland Transshipment
Copyright © 1998-2021, Dr. Jean-Paul Rodrigue, Dept. of Global Studies & Geography, Hofstra University. For personal or classroom use ONLY. This material (including graphics) is not public domain and cannot be published, in whole or in part, in ANY form (printed or electronic) and on any media without consent. This includes conference presentations. Permission MUST be requested prior to use.

Length of Navigable Waters and Tonnage Carried, 2006-08
0 200 400 600 800 1000 1200 1400
0 10,000 20,000 30,000 40,000 50,000 60,000
China
Russian Federation
European Union
Brazil
United States
Indonesia
Colombia
Tons
Kilometers
km Tonnage
Copyright © 1998-2021, Dr. Jean-Paul Rodrigue, Dept. of Global Studies & Geography, Hofstra University. For personal or classroom use ONLY. This material (including graphics) is not public domain and cannot be published, in whole or in part, in ANY form (printed or electronic) and on any media without consent. This includes conference presentations. Permission MUST be requested prior to use.

Inland Waterway Traffic, Western Europe, 1970-2000 (in billion ton-kms)
0
20
40
60
80
100
120
140
1970 1980 1990 1995 2000
UK
Netherlands
Germany
France
Finland
Belgium
Copyright © 1998-2021, Dr. Jean-Paul Rodrigue, Dept. of Global Studies & Geography, Hofstra University. For personal or classroom use ONLY. This material (including graphics) is not public domain and cannot be published, in whole or in part, in ANY form (printed or electronic) and on any media without consent. This includes conference presentations. Permission MUST be requested prior to use.

Channel length (in km)
1610
293
161
80
0 200 400 600 800 1000 1200 1400 1600 1800
Grand Canal
St Lawrence
Suez
Panama
Copyright © 1998-2021, Dr. Jean-Paul Rodrigue, Dept. of Global Studies & Geography, Hofstra University. For personal or classroom use ONLY. This material (including graphics) is not public domain and cannot be published, in whole or in part, in ANY form (printed or electronic) and on any media without consent. This includes conference presentations. Permission MUST be requested prior to use.

The St. Lawrence / Great Lakes System
Copyright © 1998-2021, Dr. Jean-Paul Rodrigue, Dept. of Global Studies & Geography, Hofstra University. For personal or classroom use ONLY. This material (including graphics) is not public domain and cannot be published, in whole or in part, in ANY form (printed or electronic) and on any media without consent. This includes conference presentations. Permission MUST be requested prior to use.
River
Great Lakes
Seaway
St. Lawrence
Channel
Estuary & Gulf
Kingston Montreal Quebec
ABCD
WellandCanalSault Ste. Marie
1645 km 2055 km
(A) Lake Ontario(B) Lake Erie(C) Lake Huron(D) Lake Superior(E) Lake Michigan
E
Chicago
DetroitDuluth

Inland Waterway Vessels Operating Costs, China 1998
0
2
4
6
8
10
12
14
0 500 1000 1500 2000 2500 3000
US c
ent /
ton-
km
Vessel size (dwt)
Copyright © 1998-2021, Dr. Jean-Paul Rodrigue, Dept. of Global Studies & Geography, Hofstra University. For personal or classroom use ONLY. This material (including graphics) is not public domain and cannot be published, in whole or in part, in ANY form (printed or electronic) and on any media without consent. This includes conference presentations. Permission MUST be requested prior to use.

Factors Impacting Maritime Shipping Networks
Copyright © 1998-2021, Dr. Jean-Paul Rodrigue, Dept. of Global Studies & Geography, Hofstra University. For personal or classroom use ONLY. This material (including graphics) is not public domain and cannot be published, in whole or in part, in ANY form (printed or electronic) and on any media without consent. This includes conference presentations. Permission MUST be requested prior to use.
2 2 2 2
2 2 2
Port calls per week
2 2 2 2
2 2 2
3,000 TEU 6,000 TEU
3 3 3
3 3 3
Port calls per week
Frequency of Service Fleet and Vessel Size Number of Port Calls

Inter-Range Services and Cabotage
Copyright © 1998-2021, Dr. Jean-Paul Rodrigue, Dept. of Global Studies & Geography, Hofstra University. For personal or classroom use ONLY. This material (including graphics) is not public domain and cannot be published, in whole or in part, in ANY form (printed or electronic) and on any media without consent. This includes conference presentations. Permission MUST be requested prior to use.
A
B
C
D
E
F
Cabotage
Country 1
Country 2
Inter-range Service

The Maritime Transport Life Cycle and Main National Actors
Copyright © 1998-2021, Dr. Jean-Paul Rodrigue, Dept. of Global Studies & Geography, Hofstra University. For personal or classroom use ONLY. This material (including graphics) is not public domain and cannot be published, in whole or in part, in ANY form (printed or electronic) and on any media without consent. This includes conference presentations. Permission MUST be requested prior to use.
1. Building 2. Ownership 3. Registration 4. Operations 5. Scrapping
China, South Korea & Japan (91%)
Greece, Japan &China (38%)
Panama, Liberia& Marshall Islands(42%)
Denmark &Switzerland (30%)
India, Bangladesh, China &Pakistan (95%)
Financing and Insurance SeafarersGlobal Terminal Operators
UK & Scandinavia Philippines & Indonesia
Hong Kong, Netherlands, Singapore & UAE (44%)
CO
RE
SU
PP
OR
T
Top Related