


Languages
Pages
Legal


Transport Asset Management Plan 2018-2038
Adopted June 2018

Inner West Council Transport Asset Management Plan 2018
Document Control Asset Management Plan – Transport assets
Document ID : Iwc Draft Transport Asset Management Plan 2018 June 6 Ver 2 - Tg
Rev No Date Revision Details Author Reviewer Approver
V1 30 May 2018 Draft Version 1 RJ/TG
V2 6 June 2018 Draft Version 2 RJ/TG
NAMS.PLUS Asset Management Plan Templates
NAMS.Plus offers two Asset Management Plan templates – ‘Concise’ and ‘Comprehensive’.
The Concise template is appropriate for those entities who wish to present their data and information clearly and in as few words as possible whilst complying with the ISO 55000 Standards approach and guidance contained in the International Infrastructure Management Manual.
The Comprehensive template is appropriate for those entities who wish to present their asset management plan and information in a more detailed manner.
The concise Asset Management Plan is used as a supporting document to inform the overarching Strategic Asset Management Plan.
This Asset Management Plan is based on the Concise Asset Management Plan template.
© Copyright 2017 – All rights reserved. The Institute of Public Works Engineering Australasia.www.ipwea.org/namsplus

Inner West Council Transport Asset Management Plan 2018
TABLE OF CONTENTS
1 EXECUTIVE SUMMARY .................................................................................................................... 1 1.1 The Purpose of the Plan ............................................................................................................ 1 1.2 Asset Description ...................................................................................................................... 1 1.3 Levels of Service ....................................................................................................................... 1 1.4 Future Demand ........................................................................................................................ 1 1.5 Lifecycle Management Plan ...................................................................................................... 1 1.6 Financial Summary ................................................................................................................... 2 1.7 Asset Management Practices .................................................................................................... 2 1.8 Monitoring and Improvement Program..................................................................................... 3
2. INTRODUCTION .............................................................................................................................. 2 2.1 Background ............................................................................................................................ 2 2.2 Goals and Objectives of Asset Ownership ............................................................................... 2 2.3 Core and Advanced Asset Management .................................................................................. 3
3. LEVELS OF SERVICE ......................................................................................................................... 4 3.1 Customer Research and Expectations ..................................................................................... 4 3.2 Strategic and Corporate Goals ................................................................................................ 5 3.3 Legislative Requirements ........................................................................................................ 5 3.4 Customer Levels of Service ..................................................................................................... 8 3.5 Technical Levels of Service ...................................................................................................... 8
4. FUTURE DEMAND......................................................................................................................... 11 4.1 Demand Drivers ................................................................................................................... 11 4.2 Demand Forecasts ................................................................................................................ 12 4.3 Demand Impact on Assets .................................................................................................... 12 4.4 Demand Management Plan .................................................................................................. 13 4.5 Asset Programs to meet Demand ......................................................................................... 13
5. LIFECYCLE MANAGEMENT PLAN ................................................................................................... 15 5.1 Background Data .................................................................................................................. 15 5.2 Operations and Maintenance Plan ........................................................................................ 20 5.3 Renewal/Replacement Plan .................................................................................................. 21 5.4 Creation/Acquisition/Upgrade Plan ...................................................................................... 23 5.5 Disposal Plan ........................................................................................................................ 25
6. RISK MANAGEMENT PLAN ............................................................................................................ 26 6.1 Critical Assets ....................................................................................................................... 26 6.2 Risk Assessment ................................................................................................................... 26 6.3 Infrastructure Resilience Approach ....................................................................................... 27
7. FINANCIAL SUMMARY .................................................................................................................. 28 7.1 Financial Statements and Projections ................................................................................... 28 7.2 Funding Strategy .................................................................................................................. 32 7.3 Valuation Forecasts .............................................................................................................. 32 7.4 Key Assumptions Made in Financial Forecasts ....................................................................... 33 7.5 Forecast Reliability and Confidence ...................................................................................... 34
8. PLAN IMPROVEMENT AND MONITORING ..................................................................................... 35 8.1 Status of Asset Management Practices ................................................................................. 35 8.2 Improvement Plan ................................................................................................................ 35 8.3 Monitoring and Review Procedures ...................................................................................... 37 8.4 Performance Measures ........................................................................................................ 37
9. REFERENCES ................................................................................................................................. 38 10. APPENDICES ................................................................................................................................. 38
Appendix A: Forward Capital Works Program – 4 years ................................................................. 39 Appendix B: Budgeted Expenditures Accommodated in LTFP ........................................................ 40

Inner West Council Transport Asset Management Plan 2018
This page is intentionally left blank

- 1 -
Inner West Council Transport Asset Management Plan 2018
1 EXECUTIVE SUMMARY
1.1 The Purpose of the Plan Asset management planning is a comprehensive process to ensure delivery of services from infrastructure is provided in a financially sustainable manner.
This asset management plan details information about infrastructure assets including actions required to provide an agreed level of service in the most cost effective manner while outlining associated risks. The plan defines the services to be provided, how the services are provided and what funds are required to provide the services over a 20-year planning period.
The analysis considers the condition and remaining life of the assets to estimate the year when renewal is due in order to project renewal expenditure that will be required at the end of their useful life.
This plan covers the transport infrastructure assets that provide roads and road related services.
1.2 Asset Description These assets include:
The Transport network comprises:
Road Pavement
Kerb and Gutter
Footpaths
Bridges
Other Structures
Cycleways and other Road Assets
Carparks
Bulk Earthworks These infrastructure assets have a significant replacement value estimated at $1,097,600,000.
1.3 Levels of Service Our present funding levels are sufficient to continue to provide existing services at current levels for the duration of the Long Term Financial Plan (LTFP).
The main services consequences are:
The need to align levels of services to community requirements
The overall condition of the network is being held stable with minor improvements
1.4 Future Demand The main demands for new services are created by:
High car ownership
Traffic congestion
Parking demand
Cycleways
Town Centre Improvements
Road Safety Population density
These will be managed through a combination of managing existing assets, upgrading of existing assets and providing new assets to meet demand and demand management. Demand management practices include non-asset solutions, insuring against risks and managing failures.
The main demand management practices are:
Static road network extent;
Encouraging alternate travel modes;
Parking restrictions.
1.5 Lifecycle Management Plan
What does it Cost?
The Long Term Financial Plan does consider a funding scenario over a 10 year period to address the infrastructure renewal backlog, being the value of assets rated as poor (condition 4) and very poor condition (condition 5). As the assets predominantly have long useful lives, the analysis applied in this Plan refines the relatively coarse condition rating by considering renewal to occur in the year at the end of the assets useful life.
It is important to note that asset management projections are carried out in present value or today’s dollars with no indexing for future inflation, material or labour increases. Council’s Long Term Financial Plan uses future values which include assumed increases in the cost of services.
The analysis prepared for this Plan considers the following provisions of funding:
Scenario 1: Long Term Financial Plan: Business as Usual Applying existing asset data and the planned funding provided in Council’s Long Term Financial Plan.

- 2 -
Inner West Council Transport Asset Management Plan 2018
In this scenario the projected renewal expenditure is aligned to Special Schedule 7 in the 2016/17 Inner West Council Annual Report which identifies condition 4 and 5 assets as an infrastructure backlog and are partially addressed as a part of this scenario.
Scenario 2: Infrastructure Renewal Backlog Scenario 2 in Council’s Long Term Financial Plan aims to address Council’s infrastructure renewal shortfall (aligned with Special Schedule 7) within the life of the LTFP. This scenario is not modelled in this iteration of this Asset Management plan. Unconstrained Funding This iteration of funding modelling presumes that all asset expenditure shortfalls (operational, maintenance, Renewal, upgrade and new) will be funded. This is not modelled in the current iteration of Council’s Long Term Financial Plan. The projected outlays necessary to provide the services covered by this Asset Management Plan (AM Plan) includes operations, maintenance, renewal and upgrade of existing assets over the 10-year planning period is $697,596,000, or $69,759,600 on average per year.
1.6 Financial Summary
What we will do Estimated available funding for this period is $700,823,000 or $70,082,300 on average per year as per the long term financial plan or budget forecast. This is 100.5% of the cost to sustain the current level of service at the lowest lifecycle cost.
The infrastructure reality is that only what is funded in the long term financial plan can be provided. The emphasis of the Asset Management Plan is to communicate the consequences that this will have on the service provided and risks, so that decision making is “informed”.
The allocated funding leaves no shortfall on average per year in the projected expenditure required to provide services in the AM Plan compared with planned expenditure currently included in the Long Term Financial Plan. The result of this allows Council’s backlog to be reduced over the duration of the LTFP. The projected expenditure is shown in the figure below.
Figure Values are in current (real) dollars. Refer to Section 5.4 for a more detailed figure.
We plan to provide Transport services for the following:
Operation, maintenance, renewal and upgrade of roads, footpaths, kerb and gutter, other structures and road related assets to meet service levels set by in annual budgets, for the 10-year planning period.
What we cannot do We currently allocate enough funding to maintain existing services at the current standard including an amount to provide for some new services being sought. Works and services that cannot be provided under present funding levels are those beyond the scope of the current budget.
Managing the Risks
Our present funding levels are adequate to continue to manage risks in the medium term.
The main risk consequences are:
Reductions in the serviceability of assets
Severance of service Rising costs of managing infrastructure
We will endeavour to manage these risks within available funding by:
Manage the existing infrastructure with priority to items which could result in increased risks
Continue to provide optimal asset renewal treatments
Ensure the adequacy of maintenance treatments
1.7 Asset Management Practices Our systems to manage assets include:

- 3 -
Inner West Council Transport Asset Management Plan 2018
Technology One Finance
Technology One - Strategic Asset Management
MapInfo Geographic Information System
Assets requiring renewal/replacement are identified from one of three methods provided in the ‘Expenditure Template’.
• Method 1 uses Asset Register data to project the renewal costs using acquisition year and useful life to determine the renewal year, or
• Method 2 uses capital renewal expenditure projections from external condition modelling systems (such as Pavement Management Systems), or
• Method 3 uses a combination of average network renewals plus defect repairs in the
Renewal Plan and Defect Repair Plan worksheets on the ‘Expenditure template’.
Method 2 was used for this asset management plan.
1.8 Monitoring and Improvement Program The next steps resulting from this asset management plan to improve asset management practices are:
Condition data improvements;
Analytical capability to monitor and predict performance;
A methodology for, and predictions of asset life based on condition and asset consumption rates.

- 2 -
Inner West Council Transport Asset Management Plan 2018
2. INTRODUCTION
2.1 Background This asset management plan communicates the actions required for the responsive management of assets (and services provided from assets), compliance with regulatory requirements, and funding needed to provide the required levels of service over a 20-year planning period.
The asset management plan is to be read with the Inner West Council planning documents. This should include the Asset Management Policy and Asset Management Strategy, along with the following key planning documents:
Inner West Council Community Strategic Plan “Our Inner West 2036”
Delivery Program – 4 years
Operational Plan – 1 year
Workforce Management Plan
Long Term Financial Plan – 10 years
The infrastructure assets covered by this asset management plan are shown in Table 2.1. These assets are used to support a broad range of services to the community that provides for transport, trade, delivery of utility services and communications services.
Table 2.1: Assets covered by this Plan
Asset Category Quantity Current Replacement Value
Road Pavements 40.8 km Regional Roads 346 km Local roads 77.4 km Lanes 464.2 km Total
$290,001,000
Kerb and Gutter 907 km of kerb and gutter $98,605,000
Footpaths 845 km $108,633,000
Bridges 8 Road bridges 11 Pedestrian bridges
$14,830,000
Other Structures Retaining structures, safety barriers, fences, rock faces
$20,266,000
Cycleways and other Road Assets
Cycleways and Traffic Facilities $42,159,000
Car Parks 23 surface car parks $10,761,000
Bulk Earthworks Road Formation $512,345,000
TOTAL: $1,097,600,000
2.2 Goals and Objectives of Asset Ownership Our goal in managing infrastructure assets is to meet the defined level of service (as amended from time to time) in the most cost effective manner for present and future consumers. The key elements of infrastructure asset management are:
Providing a defined level of service and monitoring performance,
Managing the impact of growth through demand management and infrastructure investment,
Taking a lifecycle approach to developing cost-effective management strategies for the long-term that meet the defined level of service,
Identifying, assessing and appropriately controlling risks, and
Linking to a long-term financial plan which identifies required, affordable expenditure and how it will be allocated.
Other references to the benefits, fundamentals principles and objectives of asset management are:
- 3 -
Inner West Council Transport Asset Management Plan 2018
• International Infrastructure Management Manual 2015 1
• ISO 550002
2.3 Core and Advanced Asset Management This asset management plan is prepared as a ‘core’ asset management plan over a 20 year planning period in accordance with the International Infrastructure Management Manual3. Core asset management is a ‘top down’ approach where analysis is applied at the system or network level. An ‘advanced’ asset management approach uses a ‘bottom up’ approach for gathering detailed asset information for individual assets. This Plan uses a bottom up approach blended with a top down approach where the asset data is inadequate for detailed analysis.
1 Based on IPWEA 2015 IIMM, Sec 2.1.3, p 2| 13
2 ISO 55000 Overview, principles and terminology 3 IPWEA, 2015, IIMM.

- 4 -
Inner West Council Transport Asset Management Plan 2018
3. LEVELS OF SERVICE
3.1 Customer Research and Expectations This ‘core’ asset management plan is prepared to inform Council about the infrastructure assets covered by this plan. Future revisions of the asset management plan will incorporate community consultation on service levels and costs of providing the service. This will assist the Senior Management, Councillors and stakeholders in matching the level of service required, service risks and consequences with the community’s ability and willingness to pay for the service.
Following the amalgamation of three Councils to form Inner West Council, the levels of service provided by infrastructure assets is yet to be aligned. We have prior and current research on customer expectations which reflect the former provision of services. This subject will be investigated in more detail for future updates of the asset management plan.
Community Satisfaction Survey – Background Inner West Council sought to examine community attitudes and perceptions towards current and future services and facilities provided by Council. Key objectives of the research included:
Assessing and establishing the community’s priorities and satisfaction in relation to council activities, services, and facilities
Identifying the community’s overall level of satisfaction with Council’s performance
Identifying the community’s level of agreement with prompted statements surrounding wellbeing/connectedness
Identifying methods of communication and engagement with Council
Identifying priority areas for Council to focus on
The sample consisted of a total of 1,002 residents. 850 of 1,002 respondents were selected by means of a computer based random selection process using the electronic White Pages. The remaining 152 respondents were recruited via face-to-face intercept at a number of areas around the Inner West Council local government area, i.e. Addison Road Markets, Ashfield railway station, Marrickville railway station, and Woolworths Balmain.
The survey was conducted during the period 26th July – 12th August 2017.
The full survey is published and available on the Council’s website: www.innerwest.nsw.gov.au. The survey results for the infrastructure Service Area are summarised in Table 3.1.
Table 3.1: Community Satisfaction Survey Levels - Infrastructure
Performance Measured
Response for Importance
Satisfaction Level
Very Important
Important Somewhat Important
Not Very Important
Not at all Important
Management of Parking 50% 22% 14% 8% 6%
Cycleways 32% 19% 18% 12% 18%
Maintaining Footpaths 60% 27% 9% 2% 1%
Maintaining Local Roads 63% 25% 10% 2% 1%
Traffic Management and Road Safety 68% 21% 8% 1% 2%
Response for Satisfaction
Very Satisfied
Satisfied Somewhat Satisfied
Not Very Satisfied
Not at all Satisfied
Management of Parking 6% 19% 35% 23% 17%
Cycleways 10% 27% 29% 22% 12%
Maintaining Footpaths 9% 26% 38% 18% 9%
Maintaining Local Roads 9% 30% 38% 16% 8%
Traffic Management and Road Safety 12% 31% 31% 14% 12%

- 5 -
Inner West Council Transport Asset Management Plan 2018
Community satisfaction information is used in developing the Strategic Plan and in the allocation of resources in the budget.
3.2 Strategic and Corporate Goals This asset management plan is prepared under the direction of the Inner West Council vision, mission, goals and objectives.
Vision Statement We are the Inner West, land of the Gadigal and Wangal peoples, whose rich cultures, heritage and history we acknowledge and respect. We are defined by our diversity of people, places and ideas. We are an inclusive, vibrant,caring and progressive community where everyone is welcome, people and nature live in harmony and creativity is a way of life.
Relevant strategic directions and outcomes relating to the delivery of services from infrastructure are shown in Table 3.2.
Table 3.2: Strategic Directions and Outcomes for Infrastructure Services
Strategic Direction Outcomes
1. An ecologically sustainable Inner
West
1.1 The people and infrastructure of Inner West contribute
positively to the environment and tackling climate change
1.3 The community is a water sensitive, with clean, swimmable
waterways
1.4 Inner West is a zero emissions community that generates and
owns clean energy
2. Unique, liveable and networked
neighbourhoods
2.1 Development is designed for sustainability and makes life better
2.2 The unique character and heritage of neighbourhoods is
retained and enhanced
2.3 Public spaces are high-quality, welcoming and enjoyable places,
seamlessly connected with their surroundings
3. Creative communities and a strong
economy
3.5 Urban hubs and main streets are distinct and enjoyable places
to shop, eat, socialise and be entertained
4. Caring, happy, healthy communities 4.4 People have access to the services and facilities they need at all
stages of life
5. Progressive local leadership 5.1 People are well informed and actively engaged in local decision
making and problem-solving
Council’s Asset Management Policy defines the council’s vision and service delivery objectives for asset management in accordance with legislative requirements, community needs and affordability.
Inner West Council will exercise its duty of care to manage public safety in accordance with the infrastructure risk management plan prepared in conjunction with this AM Plan. Management of infrastructure risks is covered in Section 6.
3.3 Legislative Requirements There are many legislative requirements relating to the management of assets. These include:

- 6 -
Inner West Council Transport Asset Management Plan 2018
Table 3.3: Legislative Requirements
Legislation Requirement
Local Government Act 1993 Sets out role, purpose, responsibilities and powers of local governments. The purposes of this Act are as follows: (a) to provide the legal framework for an effective, efficient, environmentally responsible and open system of local government in New South Wales, (b) to regulate the relationships between the people and bodies comprising the system of local government in New South Wales, (c) to encourage and assist the effective participation of local communities in the affairs of local government, (d) to give councils: • the ability to provide goods, services and facilities, and to carry out activities, appropriate to the current and future needs of local communities and of the wider public • the responsibility for administering some regulatory systems under this Act • a role in the management, improvement and development of the resources of their areas, (e) to require councils, councillors and council employees to have regard to the principles of ecologically sustainable development in carrying out their responsibilities. The land management provisions of the Act require that Council prepare plans of management for all community land. The plan of management identifies the management objectives for the land category, performance indicators and performance measures to meet the objectives identified.
Local Government Amendment (Planning and Reporting) Act 2009
Local Government Amendment (Planning and Reporting) Act 2009 includes the preparation of a long term financial plan supported by asset management plans for sustainable service delivery.
Local Government Act - Annual Reporting Section 428(2)(d)
A report of the condition of the public works (including public buildings, public road and water sewerage and drainage works) under the control of council as at the end of that year; together with • An estimate (at current values) of the amount of money required to bring the works up to a satisfactory standard; and • An estimate (at current values) of the annual expense of maintain the works at that standard; and The Council’s programme for maintenance for that year in respect of the works.
Disability Discriminations Act, 1992 The Federal Disability Discrimination Act 1992 (D.D.A.) provides protection for everyone in Australia against discrimination based on disability. It encourages everyone to be involved in implementing the Act and to share in the overall benefits to the community and the economy that flow from participation by the widest range of people. (a) to eliminate, as far as possible, discrimination against persons on the ground of disability in the areas of: (i) work, accommodation, education, access to premises, clubs and sport; and (ii) the provision of goods, facilities, services and land; and (iii) existing laws; and (iv) the administration of Commonwealth laws and programs; and (b) to ensure, as far as practicable, that persons with disabilities have the same rights to equality before the law as the rest of the community; and to promote recognition and acceptance within the community of the principle

- 7 -
Inner West Council Transport Asset Management Plan 2018
Legislation Requirement
that persons with disabilities have the same fundamental rights as the rest of the community.
Work Health & Safety Act 2011 Sets out roles and responsibilities to secure the health, safety and welfare of persons at work and covering injury management, emphasising rehabilitation of workers particularly for return to work. Council is to provide a safe working environment and supply equipment to ensure safety.
Environmental Planning and Assessment Act 1979
An Act to institute a system of environmental planning and assessment for the State of New South Wales. Among other requirements the Act outlines the requirement for the preparation of Local Environmental Plans (LEP), Development Control Plans (DCP), Environmental Impact Assessments (EIA) and Environmental Impact Statements.
Plant Protection Act 1989 This act sets out requirements in respect to Flora Protection
Environmental Protection Act 1994 This act sets out requirements in respect to environmental protection
Threatened Species Conservation Act, 1995
An Act to conserve threatened species, populations and ecological communities of animals and plants. Under the terms of this Act Council is required to ensure the long term survival of the species identified.
Protection of the Environment Operations Act 1997
Council is required to exercise due diligence to avoid environmental impact and among others are required to develop operations emergency plans and due diligence plans to ensure that procedures are in place to prevent or minimise pollution.
National Parks and Wildlife Act (1974)
An Act relating to the establishment, preservation and management of national parks, historic sites and certain other areas and the protection of certain fauna, native plants and Aboriginal objects
Public Works Act 1912 Sets out the role of Council in the planning and construction of new assets.
Road Transport (General) Act 2005 Provides for the administration and enforcement of road transport legislation. It provides for the review of decisions made under road transport legislation. It makes provision for the use of vehicles on roads and road related areas and also with respect to written off and wrecked vehicles.
Road Transport (Safety and Traffic Management) Act 1999
Facilitates the adoption of nationally consistent road rules in NSW, the Australian Road Rules. It also makes provision for safety and traffic management on roads and road related areas including alcohol and other drug use, speeding and other dangerous driving, traffic control devices and vehicle safety accidents.
Roads Act 1993 Sets out rights of members of the public to pass along public roads, establishes procedures for opening and closing a public road, and provides for the classification of roads. It also provides for declaration of the RTA and other public authorities as roads authorities for both classified and unclassified roads, and confers certain functions (in particular, the function of carrying out roadwork) on the RTA and other roads authorities. Finally it provides for distribution of functions conferred by this Act between the RTA and other roads authorities, and regulates the carrying out of various activities on public roads.
Local Government (Highways) Act 1982
An Act to consolidate with amendments certain enactments concerning the functions of the corporations of municipalities with respect to highways and certain other ways and places open to the public.
Valuation of Land Act 1916 This act sets out requirements in respect Land Valuation

- 8 -
Inner West Council Transport Asset Management Plan 2018
Legislation Requirement
Crown Lands Act, 1989 An Act to provide for the administration and management of Crown land in the Eastern and Central Division of the State of NSW. Council has large holdings of Crown land under it care, control and management.
Heritage Act, 1977 An Act to conserve the environmental heritage of the State. Several properties are listed under the terms of the Act and attract a high level of maintenance cost, approval and monitoring.
Fire and Rescue Service Act 1990 This act sets out requirements in respect to Emergency Services for Fire and Rescue
Public Records Act 2002 This act sets out requirements in respect maintaining Public Records
Surveillance Devices Act This act sets out requirements in respect use of Surveillance Devices
Civil Liability Act, 2002 An Act to make provision in relation to the recovery of damages for death or personal injury caused by the fault of a person
Rural Fires Act, 1997 An Act to establish the NSW Rural Fire Service and define its functions; to make provision for the prevention, mitigation and suppression of rural fires. Under the terms of this Act Council is required to mitigate any fire that emanate from bushland.
3.4 Customer Levels of Service Service levels are defined service levels in two terms, customer levels of service and technical levels of service. These are supplemented by organisational measures.
Customer Levels of Service measure how the customer receives the service and whether value to the customer is provided.
Customer levels of service measures used in the asset management plan are:
Quality How good is the service … what is the condition or quality of the service?
Function Is it suitable for its intended purpose …. Is it the right service?
Capacity/Use Is the service over or under used … do we need more or less of these assets?
The current and expected customer service levels vary between the former council areas and are to be aligned through a process to redefine the levels of service and applied in the development of a works programs.
Organisational measures are measures of fact related to the service delivery outcome e.g. number of occasions when service is not available, condition %’s of Very Poor, Poor/Average/Good, Very good.
These Organisational measures provide a balance in comparison to the customer perception that may be more subjective. The charts in Section 5 indicate the current asset condition percentages referred to above.
3.5 Technical Levels of Service Technical Levels of Service - Supporting the customer service levels are operational or technical measures of performance. These technical measures relate to the allocation of resources to service activities to best achieve the desired customer outcomes and demonstrate effective performance.
Technical service measures are linked to the activities and annual budgets covering:

- 9 -
Inner West Council Transport Asset Management Plan 2018
Operations – the regular activities to provide services (e.g. opening hours, cleansing, mowing grass, energy, inspections, etc.
Maintenance – the activities necessary to retain an asset as near as practicable to an appropriate service condition. Maintenance activities enable an asset to provide service for its planned life (e.g. road patching, unsealed road grading, building and structure repairs),
Renewal – the activities that return the service capability of an asset up to that which it had originally (e.g. road resurfacing and pavement reconstruction, pipeline replacement and building component replacement),
Upgrade/New – the activities to provide a higher level of service (e.g. widening a road, sealing an unsealed road, replacing a pipeline with a larger size) or a new service that did not exist previously (e.g. a new library).
Service and asset managers plan, implement and control technical service levels to influence the customer service levels.4
Table 3.4 shows the technical levels of service expected to be provided under this AM Plan. The ‘Desired’ position in the table documents the position being recommended in this AM Plan.
Table 3.4: Technical Levels of Service
Service Attribute
Service Activity Objective
Activity Measure Process
Current Performance * Desired for Optimum Lifecycle Cost **
TECHNICAL LEVELS OF SERVICE
Operations
In Service as & when required
Continuity of service availability
Service Available Continue to provide Service Available
Budget $31,789,000 $31,393,000
Maintenance
Safe for users Extent of short term exclusions of service for repairs
Routine and reactive activities to assure service continuity
Timely maintenance of identified activities. Planned maintenance actives completed to schedule.
Budget $19,850,000 $19,355,000
Renewal
Renewal at or approaching very poor condition
Renewal Programs Long Term Planned Program matching demand
Timely renewal of high risk and poor condition assets
Budget $12,422,000 $12,143,000
Upgrade/New
Creation as new or Upgrading to contemporary requirements
Timely response to new requirement
Programmed annually in response to demand
Develop programs to meet future demands
Budget $6,837,000 $7,189,000
Note: * Current activities and costs (currently funded 2018/19). ** Desired activities and costs to sustain current service levels and achieve minimum life cycle costs (10 year average funding 2018/28).
4 IPWEA, 2015, IIMM, p 2|28.

- 10 -
Inner West Council Transport Asset Management Plan 2018
It is important to monitor the service levels provided regularly as these will change. The current performance is influenced by work efficiencies, innovations, and emergent technology, and customer priorities will change over time. A process of review and the establishment of an agreed position which achieves the best balance between service, risk and cost is essential.

- 11 -
Inner West Council Transport Asset Management Plan 2018
4. FUTURE DEMAND
4.1 Demand Drivers Drivers affecting demand include things such as population change, regulations, changes in demographics, seasonal factors, vehicle ownership rates, consumer preferences and expectations, technological changes, economic factors, agricultural practices, environmental awareness, etc.
Figure 1: Inner West Population Age Distributions
Source: Australian Bureau of Statistics – 2016
As only those aged less than 18 years in the 2036 population are yet to be born, the pattern of the majority of the population is already existent. The parents of these future residents are already in the population, and barring catastrophic population loss events, the pattern of population growth could be expected to follow current trends. Figure 1 shows the medium population forcast for the purposes of this Plan.
Table 4.1: Inner West Vehicle Ownership – 2016
Vehicle Ownership
Number of Motor vehicles at a Dwelling Number of Households
% of Households
None 11,931 17.3%
1 motor vehicle 33,604 48.9%
2 motor vehicles 16,655 24.2%
3 or more motor vehicles 4,282 6.2% Not stated 2,332 3.4%
TOTAL: 68,804 100.0%
Source: Australian Bureau of Statistics – 2016

- 12 -
Inner West Council Transport Asset Management Plan 2018
Figure 2: Vehicle Ownership - 2016, Comparing Inner West to Greater Sydney
Source: Australian Bureau of Statistics - 2016
4.2 Demand Forecasts The present position and projections for demand drivers that may impact future service delivery and use of assets were identified and are documented in Table 4.2.
4.3 Demand Impact on Assets The impact of demand drivers that may affect future service delivery and use of assets are shown in Table 4.2.
Table 4.2: Demand Drivers, Projections and Impact on Services
Demand drivers Present position Projection Impact on services
Population Growth Increasing population in recent years
Minor population increase forecast
Minor increase in demand for services provided utilising transport network
Rising proportion of elderly residents
Growing cohort of mobile seniors
Larger mobile population Mobility and safety related requirements for assets
Adoption of new transportation technologies
Safety and efficiency improved
Autonomous vehicles to enter fleet
Reduction in ownership, reduced fleet, traffic efficiency gains
Alternate forms of transport

- 13 -
Inner West Council Transport Asset Management Plan 2018
Increasing Car Ownership
Multiple cars per dwelling
Increase in fleet of share vehicles
Trend of more vehicles per census district is continuing, but disruption is likely (refer New Technology).
Usage patterns impacted by peak travel time and destination user charges
Increased pressure on road capacity, street parking and the demand for additional traffic devices.
Increase in travel outside peaks.
Road Construction Costs
Current costs Costs anticipated to increase in near to medium term.
The shortage of skilled labour, high labour costs and increasing material costs, and availability of quality road making materials will impact on the future management of roads.
Climate Change / Energy Economics
Vehicle energy source: Petroleum fuels dominance may reduce due to increase in electric propulsion.
Electric vehicles growing market share. Autonomous and electric vehicles increasingly common
Reduced petroleum demand may cause the collapse of the fuel price - resulting in cheaper petroleum products including bitumen. Reduction in fleet size -journey specific use of vehicles.
4.4 Demand Management Plan Demand for new services will be managed through a combination of managing existing assets, upgrading of existing assets and providing new assets to meet demand and demand management. Demand management practices can include non-asset solutions, insuring against risks and managing failures.
Opportunities identified to date for demand management are shown in Table 4.3. Further opportunities will be developed in future revisions of this asset management plan.
Table 4.3: Demand Management Plan Summary
Demand Driver Impact on Services Demand Management Plan
Increase in local car population
Traffic congestion Road Safety
Traffic facilities program
Increase in local car population
Parking demand increases Parking Policies
Increase in cycling travel and cycling users
Increase in the number of cyclists
New and improved cycleway infrastructure
4.5 Asset Programs to meet Demand The new assets required to meet demand can be acquired, donated or constructed. Additional assets are discussed in Section 5.4. The summary of the cumulative value of additional asset is shown in Figure 3.

- 14 -
Inner West Council Transport Asset Management Plan 2018
Figure 3: Upgrade and New Assets to meet Demand – (Cumulative)
Figure Values are in current (real) dollars.
Creating or acquiring new assets will create demand for, and commit ongoing additional funding of operations, maintenance and renewal costs for the period that the service provided from the assets is required.
Acquiring these new assets will commit ongoing operations, maintenance and renewal costs for the period that the service provided from the assets is required. These future costs are identified and considered in developing forecasts of future operations, maintenance and renewal costs for inclusion in the long term financial plan is further discussed in Section 5.

- 15 -
Inner West Council Transport Asset Management Plan 2018
5. LIFECYCLE MANAGEMENT PLAN The lifecycle management plan details how Council plans to manage and operate the assets at the agreed levels of service (defined in Section 3) while managing life cycle costs.
5.1 Background Data 5.1.1 Physical parameters
The assets covered by this asset management plan are shown in Table 5.1.
Table 5.1: Assets covered by this Plan
Asset Category Quantity Current Replacement Value
Road Pavements 40.8 km Regional Roads 346 km Local roads 77.4 km Lanes 464.2 km Total
$290,001,000
Kerb and Gutter 907 km of kerb and gutter $98,605,000
Footpaths 845 km $108,633,000
Bridges 8 Road bridges 11 Pedestrian bridges
$14,830,000
Other Structures Retaining structures, safety barriers, fences, rock faces
$20,266,000
Cycleways and other Road Assets
Cycleways and Traffic Facilities $42,159,000
Car Parks 23 surface car parks $10,761,000
Bulk Earthworks Road Formation $512,345,000
TOTAL: $1,097,600,000
The roads network of the area was initially developed before motor vehicles and has further developed through the first half of last century. Changes have occurred to the major roads since the removal of the Sydney wide tram network, but changes to the local roads are limited to traffic management changes. So the network is a legacy of prior planning. The network is a mature asset, with a diversity of age and lifecycle status for assets, which has distributed renewal demand across the decades.

- 16 -
Inner West Council Transport Asset Management Plan 2018
The age profile of the assets included in this AM Plan are shown in Figure 4.
Figure 4: Asset Age Profile
Figure 4 Values are in current (real) dollars.
The assets are a mature network, at a full range of life cycle ages and condition between as new to very poor. The spikes in the graph are likely to represent assumed common creation dates for long lived assets. In reality the age is more distributed. However, due to the maturity of the assets, the use of age is not a reliable proxy for condition. Many assets are in second and subsequent life cycles, and condition is no longer a function of age since acquisition. Age is simply an indicator of the planning parameters and construction techniques applicable at its creation.
5.1.2 Asset capacity and performance
Assets are generally provided to meet design standards where these are available.
Locations where deficiencies in service performance due to the planning parameters applied to the physical attributes at the asset’s creation are common, as discussed in Section 5.1.1 above.
5.1.3 Asset condition
Condition is monitored on a cyclic program for each asset group, ensuring an inspection of each asset on an appropriate cycle to detect changes in performance.
The currency of condition data for road pavements was variable when the asset register was amalgamated, and a program of data collection has been commenced to update and extend the data coverage to at least 90-95% reliability within three years. The first data collection contract is in progress and will result in reliable data for half of the road pavement network. The refreshed condition data will permit the detailed analysis using the pavement management system to predict pavement maintenance and renewal requirements for the network.

- 17 -
Inner West Council Transport Asset Management Plan 2018
The condition profile of our assets is shown in Figure 5.
Figure 5: Transport Assets Current Condition Profile
Figure 5 Values are in current (real) dollars.
Figure 5.1: Transport Assets Current Condition Profile

- 18 -
Inner West Council Transport Asset Management Plan 2018
Figure 5.2: Road Pavement Assets Current Condition Profile
Road pavements are distributed across the condition spectrum indicating a balanced population of condition readily managed by a continuing stable renewal program, which generates a clockwise cycle of life of pavement, which are renewed from very poor and poor to very good, and thereafter slowly deteriorate through good and fair to poor.
Figure 5.3: Footpath Assest Current Condition Profile
Footpaths are substantially at better than fair condition with one third at fair condition. A small proportion are in poor condition and thereby candidates for renewal in accordance with the level of service requirement. Point defects are also identified in footpaths, requiring renewal of the immediate defective vicinity of the pavement. Point defects are mostly treated in routine planned maitenance.
- 19 -
Inner West Council Transport Asset Management Plan 2018
Figure 5.4: Other Road Assets Current Condition Profile
Other road assets are recorded as good and very good condition.
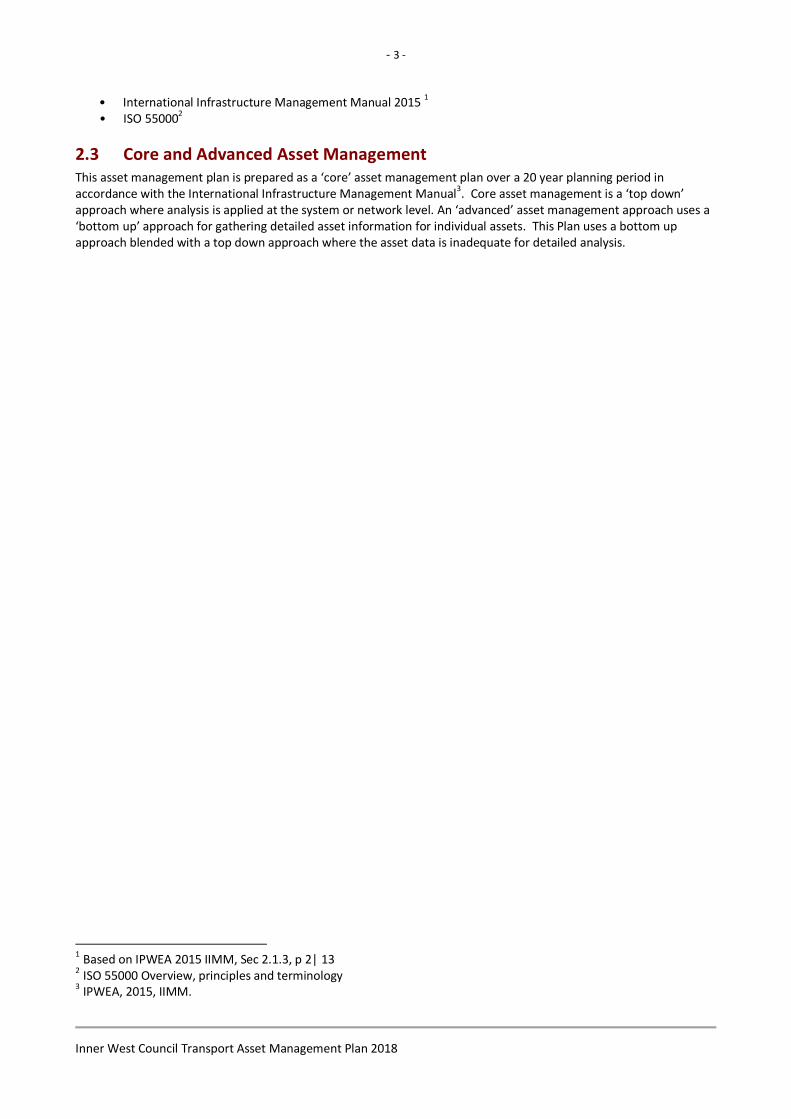
Figure 5.5: Current condition of Other Structures Assets
Other structures have a well distributed condition profile, with a similar proportion of assets in very good, good and fair condition, and a smaller quantity in poor condition, which are candidates for renewal.

- 20 -
Inner West Council Transport Asset Management Plan 2018
Condition is measured using a 1 – 5 grading system5 as detailed in Table 5.2.
Table 5.2: Simple Condition Grading Model
Condition Grading
Description of Condition
1 Very Good: only planned maintenance required
2 Good: minor maintenance required plus planned maintenance
3 Fair: significant maintenance required
4 Poor: significant renewal/rehabilitation required
5 Very Poor: physically unsound and/or beyond rehabilitation
5.2 Operations and Maintenance Plan Operations include regular activities to provide services such as public health, safety and amenity, e.g. cleaning, street sweeping, utilities costs and street lighting.
Routine maintenance is the regular on-going work that is necessary to keep assets operating, including instances where portions of the asset fail and need immediate repair to make the asset operational again, e.g. road patching.
Maintenance includes all actions necessary for retaining an asset as near as practicable to an appropriate service condition including regular ongoing day-to-day work necessary to keep assets operating.
Maintenance expenditure is shown in Table 5.3.
Table 5.3. Maintenance Expenditure Trends
Year Maintenance Budget $
Current year 2017/18 $19,300,000
Next year 2018/19 $19,850,000
Average 2018/19 to 2027/28 -in current (real) dollars $19,355,000
Maintenance expenditure levels are considered to be adequate to meet projected service levels, which may be less than or equal to current service levels. Where maintenance expenditure levels are such that they will result in a lesser level of service, the service consequences and service risks have been identified and is highlighted in this AM Plan and service risks considered in the Infrastructure Risk Management Plan.
Summary of future operations and maintenance expenditures
Future operations and maintenance expenditure is forecast to trend in line with the value of the asset stock as shown in Figure 6. Note that all costs are shown in current 2018 dollar values (i.e. real values).
5 IPWEA, 2015, IIMM, Sec 2.5.4, p 2|80.

- 21 -
Inner West Council Transport Asset Management Plan 2018
Figure 6: Projected Operations and Maintenance Expenditure
Figure 6 values are in current (real) dollars.
Operations expenditures are commonly stable when the quantity of assets are generally stable. There is little growth in new assets or asset upgrades, so a stable expenditure on operations is predicted. Maintenance costs are minimal for very good condition assets, and increase as the condition of assets deteriorate. As the network has a distributed condition range which is planned to remain a stable distribution of condition for the period of this Plan, no significant increase in maintenance is predicted.
The priority of maintenance expenditures is determined on the basis of risk. Deferred maintenance, that is works that are identified for maintenance and unable to be funded in the current program, are to be included in the risk assessment and analysis as described in the infrastructure risk management plan.
Maintenance is funded from the operating budget. This is further discussed in Section 7.
5.3 Renewal/Replacement Plan Renewal and replacement expenditure is major work which does not increase the asset’s design capacity but restores, rehabilitates, replaces or renews an existing asset to its original service potential. Work over and above restoring an asset to original service potential is considered to be an upgrade/expansion or new work expenditure resulting in additional future operations and maintenance costs.
Assets requiring renewal/replacement are identified from one of three methods provided in the ‘Expenditure Template’.
• Method 1 uses Asset Register data to establish the renewal costs using acquisition year and useful life to determine the renewal year, or
- 22 -
Inner West Council Transport Asset Management Plan 2018
• Method 2 uses capital renewal expenditure projections from external condition modelling systems including the Pavement Management System operated by Council, or
• Method 3 uses a combination of average network renewals plus defect repairs in the Renewal Plan and Defect Repair Plan worksheets on the ‘Expenditure template’.
The majority of renewal is determined using Method 2 for this asset management plan. 5.3.1 Renewal ranking criteria
Asset renewal and replacement is typically undertaken to either:
Ensure the reliability of the existing infrastructure to deliver the service it was constructed to facilitate (e.g. replacing a bridge that has a 5 t load limit), or
To ensure the infrastructure is of sufficient quality to meet the service requirements (e.g. roughness of a road).
6
It is possible to get some indication of capital renewal and replacement priorities by identifying assets or asset groups that:
Have a consequence of added damage for associated assets if renewal is deferred,
Have a high consequence of failure,
Have high use and subsequent impact on users would be greatest,
Have a total value representing the greatest net value,
Have the highest average age relative to their expected lives,
Are identified in the AM Plan as key cost factors,
Have high operational or maintenance costs, and Have replacement with a modern equivalent asset that would provide the equivalent service at a saving.7
The ranking criteria used to determine priority of identified renewal and replacement proposals is established by determining the relative additional cost of deferral, such that the least additional cost is incurred if projects are deferred.
5.3.2 Summary of future renewal and replacement expenditure
Projected future renewal and replacement expenditures are forecast to increase over time when the asset stock increases. The distribution indicated in the chart is clustered in a few distributed years. This distribution has arisen from the application of predicted life cycles to the condition rankings asset register. This produces clusters of renewal years, as the 5 classes of condition are not sufficiently discriminating for long life assets. Note that all amounts are shown in current (real) dollars.
The renewal demand is distributed across the period of this plan to deliver a steady rate of annual expenditure demand. Analysis using more detailed assessments of condition of assets recorded as approaching the time for renewal permits a finer graded rating of condition and failure risk. For example, the Pavement Management System ranks individual pavement segments in priority order.
The forward capital works program – 4 years is shown in Appendix A.
6 IPWEA, 2015, IIMM, Sec 3.4.4, p 3|91. 7 Based on IPWEA, 2015, IIMM, Sec 3.4.5, p 3|97.

- 23 -
Inner West Council Transport Asset Management Plan 2018
Figure 7: Projected Very Poor assets (condition 5 or end of useful life)
Figure 7 Values are in current (real) dollars.
Deferred renewal and replacement, i.e. those assets identified for renewal and/or replacement and not scheduled in capital works programs are to be included in the risk analysis process in the risk management plan.
Renewals and replacement expenditure in the capital works program will be accommodated in the long term financial plan. This is further discussed in Section 7.
5.4 Creation/Acquisition/Upgrade Plan New works are those that create a new asset that did not previously exist, or works which will upgrade or improve an existing asset beyond its existing capacity. They may result from growth, social or environmental needs. Assets may also be acquired at no cost. The Asset Management Policy sets the criteria for assessing additions to the asset base. These additional assets are considered in Section 4.4.
5.4.1 Selection criteria
New assets and upgrade/expansion of existing assets are identified from various sources such as community requests, proposals identified by strategic plans or partnerships with others. Candidate proposals are inspected to verify need and to develop a preliminary cost estimate. Verified proposals are ranked by priority and available funds and scheduled in future works programmes. The Asset Management Policy sets out the following criteria:
AMP 6.2. Council will ensure the asset management of existing assets will not be compromised by the creation of new assets
AMP 6.4. Decisions on asset renewal, disposal, upgrade or new asset provision are carried out in accordance with asset management information that includes demonstrated need, life cycle costing, alternative modes of delivery, sustainability, equitable distribution of resources and social equity.

- 24 -
Inner West Council Transport Asset Management Plan 2018
The priority ranking for new assets, upgrades and expansions is determined on the criteria above.
5.4.2 Summary of future upgrade/new assets expenditure
Projected upgrade/new asset expenditures are summarised in Figure 8.
Figure 8: Projected Capital Upgrade/New Asset Expenditure
Figure 8 values are in current (real) dollars.
Expenditure on new assets and services in the capital works program will be accommodated in the long term financial plan but only to the extent of the available funds, and taking into account the Asset Management Policy criteria.
There is an impact of new assets on the forward programs. The acquisition of new assets will commit the Council to the funding of ongoing operations, maintenance and renewal costs for the life cycle period that the service provided from the assets is required. Hence, the burden of additional expenditures into the future is to be considered before the asset investment base is increased.
5.4.3 Summary of asset expenditure requirements
The financial projections from this asset plan are shown in Figure 9 for projected operating (operations and maintenance) and capital expenditure (renewal and upgrade/expansion/new assets). Note that all costs are shown in real values.

- 25 -
Inner West Council Transport Asset Management Plan 2018
The bars in the graphs represent the anticipated budget needs required to achieve lowest lifecycle costs, the budget line indicates what is currently available. The gap between these informs the discussion on achieving the balance between services, costs and risk to achieve the best value outcome.
Figure 9: Projected Operating and Capital Expenditure
Figure 9 Values are in current (real) dollars.
The chart indicates that expenditure exceeds demand in most years, except where spikes in renewal occur. Redistribution of the renewal spikes across all 10 years of this Plan produces a stable funding scenario in which an average of $69,759,600 is required annually for 10 years. An average of $70,082,300 is funded under the Long Term Financial Plan, indicating that the proposed funding is adequate over the 10 year period of the Plan and assists in reducing Council’s infrastructure backlog.
The spikes of renewal projects will be distributed through the improvement of condition information proposed in the Asset Management Improvement Plan, and the application of more sophisticated needs analysis tools including the Pavement Management System and Strategic Assets Management System that is being implemented.
5.5 Disposal Plan Disposal includes any activity associated with the disposal of a decommissioned asset including sale, demolition or relocation. No assets are identified for possible decommissioning and disposal.
Apart from the remnant values of assets being renewed at the end of serviceable life, no specific assets are identified for disposal. As the physical road network is neither growing nor reducing, asset disposal is not predicted.
- 26 -
Inner West Council Transport Asset Management Plan 2018
6. RISK MANAGEMENT PLAN The purpose of infrastructure risk management is to document the results and recommendations resulting from the periodic identification, assessment and treatment of risks associated with providing services from infrastructure, using the fundamentals of International Standard ISO 31000:2009 Risk management – Principles and guidelines.
Risk Management is defined in ISO 31000:2009 as: ‘coordinated activities to direct and control with regard to risk’8.
An assessment of risks9 associated with service delivery from infrastructure assets has identified critical risks that will result in loss or reduction in service from infrastructure assets or a ‘financial shock’. The risk assessment process identifies credible risks, the likelihood of the risk event occurring, the consequences should the event occur, develops a risk rating, evaluates the risk and develops a risk treatment plan for non-acceptable risks.
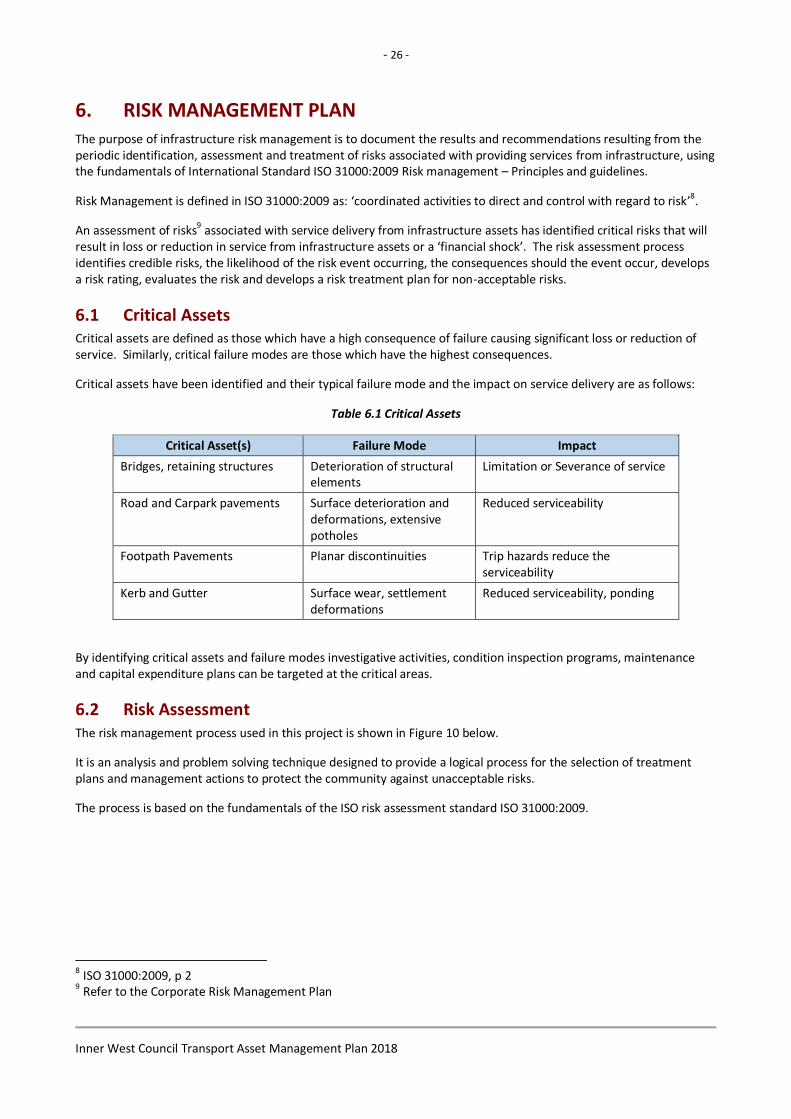
6.1 Critical Assets Critical assets are defined as those which have a high consequence of failure causing significant loss or reduction of service. Similarly, critical failure modes are those which have the highest consequences.
Critical assets have been identified and their typical failure mode and the impact on service delivery are as follows:
Table 6.1 Critical Assets
Critical Asset(s) Failure Mode Impact
Bridges, retaining structures Deterioration of structural elements
Limitation or Severance of service
Road and Carpark pavements Surface deterioration and deformations, extensive potholes
Reduced serviceability
Footpath Pavements Planar discontinuities Trip hazards reduce the serviceability
Kerb and Gutter Surface wear, settlement deformations
Reduced serviceability, ponding
By identifying critical assets and failure modes investigative activities, condition inspection programs, maintenance and capital expenditure plans can be targeted at the critical areas.
6.2 Risk Assessment The risk management process used in this project is shown in Figure 10 below.
It is an analysis and problem solving technique designed to provide a logical process for the selection of treatment plans and management actions to protect the community against unacceptable risks.
The process is based on the fundamentals of the ISO risk assessment standard ISO 31000:2009.
8 ISO 31000:2009, p 2 9 Refer to the Corporate Risk Management Plan

- 27 -
Inner West Council Transport Asset Management Plan 2018
Figure 10 Risk Management Process – Abridged
TREAT RISKS
- Identify options
- Assess options
- Treatment plans
ANALYSE &
EVALUATE RISKS
- Consequences
- Likelihood
- Level of Risk
- Evaluate
IDENTIFY RISKS
- What can happen ?
- When and why ?
- How and why ?
The risk assessment process identifies credible risks, the likelihood of the risk event occurring, the consequences should the event occur, develops a risk rating, evaluates the risk and develops a risk treatment plan for non-acceptable risks.
An assessment of risks10 associated with service delivery from infrastructure assets has identified the critical risks that will result in significant loss, ‘financial shock‘ or a reduction in service.
Critical risks are those assessed with ‘Very High’ (requiring immediate corrective action) and ‘High’ (requiring corrective action) risk ratings identified in the Infrastructure Risk Management Plan. The residual risk and treatment cost after the selected treatment plan is implemented is shown in Table 6.2. These risks and costs are reported to management.
Table 6.2: Critical Risks and Treatment Plans
Service or Asset at Risk
What can Happen Risk Rating (VH, H,
M)
Risk Treatment Plan Residual Risk *
Bridges Structural deterioration
H Reduce loading and monitor structure Moderate
Road Pavements Surface deterioration and deformation
M Temporary repair, then structural repair or renewal
Low
Footpath Pavements
Surface discontinuities, trip hazards
M Temporary repair, then renewal Low
Note * The residual risk is the risk remaining after the selected risk treatment plan is operational.
6.3 Infrastructure Resilience Approach The resilience of our critical infrastructure is vital to our customers and the services we provide. To adapt to changing conditions and grow over time we need to understand our capacity to respond to possible disruptions and be positioned to absorb disturbance and act effectively in a crisis to ensure continuity of service.
Resilience is built on aspects such as response and recovery planning, financial capacity and crisis leadership.
10 Refer to the Corporate Risk Management Plan

- 28 -
Inner West Council Transport Asset Management Plan 2018
7. FINANCIAL SUMMARY This section contains the financial requirements resulting from all the information presented in the previous sections of this asset management plan. The financial projections will be improved as further information becomes available on desired levels of service and current and projected future asset performance.
7.1 Financial Statements and Projections
7.1.1 Asset valuations
The best available estimate of the value of assets included in this Asset Management Plan are shown below. Assets are valued at fair value, as reported in the Financial Statements at 30 June 2017.
Figure 11: Asset Management Valuation Structure
Residual
Value
Depreciable
Amount
Useful Life
Gross
Replacement
Cost
End of
reporting
period 1
Annual
Depreciation
Expense
End of
reporting
period 2
Accumulated
Depreciation Depreciated
Replacement
Cost
Table 7.1: Value of Transport Assets
Asset Class Gross
Replacement Cost ($000)
Depreciable Amount ($000)
Depreciated Replacement Cost ($000)
Depreciation Expense ($000)
Roads $388,606 $388,606 $256,055 $7,816
Bridges $14,830 $14,830 $10,371 $155
Footpaths $108,633 $108,633 $75,260 $1,523
Other Structures $20,266 $20,266 $12,132 $1,699
Other Road Assets $42,159 $42,159 $33,837 $1,139
Bulk Earthworks $512,345 $0 $512,345 $0
Car Parks $10,761 $8,338 $8,684 $154
Total $1,097,600 $582,832 $908,684 $12,486

- 29 -
Inner West Council Transport Asset Management Plan 2018
7.1.2 Sustainability of service delivery
Two key indicators for service delivery sustainability that have been considered in the analysis of the services provided by this asset category, these being the:
asset renewal funding ratio, and
medium term budgeted expenditures/projected expenditure (over 10 years of the planning period).
Asset Renewal Funding Ratio
Asset Renewal Funding Ratio11
120%
The Asset Renewal Funding Ratio is the most important indicator and indicates that over the next 10 years of the forecasting that we expect to have 120% of the funds required for the optimal renewal and replacement of assets.
Medium term – 10 year financial planning period
This asset management plan identifies the projected operations, maintenance and capital renewal expenditures required to provide an agreed level of service to the community over a 10 year period. This provides input into 10 year financial and funding plans aimed at providing the required services in a sustainable manner.
These projected expenditures may be compared to budgeted expenditures in the 10 year period to identify any funding shortfall. In a core asset management plan, a gap is generally due to increasing asset renewals for ageing assets.
The projected operations, maintenance and capital renewal expenditure required over the 10 year planning period is $62,569,700 on average per year.
Estimated (budget) operations, maintenance and capital renewal funding is $62,892,400 on average per year giving a 10 year funding surplus of $322,700 per year. This indicates 100.5% of the projected expenditures needed to provide the services documented in the asset management plan.
Providing services from infrastructure in a sustainable manner requires the matching and managing of service levels, risks, projected expenditures and financing to achieve a financial indicator of approximately 1.0 for the first years of the asset management plan and ideally over the 10-year life of the Long Term Financial Plan.
11 AIFMM, 2015, Version 1.0, Financial Sustainability Indicator 3, Sec 2.6, p 9.

- 30 -
Inner West Council Transport Asset Management Plan 2018
Table 7.2: Summary Of Current Service Sustainability Ratios
Sustainability Ratios Values
Asset Renewal Funding Ratio
Net present value of renewal funding accommodated over a 10 year period in the LTFP $121,436,000
Net present value of projected capital renewal expenditure over a 10 year period $101,248,000
Asset renewal Funding Ratio 120%
Medium Term – 10 year sustainability ratio
10 year Operations, Maintenance & Renewal Planned (LTFP Budget Funding) Expenditure* $628,924,000
10 year Operations, Maintenance & Renewal Projected Expenditure* $625,697,000
10 year funding Surplus (10 year Planned (LTFP Budget Funding) Expenditure – 10 year Projected Expenditure
$3,227,000
10 year Sustainability indicator (10 year Planned Expenditure / Projected Expenditure) 100.5%
*excludes upgrade and new assets

- 31 -
Inner West Council Transport Asset Management Plan 2018
7.1.3 Projected and LTFP Budgeted Renewals and Financing Shortfall
Table 7.3 shows the projected and the long term financial budgeted renewals and financing shortfalls for the 10 year long term financial plan. The table shows that although there are renewal financing gaps in 2 specific years, over the 10 year period there is a surplus. In the first 4 years the surplus is allocated to renewal projects identified in the Forward Capital Works Program – 4 years. The surplus in the later years will be allocated to renewal projects as the program is developed.
Expenditure projections are in 2018 real values, not inflated annually.
Table 7.3: Projected and LTFP Budgeted Renewals and Financing Shortfall ($000)
Year End June 30
Projected Renewals
($000)
LTFP Renewal Budget
($000)
Renewal Financing Shortfall
(- gap, + surplus) ($000)
Cumulative Shortfall (- gap, + surplus)
($000)
2019 $15,990 $12,422 -$3,568 -$3,568
2020 $10 $12,577 $12,566 $8,999
2021 $651 $14,998 $14,346 $23,345
2022 $9,474 $12,644 $3,169 $26,514
2023 $477 $12,665 $12,188 $38,702
2024 $88 $11,676 $11,588 $50,290
2025 $1,020 $11,466 $10,447 $60,737
2026 $1,050 $11,260 $10,210 $70,947
2027 $71,837 $10,998 -$60,839 $10,108
2028 $651 $10,730 $10,078 $20,187*
* The cumulative surplus of $20.2 million identified at the end of the 2028 year is attributed to the reduction to the infrastructure backlog of asset in poor and very poor condition.
- 32 -
Inner West Council Transport Asset Management Plan 2018
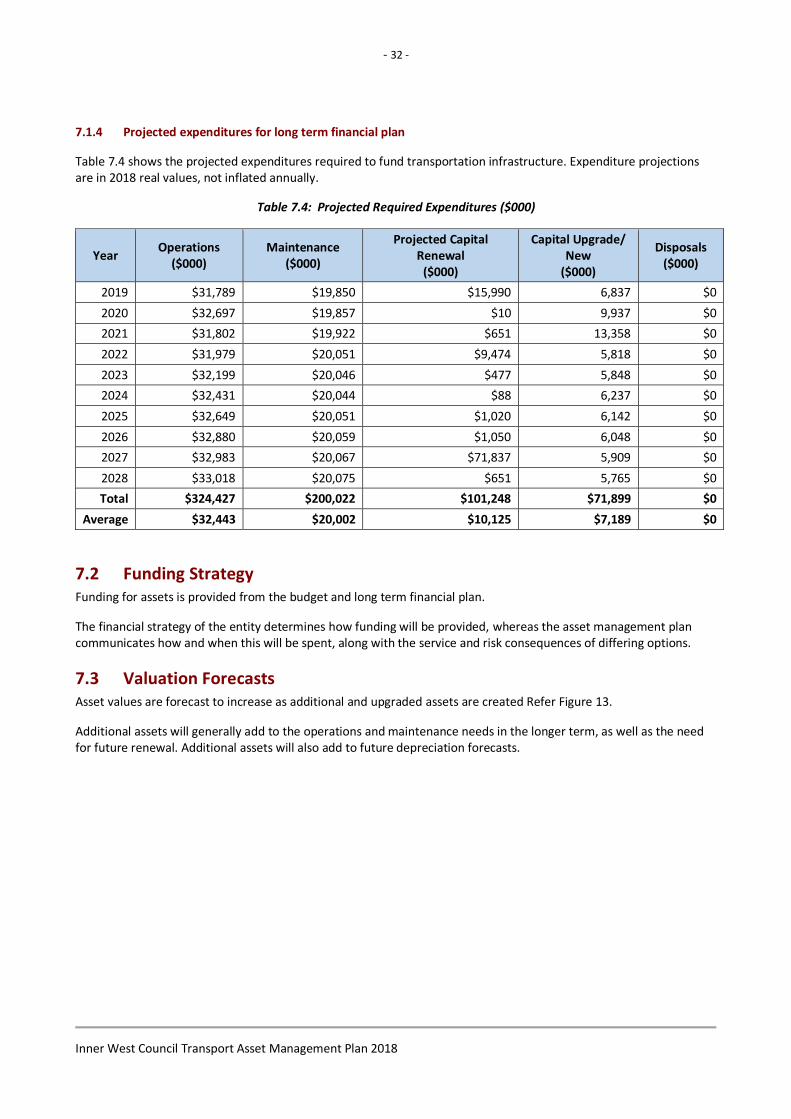
7.1.4 Projected expenditures for long term financial plan
Table 7.4 shows the projected expenditures required to fund transportation infrastructure. Expenditure projections are in 2018 real values, not inflated annually.
Table 7.4: Projected Required Expenditures ($000)
Year Operations
($000) Maintenance
($000)
Projected Capital Renewal
($000)
Capital Upgrade/ New
($000)
Disposals ($000)
2019 $31,789 $19,850 $15,990 6,837 $0
2020 $32,697 $19,857 $10 9,937 $0
2021 $31,802 $19,922 $651 13,358 $0
2022 $31,979 $20,051 $9,474 5,818 $0
2023 $32,199 $20,046 $477 5,848 $0
2024 $32,431 $20,044 $88 6,237 $0
2025 $32,649 $20,051 $1,020 6,142 $0
2026 $32,880 $20,059 $1,050 6,048 $0
2027 $32,983 $20,067 $71,837 5,909 $0
2028 $33,018 $20,075 $651 5,765 $0
Total $324,427 $200,022 $101,248 $71,899 $0
Average $32,443 $20,002 $10,125 $7,189 $0
7.2 Funding Strategy Funding for assets is provided from the budget and long term financial plan.
The financial strategy of the entity determines how funding will be provided, whereas the asset management plan communicates how and when this will be spent, along with the service and risk consequences of differing options.
7.3 Valuation Forecasts Asset values are forecast to increase as additional and upgraded assets are created Refer Figure 13.
Additional assets will generally add to the operations and maintenance needs in the longer term, as well as the need for future renewal. Additional assets will also add to future depreciation forecasts.

- 33 -
Inner West Council Transport Asset Management Plan 2018
Figure 13: Projected Asset Values
7.4 Key Assumptions Made in Financial Forecasts This section details the key assumptions made in presenting the information contained in this asset management plan. It is presented to enable readers to gain an understanding of the levels of confidence in the data behind the financial forecasts.
Key assumptions made in this asset management plan are listed in Table 7.5.
Table 7.5: Key Assumptions made in AM Plan and Risks of Change
Key Assumptions in AM Plan Risk of Change
Use of current inventory data Low risk
Use of current condition data Low risk
Use of existing valuation 30 June 2017, useful life Low risk
Maintenance expenditure is based on current costs and market rates Medium risk

- 34 -
Inner West Council Transport Asset Management Plan 2018
7.5 Forecast Reliability and Confidence The expenditure and valuations projections in this AM Plan are based on best available data. Currency and accuracy of data is critical to effective asset and financial management. Data confidence is classified on a 5 level scale12 in accordance with Table 7.6.
Table 7.6: Data Confidence Grading System
Confidence Grade
Description
A Highly reliable Data based on sound records, procedures, investigations and analysis, documented properly and agreed as the best method of assessment. Dataset is complete and estimated to be accurate ± 2%
B Reliable Data based on sound records, procedures, investigations and analysis, documented properly but has minor shortcomings, for example some of the data is old, some documentation is missing and/or reliance is placed on unconfirmed reports or some extrapolation. Dataset is complete and estimated to be accurate ± 10%
C Uncertain Data based on sound records, procedures, investigations and analysis which is incomplete or unsupported, or extrapolated from a limited sample for which grade A or B data are available. Dataset is substantially complete but up to 50% is extrapolated data and accuracy estimated ± 25%
D Very Uncertain Data is based on unconfirmed verbal reports and/or cursory inspections and analysis. Dataset may not be fully complete and most data is estimated or extrapolated. Accuracy ± 40%
E Unknown None or very little data held.
The asset data used to inform the development of this AM Plan are tabulated below. The estimated confidence level for and reliability of data used in this AM Plan is considered to be C ‘Uncertain’.
Table 7.7: Data Confidence Grades
Asset Class Data Description Confidence Level
Road Asset Register The existence, location, and extent of all road corridor assets
A Highly reliable
Road Pavement Condition Condition Values are 60% reliable, and 40% uncertain
C Uncertain
Footpath, Kerb & Gutter Condition Values are 60% reliable, and 40% uncertain
C Uncertain
Traffic Facilities Condition Values are 60% reliable, and 40% uncertain
C Uncertain
Bridges Asset details, Condition A Highly reliable
Other Structures Condition Values are 60% reliable, and 40% uncertain
C Uncertain
12 IPWEA, 2015, IIMM, Table 2.4.6, p 2|71.

- 35 -
Inner West Council Transport Asset Management Plan 2018
8. PLAN IMPROVEMENT AND MONITORING
8.1 Status of Asset Management Practices13 8.1.1 Accounting and financial data sources
Inner West Council Annual Financial Statements 2017
Long Term Financial Plan 2018
8.1.2 Asset management data sources
Inner West Council Asset Register
Inner West Council Pavement Management System
Inner West Council Geographic Information System
8.2 Improvement Plan The asset management improvement plan generated from this asset management plan is shown in Table 8.1.
Table 8.1: Asset Management Improvement Plan
Ref Practice Area Task Responsibility Target Date
1 Strategic Longer
Term Plan
Council adopt a Community
Strategic Plan
Executive June 2018
2 Annual Budget Annual Budget based on the
Delivery Program, AM Plans and
LTFP
Deputy General
Manager Asset &
Environment
July 2018
3 Annual Report Annual Report reviews
performance against strategic
objectives
Deputy General
Manager Asset &
Environment
September 2019
4 AM Policy AM Policy Deputy General
Manager Asset &
Environment
June 2018
5 AM Strategy AM Strategy Deputy General
Manager Asset &
Environment
June 2018
6 AM Plans AM Plans Group Managers July 2018
Planning forecasts of renewal, new
assets and upgrades, maintenance
and operational costs,
rationalisation and disposal,
performance and utilisation,
Managers of
Assets, Asset
Management
Steering
Committee
June 2019
7 Governance and
Management
AM practices link to service
delivery
Managers of
Assets
June 2020
13
ISO 55000 Refers to this the Asset Management System

- 36 -
Inner West Council Transport Asset Management Plan 2018
Asset Management improvement
planning
Managers of
Assets
December 2019
8 Levels of Service Processes for determining current
and target levels of service and
costs
Managers of
Assets
June 2020
Levels of service measured,
monitored and performance
reported
Managers of
Assets
June 2020
Develop Service Plans, based on
community consultations;
Managers of
Assets
June 2020
9 Data and Systems Assessments of asset service Risk
and Criticality
Managers of
Assets
December 2019
Life cycle costs for assets, Asset
Management
Steering
Committee
June 2019
Consolidated integrated, accurate
asset database and analytical
capability to monitor and predict
performance
Asset
Management
Steering
Committee
September 2019
A methodology for, and predictions
of asset life based on condition and
asset consumption rates.
Managers of
Assets
June 2019
Documented data standards and
methodologies for asset condition
surveys and defect identification
identified in an Asset Knowledge
Management Plan
Managers of
Assets
June 2019
10 Skills and Processes Documented process for planning
needs for renewal and upgrade
Managers of
Assets
June 2019
Documented service rationalisation
process, and service delivery
reviews.
Asset
Management
Steering
Committee
June 2020
Documented structure of business
case justifications of capital
projects.
Asset
Management
Steering
Committee
December 2019
Asset custodianship handover
procedures
Asset
Management
Steering
Committee
September 2019
Documented processes for
planning operations and
maintenance
Managers of
Assets
September 2019

- 37 -
Inner West Council Transport Asset Management Plan 2018
Documented procedures for
determining asset treatment and
replacement cost rates;
Managers of
Assets
September 2019
Analysis of asset failures,
considering causes and identifying
trends
Managers of
Assets
June 2020
11 Evaluation Review and improvement
processes
Managers of
Assets
December 2019
8.3 Monitoring and Review Procedures This asset management plan will be reviewed during annual budget planning processes and amended to show any material changes in service levels and/or resources available to provide those services as a result of budget decisions.
The AM Plan will be updated annually to ensure it represents the current service levels, asset values, asset knowledge data, projected operations, maintenance, capital renewal and replacement, capital upgrade/new and asset disposal expenditures and projected expenditure values incorporated into the long term financial plan.
The AM Plan has a life of 4 years and is due for complete revision and updating within the following year of each Inner West Council election.
8.4 Performance Measures The effectiveness of the asset management plan can be measured in the following ways:
The degree to which the required projected expenditures identified in this asset management plan are incorporated into the long term financial plan,
The degree to which 1-5 year detailed works programs, budgets, business plans and corporate structures take into account the ‘global’ works program trends provided by the asset management plan,
The degree to which the existing and projected service levels and service consequences (what we cannot do), risks and residual risks are incorporated into the Strategic Plan and associated plans,
The Asset Renewal Funding Ratio achieving the target of 1.0.
- 38 -
Inner West Council Transport Asset Management Plan 2018
9. REFERENCES
Institute of Public Works Engineering Australasia, 2006, ‘International Infrastructure Management Manual’, Institute of Public Works Engineering Australasia, Sydney, www.ipwea.org/IIMM
Institute of Public Works Engineering Australasia, 2008, ‘NAMS.PLUS Asset Management’, Institute of Public Works Engineering Australasia, Sydney, www.ipwea.org/namsplus.
Institute of Public Works Engineering Australasia, 2015, 2nd edn., ‘Australian Infrastructure Financial Management Manual’, Institute of Public Works Engineering Australasia, Sydney, www.ipwea.org/AIFMM.
Institute of Public Works Engineering Australasia, 2015, 3rd edn., ‘International Infrastructure Management Manual’, Institute of Public Works Engineering Australasia, Sydney, www.ipwea.org/IIMM
Institute of Public Works Engineering Australasia, 2012 LTFP Practice Note 6 PN Long Term Financial Plan, Institute of Public Works Engineering Australasia, Sydney
Inner West Council Community Strategic Plan, Our Inner West 2036.
10. APPENDICES
Appendix A Forward Capital Works Program – 4 years
Appendix B Budgeted Expenditure Accommodated in LTFP

- 39 -
Inner West Council Transport Asset Management Plan 2018
Appendix A: Forward Capital Works Program – 4 years
Capital Program – Footpaths, Roads and Traffic 2018/19 ($'000)
2019/20 ($'000)
2020/21 ($'000)
2021/22 ($'000)
Road Renewal – Haberfield, Ramsay Street
(Dalhousie St To Wattle St)
420
-
-
-
Road Renewal – Ashfield, Arthur St – Road Reconstruction
(Holden St to Milton St)
850
-
-
-
Road Renewal – Summer Hill, Dover St – Road Reconstruction 375 - - -
Road Renewal – Dulwich Hill, Keith Street
(Macarthur Pde to Wardell Rd)
320 - - -
Booth Street Bridge Annandale – Investigation, Design and Replacement 840 - - -
Chester Street Footbridge Annandale – Replacement 300 - - -
Lilyfield Road Lilyfield – Cycleway 1,500 2,375 - -
Bike Route LR18 (Marrickville Station to Dulwich Hill) – Construction 600 - - -
Bike Route LR03 (Livingstone Rd to Frazer St) – Construction 500 1,100 - -
Ashfield Town Centre Upgrade 295 1,000 - -
Gateway Treatments (Ashfield Town Centre) 480 - - -
Outdoor Dinning Embellishments (Ashfield Town Centre) 600 - - -
Urban Amenity Improvement Program (Various Projects Leichhardt) 930 6,718 16,678 -
New Ashfield Town Centre Public Toilet 100 300 - -
Regional Roads Renewal 425 850 860 1,000
Local Roads Renewal 4,139 5,294 5,289 5,248
Kerb & Gutter Renewal 544 400 405 370
Roadside Furniture 100 100 188 100
Footpaths Renewal 2,342 2,200 2,130 2,511
Footpaths Upgrade 65 250 260 144
Traffic and Parking Management 160 165 165 165
Traffic Facilities 2,056 1,178 366 992
Bridges – Capital - 35 - 375
Cycleways 625 2,275 3,545 5,726
Car Parks - Capital 260 35 180 285
Town Centres Upgrade 749 140 1,090 3,020
Total 19,575 24,415 31,156 19,936

- 40 -
Inner West Council Transport Asset Management Plan 2018
Appendix B: Budgeted Expenditures Accommodated in LTFP
Top Related