


Languages
Pages
Legal


TecnoLógicas
ISSN-p 0123-7799
ISSN-e 2256-5337
Vol. 21, No. 42, pp. 31-50
Mayo-agosto de 2018
© Copyright 2015 por
autores y Tecno Lógicas
Este trabajo está licenciado bajo una
Licencia Internacional Creative
Commons Atribución (CC BY)
Artículo de Investigación/Research Article
Transmission network expansion
planning considering weighted
transmission loading relief nodal
indexes
Planeación de la expansión de la red de
transmisión considerando índices nodales
ponderados de alivio de carga
Sergio D. Saldarriaga-Zuluaga1, Jesús M. López-Lezama2
y Fernando Villada-Duque3
Recibido: 23 de enero de 2018
Aceptado: 16 de abril de 2018
Cómo citar / How to cite
S. D. Saldarriaga-Zuluaga, J. M. López-Lezama, y F. Villada-Duque,
Transmission network expansion planning considering weighted
transmission loading relief nodal indexes. TecnoLógicas, vol. 21, no. 42,
pp. 31-50, 2018.
1 MSc. in Engineering, Facultad de Ingeniería, Institución Universitaria
Pascual Bravo, Medellín-Colombia, [email protected] 2 PhD. in Electrical Engineering, Departamento de Ingeniería Eléctrica,
Universidad de Antioquia, Medellín-Colombia, [email protected] 3 PhD. in Electrical Engineering , Departamento de Ingeniería Eléctrica,
Universidad de Antioquia, Medellín-Colombia, [email protected]

Transmission network expansion planning considering weighted transmission loading relief nodal indexes
[32] TecnoLógicas, ISSN-p 0123-7799 / ISSN-e 2256-5337, Vol. 21, No. 42, mayo-agosto de 2018, pp. 31-50
Abstract
This paper presents a model and a solution approach for the transmission network
expansion planning (TNEP) problem that integrates security constraints given by weighted
transmission loading relief (WTLR) indexes. Such indexes integrate shift and power
distribution factors and allow to measure the severity of overloads in normal conditions and
under any single contingency. Furthermore, the inclusion of small-scale generation was
considered as complementary to TNEP solutions. The proposed model was solved by means
of the metaheuristic NSGA-II (Non-dominated Sorting Genetic Algorithm II), which enabled
to find a set of solutions that represent a trade-off between the cost of the expansion plan
and its security level. Several tests were performed on the 6-bus Garver system and the
IEEE 24-bus reliability test system, thus showing the applicability of the proposed
approach. It was found that the inclusion of small-scale generation in strategic nodes allows
to reduce the cost of expansion plans and increases their level of security for single
contingencies.
Keywords
Genetic algorithms, security constraints, transmission network expansion planning.
Resumen
En este artículo se presenta un modelo y método de solución para el problema de la
expansión de la red de transmisión, que integra restricciones de seguridad dadas a través de
los índices nodales ponderados de alivio de carga en transmisión. Estos índices integran
factores de inyección y distribución de potencia que permiten estimar la severidad de
sobrecargas en condiciones normales y bajo contingencias simples. Adicionalmente, se ha
considerado la inclusión de generación a pequeña escala, como complementaria a las
soluciones del problema de expansión de la red de transmisión. El modelo propuesto es
solucionado mediante la metaheurística NSGA-II (Non-dominated Sorting Genetic
Algorithm II), permitiendo encontrar un conjunto de soluciones que representan un
compromiso entre el costo del plan de expansión y su nivel de seguridad. Se encontró que la
inclusión de generación a pequeña escala en nodos estratégicos permite reducir los costos de
los planes de expansión y aumenta sus niveles de seguridad ante contingencias simples.
Palabras clave
Algoritmos genéticos, restricciones de seguridad, planeamiento de la expansión de la
transmisión.
Transmission network expansion planning considering weighted transmission loading relief nodal indexes
TecnoLógicas, ISSN-p 0123-7799 / ISSN-e 2256-5337, Vol. 21, No. 42, mayo-agosto de 2018, pp. 31-50 [33]
NOMENCLATURE
The nomenclature used in the docu-
ment is provided here for quick reference.
Variables:
𝑓1, 𝑓1 Objective functions 1 and 2.
𝑤𝑙 New line 𝑙. 𝑧𝑘 New generator 𝑘.
𝐷𝑁𝐴𝑖 Unserved demand in node 𝑖 [MW].
𝑔𝑘𝑖 Active power supplied by genera-
tor 𝑘 connected at node 𝑖 [MW]. 𝜃𝑖 Phase angle in bus 𝑖 [rad].
𝑊𝑇𝐿𝑅𝑖 WTLR index for node 𝑖. 𝑁𝑣𝑖𝑜𝑙 Number of overloads in normal
operation and under contingen-
cies. 𝑂𝐿𝑠𝑦𝑠 Sum of all system overloads in
normal operation and under con-
tingencies [MW]. 𝑃𝐶𝑂𝑙 Overload of line 𝑙 in normal oper-
ation condition [MW]. 𝑃𝐶𝑂𝑙,𝑐 Overload in line 𝑙 under contin-
gency of line c [MW].
𝑓𝑐 Power flow on faulted line c (ini-
tial value) [MW].
𝑓𝑙𝑖𝑗 Power flow on line 𝑙 connected
between nodes 𝑖, 𝑗 in normal op-
eration condition [MW]. 𝑓𝑙𝑖𝑗,𝑐 Power flow on line 𝑙 connected
between nodes 𝑖, 𝑗 under contin-
gency 𝑐 [MW].
𝐼𝑆𝐹𝑙𝑖: Sensibility of load flow change in
line 𝑙 with respect to a power
injection in node 𝑖 in normal op-
eration condition.
𝐼𝑆𝐹𝑙,𝑐𝑖 : Sensibility of load flow change in
line 𝑙 with respect to a power
injection in node 𝑖 under contin-
gency of line 𝑐. 𝐿𝑂𝐷𝐹𝑙,𝑐 Sensibility of load flow change in
line 𝑙 under contingency 𝑐.
Parameters:
𝑑𝑖 Demand in bus 𝑖 [MW]. �̅�𝑘 Maximum active generation limit
of generator 𝑘[MW].
𝑐𝑙 Investment cost of line 𝑙 [$].
𝑐𝑘 Investment cost of generator 𝑘
[$].
𝑐𝑜𝑘 Operation cost of generator 𝑘
[$/MW].
𝑓�̅� Maximum active power flow limit
in line 𝑙 [MW].
𝑥𝑙𝑝𝑢
Reactance of line 𝑙 [p.u].
𝑆𝑏𝑎𝑠𝑒 Base power [MW].
�̅� Maximum phase angle [rad].
𝐶𝐷𝑁𝐴 Cost of non-attended demand
[$/MW].
Sets:
𝛺𝑏 Set of buses.
𝛺𝑙 Set of existent lines.
𝛺𝑔 Set of existent generators.
𝛺𝑙𝑛 Set of new lines.
𝛺𝑔𝑛 Set of new generators.
𝛺𝑐 Set of contingences.

Transmission network expansion planning considering weighted transmission loading relief nodal indexes
[34] TecnoLógicas, ISSN-p 0123-7799 / ISSN-e 2256-5337, Vol. 21, No. 42, mayo-agosto de 2018, pp. 31-50
1. INTRODUCTION
The transmission network expansion
planning (TNEP) problem consists in de-
termining the lowest cost of investment for
new transmission assets that must be in-
stalled in a power system to attend a fore-
casted demand within a given time horizon
[1]. The fact that TNEP has a long-lasting
impact on systems operation makes it one
of the main strategic decisions in power
systems. Furthermore, TNEP is a non-
convex, non-linear and multi-modal opti-
mization problem which, from a computa-
tional complexity point of view is cataloged
as NP-hard [2].
Several models and solution techniques
have been proposed in the specialized lit-
erature to approach the TNEP problem [3].
Heuristic [4], metaheuristic [5]-[6] and
exact methods [7]-[8] have been explored to
tackle the TNEP problem in its different
versions. Heuristic techniques are easy to
implement but rather often get trapped in
local optimal solutions. Metaheuristic
techniques are more refined search proce-
dures able to find better solutions than
common heuristic techniques, but at the
expense of higher computational time.
Finally, exact methods can guarantee the
achievement of optimal solutions but re-
quire a linearization of the problem, which
in most cases is a challenging task and
leads to neglect certain effects such us
reactive power requirements. A compre-
hensive review of the state of the art that
considers modeling, solving methods, inte-
gration of distributed generation, environ-
mental impacts and uncertainty issues
within TNEP can be consulted in [9]. Also,
a classification of several studies and mod-
els of transmission expansion planning is
presented in [10].
Currently, the growing levels of pene-
tration of renewable-based generation have
posed major challenges to TNEP. In [11],
the authors present a multi-objective ap-
proach for determining transmission ex-
pansion plans that considers the effect of
distributed generation (DG). In [12], the
authors consider different operating sce-
narios and wind power generation for
TNEP, including the optimal location of
thyristor controlled series components.
Other works that integrate DG into TNEP
are presented in [13] and [14].
Power system security is also an im-
portant issue when deciding which new
lines to add to an existing network. The
most common way to keep track of security
constraints is through the N-1 criterion,
which establishes that the power system
must continue to operate, within allowed
limits, after any single contingency takes
place. Several studies have been conducted
in this regard. In [15], the authors propose
a multi-objective approach to solve the
TNEP problem considering investment
costs and the N-1 security criterion. An
interior point method combined with a
metaheuristic technique is used to solve
the problem. In [16], the authors approach
the TNEP problem considering the N-1
security criterion and introducing energy
storage to provide the system with opera-
tional flexibility, deferring expansion in-
vestment and reduced costs. In [17], the
line outage distribution factors are used to
create a contingency identification index to
detect critical lines and incorporate the
eventual outage of such elements within
the TNEP problem. In [8], an exact method
is proposed to solve the TNEP problem
introducing a subset of credible contingen-
cies. In [18], the authors propose a Benders
decomposition approach to solve the TNEP
considering single contingencies. The
Bender cuts are used to decompose the
original problem into smaller sub-
problems. In general, the contingency
analysis to guarantee a robust expansion
plan increases the complexity of the TNEP.
This is confirmed by another work [19] in
which the authors are forced to reduce the
maximum number of lines in each branch
to only one and do not consider the possi-
bility of adding new lines in all corridors.
When considering security criteria, TNEP

Transmission network expansion planning considering weighted transmission loading relief nodal indexes
TecnoLógicas, ISSN-p 0123-7799 / ISSN-e 2256-5337, Vol. 21, No. 42, mayo-agosto de 2018, pp. 31-50 [35]
is usually solved in two phases [20]. In the
first one, the problem is approached ne-
glecting the effect of contingencies; in the
second, new lines are added every time a
contingency makes the system operation
unfeasible. The main drawback of this
approach is the fact that, when dividing
the optimization problem into two different
sub-problems, the optimality of the solu-
tion is not guaranteed. Consequently, the
problem must be modeled considering the
complete set of contingencies. This ap-
proach is developed in [8] by using mixed
integer linear programing (MILP) meth-
ods. Nevertheless, for medium and large
size power systems the time required to
solve a MILP problem increases exponen-
tially, which sometimes makes the inclu-
sion of security constraints intractable,
thus forcing planner engineers to develop
strategies in order to reduce the search
space. In this paper, we have approached
the TNEP problem with a metaheuristic
technique. These methods are well suited
for solving complex mathematical problems
and have been successfully applied to ap-
proach the TNEP problem as reported in
[21], [22] and [23]. Given the fact that
TNEP is represented by a multi-objective
optimization problem, the NSGA-II (Non-
dominated Sorting Genetic Algorithm II)
was implemented for its solution. This
algorithm has several characteristics that
make it suitable for multi-objective optimi-
zation, such as reduced computational
complexity for non-dominated sorting and
the use of elitism that speeds up its per-
formance. Also, the NSGA II does not use
additional parameters for preserving the
diversity of the solutions. This algorithm
has proven to be effective in tackling the
multi-objective TNEP problem as shown in
[15], [24] and [25].
Two conflicting planning objectives
have been considered in the proposed
TNEP model: the minimization of costs
and the maximization of security. The first
one considers the cost of adding new cir-
cuits and small-scale generators to the
system, while the second one consists in
guaranteeing a feasible operation under
both normal operating conditions and sin-
gle contingencies. The second objective is
modeled through the weighted transmis-
sion loading relief (WTLR) indexes pro-
posed in [26]. Note that none of the above-
mentioned studies use WTLR indexes to
account for contingencies. The novelty of
the proposed model lies on the use of such
indexes that are expressed in terms of shift
and power distribution factors. Including
such factors allows the model to implicitly
consider security constraints. Also, the
possibility of adding small-scale controlla-
ble generation units is considered. There-
fore, this paper aims to contribute to the
discussion of new TMEP modeling ap-
proaches. In summary, the main features
and contributions of this paper are the
following:
A new model for the TNEP problem,
that integrates security constraints (N-1
criterion) thought WTLR indexes, is
proposed.
A multi-objective algorithm was imple-
mented to solve the proposed model,
thus allowing to find trade-offs between
the costs of expansion plans and their
levels of security.
Furthermore, the possibility of intro-
ducing small-scale or distributed genera-
tion into the expansion plan was integrat-
ed in the model. The controllability of this
type of generation technologies plays a key
role in the security levels of the system; in
the case of non-controllable technologies,
there is no guarantee they contribute to
higher security levels due to the inherent
uncertainty of generation levels. In this
case, only controllable DG technologies
such as turbine gas, small hydo, reciprocat-
ing engines, and microturbines were con-
sidered. Under this assumption it is possi-
ble to reduce the number of transmission
assets required in the transmission plan
and contribute to higher security levels.
The remaining of this document is or-
ganized as follows. Section 3 presents the

Transmission network expansion planning considering weighted transmission loading relief nodal indexes
[36] TecnoLógicas, ISSN-p 0123-7799 / ISSN-e 2256-5337, Vol. 21, No. 42, mayo-agosto de 2018, pp. 31-50
mathematical formulation of the TNEP
considering WTLR indexes. Section 4 de-
scribes the metaheuristic method applied
to solve the proposed model. In Section 5,
several tests are performed using the
Garver system and the IEEE 24-bus relia-
bility test system. Finally, Section 6 pre-
sents the conclusions.
2. MATHEMATICAL FORMULATION
2.1 Objective functions
The objective functions considered in
the proposed model are given by (1) and
(2). The first objective function is composed
of five terms. The first two terms indicate
the cost of adding new transmission lines
and small-scale generators, respectively. In
this case, the binary variables wl and zk
are used to indicate the existence of new
transmission lines and generators, respec-
tively. The third and fourth terms indicate
the operating costs of existing and new
generators, respectively. The last term
indicates the cost of unserved demand.
Equation (2) represents the minimization
of the maximum absolute value of the
WTLR indexes, which are defined in the
next sub-section. Note that this forces
WTLR indexes to move towards zero. If
such indexes are zero, it means that no
overload is present, neither in the base
case nor under any contingency.
2.2 Constraints regarding WTLR indexes
computation
WTLR indexes are given by (3). Note
that these indexes are computed once wl
and zk are specified. The terms used to
compute the WTLR indexes are given by
(4)-(10) [26]. They indicate the approxi-
mate change in the total overload of the
system (in both, normal and contingency
states) that would result from a marginal
injection of 1MW in a given bus. Since they
are based on systems’ injection shift fac-
tors, WTLR indexes can take either posi-
tive or negative values. The receiving ends
of overloaded elements have negative
WTLR indexes, which indicates that inject-
ing power into these nodes produces coun-
ter flows that relieve the overload. Con-
versely, the emitting ends of overloaded
elements have positive indexes, which
indicates that injecting power into these
nodes would worsen the overload. To re-
duce overloads in both normal and under
contingency conditions, new elements must
be added to the existing transmission net-
work in such way that the magnitudes of
the WTLR indexes are reduced. That is to
say, if these indexes are equal to zero there
are no overloads, neither in normal opera-
tion nor under contingencies.
Equations (4) and (5) represent over-
load limits in lines for normal operation
condition. Note that the power flow limits
are considered not only for existing lines
but also for new ones. Equations (6) and (7)
represent overloads in power flow limits of
lines under contingency.
𝑀𝑖𝑛: 𝑓1 = ∑ 𝑐𝑙𝑤𝑙
𝑖𝑗𝜖𝛺𝑙𝑛
+ ∑ 𝑐𝑘𝑧𝑘 +
𝑘𝜖𝛺𝑔𝑛
∑ 𝑐𝑜𝑘𝑔𝑘𝑖𝑧𝑘
𝑘𝜖𝛺𝑔𝑛
+ ∑ 𝑐𝑜𝑘𝑔𝑘𝑖 + ∑ 𝐷𝑁𝐴𝑖𝐶𝐷𝑁𝐴𝑖
𝑖𝜖𝛺𝑏𝑘𝜖𝛺𝑔
(1)
𝑀𝑖𝑛: 𝑓2 = 𝑀𝐴𝑋𝑖𝜖𝛺𝑏
|𝑊𝑇𝐿𝑅𝑖| (2)

Transmission network expansion planning considering weighted transmission loading relief nodal indexes
TecnoLógicas, ISSN-p 0123-7799 / ISSN-e 2256-5337, Vol. 21, No. 42, mayo-agosto de 2018, pp. 31-50 [37]
In this case, overloads up to 120% of
the maximum capacity transmission limit
are allowed. This corresponds to a setting
selected by the authors; however, any oth-
er overload level can be considered. Equa-
tion (8) is used to compute the post-
contingency power flow of each line for
each contingency though the line’s outage
distribution factors (LODF). They repre-
sent the sensitivity of the change of power
flow in each line for each contingency.
Constraint (9) represents the injection
shift factor (ISF) of each line with respect
to each node for each contingency. A Thor-
ough description and details of the compu-
tation of LODF and ISF can be consulted
in [27] and [28], respectively. It is worth
mentioning that power flow limits are
taken into account but not enforced within
the proposed approach. This is because the
proposed expansion plans, as explained in
the Method section, represent the best
trade-offs between security and costs. If
system planners do not have an appropri-
ate budget available, they will have to set
up an expansion plan that would eventual-
ly result in post-contingency overloads.
The set of different expansion plans is
represented by an optimal Pareto front, on
which the system planner would be able to
choose a specific plan according to a given
budget. Equation (10) is used for the calcu-
lation of the total system overload. Note
that overloads are considered in the base
case and after contingencies.
𝑊𝑇𝐿𝑅𝑖 =𝑁𝑣𝑖𝑜𝑙
𝑂𝐿𝑠𝑦𝑠( ∑ 𝐼𝑆𝐹𝑙
𝑖𝑃𝐶𝑂𝑙
𝑙𝜖(𝛺𝑙∪𝛺𝑙𝑛)
+ ∑ ∑ 𝐼𝑆𝐹𝑙,𝑐𝑖 𝑃𝐶𝑂𝑙,𝑐
𝑐𝜖(𝛺𝑐)𝑙𝜖(𝛺𝑙∪𝛺𝑙𝑛)
) ; ∀𝑖 ∈ 𝛺𝑏 (3)
𝑃𝐶𝑂𝑙 = ∑ (𝑓𝑙𝑖𝑗 − 𝑓�̅�)
𝑙𝜖(𝛺𝑙∪𝛺𝑙𝑛)
↔ 𝑓𝑙𝑖𝑗 > 𝑓�̅�;
∀𝑙 ∈ (𝛺𝑙 ∪ 𝛺𝑙𝑛)
(4)
𝑃𝐶𝑂𝑙 = 0 ↔ 𝑓𝑙𝑖𝑗 ≤ 𝑓�̅�
∀𝑙 ∈ (𝛺𝑙 ∪ 𝛺𝑙𝑛) (5)
𝑃𝐶𝑂𝑙,𝑐 = ∑ (𝑓𝑙𝑖𝑗,𝑐 − 𝑓�̅�)
𝑙𝜖(𝛺𝑙∪𝛺𝑙𝑛)
↔ 𝑓𝑙𝑖𝑗,𝑐 > 1.2 ∗ 𝑓�̅�
∀𝑙 ∈ (𝛺𝑙 ∪ 𝛺𝑙𝑛), ∀𝑐 ∈ (𝛺𝑐)
(6)
𝑃𝐶𝑂𝑙,𝑐 = 0 ↔ 𝑓𝑙𝑖𝑗,𝑐 ≤ 1.2 ∗ 𝑓�̅�
∀𝑙 ∈ (𝛺𝑙 ∪ 𝛺𝑙𝑛), ∀𝑐 ∈ (𝛺𝑐) (7)
𝑓𝑙𝑖𝑗,𝑐 = 𝑓𝑙𝑖𝑗 + 𝐿𝑂𝐷𝐹𝑙,𝑐𝑓𝑐
∀𝑙 ∈ (𝛺𝑙 ∪ 𝛺𝑙𝑛), ∀𝑐 ∈ (𝛺𝑐) (8)
𝐼𝑆𝐹𝑙,𝑐
𝑖 = 𝐼𝑆𝐹𝑙𝑖 + 𝐿𝑂𝐷𝐹𝑙,𝑐𝐼𝑆𝐹𝑐
𝑖
∀𝑙 ∈ (𝛺𝑙 ∪ 𝛺𝑙𝑛), ∀𝑐 ∈ (𝛺𝑐) (9)
𝑂𝐿𝑠𝑦𝑠 = ∑ 𝑃𝐶𝑂𝑙
𝑙𝜖(𝛺𝑙∪𝛺𝑙𝑛)
+ ∑ ∑ 𝑃𝐶𝑂𝑙,𝑐
𝑙𝜖(𝛺𝑙∪𝛺𝑙𝑛)𝑐𝜖𝛺𝑐
∀𝑙 ∈ (𝛺𝑙 ∪ 𝛺𝑙𝑛) (10)
Transmission network expansion planning considering weighted transmission loading relief nodal indexes
[38] TecnoLógicas, ISSN-p 0123-7799 / ISSN-e 2256-5337, Vol. 21, No. 42, mayo-agosto de 2018, pp. 31-50
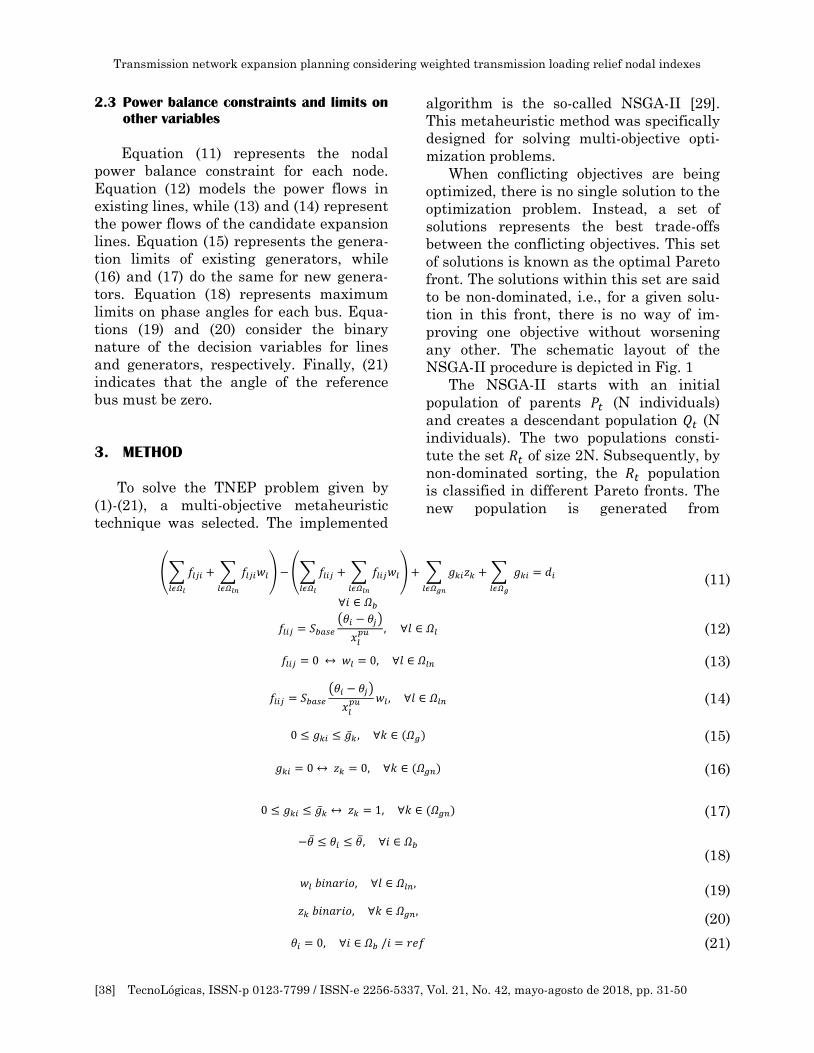
2.3 Power balance constraints and limits on
other variables
Equation (11) represents the nodal
power balance constraint for each node.
Equation (12) models the power flows in
existing lines, while (13) and (14) represent
the power flows of the candidate expansion
lines. Equation (15) represents the genera-
tion limits of existing generators, while
(16) and (17) do the same for new genera-
tors. Equation (18) represents maximum
limits on phase angles for each bus. Equa-
tions (19) and (20) consider the binary
nature of the decision variables for lines
and generators, respectively. Finally, (21)
indicates that the angle of the reference
bus must be zero.
3. METHOD
To solve the TNEP problem given by
(1)-(21), a multi-objective metaheuristic
technique was selected. The implemented
algorithm is the so-called NSGA-II [29].
This metaheuristic method was specifically
designed for solving multi-objective opti-
mization problems.
When conflicting objectives are being
optimized, there is no single solution to the
optimization problem. Instead, a set of
solutions represents the best trade-offs
between the conflicting objectives. This set
of solutions is known as the optimal Pareto
front. The solutions within this set are said
to be non-dominated, i.e., for a given solu-
tion in this front, there is no way of im-
proving one objective without worsening
any other. The schematic layout of the
NSGA-II procedure is depicted in Fig. 1
The NSGA-II starts with an initial
population of parents 𝑃𝑡 (N individuals)
and creates a descendant population 𝑄𝑡 (N
individuals). The two populations consti-
tute the set 𝑅𝑡 of size 2N. Subsequently, by
non-dominated sorting, the 𝑅𝑡 population
is classified in different Pareto fronts. The
new population is generated from
(∑ 𝑓𝑙𝑗𝑖
𝑙𝜖𝛺𝑙
+ ∑ 𝑓𝑙𝑗𝑖𝑤𝑙
𝑙𝜖𝛺𝑙𝑛
) − (∑ 𝑓𝑙𝑖𝑗
𝑙𝜖𝛺𝑙
+ ∑ 𝑓𝑙𝑖𝑗𝑤𝑙
𝑙𝜖𝛺𝑙𝑛
) + ∑ 𝑔𝑘𝑖𝑧𝑘 + ∑ 𝑔𝑘𝑖
𝑙𝜖𝛺𝑔𝑙𝜖𝛺𝑔𝑛
= 𝑑𝑖
∀𝑖 ∈ 𝛺𝑏
(11)
𝑓𝑙𝑖𝑗 = 𝑆𝑏𝑎𝑠𝑒
(𝜃𝑖 − 𝜃𝑗)
𝑥𝑙𝑝𝑢 , ∀𝑙 ∈ 𝛺𝑙 (12)
𝑓𝑙𝑖𝑗 = 0 ↔ 𝑤𝑙 = 0, ∀𝑙 ∈ 𝛺𝑙𝑛 (13)
𝑓𝑙𝑖𝑗 = 𝑆𝑏𝑎𝑠𝑒
(𝜃𝑖 − 𝜃𝑗)
𝑥𝑙𝑝𝑢 𝑤𝑙 , ∀𝑙 ∈ 𝛺𝑙𝑛 (14)
0 ≤ 𝑔𝑘𝑖 ≤ �̅�𝑘 , ∀𝑘 ∈ (𝛺𝑔) (15)
𝑔𝑘𝑖 = 0 ↔ 𝑧𝑘 = 0, ∀𝑘 ∈ (𝛺𝑔𝑛) (16)
0 ≤ 𝑔𝑘𝑖 ≤ �̅�𝑘 ↔ 𝑧𝑘 = 1, ∀𝑘 ∈ (𝛺𝑔𝑛) (17)
−�̅� ≤ 𝜃𝑖 ≤ �̅�, ∀𝑖 ∈ 𝛺𝑏
(18)
𝑤𝑙 𝑏𝑖𝑛𝑎𝑟𝑖𝑜, ∀𝑙 ∈ 𝛺𝑙𝑛,
(19)
𝑧𝑘 𝑏𝑖𝑛𝑎𝑟𝑖𝑜, ∀𝑘 ∈ 𝛺𝑔𝑛,
(20)
𝜃𝑖 = 0, ∀𝑖 ∈ 𝛺𝑏 /𝑖 = 𝑟𝑒𝑓 (21)

Transmission network expansion planning considering weighted transmission loading relief nodal indexes
TecnoLógicas, ISSN-p 0123-7799 / ISSN-e 2256-5337, Vol. 21, No. 42, mayo-agosto de 2018, pp. 31-50 [39]
Fig. 1. Schematic representation of the NSGA-II. Source: Adapted from [30].
Fig. 2. Flowchart of the implemented NSGA-II. Source: Author.
configurations of non-dominated fronts.
The population is built with the best form
of non-dominated solutions (F1), followed
by solutions in the second front (F2), and
so on.
A candidate solution to the TNEP prob-
lem is represented by a binary vector that
indicates whether a new element must be
added to the network. The length of the
vector corresponds to the number of candi-
date lines and generators. If a given posi-
tion of the vector is zero, it indicates that
the corresponding element was not select-
ed in the expansion plan. The flowchart of
the implemented NSGA-II is depicted in
Fig. 2. Given an initial set of randomly
generated candidate solutions, their objec-
tive functions are calculated, and the con-
cept of dominance is applied to classify the
solutions (non-dominated sorting). The
initial population of candidate solutions
must go through the stages of tournament

Transmission network expansion planning considering weighted transmission loading relief nodal indexes
[40] TecnoLógicas, ISSN-p 0123-7799 / ISSN-e 2256-5337, Vol. 21, No. 42, mayo-agosto de 2018, pp. 31-50
selection, crossover and mutation to gener-
ate a new set of solutions. Then, a non-
dominated sorting of the combined popula-
tion is carried out as illustrated in Fig. 1.
The procedure is repeated until a maxi-
mum number of iterations is reached. A
detailed description of the implementation
the NSGA-II can be consulted in [31] and
[32].
4. TESTS AND RESULTS
In order to show the applicability of the
proposed approach, several tests were
performed with two benchmark power
systems: the Gaver system and IEEE 24-
bus reliability test system. The data of
both systems can be consulted in [33] and
[34], respectively. Two scenarios were ana-
lyzed for each system. Scenario 1 considers
high investment costs in transmission
lines, as given in [35]; Scenario 2 considers
low investment costs in transmission lines,
as presented in [36]. Power flows were
computed using Matpower software [37].
Three types of generators (10, 20 and
30MW) were considered as additional can-
didates to be included in TNEP in all load
buses. The investment cost of generators
was considered to be 1MillionUSD/MW.
The results and analysis of the selected
test cases are provided below.
4.1 Tests with the Garver system
This system has 6 buses, 6 existing
lines, 2 generators and 5 loads that add up
to a forecasted demand of 670MW [33]. Bus
6 is not initially connected to the network
and its load must be supplied by the ex-
pansion plan. All possible combinations of
corridors, with maximum 2 new lines per
corridor among the 6 buses, are considered.
To adjust the parameters of the NSGA-
II, several tests were conducted until the
algorithm was able to find high-quality
solutions. The best solutions were found
using a population of 30 individuals with
100 generations and crossover and muta-
tion rates of 90% and 10%, respectively.
The NSGA-II provides a set of optimal
solutions instead of a single one. For Sce-
nario 1 (considering high costs of transmis-
sion lines given in [35]), the algorithm
found 12 expansion plans marked as dots
in Fig. 3. A reduction of the WTLR indexes
is related to a more secure system. Note
that higher security levels imply
Fig. 3. Optimal Pareto front for the Garver system. Scenario 1. Source: Authors.

Transmission network expansion planning considering weighted transmission loading relief nodal indexes
TecnoLógicas, ISSN-p 0123-7799 / ISSN-e 2256-5337, Vol. 21, No. 42, mayo-agosto de 2018, pp. 31-50 [41]
Fig. 4. Expansion plan with WTLR≈0 and an investment cost of 270 M$. Scenario 1. Source: Authors.
higher investment costs and vice versa. It
can be noted that the minimum investment
that guarantees WTLR indexes approxi-
mately equal to zero (no overloads in nor-
mal conditions or under contingencies) is
270MUSD$. Higher investments would
only marginally improve the security level
of the system. This particular solution is
illustrated in Fig. 4. The new elements
incorporated into the system are indicated
with dashed lines.
It can be noted in Fig. 4 that no trans-
mission lines are needed to serve the ex-
pected demand in Bus 6. Instead, this de-
mand is locally met by new generation.
Also, only three new lines are considered in
the expansion plan. Details of the expan-
sion plan depicted in Fig.4 are presented in
Table 1. The first column indicates the new
transmission lines, which are labeled with
the number of the nodes they interconnect.
The second column indicates the new gen-
erators. In this case, the label Bus (MW)
indicates the location and size of the gen-
erator being proposed. For example, N1(30)
means that a generator of 30MW is pro-
posed in Bus 1. Note that several genera-
tion units of different capacities can be
assigned to a given bus.
When Scenario 2 is considered (low cost
of transmission lines as given in [36]), a
new set of optimal solutions is obtained.
The Pareto optimal front for Scenario 2 is
depicted in Fig. 5. Note that, in this case
the minimum investment cost for a secure
operation is 195MUSD$. This particular
solution is illustrated in Fig 6, in which
new elements are drawn as dashed lines.
The details of this transmission plan are
presented in Table 2.
Table 1. Expansion plan depicted in Fig.4.
Source: Authors’ own work.
Transmission
lines
Generators
Bus(MW)
L1-5, L2-3, L2-3
N2(20), N3(10), N3(20),
N3(30), N4(10), N4(30),
N5(30), N6(10), N6(20),
N6(30)
Table 2. Expansion plan depicted in Fig.6.
Source: Authors’ own work.
Transmission
lines
Generators
Bus(MW)
L1-3, L1-6, L2-
3, L2-6, L2-6,
L3-5
N2(20), N3(20),
N4(20), N4(30),
N5(30), N6(30)

Transmission network expansion planning considering weighted transmission loading relief nodal indexes
[42] TecnoLógicas, ISSN-p 0123-7799 / ISSN-e 2256-5337, Vol. 21, No. 42, mayo-agosto de 2018, pp. 31-50
Fig. 5. Optimal Pareto front for the Garver system. Scenario 2. Source: Authors.
Fig. 6. Expansion plan with WTLR≈0 and investment cost of 195 MUSD$. Scenario 2. Source: Authors’ own work.
As expected, more transmission lines
are considered in the solution for Scenario
2. In that case, 6 new transmission lines
are proposed, in contrast with only 3 for
Scenario 1. Furthermore, less generation is
needed (see Table 2) and Bus 6 is now
interconnected with the rest of the system
(see Fig. 6).
4.2 Tests with the IEEE 24-bus reliability test
system
This system comprises 24 buses, 38
lines, and 17 load buses that add up to a
future demand of 8,550MW. To carry out
the tests with the proposed algorithm, all
existing corridors plus 7 more as indicated
in [33] were considered. In this system, up
Transmission network expansion planning considering weighted transmission loading relief nodal indexes
TecnoLógicas, ISSN-p 0123-7799 / ISSN-e 2256-5337, Vol. 21, No. 42, mayo-agosto de 2018, pp. 31-50 [43]
to 2 additional lines per corridor can be
installed. In addition, the possibility of
adding small-scale generation in all load
buses was also taken into account. The size
and cost of new generators is the same as
previously indicated for the Garver system.
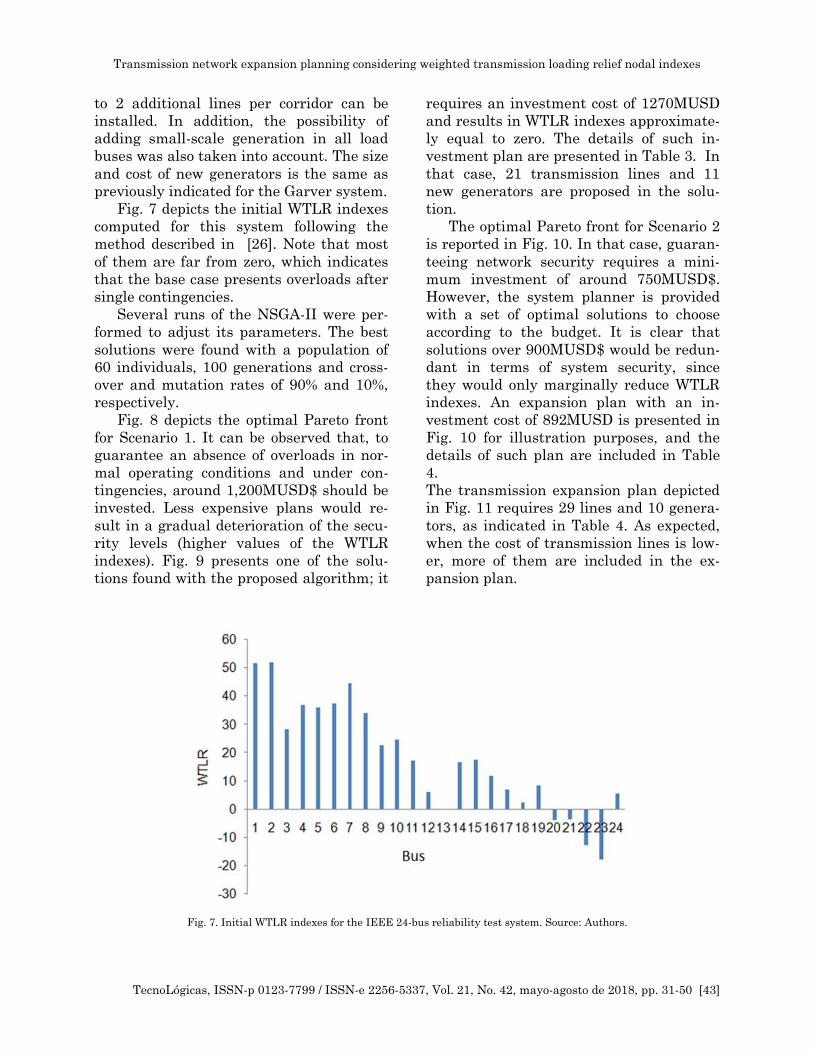
Fig. 7 depicts the initial WTLR indexes
computed for this system following the
method described in [26]. Note that most
of them are far from zero, which indicates
that the base case presents overloads after
single contingencies.
Several runs of the NSGA-II were per-
formed to adjust its parameters. The best
solutions were found with a population of
60 individuals, 100 generations and cross-
over and mutation rates of 90% and 10%,
respectively.
Fig. 8 depicts the optimal Pareto front
for Scenario 1. It can be observed that, to
guarantee an absence of overloads in nor-
mal operating conditions and under con-
tingencies, around 1,200MUSD$ should be
invested. Less expensive plans would re-
sult in a gradual deterioration of the secu-
rity levels (higher values of the WTLR
indexes). Fig. 9 presents one of the solu-
tions found with the proposed algorithm; it
requires an investment cost of 1270MUSD
and results in WTLR indexes approximate-
ly equal to zero. The details of such in-
vestment plan are presented in Table 3. In
that case, 21 transmission lines and 11
new generators are proposed in the solu-
tion.
The optimal Pareto front for Scenario 2
is reported in Fig. 10. In that case, guaran-
teeing network security requires a mini-
mum investment of around 750MUSD$.
However, the system planner is provided
with a set of optimal solutions to choose
according to the budget. It is clear that
solutions over 900MUSD$ would be redun-
dant in terms of system security, since
they would only marginally reduce WTLR
indexes. An expansion plan with an in-
vestment cost of 892MUSD is presented in
Fig. 10 for illustration purposes, and the
details of such plan are included in Table
4.
The transmission expansion plan depicted
in Fig. 11 requires 29 lines and 10 genera-
tors, as indicated in Table 4. As expected,
when the cost of transmission lines is low-
er, more of them are included in the ex-
pansion plan.
Fig. 7. Initial WTLR indexes for the IEEE 24-bus reliability test system. Source: Authors.

Transmission network expansion planning considering weighted transmission loading relief nodal indexes
[44] TecnoLógicas, ISSN-p 0123-7799 / ISSN-e 2256-5337, Vol. 21, No. 42, mayo-agosto de 2018, pp. 31-50
Fig. 8. Optimal Pareto front for the IEEE 24-bus reliability test system. Scenario 1. Source: Authors.
Fig. 9. Expansion plan with WTLR≈0 and investment cost of 1,270MUSD$. Scenario 1. Source: Authors.
Transmission network expansion planning considering weighted transmission loading relief nodal indexes
TecnoLógicas, ISSN-p 0123-7799 / ISSN-e 2256-5337, Vol. 21, No. 42, mayo-agosto de 2018, pp. 31-50 [45]
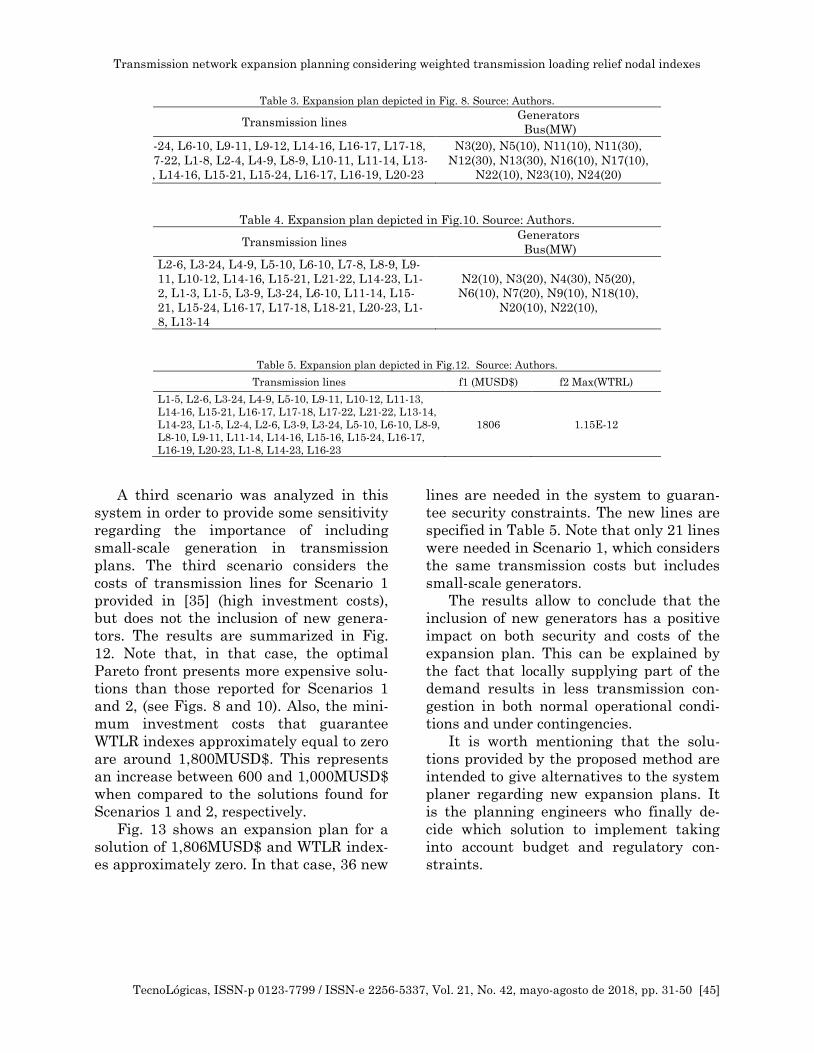
Table 3. Expansion plan depicted in Fig. 8. Source: Authors.
Transmission lines Generators
Bus(MW)
L3-24, L6-10, L9-11, L9-12, L14-16, L16-17, L17-18,
L17-22, L1-8, L2-4, L4-9, L8-9, L10-11, L11-14, L13-
23, L14-16, L15-21, L15-24, L16-17, L16-19, L20-23
N3(20), N5(10), N11(10), N11(30),
N12(30), N13(30), N16(10), N17(10),
N22(10), N23(10), N24(20)
Table 4. Expansion plan depicted in Fig.10. Source: Authors.
Transmission lines Generators
Bus(MW)
L2-6, L3-24, L4-9, L5-10, L6-10, L7-8, L8-9, L9-
11, L10-12, L14-16, L15-21, L21-22, L14-23, L1-
2, L1-3, L1-5, L3-9, L3-24, L6-10, L11-14, L15-
21, L15-24, L16-17, L17-18, L18-21, L20-23, L1-
8, L13-14
N2(10), N3(20), N4(30), N5(20),
N6(10), N7(20), N9(10), N18(10),
N20(10), N22(10),
Table 5. Expansion plan depicted in Fig.12. Source: Authors.
Transmission lines f1 (MUSD$) f2 Max(WTRL)
L1-5, L2-6, L3-24, L4-9, L5-10, L9-11, L10-12, L11-13,
L14-16, L15-21, L16-17, L17-18, L17-22, L21-22, L13-14,
L14-23, L1-5, L2-4, L2-6, L3-9, L3-24, L5-10, L6-10, L8-9,
L8-10, L9-11, L11-14, L14-16, L15-16, L15-24, L16-17,
L16-19, L20-23, L1-8, L14-23, L16-23
1806 1.15E-12
A third scenario was analyzed in this
system in order to provide some sensitivity
regarding the importance of including
small-scale generation in transmission
plans. The third scenario considers the
costs of transmission lines for Scenario 1
provided in [35] (high investment costs),
but does not the inclusion of new genera-
tors. The results are summarized in Fig.
12. Note that, in that case, the optimal
Pareto front presents more expensive solu-
tions than those reported for Scenarios 1
and 2, (see Figs. 8 and 10). Also, the mini-
mum investment costs that guarantee
WTLR indexes approximately equal to zero
are around 1,800MUSD$. This represents
an increase between 600 and 1,000MUSD$
when compared to the solutions found for
Scenarios 1 and 2, respectively.
Fig. 13 shows an expansion plan for a
solution of 1,806MUSD$ and WTLR index-
es approximately zero. In that case, 36 new
lines are needed in the system to guaran-
tee security constraints. The new lines are
specified in Table 5. Note that only 21 lines
were needed in Scenario 1, which considers
the same transmission costs but includes
small-scale generators.
The results allow to conclude that the
inclusion of new generators has a positive
impact on both security and costs of the
expansion plan. This can be explained by
the fact that locally supplying part of the
demand results in less transmission con-
gestion in both normal operational condi-
tions and under contingencies.
It is worth mentioning that the solu-
tions provided by the proposed method are
intended to give alternatives to the system
planer regarding new expansion plans. It
is the planning engineers who finally de-
cide which solution to implement taking
into account budget and regulatory con-
straints.

Transmission network expansion planning considering weighted transmission loading relief nodal indexes
[46] TecnoLógicas, ISSN-p 0123-7799 / ISSN-e 2256-5337, Vol. 21, No. 42, mayo-agosto de 2018, pp. 31-50
Fig. 10. Optimal Pareto front for the IEEE 24-bus reliability test system. Scenario 2. Source: Authors.
Fig. 11. Expansion plan with WTLR≈0 and investment cost of 892 MUSD$. Scenario 2. Source: Authors.

Transmission network expansion planning considering weighted transmission loading relief nodal indexes
TecnoLógicas, ISSN-p 0123-7799 / ISSN-e 2256-5337, Vol. 21, No. 42, mayo-agosto de 2018, pp. 31-50 [47]
Fig. 12. Optimal Pareto front for the IEEE 24-bus reliability test system. Scenario 3. Source: Authors.
Fig. 13. Expansion plan with WTLR≈0 and Investment cost of 1,806MUSD$. Scenario 3.
Source: Authors.

Transmission network expansion planning considering weighted transmission loading relief nodal indexes
[48] TecnoLógicas, ISSN-p 0123-7799 / ISSN-e 2256-5337, Vol. 21, No. 42, mayo-agosto de 2018, pp. 31-50
5. CONCLUSIONS
In this paper an optimization model
and solution method were presented to
approach the TNEP problem to minimize
investment costs and improve network
security. The main contribution of this
work lies in the use of WTLR nodal index-
es, which are expressed as functions of
power distribution factors. Such indexes
not only measure the level of network se-
curity but also identify the most sensitive
buses to power injections in terms of post-
contingency power flows. In this work,
WRLR indexes were used for the double
function of diagnosing the system in terms
of congestion and guiding the NSGA-II to
find better solution proposals. Further-
more, small-scale generators were also
included as candidate solutions in expan-
sion plans.
The proposed technique allows to find a
set of solutions with different costs and
security levels from which the planner can
decide depending on the available budget.
Several tests on two benchmark power
systems showed the applicability and effec-
tiveness of the proposed approach. The
inclusion of small-scale generation was
found to have a positive effect on transmis-
sion expansion plans; it allows to reduce
the required number of new lines and con-
tributes to higher security levels. Future
work will include a more detailed modeling
of generation technologies (such as photo-
voltaic and wind generation) considered in
the expansion plans.
6. ACKNOWLEDGMENTS
The authors would like to acknowledge
the University of Antioquia for the support
provided by “Proyecto de Sostenibilidad”
and Colciencias Project 111574554929.
7. REFERENCES
[1] X. Han, L. Zhao, J. Wen, X. Ai, J. Liu, and D.
Yang, “Transmission network expansion
planning considering the generators’
contribution to uncertainty accommodation,”
CSEE J. Power Energy Syst., vol. 3, no. 4, pp.
450–460, 2017.
[2] A. H. Domínguez, A. H. Escobar, and R. A.
Gallego, “An MILP model for the static
transmission expansion planning problem
including HVAC/HVDC links, security
constraints and power losses with a reduced
search space,” Electr. Power Syst. Res., vol.
143, pp. 611–623, Feb. 2017.
[3] S. Lumbreras and A. Ramos, “The new
challenges to transmission expansion
planning. Survey of recent practice and
literature review,” Electr. Power Syst. Res.,
vol. 134, pp. 19–29, May 2016.
[4] A. Monticelli, A. Santos, M. F. Pereira, S.
Cunha, B. Parker, and J. G. Praca,
“Interactive Transmission Network Planning
Using a Least-Effort Criterion,” IEEE Trans.
Power Appar. Syst., vol. PAS-101, no. 10, pp.
3919–3925, Oct. 1982.
[5] A. H. Escobar, R. A. Gallego, and R. Romero,
“Multistage and Coordinated Planning of the
Expansion of Transmission Systems,” IEEE
Trans. Power Syst., vol. 19, no. 2, pp. 735–
744, May 2004.
[6] J. A. López-López, D. A. Tejada-Arango, and
J. M. López-Lezama, “Planeamiento AC de la
expansión de la red de transmisión
considerando repotenciación de circuitos y
ubicación de capacitores,” TecnoLógicas, vol.
19, no. 37, pp. 61–77, 2016.
[7] D. Tejada, J. M. López-Lezama, M. J. Rider,
and G. Vinasco, “Transmission network
expansion planning considering repowering
and reconfiguration,” Int. J. Electr. Power
Energy Syst., vol. 69, pp. 213–221, Jul. 2015.
[8] G. Vinasco, D. Tejada, E. F. Da Silva, and M.
J. Rider, “Transmission network expansion
planning for the Colombian electrical
system: Connecting the Ituango
hydroelectric power plant,” Electr. Power
Syst. Res., vol. 110, pp. 94–103, May 2014.
[9] R. Hemmati, R.-A. Hooshmand, and A.
Khodabakhshian, “State-of-the-art of
transmission expansion planning:
Comprehensive review,” Renew. Sustain.
Energy Rev., vol. 23, pp. 312–319, Jul. 2013.
[10] G. Latorre, R. D. Cruz, J. M. Areiza, and A.
Villegas, “Classification of publications and
models on transmission expansion planning,”
IEEE Trans. Power Syst., vol. 18, no. 2, pp.
938–946, May 2003.

Transmission network expansion planning considering weighted transmission loading relief nodal indexes
TecnoLógicas, ISSN-p 0123-7799 / ISSN-e 2256-5337, Vol. 21, No. 42, mayo-agosto de 2018, pp. 31-50 [49]
[11] J. H. Zhao, J. Foster, Z. Y. Dong, and K. P.
Wong, “Flexible Transmission Network
Planning Considering Distributed
Generation Impacts,” IEEE Trans. Power
Syst., vol. 26, no. 3, pp. 1434–1443, Aug.
2011.
[12] O. Ziaee, O. Alizadeh-Mousavi, and F. F.
Choobineh, “Co-Optimization of
Transmission Expansion Planning and
TCSC Placement Considering the
Correlation Between Wind and Demand
Scenarios,” IEEE Trans. Power Syst., vol. 33,
no. 1, pp. 206–215, Jan. 2018.
[13] J. Qiu, J. Zhao, D. Wang, and Z. Y. Dong,
“Decomposition-based approach to risk-
averse transmission expansion planning
considering wind power integration,” IET
Gener. Transm. Distrib., vol. 11, no. 14, pp.
3458–3466, Sep. 2017.
[14] E. Sauma, C. Muñoz, J. Aguado, J.
Contreras, and S. D. La Torre, “Impact of
high wind power penetration on
transmission network expansion planning,”
IET Gener. Transm. Distrib., vol. 6, no. 12,
pp. 1281–1291, Dec. 2012.
[15] C. A. Correa, R. Bolanos, A. Sanchez, A.
Garces, and A. Molina, “Multiobjective
transmission planning with security
constraints,” in Eurocon 2013, 2013, pp.
1215–1221.
[16] E. B. Obio and J. Mutale, “A comparative
analysis of energy storage and N-1 network
security in transmission expansion
planning,” in 2015 50th International
Universities Power Engineering Conference
(UPEC), 2015, pp. 1–6.
[17] M. Majidi-Qadikolai and R. Baldick,
“Integration of Contingency Analysis With
Systematic Transmission Capacity
Expansion Planning: ERCOT Case Study,”
IEEE Trans. Power Syst., vol. 31, no. 3, pp.
2234–2245, May 2016.
[18] O. Alizadeh-Mousavi and M. Zima-
Bočkarjova, “Efficient Benders cuts for
transmission expansion planning,” Electr.
Power Syst. Res., vol. 131, pp. 275–284, Feb.
2016.
[19] H. Zhang, V. Vittal, G. T. Heydt, and J.
Quintero, “A Mixed-Integer Linear
Programming Approach for Multi-Stage
Security-Constrained Transmission
Expansion Planning,” IEEE Trans. Power
Syst., vol. 27, no. 2, pp. 1125–1133, May
2012.
[20] A. M. Leite da Silva, M. R. Freire, and L. M.
Honório, “Transmission expansion planning
optimization by adaptive multi-operator
evolutionary algorithms,” Electr. Power Syst.
Res., vol. 133, pp. 173–181, Apr. 2016.
[21] A. M. L. da Silva, F. A. de Assis, L. A. F.
Manso, M. R. Freire, and S. A. Flavio,
“Constructive metaheuristics applied to
transmission expansion planning with
security constraints,” in 2017 19th
International Conference on Intelligent
System Application to Power Systems (ISAP),
2017, pp. 1–7.
[22] A. M. Leite da Silva, L. S. Rezende, L. M.
Honório, and L. A. F. Manso, “Performance
comparison of metaheuristics to solve the
multi-stage transmission expansion planning
problem,” IET Gener. Transm. Distrib., vol.
5, no. 3, p. 360, 2011.
[23] L. A. Gallego, L. P. Garcés, M. Rahmani, and
R. A. Romero, “High-performance hybrid
genetic algorithm to solve transmission
network expansion planning,” IET Gener.
Transm. Distrib., vol. 11, no. 5, pp. 1111–
1118, Mar. 2017.
[24] A. Arabali, M. Ghofrani, M. Etezadi-Amoli,
M. S. Fadali, and M. Moeini-Aghtaie, “A
Multi-Objective Transmission Expansion
Planning Framework in Deregulated Power
Systems With Wind Generation,” IEEE
Trans. Power Syst., vol. 29, no. 6, pp. 3003–
3011, Nov. 2014.
[25] Yuan Hu, Zhaohong Bie, Gengfeng Li, and
Tao Ding, “Application of improved point
estimate method on multi-objective
transmission network expansion planning,”
in 2016 IEEE PES Asia-Pacific Power and
Energy Engineering Conference (APPEEC),
2016, pp. 1038–1042.
[26] S. Grijalva and A. M. Visnesky, “The Effect
of Generation on Network Security: Spatial
Representation, Metrics, and Policy,” IEEE
Trans. Power Syst., vol. 21, no. 3, pp. 1388–
1395, Aug. 2006.
[27] T. Guler, G. Gross, and L. Minghai,
“Generalized Line Outage Distribution
Factors,” IEEE Trans. Power Syst., vol. 22,
no. 2, pp. 879–881, May 2007.
[28] Y. C. Chen, S. V Dhople, A. D. Dominguez-
Garcia, and P. W. Sauer, “Generalized
Injection Shift Factors,” IEEE Trans. Smart
Grid, vol. 8, no. 5, pp. 2071–2080, Sep. 2017.
[29] K. Deb, A. Pratap, S. Agarwal, and T.
Meyarivan, “A fast and elitist multiobjective
genetic algorithm: NSGA-II,” IEEE Trans.
Evol. Comput., vol. 6, no. 2, pp. 182–197,
Apr. 2002.
[30] L. F. Rojas-Ríos, J. M. López-Lezama, and N.
Muñoz-Galeano, “Asignación Óptima de
Presupuesto para Mejoramiento de la
Calidad del Servicio en Sistemas de
Distribución usando Algoritmo Genético No-
Dominado II (NSGA-II) y un Algoritmo
Memético,” Inf. tecnológica, vol. 27, no. 1, pp.
115–126, 2016.

Transmission network expansion planning considering weighted transmission loading relief nodal indexes
[50] TecnoLógicas, ISSN-p 0123-7799 / ISSN-e 2256-5337, Vol. 21, No. 42, mayo-agosto de 2018, pp. 31-50
[31] F. Ugranlı and E. Karatepe, “Multi-objective
transmission expansion planning considering
minimization of curtailed wind energy,” Int.
J. Electr. Power Energy Syst., vol. 65, pp.
348–356, Feb. 2015.
[32] C. A. Correa Florez, R. A. Bolaños Ocampo,
and A. H. Escobar Zuluaga, “Multi-objective
transmission expansion planning considering
multiple generation scenarios,” Int. J. Electr.
Power Energy Syst., vol. 62, pp. 398–409,
Nov. 2014.
[33] L. Garver, “Transmission Network
Estimation Using Linear Programming,”
IEEE Trans. Power Appar. Syst., vol. PAS-
89, no. 7, pp. 1688–1697, Sep. 1970.
[34] C. Grigg et al., “The IEEE Reliability Test
System-1996. A report prepared by the
Reliability Test System Task Force of the
Application of Probability Methods
Subcommittee,” IEEE Trans. Power Syst.,
vol. 14, no. 3, pp. 1010–1020, 1999.
[35] R. Romero, C. Rocha, J. R. S. Mantovani, and
I. G. Sanchez, “Constructive heuristic
algorithm for the DC model in network
transmission expansion planning,” IEE Proc.
- Gener. Transm. Distrib., vol. 152, no. 2, pp.
277–282, 2005.
[36] B. Alizadeh and S. Jadid, “Reliability
constrained coordination of generation and
transmission expansion planning in power
systems using mixed integer programming,”
IET Gener. Transm. Distrib., vol. 5, no. 9, pp.
948–960, 2011.
[37] R. D. Zimmerman, C. E. Murillo-Sanchez,
and R. J. Thomas, “MATPOWER: Steady-
State Operations, Planning, and Analysis
Tools for Power Systems Research and
Education,” IEEE Trans. Power Syst., vol.
26, no. 1, pp. 12–19, Feb. 2011.
Top Related