


Languages
Pages
Legal

Planning Act 2008
Infrastructure Planning (Applications: Prescribed Forms and Procedure)
Regulations 2009
Regulation Number: Regulation 5(2)(o)
Author: Jacobs
Document Reference: TR010007/APP/23.6
Revision Date Description
0 8 Jan 2014 Application Issue
Traffic Forecasting Report
A160/A180 Port of Immingham Improvement

[Page not used]

Glossary
AADT - ANNUAL AVERAGE DAILY TRAFFIC
AAWT - ANNUAL AVERAGE WEEKDAY TRAFFIC
ABP – ASSOCIATION OF BRITISH PORTS
ARCADY – SOFTWARE FOR ASSESSMENT OF ROUNDABOUT CAPACITY
ATC – AUTOMATIC TRAFFIC COUNT
DFT – DEPARTMENT FOR TRANSPORT
DM – DO MINIMUM (WITHOUT SCHEME)
DMRB – DESIGN MANUAL FOR ROADS AND BRIDGES
DS – DO SOMETHING (WITH SCHEME)
GDP – GROSS DOMESTIC PRODUCT
GEH - STATISTICAL COMPARISON OF TWO NUMBERS
GFA – GROSS FLOOR AREA
HGV – HEAVY GOODS VEHICLE (OGV1 AND OGV2)
LGV – LIGHT GOODS VEHICLE
MCC – MANUAL CLASSIFIED COUNT
MCTC – MANUAL CLASSIFIED TURNING COUNT
NMU – NON MOTORISED USER
NTEM – NATIONAL TRIP END MODEL
NTM – NATIONAL TRAFFIC MODEL
OGV – ORDINARY GOODS VEHICLE
PCF – PROJECT CONTROL FRAMEWORK
PCU – PASSENGER CAR UNIT
PICADY – SOFTWARE FOR ASSESSMENT OF CAPACITY OF PRIORITY JUNCTIONS
PPK – PENCE PER KILOMETER
PPM – PENCE PER MILE
RSI – ROAD SIDE INTERVIEW
SHB – SOUTH HUMBER BANK
TA – TRANSPORT ASSESSMENT
TEMPRO – TRIP END MODEL ASSESSMENT PROGRAMME
TRADS – TRAFFIC FLOW DATA SYSTEM
TRICS – TRIP RATE INFORMATION COMPUTER SYSTEM
TRL – TRANSPORT RESEARCH LABORATORY
WEBTAG – INTERNET BASED TRANSPORT APPRAISAL GUIDANCE

[Page not used
CONTENTS
1 INTRODUCTION .......................................................................................................... 7
2 OVERVIEW OF CURRENT BASE YEAR MODELS ................................................... 11
3 SUMMARY OF PREVIOUS FORECASTING WORK ................................................. 14
4 DEVELOPMENT OF 2012 INTERIM FORECAST MODEL ........................................ 15
5 FORECASTING AND MODELLING FUTURE YEAR TRAVEL ................................... 19
6 CORE TEMPRO SCENARIO ..................................................................................... 28
7 CORE SCENARIO ..................................................................................................... 38
8 CORE SCENARIO - FUTURE YEAR FORECASTS ................................................... 42
9 HIGH AND LOW SENSITIVITY TEST RESULTS ....................................................... 48
10 SUMMARY AND CONCLUSION ................................................................................ 54
FIGURES
Figure 1.1 - Location of A160 ............................................................................................ 7 Figure 1.2 - Plan of Key Locations and Features of A160 Scheme .................................... 8 Figure 1.3 - Plan Indicating Proposed Layout for A160 Scheme ...................................... 10 Figure 4.1 - MCTC and MCC Sites Used in the Creation of 2012 Matrices ...................... 16 Figure 5.1 - Forecast Core TEMPRO Methodology (Cars) Flow Chart ............................ 26 TABLES
Table 4.1 - 2012 Matrix Validation Results ...................................................................... 18 Table 5.1 – PPM and PPK Values ................................................................................... 22 Table 5.2 - Classification of Future Inputs ....................................................................... 23 Table 5.3 - NTM 2011 Factors ......................................................................................... 27 Table 6.1 - Default TEMPRO 6.2 Planning Assumptions 2012 to 2031 ........................... 28 Table 6.2 - Adjusted TEMPRO 6.2 Planning Assumptions 2012 to 2031 ......................... 30 Table 6.3 - Fuel & Income Factors .................................................................................. 30 Table 6.4 - Development Site Trip Generation (Total Vehicles) ....................................... 32 Table 6.5 - Scunthorpe Gravity Model Distribution by Population Area ............................ 34 Table 6.6 - AM Peak Core TEMPRO Matrix Totals. ......................................................... 36 Table 6.7 - Inter Peak Core TEMPRO Matrix Totals ........................................................ 36 Table 6.8 - PM Peak Core TEMPRO Matrix Totals .......................................................... 36 Table 6.9 - 12 Hr AAWT Model Conversion Factors ........................................................ 37 Table 6.10 - 12hr AAWT to 16hr, 18hr and 24hr AAWT and AADT Conversion Factors .. 37 Table 7.1 - Able Development Trip Totals ....................................................................... 38 Table 7.2 - Additional Port Growth Trip Totals ................................................................. 39 Table 7.3 - AM Peak Core Matrix Totals .......................................................................... 40 Table 7.4 - Inter Peak Core Matrix Totals ........................................................................ 40 Table 7.5 - PM Peak Core Matrix Totals .......................................................................... 40 Table 7.6 – Comparison between Core TEMPRO and Core Matrix Totals ...................... 41 Table 8.1 - A160 Journey Times (Seconds) - Core Scenario ........................................... 42 Table 8.2 - A1173 Journey Times (Seconds) - Core Scenario ......................................... 42 Table 8.3 - A180 Journey Times (Seconds) - Core Scenario ........................................... 42 Table 8.4 - Congestion - Delays and Queues - Opening Year 2016 - Core Scenario ...... 44 Table 8.5 - Congestion - Delays and Queues - Design Year 2031 - Core Scenario ......... 44 Table 8.6 - Summary Vehicle Hours - Core Scenario ...................................................... 45 Table 8.7 - Summary Vehicle Kilometres - Core Scenario ............................................... 46 Table 8.8 - Forecast Core Scenario Model Assignment Convergence ............................. 47 Table 9.1 - High Growth Matrix Totals ............................................................................. 50 Table 9.2 - Low Growth Matrix Totals .............................................................................. 52

[Page not used]
Page | 7
1 INTRODUCTION
1.1 SCHEME HISTORY/BACKGROUND
1.1.1 The South Humber Bank (SHB) remains the largest area of undeveloped land fronting a deep-water estuary in the United Kingdom. Approximately 1000 hectares of land is currently available for future development. The ports of Immingham and Grimsby located on the SHB are the largest ports in the UK by tonnage having handled 66 million tonnes of freight in 2007, representing some 10% of the UK’s cargo market. The SHB is also home to the UK’s largest refinery cluster representing approximately a quarter of the UK’s refining capacity.
1.1.2 With the availability of developable land and increasing infrastructure constraints at the major southern ports (Felixstowe, Southampton etc) there is the potential for significant growth to take place on the SHB with the ports of Immingham and Grimsby forecast to grow rapidly over the next 10-15 years to meet growing UK demand.
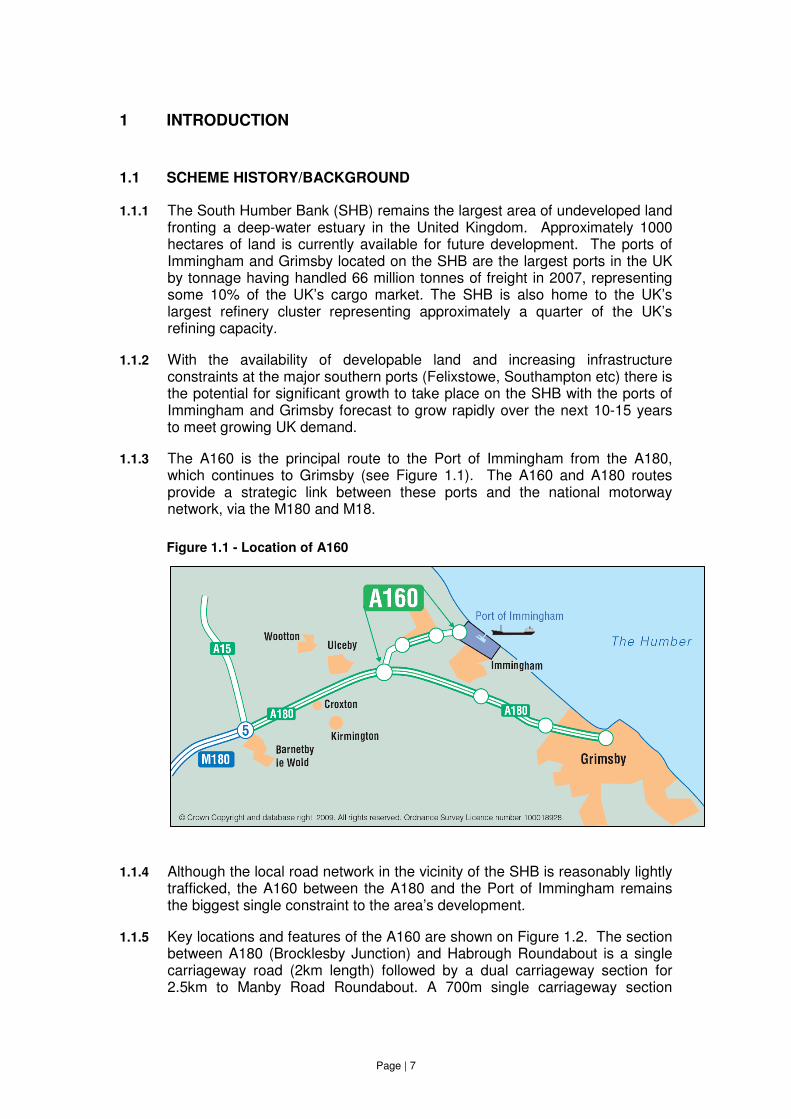
1.1.3 The A160 is the principal route to the Port of Immingham from the A180, which continues to Grimsby (see Figure 1.1). The A160 and A180 routes provide a strategic link between these ports and the national motorway network, via the M180 and M18.
Figure 1.1 - Location of A160
1.1.4 Although the local road network in the vicinity of the SHB is reasonably lightly trafficked, the A160 between the A180 and the Port of Immingham remains the biggest single constraint to the area’s development.
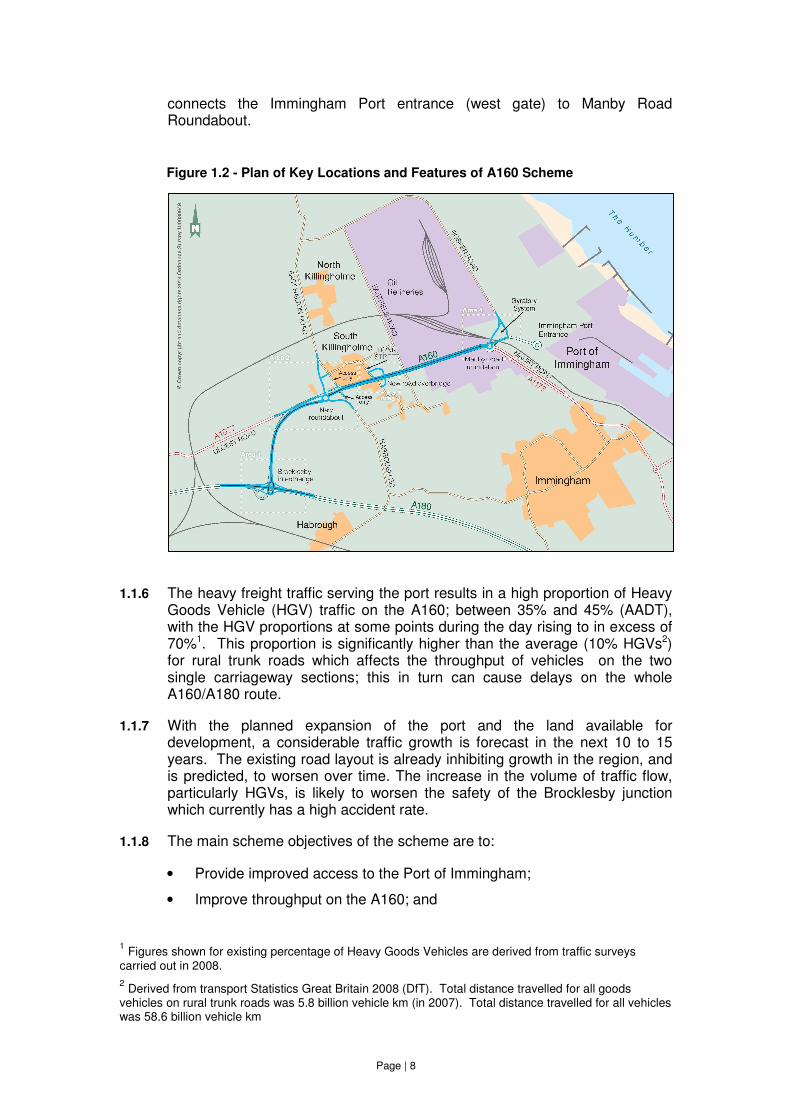
1.1.5 Key locations and features of the A160 are shown on Figure 1.2. The section between A180 (Brocklesby Junction) and Habrough Roundabout is a single carriageway road (2km length) followed by a dual carriageway section for 2.5km to Manby Road Roundabout. A 700m single carriageway section
Page | 8
connects the Immingham Port entrance (west gate) to Manby Road Roundabout.
Figure 1.2 - Plan of Key Locations and Features of A160 Scheme
1.1.6 The heavy freight traffic serving the port results in a high proportion of Heavy Goods Vehicle (HGV) traffic on the A160; between 35% and 45% (AADT), with the HGV proportions at some points during the day rising to in excess of 70%1. This proportion is significantly higher than the average (10% HGVs2) for rural trunk roads which affects the throughput of vehicles on the two single carriageway sections; this in turn can cause delays on the whole A160/A180 route.
1.1.7 With the planned expansion of the port and the land available for development, a considerable traffic growth is forecast in the next 10 to 15 years. The existing road layout is already inhibiting growth in the region, and is predicted, to worsen over time. The increase in the volume of traffic flow, particularly HGVs, is likely to worsen the safety of the Brocklesby junction which currently has a high accident rate.
1.1.8 The main scheme objectives of the scheme are to:
• Provide improved access to the Port of Immingham;
• Improve throughput on the A160; and
1 Figures shown for existing percentage of Heavy Goods Vehicles are derived from traffic surveys
carried out in 2008.
2 Derived from transport Statistics Great Britain 2008 (DfT). Total distance travelled for all goods
vehicles on rural trunk roads was 5.8 billion vehicle km (in 2007). Total distance travelled for all vehicles was 58.6 billion vehicle km
Page | 9
• Improve safety.
1.1.9 In previous commissions, the Highways Agency examined the feasibility of eight options which arose following Options and Value Engineering workshops in July and November 2008 respectively. These eight scheme options were developed and appraised during the Stage 1 (Options Identification) and Stage 2 (Option Selection) of the PCF process. During Stage 2 a Public Consultation was carried out between 8th June and 28th August 2009, resulting in the development of a ninth option to address issues that arose from the consultation exercise. This option was also appraised and recommended as the preferred option, with the Preferred Route Announcement having been made on 22nd March 2010.
1.2 SCHEME PROPOSALS
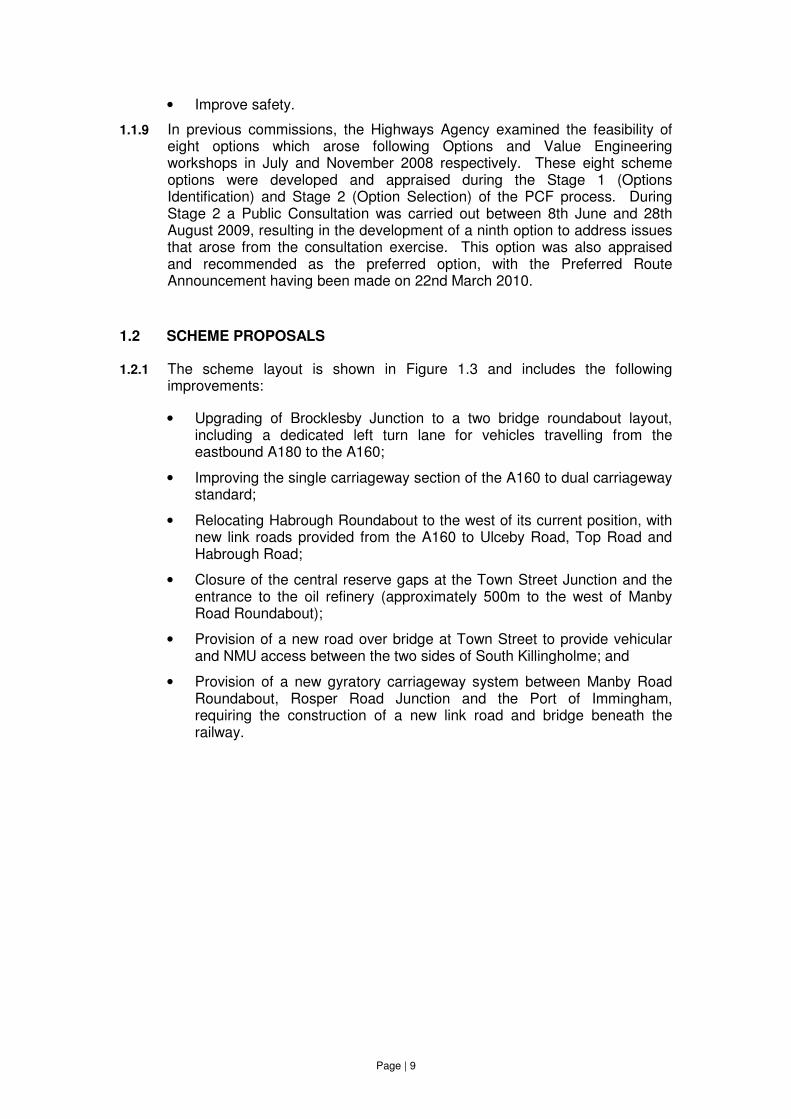
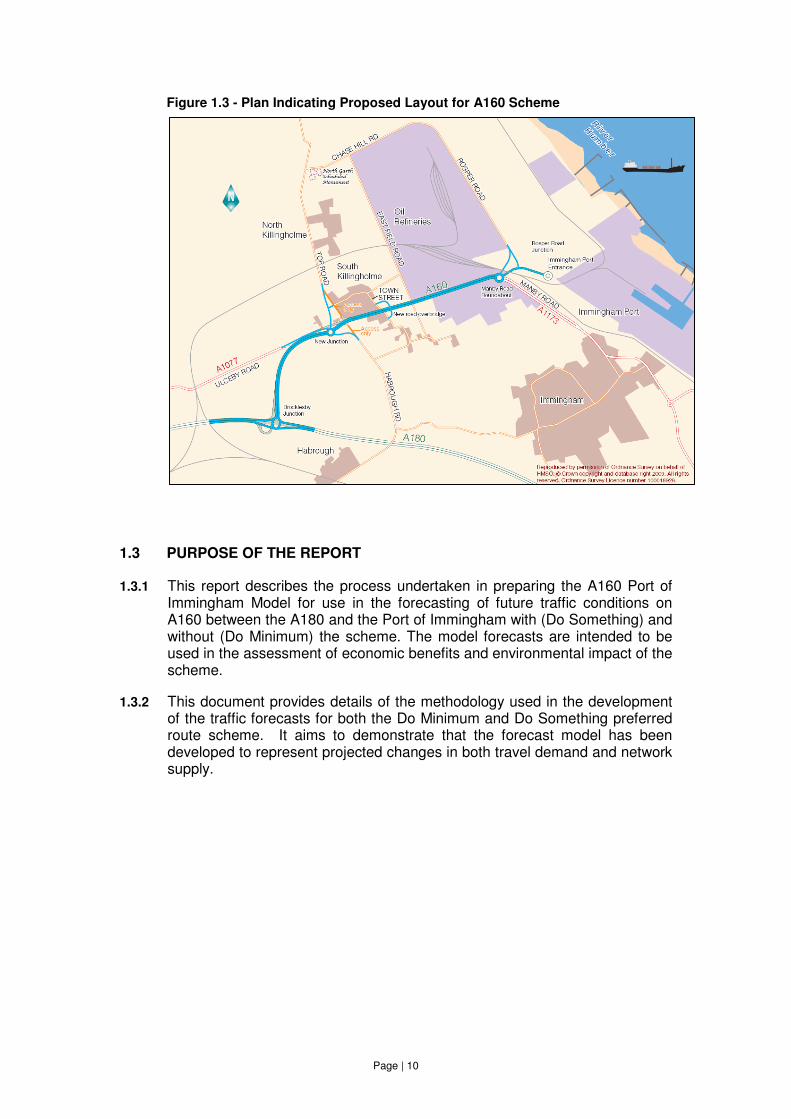
1.2.1 The scheme layout is shown in Figure 1.3 and includes the following improvements:
• Upgrading of Brocklesby Junction to a two bridge roundabout layout, including a dedicated left turn lane for vehicles travelling from the eastbound A180 to the A160;
• Improving the single carriageway section of the A160 to dual carriageway standard;
• Relocating Habrough Roundabout to the west of its current position, with new link roads provided from the A160 to Ulceby Road, Top Road and Habrough Road;
• Closure of the central reserve gaps at the Town Street Junction and the entrance to the oil refinery (approximately 500m to the west of Manby Road Roundabout);
• Provision of a new road over bridge at Town Street to provide vehicular and NMU access between the two sides of South Killingholme; and
• Provision of a new gyratory carriageway system between Manby Road Roundabout, Rosper Road Junction and the Port of Immingham, requiring the construction of a new link road and bridge beneath the railway.
Page | 10
Figure 1.3 - Plan Indicating Proposed Layout for A160 Scheme
1.3 PURPOSE OF THE REPORT
1.3.1 This report describes the process undertaken in preparing the A160 Port of Immingham Model for use in the forecasting of future traffic conditions on A160 between the A180 and the Port of Immingham with (Do Something) and without (Do Minimum) the scheme. The model forecasts are intended to be used in the assessment of economic benefits and environmental impact of the scheme.
1.3.2 This document provides details of the methodology used in the development of the traffic forecasts for both the Do Minimum and Do Something preferred route scheme. It aims to demonstrate that the forecast model has been developed to represent projected changes in both travel demand and network supply.
Page | 11
2 OVERVIEW OF CURRENT BASE YEAR MODEL
2.1 BASE MODEL OVERVIEW
2.1.1 The base traffic model represents travel and traffic conditions on the highway network in 2010.
2.1.2 The 2010 base model has been reviewed and a number of proposed improvements were identified to ensure the model complied with current WebTAG guidance and current best practice.
2.1.3 To account for a general reduction in trips in the area due to the effects of the economic recession a 2012 interim forecast traffic model has been developed. The 2012 model was developed using TRADS and survey data (both collected in 2012) to apply a growth factor between 2010 and 2012. This uplift methodology is explained in Section 3 of this report.
2.2 MODEL TIME PERIODS
2.2.1 The 2010 model represents morning, evening and inter-peak traffic conditions for the following model hours:
• AM Peak (0700-0800);
• PM Peak (1600-1700); and
• Inter-Peak (1000-1600, modelled as an average hour for the period)
2.3 STRUCTURE AND DEVELOPMENT OF 2010 BASE MODEL
2.3.1 The process undertaken in preparing and developing the 2010 base model was split into 3 stages; development, calibration, and validation.
2.3.2 The model was developed using the SATURN modelling suite. SATURN provides the structure for the model but also a computational basis to represent the interaction between travel demand and the operation of the network.
2.3.3 Highway travel demand was gauged by the data collected as part of the study, and includes Roadside Interviews (RSI), Automatic Traffic Counts (ATC), Manual Classified Counts (MCC) and Automatic Number Plate Recognition (ANPR).
2.3.4 RSI data from 5 locations was used to develop observed highway trip matrices of travel demand for trips entering a cordon around the Port of Immingham, and were located as follows:
• Site 1 . College Road, East Halton;
• Site 2 . A160 Humber Road, east of Top Road Roundabout;
• Site 3 . B1210 Station Road, Habrough;
Page | 12
• Site 4 . B1210 Stallingborough Road, south of Immingham; and
• Site 5 . A1173, between A180 and Kiln Lane Roundabout.
2.3.5 This data was processed to remove double counting and provide the basis for the development of a synthetic trip matrix to infill unobserved and partially observed movements.
2.3.6 The development of the base highway model network was based on providing a spatial framework that represents the structure of the highway network. This structure was broadly split into two linked components of junctions and roads linking the junctions.
2.3.7 The operation of junctions and roads is related to the geometric arrangement, operational characteristics of the vehicles, abilities of the user and constraints such as speed limits. The data collected for building this process was based on the following sources:
• Network Inventory; and
• Aerial Photography.
2.3.8 The network inventory provided information on traffic signal operations, signed speed limits and other signed restrictions such as height and weight restrictions. The inventory also included the collection of signal timings and phasing information from North Lincolnshire Council (NLC). The aerial photography provided a visual basis for the representation of the geometric information of both junctions and roads (aerial photography supplied by Google-Earth Pro via a commercial license).
2.3.9 At the calibration stage the trip matrices and highway network were combined via an assignment process within the SATURN suite. The highway model calibration process included two main steps; firstly, calibration of the gravity model to provide a synthetic trip matrix to infill unobserved and partially observed trips, and secondly, matrix estimation to adjust travel demand to reflect the range of traffic counts collected across the study area.
2.3.10 The synthetic trip matrix was developed using a gravity model formulation that was calibrated using the observed matrix developed from the roadside interview data.
2.3.11 The matrix estimation utilised traffic counts, which are point measures of travel demand for trips routeing between its origin and destination. Data used in the model development is used for comparative purposes to confirm that the model is accurately representing the input data.
2.3.12 Validation of the highway model used independent data collected for the modelling process. The three types of observed data collected for the study and used at this stage are as follows:
• Traffic Counts;
• Journey Time Surveys; and
• Automatic Number Plate Registration.

Page | 13
2.3.13 The validation process was based on criteria defined in the Design Manual for Roads and Bridges (DMRB) Volume 12 which measure the correlation between observed and modelled datasets; higher levels of correlation tend to indicate a more robust model. The results of the calibration and validation are details in the Local Model Validation Report.
2.3.14 An extensive set of journey time surveys were undertaken on the main routes around and across the study area including the A160, A180 and A1173.
Page | 14
3 SUMMARY OF PREVIOUS FORECASTING WORK
3.1 PCF STAGES 1
3.1.1 PCF Stage 1 is Option Identification. The assessments used the SATURN suite of programs.
3.2 PCF STAGE 2
3.2.1 PCF Stage 2 is Option Selection, the purpose of which is to identify options, and associated key information, to be presented at Public Consultation. The outcome of PCF Stage 2 is the announcement of a Preferred Route. Traffic forecasts were previously produced for the then future Opening Year and Design Year of 2017 and 2032 respectively, both with and without the scheme in place, and based on the then current national traffic forecasts (NTEM version 5.4). Future developments were not assessed in detail as it was considered that they were unlikely to materially affect the choice between options.
3.3 PCF STAGE 3
3.3.1 PCF Stage 3 is Preliminary Design, the purpose of which is to progress the design of the Preferred Route such that draft Legal Orders can be published. As mentioned earlier in this report, traffic forecasts for PCF Stage 3 were previously produced for the then future Opening Year and Design Year of 2017 and 2032 respectively, both with and without the scheme in place, and based on the then current national traffic forecasts (NTEM version 5.4). Future developments were explicitly modelled for those significant developments closest to the scheme.
Page | 15
4 DEVELOPMENT OF 2012 INTERIM FORECAST MODEL
4.1 INTRODUCTION
4.1.1 This section describes the methodology and results of producing 2012 present year demand matrices for Immingham. The 2012 demand matrices have been developed using the existing 2010 base model and a set of 2012 traffic surveys undertaken by Sky High-Count On Us.
4.1.2 The 2012 demand matrices are required to act as an alternative base year from which to forecast future demand. This is necessary to account for a general reduction in trips in the area between 2010 and 2012 due to the effects of the economic recession. Standard practice would be to forecast the 2010 base to 2012 using TEMPRO and NTM data; however, both these datasets work on the principle that there will be an increase in trips between 2010 and 2012, which does not tally with on site observations made using TRADS and the Sky High-Count On Us observed data. The TEMPRO and NTM data are therefore not suitable for use in determining changes in traffic between 2010 and 2012 in this area.
4.2 2012 DATA COLLECTION
4.2.1 In November 2012, Sky High-Count On Us undertook a number of traffic surveys in the area covered by the model simulation network. The surveys are detailed below.
• 9 Manually Classified Turning Count (MCTC) Surveys (12hr, 1 Day).
• 5 Manually Classified Count (MCC) Surveys (12hr, 1 Day).
• 9 Automatic Traffic Count (ATC) Surveys (24hr, 1-3 weeks).
4.2.2 Additionally, 4 TRADS sites on the A180 and A160 have available data for 2012.
4.2.3 A data processing exercise was undertaken to check and analyse the observed traffic counts. This included the following checks:
• Check that surveyed trips approximately match between connecting surveys.
• Check that 12hr counts are approximately equal and opposite to a certain degree.
• Check for unusual spikes or anomalies in flow profiles by vehicle type.
• Compare MCTC and MCC counts for consistency.
• Compare 1 day MCTC/MCC counts against ATC and TRADS.
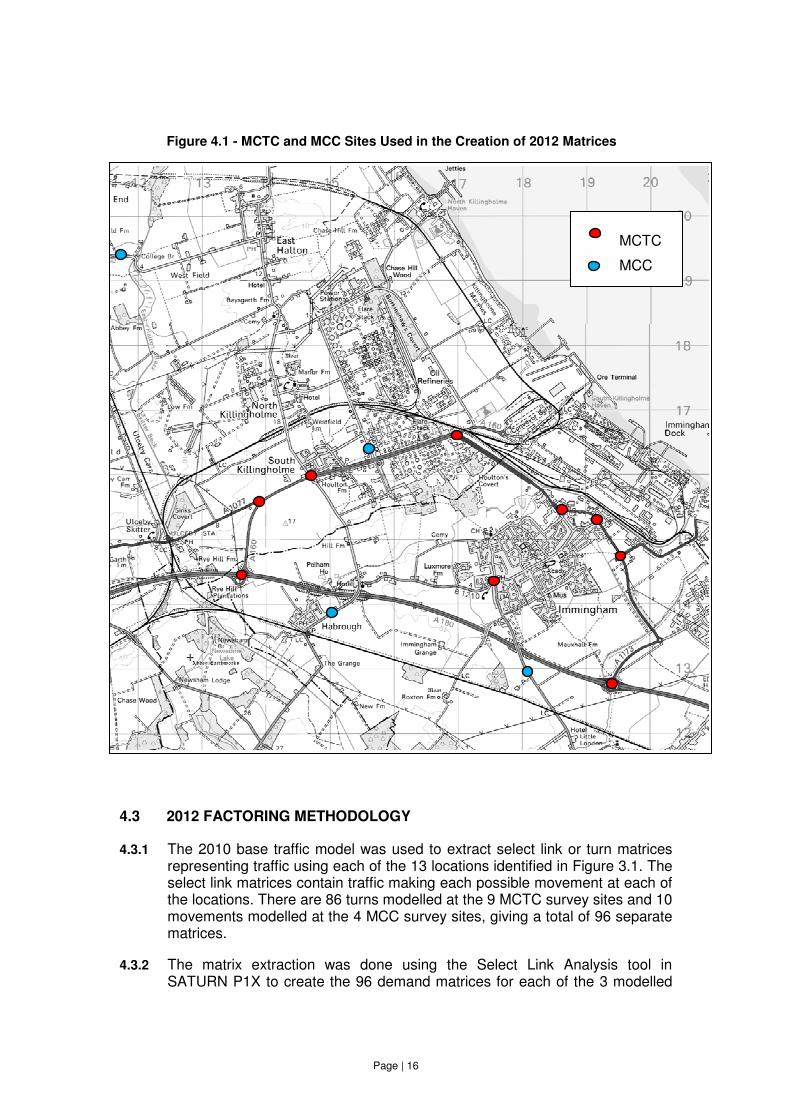
4.2.4 Data from all 9 MCTC surveys, 4 of the MCC surveys and ATC data (for checking) was extracted for use in the creation of the 2012 matrices. The locations of these 13 sites are shown in Figure 3.1.
Page | 16
Figure 4.1 - MCTC and MCC Sites Used in the Creation of 2012 Matrices
4.3 2012 FACTORING METHODOLOGY
4.3.1 The 2010 base traffic model was used to extract select link or turn matrices representing traffic using each of the 13 locations identified in Figure 3.1. The select link matrices contain traffic making each possible movement at each of the locations. There are 86 turns modelled at the 9 MCTC survey sites and 10 movements modelled at the 4 MCC survey sites, giving a total of 96 separate matrices.
4.3.2 The matrix extraction was done using the Select Link Analysis tool in SATURN P1X to create the 96 demand matrices for each of the 3 modelled
MCTC
MCC
Page | 17
time periods (AM, IP and PM) and 4 user classes (Car, LGV, OGV1 and OGV2).
4.3.3 To factor the modelled 2010 select link matrices to 2012 the following method was used to calculate a set of ‘growth’ factors.
4.3.4 The matrix total (in vehicles) for each of the 96 matrices was compared against the number of vehicles in the corresponding observed survey movement and a factor calculated to convert from 2010 modelled to the 2012 observed vehicles. This method provides an accurate representation of observed flows as any anomalies in the 2010 modelled flow are removed.
4.3.5 In some cases the observed 2012 turning movement was greater than zero but the modelled 2010 turning movement was zero. This means that a factor could not be calculated and so the 2012 flow was kept as zero. This does not affect the validity of the 2012 matrices as this does not occur on any junction on the proposed scheme and only involves minimal numbers of vehicles.
4.3.6 Each of the 96 matrices were then multiplied by their corresponding factor and an average of all 96 factored matrices calculated on a cell by cell basis. This average matrix forms the 2012 matrix for all trips travelling through the count sites.
4.3.7 The next step was to create a matrix for all modelled trips not travelling through one of the count sites. Firstly the average matrix above was compared against the 2010 base matrix. Where there was a zero value in the 2012 matrix the equivalent cell value in the 2010 matrix was extracted to create a matrix of trips which do not pass through one of the count sites.
4.3.8 This 2010 non-select-link matrix was then factored to create a 2012 non-select-link matrix. Factoring was done in two different ways. For cars and LGVs the factors were based on an average of the car or LGV based factors calculated using the select link to observed methodology above. For OGV1 and OGV2 the factor was based on NTM(11) as the growth in goods vehicles in the model simulation area was too large due to changes in land use between 2010 and 2012.
4.3.9 The 2012 non-select-link matrix was then added to the 2012 matrix for all trips travelling through one of the count sites to create a final matrix representing all trips in 2012.
4.4 ASSIGNED MATRIX VALIDATION
4.4.1 The 2012 demand matrices have been assigned to the 2010 base network to check the modelled link and turning movements at each of the 96 locations. The modelled flows have been compared to the observed 2012 flows for each time period and each vehicle type using the GEH statistic.
4.4.2 The GEH statistic is a generally accepted value used as an indicator of ‘goodness of fit’, i.e. the extent to which the modelled flows match the corresponding observed flows.
4.4.3 The majority of the link flows and turning movements have a good match of observed and modelled flows with a few cases where the difference did not pass the criteria of GEH statistic less than 5. Those movements were further
Page | 18
investigated and it was found that the GEH values were above 5 for the following two reasons
• The observed flow is greater than zero but the modelled flow is zero. This occurs because the modelled flow in 2010 is zero due to the way the base model was developed and the traffic counts used to estimate the modelled flow. This zero flow cannot be factored and therefore remains as zero in the 2012 model.
• Some of the trips are being assigned differently (to an alternative path) with the changed demand.
4.4.4 The effect of zero flows due to zero flows in 2010 is minimal and relates to small observed flows, as such the 2012 matrices are still considered valid.
4.4.5 An assessment of the effect of rerouting of 2012 trips in the 2010 network concluded that it does not affect the validity of the 2012 matrices: an increase in a number of trips at one link or turning movement is compensated by a decrease of a similar scale at another link or turning movement on the same screen line. In any case, this mainly affects HGVs and is alleviated when the future year networks are used.
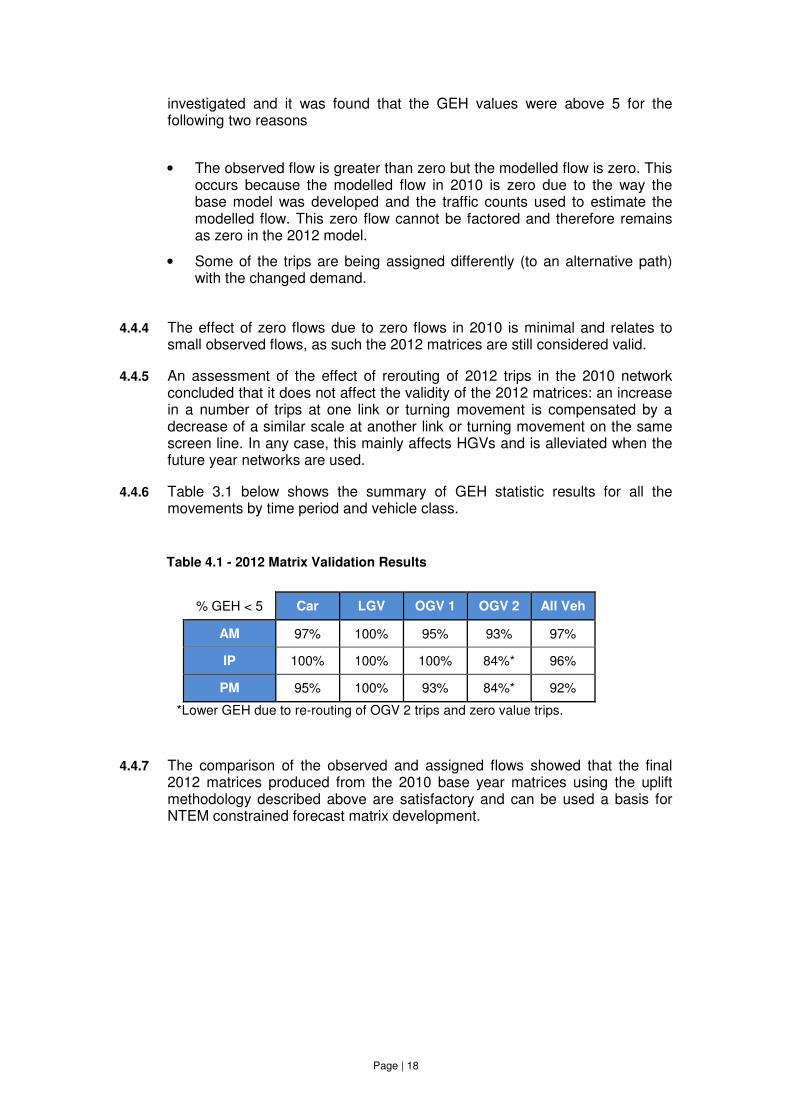
4.4.6 Table 3.1 below shows the summary of GEH statistic results for all the movements by time period and vehicle class.
Table 4.1 - 2012 Matrix Validation Results
% GEH < 5 Car LGV OGV 1 OGV 2 All Veh
AM 97% 100% 95% 93% 97%
IP 100% 100% 100% 84%* 96%
PM 95% 100% 93% 84%* 92%
*Lower GEH due to re-routing of OGV 2 trips and zero value trips.
4.4.7 The comparison of the observed and assigned flows showed that the final 2012 matrices produced from the 2010 base year matrices using the uplift methodology described above are satisfactory and can be used a basis for NTEM constrained forecast matrix development.
Page | 19
5 FORECASTING AND MODELLING FUTURE YEAR TRAVEL
5.1 INTRODUCTION
5.1.1 The development of the future year model relates to projecting changes in travel supply and demand into the future. The 2012 interim forecast year model provides the starting point for each element of these projections.
5.1.2 Future year travel supply relates to updating the highway network to represent the future year both ‘with’ and ‘without’ the A160 Port of Immingham Improvements. The ‘without’ A160 Port of Improvement network, known as the Do Minimum (DM), includes other committed changes to the network which are planned to be delivered irrespective of the A160 Port of Immingham Improvement going ahead. The ‘with’ A160 Port of Immingham Improvement network, known as the Do Something (DS), includes the same committed schemes as in the Do Minimum plus the improvements relating to the scheme.
5.1.3 The proposed scheme Opening Year of 2016 has been modelled as the first of the future years. The Design Year of 2031, 15 years after scheme opening, has also been modelled. For the accurate assessment of the benefits associated with the scheme an intermediate year of 2023 and a final year of 2041 have also been modelled.
5.1.4 Future year travel demand relates to factoring the 2012 trip matrices in relation to projected growth in travel demand. The Department for Transport (DfT) provides national based forecasts via published summaries of traffic growth from its National Transport Model (NTM) split into several vehicle types.
5.1.5 Additionally the DfT provides growth forecasts for car based trips, in its National Trip End Model (NTEM), accessed via the software suite TEMPRO. This suite considers responses such as car ownership, population, employment and the number of households to derive localised growth forecasts. TEMPRO’s spatial detail is typically split into several areas for each local authority district.
5.1.6 TEMPRO includes an adjustment process to enable the inclusion of identified specific developments using specific trip rates and distributions, while allowing the wider trip growth to be adjusted to eliminate double counting of travel demand. Several developments in the model have been identified and site specific travel demand and trip patterns have been used.
5.2 TRAFFIC FORECASTING GUIDANCE
5.2.1 WebTAG, the DfT’s website for Transport Appraisal Guidance and IAN106/08 have been used to determine the traffic forecasting methodology used on the project. Key WebTAG Unit references are listed below:
• WebTAG Unit 3.15.1: Forecasting using Transport Models
• WebTAG Unit 3.15.2: Use of TEMPRO data
• WebTAG Unit 3.15.5: Treatment of Uncertainty in Forecasting
Page | 20
5.3 FUTURE YEAR NETWORKS
5.3.1 The assessment process is based on considering the differences in traffic impacts from comparing trips assigned to the Do Minimum (DM) and Do Something (DS) networks.
5.4 DO MINIMUM NETWORK
5.4.1 The proposed link between Stallingborough Road (south of the A180) and the A180 / A1173 junction has been modelled as a Do Minimum scheme. This scheme is known locally as the ‘Immingham Bypass’. No other Highway Schemes were within the scope of the traffic model.
5.4.2 The same Do Minimum network has been used for all assessment scenarios.
5.5 DO SOMETHING NETWORK
5.5.1 The PCF Stage 2 - Option Selection concluded with a preferred route to be taken forward into the PCF Stage 3 - Preliminary Design. This preferred route is the previous Do Something ‘Option 9’ scheme.
5.5.2 The preferred route consists of a new grade separated junction replacing the existing Brocklesby A160/ A180 junction. A new dual carriageway, utilising the existing A160, linking the new grade separated junction with a new roundabout located to the south west of the existing A160 - Top Road roundabout. This new five arm roundabout links in to the existing A160, Habrough Road and Top Road approaches, and the A1077 Ulceby Road, which is diverted from the existing priority junction with the A160 (east of the Truck Stop).
5.5.3 The existing dual carriageway section of the A160 remains largely unchanged, except for closure of central reservations gaps at Town Street - South Killingholme and for refinery accesses west of the Manby Road roundabout. The north-south movements across the A160 at South Killingholme will be undertaken via a new over bridge.
5.5.4 The A160 to the east of the Manby Road roundabout has been modified via a one way circulatory route (two lanes) eastbound from Manby Road via a new link passing to the north of the Fire Station linking into Rosper Road via free flow left turn (northbound) and free flow right turn (southbound) lanes. The one way circulation continues south of this new junction towards the existing Rosper Road/ A160 junction which becomes a free flow left (to a two way single carriageway) and right turn (continued one way section) lanes. The one way section (two lanes) continues from this junction westbound to the Manby Road roundabout using the existing A160 carriageway.
5.5.5 The Do Minimum and Do Something networks were coded into the SATURN simulation model by the calculation of junction capacities related to the physical layout of the intersections. Junction capacities in SATURN are represented by saturation flows which relate to the maximum flow that could use the junction assuming no opposing flows but considering layout constraints. The saturation flows used were based on ARCADY, TRANSYT
Page | 21
and PICADY formula described in the following Transport Research Laboratory (TRL) reports:
• Signalised junctions - TRL Research Report 67;
• Roundabout junctions - TRL Research Report 36;
• Priority Junctions, Opposed movements - TRL Research Report 35; and
• Priority Junctions, Unopposed movements - TRL Research Report 67.
5.5.6 The use of saturation flows based on the above methodology ensures that the junctions operate in a similar manner to an assessment undertaken in the junction modelling suites of ARCADY, TRANSYT and PICADY. Although it should be noted that SATURN calculation of delays and queues do differ from the junction modelling suites and so comparisons between the two types of modelling suites should be undertaken with due diligence. Although typically the operation results are similar, most notably volume over capacity ratios usually shows a good correlation.
5.6 ASSIGNMENT PROCEDURES
5.6.1 Assignment is the process that traffic models use to predict the routes that road users take between their origin and their destination.
5.6.2 Travel cost (and in particular time) is assumed to depend on the flows in the network. The default assignment procedure within SATURN was used, which is based on Wardrop’s Principle of traffic equilibrium (congestion-restrained and deterministic). This principle states that “Drivers choose routes such that, at equilibrium, no individual trip maker can reduce his/her cost of travel by unilaterally changing route”.
5.7 GENERALISED COST PARAMETERS
5.7.1 The assignment of trip matrices to the traffic model network is undertaken in an iterative manner by the assignment program until equilibrium is achieved. At the point of equilibrium, all trips have been assigned along paths between origins and destinations to minimise their overall user costs (based on travel time and distance). In this way, the traffic model achieves a balance between the transport network capacity (i.e. the supply) and the demand for road-based travel within the modelled area.
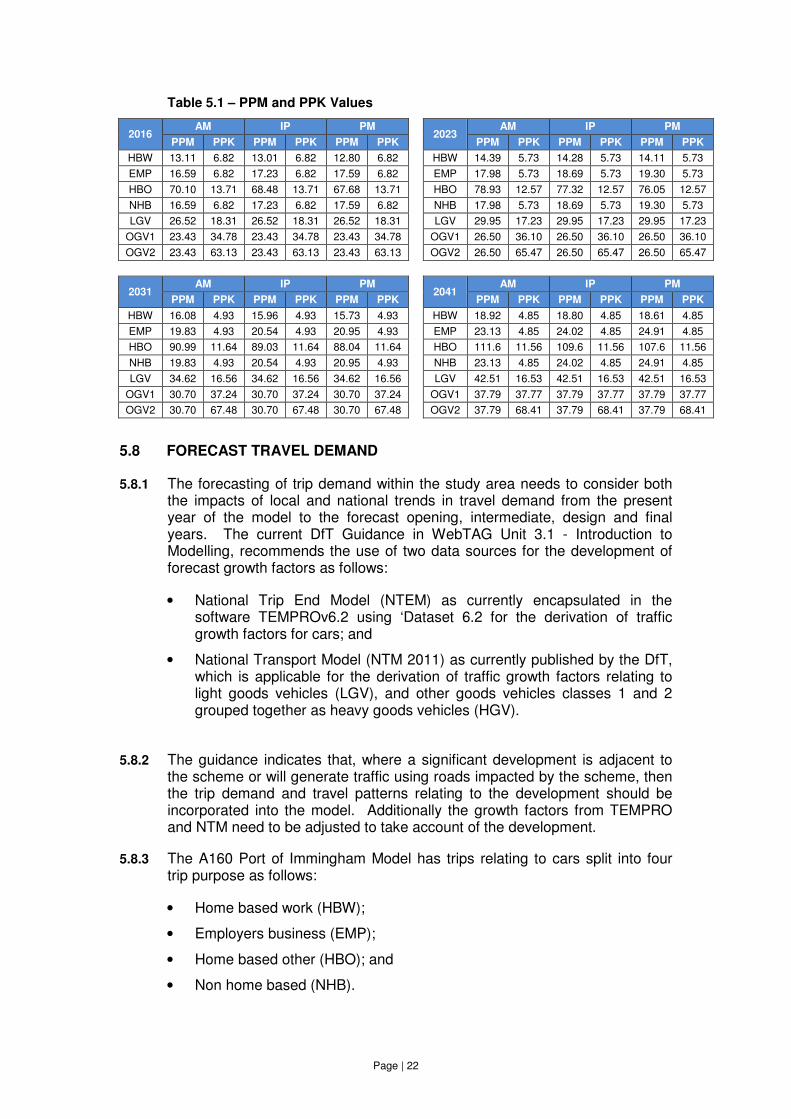
5.7.2 Generalised cost parameters have been calculated for each of the future years/time periods, based on the methodology proposed in WebTAG Unit 3.5.6: Values of Time and Vehicle Operating Costs. These generalised cost parameters have been input to the network files in the form of ‘pence per minute’ (PPM) and ‘pence per kilometre’ (PPK) values to specify the appropriate assignment criteria by year, time period and user class.
5.7.3 Table 5.1 below shows the PPM and PPK used for each model time period and year.
Page | 22
Table 5.1 – PPM and PPK Values
2016 AM IP PM
2023 AM IP PM
PPM PPK PPM PPK PPM PPK PPM PPK PPM PPK PPM PPK
HBW 13.11 6.82 13.01 6.82 12.80 6.82 HBW 14.39 5.73 14.28 5.73 14.11 5.73
EMP 16.59 6.82 17.23 6.82 17.59 6.82 EMP 17.98 5.73 18.69 5.73 19.30 5.73
HBO 70.10 13.71 68.48 13.71 67.68 13.71 HBO 78.93 12.57 77.32 12.57 76.05 12.57
NHB 16.59 6.82 17.23 6.82 17.59 6.82 NHB 17.98 5.73 18.69 5.73 19.30 5.73
LGV 26.52 18.31 26.52 18.31 26.52 18.31 LGV 29.95 17.23 29.95 17.23 29.95 17.23
OGV1 23.43 34.78 23.43 34.78 23.43 34.78 OGV1 26.50 36.10 26.50 36.10 26.50 36.10
OGV2 23.43 63.13 23.43 63.13 23.43 63.13 OGV2 26.50 65.47 26.50 65.47 26.50 65.47
2031 AM IP PM
2041 AM IP PM
PPM PPK PPM PPK PPM PPK PPM PPK PPM PPK PPM PPK
HBW 16.08 4.93 15.96 4.93 15.73 4.93 HBW 18.92 4.85 18.80 4.85 18.61 4.85
EMP 19.83 4.93 20.54 4.93 20.95 4.93 EMP 23.13 4.85 24.02 4.85 24.91 4.85
HBO 90.99 11.64 89.03 11.64 88.04 11.64 HBO 111.6 11.56 109.6 11.56 107.6 11.56
NHB 19.83 4.93 20.54 4.93 20.95 4.93 NHB 23.13 4.85 24.02 4.85 24.91 4.85
LGV 34.62 16.56 34.62 16.56 34.62 16.56 LGV 42.51 16.53 42.51 16.53 42.51 16.53
OGV1 30.70 37.24 30.70 37.24 30.70 37.24 OGV1 37.79 37.77 37.79 37.77 37.79 37.77
OGV2 30.70 67.48 30.70 67.48 30.70 67.48 OGV2 37.79 68.41 37.79 68.41 37.79 68.41
5.8 FORECAST TRAVEL DEMAND
5.8.1 The forecasting of trip demand within the study area needs to consider both the impacts of local and national trends in travel demand from the present year of the model to the forecast opening, intermediate, design and final years. The current DfT Guidance in WebTAG Unit 3.1 - Introduction to Modelling, recommends the use of two data sources for the development of forecast growth factors as follows:
• National Trip End Model (NTEM) as currently encapsulated in the software TEMPROv6.2 using ‘Dataset 6.2 for the derivation of traffic growth factors for cars; and
• National Transport Model (NTM 2011) as currently published by the DfT, which is applicable for the derivation of traffic growth factors relating to light goods vehicles (LGV), and other goods vehicles classes 1 and 2 grouped together as heavy goods vehicles (HGV).
5.8.2 The guidance indicates that, where a significant development is adjacent to the scheme or will generate traffic using roads impacted by the scheme, then the trip demand and travel patterns relating to the development should be incorporated into the model. Additionally the growth factors from TEMPRO and NTM need to be adjusted to take account of the development.
5.8.3 The A160 Port of Immingham Model has trips relating to cars split into four trip purpose as follows:
• Home based work (HBW);
• Employers business (EMP);
• Home based other (HBO); and
• Non home based (NHB).
Page | 23
5.8.4 The A160 Port of Immingham Model assigns each trip purpose separate based on relevant generalised costs. The value of generalised costs reflects the relative weighting between the value of time and vehicle operating costs.
5.8.5 The model represents trips undertaken by goods vehicles as follows:
• Light goods vehicles (LGV);
• Other goods vehicles type 1 - Rigid (OGV1); and
• Other goods vehicles type 2 - Articulated (OGV2).
5.9 UNCERTAINTY IN FORECASTING - OVERVIEW
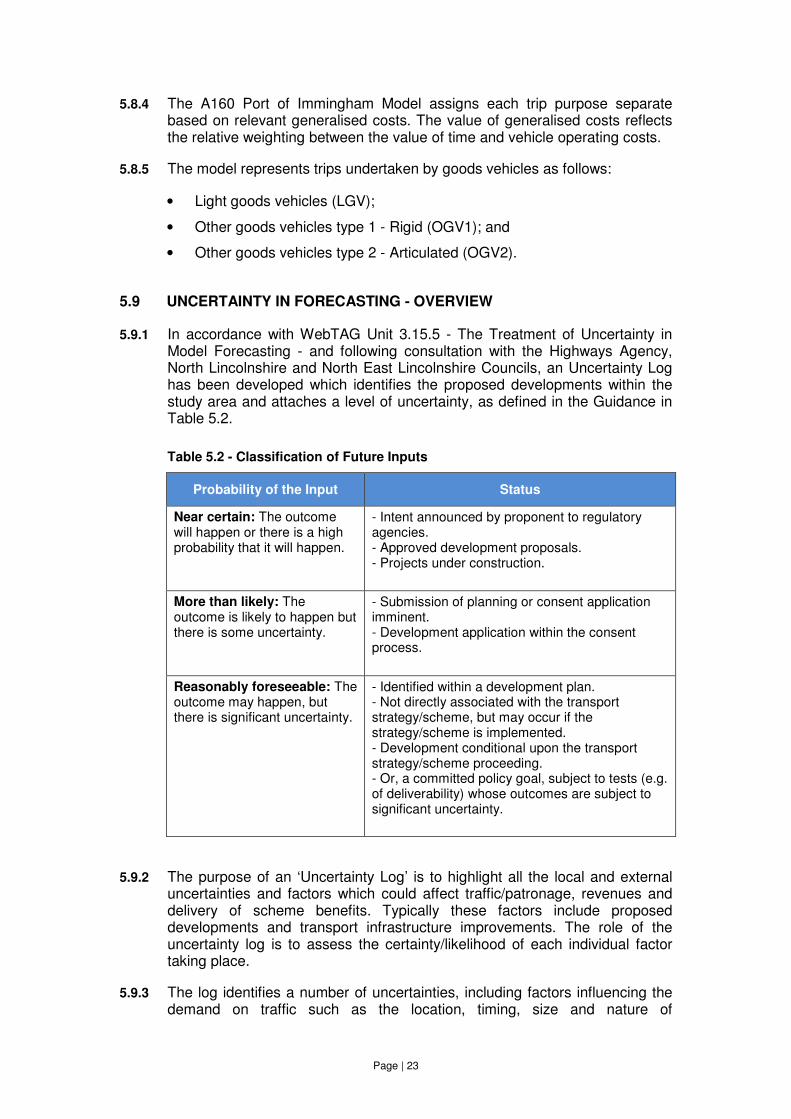
5.9.1 In accordance with WebTAG Unit 3.15.5 - The Treatment of Uncertainty in Model Forecasting - and following consultation with the Highways Agency, North Lincolnshire and North East Lincolnshire Councils, an Uncertainty Log has been developed which identifies the proposed developments within the study area and attaches a level of uncertainty, as defined in the Guidance in Table 5.2.
Table 5.2 - Classification of Future Inputs
Probability of the Input Status
Near certain: The outcome will happen or there is a high probability that it will happen.
- Intent announced by proponent to regulatory agencies. - Approved development proposals. - Projects under construction.
More than likely: The outcome is likely to happen but there is some uncertainty.
- Submission of planning or consent application imminent. - Development application within the consent process.
Reasonably foreseeable: The outcome may happen, but there is significant uncertainty.
- Identified within a development plan. - Not directly associated with the transport strategy/scheme, but may occur if the strategy/scheme is implemented. - Development conditional upon the transport strategy/scheme proceeding. - Or, a committed policy goal, subject to tests (e.g. of deliverability) whose outcomes are subject to significant uncertainty.
5.9.2 The purpose of an ‘Uncertainty Log’ is to highlight all the local and external uncertainties and factors which could affect traffic/patronage, revenues and delivery of scheme benefits. Typically these factors include proposed developments and transport infrastructure improvements. The role of the uncertainty log is to assess the certainty/likelihood of each individual factor taking place.
5.9.3 The log identifies a number of uncertainties, including factors influencing the demand on traffic such as the location, timing, size and nature of
Page | 24
developments. The factors which are ‘less likely’ will be used to derive further sensitivity tests to determine the robustness of the future year traffic flows.
5.9.4 Appendix A contains the Uncertainty Log.
5.10 DEVELOPMENT OF FORECAST SCENARIOS
5.10.1 The guidance in WebTAG unit 3.15.5 recommends that a core forecast scenario should be developed which includes development and interventions which are near certain and more than likely. In addition to this forecast scenario at least two sensitivity tests must be considered and it has been agreed that a Low Benefits (Low Growth) and a High Benefits (High Growth) scenario would be considered.
5.10.2 Guidance also advises that the forecast scenarios should be constrained to TEMPRO growth. In this instance the most likely and near certain developments results in traffic growth greater than that predicted by TEMPRO. When this occurs the guidance recommends that a further forecast scenario should be developed that is constrained to TEMPRO i.e. a Core TEMPRO Scenario. This forecast is used as a benchmark against which the core scenario can be assessed.
5.10.3 Forecasts have been produced for the following demand scenarios
• Core TEMPRO Scenario - this scenario includes traffic growth due to TEMPRO as well as near certain and more than likely development trips (excluding Able). The total traffic growth given in this Core TEMPRO Scenario has been constrained to TEMPRO as required by guidance given in WebTAG.
• Core Scenario - The Core scenario is the Core TEMPRO scenario but with additional development trips associated with the South Humber Bank (Able) and additional growth in Humber Sea Terminal and Immingham Port traffic. This scenario is not constrained to TEMPRO as it was not possible to provide TEMPRO constrained demand which includes the Able development and additional Port growth without unrealistic background growth to non-development trips. It is expected that this will be the most realistic forecast.
• High Growth Scenario - as Core but with increased TEMPRO growth and port growth as well as reasonably foreseeable development trips.
• Low Growth Scenario - as Core TEMPRO but with decreased TEMPRO growth and only near certain development trips.
5.11 OVERVIEW OF DEMAND FORECASTING PROCEDURE (CARS)
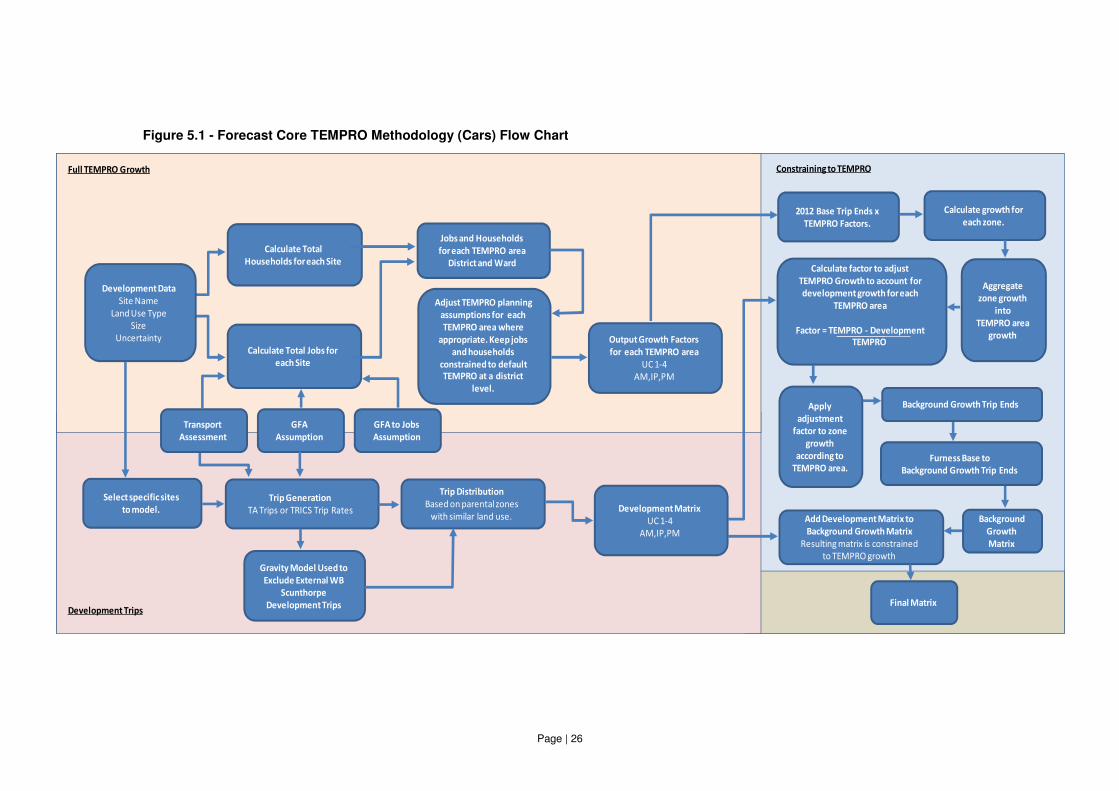
5.11.1 Figure 4.1 over the page shows a flow chart illustrating the methodology used for creating Core TEMPRO forecast matrices for cars.
5.11.2 In summary TEMPRO growth factors by trip purpose and time period have been calculated for each TEMPRO district in the model and for the Immingham / Killingholme TEMPRO ward areas within North Lincolnshire and North East Lincolnshire. These have been applied to the base model trip ends to calculate traffic growth for each TEMPRO area.
Page | 25
5.11.3 Development details obtained from the local authorities along with TRICS3 trip rates and trips extracted from Transport Assessments have been used to generate development trips. These trips have been distributed using similar parental zones in the 2012 base model to create a development matrix for each trip purpose and time period. Development trip end totals have been calculated by TEMPRO area.
5.11.4 The total TEMPRO only growth trip ends for each TEMPRO area have been adjusted based on the total development trip ends for each TEMPRO area to calculate background traffic growth trip ends.
5.11.5 The base model has been furnessed to the background growth trip ends to create a background growth matrix. This background growth matrix has then been added to the development matrix to create a final forecast matrix which as a result is constrained to TEMPRO i.e. total growth by TEMPRO area will be as dictated by TEMPRO factors.
3 TRICS – Trip Rate Information Computer System, the national standard for trip generation
analysis.
Page | 26
Figure 5.1 - Forecast Core TEMPRO Methodology (Cars) Flow Chart
Calculate Total
Households for each Site
Calculate Total Jobs for
each Site
Transport
Assessment
GFA
Assumption
GFA to Jobs
Assumption
Jobs and Households
for each TEMPRO area
District and Ward
Adjust TEMPRO planning
assumptions for each
TEMPRO area where
appropriate. Keep jobs
and households
constrained to default
TEMPRO at a district
level.
Output Growth Factors
for each TEMPRO area
UC 1-4
AM,IP,PM
Select specific sites
to model.
Trip Generation
TA Trips or TRICS Trip Rates
Gravity Model Used to
Exclude External WB
Scunthorpe
Development Trips
Trip Distribution
Based on parental zones
with similar land use.Development Matrix
UC 1-4
AM,IP,PM
2012 Base Trip Ends x
TEMPRO Factors.
Calculate growth for
each zone.
Aggregate
zone growth
into
TEMPRO area
growth
Calculate factor to adjust
TEMPRO Growth to account for
development growth for each
TEMPRO area
Factor = TEMPRO - Development
TEMPRO
Apply
adjustment
factor to zone
growth
according to
TEMPRO area.
Background Growth Trip Ends
Furness Base to
Background Growth Trip Ends
Background
Growth
Matrix
Add Development Matrix to
Background Growth Matrix
Resulting matrix is constrained
to TEMPRO growth
Final Matrix
Full TEMPRO Growth
Development Trips
Constraining to TEMPRO
Development Data
Site Name
Land Use Type
Size
Uncertainty
Page | 27
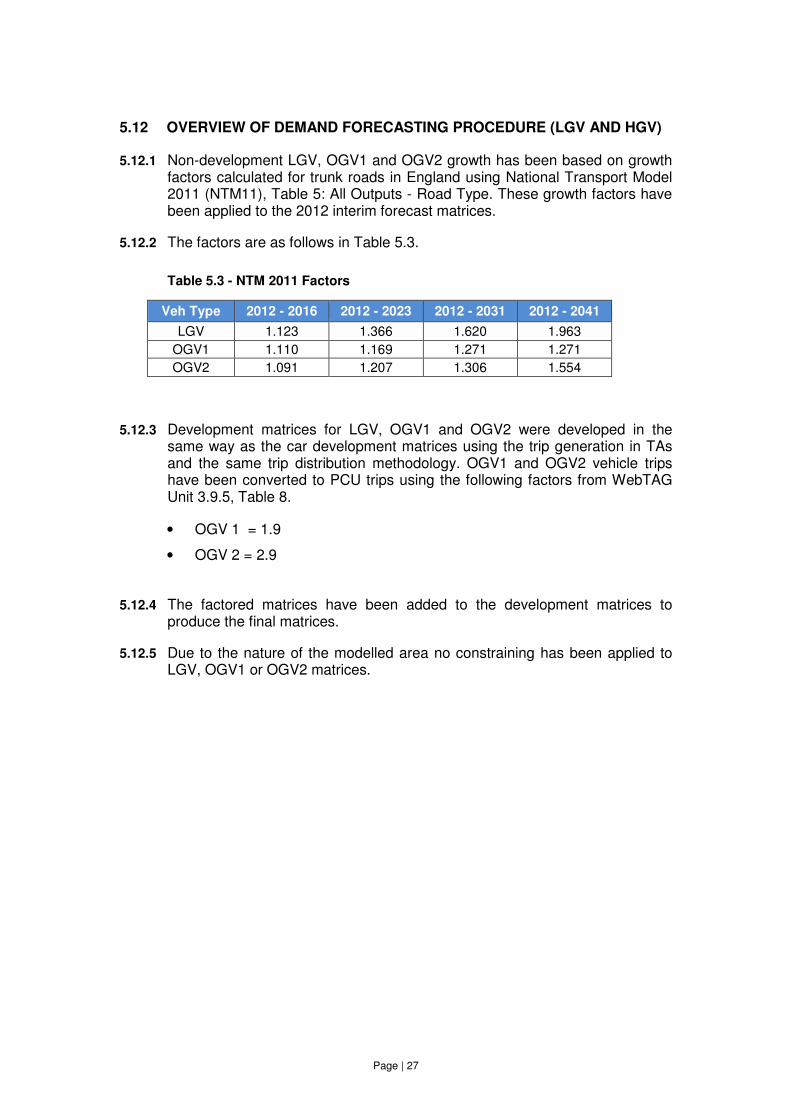
5.12 OVERVIEW OF DEMAND FORECASTING PROCEDURE (LGV AND HGV)
5.12.1 Non-development LGV, OGV1 and OGV2 growth has been based on growth factors calculated for trunk roads in England using National Transport Model 2011 (NTM11), Table 5: All Outputs - Road Type. These growth factors have been applied to the 2012 interim forecast matrices.
5.12.2 The factors are as follows in Table 5.3.
Table 5.3 - NTM 2011 Factors
5.12.3 Development matrices for LGV, OGV1 and OGV2 were developed in the same way as the car development matrices using the trip generation in TAs and the same trip distribution methodology. OGV1 and OGV2 vehicle trips have been converted to PCU trips using the following factors from WebTAG Unit 3.9.5, Table 8.
• OGV 1 = 1.9
• OGV 2 = 2.9
5.12.4 The factored matrices have been added to the development matrices to produce the final matrices.
5.12.5 Due to the nature of the modelled area no constraining has been applied to LGV, OGV1 or OGV2 matrices.
Veh Type 2012 - 2016 2012 - 2023 2012 - 2031 2012 - 2041
LGV 1.123 1.366 1.620 1.963
OGV1 1.110 1.169 1.271 1.271
OGV2 1.091 1.207 1.306 1.554
Page | 28
6 CORE TEMPRO SCENARIO
6.1 OVERVIEW
6.1.1 The Core TEMPRO scenario includes car based traffic growth due to TEMPRO as well as near certain and more than likely development trips. The total traffic growth has been constrained to TEMPRO.
6.1.2 LGV and HGV trips have been based on NTM traffic growth as well as near certain and more than likely development trips as identified in the Uncertainty Log (Appendix A).
6.2 TEMPRO - DEFAULT PLANNING ASSUMPTIONS
6.2.1 The TEMPRO software v6.2 has been used along with dataset v6.2 to extract TEMPRO growth factors.
6.2.2 Within the TEMPRO software are a set of adjustable planning data assumptions which predict the number of households and jobs in 2012 and the number of future year households and jobs. To calculate accurate factors it is important to update these assumptions where appropriate to take account of the most recent development planning policy of the local authority.
6.2.3 The Immingham / Killingholme area in TEMPRO is split into two parts. One part falls within the North Lincolnshire TEMPRO zone while the other part falls within the North East Lincolnshire TEMPRO zone.
6.2.4 The growth assumptions for these Immingham areas within North Lincolnshire and North East Lincolnshire have been updated using the Planning Data from the Local Councils whilst keeping the number of jobs and households within the whole of North Lincolnshire and North East Lincolnshire the same as default TEMPRO.
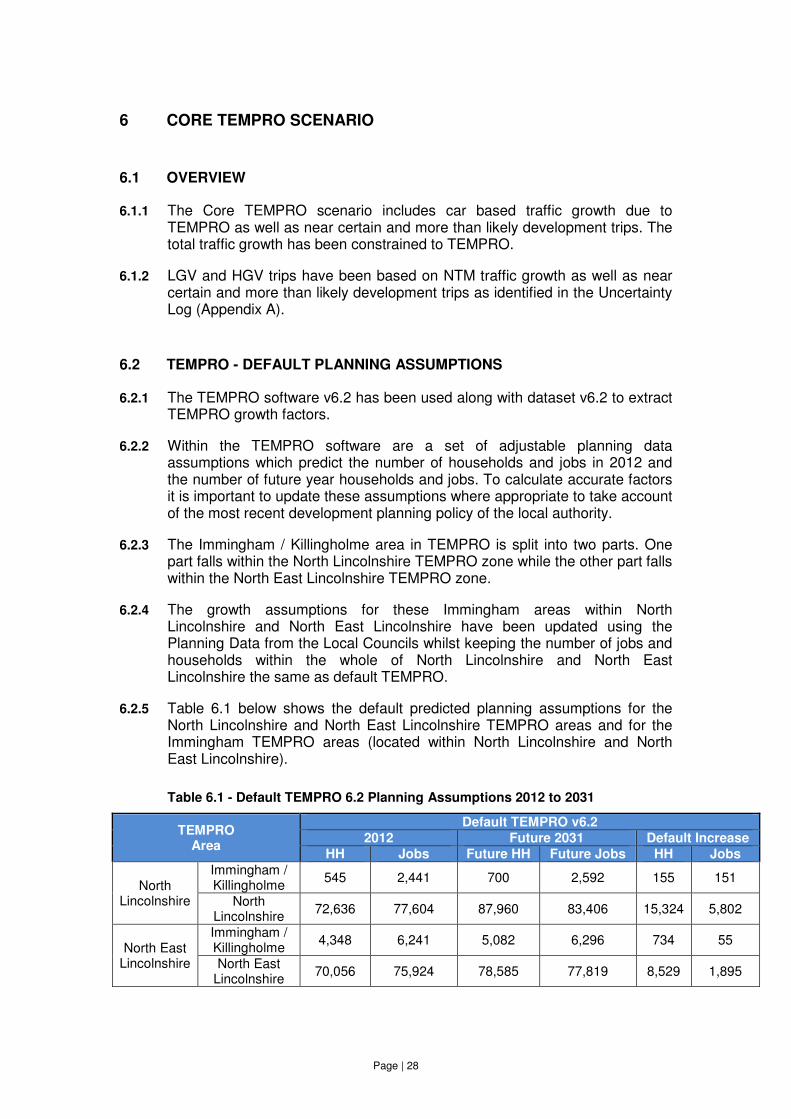
6.2.5 Table 6.1 below shows the default predicted planning assumptions for the North Lincolnshire and North East Lincolnshire TEMPRO areas and for the Immingham TEMPRO areas (located within North Lincolnshire and North East Lincolnshire).
Table 6.1 - Default TEMPRO 6.2 Planning Assumptions 2012 to 2031
TEMPRO Area
Default TEMPRO v6.2
2012 Future 2031 Default Increase
HH Jobs Future HH Future Jobs HH Jobs
North Lincolnshire
Immingham / Killingholme
545 2,441 700 2,592 155 151
North Lincolnshire
72,636 77,604 87,960 83,406 15,324 5,802
North East Lincolnshire
Immingham / Killingholme
4,348 6,241 5,082 6,296 734 55
North East Lincolnshire
70,056 75,924 78,585 77,819 8,529 1,895
Page | 29
6.3 TEMPRO AREAS
6.3.1 Although within the North Lincolnshire and North East Lincolnshire District TEMPRO areas, the two smaller Immingham / Killingholme ward TEMPRO areas have been used specifically. This is because there are developments to be located within them with more associated jobs predicted than the job increase predicted by TEMPRO. If model zones located within this TEMPRO area were to be captured by the larger North Lincolnshire and North East Lincolnshire TEMPRO zone it would not be possible to constrain to TEMPRO growth due to the small number of trips in the 2012 model relative to the high concentration of development trips.
6.4 FORECAST HOUSEHOLDS AND JOBS
6.4.1 Information and Transport Assessments received from North Lincolnshire Council and North East Lincolnshire Council have enabled Jacobs to develop an uncertainty log showing the location, land use type, size and uncertainty of all proposed housing and employment sites within the North Lincolnshire and North East Lincolnshire authority areas. This data has been used to derive the number of jobs and the number of households associated with each development in the study area.
6.4.2 As the Immingham / Killingholme TEMPRO zones are located within the North Lincolnshire and North East Lincolnshire TEMPRO zones the total number of 2012 and future year jobs and households in North Lincolnshire and North East Lincolnshire need to be adjusted downwards so that when adjustments are made to the planning assumptions in TEMPRO the Immingham / Killingholme figures are not double counted.
6.4.3 It should be noted that when adjusted the total number of households and jobs within the whole of North Lincolnshire or North East Lincolnshire does not exceed that in the default TEMPRO for these areas.
Page | 30
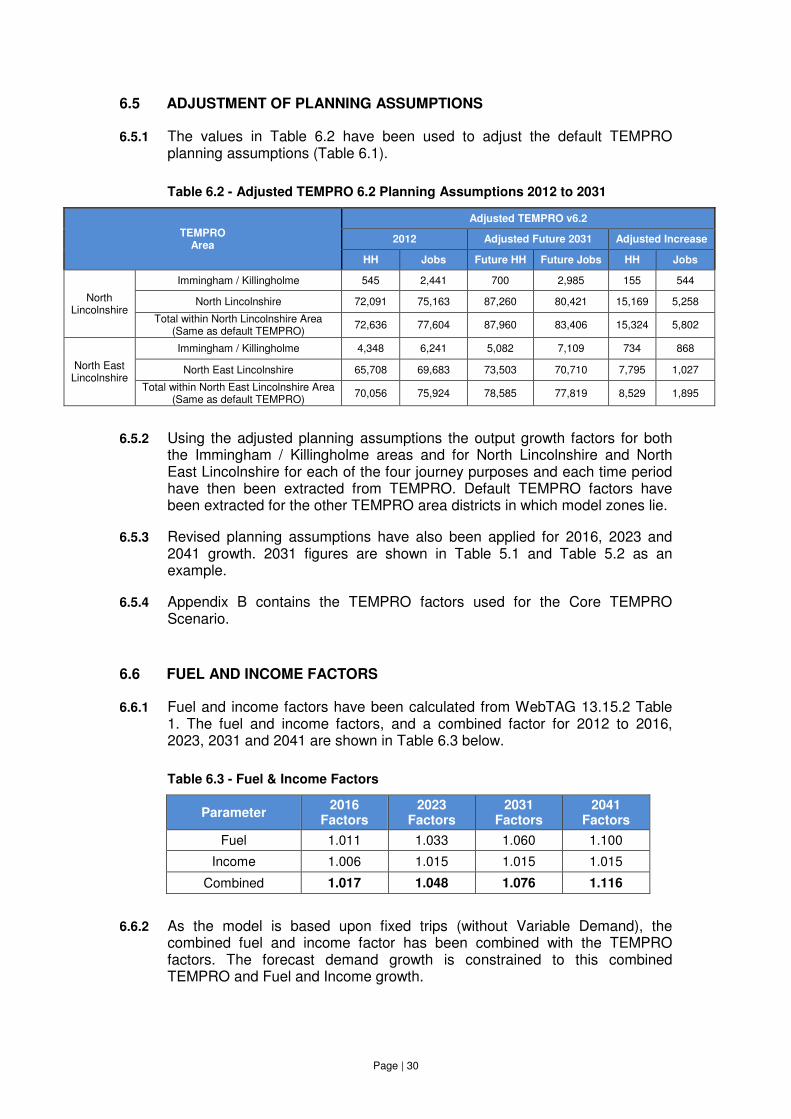
6.5 ADJUSTMENT OF PLANNING ASSUMPTIONS
6.5.1 The values in Table 6.2 have been used to adjust the default TEMPRO planning assumptions (Table 6.1).
Table 6.2 - Adjusted TEMPRO 6.2 Planning Assumptions 2012 to 2031
TEMPRO Area
Adjusted TEMPRO v6.2
2012 Adjusted Future 2031 Adjusted Increase
HH Jobs Future HH Future Jobs HH Jobs
North Lincolnshire
Immingham / Killingholme 545 2,441 700 2,985 155 544
North Lincolnshire 72,091 75,163 87,260 80,421 15,169 5,258
Total within North Lincolnshire Area (Same as default TEMPRO)
72,636 77,604 87,960 83,406 15,324 5,802
North East Lincolnshire
Immingham / Killingholme 4,348 6,241 5,082 7,109 734 868
North East Lincolnshire 65,708 69,683 73,503 70,710 7,795 1,027
Total within North East Lincolnshire Area (Same as default TEMPRO)
70,056 75,924 78,585 77,819 8,529 1,895
6.5.2 Using the adjusted planning assumptions the output growth factors for both the Immingham / Killingholme areas and for North Lincolnshire and North East Lincolnshire for each of the four journey purposes and each time period have then been extracted from TEMPRO. Default TEMPRO factors have been extracted for the other TEMPRO area districts in which model zones lie.
6.5.3 Revised planning assumptions have also been applied for 2016, 2023 and 2041 growth. 2031 figures are shown in Table 5.1 and Table 5.2 as an example.
6.5.4 Appendix B contains the TEMPRO factors used for the Core TEMPRO Scenario.
6.6 FUEL AND INCOME FACTORS
6.6.1 Fuel and income factors have been calculated from WebTAG 13.15.2 Table 1. The fuel and income factors, and a combined factor for 2012 to 2016, 2023, 2031 and 2041 are shown in Table 6.3 below.
Table 6.3 - Fuel & Income Factors
Parameter 2016
Factors
2023 Factors
2031 Factors
2041 Factors
Fuel 1.011 1.033 1.060 1.100
Income 1.006 1.015 1.015 1.015
Combined 1.017 1.048 1.076 1.116
6.6.2 As the model is based upon fixed trips (without Variable Demand), the combined fuel and income factor has been combined with the TEMPRO factors. The forecast demand growth is constrained to this combined TEMPRO and Fuel and Income growth.
Page | 31
6.7 GROWTH TRIP ENDS
6.7.1 The TEMPRO factor for each district combined with the fuel and income factor has been multiplied by the trip end for each zone in the 2012 model. The resulting trip ends have been used to calculate the total growth for each TEMPRO area. This represents the total growth due to TEMPRO to which the growth of the final Core TEMPRO forecast matrices has been constrained.
6.8 DEVELOPMENT TRIPS - TRIP GENERATION
6.8.1 The list of developments received from North Lincolnshire Council contains several proposed housing and employment development sites which are planned within the North Lincolnshire and North East Lincolnshire area. Of these development sites there are seven specific development sites which have been identified which are within the North Lincolnshire model area. These are:
• Able Marine (South Humber Bank);
• Able Logistics (South Humber Bank);
• Bio-ethanol Plant (South Humber Bank);
• Glass Wool Manufacturing Plant (South Humber Bank);
• Hargreaves Warehousing and Industrial Development (North Killingholme Airfield);
• Two small container storage sites (North Killingholme Airfield); and
• Scunthorpe Residential Sites (multiple sites grouped into single model zone).
6.8.2 There are also nine specific development sites identified within the North East Lincolnshire model area. These are:
• Abengoa Bioethanol Plant (Immingham);
• XHelius Biomass Plant (Immingham);
• ABP (Immingham);
• Katoen Natie (Immingham);
• Encycle (Immingham);
• Real Ventures (Immingham);
• Graypen Ltd (Immingham);
• Vireol Bioethanol Plant (Grimsby); and
• Residential Sites (mainly in Grimsby/Cleethorpes area).
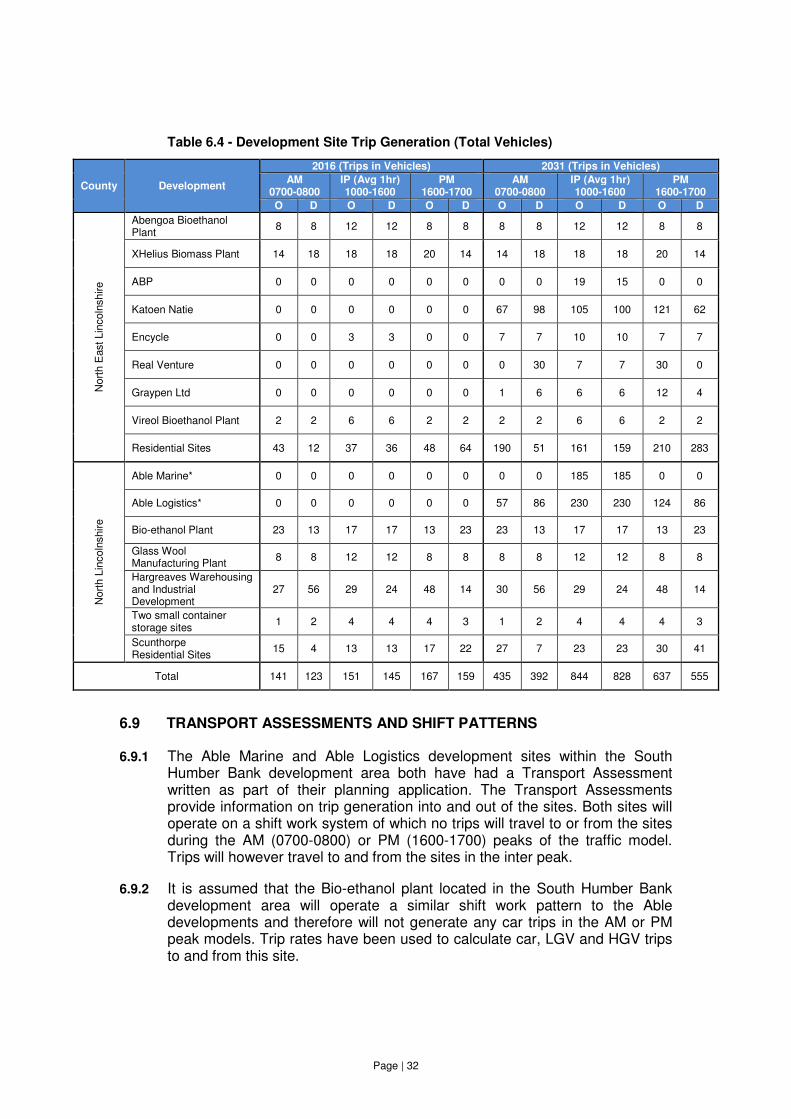
6.8.3 These North Lincolnshire and North East Lincolnshire development sites have been specifically modelled in the traffic model based on calculated trip generation and trip distribution. Table 6.4 below shows the trip generation for the above sites.
Page | 32
Table 6.4 - Development Site Trip Generation (Total Vehicles)
6.9 TRANSPORT ASSESSMENTS AND SHIFT PATTERNS
6.9.1 The Able Marine and Able Logistics development sites within the South Humber Bank development area both have had a Transport Assessment written as part of their planning application. The Transport Assessments provide information on trip generation into and out of the sites. Both sites will operate on a shift work system of which no trips will travel to or from the sites during the AM (0700-0800) or PM (1600-1700) peaks of the traffic model. Trips will however travel to and from the sites in the inter peak.
6.9.2 It is assumed that the Bio-ethanol plant located in the South Humber Bank development area will operate a similar shift work pattern to the Able developments and therefore will not generate any car trips in the AM or PM peak models. Trip rates have been used to calculate car, LGV and HGV trips to and from this site.
County Development
2016 (Trips in Vehicles) 2031 (Trips in Vehicles)
AM 0700-0800
IP (Avg 1hr) 1000-1600
PM 1600-1700
AM 0700-0800
IP (Avg 1hr) 1000-1600
PM 1600-1700
O D O D O D O D O D O D
Nort
h E
ast Lin
coln
shire
Abengoa Bioethanol Plant
8 8 12 12 8 8 8 8 12 12 8 8
XHelius Biomass Plant 14 18 18 18 20 14 14 18 18 18 20 14
ABP 0 0 0 0 0 0 0 0 19 15 0 0
Katoen Natie 0 0 0 0 0 0 67 98 105 100 121 62
Encycle 0 0 3 3 0 0 7 7 10 10 7 7
Real Venture 0 0 0 0 0 0 0 30 7 7 30 0
Graypen Ltd 0 0 0 0 0 0 1 6 6 6 12 4
Vireol Bioethanol Plant 2 2 6 6 2 2 2 2 6 6 2 2
Residential Sites 43 12 37 36 48 64 190 51 161 159 210 283
Nort
h L
incoln
shire
Able Marine* 0 0 0 0 0 0 0 0 185 185 0 0
Able Logistics* 0 0 0 0 0 0 57 86 230 230 124 86
Bio-ethanol Plant 23 13 17 17 13 23 23 13 17 17 13 23
Glass Wool Manufacturing Plant
8 8 12 12 8 8 8 8 12 12 8 8
Hargreaves Warehousing and Industrial Development
27 56 29 24 48 14 30 56 29 24 48 14
Two small container storage sites
1 2 4 4 4 3 1 2 4 4 4 3
Scunthorpe Residential Sites
15 4 13 13 17 22 27 7 23 23 30 41
Total 141 123 151 145 167 159 435 392 844 828 637 555
Page | 33
6.9.3 The North Killingholme Airfield sites and North East Lincolnshire development sites also have Transport Assessments giving their type, size, GFA, phasing and trip generation.
6.10 SOUTH HUMBER BANK (ABLE)
6.10.1 The magnitude of the number of jobs associated with the Able development sites means it is not possible to include trips generated by these sites and be able to constrain to TEMPRO growth without significant negative background growth. For this reason the sites have not been included in the Core TEMPRO scenario, which will be constrained to TEMPRO, but they have been included in the Core Scenario (see Section 7) to be used for operational, economic and environmental assessment.
6.11 SCUNTHORPE & GRIMSBY RESIDENTIAL DEVELOPMENT
6.11.1 The residential development sites identified in Scunthorpe and Grimsby have been grouped together as Scunthorpe and Grimsby are only represented by two to three zones in the model. A trip rate has been extracted from TRICS to generate the amount of trips to and from these development sites.
6.12 ASSESSMENT OF DEPENDENT DEVELOPMENT
6.12.1 A review of the relevant Core Scenarios and liaison with the relevant local authorities has identified that there are no significant developments in the study area that are wholly dependent upon the implementation of the A160/A180 improvement scheme.
6.13 CORE TEMPRO - PORT GROWTH
6.13.1 Information from ABP has identified a 70%4 increase in vehicles on the A160 associated with the port with the proportion of HGVs remaining at 44%. This 70% growth seems ambitious and as such the growth in port related car trips in the Core TEMPRO Scenario has been captured in the TEMPRO background growth calculated for the Immingham TEMPRO area. Port growth in LGV and HGV trips has been captured within the NTM growth factors.
6.13.2 The background growth for cars is between 6.4% (AM) and 8.5% (PM) for 2012 to 2016 and 15% (AM) and 19% (PM) for 2012 to 2031.
6.14 DEVELOPMENT TRIPS - TRIP DISTRIBUTION
6.14.1 The first step in the trip distribution was to identify development trips which will not pass through one of the road side interview sites used to build the base model. This is because in the base matrices, trips to and from Scunthorpe only have origins or destinations east of Scunthorpe (i.e. east of a point just west of the Brocklesby junction).
4 ABP, Port of Immingham Master Plan 2010-2030, October 2012
Page | 34
6.14.2 To be consistent with the base model all trips which travel west of Scunthorpe or that will travel north across the Humber Bridge have been excluded from the demand matrices.
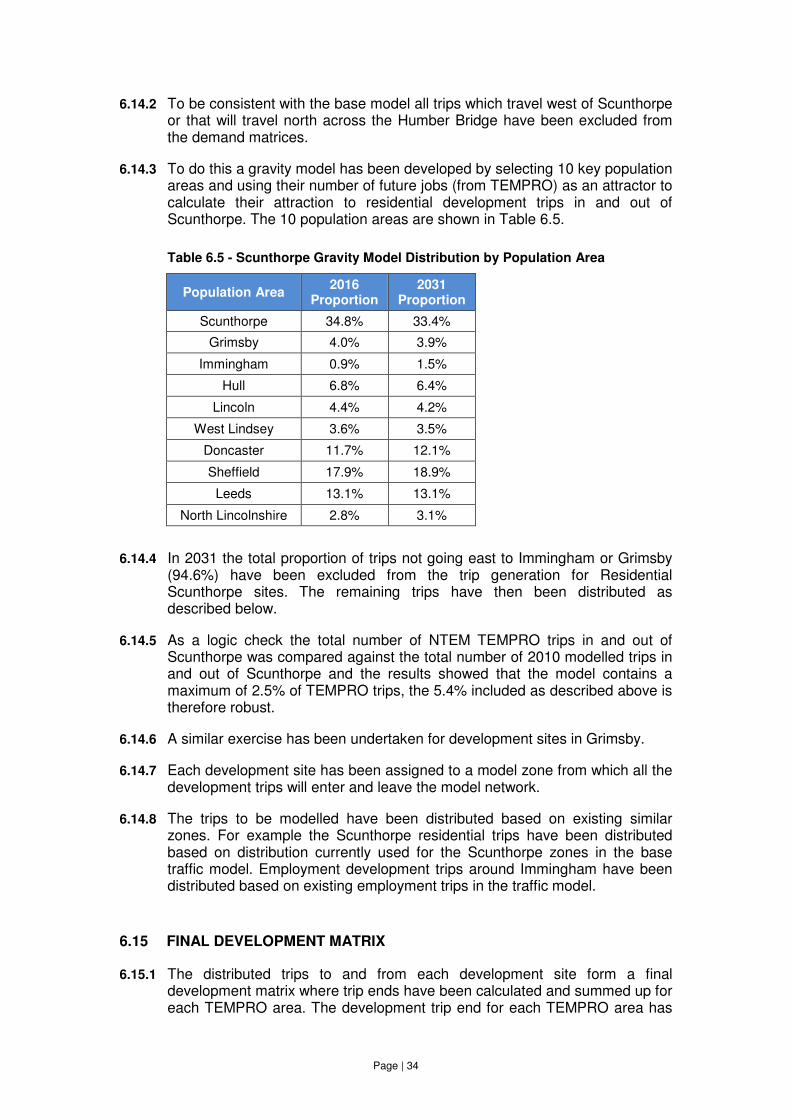
6.14.3 To do this a gravity model has been developed by selecting 10 key population areas and using their number of future jobs (from TEMPRO) as an attractor to calculate their attraction to residential development trips in and out of Scunthorpe. The 10 population areas are shown in Table 6.5.
Table 6.5 - Scunthorpe Gravity Model Distribution by Population Area
Population Area 2016
Proportion
2031 Proportion
Scunthorpe 34.8% 33.4%
Grimsby 4.0% 3.9%
Immingham 0.9% 1.5%
Hull 6.8% 6.4%
Lincoln 4.4% 4.2%
West Lindsey 3.6% 3.5%
Doncaster 11.7% 12.1%
Sheffield 17.9% 18.9%
Leeds 13.1% 13.1%
North Lincolnshire 2.8% 3.1%
6.14.4 In 2031 the total proportion of trips not going east to Immingham or Grimsby (94.6%) have been excluded from the trip generation for Residential Scunthorpe sites. The remaining trips have then been distributed as described below.
6.14.5 As a logic check the total number of NTEM TEMPRO trips in and out of Scunthorpe was compared against the total number of 2010 modelled trips in and out of Scunthorpe and the results showed that the model contains a maximum of 2.5% of TEMPRO trips, the 5.4% included as described above is therefore robust.
6.14.6 A similar exercise has been undertaken for development sites in Grimsby.
6.14.7 Each development site has been assigned to a model zone from which all the development trips will enter and leave the model network.
6.14.8 The trips to be modelled have been distributed based on existing similar zones. For example the Scunthorpe residential trips have been distributed based on distribution currently used for the Scunthorpe zones in the base traffic model. Employment development trips around Immingham have been distributed based on existing employment trips in the traffic model.
6.15 FINAL DEVELOPMENT MATRIX
6.15.1 The distributed trips to and from each development site form a final development matrix where trip ends have been calculated and summed up for each TEMPRO area. The development trip end for each TEMPRO area has
Page | 35
been used when calculating background traffic growth and constraining to TEMPRO.
6.15.2 A separate development matrix has been produced to represent trips to and from the South Humber Bank development sites. This has been used to create the Core scenario trip matrices.
6.16 CONSTRAINING TO TEMPRO
6.16.1 The growth due to TEMPRO contains a certain element of development growth proportional to the number of houses and jobs used in the TEMPRO planning assumptions. As the development matrix has been used without any adjustment it was necessary to adjust the TEMPRO growth in each district so that when it was added to the development matrix the total growth is equal to the TEMPRO growth. In this case TEMPRO growth includes the fuel and income growth.
6.16.2 The growth due to TEMPRO in each TEMPRO area has been factored based on the following factor, F.
F = (TEMPRO Growth - Development Trips) / TEMPRO Growth
6.16.3 This created a revised growth for each TEMPRO area which represents background growth i.e. growth not including development.
6.16.4 The background traffic growth factor for each TEMPRO area has been applied to the 2012 trip end for each zone that lies within the TEMPRO area. This created a set of background growth trip ends.
6.16.5 For North Lincolnshire and North East Lincolnshire the ‘Immingham’ TEMPRO area in each has been combined with the main district area for each to ensure the constraining was undertaken at a district level.
6.16.6 The 2012 matrix has been furnessed to the background growth trip ends to create a background growth matrix.
6.17 FINAL FORECAST MATRIX
6.17.1 The development matrix has been added to the background growth matrix to create a final Core TEMPRO forecast matrix. The growth by TEMPRO area within this final forecast matrix is constrained to TEMPRO.
6.18 MATRIX CHECKS
6.18.1 The fixed trip matrices are the same for the Do Minimum and Do Something scenarios. Checks have been carried out to compare the trip end totals between the 2012 and the future years for all time periods to ensure the expected, overall growth between 2012 and the future years is in line with that estimated by TEMPRO.
Page | 36
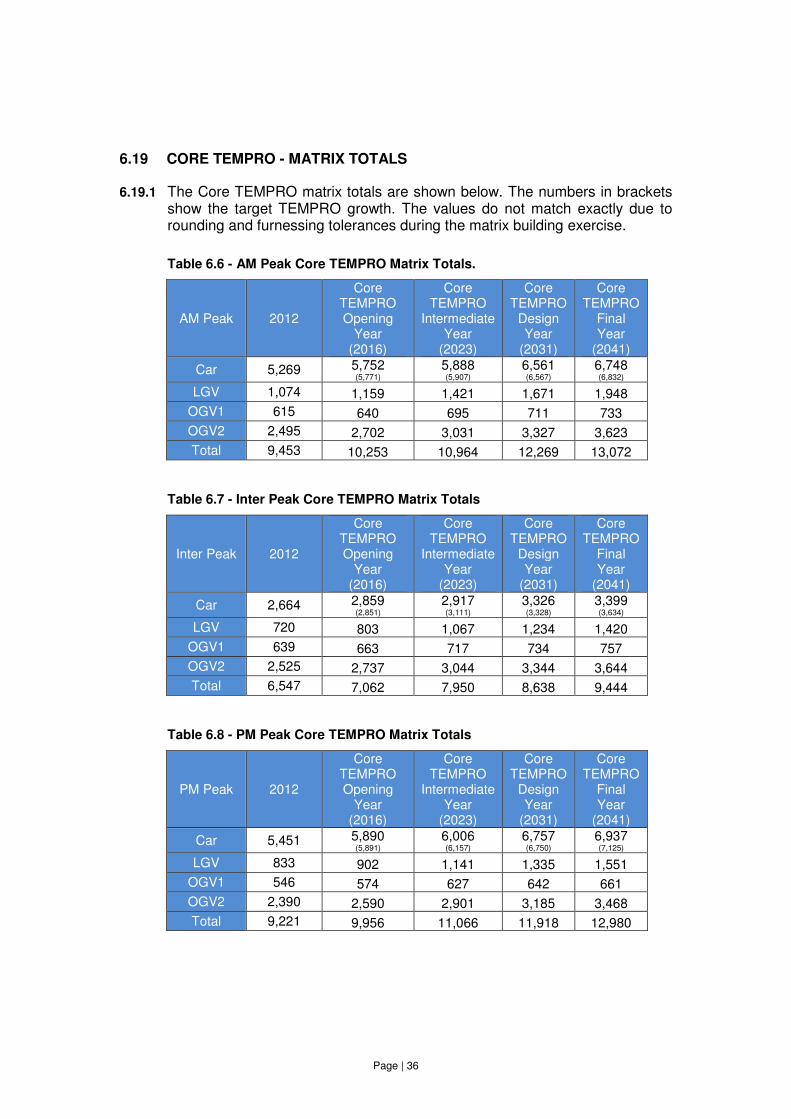
6.19 CORE TEMPRO - MATRIX TOTALS
6.19.1 The Core TEMPRO matrix totals are shown below. The numbers in brackets show the target TEMPRO growth. The values do not match exactly due to rounding and furnessing tolerances during the matrix building exercise.
Table 6.6 - AM Peak Core TEMPRO Matrix Totals.
AM Peak 2012
Core TEMPRO Opening
Year (2016)
Core TEMPRO
Intermediate Year
(2023)
Core TEMPRO
Design Year
(2031)
Core TEMPRO
Final Year
(2041)
Car 5,269 5,752 (5,771)
5,888 (5,907)
6,561 (6,567)
6,748 (6,832)
LGV 1,074 1,159 1,421 1,671 1,948
OGV1 615 640 695 711 733
OGV2 2,495 2,702 3,031 3,327 3,623
Total 9,453 10,253 10,964 12,269 13,072
Table 6.7 - Inter Peak Core TEMPRO Matrix Totals
Inter Peak 2012
Core TEMPRO Opening
Year (2016)
Core TEMPRO
Intermediate Year
(2023)
Core TEMPRO
Design Year
(2031)
Core TEMPRO
Final Year
(2041)
Car 2,664 2,859 (2,851)
2,917 (3,111)
3,326 (3,328)
3,399 (3,634)
LGV 720 803 1,067 1,234 1,420
OGV1 639 663 717 734 757
OGV2 2,525 2,737 3,044 3,344 3,644
Total 6,547 7,062 7,950 8,638 9,444
Table 6.8 - PM Peak Core TEMPRO Matrix Totals
PM Peak 2012
Core TEMPRO Opening
Year (2016)
Core TEMPRO
Intermediate Year
(2023)
Core TEMPRO
Design Year
(2031)
Core TEMPRO
Final Year
(2041)
Car 5,451 5,890 (5,891)
6,006 (6,157)
6,757 (6,750)
6,937 (7,125)
LGV 833 902 1,141 1,335 1,551
OGV1 546 574 627 642 661
OGV2 2,390 2,590 2,901 3,185 3,468
Total 9,221 9,956 11,066 11,918 12,980
Page | 37
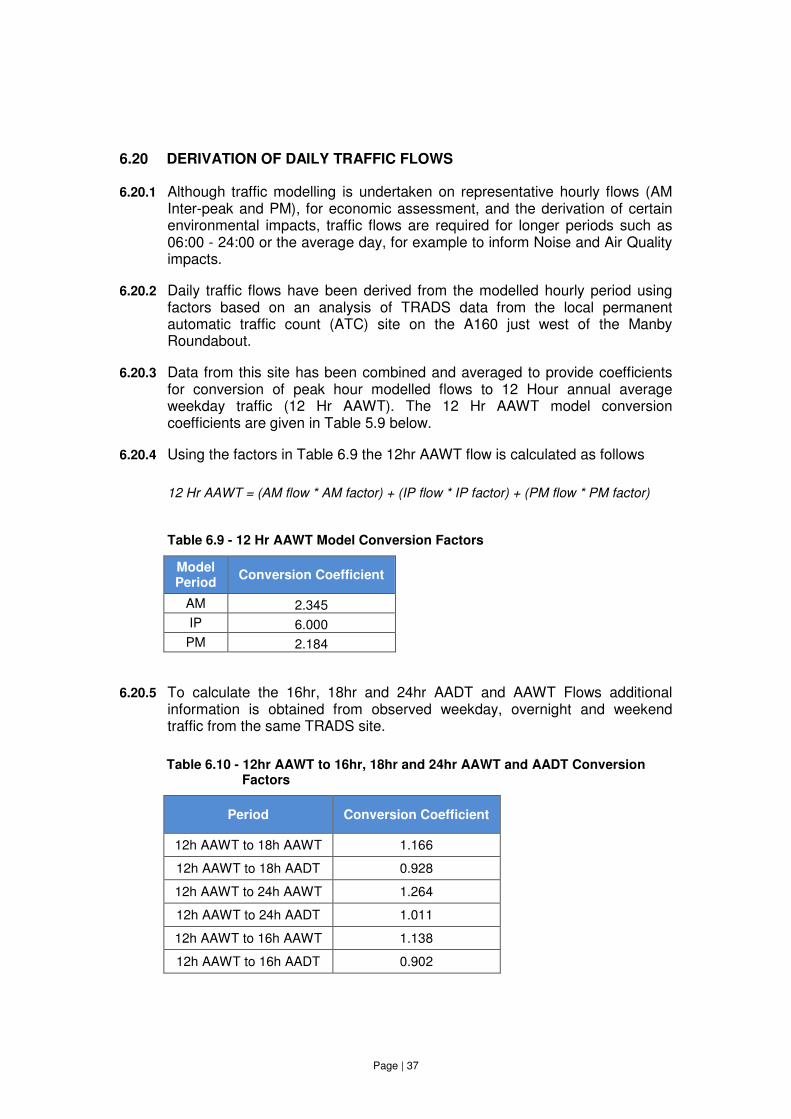
6.20 DERIVATION OF DAILY TRAFFIC FLOWS
6.20.1 Although traffic modelling is undertaken on representative hourly flows (AM Inter-peak and PM), for economic assessment, and the derivation of certain environmental impacts, traffic flows are required for longer periods such as 06:00 - 24:00 or the average day, for example to inform Noise and Air Quality impacts.
6.20.2 Daily traffic flows have been derived from the modelled hourly period using factors based on an analysis of TRADS data from the local permanent automatic traffic count (ATC) site on the A160 just west of the Manby Roundabout.
6.20.3 Data from this site has been combined and averaged to provide coefficients for conversion of peak hour modelled flows to 12 Hour annual average weekday traffic (12 Hr AAWT). The 12 Hr AAWT model conversion coefficients are given in Table 5.9 below.
6.20.4 Using the factors in Table 6.9 the 12hr AAWT flow is calculated as follows
12 Hr AAWT = (AM flow * AM factor) + (IP flow * IP factor) + (PM flow * PM factor)
Table 6.9 - 12 Hr AAWT Model Conversion Factors
Model Period
Conversion Coefficient
AM 2.345
IP 6.000
PM 2.184
6.20.5 To calculate the 16hr, 18hr and 24hr AADT and AAWT Flows additional information is obtained from observed weekday, overnight and weekend traffic from the same TRADS site.
Table 6.10 - 12hr AAWT to 16hr, 18hr and 24hr AAWT and AADT Conversion Factors
Period Conversion Coefficient
12h AAWT to 18h AAWT 1.166
12h AAWT to 18h AADT 0.928
12h AAWT to 24h AAWT 1.264
12h AAWT to 24h AADT 1.011
12h AAWT to 16h AAWT 1.138
12h AAWT to 16h AADT 0.902
Page | 38
7 CORE SCENARIO
7.1 OVERVIEW
7.1.1 The Core Scenario has been developed to provide the most realistic scenario for the operational assessment, economic assessment and environmental assessment of the scheme.
7.1.2 The Core Scenario is based on the Core TEMPRO scenario but with two additional elements added. These are
• Trips associated with the Able Development.
• Trips associated with additional Port Growth above TEMPRO.
7.1.3 The Core Scenario traffic growth is therefore higher than the Core TEMPRO traffic growth and is not constrained to TEMPRO due to these additional trips.
7.2 TRIPS ASSOCIATED WITH THE ABLE DEVELOPMENT.
7.2.1 Using the methodology described in Section 5 of this report it is not possible to constrain to TEMPRO growth and model the trips associated with the Able development without significant negative growth in background (non development) trips which would be unrealistic. For this reason the Core TEMPRO scenario has been modelled without these trips and the Core Scenario has been modelled with these trips.
7.2.2 The Transport Assessment for the Able development states that the site will not generate any car trips in the modelled AM and PM peaks but will generate car trips in the inter peak. The Able site will however generate LGV and HGV trips in the three modelled time periods.
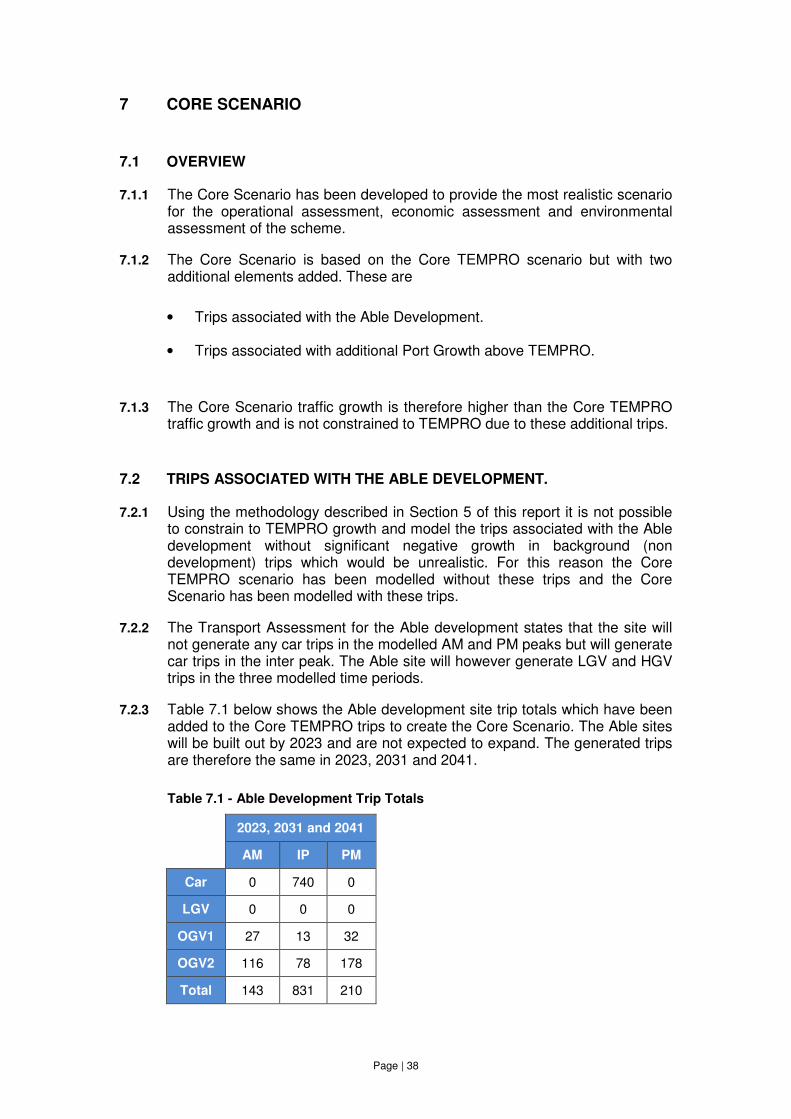
7.2.3 Table 7.1 below shows the Able development site trip totals which have been added to the Core TEMPRO trips to create the Core Scenario. The Able sites will be built out by 2023 and are not expected to expand. The generated trips are therefore the same in 2023, 2031 and 2041.
Table 7.1 - Able Development Trip Totals
2023, 2031 and 2041
AM IP PM
Car 0 740 0
LGV 0 0 0
OGV1 27 13 32
OGV2 116 78 178
Total 143 831 210
Page | 39
7.3 TRIPS ASSOCIATED WITH ADDITIONAL PORT GROWTH.
7.3.1 The 2031 and 2041 background traffic growth applied to the model zones representing the Port of Immingham and the Humber Sea Terminal is based on TEMPRO growth. When comparing against the aspiration growth of 70% predicted by ABP this level of growth is thought to be too low.
7.3.2 A more realistic level of growth has been estimated for cars using NTM 2013 Yorkshire and Humberside growth rates between 2012 and 2031 and 2012 and 2041. This growth for both years is 31%.
7.3.3 The growth difference between the background TEMPRO growth (19%-20%) and the NTM13 growth (31%) has been used to calculate the growth in car trips to and from the ports above TEMPRO. This has been added to the Core TEMPRO matrices along with the Able development trips to create the Core scenario.
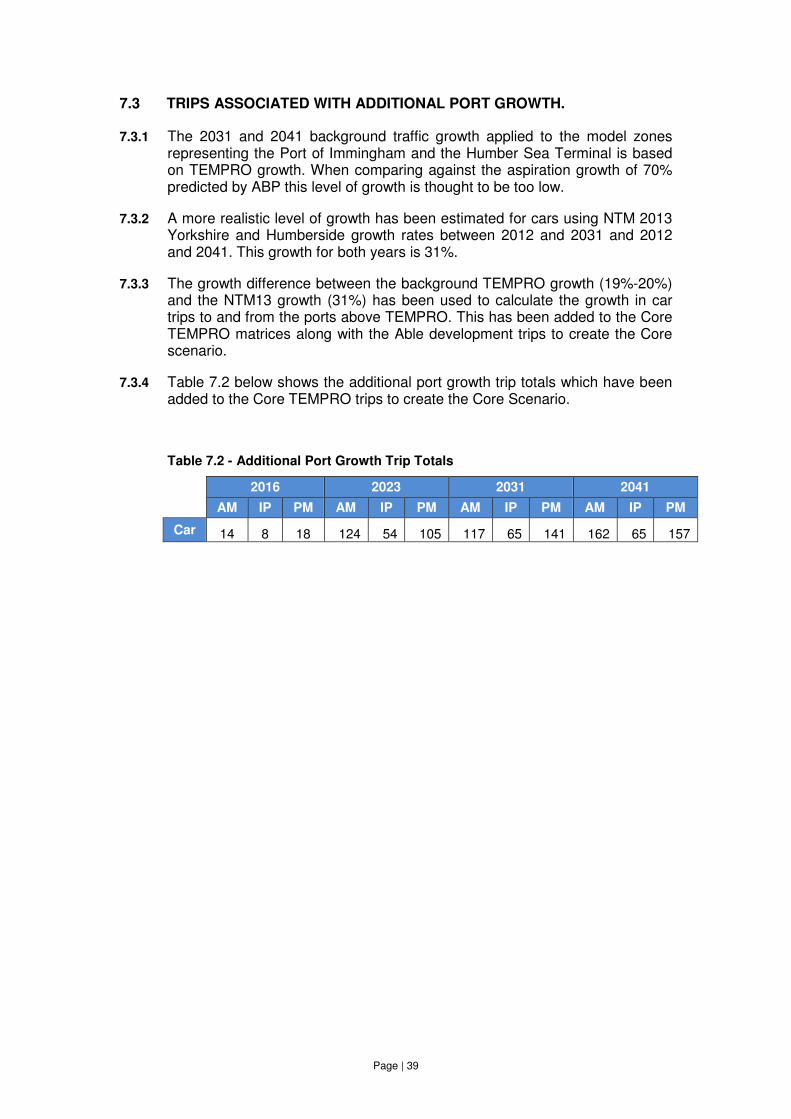
7.3.4 Table 7.2 below shows the additional port growth trip totals which have been added to the Core TEMPRO trips to create the Core Scenario.
Table 7.2 - Additional Port Growth Trip Totals
2016 2023 2031 2041
AM IP PM AM IP PM AM IP PM AM IP PM
Car 14 8 18 124 54 105 117 65 141 162 65 157
Page | 40
7.4 CORE SCENARIO MATRIX TOTALS
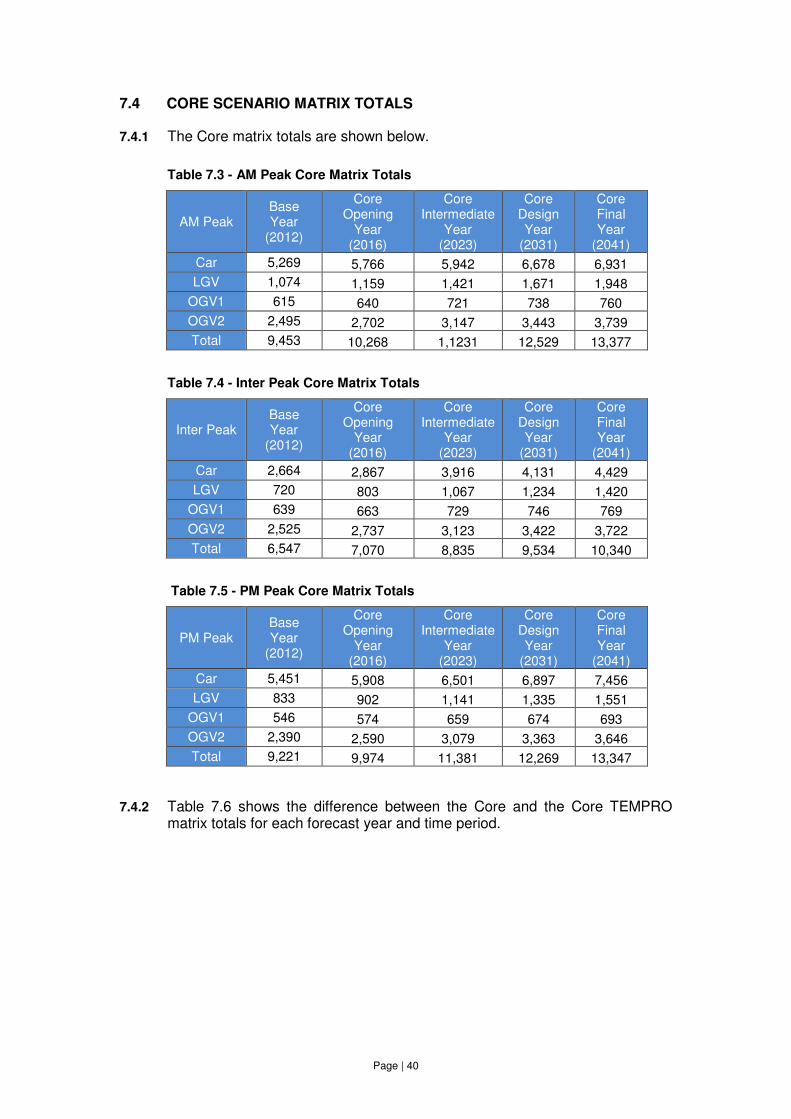
7.4.1 The Core matrix totals are shown below.
Table 7.3 - AM Peak Core Matrix Totals
AM Peak Base Year
(2012)
Core Opening
Year (2016)
Core Intermediate
Year (2023)
Core Design Year
(2031)
Core Final Year
(2041)
Car 5,269 5,766 5,942 6,678 6,931
LGV 1,074 1,159 1,421 1,671 1,948
OGV1 615 640 721 738 760
OGV2 2,495 2,702 3,147 3,443 3,739
Total 9,453 10,268 1,1231 12,529 13,377
Table 7.4 - Inter Peak Core Matrix Totals
Inter Peak Base Year
(2012)
Core Opening
Year (2016)
Core Intermediate
Year (2023)
Core Design Year
(2031)
Core Final Year
(2041)
Car 2,664 2,867 3,916 4,131 4,429
LGV 720 803 1,067 1,234 1,420
OGV1 639 663 729 746 769
OGV2 2,525 2,737 3,123 3,422 3,722
Total 6,547 7,070 8,835 9,534 10,340
Table 7.5 - PM Peak Core Matrix Totals
PM Peak Base Year
(2012)
Core Opening
Year (2016)
Core Intermediate
Year (2023)
Core Design Year
(2031)
Core Final Year
(2041)
Car 5,451 5,908 6,501 6,897 7,456
LGV 833 902 1,141 1,335 1,551
OGV1 546 574 659 674 693
OGV2 2,390 2,590 3,079 3,363 3,646
Total 9,221 9,974 11,381 12,269 13,347
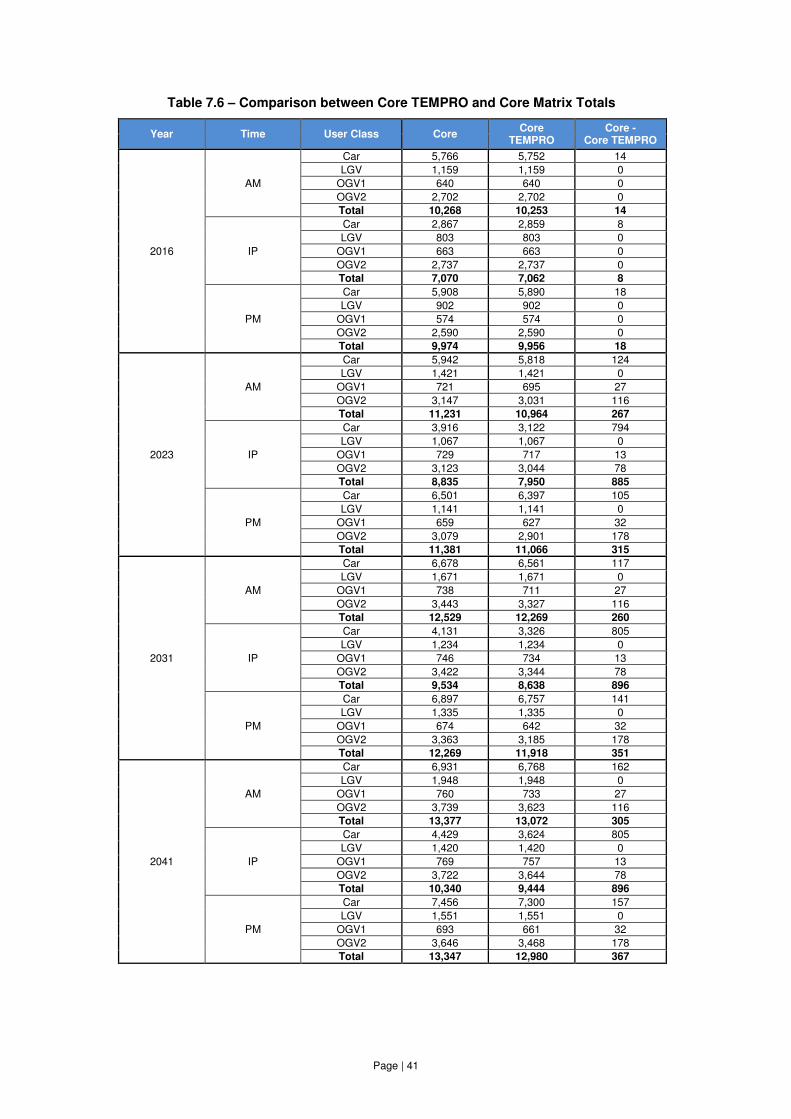
7.4.2 Table 7.6 shows the difference between the Core and the Core TEMPRO matrix totals for each forecast year and time period.
Page | 41
Table 7.6 – Comparison between Core TEMPRO and Core Matrix Totals
Year Time User Class Core Core
TEMPRO Core -
Core TEMPRO
2016
AM
Car 5,766 5,752 14
LGV 1,159 1,159 0
OGV1 640 640 0
OGV2 2,702 2,702 0
Total 10,268 10,253 14
IP
Car 2,867 2,859 8
LGV 803 803 0
OGV1 663 663 0
OGV2 2,737 2,737 0
Total 7,070 7,062 8
PM
Car 5,908 5,890 18
LGV 902 902 0
OGV1 574 574 0
OGV2 2,590 2,590 0
Total 9,974 9,956 18
2023
AM
Car 5,942 5,818 124
LGV 1,421 1,421 0
OGV1 721 695 27
OGV2 3,147 3,031 116
Total 11,231 10,964 267
IP
Car 3,916 3,122 794
LGV 1,067 1,067 0
OGV1 729 717 13
OGV2 3,123 3,044 78
Total 8,835 7,950 885
PM
Car 6,501 6,397 105
LGV 1,141 1,141 0
OGV1 659 627 32
OGV2 3,079 2,901 178
Total 11,381 11,066 315
2031
AM
Car 6,678 6,561 117
LGV 1,671 1,671 0
OGV1 738 711 27
OGV2 3,443 3,327 116
Total 12,529 12,269 260
IP
Car 4,131 3,326 805
LGV 1,234 1,234 0
OGV1 746 734 13
OGV2 3,422 3,344 78
Total 9,534 8,638 896
PM
Car 6,897 6,757 141
LGV 1,335 1,335 0
OGV1 674 642 32
OGV2 3,363 3,185 178
Total 12,269 11,918 351
2041
AM
Car 6,931 6,768 162
LGV 1,948 1,948 0
OGV1 760 733 27
OGV2 3,739 3,623 116
Total 13,377 13,072 305
IP
Car 4,429 3,624 805
LGV 1,420 1,420 0
OGV1 769 757 13
OGV2 3,722 3,644 78
Total 10,340 9,444 896
PM
Car 7,456 7,300 157
LGV 1,551 1,551 0
OGV1 693 661 32
OGV2 3,646 3,468 178
Total 13,347 12,980 367
Page | 42
8 CORE SCENARIO - FUTURE YEAR FORECASTS
8.1 FORECAST TRAFFIC FLOWS
8.1.1 The forecast traffic flows for the three modelled time periods (AM, IP, PM) and a calculated daily flow (AADT) for the opening year (2016) and design year (2031) for the Do Minimum and Do Something networks are shown in schematics in Appendix C. For Comparison the forecast traffic flows for the Core TEMPRO Scenario are shown in Appendix D.
8.2 FORECAST JOURNEY TIMES
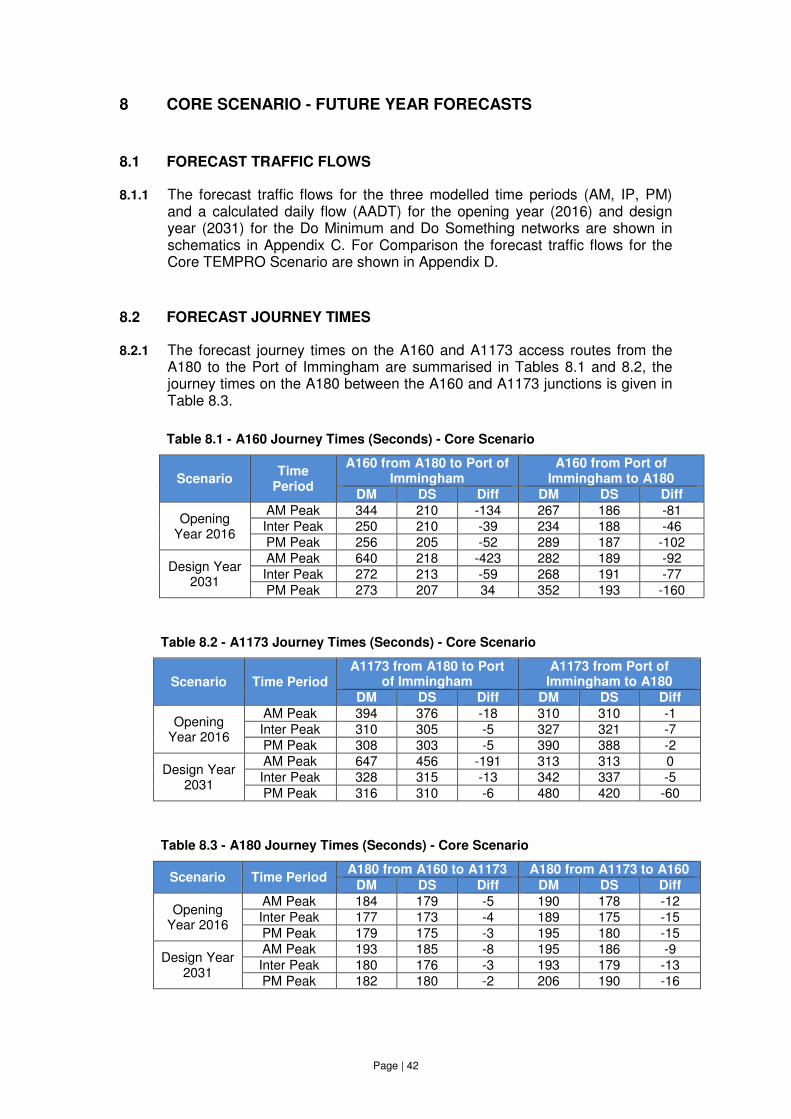
8.2.1 The forecast journey times on the A160 and A1173 access routes from the A180 to the Port of Immingham are summarised in Tables 8.1 and 8.2, the journey times on the A180 between the A160 and A1173 junctions is given in Table 8.3.
Table 8.1 - A160 Journey Times (Seconds) - Core Scenario
Scenario Time
Period
A160 from A180 to Port of Immingham
A160 from Port of Immingham to A180
DM DS Diff DM DS Diff
Opening Year 2016
AM Peak 344 210 -134 267 186 -81
Inter Peak 250 210 -39 234 188 -46
PM Peak 256 205 -52 289 187 -102
Design Year 2031
AM Peak 640 218 -423 282 189 -92
Inter Peak 272 213 -59 268 191 -77
PM Peak 273 207 34 352 193 -160
Table 8.2 - A1173 Journey Times (Seconds) - Core Scenario
Scenario Time Period A1173 from A180 to Port
of Immingham A1173 from Port of
Immingham to A180
DM DS Diff DM DS Diff
Opening Year 2016
AM Peak 394 376 -18 310 310 -1
Inter Peak 310 305 -5 327 321 -7
PM Peak 308 303 -5 390 388 -2
Design Year 2031
AM Peak 647 456 -191 313 313 0
Inter Peak 328 315 -13 342 337 -5
PM Peak 316 310 -6 480 420 -60
Table 8.3 - A180 Journey Times (Seconds) - Core Scenario
Scenario Time Period A180 from A160 to A1173 A180 from A1173 to A160
DM DS Diff DM DS Diff
Opening Year 2016
AM Peak 184 179 -5 190 178 -12
Inter Peak 177 173 -4 189 175 -15
PM Peak 179 175 -3 195 180 -15
Design Year 2031
AM Peak 193 185 -8 195 186 -9
Inter Peak 180 176 -3 193 179 -13
PM Peak 182 180 -2 206 190 -16
Page | 43
8.2.2 The modelled journey times show that in the design year the scheme will provide travel time savings relative to the DM on the A160 (between the A180 and Port of Immingham) ranging between just over 1 minute and 8 minutes depending on time period and direction.
8.2.3 In the design year the scheme provides travel time savings on the A1173 for the AM peak of up to 4 minutes between the A180 and the Port of Immingham. In the PM peak there is a time saving of 1.5 minutes. This is mainly due to changes in delay at the A160/A1173 roundabout but also along the A1173 corridor, most notably at the junctions to the town of Immingham.
8.2.4 Time savings on the A180 between the A160 and A1173 junctions of less than 1 minute occur for all time periods but are all relatively small, being no more than 17 seconds.
8.3 FORECAST CONGESTION
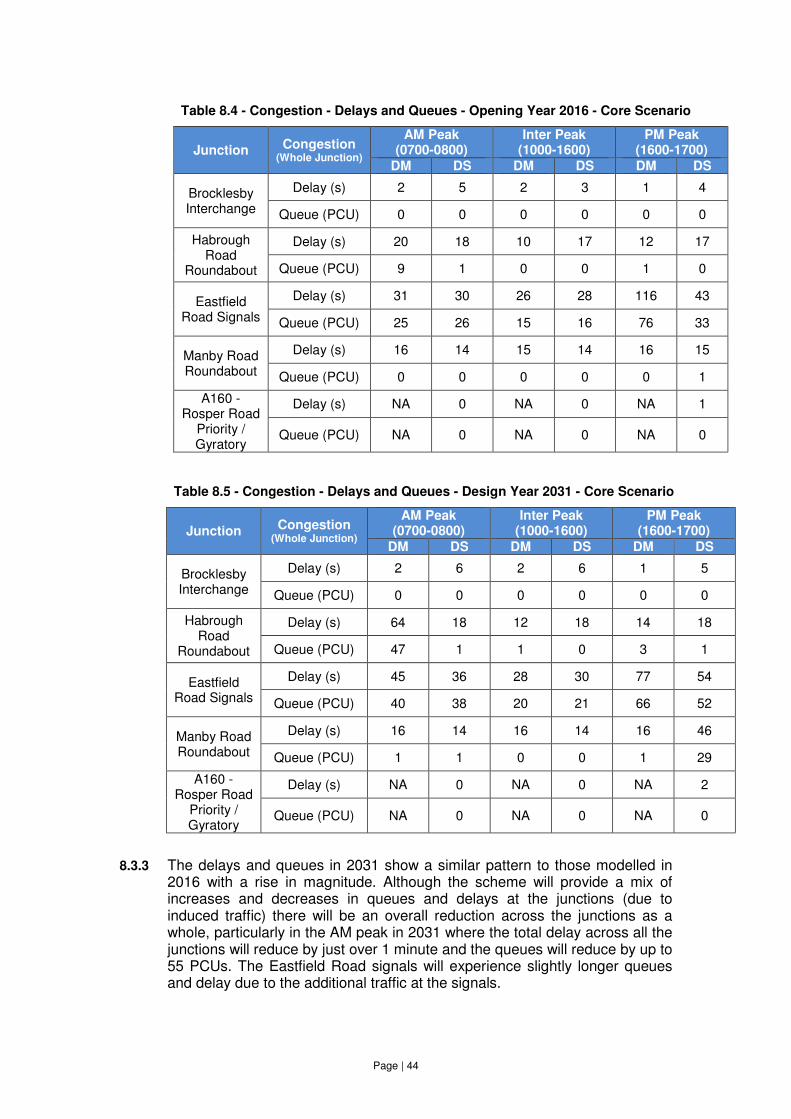
8.3.1 The level of congestion along the A160 corridor can be measured by considering the vehicle delay and queuing at the four main junctions as follows:
• Brocklesby Interchange;
• Habrough Road Roundabout;
• Eastfield Road Signals;
• Manby Road Roundabout; and
• A160 - Rosper Road Priority / Gyratory.
8.3.2 The delay and queuing levels from the forecast model assignments for each time period (AM, Inter Peak and PM) for these four junctions are summarised in Table 8.4 for the opening year (2016) and Table 8.5 for the design year (2031).
Page | 44
Table 8.5 - Congestion - Delays and Queues - Design Year 2031 - Core Scenario
Table 8.4 - Congestion - Delays and Queues - Opening Year 2016 - Core Scenario
Junction Congestion (Whole Junction)
AM Peak (0700-0800)
Inter Peak (1000-1600)
PM Peak (1600-1700)
DM DS DM DS DM DS
Brocklesby Interchange
Delay (s) 2 5 2 3 1 4
Queue (PCU) 0 0 0 0 0 0
Habrough Road
Roundabout
Delay (s) 20 18 10 17 12 17
Queue (PCU) 9 1 0 0 1 0
Eastfield Road Signals
Delay (s) 31 30 26 28 116 43
Queue (PCU) 25 26 15 16 76 33
Manby Road Roundabout
Delay (s) 16 14 15 14 16 15
Queue (PCU) 0 0 0 0 0 1
A160 -Rosper Road
Priority / Gyratory
Delay (s) NA 0 NA 0 NA 1
Queue (PCU) NA 0 NA 0 NA 0
Junction Congestion (Whole Junction)
AM Peak (0700-0800)
Inter Peak (1000-1600)
PM Peak (1600-1700)
DM DS DM DS DM DS
Brocklesby Interchange
Delay (s) 2 6 2 6 1 5
Queue (PCU) 0 0 0 0 0 0
Habrough Road
Roundabout
Delay (s) 64 18 12 18 14 18
Queue (PCU) 47 1 1 0 3 1
Eastfield Road Signals
Delay (s) 45 36 28 30 77 54
Queue (PCU) 40 38 20 21 66 52
Manby Road Roundabout
Delay (s) 16 14 16 14 16 46
Queue (PCU) 1 1 0 0 1 29
A160 -Rosper Road
Priority / Gyratory
Delay (s) NA 0 NA 0 NA 2
Queue (PCU) NA 0 NA 0 NA 0
8.3.3 The delays and queues in 2031 show a similar pattern to those modelled in 2016 with a rise in magnitude. Although the scheme will provide a mix of increases and decreases in queues and delays at the junctions (due to induced traffic) there will be an overall reduction across the junctions as a whole, particularly in the AM peak in 2031 where the total delay across all the junctions will reduce by just over 1 minute and the queues will reduce by up to 55 PCUs. The Eastfield Road signals will experience slightly longer queues and delay due to the additional traffic at the signals.
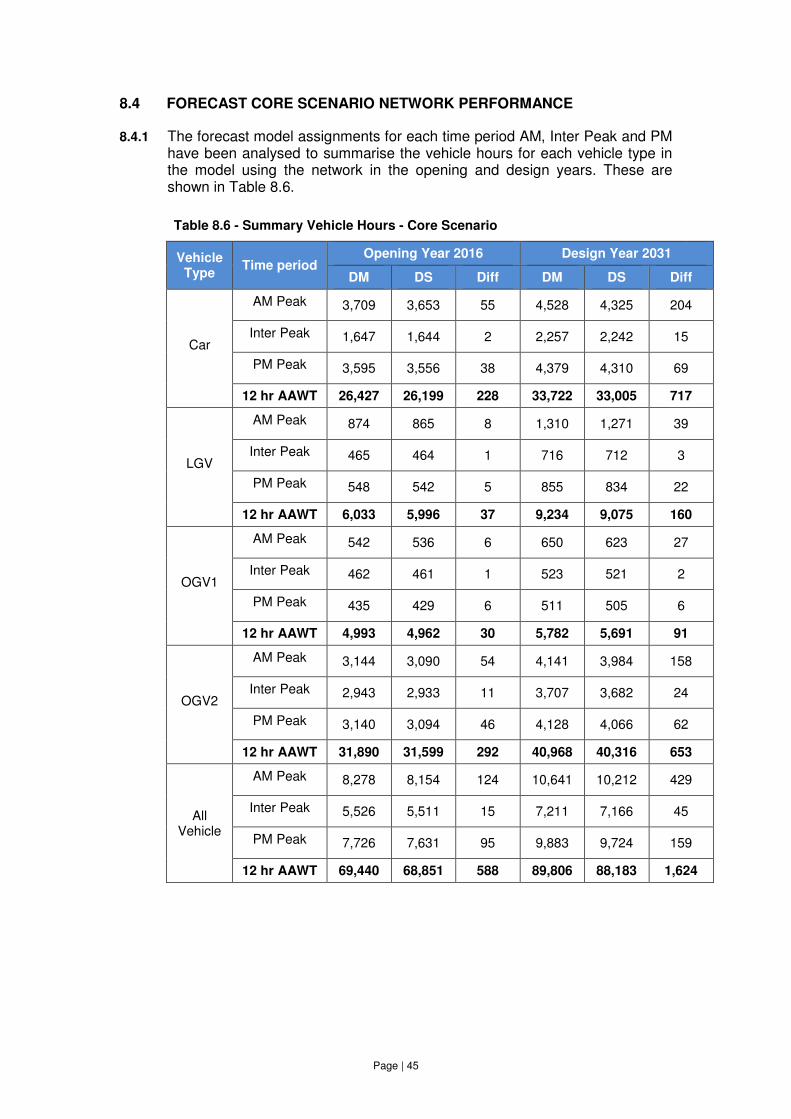
Page | 45
8.4 FORECAST CORE SCENARIO NETWORK PERFORMANCE
8.4.1 The forecast model assignments for each time period AM, Inter Peak and PM have been analysed to summarise the vehicle hours for each vehicle type in the model using the network in the opening and design years. These are shown in Table 8.6.
Table 8.6 - Summary Vehicle Hours - Core Scenario
Vehicle Type
Time period Opening Year 2016 Design Year 2031
DM DS Diff DM DS Diff
Car
AM Peak 3,709 3,653 55 4,528 4,325 204
Inter Peak 1,647 1,644 2 2,257 2,242 15
PM Peak 3,595 3,556 38 4,379 4,310 69
12 hr AAWT 26,427 26,199 228 33,722 33,005 717
LGV
AM Peak 874 865 8 1,310 1,271 39
Inter Peak 465 464 1 716 712 3
PM Peak 548 542 5 855 834 22
12 hr AAWT 6,033 5,996 37 9,234 9,075 160
OGV1
AM Peak 542 536 6 650 623 27
Inter Peak 462 461 1 523 521 2
PM Peak 435 429 6 511 505 6
12 hr AAWT 4,993 4,962 30 5,782 5,691 91
OGV2
AM Peak 3,144 3,090 54 4,141 3,984 158
Inter Peak 2,943 2,933 11 3,707 3,682 24
PM Peak 3,140 3,094 46 4,128 4,066 62
12 hr AAWT 31,890 31,599 292 40,968 40,316 653
All Vehicle
AM Peak 8,278 8,154 124 10,641 10,212 429
Inter Peak 5,526 5,511 15 7,211 7,166 45
PM Peak 7,726 7,631 95 9,883 9,724 159
12 hr AAWT 69,440 68,851 588 89,806 88,183 1,624
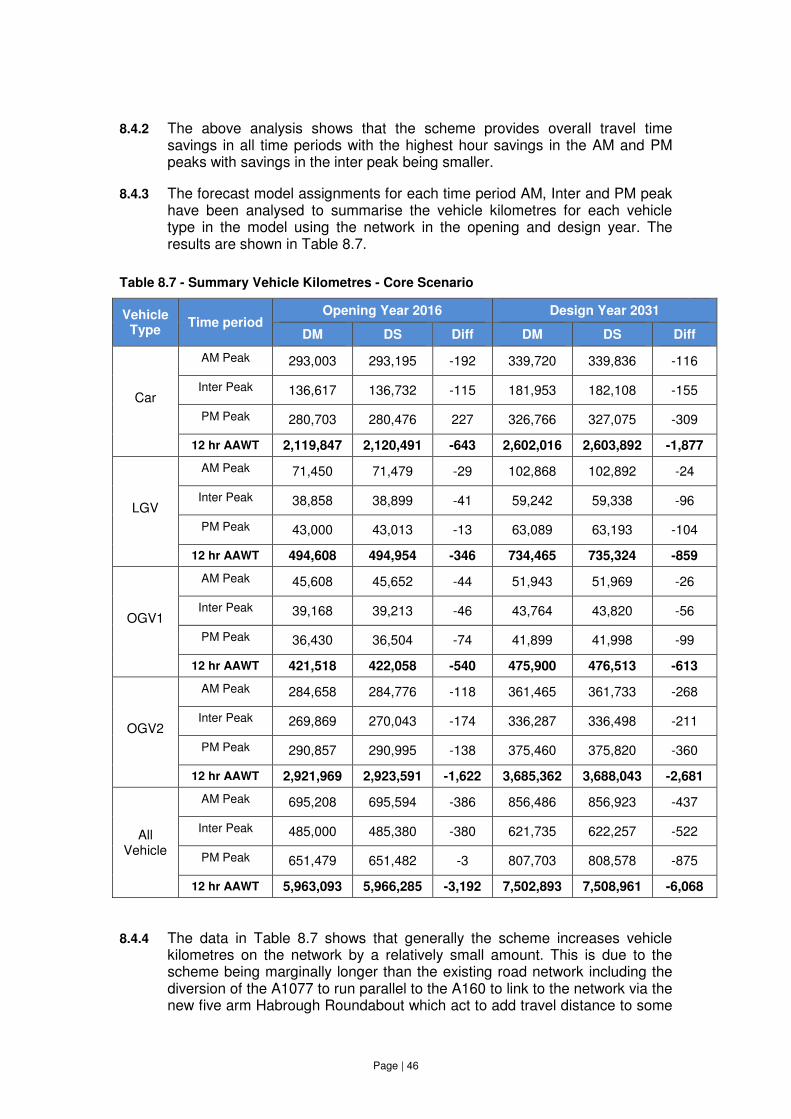
Page | 46
8.4.2 The above analysis shows that the scheme provides overall travel time
savings in all time periods with the highest hour savings in the AM and PM peaks with savings in the inter peak being smaller.
8.4.3 The forecast model assignments for each time period AM, Inter and PM peak have been analysed to summarise the vehicle kilometres for each vehicle type in the model using the network in the opening and design year. The results are shown in Table 8.7.
Table 8.7 - Summary Vehicle Kilometres - Core Scenario
Vehicle Type
Time period Opening Year 2016 Design Year 2031
DM DS Diff DM DS Diff
Car
AM Peak 293,003 293,195 -192 339,720 339,836 -116
Inter Peak 136,617 136,732 -115 181,953 182,108 -155
PM Peak 280,703 280,476 227 326,766 327,075 -309
12 hr AAWT 2,119,847 2,120,491 -643 2,602,016 2,603,892 -1,877
LGV
AM Peak 71,450 71,479 -29 102,868 102,892 -24
Inter Peak 38,858 38,899 -41 59,242 59,338 -96
PM Peak 43,000 43,013 -13 63,089 63,193 -104
12 hr AAWT 494,608 494,954 -346 734,465 735,324 -859
OGV1
AM Peak 45,608 45,652 -44 51,943 51,969 -26
Inter Peak 39,168 39,213 -46 43,764 43,820 -56
PM Peak 36,430 36,504 -74 41,899 41,998 -99
12 hr AAWT 421,518 422,058 -540 475,900 476,513 -613
OGV2
AM Peak 284,658 284,776 -118 361,465 361,733 -268
Inter Peak 269,869 270,043 -174 336,287 336,498 -211
PM Peak 290,857 290,995 -138 375,460 375,820 -360
12 hr AAWT 2,921,969 2,923,591 -1,622 3,685,362 3,688,043 -2,681
All Vehicle
AM Peak 695,208 695,594 -386 856,486 856,923 -437
Inter Peak 485,000 485,380 -380 621,735 622,257 -522
PM Peak 651,479 651,482 -3 807,703 808,578 -875
12 hr AAWT 5,963,093 5,966,285 -3,192 7,502,893 7,508,961 -6,068
8.4.4 The data in Table 8.7 shows that generally the scheme increases vehicle kilometres on the network by a relatively small amount. This is due to the scheme being marginally longer than the existing road network including the diversion of the A1077 to run parallel to the A160 to link to the network via the new five arm Habrough Roundabout which act to add travel distance to some
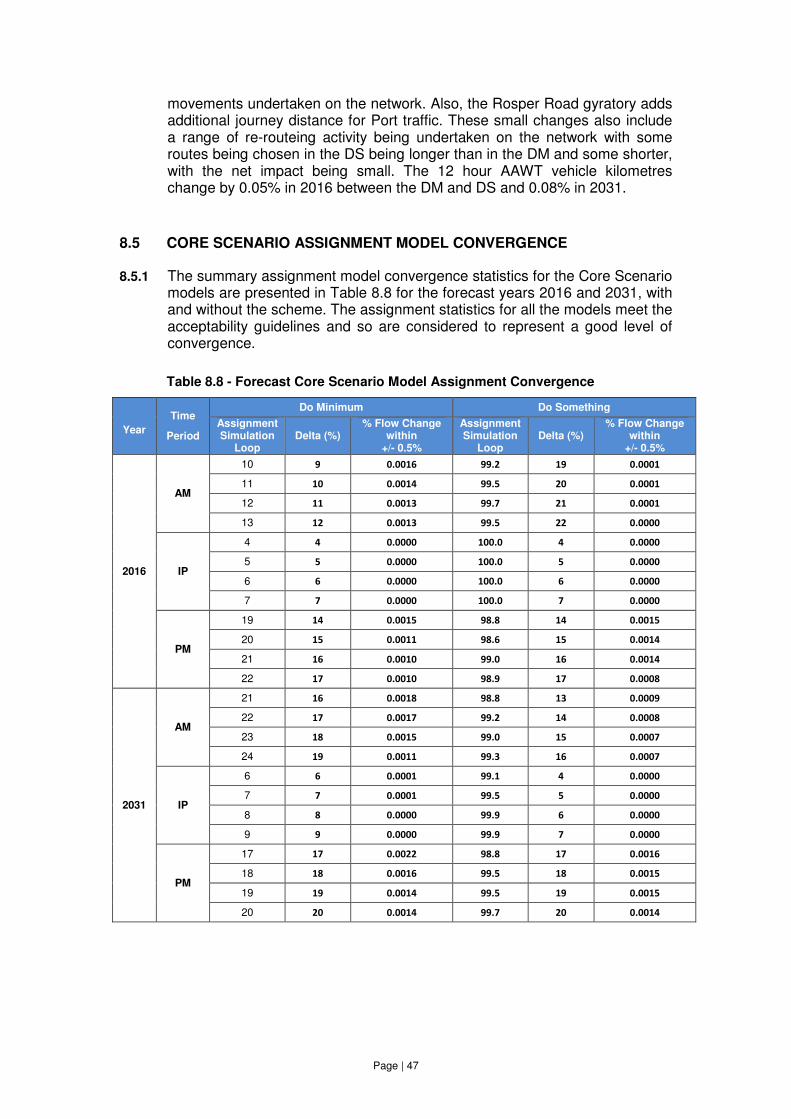
Page | 47
movements undertaken on the network. Also, the Rosper Road gyratory adds additional journey distance for Port traffic. These small changes also include a range of re-routeing activity being undertaken on the network with some routes being chosen in the DS being longer than in the DM and some shorter, with the net impact being small. The 12 hour AAWT vehicle kilometres change by 0.05% in 2016 between the DM and DS and 0.08% in 2031.
8.5 CORE SCENARIO ASSIGNMENT MODEL CONVERGENCE
8.5.1 The summary assignment model convergence statistics for the Core Scenario models are presented in Table 8.8 for the forecast years 2016 and 2031, with and without the scheme. The assignment statistics for all the models meet the acceptability guidelines and so are considered to represent a good level of convergence.
Table 8.8 - Forecast Core Scenario Model Assignment Convergence
Year
Time
Period
Do Minimum Do Something
Assignment Simulation
Loop Delta (%)
% Flow Change within
+/- 0.5%
Assignment Simulation
Loop Delta (%)
% Flow Change within
+/- 0.5%
2016
AM
10 9 0.0016 99.2 19 0.0001
11 10 0.0014 99.5 20 0.0001
12 11 0.0013 99.7 21 0.0001
13 12 0.0013 99.5 22 0.0000
IP
4 4 0.0000 100.0 4 0.0000
5 5 0.0000 100.0 5 0.0000
6 6 0.0000 100.0 6 0.0000
7 7 0.0000 100.0 7 0.0000
PM
19 14 0.0015 98.8 14 0.0015
20 15 0.0011 98.6 15 0.0014
21 16 0.0010 99.0 16 0.0014
22 17 0.0010 98.9 17 0.0008
2031
AM
21 16 0.0018 98.8 13 0.0009
22 17 0.0017 99.2 14 0.0008
23 18 0.0015 99.0 15 0.0007
24 19 0.0011 99.3 16 0.0007
IP
6 6 0.0001 99.1 4 0.0000
7 7 0.0001 99.5 5 0.0000
8 8 0.0000 99.9 6 0.0000
9 9 0.0000 99.9 7 0.0000
PM
17 17 0.0022 98.8 17 0.0016
18 18 0.0016 99.5 18 0.0015
19 19 0.0014 99.5 19 0.0015
20 20 0.0014 99.7 20 0.0014
Page | 48
9 HIGH AND LOW SENSITIVITY TEST RESULTS
9.1 OVERVIEW
9.1.1 WebTAG Unit 3.15.5 states that schemes should be tested to incorporate national economic uncertainties. This is done by reducing or increasing core scenario highway growth to create a high growth and a low growth scenario sensitivity test.
9.1.2 The following methodology has been used to identify the sensitivity tests needed, and to specify inputs from the Uncertainty Log to be included within each one. The methodology to develop these two sensitivity tests was also discussed and agreed with the Highways Agency.
9.1.3 To produce the matrices for the High growth Scenario, the uncertainty threshold was lowered so that all the ‘reasonably foreseeable’ developments from the Uncertainty Log were included in the growth forecasts, in addition to the ‘near certain’ and ‘more than likely’ already present in the Core Scenario. Secondly, national uncertainty, covering such items as GDP growth, fuel price trends, vehicle efficiency changes and other national trends, has been assessed by following the guidance given in WebTAG Unit 3.15.5, to factor the matrices as follows:
• High Growth Scenario, 2012 to 2016 = +2.5% x √(2016-2012) = +5.0%
• High Growth Scenario, 2012 to 2023 = +2.5% x √(2023-2012) = +8.3%
• High Growth Scenario, 2012 to 2031 = +2.5% x √(2031-2012) = +10.9%
• High Growth Scenario, 2012 to 2041 = +2.5% x √(2041-2012) = +13.5%
9.1.4 The Low Growth Scenario was developed in a similar way. For the matrices, the uncertainty threshold was raised so that only the ‘near certain’ developments from the Uncertainty Log were included i.e. the ‘more than likely’ developments were excluded. Secondly, national uncertainty has been assessed in the same way, to factor the matrices as follows:
• Low Growth Scenario, 2012 to 2016 = -2.5% x √(2016-2012) = -5.0%
• Low Growth Scenario, 2012 to 2023 = -2.5% x √(2023-2012) = -8.3%
• Low Growth Scenario, 2012 to 2031 = -2.5% x √(2031-2012) = -10.9%
• Low Growth Scenario, 2012 to 2041 = -2.5% x √(2041-2012) = -13.5%
Page | 49
9.2 HIGH GROWTH SCENARIO
9.2.1 The high growth scenario is based on the Core TEMPRO scenario but has had the national uncertainty applied to the TEMPRO factors to create a higher growth due to TEMPRO. In addition to this higher TEMPRO growth the development trips associated with the reasonably foreseeable developments identified in the uncertainty log and also the Able development sites have been added.
9.2.2 For the high growth scenario the Humber Sea Terminal and Port of Immingham traffic growth to 2031 has been assumed to be 70%5. The same methodology as the Core scenario has been followed so that the total port growth including the higher growth due to TEMPRO is 70%.
9.2.3 The high growth matrix totals and a comparison with core scenario matrix totals are shown in Table 9.1 below.
5 ABP, Port of Immingham Master Plan 2010-2030, October 2012
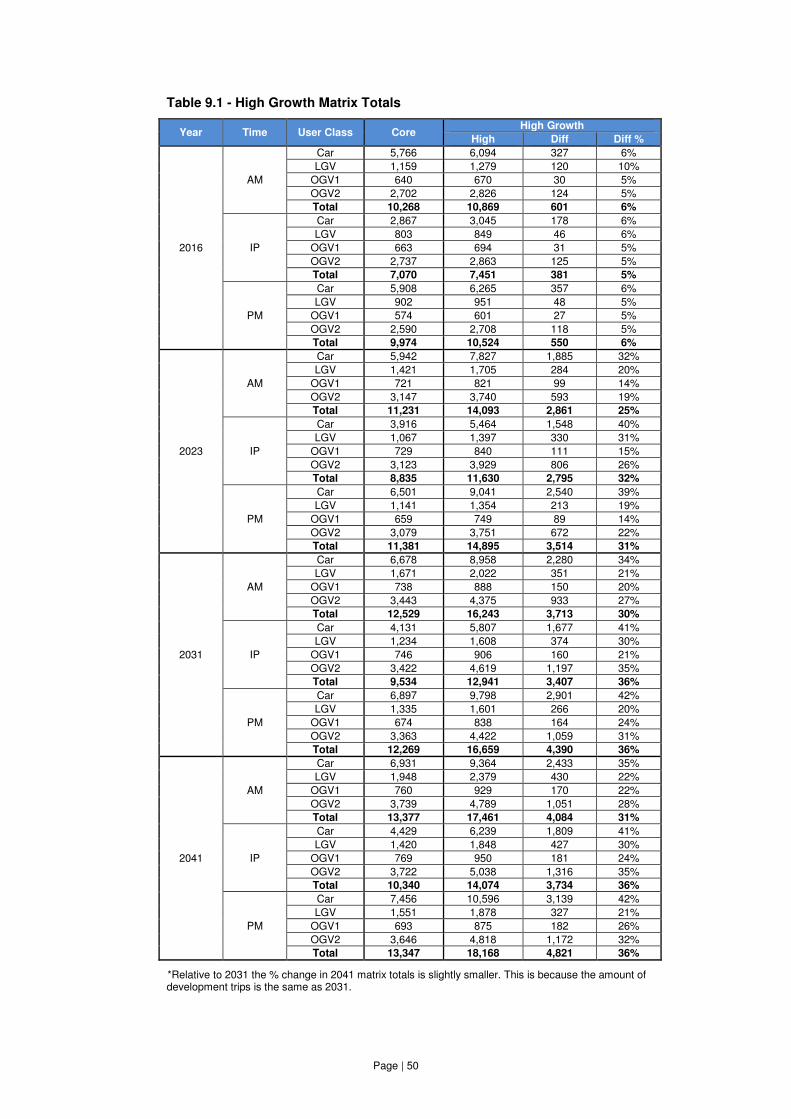
Page | 50
Table 9.1 - High Growth Matrix Totals
Year Time User Class Core High Growth
High Diff Diff %
2016
AM
Car 5,766 6,094 327 6%
LGV 1,159 1,279 120 10%
OGV1 640 670 30 5%
OGV2 2,702 2,826 124 5%
Total 10,268 10,869 601 6%
IP
Car 2,867 3,045 178 6%
LGV 803 849 46 6%
OGV1 663 694 31 5%
OGV2 2,737 2,863 125 5%
Total 7,070 7,451 381 5%
PM
Car 5,908 6,265 357 6%
LGV 902 951 48 5%
OGV1 574 601 27 5%
OGV2 2,590 2,708 118 5%
Total 9,974 10,524 550 6%
2023
AM
Car 5,942 7,827 1,885 32%
LGV 1,421 1,705 284 20%
OGV1 721 821 99 14%
OGV2 3,147 3,740 593 19%
Total 11,231 14,093 2,861 25%
IP
Car 3,916 5,464 1,548 40%
LGV 1,067 1,397 330 31%
OGV1 729 840 111 15%
OGV2 3,123 3,929 806 26%
Total 8,835 11,630 2,795 32%
PM
Car 6,501 9,041 2,540 39%
LGV 1,141 1,354 213 19%
OGV1 659 749 89 14%
OGV2 3,079 3,751 672 22%
Total 11,381 14,895 3,514 31%
2031
AM
Car 6,678 8,958 2,280 34%
LGV 1,671 2,022 351 21%
OGV1 738 888 150 20%
OGV2 3,443 4,375 933 27%
Total 12,529 16,243 3,713 30%
IP
Car 4,131 5,807 1,677 41%
LGV 1,234 1,608 374 30%
OGV1 746 906 160 21%
OGV2 3,422 4,619 1,197 35%
Total 9,534 12,941 3,407 36%
PM
Car 6,897 9,798 2,901 42%
LGV 1,335 1,601 266 20%
OGV1 674 838 164 24%
OGV2 3,363 4,422 1,059 31%
Total 12,269 16,659 4,390 36%
2041
AM
Car 6,931 9,364 2,433 35%
LGV 1,948 2,379 430 22%
OGV1 760 929 170 22%
OGV2 3,739 4,789 1,051 28%
Total 13,377 17,461 4,084 31%
IP
Car 4,429 6,239 1,809 41%
LGV 1,420 1,848 427 30%
OGV1 769 950 181 24%
OGV2 3,722 5,038 1,316 35%
Total 10,340 14,074 3,734 36%
PM
Car 7,456 10,596 3,139 42%
LGV 1,551 1,878 327 21%
OGV1 693 875 182 26%
OGV2 3,646 4,818 1,172 32%
Total 13,347 18,168 4,821 36%
*Relative to 2031 the % change in 2041 matrix totals is slightly smaller. This is because the amount of development trips is the same as 2031.
Page | 51
9.3 HIGH GROWTH TRAFFIC FLOWS ON STRATEGIC ROADS
9.3.1 The high growth, strategic road traffic flows are shown in Appendix E.
9.4 LOW GROWTH SCENARIO
9.4.1 The low growth scenario is based on the Core TEMPRO scenario but has had the national uncertainty applied to the TEMPRO factors to create a lower growth due to TEMPRO.
9.4.2 The development trips associated with the more than likely developments identified in the uncertainty log have been removed. The low growth scenario does not contain the Able development.
9.4.3 No additional port growth has been added to the low growth scenario. The only growth associated with the Humber sea Terminal and the Port of Immingham is background traffic growth as a result of the TEMPRO growth.
9.4.4 The low growth matrix totals and a comparison with core scenario matrix totals are shown in Table 9.2 below.
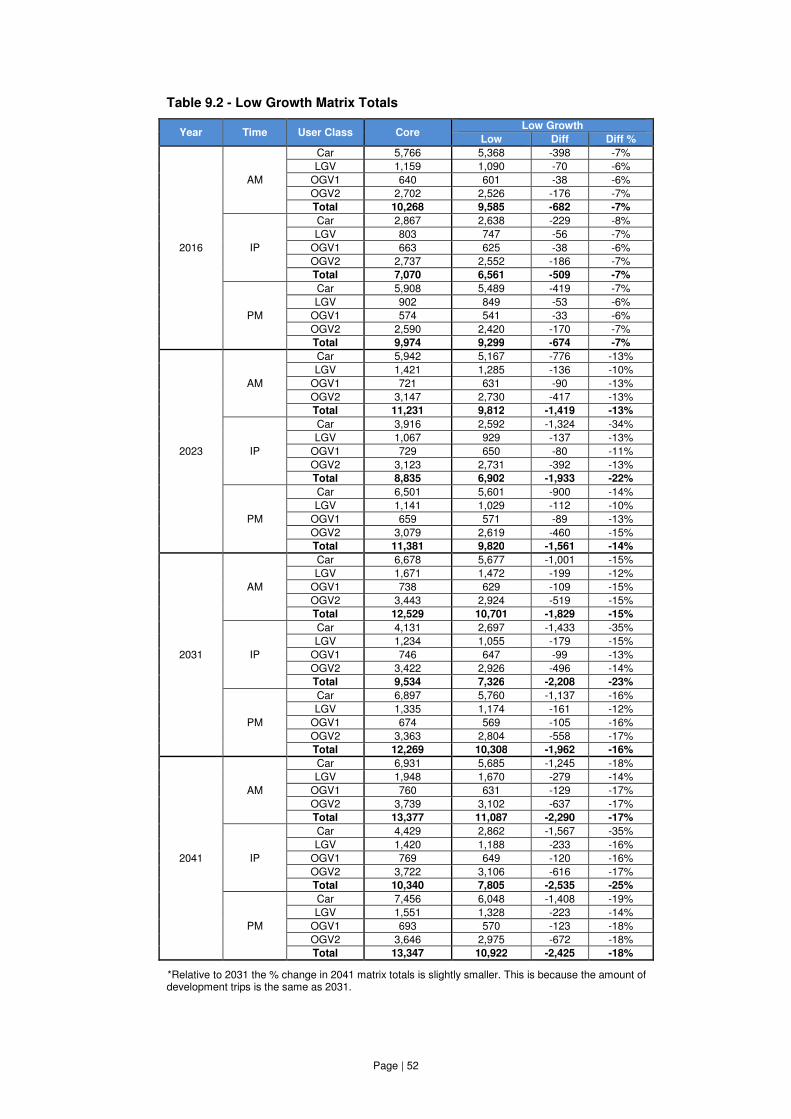
Page | 52
Table 9.2 - Low Growth Matrix Totals
Year Time User Class Core Low Growth
Low Diff Diff %
2016
AM
Car 5,766 5,368 -398 -7%
LGV 1,159 1,090 -70 -6%
OGV1 640 601 -38 -6%
OGV2 2,702 2,526 -176 -7%
Total 10,268 9,585 -682 -7%
IP
Car 2,867 2,638 -229 -8%
LGV 803 747 -56 -7%
OGV1 663 625 -38 -6%
OGV2 2,737 2,552 -186 -7%
Total 7,070 6,561 -509 -7%
PM
Car 5,908 5,489 -419 -7%
LGV 902 849 -53 -6%
OGV1 574 541 -33 -6%
OGV2 2,590 2,420 -170 -7%
Total 9,974 9,299 -674 -7%
2023
AM
Car 5,942 5,167 -776 -13%
LGV 1,421 1,285 -136 -10%
OGV1 721 631 -90 -13%
OGV2 3,147 2,730 -417 -13%
Total 11,231 9,812 -1,419 -13%
IP
Car 3,916 2,592 -1,324 -34%
LGV 1,067 929 -137 -13%
OGV1 729 650 -80 -11%
OGV2 3,123 2,731 -392 -13%
Total 8,835 6,902 -1,933 -22%
PM
Car 6,501 5,601 -900 -14%
LGV 1,141 1,029 -112 -10%
OGV1 659 571 -89 -13%
OGV2 3,079 2,619 -460 -15%
Total 11,381 9,820 -1,561 -14%
2031
AM
Car 6,678 5,677 -1,001 -15%
LGV 1,671 1,472 -199 -12%
OGV1 738 629 -109 -15%
OGV2 3,443 2,924 -519 -15%
Total 12,529 10,701 -1,829 -15%
IP
Car 4,131 2,697 -1,433 -35%
LGV 1,234 1,055 -179 -15%
OGV1 746 647 -99 -13%
OGV2 3,422 2,926 -496 -14%
Total 9,534 7,326 -2,208 -23%
PM
Car 6,897 5,760 -1,137 -16%
LGV 1,335 1,174 -161 -12%
OGV1 674 569 -105 -16%
OGV2 3,363 2,804 -558 -17%
Total 12,269 10,308 -1,962 -16%
2041
AM
Car 6,931 5,685 -1,245 -18%
LGV 1,948 1,670 -279 -14%
OGV1 760 631 -129 -17%
OGV2 3,739 3,102 -637 -17%
Total 13,377 11,087 -2,290 -17%
IP
Car 4,429 2,862 -1,567 -35%
LGV 1,420 1,188 -233 -16%
OGV1 769 649 -120 -16%
OGV2 3,722 3,106 -616 -17%
Total 10,340 7,805 -2,535 -25%
PM
Car 7,456 6,048 -1,408 -19%
LGV 1,551 1,328 -223 -14%
OGV1 693 570 -123 -18%
OGV2 3,646 2,975 -672 -18%
Total 13,347 10,922 -2,425 -18%
*Relative to 2031 the % change in 2041 matrix totals is slightly smaller. This is because the amount of development trips is the same as 2031.

Page | 53
9.5 LOW GROWTH TRAFFIC FLOWS ON STRATEGIC ROADS
9.5.1 The low growth, strategic road traffic flows are shown in Appendix F.
Page | 54
10 SUMMARY AND CONCLUSION
10.1 SUMMARY
10.1.1 The A160 Port of Immingham Improvements traffic forecasts have been developed from an interim forecast year (2012) model which was developed from a calibrated and validated base year 2010 traffic model. The process used in developing the traffic forecasts have been based on current WebTAG and DMRB guidance.
10.1.2 Forecast travel demand has been based on initially factoring the base year trip matrices to an interim forecast year of 2012 then applying traffic growth and development trips to represent the opening (2016), intermediate year (2023), design year (2031) and final year (2041) projected demand. These forecasts used a combination of DfT growth factors as from in the National Trip End Model (NTEM) as implemented in the TEMPRO (6.2 dataset) and the 2011 National Traffic Model (NTM) road traffic forecast. Travel demand associated with development proposals, most notably in land adjacent to and within the existing Port of Immingham has been incorporated into the forecasts. The development projections have also been used to adjust the TEMPRO growth in line with current WebTAG guidance.
10.1.3 The Do Minimum network uses the base year highway networks, with modifications to represent proposals associated with the ‘Immingham Bypass’ scheme. The Do Minimum network was then modified to include the A160 Port of Immingham Improvements proposals to create the Do Something network.
10.1.4 Forecast travel demand was then assigned to both the Do Minimum and Do Something networks to give future traffic levels on the network. The Do Something forecast assignments show that the A160 Port of Immingham Improvements scheme reduces travel times compared to the Do Minimum.
10.2 CONCLUSION
10.2.1 The forecasts documented in the appendices of this report provide estimates of traffic movements and operations on the A160 Port of Immingham Improvements scheme and adjacent road network for the future opening year (2016) and design year (2031). In addition, the forecasts have been undertaken to provide an estimate of traffic relating to the Do Minimum situation without the A160 Port of Immingham Improvements.
10.2.2 These forecasts show that the proposed scheme improves traffic conditions in the area by reducing delay along the A160 corridor between the A180 and the Port of Immingham. This reduction in traffic delay results in a rise in traffic volumes on the A160, due to re-assignment from a range of alternative routes.
10.2.3 The Do Minimum and Do Something forecasts are suitable for use in the economic and environmental assessment of the A160 Port of Immingham Improvements. Additionally, the traffic forecasts will be used in the preliminary and detailed design of the scheme.

Appendix A
Uncertainty Log
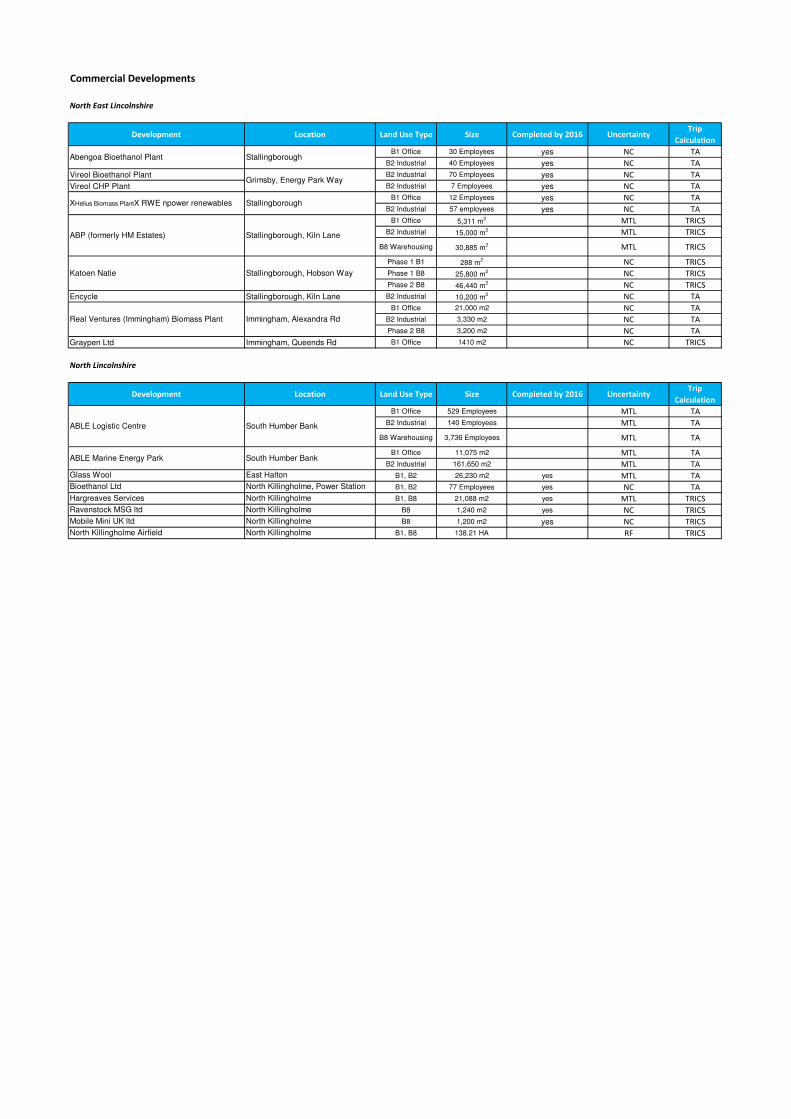
Commercial Developments
North East Lincolnshire
Development Location Land Use Type Size Completed by 2016 UncertaintyTrip
Calculation
B1 Office 30 Employees yes NC TA
B2 Industrial 40 Employees yes NC TA
Vireol Bioethanol Plant B2 Industrial 70 Employees yes NC TA
Vireol CHP Plant B2 Industrial 7 Employees yes NC TA
B1 Office 12 Employees yes NC TA
B2 Industrial 57 employees yes NC TA
B1 Office 5,311 m2
MTL TRICS
B2 Industrial 15,000 m2
MTL TRICS
B8 Warehousing 30,885 m2
MTL TRICS
Phase 1 B1 288 m2
NC TRICS
Phase 1 B8 25,800 m2
NC TRICS
Phase 2 B8 46,440 m2
NC TRICS
Encycle Stallingborough, Kiln Lane B2 Industrial 10,200 m2
NC TA
B1 Office 21,000 m2 NC TA
B2 Industrial 3,330 m2 NC TA
Phase 2 B8 3,200 m2 NC TA
Graypen Ltd Immingham, Queends Rd B1 Office 1410 m2 NC TRICS
North Lincolnshire
Development Location Land Use Type Size Completed by 2016 UncertaintyTrip
Calculation
B1 Office 529 Employees MTL TA
B2 Industrial 140 Employees MTL TA
B8 Warehousing 3,736 Employees MTL TA
B1 Office 11,075 m2 MTL TA
B2 Industrial 161,650 m2 MTL TA
Glass Wool East Halton B1, B2 26,230 m2 yes MTL TA
Bioethanol Ltd North Killingholme, Power Station B1, B2 77 Employees yes NC TA
Hargreaves Services North Killingholme B1, B8 21,088 m2 yes MTL TRICS
Ravenstock MSG ltd North Killingholme B8 1,240 m2 yes NC TRICS
Mobile Mini UK ltd North Killingholme B8 1,200 m2 yes NC TRICS
North Killingholme Airfield North Killingholme B1, B8 138.21 HA RF TRICS
ABLE Marine Energy Park South Humber Bank
ABLE Logistic Centre South Humber Bank
Stallingborough
Stallingborough
Stallingborough, Kiln Lane
Stallingborough, Hobson Way
Immingham, Alexandra Rd
Grimsby, Energy Park Way
Abengoa Bioethanol Plant
XHelius Biomass PlantX RWE npower renewables
ABP (formerly HM Estates)
Katoen Natie
Real Ventures (Immingham) Biomass Plant
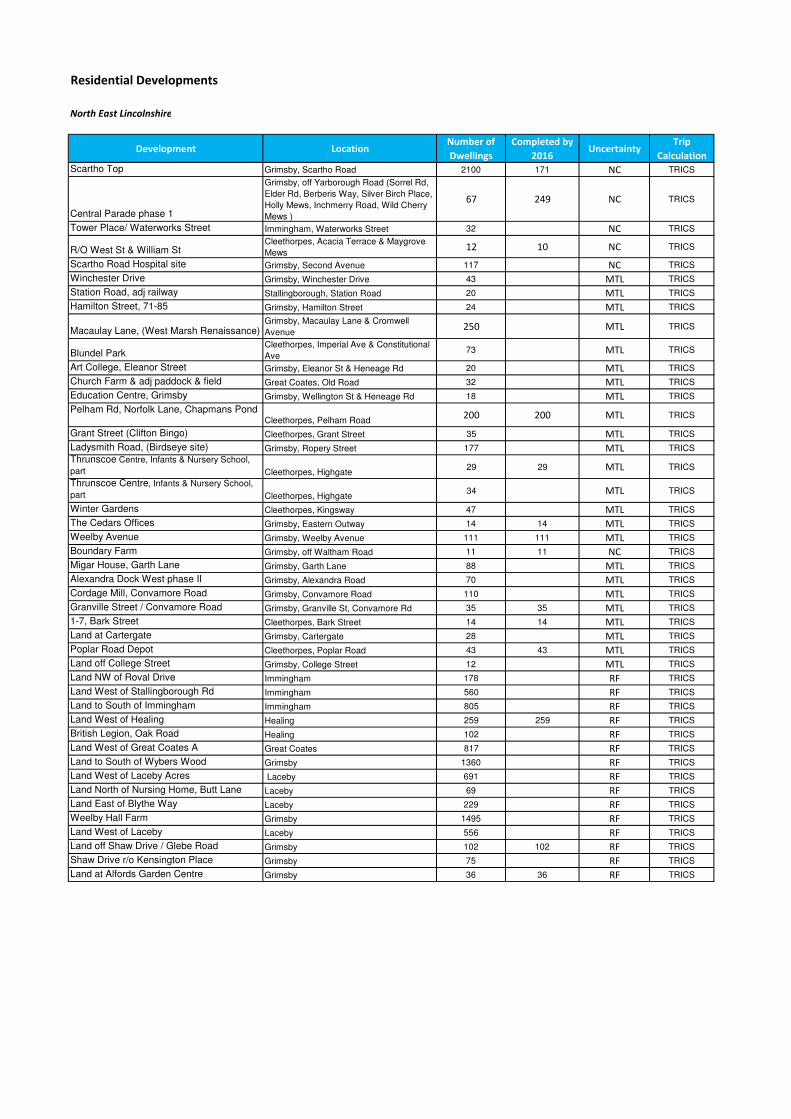
Residential Developments
North East Lincolnshire
Development LocationNumber of
Dwellings
Completed by
2016Uncertainty
Trip
Calculation
Scartho Top Grimsby, Scartho Road 2100 171 NC TRICS
Central Parade phase 1
Grimsby, off Yarborough Road (Sorrel Rd,
Elder Rd, Berberis Way, Silver Birch Place,
Holly Mews, Inchmerry Road, Wild Cherry
Mews )
67 249 NC TRICS
Tower Place/ Waterworks Street Immingham, Waterworks Street 32 NC TRICS
R/O West St & William StCleethorpes, Acacia Terrace & Maygrove
Mews12 10 NC TRICS
Scartho Road Hospital site Grimsby, Second Avenue 117 NC TRICS
Winchester Drive Grimsby, Winchester Drive 43 MTL TRICS
Station Road, adj railway Stallingborough, Station Road 20 MTL TRICS
Hamilton Street, 71-85 Grimsby, Hamilton Street 24 MTL TRICS
Macaulay Lane, (West Marsh Renaissance)Grimsby, Macaulay Lane & Cromwell
Avenue 250 MTL TRICS
Blundel ParkCleethorpes, Imperial Ave & Constitutional
Ave73 MTL TRICS
Art College, Eleanor Street Grimsby, Eleanor St & Heneage Rd 20 MTL TRICS
Church Farm & adj paddock & field Great Coates, Old Road 32 MTL TRICS
Education Centre, Grimsby Grimsby, Wellington St & Heneage Rd 18 MTL TRICS
Pelham Rd, Norfolk Lane, Chapmans PondCleethorpes, Pelham Road
200 200 MTL TRICS
Grant Street (Clifton Bingo) Cleethorpes, Grant Street 35 MTL TRICS
Ladysmith Road, (Birdseye site) Grimsby, Ropery Street 177 MTL TRICS
Thrunscoe Centre, Infants & Nursery School,
part Cleethorpes, Highgate29 29 MTL TRICS
Thrunscoe Centre, Infants & Nursery School,
part Cleethorpes, Highgate34 MTL TRICS
Winter Gardens Cleethorpes, Kingsway 47 MTL TRICS
The Cedars Offices Grimsby, Eastern Outway 14 14 MTL TRICS
Weelby Avenue Grimsby, Weelby Avenue 111 111 MTL TRICS
Boundary Farm Grimsby, off Waltham Road 11 11 NC TRICS
Migar House, Garth Lane Grimsby, Garth Lane 88 MTL TRICS
Alexandra Dock West phase II Grimsby, Alexandra Road 70 MTL TRICS
Cordage Mill, Convamore Road Grimsby, Convamore Road 110 MTL TRICS
Granville Street / Convamore Road Grimsby, Granville St, Convamore Rd 35 35 MTL TRICS
1-7, Bark Street Cleethorpes, Bark Street 14 14 MTL TRICS
Land at Cartergate Grimsby, Cartergate 28 MTL TRICS
Poplar Road Depot Cleethorpes, Poplar Road 43 43 MTL TRICS
Land off College Street Grimsby, College Street 12 MTL TRICS
Land NW of Roval Drive Immingham 178 RF TRICS
Land West of Stallingborough Rd Immingham 560 RF TRICS
Land to South of Immingham Immingham 805 RF TRICS
Land West of Healing Healing 259 259 RF TRICS
British Legion, Oak Road Healing 102 RF TRICS
Land West of Great Coates A Great Coates 817 RF TRICS
Land to South of Wybers Wood Grimsby 1360 RF TRICS
Land West of Laceby Acres Laceby 691 RF TRICS
Land North of Nursing Home, Butt Lane Laceby 69 RF TRICS
Land East of Blythe Way Laceby 229 RF TRICS
Weelby Hall Farm Grimsby 1495 RF TRICS
Land West of Laceby Laceby 556 RF TRICS
Land off Shaw Drive / Glebe Road Grimsby 102 102 RF TRICS
Shaw Drive r/o Kensington Place Grimsby 75 RF TRICS
Land at Alfords Garden Centre Grimsby 36 36 RF TRICS
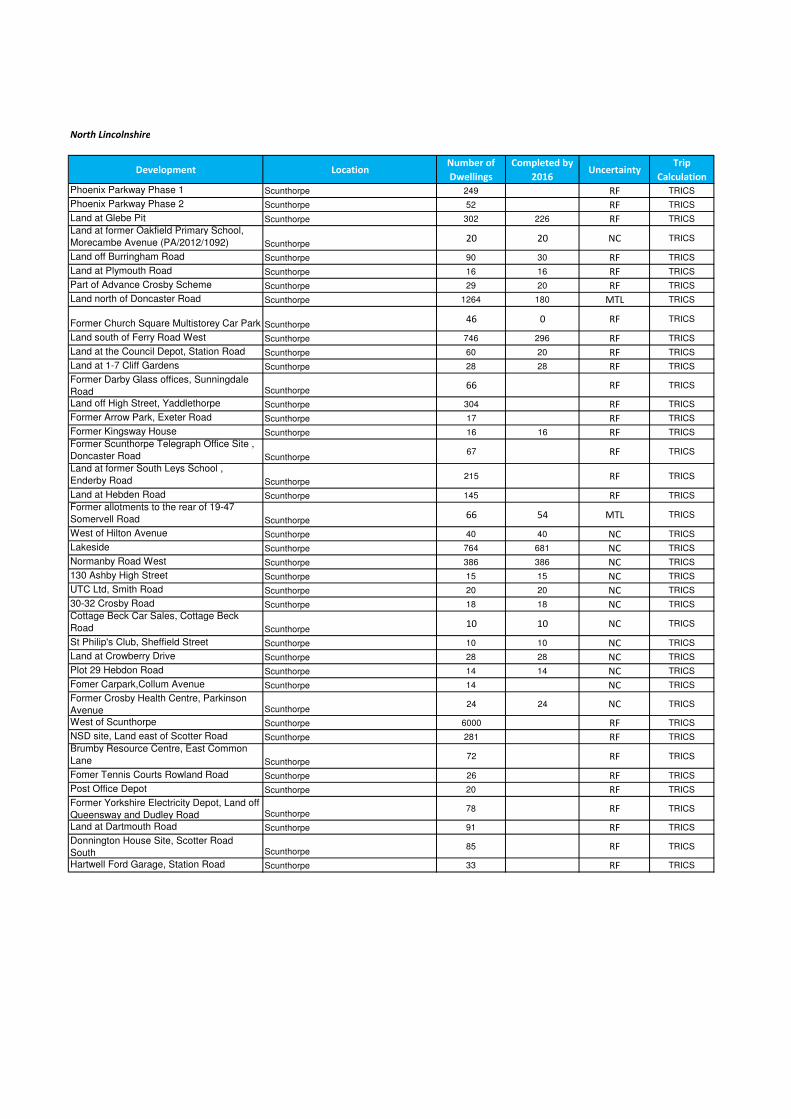
North Lincolnshire
Development LocationNumber of
Dwellings
Completed by
2016Uncertainty
Trip
Calculation
Phoenix Parkway Phase 1 Scunthorpe 249 RF TRICS
Phoenix Parkway Phase 2 Scunthorpe 52 RF TRICS
Land at Glebe Pit Scunthorpe 302 226 RF TRICS
Land at former Oakfield Primary School,
Morecambe Avenue (PA/2012/1092) Scunthorpe 20 20 NC TRICS
Land off Burringham Road Scunthorpe 90 30 RF TRICS
Land at Plymouth Road Scunthorpe 16 16 RF TRICS
Part of Advance Crosby Scheme Scunthorpe 29 20 RF TRICS
Land north of Doncaster Road Scunthorpe 1264 180 MTL TRICS
Former Church Square Multistorey Car Park Scunthorpe 46 0 RF TRICS
Land south of Ferry Road West Scunthorpe 746 296 RF TRICS
Land at the Council Depot, Station Road Scunthorpe 60 20 RF TRICS
Land at 1-7 Cliff Gardens Scunthorpe 28 28 RF TRICS
Former Darby Glass offices, Sunningdale
Road Scunthorpe 66 RF TRICS
Land off High Street, Yaddlethorpe Scunthorpe 304 RF TRICS
Former Arrow Park, Exeter Road Scunthorpe 17 RF TRICS
Former Kingsway House Scunthorpe 16 16 RF TRICS
Former Scunthorpe Telegraph Office Site ,
Doncaster Road Scunthorpe 67 RF TRICS
Land at former South Leys School ,
Enderby Road Scunthorpe 215 RF TRICS
Land at Hebden Road Scunthorpe 145 RF TRICS
Former allotments to the rear of 19-47
Somervell Road Scunthorpe66 54 MTL TRICS
West of Hilton Avenue Scunthorpe 40 40 NC TRICS
Lakeside Scunthorpe 764 681 NC TRICS
Normanby Road West Scunthorpe 386 386 NC TRICS
130 Ashby High Street Scunthorpe 15 15 NC TRICS
UTC Ltd, Smith Road Scunthorpe 20 20 NC TRICS
30-32 Crosby Road Scunthorpe 18 18 NC TRICS
Cottage Beck Car Sales, Cottage Beck
Road Scunthorpe 10 10 NC TRICS
St Philip's Club, Sheffield Street Scunthorpe 10 10 NC TRICS
Land at Crowberry Drive Scunthorpe 28 28 NC TRICS
Plot 29 Hebdon Road Scunthorpe 14 14 NC TRICS
Fomer Carpark,Collum Avenue Scunthorpe 14 NC TRICS
Former Crosby Health Centre, Parkinson
Avenue Scunthorpe24 24 NC TRICS
West of Scunthorpe Scunthorpe 6000 RF TRICS
NSD site, Land east of Scotter Road Scunthorpe 281 RF TRICS
Brumby Resource Centre, East Common
Lane Scunthorpe 72 RF TRICS
Fomer Tennis Courts Rowland Road Scunthorpe 26 RF TRICS
Post Office Depot Scunthorpe 20 RF TRICS
Former Yorkshire Electricity Depot, Land off
Queensway and Dudley Road Scunthorpe78 RF TRICS
Land at Dartmouth Road Scunthorpe 91 RF TRICS
Donnington House Site, Scotter Road
South Scunthorpe85 RF TRICS
Hartwell Ford Garage, Station Road Scunthorpe 33 RF TRICS

Appendix B
TEMPRO Factors
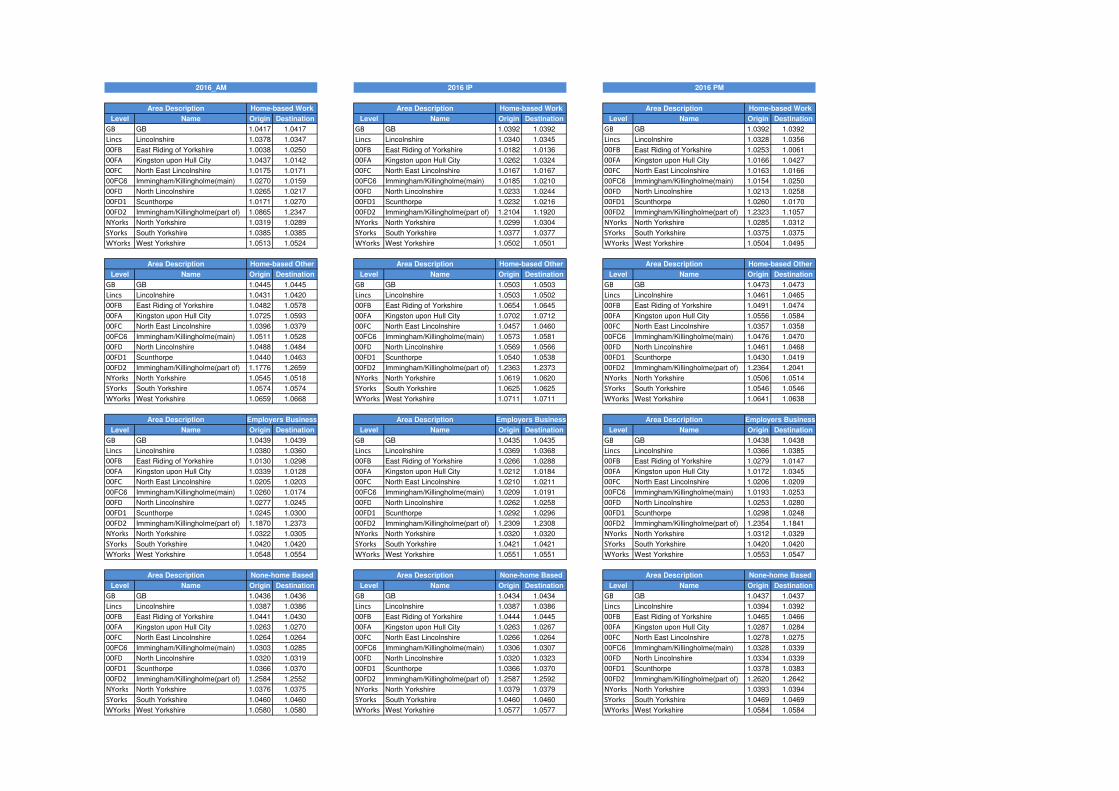
Level Name Origin Destination Level Name Origin Destination Level Name Origin Destination
GB GB 1.0417 1.0417 GB GB 1.0392 1.0392 GB GB 1.0392 1.0392
Lincs Lincolnshire 1.0378 1.0347 Lincs Lincolnshire 1.0340 1.0345 Lincs Lincolnshire 1.0328 1.0356
00FB East Riding of Yorkshire 1.0038 1.0250 00FB East Riding of Yorkshire 1.0182 1.0136 00FB East Riding of Yorkshire 1.0253 1.0061
00FA Kingston upon Hull City 1.0437 1.0142 00FA Kingston upon Hull City 1.0262 1.0324 00FA Kingston upon Hull City 1.0166 1.0427
00FC North East Lincolnshire 1.0175 1.0171 00FC North East Lincolnshire 1.0167 1.0167 00FC North East Lincolnshire 1.0163 1.0166
00FC6 Immingham/Killingholme(main) 1.0270 1.0159 00FC6 Immingham/Killingholme(main) 1.0185 1.0210 00FC6 Immingham/Killingholme(main) 1.0154 1.0250
00FD North Lincolnshire 1.0265 1.0217 00FD North Lincolnshire 1.0233 1.0244 00FD North Lincolnshire 1.0213 1.0258
00FD1 Scunthorpe 1.0171 1.0270 00FD1 Scunthorpe 1.0232 1.0216 00FD1 Scunthorpe 1.0260 1.0170
00FD2 Immingham/Killingholme(part of) 1.0865 1.2347 00FD2 Immingham/Killingholme(part of) 1.2104 1.1920 00FD2 Immingham/Killingholme(part of) 1.2323 1.1057
NYorks North Yorkshire 1.0319 1.0289 NYorks North Yorkshire 1.0299 1.0304 NYorks North Yorkshire 1.0285 1.0312
SYorks South Yorkshire 1.0385 1.0385 SYorks South Yorkshire 1.0377 1.0377 SYorks South Yorkshire 1.0375 1.0375
WYorks West Yorkshire 1.0513 1.0524 WYorks West Yorkshire 1.0502 1.0501 WYorks West Yorkshire 1.0504 1.0495
Level Name Origin Destination Level Name Origin Destination Level Name Origin Destination
GB GB 1.0445 1.0445 GB GB 1.0503 1.0503 GB GB 1.0473 1.0473
Lincs Lincolnshire 1.0431 1.0420 Lincs Lincolnshire 1.0503 1.0502 Lincs Lincolnshire 1.0461 1.0465
00FB East Riding of Yorkshire 1.0482 1.0578 00FB East Riding of Yorkshire 1.0654 1.0645 00FB East Riding of Yorkshire 1.0491 1.0474
00FA Kingston upon Hull City 1.0725 1.0593 00FA Kingston upon Hull City 1.0702 1.0712 00FA Kingston upon Hull City 1.0556 1.0584
00FC North East Lincolnshire 1.0396 1.0379 00FC North East Lincolnshire 1.0457 1.0460 00FC North East Lincolnshire 1.0357 1.0358
00FC6 Immingham/Killingholme(main) 1.0511 1.0528 00FC6 Immingham/Killingholme(main) 1.0573 1.0581 00FC6 Immingham/Killingholme(main) 1.0476 1.0470
00FD North Lincolnshire 1.0488 1.0484 00FD North Lincolnshire 1.0569 1.0566 00FD North Lincolnshire 1.0461 1.0468
00FD1 Scunthorpe 1.0440 1.0463 00FD1 Scunthorpe 1.0540 1.0538 00FD1 Scunthorpe 1.0430 1.0419
00FD2 Immingham/Killingholme(part of) 1.1776 1.2659 00FD2 Immingham/Killingholme(part of) 1.2363 1.2373 00FD2 Immingham/Killingholme(part of) 1.2364 1.2041
NYorks North Yorkshire 1.0545 1.0518 NYorks North Yorkshire 1.0619 1.0620 NYorks North Yorkshire 1.0506 1.0514
SYorks South Yorkshire 1.0574 1.0574 SYorks South Yorkshire 1.0625 1.0625 SYorks South Yorkshire 1.0546 1.0546
WYorks West Yorkshire 1.0659 1.0668 WYorks West Yorkshire 1.0711 1.0711 WYorks West Yorkshire 1.0641 1.0638
Level Name Origin Destination Level Name Origin Destination Level Name Origin Destination
GB GB 1.0439 1.0439 GB GB 1.0435 1.0435 GB GB 1.0438 1.0438
Lincs Lincolnshire 1.0380 1.0360 Lincs Lincolnshire 1.0369 1.0368 Lincs Lincolnshire 1.0366 1.0385
00FB East Riding of Yorkshire 1.0130 1.0298 00FB East Riding of Yorkshire 1.0266 1.0288 00FB East Riding of Yorkshire 1.0279 1.0147
00FA Kingston upon Hull City 1.0339 1.0128 00FA Kingston upon Hull City 1.0212 1.0184 00FA Kingston upon Hull City 1.0172 1.0345
00FC North East Lincolnshire 1.0205 1.0203 00FC North East Lincolnshire 1.0210 1.0211 00FC North East Lincolnshire 1.0206 1.0209
00FC6 Immingham/Killingholme(main) 1.0260 1.0174 00FC6 Immingham/Killingholme(main) 1.0209 1.0191 00FC6 Immingham/Killingholme(main) 1.0193 1.0253
00FD North Lincolnshire 1.0277 1.0245 00FD North Lincolnshire 1.0262 1.0258 00FD North Lincolnshire 1.0253 1.0280
00FD1 Scunthorpe 1.0245 1.0300 00FD1 Scunthorpe 1.0292 1.0296 00FD1 Scunthorpe 1.0298 1.0248
00FD2 Immingham/Killingholme(part of) 1.1870 1.2373 00FD2 Immingham/Killingholme(part of) 1.2309 1.2308 00FD2 Immingham/Killingholme(part of) 1.2354 1.1841
NYorks North Yorkshire 1.0322 1.0305 NYorks North Yorkshire 1.0320 1.0320 NYorks North Yorkshire 1.0312 1.0329
SYorks South Yorkshire 1.0420 1.0420 SYorks South Yorkshire 1.0421 1.0421 SYorks South Yorkshire 1.0420 1.0420
WYorks West Yorkshire 1.0548 1.0554 WYorks West Yorkshire 1.0551 1.0551 WYorks West Yorkshire 1.0553 1.0547
Level Name Origin Destination Level Name Origin Destination Level Name Origin Destination
GB GB 1.0436 1.0436 GB GB 1.0434 1.0434 GB GB 1.0437 1.0437
Lincs Lincolnshire 1.0387 1.0386 Lincs Lincolnshire 1.0387 1.0386 Lincs Lincolnshire 1.0394 1.0392
00FB East Riding of Yorkshire 1.0441 1.0430 00FB East Riding of Yorkshire 1.0444 1.0445 00FB East Riding of Yorkshire 1.0465 1.0466
00FA Kingston upon Hull City 1.0263 1.0270 00FA Kingston upon Hull City 1.0263 1.0267 00FA Kingston upon Hull City 1.0287 1.0284
00FC North East Lincolnshire 1.0264 1.0264 00FC North East Lincolnshire 1.0266 1.0264 00FC North East Lincolnshire 1.0278 1.0275
00FC6 Immingham/Killingholme(main) 1.0303 1.0285 00FC6 Immingham/Killingholme(main) 1.0306 1.0307 00FC6 Immingham/Killingholme(main) 1.0328 1.0339
00FD North Lincolnshire 1.0320 1.0319 00FD North Lincolnshire 1.0320 1.0323 00FD North Lincolnshire 1.0334 1.0339
00FD1 Scunthorpe 1.0366 1.0370 00FD1 Scunthorpe 1.0366 1.0370 00FD1 Scunthorpe 1.0378 1.0383
00FD2 Immingham/Killingholme(part of) 1.2584 1.2552 00FD2 Immingham/Killingholme(part of) 1.2587 1.2592 00FD2 Immingham/Killingholme(part of) 1.2620 1.2642
NYorks North Yorkshire 1.0376 1.0375 NYorks North Yorkshire 1.0379 1.0379 NYorks North Yorkshire 1.0393 1.0394
SYorks South Yorkshire 1.0460 1.0460 SYorks South Yorkshire 1.0460 1.0460 SYorks South Yorkshire 1.0469 1.0469
WYorks West Yorkshire 1.0580 1.0580 WYorks West Yorkshire 1.0577 1.0577 WYorks West Yorkshire 1.0584 1.0584
2016_AM 2016 IP 2016 PM
Area Description Home-based Work Area Description Home-based Work Area Description Home-based Work
Area Description Home-based Other Area Description Home-based Other Area Description Home-based Other
Area Description Employers Business Area Description Employers Business Area Description Employers Business
Area Description None-home Based Area Description None-home Based Area Description None-home Based
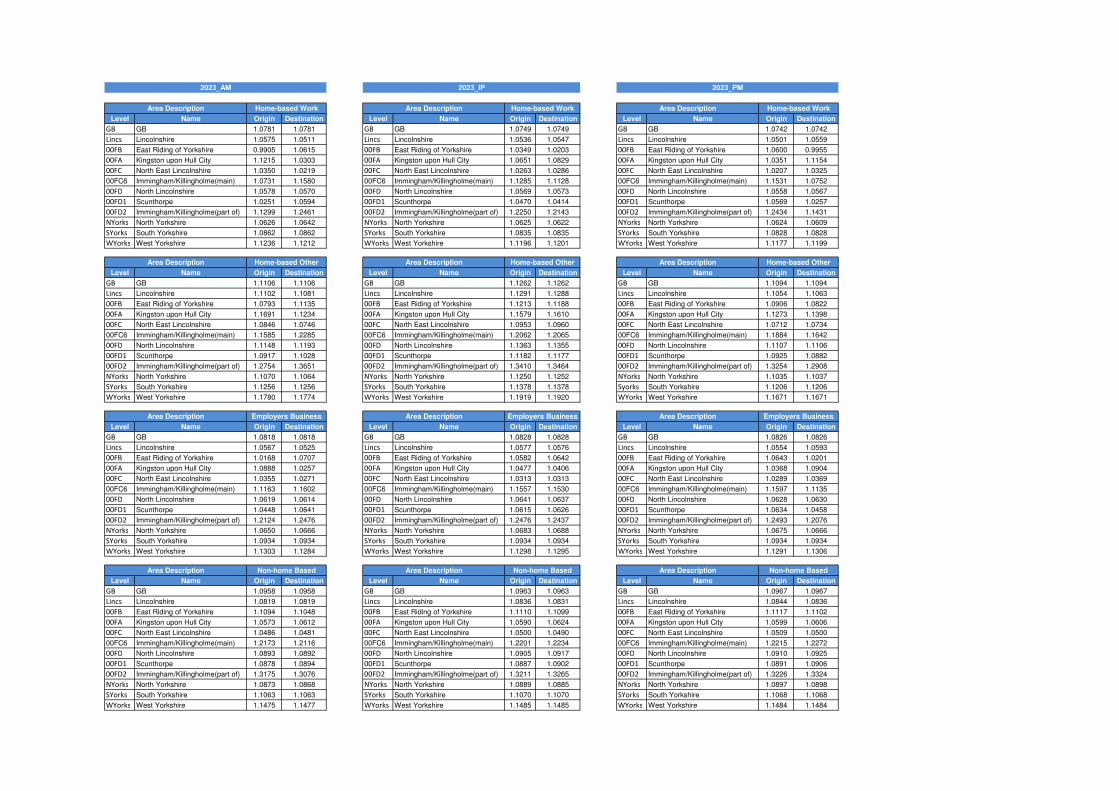
Level Name Origin Destination Level Name Origin Destination Level Name Origin Destination
GB GB 1.0781 1.0781 GB GB 1.0749 1.0749 GB GB 1.0742 1.0742
Lincs Lincolnshire 1.0575 1.0511 Lincs Lincolnshire 1.0536 1.0547 Lincs Lincolnshire 1.0501 1.0559
00FB East Riding of Yorkshire 0.9905 1.0615 00FB East Riding of Yorkshire 1.0349 1.0203 00FB East Riding of Yorkshire 1.0600 0.9955
00FA Kingston upon Hull City 1.1215 1.0303 00FA Kingston upon Hull City 1.0651 1.0829 00FA Kingston upon Hull City 1.0351 1.1154
00FC North East Lincolnshire 1.0350 1.0219 00FC North East Lincolnshire 1.0263 1.0286 00FC North East Lincolnshire 1.0207 1.0325
00FC6 Immingham/Killingholme(main) 1.0731 1.1580 00FC6 Immingham/Killingholme(main) 1.1285 1.1128 00FC6 Immingham/Killingholme(main) 1.1531 1.0752
00FD North Lincolnshire 1.0578 1.0570 00FD North Lincolnshire 1.0569 1.0573 00FD North Lincolnshire 1.0558 1.0567
00FD1 Scunthorpe 1.0251 1.0594 00FD1 Scunthorpe 1.0470 1.0414 00FD1 Scunthorpe 1.0569 1.0257
00FD2 Immingham/Killingholme(part of) 1.1299 1.2461 00FD2 Immingham/Killingholme(part of) 1.2250 1.2143 00FD2 Immingham/Killingholme(part of) 1.2434 1.1431
NYorks North Yorkshire 1.0626 1.0642 NYorks North Yorkshire 1.0625 1.0622 NYorks North Yorkshire 1.0624 1.0609
SYorks South Yorkshire 1.0862 1.0862 SYorks South Yorkshire 1.0835 1.0835 SYorks South Yorkshire 1.0828 1.0828
WYorks West Yorkshire 1.1236 1.1212 WYorks West Yorkshire 1.1196 1.1201 WYorks West Yorkshire 1.1177 1.1199
2023_AM 2023_AM 2023_IP 2023_IP 2023_PM 2023_PM
Level Name Origin Destination Level Name Origin Destination Level Name Origin Destination
GB GB 1.1106 1.1106 GB GB 1.1262 1.1262 GB GB 1.1094 1.1094
Lincs Lincolnshire 1.1102 1.1081 Lincs Lincolnshire 1.1291 1.1288 Lincs Lincolnshire 1.1054 1.1063
00FB East Riding of Yorkshire 1.0793 1.1135 00FB East Riding of Yorkshire 1.1213 1.1188 00FB East Riding of Yorkshire 1.0906 1.0822
00FA Kingston upon Hull City 1.1691 1.1234 00FA Kingston upon Hull City 1.1579 1.1610 00FA Kingston upon Hull City 1.1273 1.1398
00FC North East Lincolnshire 1.0846 1.0746 00FC North East Lincolnshire 1.0953 1.0960 00FC North East Lincolnshire 1.0712 1.0734
00FC6 Immingham/Killingholme(main) 1.1585 1.2285 00FC6 Immingham/Killingholme(main) 1.2062 1.2065 00FC6 Immingham/Killingholme(main) 1.1884 1.1642
00FD North Lincolnshire 1.1148 1.1193 00FD North Lincolnshire 1.1363 1.1355 00FD North Lincolnshire 1.1107 1.1106
00FD1 Scunthorpe 1.0917 1.1028 00FD1 Scunthorpe 1.1182 1.1177 00FD1 Scunthorpe 1.0925 1.0882
00FD2 Immingham/Killingholme(part of) 1.2754 1.3651 00FD2 Immingham/Killingholme(part of) 1.3410 1.3464 00FD2 Immingham/Killingholme(part of) 1.3254 1.2908
NYorks North Yorkshire 1.1070 1.1064 NYorks North Yorkshire 1.1250 1.1252 NYorks North Yorkshire 1.1035 1.1037
SYorks South Yorkshire 1.1256 1.1256 SYorks South Yorkshire 1.1378 1.1378 Syorks South Yorkshire 1.1206 1.1206
WYorks West Yorkshire 1.1780 1.1774 WYorks West Yorkshire 1.1919 1.1920 WYorks West Yorkshire 1.1671 1.1671
2023_AM 2023_AM 2023_IP 2023_IP 2023_PM 2023_PM
Level Name Origin Destination Level Name Origin Destination Level Name Origin Destination
GB GB 1.0818 1.0818 GB GB 1.0828 1.0828 GB GB 1.0826 1.0826
Lincs Lincolnshire 1.0567 1.0525 Lincs Lincolnshire 1.0577 1.0576 Lincs Lincolnshire 1.0554 1.0593
00FB East Riding of Yorkshire 1.0168 1.0707 00FB East Riding of Yorkshire 1.0582 1.0642 00FB East Riding of Yorkshire 1.0643 1.0201
00FA Kingston upon Hull City 1.0888 1.0257 00FA Kingston upon Hull City 1.0477 1.0406 00FA Kingston upon Hull City 1.0368 1.0904
00FC North East Lincolnshire 1.0355 1.0271 00FC North East Lincolnshire 1.0313 1.0313 00FC North East Lincolnshire 1.0289 1.0369
00FC6 Immingham/Killingholme(main) 1.1163 1.1602 00FC6 Immingham/Killingholme(main) 1.1557 1.1530 00FC6 Immingham/Killingholme(main) 1.1597 1.1135
00FD North Lincolnshire 1.0619 1.0614 00FD North Lincolnshire 1.0641 1.0637 00FD North Lincolnshire 1.0628 1.0630
00FD1 Scunthorpe 1.0448 1.0641 00FD1 Scunthorpe 1.0615 1.0626 00FD1 Scunthorpe 1.0634 1.0458
00FD2 Immingham/Killingholme(part of) 1.2124 1.2476 00FD2 Immingham/Killingholme(part of) 1.2476 1.2437 00FD2 Immingham/Killingholme(part of) 1.2493 1.2076
NYorks North Yorkshire 1.0650 1.0666 NYorks North Yorkshire 1.0683 1.0688 NYorks North Yorkshire 1.0675 1.0666
SYorks South Yorkshire 1.0934 1.0934 SYorks South Yorkshire 1.0934 1.0934 SYorks South Yorkshire 1.0934 1.0934
WYorks West Yorkshire 1.1303 1.1284 WYorks West Yorkshire 1.1298 1.1295 WYorks West Yorkshire 1.1291 1.1306
2023_AM 2023_AM 2023_IP 2023_IP 2023_PM 2023_PM
Level Name Origin Destination Level Name Origin Destination Level Name Origin Destination
GB GB 1.0958 1.0958 GB GB 1.0963 1.0963 GB GB 1.0967 1.0967
Lincs Lincolnshire 1.0819 1.0819 Lincs Lincolnshire 1.0836 1.0831 Lincs Lincolnshire 1.0844 1.0836
00FB East Riding of Yorkshire 1.1094 1.1048 00FB East Riding of Yorkshire 1.1110 1.1099 00FB East Riding of Yorkshire 1.1117 1.1102
00FA Kingston upon Hull City 1.0573 1.0612 00FA Kingston upon Hull City 1.0590 1.0624 00FA Kingston upon Hull City 1.0599 1.0606
00FC North East Lincolnshire 1.0486 1.0481 00FC North East Lincolnshire 1.0500 1.0490 00FC North East Lincolnshire 1.0509 1.0500
00FC6 Immingham/Killingholme(main) 1.2173 1.2116 00FC6 Immingham/Killingholme(main) 1.2201 1.2234 00FC6 Immingham/Killingholme(main) 1.2215 1.2272
00FD North Lincolnshire 1.0893 1.0892 00FD North Lincolnshire 1.0905 1.0917 00FD North Lincolnshire 1.0910 1.0925
00FD1 Scunthorpe 1.0878 1.0894 00FD1 Scunthorpe 1.0887 1.0902 00FD1 Scunthorpe 1.0891 1.0906
00FD2 Immingham/Killingholme(part of) 1.3175 1.3076 00FD2 Immingham/Killingholme(part of) 1.3211 1.3265 00FD2 Immingham/Killingholme(part of) 1.3226 1.3324
NYorks North Yorkshire 1.0873 1.0868 NYorks North Yorkshire 1.0889 1.0885 NYorks North Yorkshire 1.0897 1.0898
SYorks South Yorkshire 1.1063 1.1063 SYorks South Yorkshire 1.1070 1.1070 SYorks South Yorkshire 1.1068 1.1068
WYorks West Yorkshire 1.1475 1.1477 WYorks West Yorkshire 1.1485 1.1485 WYorks West Yorkshire 1.1484 1.1484
2023_AM 2023_IP 2023_PM
Area Description Home-based Work Area Description Home-based Work Area Description Home-based Work
Area Description Home-based Other Area Description Home-based Other Area Description Home-based Other
Area Description Employers Business Area Description Employers Business Area Description Employers Business
Area Description Non-home Based Area Description Non-home Based Area Description Non-home Based
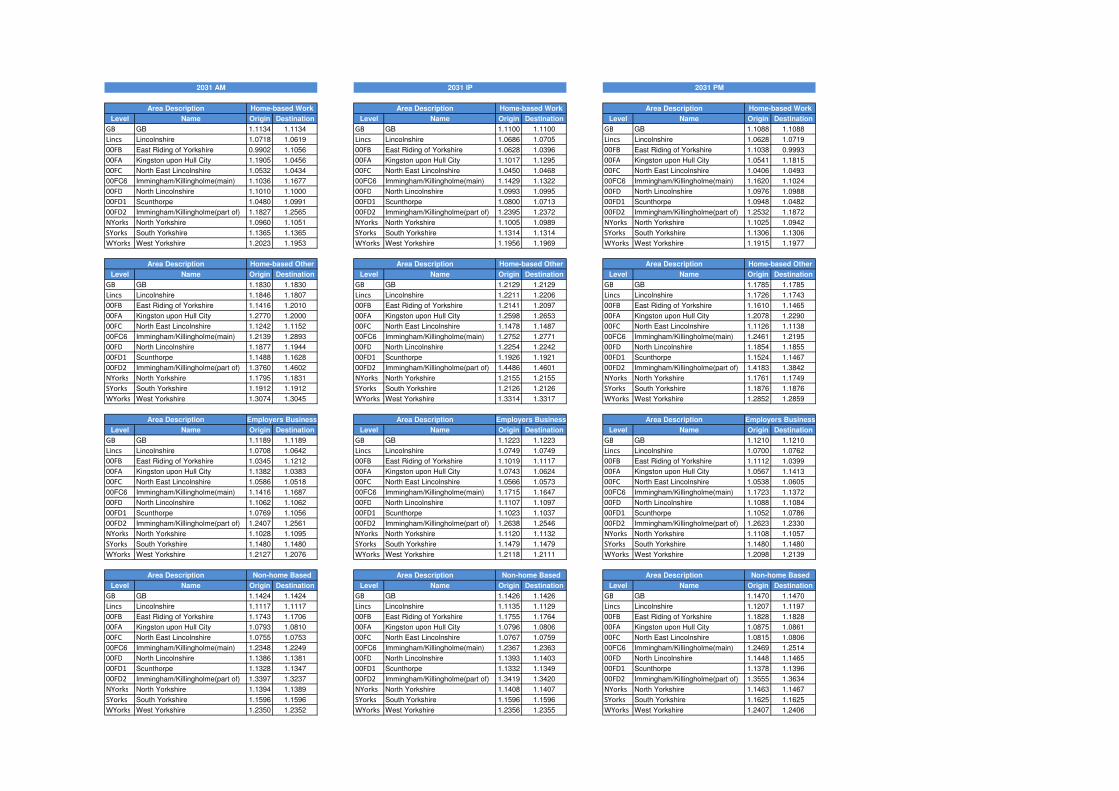
Level Name Origin Destination Level Name Origin Destination Level Name Origin Destination
GB GB 1.1134 1.1134 GB GB 1.1100 1.1100 GB GB 1.1088 1.1088
Lincs Lincolnshire 1.0718 1.0619 Lincs Lincolnshire 1.0686 1.0705 Lincs Lincolnshire 1.0628 1.0719
00FB East Riding of Yorkshire 0.9902 1.1056 00FB East Riding of Yorkshire 1.0628 1.0396 00FB East Riding of Yorkshire 1.1038 0.9993
00FA Kingston upon Hull City 1.1905 1.0456 00FA Kingston upon Hull City 1.1017 1.1295 00FA Kingston upon Hull City 1.0541 1.1815
00FC North East Lincolnshire 1.0532 1.0434 00FC North East Lincolnshire 1.0450 1.0468 00FC North East Lincolnshire 1.0406 1.0493
00FC6 Immingham/Killingholme(main) 1.1036 1.1677 00FC6 Immingham/Killingholme(main) 1.1429 1.1322 00FC6 Immingham/Killingholme(main) 1.1620 1.1024
00FD North Lincolnshire 1.1010 1.1000 00FD North Lincolnshire 1.0993 1.0995 00FD North Lincolnshire 1.0976 1.0988
00FD1 Scunthorpe 1.0480 1.0991 00FD1 Scunthorpe 1.0800 1.0713 00FD1 Scunthorpe 1.0948 1.0482
00FD2 Immingham/Killingholme(part of) 1.1827 1.2565 00FD2 Immingham/Killingholme(part of) 1.2395 1.2372 00FD2 Immingham/Killingholme(part of) 1.2532 1.1872
NYorks North Yorkshire 1.0960 1.1051 NYorks North Yorkshire 1.1005 1.0989 NYorks North Yorkshire 1.1025 1.0942
SYorks South Yorkshire 1.1365 1.1365 SYorks South Yorkshire 1.1314 1.1314 SYorks South Yorkshire 1.1306 1.1306
WYorks West Yorkshire 1.2023 1.1953 WYorks West Yorkshire 1.1956 1.1969 WYorks West Yorkshire 1.1915 1.1977
Level Name Origin Destination Level Name Origin Destination Level Name Origin Destination
GB GB 1.1830 1.1830 GB GB 1.2129 1.2129 GB GB 1.1785 1.1785
Lincs Lincolnshire 1.1846 1.1807 Lincs Lincolnshire 1.2211 1.2206 Lincs Lincolnshire 1.1726 1.1743
00FB East Riding of Yorkshire 1.1416 1.2010 00FB East Riding of Yorkshire 1.2141 1.2097 00FB East Riding of Yorkshire 1.1610 1.1465
00FA Kingston upon Hull City 1.2770 1.2000 00FA Kingston upon Hull City 1.2598 1.2653 00FA Kingston upon Hull City 1.2078 1.2290
00FC North East Lincolnshire 1.1242 1.1152 00FC North East Lincolnshire 1.1478 1.1487 00FC North East Lincolnshire 1.1126 1.1138
00FC6 Immingham/Killingholme(main) 1.2139 1.2893 00FC6 Immingham/Killingholme(main) 1.2752 1.2771 00FC6 Immingham/Killingholme(main) 1.2461 1.2195
00FD North Lincolnshire 1.1877 1.1944 00FD North Lincolnshire 1.2254 1.2242 00FD North Lincolnshire 1.1854 1.1855
00FD1 Scunthorpe 1.1488 1.1628 00FD1 Scunthorpe 1.1926 1.1921 00FD1 Scunthorpe 1.1524 1.1467
00FD2 Immingham/Killingholme(part of) 1.3760 1.4602 00FD2 Immingham/Killingholme(part of) 1.4486 1.4601 00FD2 Immingham/Killingholme(part of) 1.4183 1.3842
NYorks North Yorkshire 1.1795 1.1831 NYorks North Yorkshire 1.2155 1.2155 NYorks North Yorkshire 1.1761 1.1749
SYorks South Yorkshire 1.1912 1.1912 SYorks South Yorkshire 1.2126 1.2126 SYorks South Yorkshire 1.1876 1.1876
WYorks West Yorkshire 1.3074 1.3045 WYorks West Yorkshire 1.3314 1.3317 WYorks West Yorkshire 1.2852 1.2859
Level Name Origin Destination Level Name Origin Destination Level Name Origin Destination
GB GB 1.1189 1.1189 GB GB 1.1223 1.1223 GB GB 1.1210 1.1210
Lincs Lincolnshire 1.0708 1.0642 Lincs Lincolnshire 1.0749 1.0749 Lincs Lincolnshire 1.0700 1.0762
00FB East Riding of Yorkshire 1.0345 1.1212 00FB East Riding of Yorkshire 1.1019 1.1117 00FB East Riding of Yorkshire 1.1112 1.0399
00FA Kingston upon Hull City 1.1382 1.0383 00FA Kingston upon Hull City 1.0743 1.0624 00FA Kingston upon Hull City 1.0567 1.1413
00FC North East Lincolnshire 1.0586 1.0518 00FC North East Lincolnshire 1.0566 1.0573 00FC North East Lincolnshire 1.0538 1.0605
00FC6 Immingham/Killingholme(main) 1.1416 1.1687 00FC6 Immingham/Killingholme(main) 1.1715 1.1647 00FC6 Immingham/Killingholme(main) 1.1723 1.1372
00FD North Lincolnshire 1.1062 1.1062 00FD North Lincolnshire 1.1107 1.1097 00FD North Lincolnshire 1.1088 1.1084
00FD1 Scunthorpe 1.0769 1.1056 00FD1 Scunthorpe 1.1023 1.1037 00FD1 Scunthorpe 1.1052 1.0786
00FD2 Immingham/Killingholme(part of) 1.2407 1.2561 00FD2 Immingham/Killingholme(part of) 1.2638 1.2546 00FD2 Immingham/Killingholme(part of) 1.2623 1.2330
NYorks North Yorkshire 1.1028 1.1095 NYorks North Yorkshire 1.1120 1.1132 NYorks North Yorkshire 1.1108 1.1057
SYorks South Yorkshire 1.1480 1.1480 SYorks South Yorkshire 1.1479 1.1479 SYorks South Yorkshire 1.1480 1.1480
WYorks West Yorkshire 1.2127 1.2076 WYorks West Yorkshire 1.2118 1.2111 WYorks West Yorkshire 1.2098 1.2139
Level Name Origin Destination Level Name Origin Destination Level Name Origin Destination
GB GB 1.1424 1.1424 GB GB 1.1426 1.1426 GB GB 1.1470 1.1470
Lincs Lincolnshire 1.1117 1.1117 Lincs Lincolnshire 1.1135 1.1129 Lincs Lincolnshire 1.1207 1.1197
00FB East Riding of Yorkshire 1.1743 1.1706 00FB East Riding of Yorkshire 1.1755 1.1764 00FB East Riding of Yorkshire 1.1828 1.1828
00FA Kingston upon Hull City 1.0793 1.0810 00FA Kingston upon Hull City 1.0796 1.0806 00FA Kingston upon Hull City 1.0875 1.0861
00FC North East Lincolnshire 1.0755 1.0753 00FC North East Lincolnshire 1.0767 1.0759 00FC North East Lincolnshire 1.0815 1.0806
00FC6 Immingham/Killingholme(main) 1.2348 1.2249 00FC6 Immingham/Killingholme(main) 1.2367 1.2363 00FC6 Immingham/Killingholme(main) 1.2469 1.2514
00FD North Lincolnshire 1.1386 1.1381 00FD North Lincolnshire 1.1393 1.1403 00FD North Lincolnshire 1.1448 1.1465
00FD1 Scunthorpe 1.1328 1.1347 00FD1 Scunthorpe 1.1332 1.1349 00FD1 Scunthorpe 1.1378 1.1396
00FD2 Immingham/Killingholme(part of) 1.3397 1.3237 00FD2 Immingham/Killingholme(part of) 1.3419 1.3420 00FD2 Immingham/Killingholme(part of) 1.3555 1.3634
NYorks North Yorkshire 1.1394 1.1389 NYorks North Yorkshire 1.1408 1.1407 NYorks North Yorkshire 1.1463 1.1467
SYorks South Yorkshire 1.1596 1.1596 SYorks South Yorkshire 1.1596 1.1596 SYorks South Yorkshire 1.1625 1.1625
WYorks West Yorkshire 1.2350 1.2352 WYorks West Yorkshire 1.2356 1.2355 WYorks West Yorkshire 1.2407 1.2406
2031 AM 2031 IP 2031 PM
Area Description Home-based Work Area Description Home-based Work Area Description Home-based Work
Area Description Home-based Other Area Description Home-based Other Area Description Home-based Other
Area Description Employers Business Area Description Employers Business Area Description Employers Business
Area Description Non-home Based Area Description Non-home Based Area Description Non-home Based
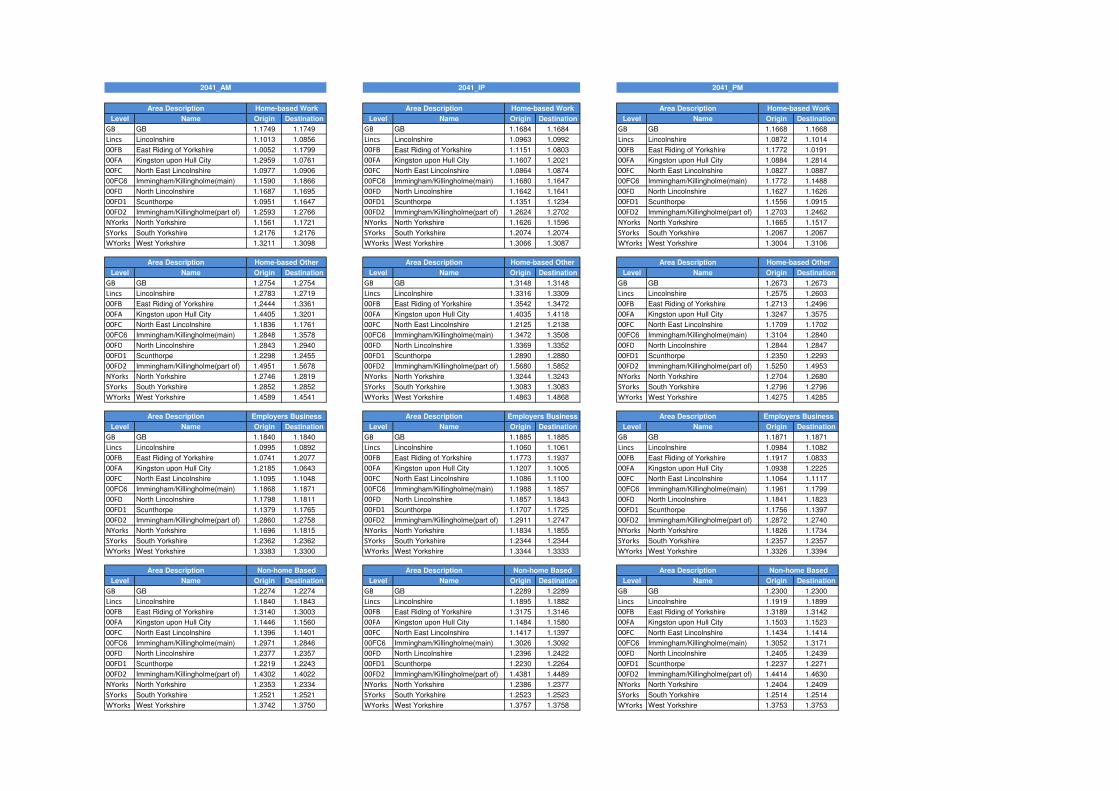
Level Name Origin Destination Level Name Origin Destination Level Name Origin Destination
GB GB 1.1749 1.1749 GB GB 1.1684 1.1684 GB GB 1.1668 1.1668
Lincs Lincolnshire 1.1013 1.0856 Lincs Lincolnshire 1.0963 1.0992 Lincs Lincolnshire 1.0872 1.1014
00FB East Riding of Yorkshire 1.0052 1.1799 00FB East Riding of Yorkshire 1.1151 1.0803 00FB East Riding of Yorkshire 1.1772 1.0191
00FA Kingston upon Hull City 1.2959 1.0761 00FA Kingston upon Hull City 1.1607 1.2021 00FA Kingston upon Hull City 1.0884 1.2814
00FC North East Lincolnshire 1.0977 1.0906 00FC North East Lincolnshire 1.0864 1.0874 00FC North East Lincolnshire 1.0827 1.0887
00FC6 Immingham/Killingholme(main) 1.1590 1.1866 00FC6 Immingham/Killingholme(main) 1.1680 1.1647 00FC6 Immingham/Killingholme(main) 1.1772 1.1488
00FD North Lincolnshire 1.1687 1.1695 00FD North Lincolnshire 1.1642 1.1641 00FD North Lincolnshire 1.1627 1.1626
00FD1 Scunthorpe 1.0951 1.1647 00FD1 Scunthorpe 1.1351 1.1234 00FD1 Scunthorpe 1.1556 1.0915
00FD2 Immingham/Killingholme(part of) 1.2593 1.2766 00FD2 Immingham/Killingholme(part of) 1.2624 1.2702 00FD2 Immingham/Killingholme(part of) 1.2703 1.2462
NYorks North Yorkshire 1.1561 1.1721 NYorks North Yorkshire 1.1626 1.1596 NYorks North Yorkshire 1.1665 1.1517
SYorks South Yorkshire 1.2176 1.2176 SYorks South Yorkshire 1.2074 1.2074 SYorks South Yorkshire 1.2067 1.2067
WYorks West Yorkshire 1.3211 1.3098 WYorks West Yorkshire 1.3066 1.3087 WYorks West Yorkshire 1.3004 1.3106
2041_AM 2041_AM 2041_IP 2041_IP 2041_PM 2041_PM
Level Name Origin Destination Level Name Origin Destination Level Name Origin Destination
GB GB 1.2754 1.2754 GB GB 1.3148 1.3148 GB GB 1.2673 1.2673
Lincs Lincolnshire 1.2783 1.2719 Lincs Lincolnshire 1.3316 1.3309 Lincs Lincolnshire 1.2575 1.2603
00FB East Riding of Yorkshire 1.2444 1.3361 00FB East Riding of Yorkshire 1.3542 1.3472 00FB East Riding of Yorkshire 1.2713 1.2496
00FA Kingston upon Hull City 1.4405 1.3201 00FA Kingston upon Hull City 1.4035 1.4118 00FA Kingston upon Hull City 1.3247 1.3575
00FC North East Lincolnshire 1.1836 1.1761 00FC North East Lincolnshire 1.2125 1.2138 00FC North East Lincolnshire 1.1709 1.1702
00FC6 Immingham/Killingholme(main) 1.2848 1.3578 00FC6 Immingham/Killingholme(main) 1.3472 1.3508 00FC6 Immingham/Killingholme(main) 1.3104 1.2840
00FD North Lincolnshire 1.2843 1.2940 00FD North Lincolnshire 1.3369 1.3352 00FD North Lincolnshire 1.2844 1.2847
00FD1 Scunthorpe 1.2298 1.2455 00FD1 Scunthorpe 1.2890 1.2880 00FD1 Scunthorpe 1.2350 1.2293
00FD2 Immingham/Killingholme(part of) 1.4951 1.5678 00FD2 Immingham/Killingholme(part of) 1.5680 1.5852 00FD2 Immingham/Killingholme(part of) 1.5250 1.4953
NYorks North Yorkshire 1.2746 1.2819 NYorks North Yorkshire 1.3244 1.3243 NYorks North Yorkshire 1.2704 1.2680
SYorks South Yorkshire 1.2852 1.2852 SYorks South Yorkshire 1.3083 1.3083 SYorks South Yorkshire 1.2796 1.2796
WYorks West Yorkshire 1.4589 1.4541 WYorks West Yorkshire 1.4863 1.4868 WYorks West Yorkshire 1.4275 1.4285
2041_AM 2041_AM 2041_IP 2041_IP 2041_PM 2041_PM
Level Name Origin Destination Level Name Origin Destination Level Name Origin Destination
GB GB 1.1840 1.1840 GB GB 1.1885 1.1885 GB GB 1.1871 1.1871
Lincs Lincolnshire 1.0995 1.0892 Lincs Lincolnshire 1.1060 1.1061 Lincs Lincolnshire 1.0984 1.1082
00FB East Riding of Yorkshire 1.0741 1.2077 00FB East Riding of Yorkshire 1.1773 1.1937 00FB East Riding of Yorkshire 1.1917 1.0833
00FA Kingston upon Hull City 1.2185 1.0643 00FA Kingston upon Hull City 1.1207 1.1005 00FA Kingston upon Hull City 1.0938 1.2225
00FC North East Lincolnshire 1.1095 1.1048 00FC North East Lincolnshire 1.1086 1.1100 00FC North East Lincolnshire 1.1064 1.1117
00FC6 Immingham/Killingholme(main) 1.1868 1.1871 00FC6 Immingham/Killingholme(main) 1.1988 1.1857 00FC6 Immingham/Killingholme(main) 1.1961 1.1799
00FD North Lincolnshire 1.1798 1.1811 00FD North Lincolnshire 1.1857 1.1843 00FD North Lincolnshire 1.1841 1.1823
00FD1 Scunthorpe 1.1379 1.1765 00FD1 Scunthorpe 1.1707 1.1725 00FD1 Scunthorpe 1.1756 1.1397
00FD2 Immingham/Killingholme(part of) 1.2860 1.2758 00FD2 Immingham/Killingholme(part of) 1.2911 1.2747 00FD2 Immingham/Killingholme(part of) 1.2872 1.2740
NYorks North Yorkshire 1.1696 1.1815 NYorks North Yorkshire 1.1834 1.1855 NYorks North Yorkshire 1.1826 1.1734
SYorks South Yorkshire 1.2362 1.2362 SYorks South Yorkshire 1.2344 1.2344 SYorks South Yorkshire 1.2357 1.2357
WYorks West Yorkshire 1.3383 1.3300 WYorks West Yorkshire 1.3344 1.3333 WYorks West Yorkshire 1.3326 1.3394
2041_AM 2041_AM 2041_IP 2041_IP 2041_PM 2041_PM
Level Name Origin Destination Level Name Origin Destination Level Name Origin Destination
GB GB 1.2274 1.2274 GB GB 1.2289 1.2289 GB GB 1.2300 1.2300
Lincs Lincolnshire 1.1840 1.1843 Lincs Lincolnshire 1.1895 1.1882 Lincs Lincolnshire 1.1919 1.1899
00FB East Riding of Yorkshire 1.3140 1.3003 00FB East Riding of Yorkshire 1.3175 1.3146 00FB East Riding of Yorkshire 1.3189 1.3142
00FA Kingston upon Hull City 1.1446 1.1560 00FA Kingston upon Hull City 1.1484 1.1580 00FA Kingston upon Hull City 1.1503 1.1523
00FC North East Lincolnshire 1.1396 1.1401 00FC North East Lincolnshire 1.1417 1.1397 00FC North East Lincolnshire 1.1434 1.1414
00FC6 Immingham/Killingholme(main) 1.2971 1.2846 00FC6 Immingham/Killingholme(main) 1.3026 1.3092 00FC6 Immingham/Killingholme(main) 1.3052 1.3171
00FD North Lincolnshire 1.2377 1.2357 00FD North Lincolnshire 1.2396 1.2422 00FD North Lincolnshire 1.2405 1.2439
00FD1 Scunthorpe 1.2219 1.2243 00FD1 Scunthorpe 1.2230 1.2264 00FD1 Scunthorpe 1.2237 1.2271
00FD2 Immingham/Killingholme(part of) 1.4302 1.4022 00FD2 Immingham/Killingholme(part of) 1.4381 1.4489 00FD2 Immingham/Killingholme(part of) 1.4414 1.4630
NYorks North Yorkshire 1.2353 1.2334 NYorks North Yorkshire 1.2386 1.2377 NYorks North Yorkshire 1.2404 1.2409
SYorks South Yorkshire 1.2521 1.2521 SYorks South Yorkshire 1.2523 1.2523 SYorks South Yorkshire 1.2514 1.2514
WYorks West Yorkshire 1.3742 1.3750 WYorks West Yorkshire 1.3757 1.3758 WYorks West Yorkshire 1.3753 1.3753
2041_AM 2041_IP 2041_PM
Area Description Home-based Work Area Description Home-based Work Area Description Home-based Work
Area Description Home-based Other Area Description Home-based Other Area Description Home-based Other
Area Description Employers Business Area Description Employers Business Area Description Employers Business
Area Description Non-home Based Area Description Non-home Based Area Description Non-home Based

Appendix C
Core Traffic Flows

1,291
1,390
1,505
1,004 1,272 1,496
974
1,997
2,072 2,341 1,465
1,404 2,135
1,903
4,596
2,360 3,508 4,596
24 AADT 1,732 3,875
2016 2,970
Total Veh 3,852
Do Minimum 5,124
182
2,678 #N/A 6,200 3,140
2,080 4,564
146 #N/A
5,190
6,023 4,596
5,065
22 5 4,839
959
833 6,269 356 283
6,263 1,925
823 872 2,309
4,348
6,109 6,049
1,956
4,819
13,404 2,813
2,895 1,717
14,207 8,835
1,754
9,714
2,088
1,533 4,134
4,846
1,507
3,304
3,277
6,384
8,836 5,649
2,950
2,883
9,714
13,125
14,790
Time
Year
Box Information
Scenario
Project:
Core
Traffic Flow Information
Date: Total Vehicles
24 AADTTime Period:
Year:
Scenario:
12/09/2013 Box Information:
A160/A180 Port of Immingham Improvement
2016
Do Minimum
North Killingholme
North Killingholme
Airfield
Town St
Habrough Road
Station Road
Humber Rd
Eastfield Road
Ulceby Road
Rosper Rd
Town St
Eastfield Road
Top Rd
Queens Rd
Kiln Ln
A1173
A1173
A1173
Bluestone Ln
Stallingborough Road
Habrough Road
Refinery
A180
A180
A180
A160
A160
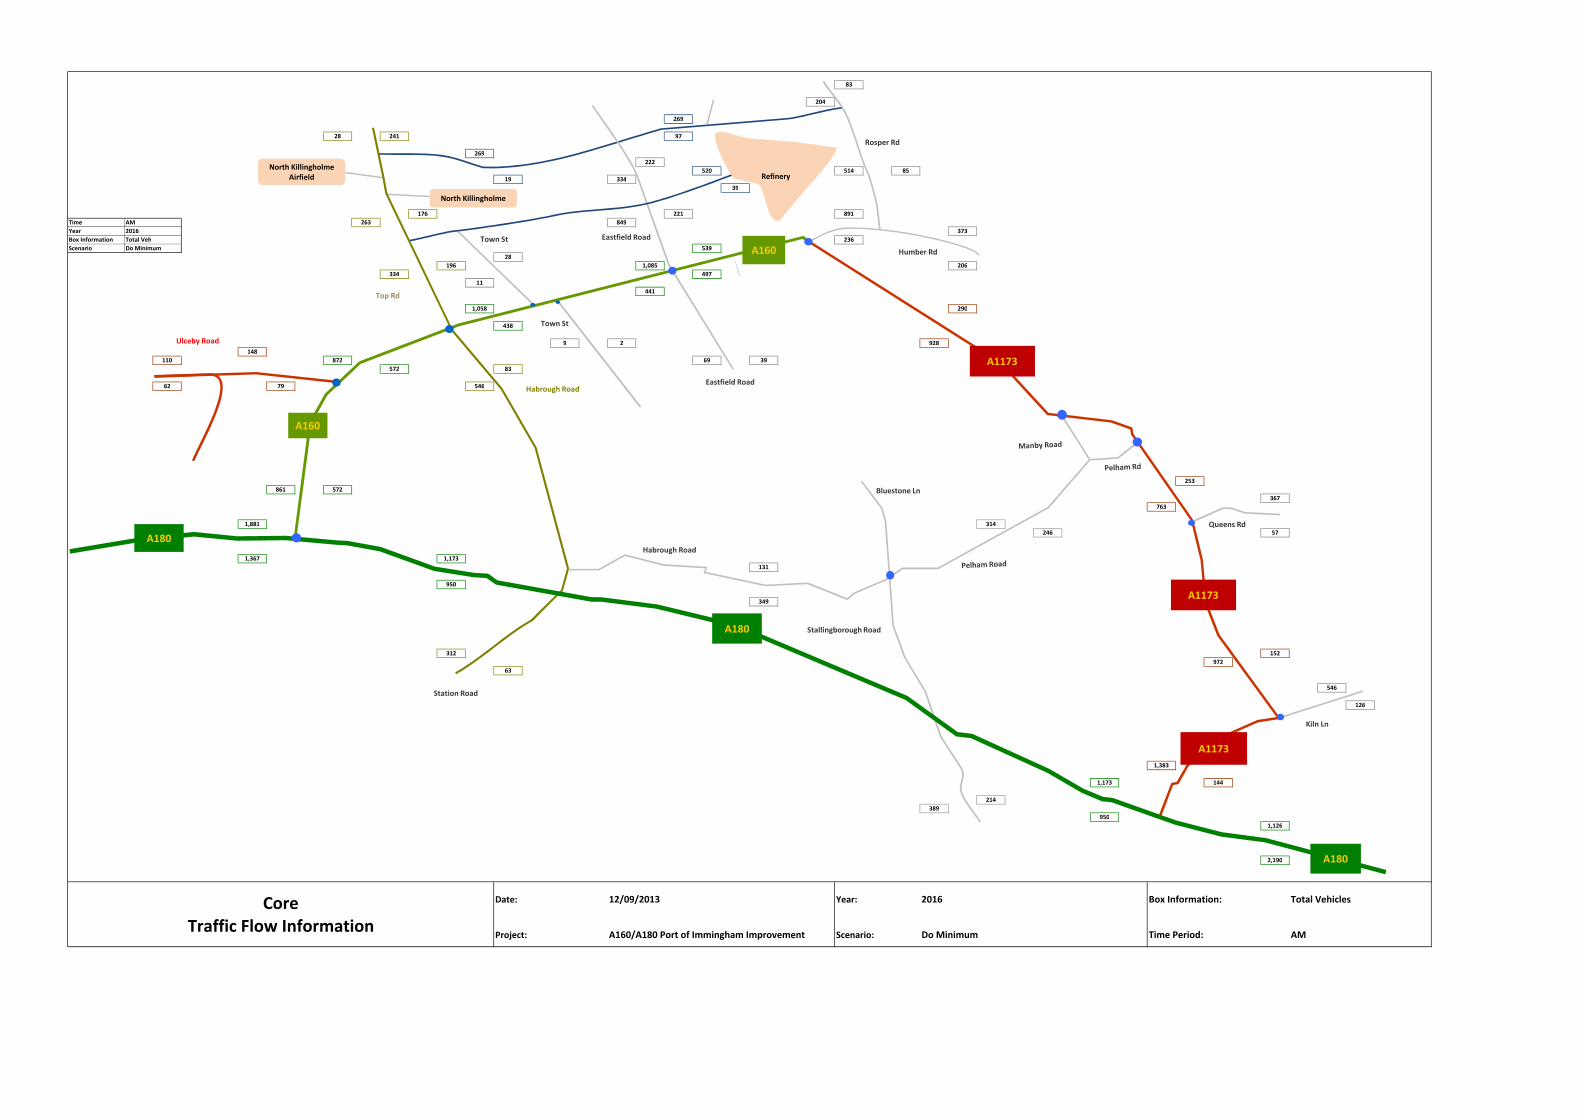
83
204
269
28 241 97
269
222
520 514 85
19 334
39
891
176 221 891
AM 263 849
2016 373
Total Veh 236
Do Minimum 539
28
196 #N/A 1,085 206
334 497
11 #N/A
441
1,058 290
438
9 2 928
148
110 872 69 39
572 83
62 79 546
253
861 572
367
763
1,881 314
246 57
1,367 1,173
131
950
349
312 152
972
63
546
126
1,383
1,173 144
214
389
950
1,126
2,190
Time
Year
Box Information
Scenario
Project:
Core
Traffic Flow Information
Date: Total Vehicles
AMTime Period:
Year:
Scenario:
12/09/2013 Box Information:
A160/A180 Port of Immingham Improvement
2016
Do Minimum
North Killingholme
North Killingholme
Airfield
Town St
Habrough Road
Station Road
Humber Rd
Eastfield Road
Ulceby Road
Rosper Rd
Town St
Eastfield Road
Top Rd
Queens Rd
Kiln Ln
A1173
A1173
A1173
Bluestone Ln
Stallingborough Road
Habrough Road
Refinery
A180
A180
A180
A160
A160

116
111
101
74 71 109
47
183
108 130 139
60 139
109
309
117 276 309
IP 122 227
2016 251
Total Veh 314
Do Minimum 421
15
146 #N/A 438 247
145 347
10 #N/A
410
423 368
400
0 0 299
77
77 490 19 20
458 130
71 71 119
375
471 445
147
361
1,014 230
238 144
1,111 659
140
783
147
93 321
310
111
235
283
399
659 457
240
206
783
1,007
1,065
Time
Year
Box Information
Scenario
Project:
Core
Traffic Flow Information
Date: Total Vehicles
IPTime Period:
Year:
Scenario:
12/09/2013 Box Information:
A160/A180 Port of Immingham Improvement
2016
Do Minimum
North Killingholme
North Killingholme
Airfield
Town St
Habrough Road
Station Road
Humber Rd
Eastfield Road
Ulceby Road
Rosper Rd
Town St
Eastfield Road
Top Rd
Queens Rd
Kiln Ln
A1173
A1173
A1173
Bluestone Ln
Stallingborough Road
Habrough Road
Refinery
A180
A180
A180
A160
A160

175
105
116
220 123 275
23
164
82 150 189
450 226
520
276
557 593 276
PM 165 220
2016 255
Total Veh 627
Do Minimum 583
11
599 #N/A 440 521
186 580
25 #N/A
748
430 759
723
0 0 373
65
49 555 35 30
963 425
112 116 133
665
549 903
86
369
1,263 305
393 321
1,912 929
269
1,228
166
103 828
298
310
265
571
308
929 1,146
448
321
1,228
1,966
1,417
Time
Year
Box Information
Scenario
Project:
Core
Traffic Flow Information
Date: Total Vehicles
PMTime Period:
Year:
Scenario:
12/09/2013 Box Information:
A160/A180 Port of Immingham Improvement
2016
Do Minimum
North Killingholme
North Killingholme
Airfield
Town St
Habrough Road
Station Road
Humber Rd
Eastfield Road
Ulceby Road
Rosper Rd
Town St
Eastfield Road
Top Rd
Queens Rd
Kiln Ln
A1173
A1173
A1173
Bluestone Ln
Stallingborough Road
Habrough Road
Refinery
A180
A180
A180
A160
A160

1,291
1,400
1,512
1,032 1,352 1,501
1,008
2,402
2,131 2,483 1,737
984 2,108
1,918
5,292
1,921 3,921 5,292
24 AADT 1,704 3,975
2016 3,037
Total Veh 4,473
Do Something 5,287
209
2,209 5 6,495 2,969
2,054 4,721
0 167
5,913
6,286 4,452
5,774
0 140 4,736
927
802 #N/A 418 366
#N/A 1,823
747 797 1,970
4,048
6,708 6,622
1,897
4,719
13,391 2,751
2,952 1,682
14,332 9,120
1,596
10,153
1,720
1,529 3,795
4,682
1,541
3,311
3,287
6,210
9,120 5,300
2,885
2,828
10,153
13,187
14,830
Time
Year
Box Information
Scenario
Project:
Core
Traffic Flow Information
Date: Total Vehicles
24 AADTTime Period:
Year:
Scenario:
12/09/2013 Box Information:
A160/A180 Port of Immingham Improvement
2016
Do Something
North Killingholme
North Killingholme
Airfield
Town St
Habrough Road
Station Road
Humber Rd
Eastfield Road
Ulceby Road
Rosper Rd
Town St
Eastfield Road
Top Rd
Queens Rd
Kiln Ln
A1173
A1173
A1173
Bluestone Ln
Stallingborough Road
Habrough Road
Refinery
A180
A180
A180
A160
A160

83
207
277
33 246 98
287
238
545 521 86
20 351
45
950
168 244 950
AM 274 885
2016 408
Total Veh 260
Do Something 617
25
188 2 1,196 214
347 509
0 17
469
1,171 288
463
0 6 885
152
114 #N/A 72 49
#N/A 97
62 79 391
248
1,107 608
342
723
1,882 303
240 45
1,375 1,152
139
1,145
181
318 134
906
66
546
131
1,307
1,152 120
212
368
1,145
1,130
2,201
Time
Year
Box Information
Scenario
Project:
Core
Traffic Flow Information
Date: Total Vehicles
AMTime Period:
Year:
Scenario:
12/09/2013 Box Information:
A160/A180 Port of Immingham Improvement
2016
Do Something
North Killingholme
North Killingholme
Airfield
Town St
Habrough Road
Station Road
Humber Rd
Eastfield Road
Ulceby Road
Rosper Rd
Town St
Eastfield Road
Top Rd
Queens Rd
Kiln Ln
A1173
A1173
A1173
Bluestone Ln
Stallingborough Road
Habrough Road
Refinery
A180
A180
A180
A160
A160

116
111
102
81 77 118
45
180
108 141 142
74 143
109
358
125 270 358
IP 114 229
2016 251
Total Veh 356
Do Something 407
19
150 0 443 247
136 359
0 10
435
424 330
424
0 10 297
70
70 #N/A 26 28
#N/A 133
65 65 121
336
472 479
147
359
1,016 228
238 144
1,111 694
137
782
150
93 281
308
117
235
282
400
694 420
231
207
782
1,010
1,065
Time
Year
Box Information
Scenario
Project:
Core
Traffic Flow Information
Date: Total Vehicles
IPTime Period:
Year:
Scenario:
12/09/2013 Box Information:
A160/A180 Port of Immingham Improvement
2016
Do Something
North Killingholme
North Killingholme
Airfield
Town St
Habrough Road
Station Road
Humber Rd
Eastfield Road
Ulceby Road
Rosper Rd
Town St
Eastfield Road
Top Rd
Queens Rd
Kiln Ln
A1173
A1173
A1173
Bluestone Ln
Stallingborough Road
Habrough Road
Refinery
A180
A180
A180
A160
A160

175
106
106
211 136 250
25
338
83 177 303
221 184
520
391
346 771 391
PM 164 222
2016 247
Total Veh 768
Do Something 614
15
386 0 440 436
183 604
0 28
979
425 799
950
0 29 378
65
49 #N/A 40 36
#N/A 355
94 97 141
643
551 1,029
86
372
1,252 294
424 318
1,959 986
196
1,217
173
96 801
300
306
268
571
310
986 1,116
444
317
1,217
1,982
1,423
Time
Year
Box Information
Scenario
Project:
Core
Traffic Flow Information
Date: Total Vehicles
PMTime Period:
Year:
Scenario:
12/09/2013 Box Information:
A160/A180 Port of Immingham Improvement
2016
Do Something
North Killingholme
North Killingholme
Airfield
Town St
Habrough Road
Station Road
Humber Rd
Eastfield Road
Ulceby Road
Rosper Rd
Town St
Eastfield Road
Top Rd
Queens Rd
Kiln Ln
A1173
A1173
A1173
Bluestone Ln
Stallingborough Road
Habrough Road
Refinery
A180
A180
A180
A160
A160

1,652
1,716
2,224
1,239 1,667 2,992
2,136
3,001
2,351 3,829 2,251
3,025 2,473
2,304
6,260
4,112 4,578 6,260
24 AADT 2,936 4,413
2031 3,633
Total Veh 4,953
Do Minimum 6,409
239
4,472 #N/A 7,111 3,900
3,286 5,505
211 #N/A
6,398
6,831 6,259
6,212
76 5 6,792
1,121
978 7,475 454 321
8,229 2,486
883 932 2,885
5,723
7,317 7,762
3,294
6,465
16,514 3,363
3,289 3,062
17,810 11,286
1,912
12,210
2,286
2,223 5,293
6,270
2,173
4,027
4,168
8,062
11,286 7,087
3,415
3,133
12,210
15,896
18,165
Time
Year
Box Information
Scenario
Project:
Core
Traffic Flow Information
Date: Total Vehicles
24 AADTTime Period:
Year:
Scenario:
12/09/2013 Box Information:
A160/A180 Port of Immingham Improvement
2031
Do Minimum
North Killingholme
North Killingholme
Airfield
Town St
Habrough Road
Station Road
Humber Rd
Eastfield Road
Ulceby Road
Rosper Rd
Town St
Eastfield Road
Top Rd
Queens Rd
Kiln Ln
A1173
A1173
A1173
Bluestone Ln
Stallingborough Road
Habrough Road
Refinery
A180
A180
A180
A160
A160

111
225
304
28 319 104
315
265
539 551 148
19 364
47
943
202 260 943
AM 255 882
2031 435
Total Veh 306
Do Minimum 548
34
224 #N/A 1,117 260
324 557
19 #N/A
525
1,065 307
516
31 2 1,000
153
112 807 77 37
607 59
73 89 583
312
907 583
488
816
2,220 450
265 142
1,626 1,448
137
1,195
367
393 196
1,046
77
570
156
1,508
1,448 184
246
394
1,195
1,285
2,571
Time
Year
Box Information
Scenario
Project:
Core
Traffic Flow Information
Date: Total Vehicles
AMTime Period:
Year:
Scenario:
12/09/2013 Box Information:
A160/A180 Port of Immingham Improvement
2031
Do Minimum
North Killingholme
North Killingholme
Airfield
Town St
Habrough Road
Station Road
Humber Rd
Eastfield Road
Ulceby Road
Rosper Rd
Town St
Eastfield Road
Top Rd
Queens Rd
Kiln Ln
A1173
A1173
A1173
Bluestone Ln
Stallingborough Road
Habrough Road
Refinery
A180
A180
A180
A160
A160

151
146
201
102 95 311
219
268
140 342 259
329 175
143
540
391 379 540
IP 313 279
2031 322
Total Veh 449
Do Minimum 562
21
423 #N/A 544 313
336 442
14 #N/A
529
523 573
515
0 0 556
98
98 676 29 25
726 234
80 80 205
537
623 691
294
571
1,297 256
264 279
1,462 886
173
984
172
171 448
497
198
327
402
597
886 623
298
232
984
1,294
1,361
Time
Year
Box Information
Scenario
Project:
Core
Traffic Flow Information
Date: Total Vehicles
IPTime Period:
Year:
Scenario:
12/09/2013 Box Information:
A160/A180 Port of Immingham Improvement
2031
Do Minimum
North Killingholme
North Killingholme
Airfield
Town St
Habrough Road
Station Road
Humber Rd
Eastfield Road
Ulceby Road
Rosper Rd
Town St
Eastfield Road
Top Rd
Queens Rd
Kiln Ln
A1173
A1173
A1173
Bluestone Ln
Stallingborough Road
Habrough Road
Refinery
A180
A180
A180
A160
A160

213
136
128
250 152 390
26
336
103 202 147
445 247
602
337
571 751 337
PM 195 285
2031 294
Total Veh 681
Do Minimum 770
14
620 #N/A 525 626
216 681
36 #N/A
880
511 929
844
0 0 474
74
54 661 43 36
1,081 420
103 107 118
780
626 990
160
482
1,530 337
478 467
2,301 1,119
245
1,542
169
116 954
349
358
313
614
391
1,119 1,300
462
357
1,542
2,261
1,723
Time
Year
Box Information
Scenario
Project:
Core
Traffic Flow Information
Date: Total Vehicles
PMTime Period:
Year:
Scenario:
12/09/2013 Box Information:
A160/A180 Port of Immingham Improvement
2031
Do Minimum
North Killingholme
North Killingholme
Airfield
Town St
Habrough Road
Station Road
Humber Rd
Eastfield Road
Ulceby Road
Rosper Rd
Town St
Eastfield Road
Top Rd
Queens Rd
Kiln Ln
A1173
A1173
A1173
Bluestone Ln
Stallingborough Road
Habrough Road
Refinery
A180
A180
A180
A160
A160
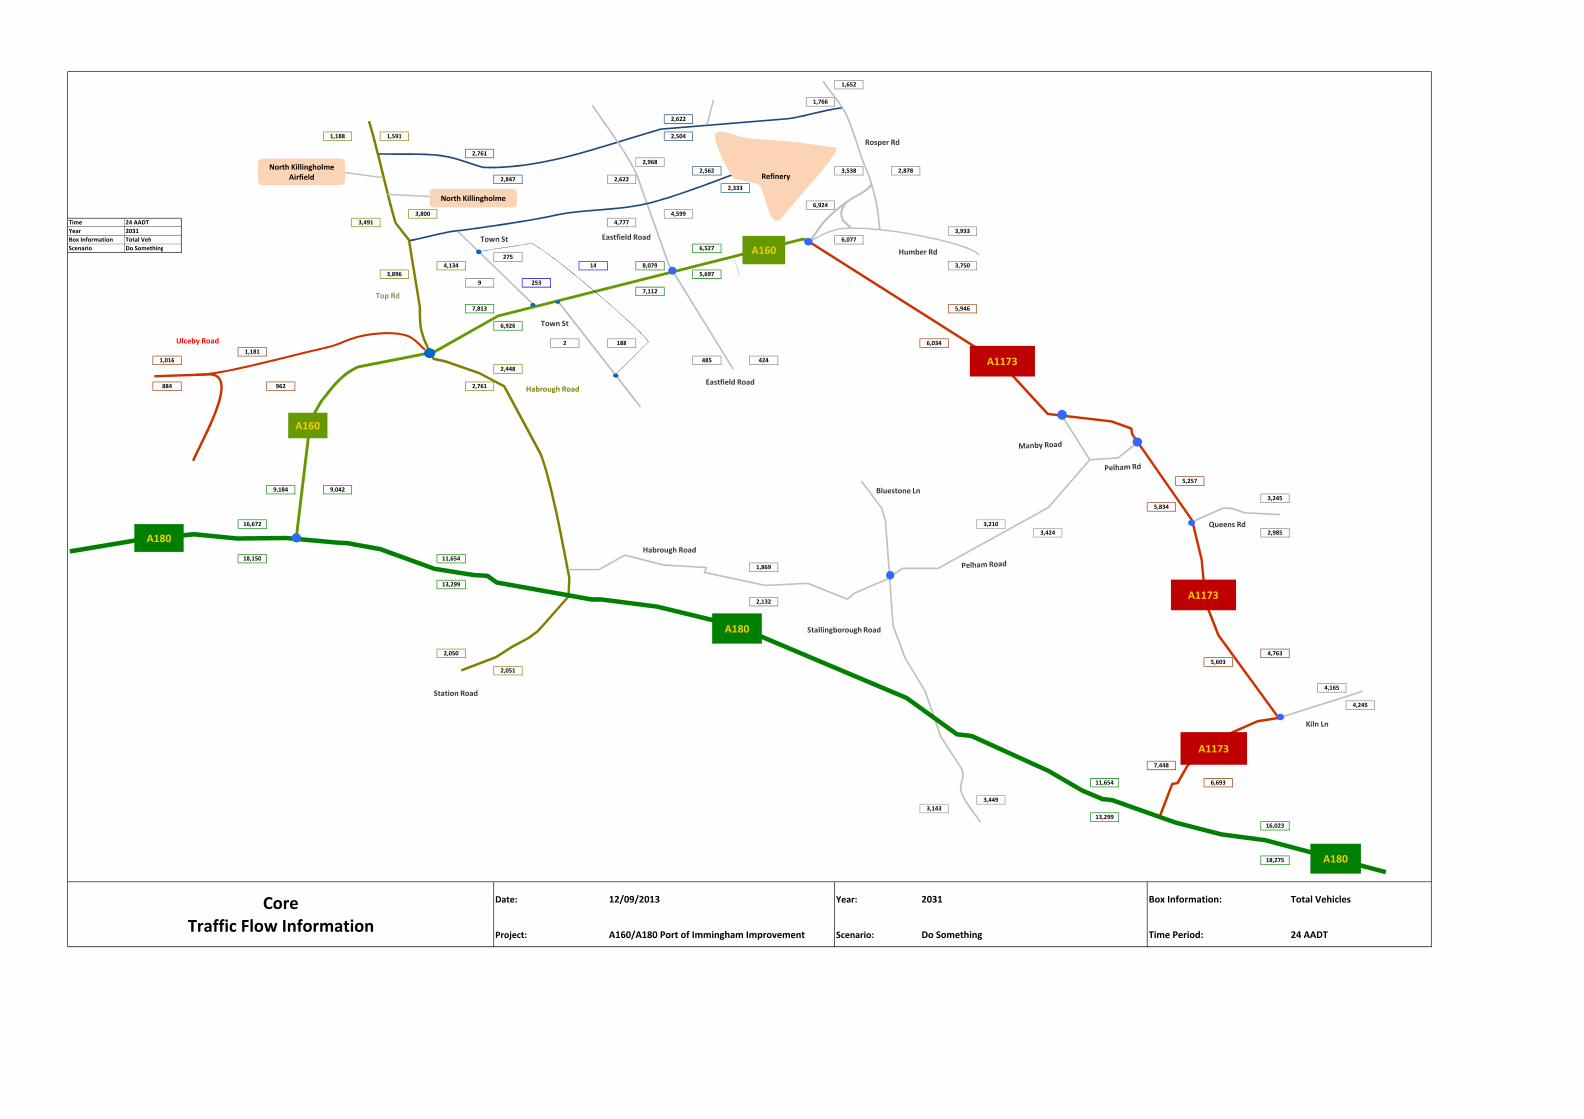
1,652
1,766
2,622
1,188 1,591 2,504
2,761
2,968
2,562 3,538 2,878
2,847 2,622
2,333
6,924
3,800 4,599 6,924
24 AADT 3,491 4,777
2031 3,933
Total Veh 6,077
Do Something 6,527
275
4,134 14 8,079 3,750
3,896 5,697
9 253
7,112
7,813 5,946
6,926
2 188 6,034
1,181
1,016 #N/A 485 424
#N/A 2,448
884 962 2,761
5,257
9,184 9,042
3,245
5,834
16,672 3,210
3,424 2,985
18,150 11,654
1,869
13,299
2,132
2,050 4,763
5,603
2,051
4,165
4,245
7,448
11,654 6,693
3,449
3,143
13,299
16,023
18,275
Time
Year
Box Information
Scenario
Project:
Core
Traffic Flow Information
Date: Total Vehicles
24 AADTTime Period:
Year:
Scenario:
12/09/2013 Box Information:
A160/A180 Port of Immingham Improvement
2031
Do Something
North Killingholme
North Killingholme
Airfield
Town St
Habrough Road
Station Road
Humber Rd
Eastfield Road
Ulceby Road
Rosper Rd
Town St
Eastfield Road
Top Rd
Queens Rd
Kiln Ln
A1173
A1173
A1173
Bluestone Ln
Stallingborough Road
Habrough Road
Refinery
A180
A180
A180
A160
A160

111
246
397
37 285 97
383
254
628 539 158
23 428
59
1,059
205 266 1,059
AM 381 1,025
2031 528
Total Veh 347
Do Something 759
30
228 2 1,511 264
470 568
0 32
570
1,481 361
564
1 7 898
172
126 #N/A 66 49
#N/A 106
77 100 505
318
1,409 719
491
782
2,279 388
307 130
1,677 1,363
157
1,455
275
354 177
1,002
74
610
163
1,437
1,363 165
240
400
1,455
1,294
2,608
Time
Year
Box Information
Scenario
Project:
Core
Traffic Flow Information
Date: Total Vehicles
AMTime Period:
Year:
Scenario:
12/09/2013 Box Information:
A160/A180 Port of Immingham Improvement
2031
Do Something
North Killingholme
North Killingholme
Airfield
Town St
Habrough Road
Station Road
Humber Rd
Eastfield Road
Ulceby Road
Rosper Rd
Town St
Eastfield Road
Top Rd
Queens Rd
Kiln Ln
A1173
A1173
A1173
Bluestone Ln
Stallingborough Road
Habrough Road
Refinery
A180
A180
A180
A160
A160

151
146
231
102 96 250
296
245
140 286 294
343 180
143
547
382 356 547
IP 366 283
2031 325
Total Veh 545
Do Something 515
27
410 1 541 315
391 446
1 14
548
514 525
534
0 14 469
98
98 #N/A 39 36
#N/A 230
80 80 202
487
724 754
286
484
1,298 253
265 275
1,457 937
169
1,067
176
161 401
410
195
332
404
529
937 592
299
232
1,067
1,295
1,363
Time
Year
Box Information
Scenario
Project:
Core
Traffic Flow Information
Date: Total Vehicles
IPTime Period:
Year:
Scenario:
12/09/2013 Box Information:
A160/A180 Port of Immingham Improvement
2031
Do Something
North Killingholme
North Killingholme
Airfield
Town St
Habrough Road
Station Road
Humber Rd
Eastfield Road
Ulceby Road
Rosper Rd
Town St
Eastfield Road
Top Rd
Queens Rd
Kiln Ln
A1173
A1173
A1173
Bluestone Ln
Stallingborough Road
Habrough Road
Refinery
A180
A180
A180
A160
A160

213
136
127
217 152 343
26
399
103 238 325
322 233
602
494
450 820 494
PM 165 284
2031 321
Total Veh 881
Do Something 726
17
500 3 549 549
186 744
2 41
1,103
535 862
1,064
0 38 479
80
54 #N/A 41 40
#N/A 364
98 109 153
701
656 1,251
155
471
1,536 340
493 456
2,413 1,239
212
1,528
187
107 863
334
314
317
636
377
1,239 1,226
483
355
1,528
2,307
1,728
Time
Year
Box Information
Scenario
Project:
Core
Traffic Flow Information
Date: Total Vehicles
PMTime Period:
Year:
Scenario:
12/09/2013 Box Information:
A160/A180 Port of Immingham Improvement
2031
Do Something
North Killingholme
North Killingholme
Airfield
Town St
Habrough Road
Station Road
Humber Rd
Eastfield Road
Ulceby Road
Rosper Rd
Town St
Eastfield Road
Top Rd
Queens Rd
Kiln Ln
A1173
A1173
A1173
Bluestone Ln
Stallingborough Road
Habrough Road
Refinery
A180
A180
A180
A160
A160

Appendix D
Core TEMPRO Traffic Flows

1,282
1,382
1,505
1,003 1,272 1,497
974
2,011
2,071 2,320 1,442
1,399 2,142
1,903
4,594
2,352 3,510 4,594
24 AADT 1,729 3,874
2016 2,941
Total Veh 3,850
Do Minimum 5,126
181
2,670 #N/A 6,200 3,113
2,076 4,564
146 #N/A
5,194
6,023 4,592
5,070
21 5 4,834
958
833 6,271 356 281
6,260 1,929
823 871 2,308
4,343
6,114 6,046
1,951
4,817
13,408 2,804
2,891 1,713
14,204 8,832
1,753
9,713
2,089
1,531 4,133
4,848
1,508
3,304
3,276
6,385
8,832 5,647
2,950
2,887
9,713
13,125
14,787
Time
Year
Box Information
Scenario
Project:
Core TEMPRO
Traffic Flow Information
Date: Total Vehicles
24 AADTTime Period:
Year:
Scenario:
12/09/2013 Box Information:
A160/A180 Port of Immingham Improvement
2016
Do Minimum
North Killingholme
North Killingholme
Airfield
Town St
Habrough Road
Station Road
Humber Rd
Eastfield Road
Ulceby Road
Rosper Rd
Town St
Eastfield Road
Top Rd
Queens Rd
Kiln Ln
A1173
A1173
A1173
Bluestone Ln
Stallingborough Road
Habrough Road
Refinery
A180
A180
A180
A160
A160

81
204
269
28 241 97
269
221
520 514 76
19 334
39
891
177 221 891
AM 263 848
2016 365
Total Veh 235
Do Minimum 540
28
197 #N/A 1,085 206
334 497
11 #N/A
442
1,058 290
439
9 1 928
147
110 873 69 39
573 84
62 79 546
253
863 572
366
765
1,883 310
245 58
1,367 1,172
132
949
349
311 152
972
63
546
126
1,383
1,172 143
214
391
949
1,127
2,189
Time
Year
Box Information
Scenario
Project:
Core TEMPRO
Traffic Flow Information
Date: Total Vehicles
AMTime Period:
Year:
Scenario:
12/09/2013 Box Information:
A160/A180 Port of Immingham Improvement
2016
Do Minimum
North Killingholme
North Killingholme
Airfield
Town St
Habrough Road
Station Road
Humber Rd
Eastfield Road
Ulceby Road
Rosper Rd
Town St
Eastfield Road
Top Rd
Queens Rd
Kiln Ln
A1173
A1173
A1173
Bluestone Ln
Stallingborough Road
Habrough Road
Refinery
A180
A180
A180
A160
A160

116
110
101
74 71 109
47
183
108 129 139
61 139
109
309
117 276 309
IP 122 227
2016 250
Total Veh 314
Do Minimum 421
15
146 #N/A 438 246
144 346
10 #N/A
410
423 367
400
0 0 298
77
77 490 19 20
458 130
71 71 119
375
471 445
147
361
1,014 230
238 143
1,111 659
140
783
147
93 321
310
111
235
283
399
659 457
239
206
783
1,007
1,065
Time
Year
Box Information
Scenario
Project:
Core TEMPRO
Traffic Flow Information
Date: Total Vehicles
IPTime Period:
Year:
Scenario:
12/09/2013 Box Information:
A160/A180 Port of Immingham Improvement
2016
Do Minimum
North Killingholme
North Killingholme
Airfield
Town St
Habrough Road
Station Road
Humber Rd
Eastfield Road
Ulceby Road
Rosper Rd
Town St
Eastfield Road
Top Rd
Queens Rd
Kiln Ln
A1173
A1173
A1173
Bluestone Ln
Stallingborough Road
Habrough Road
Refinery
A180
A180
A180
A160
A160

175
104
116
220 123 274
23
171
82 143 190
446 229
520
275
553 595 275
PM 165 220
2016 253
Total Veh 628
Do Minimum 583
11
596 #N/A 440 512
186 582
25 #N/A
751
430 759
726
0 0 372
65
49 555 35 29
962 426
112 116 133
665
549 902
86
368
1,263 304
392 320
1,910 929
268
1,228
166
103 828
298
311
265
571
308
929 1,146
448
321
1,228
1,965
1,417
Time
Year
Box Information
Scenario
Project:
Core TEMPRO
Traffic Flow Information
Date: Total Vehicles
PMTime Period:
Year:
Scenario:
12/09/2013 Box Information:
A160/A180 Port of Immingham Improvement
2016
Do Minimum
North Killingholme
North Killingholme
Airfield
Town St
Habrough Road
Station Road
Humber Rd
Eastfield Road
Ulceby Road
Rosper Rd
Town St
Eastfield Road
Top Rd
Queens Rd
Kiln Ln
A1173
A1173
A1173
Bluestone Ln
Stallingborough Road
Habrough Road
Refinery
A180
A180
A180
A160
A160

1,282
1,392
1,512
1,032 1,352 1,502
1,008
2,404
2,130 2,461 1,710
984 2,110
1,918
5,266
1,921 3,921 5,266
24 AADT 1,703 3,974
2016 3,008
Total Veh 4,448
Do Something 5,284
209
2,209 5 6,495 2,946
2,054 4,720
0 167
5,913
6,286 4,446
5,773
0 141 4,731
927
802 #N/A 418 366
#N/A 1,824
747 796 1,970
4,043
6,708 6,620
1,893
4,717
13,391 2,748
2,950 1,677
14,330 9,120
1,598
10,153
1,720
1,529 3,794
4,685
1,540
3,312
3,287
6,214
9,120 5,299
2,885
2,829
10,153
13,187
14,830
Time
Year
Box Information
Scenario
Project:
Core TEMPRO
Traffic Flow Information
Date: Total Vehicles
24 AADTTime Period:
Year:
Scenario:
12/09/2013 Box Information:
A160/A180 Port of Immingham Improvement
2016
Do Something
North Killingholme
North Killingholme
Airfield
Town St
Habrough Road
Station Road
Humber Rd
Eastfield Road
Ulceby Road
Rosper Rd
Town St
Eastfield Road
Top Rd
Queens Rd
Kiln Ln
A1173
A1173
A1173
Bluestone Ln
Stallingborough Road
Habrough Road
Refinery
A180
A180
A180
A160
A160

81
207
277
33 246 98
287
238
544 522 77
20 351
45
950
168 244 950
AM 274 884
2016 399
Total Veh 259
Do Something 617
26
188 2 1,196 214
346 509
0 17
469
1,171 287
463
0 6 885
152
114 #N/A 72 49
#N/A 97
62 79 391
248
1,107 608
342
724
1,882 302
240 45
1,375 1,152
139
1,145
181
318 134
907
66
546
131
1,308
1,152 120
212
368
1,145
1,130
2,201
Time
Year
Box Information
Scenario
Project:
Core TEMPRO
Traffic Flow Information
Date: Total Vehicles
AMTime Period:
Year:
Scenario:
12/09/2013 Box Information:
A160/A180 Port of Immingham Improvement
2016
Do Something
North Killingholme
North Killingholme
Airfield
Town St
Habrough Road
Station Road
Humber Rd
Eastfield Road
Ulceby Road
Rosper Rd
Town St
Eastfield Road
Top Rd
Queens Rd
Kiln Ln
A1173
A1173
A1173
Bluestone Ln
Stallingborough Road
Habrough Road
Refinery
A180
A180
A180
A160
A160

116
110
102
81 77 118
45
180
108 140 142
74 143
109
357
125 270 357
IP 114 229
2016 250
Total Veh 355
Do Something 407
19
150 0 443 246
136 359
0 10
435
424 330
424
0 10 297
70
70 #N/A 26 28
#N/A 133
65 65 121
336
472 479
147
359
1,016 228
238 143
1,111 694
137
782
150
93 281
308
117
235
282
400
694 420
231
207
782
1,010
1,065
Time
Year
Box Information
Scenario
Project:
Core TEMPRO
Traffic Flow Information
Date: Total Vehicles
IPTime Period:
Year:
Scenario:
12/09/2013 Box Information:
A160/A180 Port of Immingham Improvement
2016
Do Something
North Killingholme
North Killingholme
Airfield
Town St
Habrough Road
Station Road
Humber Rd
Eastfield Road
Ulceby Road
Rosper Rd
Town St
Eastfield Road
Top Rd
Queens Rd
Kiln Ln
A1173
A1173
A1173
Bluestone Ln
Stallingborough Road
Habrough Road
Refinery
A180
A180
A180
A160
A160

175
104
106
211 136 250
25
339
83 170 302
221 185
520
383
346 771 383
PM 164 222
2016 245
Total Veh 761
Do Something 613
15
386 0 440 429
183 604
0 28
979
425 798
950
0 29 377
65
49 #N/A 40 35
#N/A 356
93 97 141
642
551 1,028
86
371
1,252 294
423 317
1,958 986
197
1,217
173
96 801
300
305
268
571
310
986 1,115
444
317
1,217
1,982
1,423
Time
Year
Box Information
Scenario
Project:
Core TEMPRO
Traffic Flow Information
Date: Total Vehicles
PMTime Period:
Year:
Scenario:
12/09/2013 Box Information:
A160/A180 Port of Immingham Improvement
2016
Do Something
North Killingholme
North Killingholme
Airfield
Town St
Habrough Road
Station Road
Humber Rd
Eastfield Road
Ulceby Road
Rosper Rd
Town St
Eastfield Road
Top Rd
Queens Rd
Kiln Ln
A1173
A1173
A1173
Bluestone Ln
Stallingborough Road
Habrough Road
Refinery
A180
A180
A180
A160
A160

1,531
1,635
1,661
1,139 1,566 1,876
1,095
2,697
2,324 2,642 1,541
1,362 2,321
2,271
5,254
2,502 4,350 5,254
24 AADT 1,944 4,339
2031 3,342
Total Veh 4,524
Do Minimum 6,174
245
2,868 #N/A 7,042 3,701
2,308 5,447
208 #N/A
6,384
6,762 5,588
6,202
70 5 5,710
1,044
896 6,916 443 311
7,289 1,945
880 933 2,504
5,438
6,857 6,887
3,207
5,812
16,187 3,344
3,292 2,938
17,474 10,931
1,796
12,249
2,243
1,830 5,074
5,719
1,703
3,933
4,066
7,650
10,931 7,002
3,348
3,128
12,249
15,426
17,797
Time
Year
Box Information
Scenario
Project:
Core TEMPRO
Traffic Flow Information
Date: Total Vehicles
24 AADTTime Period:
Year:
Scenario:
12/09/2013 Box Information:
A160/A180 Port of Immingham Improvement
2031
Do Minimum
North Killingholme
North Killingholme
Airfield
Town St
Habrough Road
Station Road
Humber Rd
Eastfield Road
Ulceby Road
Rosper Rd
Town St
Eastfield Road
Top Rd
Queens Rd
Kiln Ln
A1173
A1173
A1173
Bluestone Ln
Stallingborough Road
Habrough Road
Refinery
A180
A180
A180
A160
A160

99
221
293
29 298 110
304
262
544 547 90
19 349
47
951
202 256 951
AM 265 876
2031 399
Total Veh 284
Do Minimum 568
36
224 #N/A 1,132 248
337 544
17 #N/A
511
1,081 307
504
29 1 997
157
113 822 75 37
598 58
70 89 592
308
910 573
484
808
2,227 442
265 136
1,621 1,450
131
1,196
371
388 196
1,043
75
570
154
1,508
1,450 184
247
392
1,196
1,285
2,572
Time
Year
Box Information
Scenario
Project:
Core TEMPRO
Traffic Flow Information
Date: Total Vehicles
AMTime Period:
Year:
Scenario:
12/09/2013 Box Information:
A160/A180 Port of Immingham Improvement
2031
Do Minimum
North Killingholme
North Killingholme
Airfield
Town St
Habrough Road
Station Road
Humber Rd
Eastfield Road
Ulceby Road
Rosper Rd
Town St
Eastfield Road
Top Rd
Queens Rd
Kiln Ln
A1173
A1173
A1173
Bluestone Ln
Stallingborough Road
Habrough Road
Refinery
A180
A180
A180
A160
A160

139
137
116
92 86 130
52
220
134 161 168
74 168
137
374
138 337 374
IP 145 277
2031 295
Total Veh 379
Do Minimum 513
21
171 #N/A 533 294
170 436
14 #N/A
520
512 457
506
0 0 384
84
84 584 28 23
568 146
80 80 135
488
553 541
281
472
1,246 256
264 268
1,399 830
156
994
162
108 411
409
125
312
388
530
830 608
287
232
994
1,216
1,301
Time
Year
Box Information
Scenario
Project:
Core TEMPRO
Traffic Flow Information
Date: Total Vehicles
IPTime Period:
Year:
Scenario:
12/09/2013 Box Information:
A160/A180 Port of Immingham Improvement
2031
Do Minimum
North Killingholme
North Killingholme
Airfield
Town St
Habrough Road
Station Road
Humber Rd
Eastfield Road
Ulceby Road
Rosper Rd
Town St
Eastfield Road
Top Rd
Queens Rd
Kiln Ln
A1173
A1173
A1173
Bluestone Ln
Stallingborough Road
Habrough Road
Refinery
A180
A180
A180
A160
A160

205
126
119
231 152 374
26
337
101 166 140
392 215
602
330
537 769 330
PM 196 263
2031 273
Total Veh 700
Do Minimum 776
14
587 #N/A 507 601
217 685
36 #N/A
913
494 944
877
0 0 460
74
54 645 43 36
1,097 416
104 108 126
791
609 1,016
160
467
1,513 336
480 448
2,328 1,111
244
1,531
171
115 956
344
348
310
611
388
1,111 1,303
462
357
1,531
2,263
1,721
Time
Year
Box Information
Scenario
Project:
Core TEMPRO
Traffic Flow Information
Date: Total Vehicles
PMTime Period:
Year:
Scenario:
12/09/2013 Box Information:
A160/A180 Port of Immingham Improvement
2031
Do Minimum
North Killingholme
North Killingholme
Airfield
Town St
Habrough Road
Station Road
Humber Rd
Eastfield Road
Ulceby Road
Rosper Rd
Town St
Eastfield Road
Top Rd
Queens Rd
Kiln Ln
A1173
A1173
A1173
Bluestone Ln
Stallingborough Road
Habrough Road
Refinery
A180
A180
A180
A160
A160

1,531
1,683
1,921
1,131 1,539 1,795
1,278
2,692
2,527 2,749 2,008
1,279 2,478
2,303
6,103
2,280 4,406 6,103
24 AADT 2,044 4,667
2031 3,609
Total Veh 5,294
Do Something 6,366
277
2,609 14 7,961 3,542
2,448 5,742
9 256
7,123
7,693 5,223
6,936
1 187 5,434
1,093
927 #N/A 476 413
#N/A 1,966
885 961 2,300
4,957
8,184 8,036
3,165
5,654
16,285 3,184
3,361 2,936
17,749 11,289
1,765
12,920
2,020
1,701 4,594
5,523
1,673
4,055
4,156
7,450
11,289 6,625
3,403
3,138
12,920
15,559
17,899
Time
Year
Box Information
Scenario
Project:
Core TEMPRO
Traffic Flow Information
Date: Total Vehicles
24 AADTTime Period:
Year:
Scenario:
12/09/2013 Box Information:
A160/A180 Port of Immingham Improvement
2031
Do Something
North Killingholme
North Killingholme
Airfield
Town St
Habrough Road
Station Road
Humber Rd
Eastfield Road
Ulceby Road
Rosper Rd
Town St
Eastfield Road
Top Rd
Queens Rd
Kiln Ln
A1173
A1173
A1173
Bluestone Ln
Stallingborough Road
Habrough Road
Refinery
A180
A180
A180
A160
A160

99
240
391
37 284 103
381
250
629 528 104
22 405
60
1,045
205 264 1,045
AM 379 1,004
2031 487
Total Veh 318
Do Something 758
30
227 2 1,476 253
467 567
0 32
554
1,446 355
548
0 6 907
172
126 #N/A 65 49
#N/A 106
77 99 487
313
1,391 704
482
785
2,261 379
295 125
1,663 1,362
157
1,454
261
351 177
1,006
74
610
161
1,442
1,362 164
240
398
1,454
1,292
2,607
Time
Year
Box Information
Scenario
Project:
Core TEMPRO
Traffic Flow Information
Date: Total Vehicles
AMTime Period:
Year:
Scenario:
12/09/2013 Box Information:
A160/A180 Port of Immingham Improvement
2031
Do Something
North Killingholme
North Killingholme
Airfield
Town St
Habrough Road
Station Road
Humber Rd
Eastfield Road
Ulceby Road
Rosper Rd
Town St
Eastfield Road
Top Rd
Queens Rd
Kiln Ln
A1173
A1173
A1173
Bluestone Ln
Stallingborough Road
Habrough Road
Refinery
A180
A180
A180
A160
A160

139
137
120
93 87 141
53
217
134 172 174
89 173
137
432
137 331 432
IP 129 280
2031 299
Total Veh 431
Do Something 512
26
166 1 539 296
154 445
1 14
528
514 426
514
0 14 370
84
84 #N/A 38 34
#N/A 146
80 80 134
454
572 577
276
458
1,247 253
265 267
1,398 859
153
1,006
164
105 379
393
127
315
387
529
859 587
285
232
1,006
1,216
1,302
Time
Year
Box Information
Scenario
Project:
Core TEMPRO
Traffic Flow Information
Date: Total Vehicles
IPTime Period:
Year:
Scenario:
12/09/2013 Box Information:
A160/A180 Port of Immingham Improvement
2031
Do Something
North Killingholme
North Killingholme
Airfield
Town St
Habrough Road
Station Road
Humber Rd
Eastfield Road
Ulceby Road
Rosper Rd
Town St
Eastfield Road
Top Rd
Queens Rd
Kiln Ln
A1173
A1173
A1173
Bluestone Ln
Stallingborough Road
Habrough Road
Refinery
A180
A180
A180
A160
A160

205
127
119
217 152 316
26
355
102 204 321
312 212
602
455
436 801 455
PM 163 267
2031 291
Total Veh 873
Do Something 663
22
482 3 538 519
184 768
2 42
1,178
518 814
1,139
0 39 469
80
54 #N/A 41 40
#N/A 376
99 110 150
661
640 1,297
156
458
1,518 338
478 463
2,408 1,287
209
1,525
184
107 849
340
328
315
645
372
1,287 1,211
501
355
1,525
2,316
1,726
Time
Year
Box Information
Scenario
Project:
Core TEMPRO
Traffic Flow Information
Date: Total Vehicles
PMTime Period:
Year:
Scenario:
12/09/2013 Box Information:
A160/A180 Port of Immingham Improvement
2031
Do Something
North Killingholme
North Killingholme
Airfield
Town St
Habrough Road
Station Road
Humber Rd
Eastfield Road
Ulceby Road
Rosper Rd
Town St
Eastfield Road
Top Rd
Queens Rd
Kiln Ln
A1173
A1173
A1173
Bluestone Ln
Stallingborough Road
Habrough Road
Refinery
A180
A180
A180
A160
A160

Appendix E
High Growth Traffic Flows

1,357
1,458
1,568
1,057 1,347 1,640
1,020
2,117
2,167 2,450 1,484
1,548 2,246
2,010
4,794
2,552 3,624 4,794
24 AADT 1,807 4,035
2016 3,098
Total Veh 4,006
Do Minimum 5,293
191
2,886 #N/A 6,438 3,312
2,168 4,769
158 #N/A
5,426
6,252 4,745
5,291
23 5 5,095
1,005
874 6,449 376 297
6,628 2,015
885 935 2,483
4,517
6,329 6,372
2,080
5,116
14,145 2,988
3,078 1,814
14,976 9,434
1,852
10,244
2,243
1,650 4,318
5,186
1,595
3,410
3,425
6,739
9,434 5,891
3,292
3,102
10,244
13,702
15,563
Total Vehicles
24 AADTTime Period:
Year:
Scenario:
12/09/2013 Box Information:
A160/A180 Port of Immingham Improvement
2016
Do Minimum
Time
Year
Box Information
Scenario
Project:
High Growth
Traffic Flow Information
Date:
North Killingholme
North Killingholme
Airfield
Town St
Habrough Road
Station Road
Humber Rd
Eastfield Road
Ulceby Road
Rosper Rd
Town St
Eastfield Road
Top Rd
Queens Rd
Kiln Ln
A1173
A1173
A1173
Bluestone Ln
Stallingborough Road
Habrough Road
Refinery
A180
A180
A180
A160
A160

88
213
279
30 256 106
280
233
542 540 91
22 346
41
927
189 232 927
AM 271 878
2016 382
Total Veh 251
Do Minimum 535
29
210 #N/A 1,106 217
344 512
13 #N/A
463
1,078 289
459
9 2 978
155
116 850 74 41
603 78
65 82 596
264
855 595
396
822
1,977 338
267 61
1,438 1,263
138
988
387
343 163
1,057
70
549
133
1,462
1,263 152
230
393
988
1,183
2,309
Total Vehicles
AMTime Period:
Year:
Scenario:
12/09/2013 Box Information:
A160/A180 Port of Immingham Improvement
2016
Do Minimum
Time
Year
Box Information
Scenario
Project:
High Growth
Traffic Flow Information
Date:
North Killingholme
North Killingholme
Airfield
Town St
Habrough Road
Station Road
Humber Rd
Eastfield Road
Ulceby Road
Rosper Rd
Town St
Eastfield Road
Top Rd
Queens Rd
Kiln Ln
A1173
A1173
A1173
Bluestone Ln
Stallingborough Road
Habrough Road
Refinery
A180
A180
A180
A160
A160

122
117
105
79 75 113
50
191
114 136 147
62 145
115
324
122 290 324
IP 129 238
2016 263
Total Veh 331
Do Minimum 443
16
153 #N/A 460 260
152 366
11 #N/A
433
444 387
422
0 0 314
80
80 517 20 22
482 138
78 78 126
396
499 467
155
381
1,075 243
252 152
1,173 699
148
830
156
99 339
328
117
246
296
421
699 483
275
229
830
1,048
1,122
Total Vehicles
IPTime Period:
Year:
Scenario:
12/09/2013 Box Information:
A160/A180 Port of Immingham Improvement
2016
Do Minimum
Time
Year
Box Information
Scenario
Project:
High Growth
Traffic Flow Information
Date:
North Killingholme
North Killingholme
Airfield
Town St
Habrough Road
Station Road
Humber Rd
Eastfield Road
Ulceby Road
Rosper Rd
Town St
Eastfield Road
Top Rd
Queens Rd
Kiln Ln
A1173
A1173
A1173
Bluestone Ln
Stallingborough Road
Habrough Road
Refinery
A180
A180
A180
A160
A160

185
110
121
231 129 319
24
182
87 156 171
505 246
549
286
617 597 286
PM 173 230
2016 269
Total Veh 634
Do Minimum 603
11
661 #N/A 462 552
194 604
27 #N/A
770
451 775
743
0 0 394
68
51 587 36 31
1,028 448
117 121 140
675
577 964
90
388
1,329 321
416 340
2,013 995
283
1,298
173
108 849
313
324
278
594
323
995 1,178
487
353
1,298
2,053
1,485
Total Vehicles
PMTime Period:
Year:
Scenario:
12/09/2013 Box Information:
A160/A180 Port of Immingham Improvement
2016
Do Minimum
Time
Year
Box Information
Scenario
Project:
High Growth
Traffic Flow Information
Date:
North Killingholme
North Killingholme
Airfield
Town St
Habrough Road
Station Road
Humber Rd
Eastfield Road
Ulceby Road
Rosper Rd
Town St
Eastfield Road
Top Rd
Queens Rd
Kiln Ln
A1173
A1173
A1173
Bluestone Ln
Stallingborough Road
Habrough Road
Refinery
A180
A180
A180
A160
A160

1,357
1,473
1,589
1,090 1,430 1,603
1,041
2,491
2,257 2,608 1,817
1,069 2,212
2,030
5,566
2,073 4,047 5,566
24 AADT 1,790 4,175
2016 3,196
Total Veh 4,697
Do Something 5,564
216
2,376 6 6,871 3,123
2,161 4,982
1 187
6,196
6,656 4,670
6,050
0 146 4,994
976
844 #N/A 423 383
#N/A 1,929
788 839 2,083
4,243
7,081 6,972
2,004
4,988
14,147 2,902
3,126 1,776
15,142 9,641
1,687
10,752
1,817
1,613 3,986
4,961
1,625
3,449
3,440
6,526
9,641 5,544
3,224
3,060
10,752
13,758
15,624
Total Vehicles
24 AADTTime Period:
Year:
Scenario:
12/09/2013 Box Information:
A160/A180 Port of Immingham Improvement
2016
Do Something
Time
Year
Box Information
Scenario
Project:
High Growth
Traffic Flow Information
Date:
North Killingholme
North Killingholme
Airfield
Town St
Habrough Road
Station Road
Humber Rd
Eastfield Road
Ulceby Road
Rosper Rd
Town St
Eastfield Road
Top Rd
Queens Rd
Kiln Ln
A1173
A1173
A1173
Bluestone Ln
Stallingborough Road
Habrough Road
Refinery
A180
A180
A180
A160
A160

88
220
294
35 261 107
293
241
579 551 94
24 371
50
1,006
191 248 1,006
AM 288 930
2016 432
Total Veh 277
Do Something 654
25
212 2 1,276 225
365 536
0 24
493
1,251 308
486
0 6 936
160
121 #N/A 69 50
#N/A 103
66 84 415
265
1,173 642
364
770
1,982 318
254 48
1,454 1,208
148
1,211
193
337 144
966
71
563
138
1,375
1,208 128
228
387
1,211
1,184
2,323
Total Vehicles
AMTime Period:
Year:
Scenario:
12/09/2013 Box Information:
A160/A180 Port of Immingham Improvement
2016
Do Something
Time
Year
Box Information
Scenario
Project:
High Growth
Traffic Flow Information
Date:
North Killingholme
North Killingholme
Airfield
Town St
Habrough Road
Station Road
Humber Rd
Eastfield Road
Ulceby Road
Rosper Rd
Town St
Eastfield Road
Top Rd
Queens Rd
Kiln Ln
A1173
A1173
A1173
Bluestone Ln
Stallingborough Road
Habrough Road
Refinery
A180
A180
A180
A160
A160

122
117
107
85 82 123
47
188
114 147 150
77 150
115
376
130 284 376
IP 120 240
2016 264
Total Veh 375
Do Something 428
20
157 0 466 260
143 379
0 11
458
446 348
448
0 11 312
73
73 #N/A 27 30
#N/A 141
69 69 127
354
498 504
155
379
1,076 241
252 152
1,177 736
145
830
158
97 297
325
123
246
298
419
736 443
266
226
830
1,053
1,123
Total Vehicles
IPTime Period:
Year:
Scenario:
12/09/2013 Box Information:
A160/A180 Port of Immingham Improvement
2016
Do Something
Time
Year
Box Information
Scenario
Project:
High Growth
Traffic Flow Information
Date:
North Killingholme
North Killingholme
Airfield
Town St
Habrough Road
Station Road
Humber Rd
Eastfield Road
Ulceby Road
Rosper Rd
Town St
Eastfield Road
Top Rd
Queens Rd
Kiln Ln
A1173
A1173
A1173
Bluestone Ln
Stallingborough Road
Habrough Road
Refinery
A180
A180
A180
A160
A160

185
110
110
222 143 272
26
352
87 184 311
246 191
549
407
376 786 407
PM 172 232
2016 258
Total Veh 801
Do Something 641
16
418 0 462 458
192 639
0 29
1,016
447 828
987
0 30 398
68
51 #N/A 42 38
#N/A 375
98 101 149
664
579 1,081
90
391
1,320 311
450 336
2,061 1,045
207
1,287
181
101 833
315
322
280
590
325
1,045 1,154
484
349
1,287
2,065
1,493
Total Vehicles
PMTime Period:
Year:
Scenario:
12/09/2013 Box Information:
A160/A180 Port of Immingham Improvement
2016
Do Something
Time
Year
Box Information
Scenario
Project:
High Growth
Traffic Flow Information
Date:
North Killingholme
North Killingholme
Airfield
Town St
Habrough Road
Station Road
Humber Rd
Eastfield Road
Ulceby Road
Rosper Rd
Town St
Eastfield Road
Top Rd
Queens Rd
Kiln Ln
A1173
A1173
A1173
Bluestone Ln
Stallingborough Road
Habrough Road
Refinery
A180
A180
A180
A160
A160

2,569
2,309
2,247
1,602 2,732 3,495
2,914
4,495
2,637 4,642 2,959
3,746 3,315
3,016
6,511
6,356 5,865 6,511
24 AADT 4,995 5,147
2031 4,771
Total Veh 5,130
Do Minimum 7,439
341
6,717 #N/A 7,711 5,341
5,095 6,943
476 #N/A
7,721
7,567 7,055
7,529
136 5 8,093
1,308
1,174 7,420 575 348
9,487 3,362
1,045 1,060 4,082
6,487
7,943 8,816
3,684
8,211
19,362 4,987
5,116 4,046
20,880 14,990
2,679
16,537
3,439
3,475 6,000
7,381
3,054
4,461
4,686
9,169
14,990 7,776
4,463
4,526
16,537
19,342
22,544
Total Vehicles
24 AADTTime Period:
Year:
Scenario:
12/09/2013 Box Information:
A160/A180 Port of Immingham Improvement
2031
Do Minimum
Time
Year
Box Information
Scenario
Project:
High Growth
Traffic Flow Information
Date:
North Killingholme
North Killingholme
Airfield
Town St
Habrough Road
Station Road
Humber Rd
Eastfield Road
Ulceby Road
Rosper Rd
Town St
Eastfield Road
Top Rd
Queens Rd
Kiln Ln
A1173
A1173
A1173
Bluestone Ln
Stallingborough Road
Habrough Road
Refinery
A180
A180
A180
A160
A160
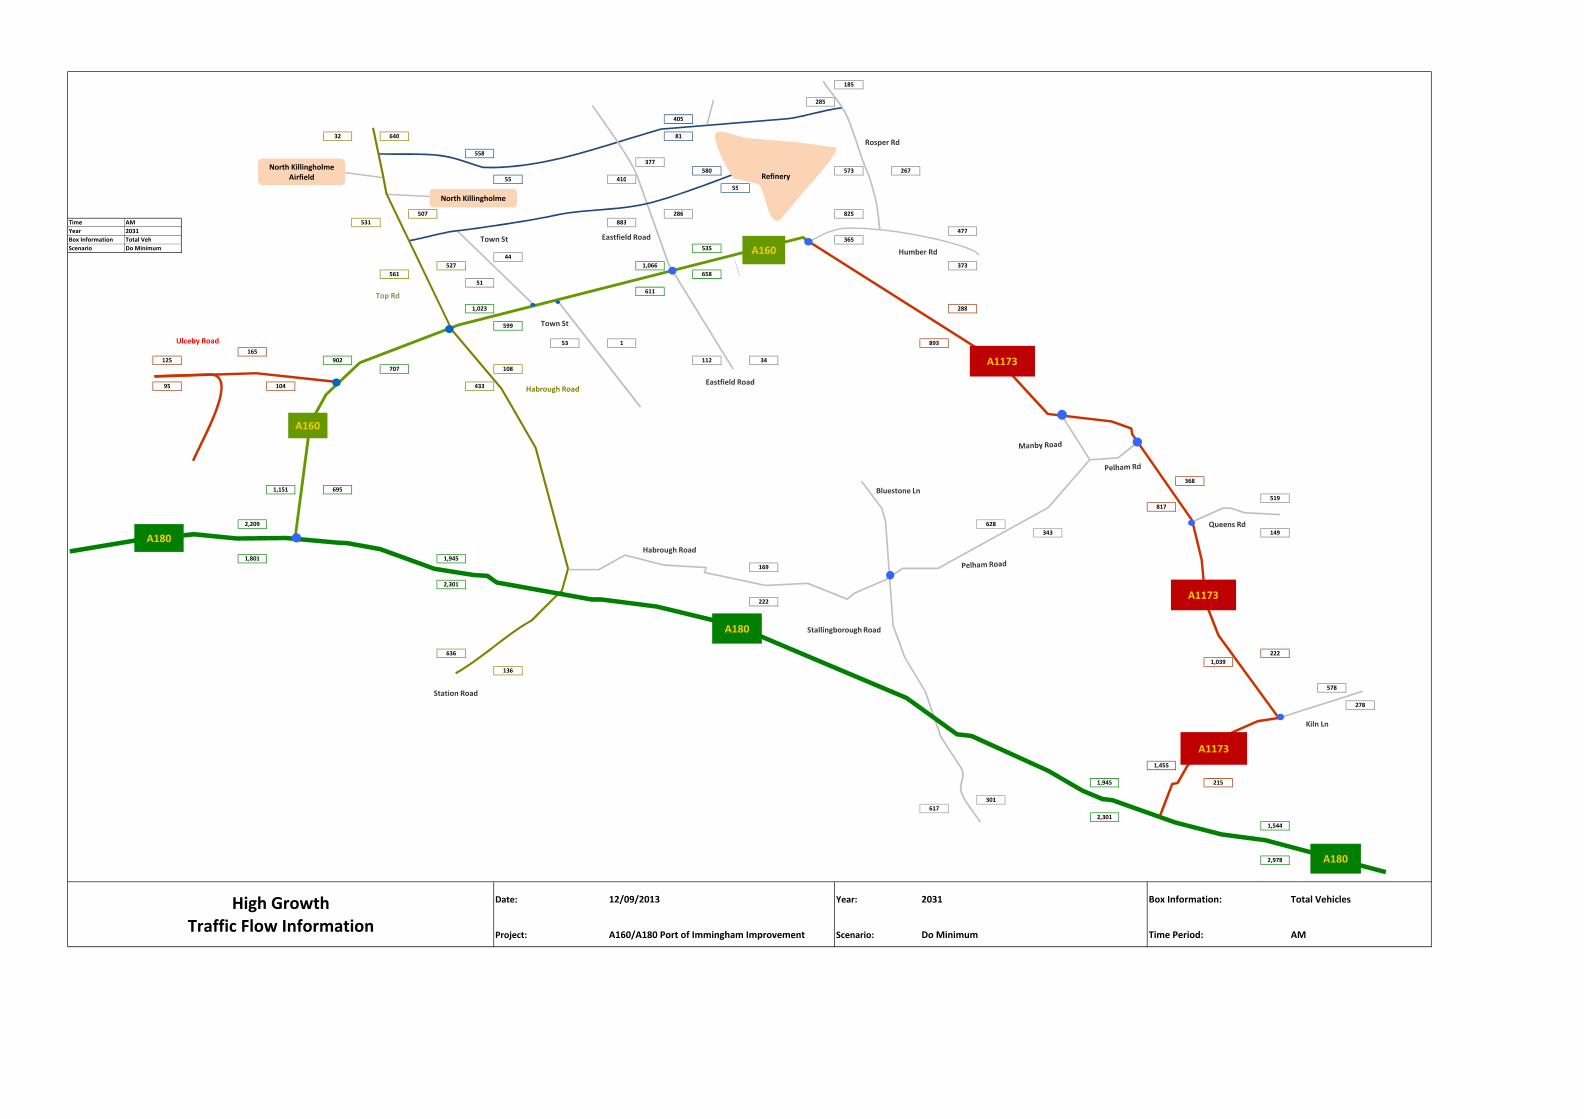
185
285
405
32 640 81
558
377
580 573 267
55 410
55
825
507 286 825
AM 531 883
2031 477
Total Veh 365
Do Minimum 535
44
527 #N/A 1,066 373
561 658
51 #N/A
611
1,023 288
599
53 1 893
165
125 902 112 34
707 108
95 104 433
368
1,151 695
519
817
2,209 628
343 149
1,801 1,945
169
2,301
222
636 222
1,039
136
578
278
1,455
1,945 215
301
617
2,301
1,544
2,978
Total Vehicles
AMTime Period:
Year:
Scenario:
12/09/2013 Box Information:
A160/A180 Port of Immingham Improvement
2031
Do Minimum
Time
Year
Box Information
Scenario
Project:
High Growth
Traffic Flow Information
Date:
North Killingholme
North Killingholme
Airfield
Town St
Habrough Road
Station Road
Humber Rd
Eastfield Road
Ulceby Road
Rosper Rd
Town St
Eastfield Road
Top Rd
Queens Rd
Kiln Ln
A1173
A1173
A1173
Bluestone Ln
Stallingborough Road
Habrough Road
Refinery
A180
A180
A180
A160
A160

235
201
151
118 138 375
241
420
164 437 277
404 262
187
612
586 559 612
IP 499 373
2031 413
Total Veh 445
Do Minimum 717
24
633 #N/A 630 434
502 585
40 #N/A
662
626 675
643
1 0 731
117
117 632 34 28
884 329
95 95 429
637
626 818
341
762
1,633 406
431 378
1,814 1,166
258
1,161
369
257 547
635
274
381
433
762
1,166 729
394
314
1,161
1,642
1,759
Total Vehicles
IPTime Period:
Year:
Scenario:
12/09/2013 Box Information:
A160/A180 Port of Immingham Improvement
2031
Do Minimum
Time
Year
Box Information
Scenario
Project:
High Growth
Traffic Flow Information
Date:
North Killingholme
North Killingholme
Airfield
Town St
Habrough Road
Station Road
Humber Rd
Eastfield Road
Ulceby Road
Rosper Rd
Town St
Eastfield Road
Top Rd
Queens Rd
Kiln Ln
A1173
A1173
A1173
Bluestone Ln
Stallingborough Road
Habrough Road
Refinery
A180
A180
A180
A160
A160

318
186
166
368 170 465
59
477
121 284 291
528 342
793
381
723 812 381
PM 319 358
2031 512
Total Veh 707
Do Minimum 824
40
738 #N/A 617 827
324 828
52 #N/A
1,021
609 1,030
999
0 0 695
94
77 655 47 44
1,108 503
110 107 206
792
640 999
175
748
1,907 469
764 634
2,537 1,496
323
1,826
304
184 977
481
483
353
632
494
1,496 1,287
616
525
1,826
2,587
2,176
Total Vehicles
PMTime Period:
Year:
Scenario:
12/09/2013 Box Information:
A160/A180 Port of Immingham Improvement
2031
Do Minimum
Time
Year
Box Information
Scenario
Project:
High Growth
Traffic Flow Information
Date:
North Killingholme
North Killingholme
Airfield
Town St
Habrough Road
Station Road
Humber Rd
Eastfield Road
Ulceby Road
Rosper Rd
Town St
Eastfield Road
Top Rd
Queens Rd
Kiln Ln
A1173
A1173
A1173
Bluestone Ln
Stallingborough Road
Habrough Road
Refinery
A180
A180
A180
A160
A160

2,569
2,443
3,107
1,535 2,012 3,290
3,311
4,031
3,084 4,610 3,845
4,093 4,054
3,058
8,364
6,519 5,284 8,364
24 AADT 6,644 6,131
2031 5,055
Total Veh 7,550
Do Something 7,939
253
6,977 35 10,453 5,008
7,032 6,952
81 298
8,583
10,280 7,031
8,403
43 222 7,067
1,481
1,312 #N/A 521 477
#N/A 3,648
1,164 1,231 5,047
6,054
12,253 11,683
3,719
6,985
20,813 4,635
5,231 3,865
21,738 14,988
2,967
16,653
4,222
2,718 5,412
6,213
2,630
4,723
4,820
8,502
14,988 7,638
4,514
4,235
16,653
19,831
22,793
Total Vehicles
24 AADTTime Period:
Year:
Scenario:
12/09/2013 Box Information:
A160/A180 Port of Immingham Improvement
2031
Do Something
Time
Year
Box Information
Scenario
Project:
High Growth
Traffic Flow Information
Date:
North Killingholme
North Killingholme
Airfield
Town St
Habrough Road
Station Road
Humber Rd
Eastfield Road
Ulceby Road
Rosper Rd
Town St
Eastfield Road
Top Rd
Queens Rd
Kiln Ln
A1173
A1173
A1173
Bluestone Ln
Stallingborough Road
Habrough Road
Refinery
A180
A180
A180
A160
A160

185
326
492
45 359 69
533
275
737 640 297
62 522
73
1,173
424 294 1,173
AM 870 1,206
2031 617
Total Veh 515
Do Something 941
12
455 2 1,878 378
963 610
0 37
640
1,866 427
648
17 7 773
204
154 #N/A 67 46
#N/A 107
113 136 1,022
460
1,767 822
552
777
2,740 466
433 140
1,930 1,674
171
1,831
738
474 290
1,019
94
633
187
1,514
1,674 263
286
545
1,831
1,507
3,012
Total Vehicles
AMTime Period:
Year:
Scenario:
12/09/2013 Box Information:
A160/A180 Port of Immingham Improvement
2031
Do Something
Time
Year
Box Information
Scenario
Project:
High Growth
Traffic Flow Information
Date:
North Killingholme
North Killingholme
Airfield
Town St
Habrough Road
Station Road
Humber Rd
Eastfield Road
Ulceby Road
Rosper Rd
Town St
Eastfield Road
Top Rd
Queens Rd
Kiln Ln
A1173
A1173
A1173
Bluestone Ln
Stallingborough Road
Habrough Road
Refinery
A180
A180
A180
A160
A160

235
211
271
131 130 337
317
330
175 410 390
415 274
187
722
578 481 722
IP 612 407
2031 430
Total Veh 724
Do Something 635
28
621 3 744 452
633 561
8 19
744
724 658
724
0 19 594
124
124 #N/A 45 44
#N/A 364
106 106 372
580
1,006 1,042
337
589
1,674 403
420 338
1,838 1,217
295
1,347
321
210 471
480
239
391
458
646
1,217 705
388
304
1,347
1,695
1,783
Total Vehicles
IPTime Period:
Year:
Scenario:
12/09/2013 Box Information:
A160/A180 Port of Immingham Improvement
2031
Do Something
Time
Year
Box Information
Scenario
Project:
High Growth
Traffic Flow Information
Date:
North Killingholme
North Killingholme
Airfield
Town St
Habrough Road
Station Road
Humber Rd
Eastfield Road
Ulceby Road
Rosper Rd
Town St
Eastfield Road
Top Rd
Queens Rd
Kiln Ln
A1173
A1173
A1173
Bluestone Ln
Stallingborough Road
Habrough Road
Refinery
A180
A180
A180
A160
A160

318
177
134
287 169 490
57
623
123 273 351
646 523
793
544
906 757 544
PM 391 363
2031 444
Total Veh 874
Do Something 839
26
965 4 673 619
410 951
14 42
1,156
661 918
1,118
2 39 738
111
89 #N/A 42 46
#N/A 537
115 121 166
655
887 1,544
164
710
1,881 490
751 672
2,719 1,644
348
1,873
237
145 845
399
434
385
723
448
1,644 1,240
672
497
1,873
2,702
2,187
Total Vehicles
PMTime Period:
Year:
Scenario:
12/09/2013 Box Information:
A160/A180 Port of Immingham Improvement
2031
Do Something
Time
Year
Box Information
Scenario
Project:
High Growth
Traffic Flow Information
Date:
North Killingholme
North Killingholme
Airfield
Town St
Habrough Road
Station Road
Humber Rd
Eastfield Road
Ulceby Road
Rosper Rd
Town St
Eastfield Road
Top Rd
Queens Rd
Kiln Ln
A1173
A1173
A1173
Bluestone Ln
Stallingborough Road
Habrough Road
Refinery
A180
A180
A180
A160
A160

Appendix F
Low Growth Traffic Flows

1,198
1,311
1,356
937 1,191 1,318
898
1,876
1,973 2,177 1,347
1,194 1,927
1,793
4,407
1,843 3,366 4,407
24 AADT 1,391 3,647
2016 2,782
Total Veh 3,661
Do Minimum 4,908
184
2,148 #N/A 5,862 2,892
1,726 4,276
139 #N/A
4,884
5,681 4,349
4,758
13 4 4,498
914
785 6,243 337 267
5,765 1,729
767 824 1,767
4,110
6,051 5,582
1,799
4,488
12,556 2,611
2,695 1,595
13,325 8,182
1,611
9,432
1,601
1,408 3,898
4,482
1,387
3,124
3,104
5,949
8,182 5,348
2,752
2,728
9,432
12,280
13,812
Total Vehicles
24 AADTTime Period:
Year:
Scenario:
12/09/2013 Box Information:
A160/A180 Port of Immingham Improvement
2016
Do Minimum
Time
Year
Box Information
Scenario
Project:
Low Growth
Traffic Flow Information
Date:
North Killingholme
North Killingholme
Airfield
Town St
Habrough Road
Station Road
Humber Rd
Eastfield Road
Ulceby Road
Rosper Rd
Town St
Eastfield Road
Top Rd
Queens Rd
Kiln Ln
A1173
A1173
A1173
Bluestone Ln
Stallingborough Road
Habrough Road
Refinery
A180
A180
A180
A160
A160

77
194
250
28 225 86
257
212
500 487 70
15 317
36
865
137 212 865
AM 210 817
2016 364
Total Veh 222
Do Minimum 538
32
157 #N/A 1,059 194
278 466
11 #N/A
410
1,028 279
404
5 1 867
139
104 997 66 38
532 80
58 74 361
242
965 531
329
710
1,769 290
225 47
1,281 1,083
126
1,031
180
287 143
893
59
519
127
1,279
1,083 137
198
368
1,031
1,064
2,048
Total Vehicles
AMTime Period:
Year:
Scenario:
12/09/2013 Box Information:
A160/A180 Port of Immingham Improvement
2016
Do Minimum
Time
Year
Box Information
Scenario
Project:
Low Growth
Traffic Flow Information
Date:
North Killingholme
North Killingholme
Airfield
Town St
Habrough Road
Station Road
Humber Rd
Eastfield Road
Ulceby Road
Rosper Rd
Town St
Eastfield Road
Top Rd
Queens Rd
Kiln Ln
A1173
A1173
A1173
Bluestone Ln
Stallingborough Road
Habrough Road
Refinery
A180
A180
A180
A160
A160

108
104
89
69 66 96
41
168
101 118 126
51 125
103
289
86 255 289
IP 95 208
2016 234
Total Veh 293
Do Minimum 394
14
113 #N/A 403 230
116 323
10 #N/A
378
389 340
368
0 0 275
72
72 452 18 19
418 115
67 67 104
350
434 406
138
336
946 214
221 135
1,038 612
128
733
134
85 298
288
101
221
266
375
612 430
223
195
733
937
992
Total Vehicles
IPTime Period:
Year:
Scenario:
12/09/2013 Box Information:
A160/A180 Port of Immingham Improvement
2016
Do Minimum
Time
Year
Box Information
Scenario
Project:
Low Growth
Traffic Flow Information
Date:
North Killingholme
North Killingholme
Airfield
Town St
Habrough Road
Station Road
Humber Rd
Eastfield Road
Ulceby Road
Rosper Rd
Town St
Eastfield Road
Top Rd
Queens Rd
Kiln Ln
A1173
A1173
A1173
Bluestone Ln
Stallingborough Road
Habrough Road
Refinery
A180
A180
A180
A160
A160

165
99
99
204 116 241
19
160
78 139 188
385 189
490
273
451 595 273
PM 144 203
2016 225
Total Veh 614
Do Minimum 563
10
493 #N/A 409 468
164 549
24 #N/A
732
399 735
708
0 0 350
66
46 514 33 28
890 382
102 110 125
640
511 842
81
347
1,185 282
370 301
1,805 859
243
1,150
163
96 791
279
288
250
539
290
859 1,092
421
304
1,150
1,844
1,328
Total Vehicles
PMTime Period:
Year:
Scenario:
12/09/2013 Box Information:
A160/A180 Port of Immingham Improvement
2016
Do Minimum
Time
Year
Box Information
Scenario
Project:
Low Growth
Traffic Flow Information
Date:
North Killingholme
North Killingholme
Airfield
Town St
Habrough Road
Station Road
Humber Rd
Eastfield Road
Ulceby Road
Rosper Rd
Town St
Eastfield Road
Top Rd
Queens Rd
Kiln Ln
A1173
A1173
A1173
Bluestone Ln
Stallingborough Road
Habrough Road
Refinery
A180
A180
A180
A160
A160

1,198
1,315
1,340
965 1,270 1,376
875
2,247
2,000 2,313 1,542
867 1,931
1,802
4,961
1,533 3,725 4,961
24 AADT 1,336 3,706
2016 2,825
Total Veh 4,129
Do Something 5,017
207
1,807 5 6,055 2,769
1,671 4,420
0 150
5,516
5,848 4,196
5,383
0 133 4,461
875
756 #N/A 411 353
#N/A 1,644
705 752 1,749
3,843
6,166 6,062
1,785
4,463
12,538 2,569
2,744 1,559
13,409 8,485
1,476
9,465
1,546
1,414 3,604
4,450
1,411
3,134
3,118
5,880
8,485 5,017
2,691
2,637
9,465
12,339
13,863
Total Vehicles
24 AADTTime Period:
Year:
Scenario:
12/09/2013 Box Information:
A160/A180 Port of Immingham Improvement
2016
Do Something
Time
Year
Box Information
Scenario
Project:
Low Growth
Traffic Flow Information
Date:
North Killingholme
North Killingholme
Airfield
Town St
Habrough Road
Station Road
Humber Rd
Eastfield Road
Ulceby Road
Rosper Rd
Town St
Eastfield Road
Top Rd
Queens Rd
Kiln Ln
A1173
A1173
A1173
Bluestone Ln
Stallingborough Road
Habrough Road
Refinery
A180
A180
A180
A160
A160

77
196
242
29 231 87
250
218
511 504 71
16 326
40
908
139 221 908
AM 200 834
2016 375
Total Veh 244
Do Something 580
28
159 2 1,123 202
269 481
0 13
436
1,096 268
430
0 6 847
144
108 #N/A 75 50
#N/A 90
58 74 342
232
1,015 561
322
697
1,764 284
224 35
1,288 1,086
131
1,065
151
295 125
878
62
520
133
1,252
1,086 113
196
350
1,065
1,067
2,057
Total Vehicles
AMTime Period:
Year:
Scenario:
12/09/2013 Box Information:
A160/A180 Port of Immingham Improvement
2016
Do Something
Time
Year
Box Information
Scenario
Project:
Low Growth
Traffic Flow Information
Date:
North Killingholme
North Killingholme
Airfield
Town St
Habrough Road
Station Road
Humber Rd
Eastfield Road
Ulceby Road
Rosper Rd
Town St
Eastfield Road
Top Rd
Queens Rd
Kiln Ln
A1173
A1173
A1173
Bluestone Ln
Stallingborough Road
Habrough Road
Refinery
A180
A180
A180
A160
A160

108
104
91
75 72 103
39
165
102 126 129
62 129
103
331
93 251 331
IP 89 210
2016 235
Total Veh 329
Do Something 382
18
117 0 409 230
110 338
0 10
405
391 307
395
0 10 275
66
66 #N/A 25 26
#N/A 118
61 61 107
314
433 436
138
336
948 212
222 135
1,037 643
125
729
136
85 263
287
107
222
266
374
643 393
215
192
729
939
994
Total Vehicles
IPTime Period:
Year:
Scenario:
12/09/2013 Box Information:
A160/A180 Port of Immingham Improvement
2016
Do Something
Time
Year
Box Information
Scenario
Project:
Low Growth
Traffic Flow Information
Date:
North Killingholme
North Killingholme
Airfield
Town St
Habrough Road
Station Road
Humber Rd
Eastfield Road
Ulceby Road
Rosper Rd
Town St
Eastfield Road
Top Rd
Queens Rd
Kiln Ln
A1173
A1173
A1173
Bluestone Ln
Stallingborough Road
Habrough Road
Refinery
A180
A180
A180
A160
A160

165
99
97
198 128 246
21
329
78 160 268
206 169
490
363
289 759 363
PM 146 204
2016 231
Total Veh 703
Do Something 600
14
327 0 410 405
165 556
0 27
918
396 770
890
0 27 355
62
46 #N/A 38 34
#N/A 324
89 93 132
627
512 944
82
350
1,178 275
393 298
1,839 908
184
1,139
163
90 774
282
279
252
539
291
908 1,070
417
290
1,139
1,861
1,337
Total Vehicles
PMTime Period:
Year:
Scenario:
12/09/2013 Box Information:
A160/A180 Port of Immingham Improvement
2016
Do Something
Time
Year
Box Information
Scenario
Project:
Low Growth
Traffic Flow Information
Date:
North Killingholme
North Killingholme
Airfield
Town St
Habrough Road
Station Road
Humber Rd
Eastfield Road
Ulceby Road
Rosper Rd
Town St
Eastfield Road
Top Rd
Queens Rd
Kiln Ln
A1173
A1173
A1173
Bluestone Ln
Stallingborough Road
Habrough Road
Refinery
A180
A180
A180
A160
A160

1,331
1,471
1,476
973 1,334 1,570
954
2,462
2,123 2,441 1,481
994 2,083
1,960
4,853
1,712 3,973 4,853
24 AADT 1,483 3,943
2031 3,025
Total Veh 4,002
Do Minimum 5,523
216
2,034 #N/A 6,321 3,136
1,832 4,760
173 #N/A
5,674
6,110 4,945
5,521
22 5 5,093
934
787 6,309 396 283
6,479 1,619
761 827 2,205
4,718
6,083 6,187
2,884
5,161
14,143 2,720
2,855 2,747
15,298 9,392
1,551
10,464
2,013
1,451 4,644
5,226
1,347
3,393
3,364
6,821
9,392 6,213
2,993
2,805
10,464
13,387
15,236
Total Vehicles
24 AADTTime Period:
Year:
Scenario:
12/09/2013 Box Information:
A160/A180 Port of Immingham Improvement
2031
Do Minimum
Time
Year
Box Information
Scenario
Project:
Low Growth
Traffic Flow Information
Date:
North Killingholme
North Killingholme
Airfield
Town St
Habrough Road
Station Road
Humber Rd
Eastfield Road
Ulceby Road
Rosper Rd
Town St
Eastfield Road
Top Rd
Queens Rd
Kiln Ln
A1173
A1173
A1173
Bluestone Ln
Stallingborough Road
Habrough Road
Refinery
A180
A180
A180
A160
A160

88
207
267
31 250 95
264
225
519 516 80
15 333
41
907
162 225 907
AM 227 847
2031 381
Total Veh 252
Do Minimum 552
35
182 #N/A 1,102 220
301 511
12 #N/A
472
1,068 290
468
9 1 940
145
105 857 73 38
593 78
67 87 541
270
859 581
481
788
2,005 317
233 126
1,447 1,283
127
1,006
362
297 166
1,039
64
542
134
1,439
1,283 158
212
387
1,006
1,153
2,250
Total Vehicles
AMTime Period:
Year:
Scenario:
12/09/2013 Box Information:
A160/A180 Port of Immingham Improvement
2031
Do Minimum
Time
Year
Box Information
Scenario
Project:
Low Growth
Traffic Flow Information
Date:
North Killingholme
North Killingholme
Airfield
Town St
Habrough Road
Station Road
Humber Rd
Eastfield Road
Ulceby Road
Rosper Rd
Town St
Eastfield Road
Top Rd
Queens Rd
Kiln Ln
A1173
A1173
A1173
Bluestone Ln
Stallingborough Road
Habrough Road
Refinery
A180
A180
A180
A160
A160

120
120
102
78 74 109
46
188
115 136 144
59 141
116
325
91 287 325
IP 104 235
2031 259
Total Veh 331
Do Minimum 435
18
120 #N/A 452 256
125 373
12 #N/A
444
434 382
432
0 0 322
71
71 497 23 20
484 114
67 67 108
404
472 464
233
393
1,069 218
224 246
1,199 707
131
845
136
88 360
336
98
247
290
435
707 503
250
198
845
1,023
1,099
Total Vehicles
IPTime Period:
Year:
Scenario:
12/09/2013 Box Information:
A160/A180 Port of Immingham Improvement
2031
Do Minimum
Time
Year
Box Information
Scenario
Project:
Low Growth
Traffic Flow Information
Date:
North Killingholme
North Killingholme
Airfield
Town St
Habrough Road
Station Road
Humber Rd
Eastfield Road
Ulceby Road
Rosper Rd
Town St
Eastfield Road
Top Rd
Queens Rd
Kiln Ln
A1173
A1173
A1173
Bluestone Ln
Stallingborough Road
Habrough Road
Refinery
A180
A180
A180
A160
A160

180
114
102
192 133 309
21
358
89 177 188
271 197
524
331
350 770 331
PM 142 230
2031 250
Total Veh 633
Do Minimum 712
12
395 #N/A 437 480
162 582
33 #N/A
842
426 879
809
0 0 412
71
48 571 38 33
966 337
89 98 120
735
535 901
150
410
1,315 292
427 433
2,078 932
207
1,336
151
96 934
327
271
275
581
347
932 1,261
440
311
1,336
2,013
1,464
Total Vehicles
PMTime Period:
Year:
Scenario:
12/09/2013 Box Information:
A160/A180 Port of Immingham Improvement
2031
Do Minimum
Time
Year
Box Information
Scenario
Project:
Low Growth
Traffic Flow Information
Date:
North Killingholme
North Killingholme
Airfield
Town St
Habrough Road
Station Road
Humber Rd
Eastfield Road
Ulceby Road
Rosper Rd
Town St
Eastfield Road
Top Rd
Queens Rd
Kiln Ln
A1173
A1173
A1173
Bluestone Ln
Stallingborough Road
Habrough Road
Refinery
A180
A180
A180
A160
A160

1,331
1,485
1,616
974 1,300 1,473
1,050
2,341
2,193 2,410 1,744
993 2,130
1,979
5,385
1,623 3,951 5,385
24 AADT 1,532 4,040
2031 3,184
Total Veh 4,633
Do Something 5,497
231
1,911 10 6,750 3,103
1,885 5,147
5 209
6,362
6,525 4,466
6,198
0 164 4,886
949
802 #N/A 442 381
#N/A 1,676
766 834 1,803
4,233
7,020 6,957
2,768
4,954
14,181 2,681
2,806 2,707
15,400 9,748
1,518
11,035
1,571
1,458 4,089
4,870
1,433
3,412
3,386
6,526
9,748 5,719
2,891
2,752
11,035
13,458
15,278
Total Vehicles
24 AADTTime Period:
Year:
Scenario:
12/09/2013 Box Information:
A160/A180 Port of Immingham Improvement
2031
Do Something
Time
Year
Box Information
Scenario
Project:
Low Growth
Traffic Flow Information
Date:
North Killingholme
North Killingholme
Airfield
Town St
Habrough Road
Station Road
Humber Rd
Eastfield Road
Ulceby Road
Rosper Rd
Town St
Eastfield Road
Top Rd
Queens Rd
Kiln Ln
A1173
A1173
A1173
Bluestone Ln
Stallingborough Road
Habrough Road
Refinery
A180
A180
A180
A160
A160

88
212
320
32 235 97
311
227
548 484 81
17 352
48
943
149 234 943
AM 277 877
2031 433
Total Veh 272
Do Something 652
27
169 2 1,226 224
354 554
0 26
502
1,199 293
495
0 7 885
152
111 #N/A 67 48
#N/A 94
68 88 365
258
1,189 635
442
733
2,020 307
231 116
1,465 1,239
138
1,239
173
302 138
939
67
548
140
1,345
1,239 136
208
367
1,239
1,154
2,266
Total Vehicles
AMTime Period:
Year:
Scenario:
12/09/2013 Box Information:
A160/A180 Port of Immingham Improvement
2031
Do Something
Time
Year
Box Information
Scenario
Project:
Low Growth
Traffic Flow Information
Date:
North Killingholme
North Killingholme
Airfield
Town St
Habrough Road
Station Road
Humber Rd
Eastfield Road
Ulceby Road
Rosper Rd
Town St
Eastfield Road
Top Rd
Queens Rd
Kiln Ln
A1173
A1173
A1173
Bluestone Ln
Stallingborough Road
Habrough Road
Refinery
A180
A180
A180
A160
A160

120
120
102
79 74 116
43
185
115 143 145
69 146
116
371
94 283 371
IP 93 238
2031 261
Total Veh 369
Do Something 441
21
119 1 465 258
115 384
1 12
454
444 358
443
0 12 310
71
71 #N/A 31 29
#N/A 119
67 67 106
379
488 484
230
382
1,069 216
225 245
1,199 722
128
857
133
88 334
323
107
248
290
430
722 484
242
197
857
1,023
1,099
Total Vehicles
IPTime Period:
Year:
Scenario:
12/09/2013 Box Information:
A160/A180 Port of Immingham Improvement
2031
Do Something
Time
Year
Box Information
Scenario
Project:
Low Growth
Traffic Flow Information
Date:
North Killingholme
North Killingholme
Airfield
Town St
Habrough Road
Station Road
Humber Rd
Eastfield Road
Ulceby Road
Rosper Rd
Town St
Eastfield Road
Top Rd
Queens Rd
Kiln Ln
A1173
A1173
A1173
Bluestone Ln
Stallingborough Road
Habrough Road
Refinery
A180
A180
A180
A160
A160

180
115
109
190 133 245
24
307
89 179 305
241 185
524
406
316 759 406
PM 140 232
2031 259
Total Veh 791
Do Something 576
17
357 1 463 457
159 681
1 35
1,093
447 724
1,058
0 35 409
71
48 #N/A 42 42
#N/A 332
91 100 133
597
560 1,139
146
406
1,315 292
404 429
2,103 1,099
187
1,310
159
93 785
310
284
277
586
329
1,099 1,113
420
309
1,310
2,044
1,465
Total Vehicles
PMTime Period:
Year:
Scenario:
12/09/2013 Box Information:
A160/A180 Port of Immingham Improvement
2031
Do Something
Time
Year
Box Information
Scenario
Project:
Low Growth
Traffic Flow Information
Date:
North Killingholme
North Killingholme
Airfield
Town St
Habrough Road
Station Road
Humber Rd
Eastfield Road
Ulceby Road
Rosper Rd
Town St
Eastfield Road
Top Rd
Queens Rd
Kiln Ln
A1173
A1173
A1173
Bluestone Ln
Stallingborough Road
Habrough Road
Refinery
A180
A180
A180
A160
A160
Top Related