


Languages
Pages
Legal

The Capital of ScandinaviaThe Capital of Scandinavia
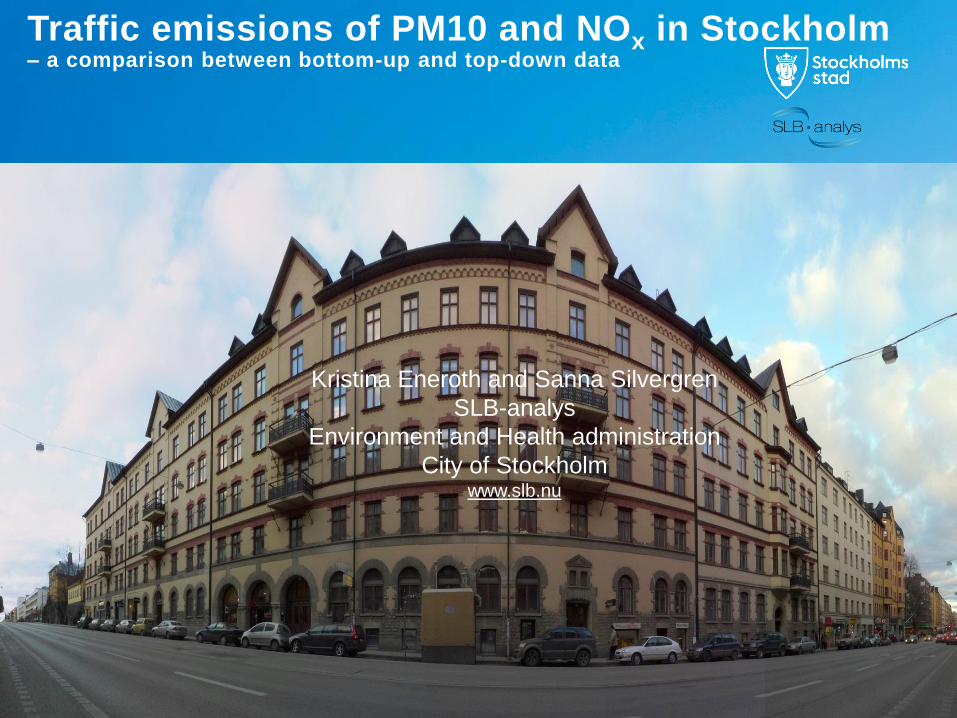
Traffic emissions of PM10 and NOx in Stockholm – a comparison between bottom-up and top-down data
Kristina Eneroth and Sanna Silvergren
SLB-analys
Environment and Health administration
City of Stockholmwww.slb.nu
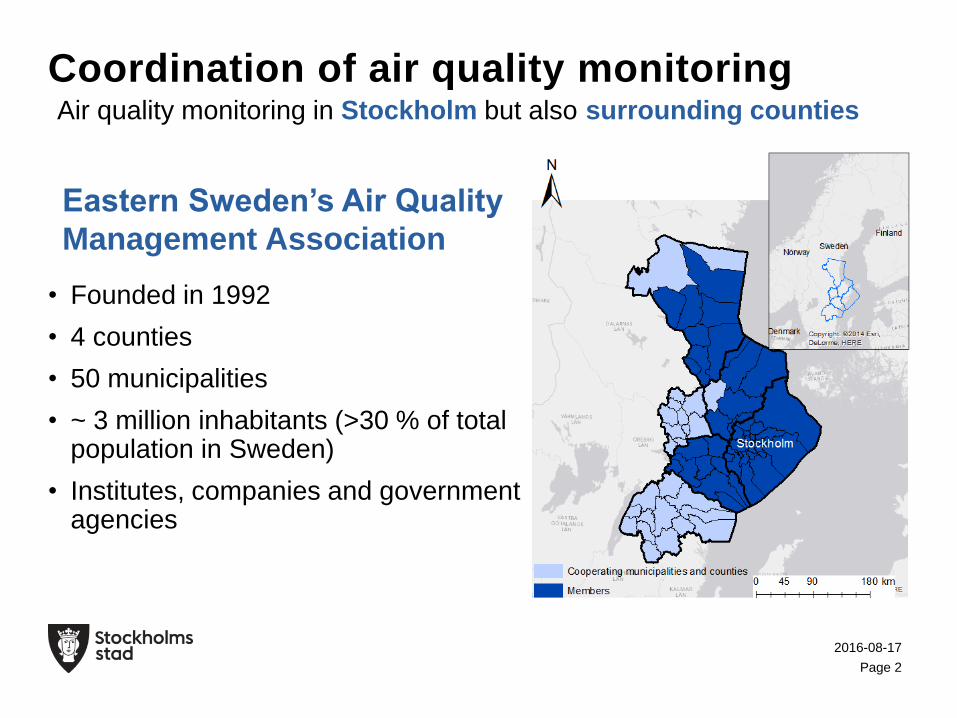
• Founded in 1992
• 4 counties
• 50 municipalities
• ~ 3 million inhabitants (>30 % of total population in Sweden)
• Institutes, companies and government agencies
Coordination of air quality monitoringAir quality monitoring in Stockholm but also surrounding counties
2016-08-17
Page 2
Eastern Sweden’s Air Quality
Management Association
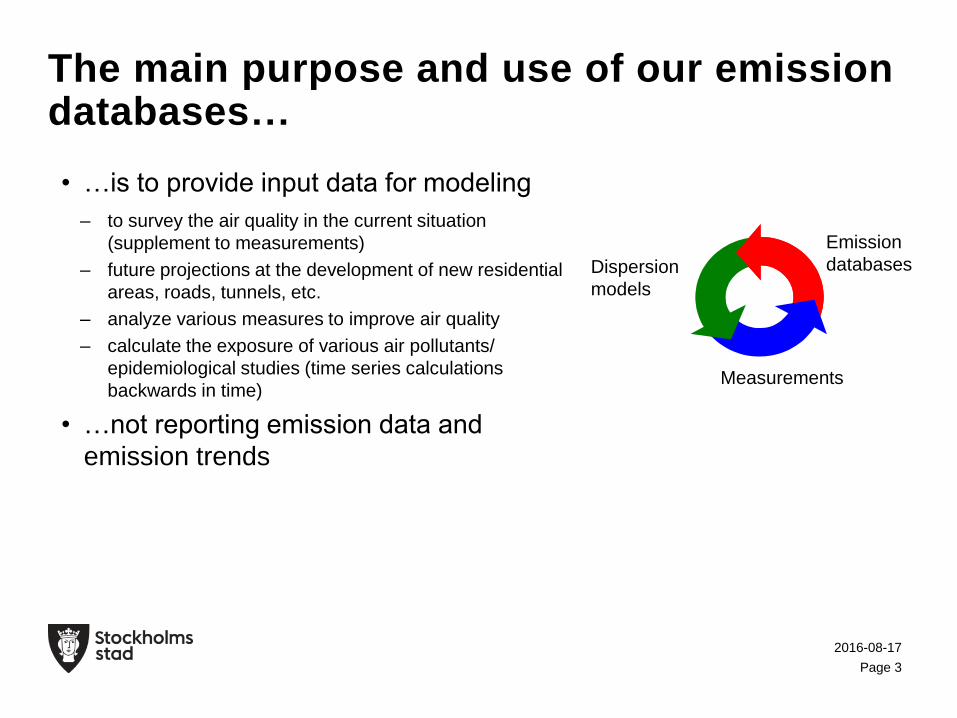
• …is to provide input data for modeling
– to survey the air quality in the current situation
(supplement to measurements)
– future projections at the development of new residential
areas, roads, tunnels, etc.
– analyze various measures to improve air quality
– calculate the exposure of various air pollutants/
epidemiological studies (time series calculations
backwards in time)
• …not reporting emission data and
emission trends
The main purpose and use of our emission databases…
2016-08-17
Page 3
Measurements
Emission
databasesDispersion
models
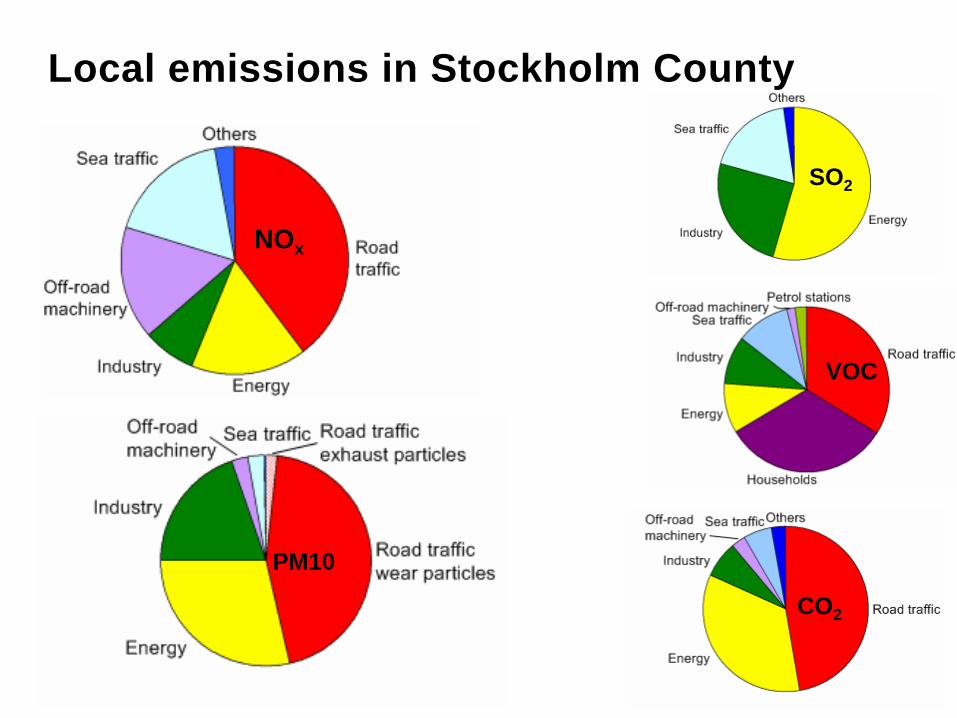
Local emissions in Stockholm County
2016-08-17
Page 4
NOx
PM10
CO2
SO2
VOC
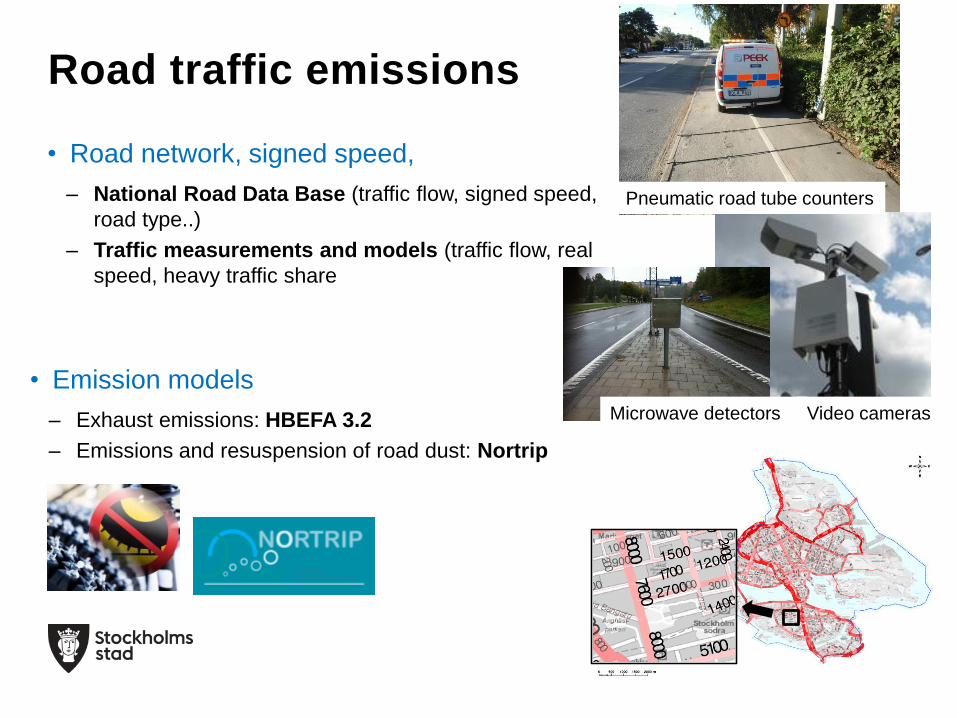
Road traffic emissions
2016-08-17
Page 5
• Road network, signed speed,
– National Road Data Base (traffic flow, signed speed,
road type..)
– Traffic measurements and models (traffic flow, real
speed, heavy traffic share
Pneumatic road tube counters
Video camerasMicrowave detectors
• Emission models
– Exhaust emissions: HBEFA 3.2
– Emissions and resuspension of road dust: Nortrip
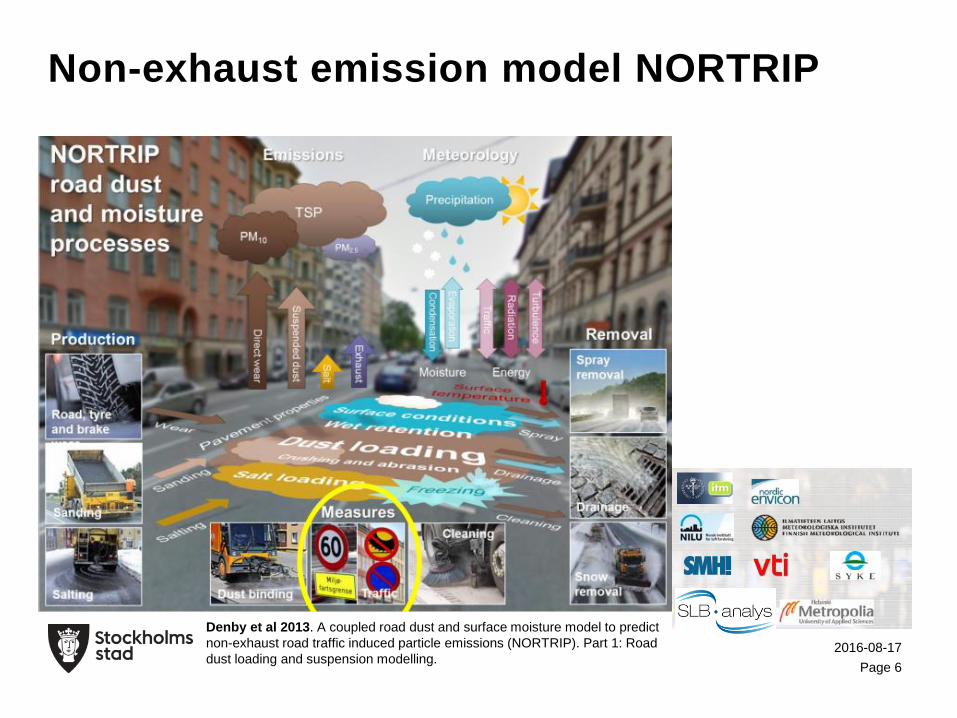
Non-exhaust emission model NORTRIP
2016-08-17
Page 6
Denby et al 2013. A coupled road dust and surface moisture model to predict
non-exhaust road traffic induced particle emissions (NORTRIP). Part 1: Road
dust loading and suspension modelling.
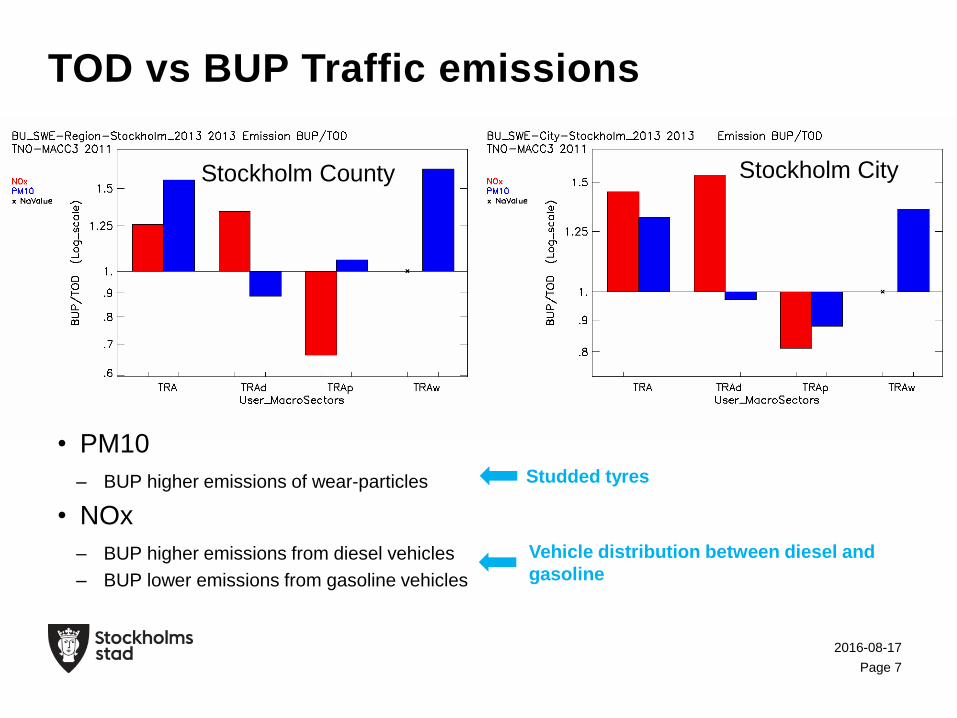
• PM10
– BUP higher emissions of wear-particles
• NOx
– BUP higher emissions from diesel vehicles
– BUP lower emissions from gasoline vehicles
TOD vs BUP Traffic emissions
2016-08-17
Page 7
Stockholm County Stockholm City
Studded tyres
Vehicle distribution between diesel and
gasoline
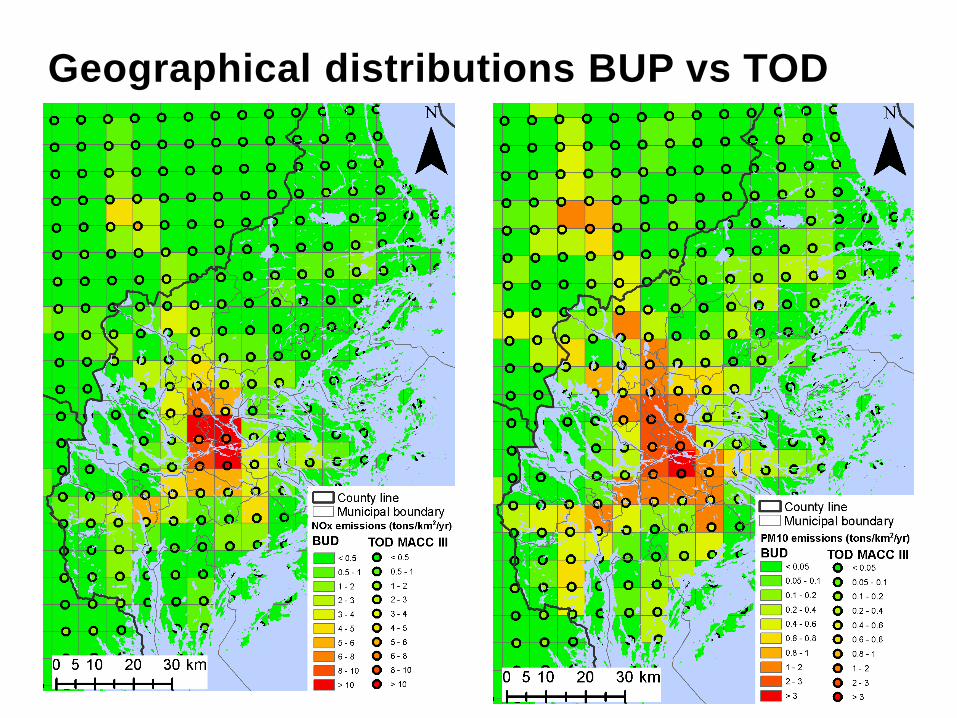
Geographical distributions BUP vs TOD
2016-08-17
Page 8
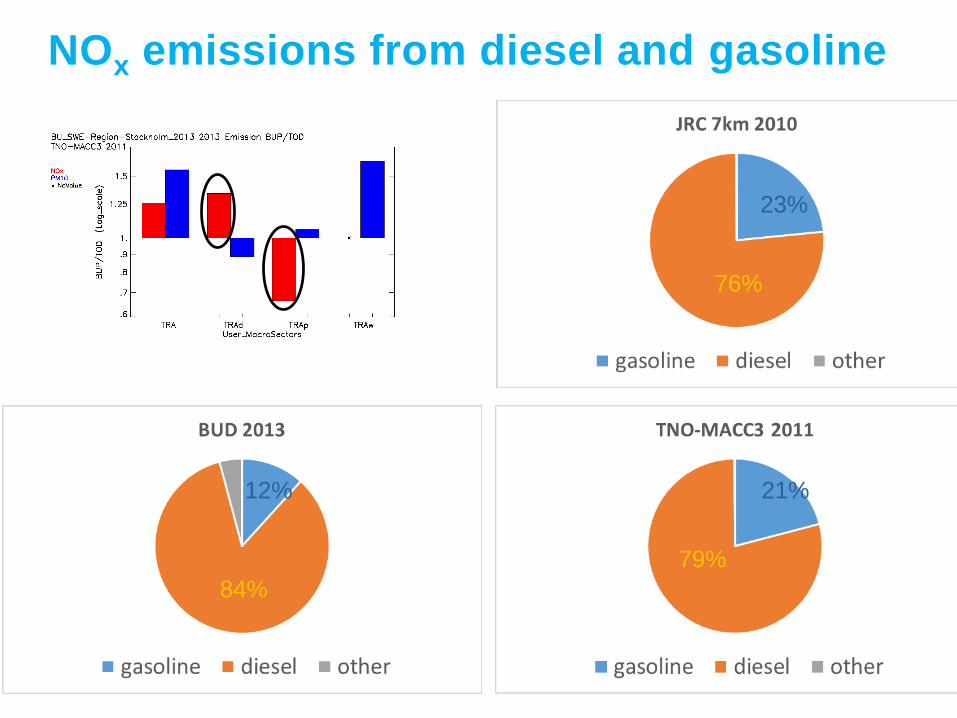
NOx emissions from diesel and gasoline
79%
84%
12% 21%
76%
23%
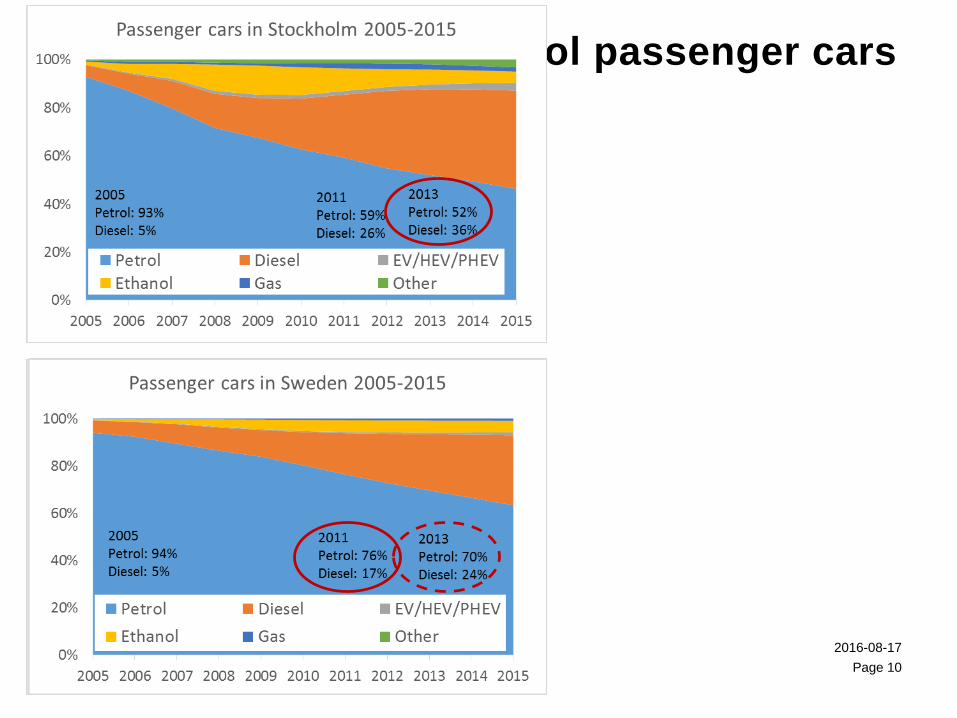
Trends in diesel and petrol passenger cars
2016-08-17
Page 10
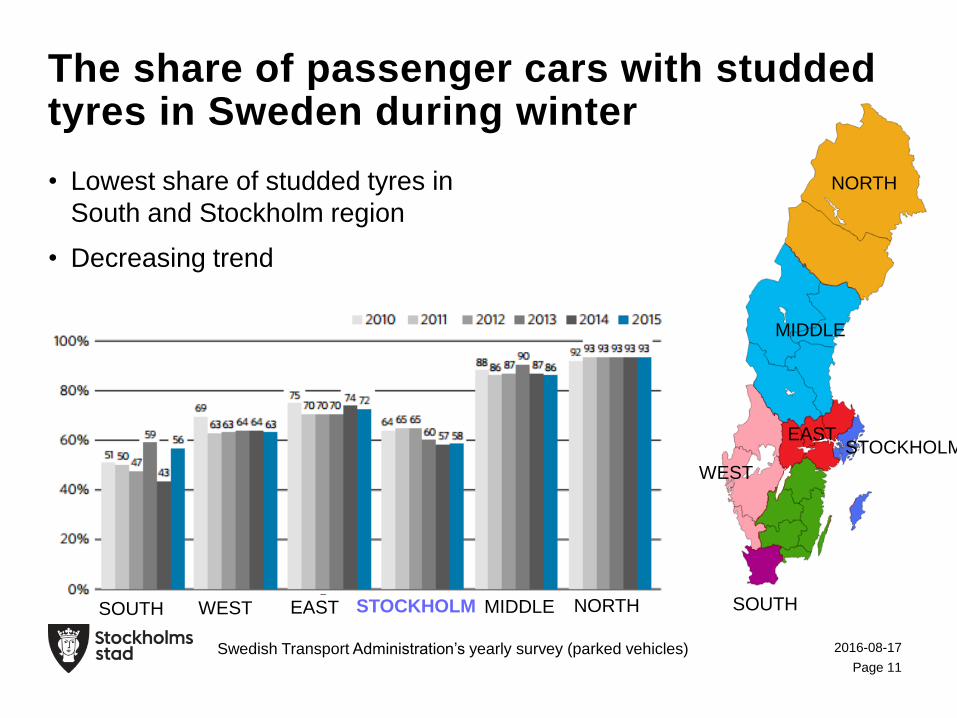
• Lowest share of studded tyres in
South and Stockholm region
• Decreasing trend
The share of passenger cars with studded tyres in Sweden during winter
2016-08-17
Page 11
SOUTH
WEST
STOCKHOLMEAST
MIDDLE
NORTH
SOUTH WEST EAST STOCKHOLM MIDDLE NORTH
Swedish Transport Administration’s yearly survey (parked vehicles)
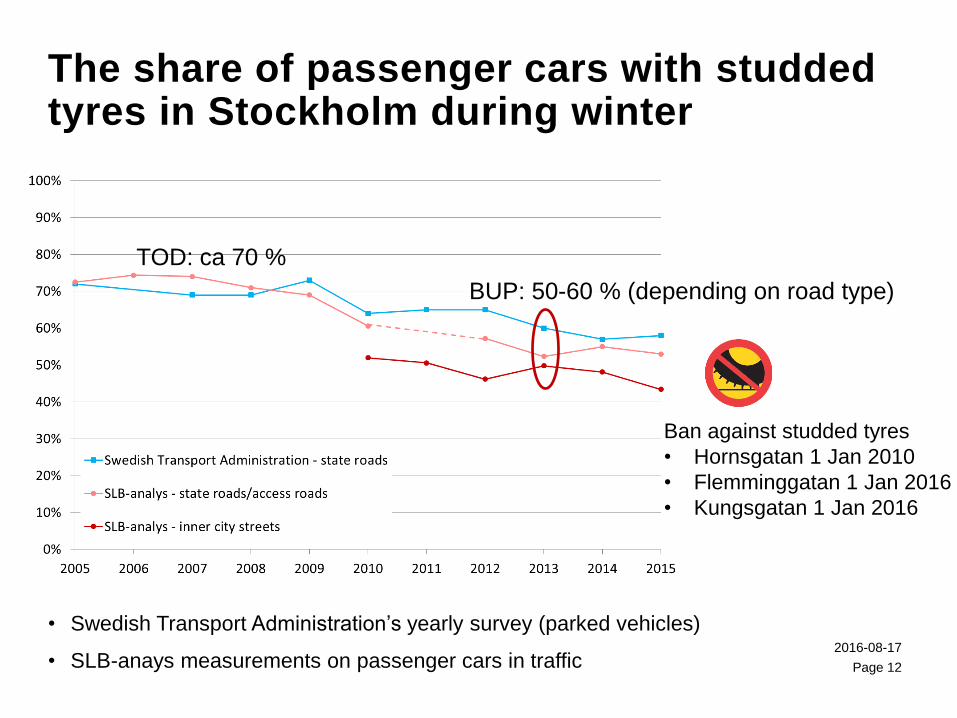
• Swedish Transport Administration’s yearly survey (parked vehicles)
• SLB-anays measurements on passenger cars in traffic
The share of passenger cars with studded tyres in Stockholm during winter
2016-08-17
Page 12
TOD: ca 70 %
BUP: 50-60 % (depending on road type)
Ban against studded tyres
• Hornsgatan 1 Jan 2010
• Flemminggatan 1 Jan 2016
• Kungsgatan 1 Jan 2016
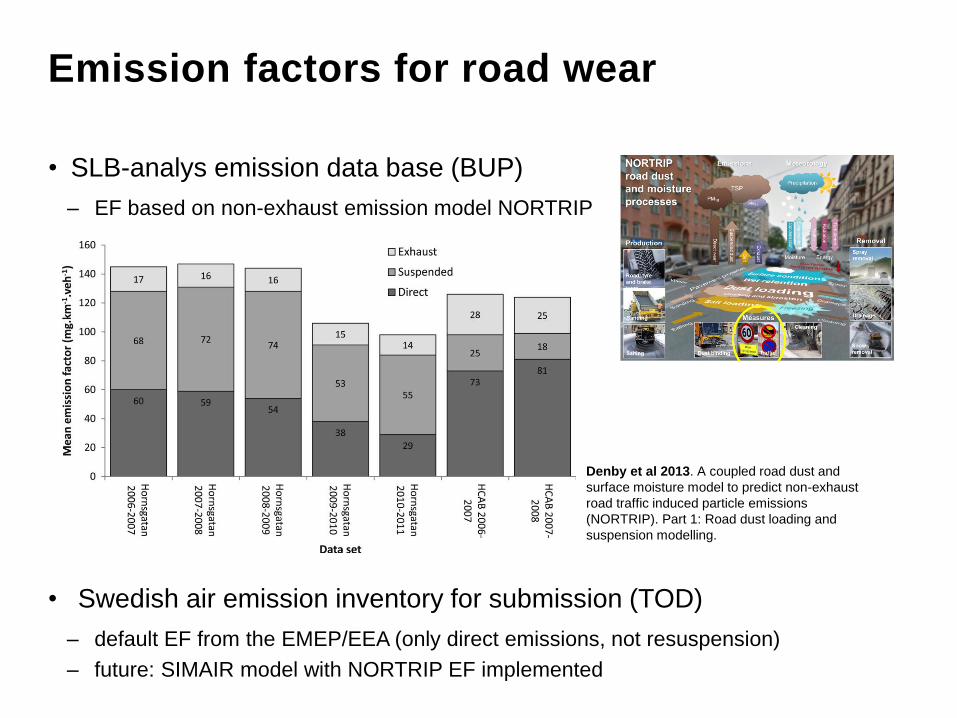
• SLB-analys emission data base (BUP)
– EF based on non-exhaust emission model NORTRIP
Emission factors for road wear
• Swedish air emission inventory for submission (TOD)
– default EF from the EMEP/EEA (only direct emissions, not resuspension)
– future: SIMAIR model with NORTRIP EF implemented
Denby et al 2013. A coupled road dust and
surface moisture model to predict non-exhaust
road traffic induced particle emissions
(NORTRIP). Part 1: Road dust loading and
suspension modelling.
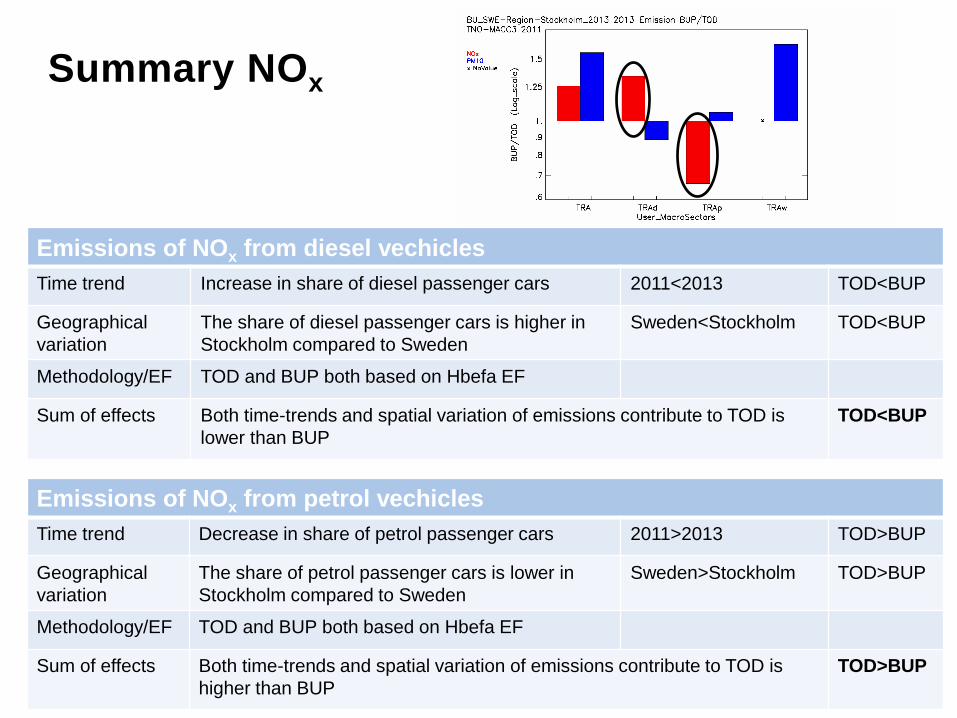
Summary NOx
2016-08-17
Page 14
Emissions of NOx from petrol vechicles
Time trend Decrease in share of petrol passenger cars 2011>2013 TOD>BUP
Geographical
variation
The share of petrol passenger cars is lower in
Stockholm compared to Sweden
Sweden>Stockholm TOD>BUP
Methodology/EF TOD and BUP both based on Hbefa EF
Sum of effects Both time-trends and spatial variation of emissions contribute to TOD is
higher than BUP
TOD>BUP
Emissions of NOx from diesel vechicles
Time trend Increase in share of diesel passenger cars 2011<2013 TOD<BUP
Geographical
variation
The share of diesel passenger cars is higher in
Stockholm compared to Sweden
Sweden<Stockholm TOD<BUP
Methodology/EF TOD and BUP both based on Hbefa EF
Sum of effects Both time-trends and spatial variation of emissions contribute to TOD is
lower than BUP
TOD<BUP
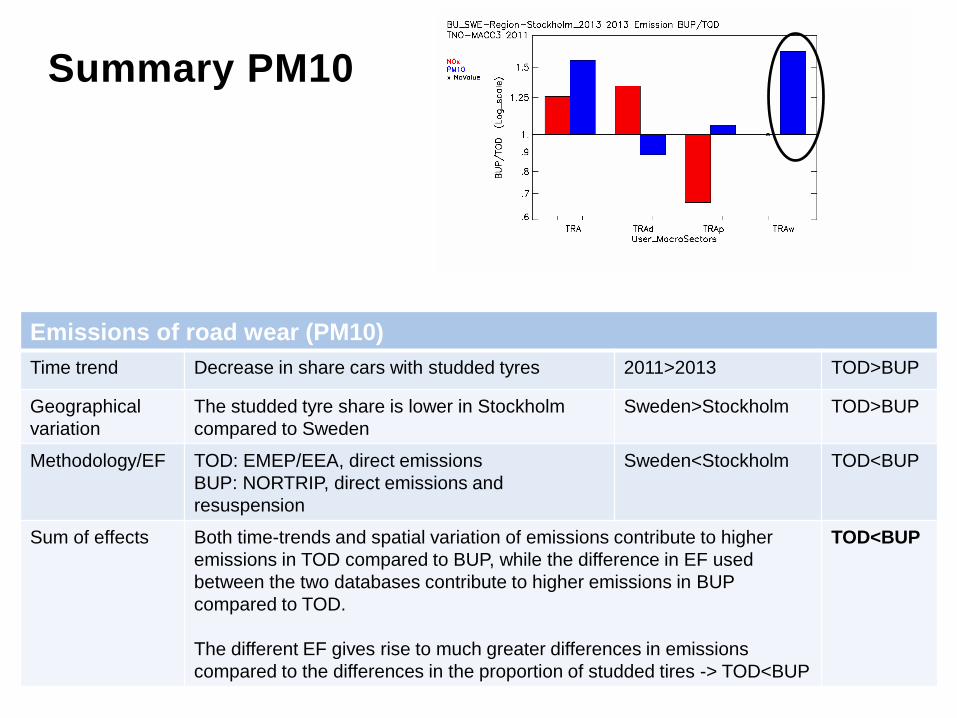
Summary PM10
2016-08-17
Emissions of road wear (PM10)
Time trend Decrease in share cars with studded tyres 2011>2013 TOD>BUP
Geographical
variation
The studded tyre share is lower in Stockholm
compared to Sweden
Sweden>Stockholm TOD>BUP
Methodology/EF TOD: EMEP/EEA, direct emissions
BUP: NORTRIP, direct emissions and
resuspension
Sweden<Stockholm TOD<BUP
Sum of effects Both time-trends and spatial variation of emissions contribute to higher
emissions in TOD compared to BUP, while the difference in EF used
between the two databases contribute to higher emissions in BUP
compared to TOD.
The different EF gives rise to much greater differences in emissions
compared to the differences in the proportion of studded tires -> TOD<BUP
TOD<BUP
• To understand and analyze the differences between emissions of TOD
and BUP it is important to consider:
– time trends and geografical variations of the input parameters for the calculations of
TOD and BUP emissions
– calculation methodology and underlying emission factors for the calculations of TOD
and BUP emissions
• Only after this is it valuable to study and analyze the more advanced
diagrams provided in the Fairmode emission tool
Concluding remarks
2016-08-17
Page 16
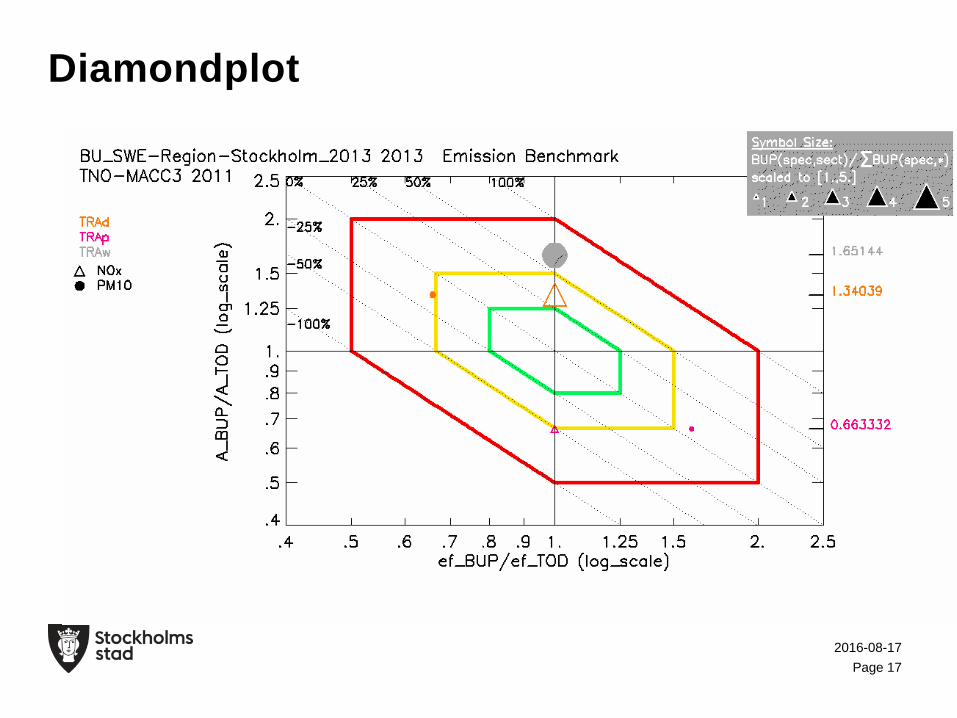
Diamondplot
2016-08-17
Page 17
Top Related