


Languages
Pages
Legal


Trade patterns in the coal market
Ajay Baral, globalCOAL
Copyright © by globalCOAL 2001 - 2015
For today’s discussion…
• Changes in trade flows
• Price trends in the thermal coal market
• The derivatives market
• SCoTA Overview
• The NEWC index – Asia’s price benchmark
• Conclusions

Copyright © by globalCOAL 2001 - 2015
globalCOAL ownership
Global HubCo BV
Individual Shareholders

Copyright © by globalCOAL 2001 - 2015
Coal brokerage
Screen Trading (Standard contracts)
Voice brokering (Any coal,
any location)
SCoTA
Contract updates and revisions
Development of new hubs
Indices and market data
Index calculation
Coal Market Report
Historical Index data
Delayed Price Feed
What does globalCOAL do?
Changes in Trade Flows: The Exporters

Copyright © by globalCOAL 2001 - 2015
The Seaborne Coal Market
6
0
200
400
600
800
1000
1200
1400
Mill
ion
tonn
es
Thermal Coal Coking Coal
Seaborne Coal Volumes 1990-2013 (Mt)
Source: IEA Coal Information (2014)

Copyright © by globalCOAL 2001 - 2015
Major Exporters
7
Australia New destinations
Indonesia From zero to hero
South Africa Looking East
USA Looking to the
Far East
Colombia Europe’s supplier

Copyright © by globalCOAL 2001 - 2015
South Africa turns to the East
Sources: globalCOAL, IHS McCloskey
Forecasted RBCT Thermal Coal Exports by Destination, 2005-2040
0
10
20
30
40
50
60
70
80
90
100
2005 2010 2015 2020 2030 2040
Mill
ion
tonn
es
Atlantic Pacific

Copyright © by globalCOAL 2001 - 2015
South Africa turns to the East
Sources: globalCOAL, IHS McCloskey
RBCT Thermal Coal Exports to Key Asian Destinations, 2006-2014
0
5
10
15
20
25
30
35
40
45
2006 2007 2008 2009 2010 2011 2012 2013 2014*
Mill
ion
tonn
es
Taiwan China India
*2014 annualised from Aug’14

Copyright © by globalCOAL 2001 - 2015
Australia Diversifies
10
Australian Thermal Coal Exports by Major Asian Destination, 2000-2014
0
20
40
60
80
100
120
140
160
180
200
2000 2001 2002 2003 2004 2005 2006 2007 2008 2009 2010 2011 2012 2013 2014*
Mill
ion
tonn
es
China Taiwan South Korea Japan
Sources: globalCOAL, IHS McCloskey
*2014 annualised from Aug’14

Copyright © by globalCOAL 2001 - 2015
Where to for Indonesia?
Sources: globalCOAL, IHS McCloskey
Forecasted Growth of Total Indonesian Coal Exports, 2000-2040
0
100
200
300
400
500
600
700
2000 2005 2010 2015 2020 2025 2030 2035 2040
Mill
ion
tonn
es

Copyright © by globalCOAL 2001 - 2015
Where to for Indonesia?
12 Sources: globalCOAL, IHS McCloskey
Indonesian Coal Exports by Product, 2000-2014
*2014 annualised from Jun’14
0
50
100
150
200
250
300
350
400
450
2000 2001 2002 2003 2004 2005 2006 2007 2008 2009 2010 2011 2012 2013 2014*
Mill
ion
tonn
es
Sub-bituminous, Lignite & Other
Bituminous

Copyright © by globalCOAL 2001 - 2015
Where to for Indonesia?
Sources: globalCOAL, IHS McCloskey
Indonesian Coal Exports by destination, 2000-2014
*2014 annualised from Jun’14
Sub-bituminous, Lignite & Other
Bituminous
0%
10%
20%
30%
40%
50%
60%
70%
80%
90%
100%
2000 2001 2002 2003 2004 2005 2006 2007 2008 2009 2010 2011 2012 2013 2014*
?
South Korea
Taiwan
Japan India & Pakistan
China
Other

Changes in Trade Flows: The Importers
Copyright © by globalCOAL 2001 - 2015
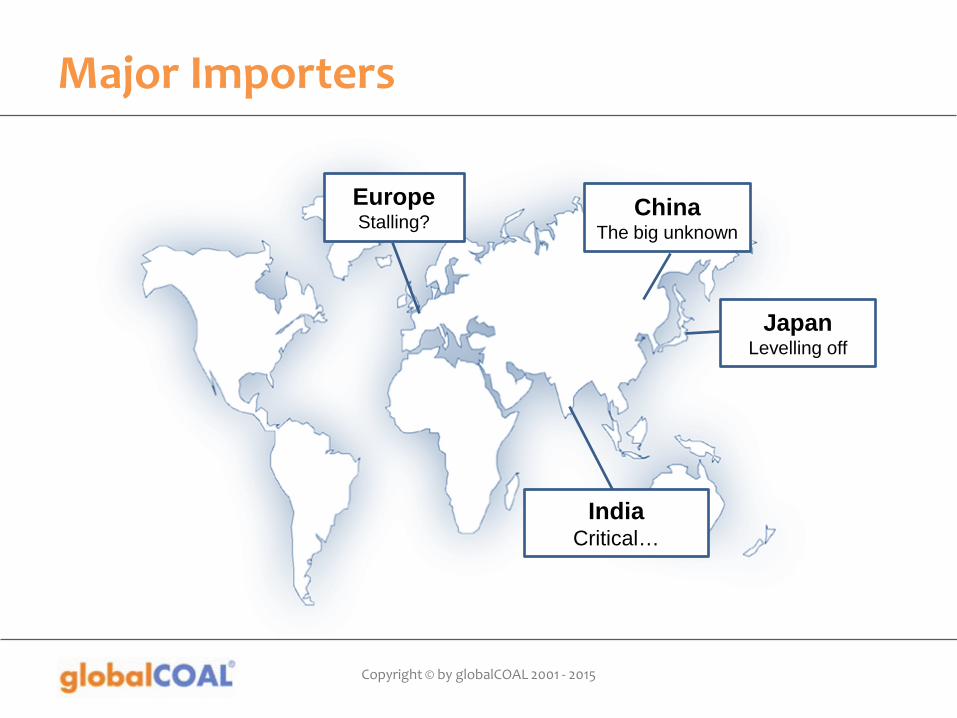
Major Importers
15
Europe Stalling?
China The big unknown
India Critical…
Japan Levelling off
Copyright © by globalCOAL 2001 - 2015
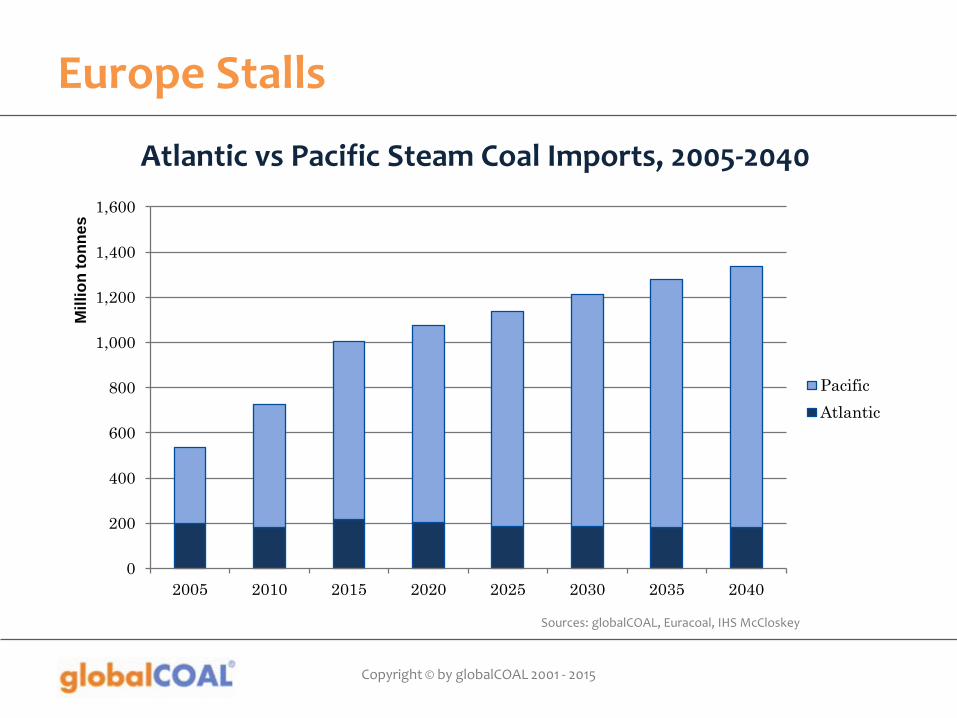
Europe Stalls
16
0
200
400
600
800
1,000
1,200
1,400
1,600
2005 2010 2015 2020 2025 2030 2035 2040
Mill
ion
tonn
es
Pacific Atlantic
Sources: globalCOAL, Euracoal, IHS McCloskey
Atlantic vs Pacific Steam Coal Imports, 2005-2040

Copyright © by globalCOAL 2001 - 2015
China
• The largest producer of coal
• The largest consumer of coal
• Imports are marginal compared to consumption (7.6% in 2013) but have huge impact on international market
• Unlike India, China doesn’t have a coal deficit
• Imports to arbitrage prices between domestic and international coal
17

Copyright © by globalCOAL 2001 - 2015
China’s Coal Imports
18
0
50
100
150
200
250
300
350
Mill
ion
tonn
es
Source: IEA Coal Information (2014)
All Coals, 1990-2013 (Mt)

Copyright © by globalCOAL 2001 - 2015
The Future for Chinese Coal Imports
• Ever changing landscape
• Uncertainty over new regulations affecting imported coal
• Likely that China will impose strict limits on trace elements in imported coal
• Major exemptions (eg. Indonesia)
• Uncertain impact
19
http
s://w
ww
.wis
dom
prod
ucts
.com
/imag
es/p
rodu
cts/
lega
cy/la
rge/
7027
0.jp
g

Copyright © by globalCOAL 2001 - 2015
India
• Large resources, large production but limited growth in extractive capacity
• Indigenous resource also tends to be far from demand centres
• Coal imports are critical to make up shortfall
• Assuming GDP growth rate of 8%, imports will top 350Mt/annum within 20 years
20

Copyright © by globalCOAL 2001 - 2015
India
21 Source: IEA Coal Information (2014)
All Coal Imports, 1990-2013 (Mt)
0
20
40
60
80
100
120
140
160
180
200
Mill
ion
tonn
es

Copyright © by globalCOAL 2001 - 2015
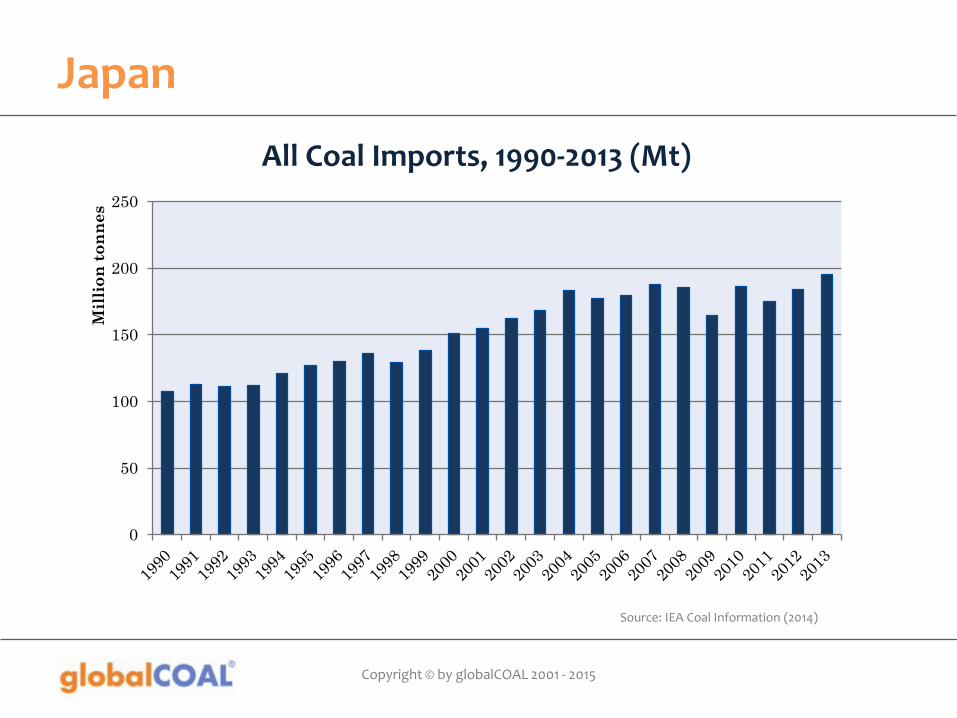
Japan’s Coal Imports
• Historically the largest thermal coal importer
• Surpassed by China in 2010
• Moving away from nuclear power after Fukushima disaster of 2011
• Coal demand expected to level out
22
Copyright © by globalCOAL 2001 - 2015
Japan
23
0
50
100
150
200
250
Mill
ion
tonn
es
Source: IEA Coal Information (2014)
All Coal Imports, 1990-2013 (Mt)

Price Trends in Seaborne Markets

Copyright © by globalCOAL 2001 - 2015
Price Trend – Last Decade
25
0
50
100
150
200
250
01/2
004
06/2
004
11/2
004
04/2
005
09/2
005
02/2
006
07/2
006
12/2
006
05/2
007
10/2
007
03/2
008
08/2
008
01/2
009
06/2
009
11/2
009
04/2
010
09/2
010
02/2
011
07/2
011
12/2
011
05/2
012
10/2
012
03/2
013
08/2
013
01/2
014
06/2
014
11/2
014
USD
/mt
RB DES ARA NEWC
globalCOAL Indices, 2004-2014 (USD/mt)
Source: globalCOAL

Copyright © by globalCOAL 2001 - 2015
Price Trend – Last 3 years
globalCOAL Indices, 2011-2014 (USD/mt)
Source: globalCOAL
0
20
40
60
80
100
120
140
01/2
011
03/2
011
05/2
011
07/2
011
09/2
011
11/2
011
01/2
012
03/2
012
05/2
012
07/2
012
09/2
012
11/2
012
01/2
013
03/2
013
05/2
013
07/2
013
09/2
013
11/2
013
01/2
014
03/2
014
05/2
014
07/2
014
09/2
014
11/2
014
01/2
015
USD
/mt
RB DES ARA NEWC

The Derivatives Market

Copyright © by globalCOAL 2001 - 2015
Building Blocks of a Derivative Market
28
Standard Contract
Screen Trading Market Data
Market Liquidity & Transparency

Copyright © by globalCOAL 2001 - 2015
2014 Derivatives Market Snapshot
API#2 2.5Bt
API#4 500Mt
NEWC 278Mt
API#8 34Mt
S/B Indo 18Mt

Copyright © by globalCOAL 2001 - 2015
Significant growth in recent years
*2014 annualised from Sept’14 Sources: globalCOAL, ICE, CME, SGX, EEX, FSA, LEBA
Growth in Coal Derivatives Volume, 2001-2014
0
500
1,000
1,500
2,000
2,500
3,000
3,500
4,000
2001
2002
2003
2004
2005
2006
2007
2008
2009
2010
2011
2012
2013
2014
Mill
ion
tonn
es
∆+7.8%

Copyright © by globalCOAL 2001 - 2015
Growth in clearing vs OTC
Sources: globalCOAL, ICE, CME, SGX, EEX, FSA, LEBA
Cleared and OTC Derivatives Volumes Growth, 2001-2014
0%
10%
20%
30%
40%
50%
60%
70%
80%
90%
100%
0
500
1000
1500
2000
2500
3000
3500
4000
2001 2002 2003 2004 2005 2006 2007 2008 2009 2010 2011 2012 2013 2014
% Cl
eare
d
Mill
ion
tonn
es
Cleared OTC % Cleared (right axis)
Copyright © by globalCOAL 2001 - 2015
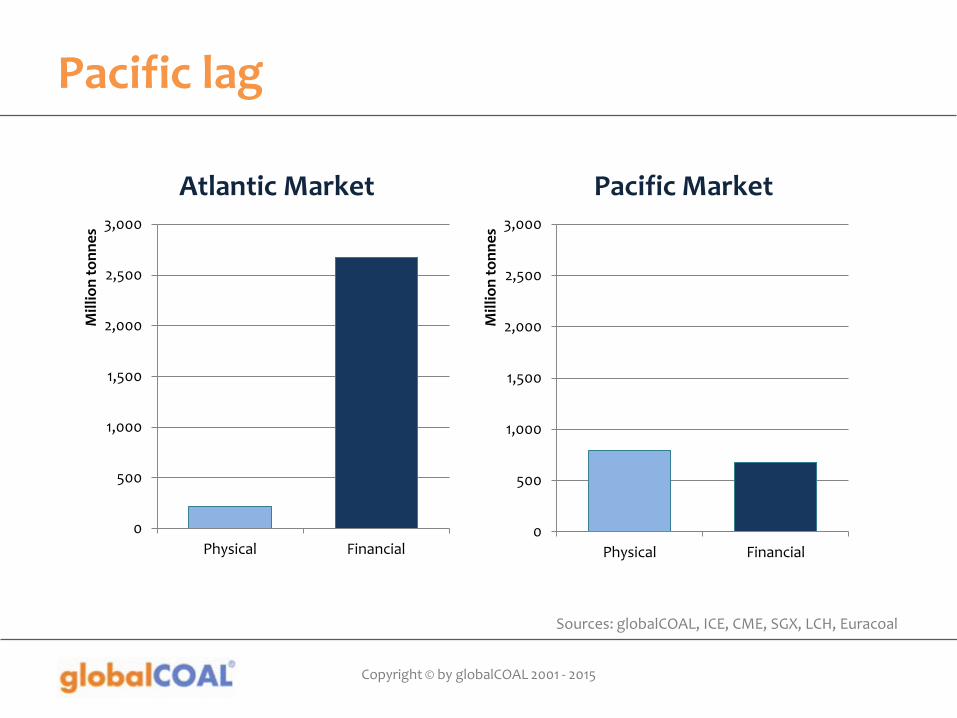
Pacific lag
Sources: globalCOAL, ICE, CME, SGX, LCH, Euracoal
Atlantic Market Pacific Market
0
500
1,000
1,500
2,000
2,500
3,000
Physical Financial
Mill
ion
tonn
es
0
500
1,000
1,500
2,000
2,500
3,000
Physical Financial
Mill
ion
tonn
es

SCoTA Overview

Copyright © by globalCOAL 2001 - 2015
A brief history of SCoTA…
• Following the collapse of ENRON in 2001, the thermal coal market demanded reliable, transparent thermal coal pricing
• globalCOAL was established in 2001 by coal market producers, consumers and traders to establish a standardised coal market:
– Introduced a standardised coal trading agreement: SCoTA
– Online trading platform to facilitate the trade of standardised seaborne thermal coal, with all trades underlied by SCoTA
– Pricing data derived from the platform provided objective, transparent price points to the market for the first time

Copyright © by globalCOAL 2001 - 2015
Benefits of Standardised Screen Trading
Screen Trading
Accessible to all
Quick and easy route to standardised
market Ability to reverse positions quickly
Real-time, transparent & objective spot and forward
prices
Efficiency & speed of execution
(click & trade)
Anonymity until point of execution

Copyright © by globalCOAL 2001 - 2015
What defines a commodity market?
• The product is traded without qualitative differentiation
• Negotiations are focussed on price rather than quality
• The price is international and fluctuates on global supply / demand
• The product is traded in a transparent market
• There is an active spot and risk management market

Copyright © by globalCOAL 2001 - 2015
Is coal a commodity?
• Is it traded without qualitative differentiation?
Yes; SCoTA defines standard quality parameters => pools of liquidity form around most commonly traded hubs
• Are negotiations focussed on price rather than quality?
Yes; Indices for the main hubs NEWC, RB & ARA give clear price markers
• Is the price international and fluctuating on supply/demand?
Yes; market participants trade coal globally
• Is the product traded in a transparent market?
Yes; bids, offers and trades on gC are communicated to the market
• Is there an active spot and risk management market?
Yes; 2.7 Billion tonnes of cleared derivatives traded in 2014 YTD

Copyright © by globalCOAL 2001 - 2015
Who uses SCoTA?
There are 2,300+ companies licensed to use SCoTA worldwide and 161 globalCOAL Market Members
Principals
• Utilities
• Miners
• Physical coal traders
• Financial institutions
OTC Brokers
•globalCOAL •Other brokers: •LCB •GFI •Ginga •ICAP

Copyright © by globalCOAL 2001 - 2015
Geographic spread of SCoTA users
226
273
218
222
186
171
145
108
70
55
26
Top 5 Countries
1. Indonesia 2. Australia 3. USA 4. India 5. UK

Copyright © by globalCOAL 2001 - 2015
Total brokered physical SCoTA volumes
Source: globalCOAL & other brokers
-
20
40
60
80
100
120
140
160
180
2001 2002 2003 2004 2005 2006 2007 2008 2009 2010 2011 2012 2013 2014 *
Mill
ion
Tonn
es
* 2014 – estimate

Copyright © by globalCOAL 2001 - 2015
The SCoTA market in perspective
Production Intl Trade Seaborne Trade Thermal Coal Market
Source: VdKI, Euracoal, globalCOAL & other brokers (2010 data)
7.2Bt Domestically produced & consumed
1.1Bt Int’l Trade
971Mt Seaborne
Trade
99Mt Overland
726Mt Thermal Coal
245Mt Coking Coal
155 Mt Brokered
SCoTA
571 Mt Bilatera
l standard and non-standard
coal
Copyright © by globalCOAL 2001 - 2015
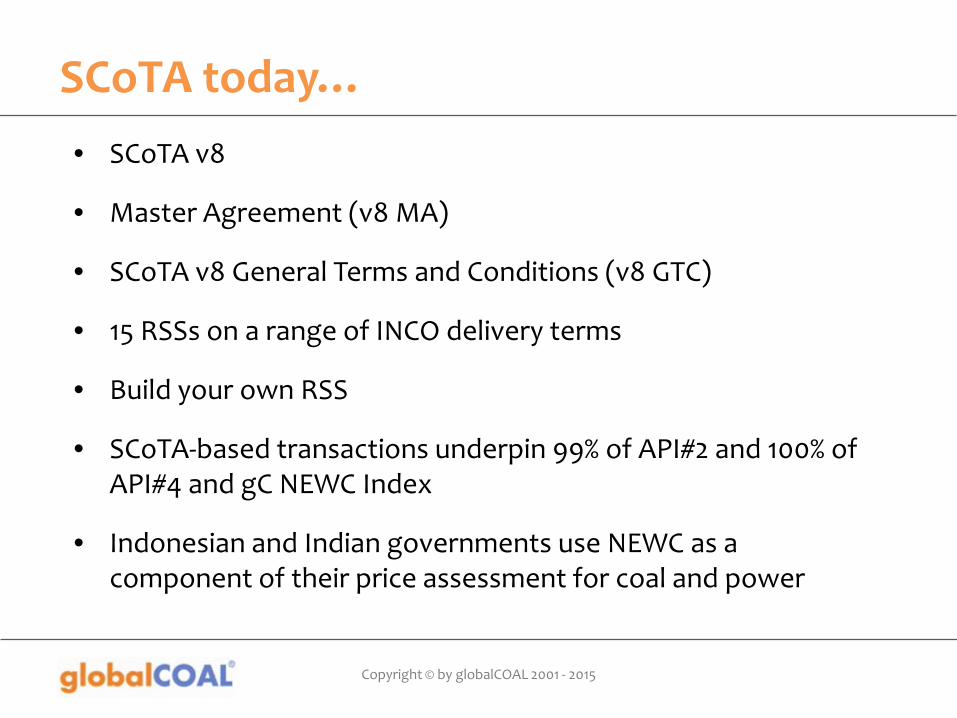
SCoTA today… • SCoTA v8
• Master Agreement (v8 MA)
• SCoTA v8 General Terms and Conditions (v8 GTC)
• 15 RSSs on a range of INCO delivery terms
• Build your own RSS
• SCoTA-based transactions underpin 99% of API#2 and 100% of API#4 and gC NEWC Index
• Indonesian and Indian governments use NEWC as a component of their price assessment for coal and power

Copyright © by globalCOAL 2001 - 2015
DES ARA Multi-origin ACPRSU
Richards Bay FOB
3 qualities
Newcastle (NEWC) FOB
COL FOB
4 load ports
INDO A B C FOB or FAS 3 qualities NCIG
FOB
DAP RTM Multi-origin ACPRSU
Lower min CV
Standard hubs covered by SCoTA
CFR China Multi-origin 2 qualities
CFR Krishnapatnam Multi-origin 2 qualities
High Ash Aus FOB
Lower CV

The gC NEWC Index

Copyright © by globalCOAL 2001 - 2015
• The benchmark price for coal in Asia Pacific
• Used by governmental agencies around Asia:
– 25% component of HBA in Indonesia (25% NEX, 25% FOB Kalimantan, 25% ICI)
– 25% component of CERC in India (25% API4, 50% Indonesian Coal)
– Chinese government is considering the use of international indices (including gC NEWC) in its forward planning for pricing electricity
• Coaltrans Bali survey in 2011:
– 64% of respondents stated the NEWC Index is the most trusted Index by Indonesian producers, end users & traders
– 64% stated that the NEWC Index is the most suitable to establish end-user prices for Indonesian coal (versus 18% for the Argus-ICI)
The globalCOAL NEWC index

Copyright © by globalCOAL 2001 - 2015
0%
10%
20%
30%
40%
50%
60%
70%
80%
90%
100%
0
5
10
15
20
25
2009 2010 2011 2012 2013 2014
Mill
ion
tonn
es
Spot trades Forward trades % Asia-Pac based trader
More spot trading in NEWC
Source: globalCOAL
Spot vs forward NEWC volume on the globalCOAL screen and % of NEWC tonnage traded from APAC
50%

Some conclusions
& your questions?

CONTACT US
London +44 207 776 5900 Singapore +65 6311 4571
New Delhi +91 1204 26 48 90
Top Related