


Languages
Pages
Legal


1979
National Cancer Institute CARCiNOGENESIS Technical Report Series No. 138
BIOASSAY OF SULFISOXAZOLE
FOR POSSIBLE CARCINOGENICITY
CAS No. 127-69-5
NCI-CG-TR-138
U.S. DEPARTMENT OF HEALTH, EDUCATION, AND WELFARE Public Health Service National Institutes of Health

BIOASSAY OF SULFISOXAZOLE
FOR POSSIBLE CARCINOGENICITY
Carcinogenesis Testing Program Division of Cancer Cause and Prevention
National Cancer Institute National Institutes of Health Bethesda, Maryland 20014
U.S. DEPARTMENT OF HEALTH, EDUCATION, AND WELFARE Public Health Service
National Institutes of Health
DREW Publication No. (NIH) 79-1393

ii

BIOASSAY OF SULFISOXAZOLE
FOR POSSIBLE CARCINOGENICITY
Carcinogenesis Testing Program Division of Cancer Cause and Prevention
National Cancer Institute National Institutes of Health
FOREWORD; This report presents the results of the bioasay of sulfisoxazole conducted for the Carcinogenesis Testing Program, Division of Cancer Cause and Prevention, National Cancer Institute (NCI), National Institutes of Health, Bethesda, Maryland. This is one of a series of experiments designed to determine whether selected chemicals have the capacity to produce cancer in animals. Negative results, in which the test animals do not have a greater incidence of cancer than control animals, do not necessarily mean that the test chemical is not a carcinogen, inasmuch as the experiments are conducted under a limited set of circumstances. Positive results demonstrate that the test chemical is carcinogenic for animals under the conditions of the test and indicate that exposure to the chemical is a potential risk to man. The actual determination of the risk to man from chemicals found to be carcinogenic in animals requires a wider analysis.
CONTRIBUTORS; This bioassay of sulfisoxazole was conducted by Hazleton Laboratories America, Inc., Vienna, Virginia, initially under direct contract to NCI and currently under a subcontract to Tracer Jitco, Inc., Rockville, Maryland, prime contractor for the NCI Carcinogenesis Testing Program.
The NCI project officers who were responsible for selecting the protocols used in this bioassay were Drs. N. P. Page (1,2) and C. Cueto (1). The principal investigators were Drs. M. B. Powers (3) and R. W. Voelker (3). Ms. K. J. Petrovics (3) was responsible for data management, and Mr. G. Najarian (3) for animal care. Histopathologic examinations were performed by Drs. B. W. Ulland (3) and D. A. Banas (3) and reviewed by Dr. Voelker, and the diagnoses included in this report represent their interpretation.
Animal pathology tables and survival tables were compiled at EG&G Mason Research Institute (4). Statistical analyses were
ill

performed by Dr. J. R. Joiner (5) and Ms. P. L. Yong (5), using methods selected for the bioassay program by Dr. J. J. Gart (6).
Chemicals used in this bioassay were analyzed at Midwest Research Institute under the direction of Dr. E. Murrill (7), and feed mixtures containing the t4st chemical were analyzed at Hazleton Laboratories by Dr. C. L. Guyton (3) and Mr. E. Missaghi (3). The results of these analyses were reviewed by Dr. C. W. Jameson (5).
This report was prepared at Tracer Jitco (5) in collaboration with Hazleton Laboratories and NCI. Those responsible for the report at Tracor Jitco were Dr. L. A. Campbell, Director of the Bioassay Program; Dr. S. S. Olin, Deputy Director for Science; Dr. J. F. Robens, toxicologist; Dr. R. L. Schueler, pathologist; Dr. G. L. Miller, Mr. W. D. Reichardt, and Ms. L. A. Waitz, bioscience writers; and Dr. E. W. Gunberg, technical editor, assisted by Ms. Y. E. Presley and Ms. P. J. Graboske.
The following scientists at NCI (1) were responsible for evaluating the bioassay experiment, interpreting the results, and reporting the findings: Dr. Kenneth C. Chu, Dr. Cipriano Cueto, Jr., Dr. J. Fielding Douglas, Dr. Richard A. Griesemer, Dr. Thomas E. Harm, Dr. William V. Hartwell, Dr. Morton H. Levitt, Dr. Harry A. Milman, Dr. Thomas W. Orme, Dr. Sherman F. Stinson, Dr. Jerrold M. Ward, and Dr. Carrie E. Whitmire.
(1) Carcinogenesis Testing Program, Division of Cancer Cause and Prevention, National Cancer Institute, National Institutes of Health, Bethesda, Maryland.
(2) Now with Office of Toxic Substances - TS 788, the Environmental Protection Agency, 401 M Street, S.W., Washington, D.C.
(3) Hazleton Laboratories America, Inc., 9200 Leesburg Turnpike, Vienna, Virginia.
(4) EG&G Mason Research Institute, 1530 East Jefferson Street, Rockville, Maryland.
(5) Tracor Jitco, Inc., 1776 East Jefferson Street, Rockville, Maryland.
iv

(6) Mathematical Statistics and Applied Mathematics Section, Biometry Branch, Field Studies and Statistics, Division of Cancer Cause and Prevention, National Cancer Institute, National Institutes of Health, Bethesda, Maryland.
(7) Midwest Research Institute, 425 Volker Boulevard, Kansas City, Missouri.

vi

SUMMARY
A bioassay of sulfisoxazole for possible carcinogenicity was conducted by administering the chemical by gavage to Fischer 344 rats and B6C3F1 mice.
Groups of 50 rats of each sex and 50 mice of each sex were administered sulfisoxazole suspended in aqueous 0.5% carboxymethyl cellulose 7 days per week at one of two doses, either 100 or 400 mg/kg body weight for the rats and either 500 or 2,000 mg/kg for the mice. Vehicle controls consisted of groups of 50 rats of each sex and 50 mice of each sex that were administered only the aqueous 0.5% carboxymethyl cellulose. Untreated controls consisted of groups of 50 rats of each sex and 50 mice of each sex. The dosed groups of the rats and mice were administered the chemical by gavage for 103 weeks, then observed for 1 to 3 additional weeks; the vehicle-control groups were similarly administered 0.5% carboxymethyl cellulose alone. All surviving rats and mice were killed at weeks 104 to 106.
Mean body weights of high-dose male rats and female mice were slightly lower than those of corresponding vehicle controls during the last 40 to 50 weeks of the bioassay; mean body weights of dosed female rats and male mice were unaffected. Survival rates were unaffected by the test chemical, and adequate numbers of animals were at risk for the development of late-appear ing tumors.
No tumors occurred in the dosed groups of rats or mice of either sex at incidences that were significantly higher than those of the vehicle-control groups.
It is concluded that under the conditions of this bioassay, sulfisoxazole was not carcinogenic for either Fischer 344 rats or B6C3F1 mice.
vii

viii

TABLE OF CONTENTS
I. Introduction 1
II. Materials and Methods 5
A. Chemical 5 B. Dosage Preparation 6 C. Animals 7 D. Animal Maintenance 7 E. Subchronic Studies 10 F. Chronic Studies 12 G. Clinical and Pathologic Examinations 12 H. Data Recording and Statistical Analyses 16
III. Results - Rats 23
A. Body Weights and Clinical Signs (Rats) 23 B. Survival (Rats) 23 C. Pathology (Rats) 26 D. Statistical Analyses of Results (Rats) 27
IV. Results - Mice 29
A. Body Weights and Clinical Signs (Mice) 29 B. Survival (Mice) 29 C. Pathology (Mice) 33 D. Statistical Analyses of Results (Mice) 34
V. Discussion 37
VI. Bibliography 41
APPENDIXES
Appendix A Summary of the Incidence of Neoplasms in Rats Administered Sulfisoxazole by Gavage 45
Table Al Summary of the Incidence of Neoplasms in Male Rats Administered Sulfisoxazole by Gavage .... 47
Table A2 Summary of the Incidence of Neoplasms in Female Rats Administered Sulfisoxazole by Gavage .... 52
ix
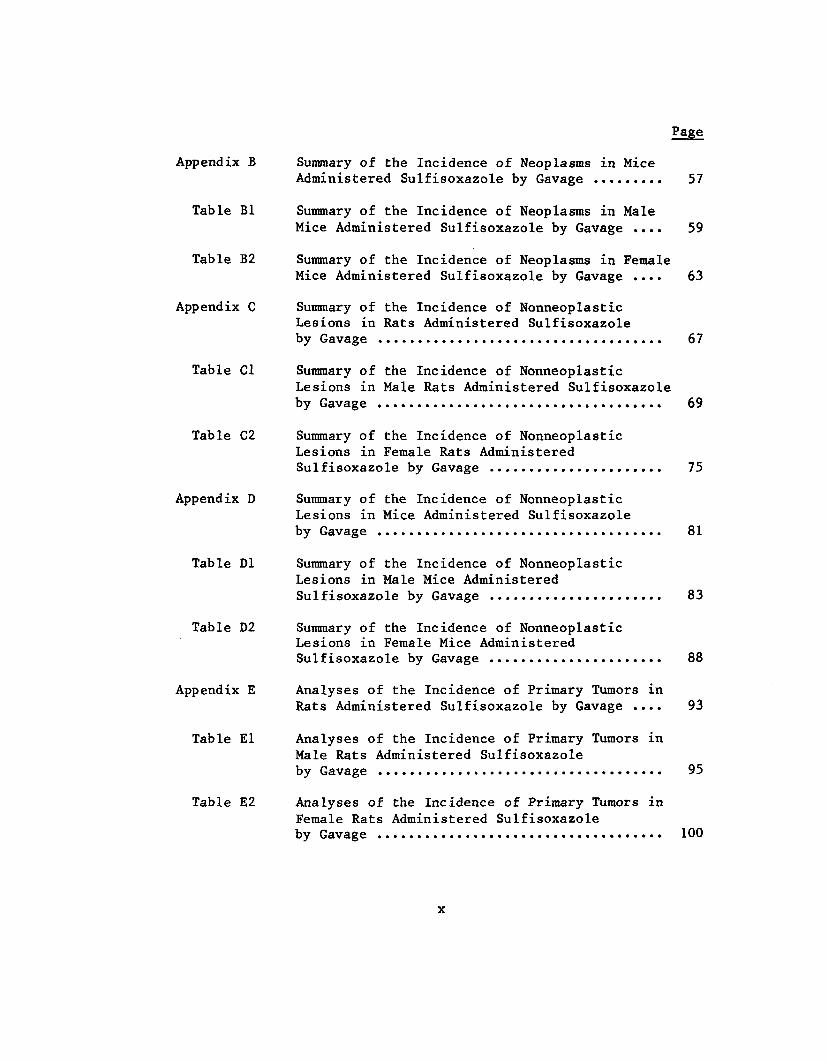
Appendix B Summary of the Incidence of Neoplasms in Mice Administered Sulfisoxazole by Gavage 57
Table Bl Summary of the Incidence of Neoplasms in Male Mice Administered Sulfisoxazole by Gavage .... 59
Table B2 Summary of the Incidence of Neoplasms in Female Mice Administered Sulfisoxazole by Gavage .... 63
Appendix C Summary of the Incidence of Nonneoplastic Lesions in Rats Administered Sulfisoxazole by Gavage 67
Table Cl Summary of the Incidence of Nonneoplastic Lesions in Male Rats Administered Sulfisoxazole by Gavage 69
Table C2 Summary of the Incidence of Nonneoplastic Lesions in Female Rats Administered Sulfisoxazole by Gavage 75
Appendix D Summary of the Incidence of Nonneoplastic Lesions in Mice Administered Sulfisoxazole by Gavage 81
Table Dl Summary of the Incidence of Nonneoplastic Lesions in Male Mice Administered Sulfisoxazole by Gavage 83
Table D2 Summary of the Incidence of Nonneoplastic Lesions in Female Mice Administered Sulfisoxazole by Gavage 88
Appendix E Analyses of the Incidence of Primary Tumors in Rats Administered Sulfisoxazole by Gavage .... 93
Table El Analyses of the Incidence of Primary Tumors in Male Rats Administered Sulfisoxazole by Gavage 95
Table E2 Analyses of the Incidence of Primary Tumors in Female Rats Administered Sulfisoxazole by Gavage 100
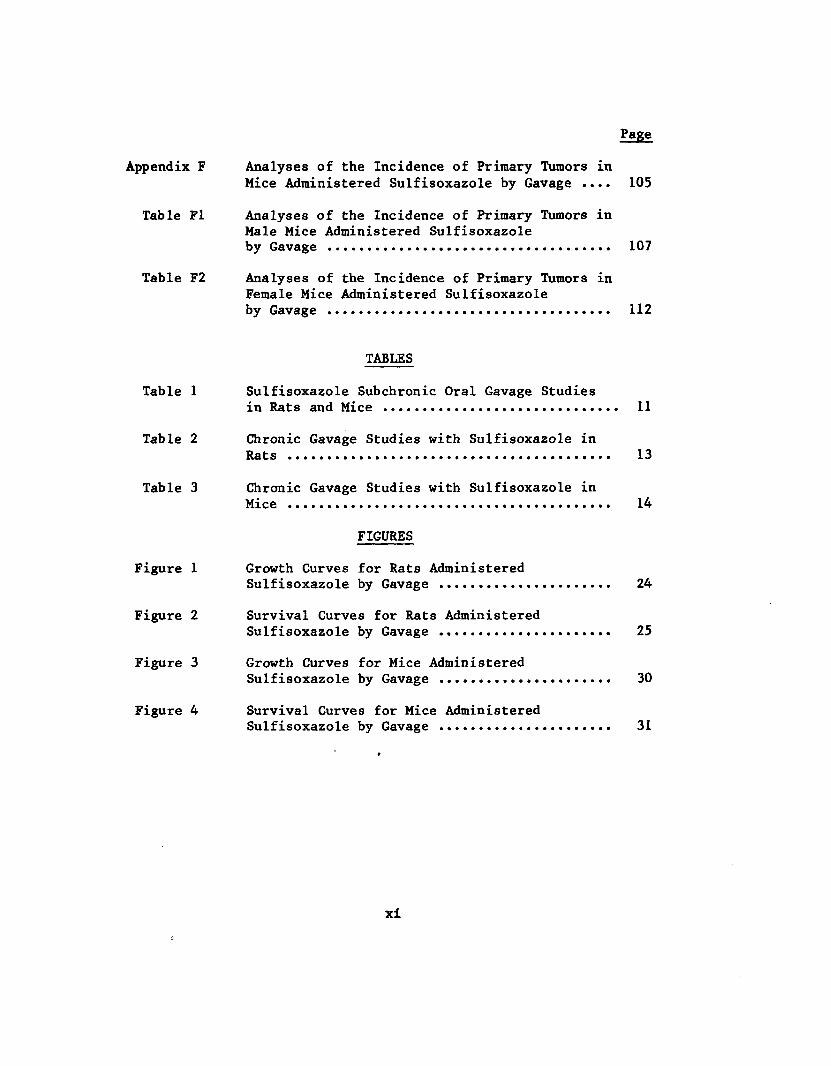
Appendix F Analyses of the Incidence of Primary Tumors in Mice Administered Sulfisoxazole by Gavage .... 105
Table Fl Analyses of the Incidence of Primary Tumors in Male Mice Administered Sulfisoxazole by Gavage 107
Table F2 Analyses of the Incidence of Primary Tumors in Female Mice Administered Sulfisoxazole by Gavage 112
TABLES
Table 1 Sulfisoxazole Subchronic Oral Gavage Studies in Rats and Mice 11
Table 2 Chronic Gavage Studies with Sulfisoxazole in Rats 13
Table 3 Chronic Gavage Studies with Sulfisoxazole in Mice 14
FIGURES
Figure 1 Growth Curves for Rats Administered Sulfisoxazole by Gavage 24
Figure 2 Survival Curves for Rats Administered Sulfisoxazole by Gavage 25
Figure 3 Growth Curves for Mice Administered Sulfisoxazole by Gavage 30
Figure 4 Survival Curves for Mice Administered Sulfisoxazole by Gavage 31
xi

xii

I. INTRODUCTION
N
CH3 CH3
Sulfisoxazole
Sulfisoxazole (CAS 127-69-5; NCI C50022) is an antimicrobial drug
that is a derivative of sulfanilamide; the chemical name is N
(3,4-dimethyl-5-isoxazolyl)sulfanilamide (Koralkovas and Burck
halter, 1976). The sulfanilamide part of the molecule is a
structural analog and an effective antimetabolite of p-aminoben
zoic-acid (PABA), one of the components of folic acid. The in
corporation of sulfanilamides into folic acid precursors inhibits
the synthesis of folic acid in susceptible microorganisms and
hence, by indirectly inhibiting the formylation of S'-phosphori
bosyl-4-carboxamide-5-aminoimidazole, prevents the biosynthesis
of purine (Lehninger, 1975). Susceptible microorganisms are those
that must synthesize their own folic acid; thus, bacteria that do

not require folic acid or that can utilize preformed folic acid
are not affected (Weinstein, 1975). While some toxic effects may
be produced by sulfanilamides in mammals, these are not due to
folic acid deficiency, since mammalian cells do not synthesize
folic acid and depend on the diet as a source of this material.
Sulfisoxazole was patented in 1947 (Stecher, 1968) and was first
used clinically in 1949 (Hay ton et al., 1976). It is a
broad-spectrum antibacterial agent, effective against both
gram-positive and gram-negative organisms (Weinstein, 1975). The
foremost clinical use of this drug is in the treatment of urinary
tract infections such as cystitis, pyelitis, and pyelonephritis
(Stanford Research Institute, 1973). Other uses include the
treatment of trachoma, inclusion conjunctivitis, nocardiosis,
chancroid, certain types of meningococcal meningitis, and otitis
media as well as adjunctive therapy for malaria (American Medical
Association, 1971). The normal adult dose is 1 gram, given
orally every 4 to 6 hours. The parenteral dose is 100 mg/kg/day,
given in divided doses (Weinstein, 1975).
Sulfisoxazole is available in 500 mg tablets; as acetyl
sulfisoxazole in a pediatric suspension; as the diolamine salt
for injection; as the diolamine salt in a 4% solution and 4%
ointment for eye, ear, and nose applications; and as a 10%

vaginal cream. Sulfisoxazole is also marketed in combination
with phenazopyridine, the latter providing pain relief from
urinary tract infections (Physician's Desk Reference, 1977;
Kastrup and Schwach, 1977; Weinstein, 1975).
Although the use of sulfonamide drugs has declined in the past
few years due to the emergence of drug-resistant strains of
bacteria and the development of newer antimicrobial drugs with
fewer side effects (American Medical Association, 1971;
Weinstein, 1975), these compounds are still widely prescribed on
a chronic basis for the treatment of recurrent urinary tract
infections and certain other infectious diseases (American
Medical Association, 1971). For 1977, approximately 990,000 new
prescriptions for Sulfisoxazole tablets, suspensions, or syrups
from a single manufacturer were written (National Disease and
Therapeutic Index, 1977). Sulfisoxazole was selected for study
in the Carcinogenenesis Testing Program because of its extensive
clinical use in humans.


II. MATERIALS AND METHODS
A. Chemical
Sulfisoxazole was obtained as the USP-grade chemical in two
different lots from Hoffmann-LaRoche, Inc., Nutley, New Jersey.
Lot No. 414034 was used for the subchronic study and Lot No.
466094 for the chronic study. USP specifications require 99 to
101% purity on a dry basis with a melting range of 194 to 199°C
(USP, 1975).
The identity and purity of both lots of Sulfisoxazole were
confirmed in analysis at Midwest Research Institute. The melting
range for Lot No. 414034 was 196 to 199°C and for Lot No.
466094, 194 to 199°C, with decomposition. Titration of the
suIfamide acid group with tetrabutyl ammonium hydroxide indicated
a purity of 98.0 + 0.3% for Lot No. 414034 and 99.3 + 0.6% for
Lot No. 466094. High-pressure liquid chromatography showed one
homogeneous peak for both lots. Elemental analyses (C, H, N, S)
for both lots were correct for CjjHigN-O-S, the molecular
formula of Sulfisoxazole. Nuclear magnetic resonance and
infrared spectra were consistent with spectra for Sulfisoxazole
given in the literature (Sadtler Standard Spectra, Sadtler

Research Laboratories, Philadelphia, Pennsylvania; Turczan and
Medwick, 1972).
The bulk chemical was stored at room temperature.
B. Dosage Preparation
Sulfisoxazole was suspended in an aqueous 0.5% carboxymethyl
cellulose (Sigma, St. Louis, Mo.) solution for administration
during these studies. Suspensions were prepared at desired
concentrations once per week and stored at 4 C for up to 1
week. To ensure the uniformity of the suspension, it was stirred
continuously during the dosing time using a magnetic stirring bar.
Due to problems encountered in the analytical method that was
used and to the 1- to 5-month lag period between preparation and
analysis, analyses of the suspensions varied considerably (i.e.,
greater than + 10%) from the concentrations established for use
in the bioassay during the first year of the study. A
modification in the analytical procedures and prompt performance
of the analyses resulted in an improvement in the recoveries
obtained from subsequent samples, which were shown to be within a
+ 10% tolerance limit.

C. Animals
Fischer 344 rats and B6C3F1 mice were obtained through a National
Cancer Institute contract from the Frederick Cancer Research
Center Animal Farm, Frederick, Maryland, through contracts with
the Division of Cancer Treatment, NCI. They were received at the
test lab at 4 weeks of age, and housed within the test
facilities. Animals determined to be free from observable
disease were assigned to the various dosed and control groups
based on initial individual body weights so that a homogeneous
distribution of mean weights and weight ranges was obtained
between groups. Rats were approximately 5 weeks of age and mice
were approximately 7 weeks of age when placed on study.
D. Animal Maintenance
All animals were housed in rooms maintained at a temperature of
20 to 24°C and a relative humidity of 45 to 55%. Incoming air
was filtered through 2-inch-thick disposable fiberglass filters
at a rate that allowed 12 changes of room air per hour.
Fluorescent lighting was provided on a 12-hour-per-day cycle.
The rats and mice were housed in polycarbonate cages covered with

stainless steel cage lids and nonwoven fiber filter bonnets
(Filtek, Appleton, Wis.). The rats were initially housed five
per cage; at week 52, however, the males were divided into groups
of two or three per cage. The mice were housed five per cage
throughout the study.
All cages were furnished with heat-treated hardwood chip bedding
(Sani-Chips®, Shurfire Products Corporation, Beltsville, Md.);
the bedding was changed twice per week. Diets and well water
were provided ad_ libitum. Feed hoppers and water bottles were
refilled twice per week.
Cages and water bottles were sanitized at 81 C twice per week,
feed hoppers once per week, and cage racks once per month. An
industrial dishwasher was used for the water bottles; a cage and
rack washer was used for the feed hoppers, cages, and racks. The
detergent used was Super Soilax®. When racks were washed,
clean racks containing cages of animals were randomly
repositioned in the rooms.
The rats and mice were housed in separate rooms. Control animals
were housed in the same room as the respective dosed animals.
Rats administered sulfisoxazole by gavage were maintained in the
same room as rats being administered the following chemicals:
Feed Studies
(CAS 119-53-9) benzoin (CAS 120-61-6) dimethyl terephthalate (CAS 89-78-1) dl-menthol (CAS 13463-67-7) titanium dioxide
Gavage Studies
(CAS 108-60-1) bischloroisopropyl ether (CAS 7488-56-4) selenium disulfide
Drinking Water Studies
(CAS 108-95-2) phenol
At week 48, the rats fed titanium dioxide, dl-menthol, or benzoin
were moved to a separate room for the remainder of the bioassay.
Mice administered sulfisoxazole by gavage were maintained in the
same room as mice being administered the following chemicals:
Feed Studies
(CAS 119-53-9) benzoin (CAS 120-61-6) dimethyl terephthalate (CAS 89-78-1) dl-menthol (CAS 13463-67-7) titanium dioxide
Gavage Studies
(CAS 108-60-1) bischloroisopropyl ether (CAS 7488-56-4) selenium disulfide
Drinking Water Studies
(CAS 108-95-2) phenol

E. Subchronic Studies
Subchronic oral gavage studies were conducted to estimate the
maximum tolerated doses (MTD's) of sulfisoxazole, on the basis of
which two concentrations (hereinafter referred to as "low" and
"high" doses) were selected for administration in the chronic
studies. Groups of ten males and ten females of each species
were administered sulfisoxazole by gastric intubation 7 days per
week. Ten animals of each sex and species received only the 0.5%
aqueous carboxymethyl cellulose solution. Animals were observed
daily for deaths and weighed once per week. Table 1 shows the
number of animals in each dosed group that survived during the
course of administration and the week on study when the last
death occurred. The table also shows the mean body weights of
the dosed animals at week 13, expressed as percentages of mean
body weights of controls.
After 13 weeks of administration of the test chemical, the
animals were observed for 1 additional week and then killed and
necropsied. The footnotes to table 1 indicate the number of
animals having clinical signs and the degree of the finding.
Based on these data, the doses selected for the chronic studies
10

Table 1. Sulfisoxazole Subchronic Oral Gavage Studies in Rats and Mice
Male Female Week on Week on Study Mean Weight Study Mean Weight
Dose when Last at week 13 when Last at Week 13 (mg/kg/ Surviv- Animal as % of Surviv- Animal as % of day) al(a) Died Control al(a) Died Control
RATS
100 5/5 103 5/5 100
215 5/5 102 5/5 100
464 5/5 97 5/5 99
l,000(b) 5/5 94 5/5 102
2,160(c) 1/5 13 91 5/5 98
MICE(d)
100 5/5 104 5/5 104
215 5/5 104 5/5 104
464 5/5 108 5/5 100
1,000 5/5 104 5/5 100
2,160 3/5 3 104 5/5 104
(a) Numbers surviving/number in group.
(b) Two males had slight interstitial nephritis.
(c) Two males had severe interstitial nephritis; eight males and four females had tubular nephrosis.
(d) No dose-related histopathologic findings were reported for the mice.
11
were 100 and 400 rag/kg for the rats and 500 and 2,000 mg/kg for
the mice.
F. Chronic Studies
The test groups, doses administered, and durations of the chronic
feeding studies are shown in tables 2 and 3.
G. Clinical and Pathologic Examinations
All animals were observed twice per day for deaths. Clinical
signs and the presence of palpable masses were recorded every
week. Mean body weights were recorded every 2 weeks for the
first 12 weeks and monthly thereafter.
Animals that were moribund and those that survived to the
termination of the study were killed by exsanguination under
sodium pentobarbital anesthesia (Diabutal®, Diamond
Laboratories, Inc., Des Moines, Iowa). The Diabutal ,
containing 60 mg/ml sodium pentobarbital, was injected
intraperitoneally at a volume of 0.3 to 0.5 ml for the rats and
0.03 to 0.05 ml for the mice.
12

Table 2. Chronic Gavage Studies with Sulfisoxazole in Rats
Sex and Initial Sulf isoxazole Time on Study Test No. of Dose (b) Dosed Observed Group Animals(a) (mg/kg) (weeks) (weeks)
Male
Untreated-Contro 1 50 0 106-107
Vehicle-Control (c) 50 0 103 3
Low-Dose 50 100 103 3
High-Dose 50 400 103 2
Female
Untreated-Contro 1 50 0 106-107
Vehicle-Control(c) 50 0 103 3
Low-Dose 50 100 103 3
High-Dose 50 400 103 3
(a) Rats were approximately 5 weeks of age when placed on study.
(b) Dosed rats were administered a suspension of sulfisoxazole in 0.5% aqueous carboxymethyl cellulose by gavage 7 days per week. A volume of 1 ml/kg body weight was administered, based on the group mean weight and adjusted at weighing periods.
(c) Vehicle controls received a volume of the 0.5% carboxymethyl cellulose solution equal to the highest volumetric dose of test solution given.
13

Table 3. Chronic Gavage Studies with Sulfisoxazole in Mice
Sex and Test Group
Initial No. of Animals(a)
Sulf isoxazole Dose (b) (mg/kg)
Time Dosed (weeks)
on Study Observed (weeks)
Male
Untreated-Contro1 50 0 104
Vehicle-Control(c) 50 0 103 1
Low-Dose 50 500 103 1
High-Dose 50 2,000 103 1-2
Female
Untreated-Contro 1 50 0 104
Vehic le-Control(c)50 0 103 1
Low-Dose 50 500 103 2
High-Dose 50 2,000 103 2
(a) Mice were approximately 7 weeks of age when placed on study.
(b) Dosed mice were administered a suspension of sulfisoxazole in 0.5% aqueous carboxymethyl cellulose by gavage 7 days per week. A volume of 10 ml/kg body weight was administered, based on the group mean weight and adjusted at weighing periods.
(c) Vehicle controls received a volume of the 0.5% carboxymethyl cellulose solution equal to the highest volumetric dose of test solution given. Vehicle-control groups were started approximately 1 week before other groups.
14

The pathologic evaluation consisted of gross and microscopic
examination of major tissues, major organs, and all gross lesions
from killed animals and from animals found dead. The different
tissues were preserved in 10% buffered formalin, embedded in
paraffin, sectioned, and stained with hematoxylin and eosin. The
following tissues were examined microscopically: skin, lungs and
bronchi, trachea, bone and bone marrow, spleen, lymph nodes,
heart, salivary gland, liver, gallbladder (mice), pancreas,
stomach, small intestine, large intestine, kidney, urinary
bladder, pituitary, adrenal, thyroid, parathyroid, mammary gland,
prostate or uterus, testis or ovary, and brain. Occasionally,
additional tissues were also examined microscopically. Special
staining techniques were utilized when indicated for more
definitive diagnosis.
A few tissues from some animals were not examined, particularly
from those animals that may have died early, been missing, or
been in advanced states of cannibalization or autolysis. Thus,
the number of animals from which particular organs or tissues
were examined microscopically varies and does not necessarily
represent the number of animals that were placed on study in each
group.
15

H. Data Recording and Statistical Analyses
Pertinent data on this experiment have been recorded in an auto
matic data processing system, the Carcinogenesis Bioassay Data
System (Linhart et al., 1974). The data elements include
descriptive information on the chemicals, animals, experimental
design, clinical observations, survival, body weight, and
individual pathologic results, as recommended by the
International Union Against Cancer (Berenblum, 1969). Data
tables were generated for verification of data transcription and
for statistical review.
These data were analyzed using the appropriate statistical
techniques described in this section. Those analyses of the
experimental results that bear on the possibility of
carcinogenicity are discussed in the statistical narrative
sections.
Probabilities of survival were estimated by the product-limit
procedure of Kaplan and Meier (1958) and are presented in this
report in the form of graphs. Animals were statistically
censored as of the time that they died of other than natural
causes or were found to be missing; animals dying from natural
causes were not statistically censored. Statistical analyses for
16

a possible dose-related effect on survival used the method of Cox
(1972) for testing two groups for equality and Tarone's (1975)
extensions of Cox's methods for testing for a dose-related
trend. One-tailed P values have been reported for all tests
except the departure from linearity test, which is only reported
when its two-tailed P value is less than 0.05.
The incidence of neoplastic or nonneoplastic lesions has been
given as the ratio of the number of animals bearing such lesions
at a specific anatomic site (numerator) to the number of animals
in which that site is examined (denominator). In most instances,
the denominators included only those animals for which that site
was examined histologically. However, when macroscopic examina
tion was required to detect lesions prior to histologic sampling
(e.g., skin or mammary tumors), or when lesions could have
appeared at multiple sites (e.g., lymphomas), the denominators
consist of the numbers of animals necropsied.
The purpose of the statistical analyses of tumor incidence is to
determine whether animals receiving the test chemical developed a
significantly higher proportion of tumors than did the control
animals. As a part of these analyses, the one-tailed Fisher
exact test (Cox, 1970) was used to compare the tumor incidence of
a control group with that of a group of dosed animals at each
17

dose level. When results for a number of dosed groups (k) are
compared simultaneously with those for a control group, a
correction to ensure an overall significance level of 0.05 may be
made. The Bonferroni inequality (Miller, 1966) requires that the
P value for any comparison be less than or equal to 0.05/k. In
cases where this correction was used, it is discussed in the
narrative section. It is not, however, presented in the tables,
where the Fisher exact P values are shown.
The Cochran-Armitage test for linear trend in proportions, with
continuity correction (Armitage, 1971), was also used. Under the
assumption of a linear trend, this test determines if the slope
of the dose-response curve is different from zero at the
one-tailed 0.05 level of significance. Unless otherwise noted,
the direction of the significant trend is a positive dose
relationship. This method also provides a two-tailed test of
departure from linear trend.
A time-adjusted analysis was applied when numerous early deaths
resulted from causes that were not associated with the formation
of tumors. In this analysis, deaths that occurred before the
first tumor was observed were excluded by basing the statistical
tests on animals that survived at least 52 weeks, unless a tumor
was found at the anatomic site of interest before week 52. When
18
such an early tumor was found, comparisons were based exclusively
on animals that survived at least as long as the animal in which
the first tumor was found. Once this reduced set of data was
obtained, the standard procedures for analyses of the incidence
of tumors (Fisher exact tests, Cochran-Armitage tests, etc.) were
followed.
When appropriate, life-table methods were used to analyze the
incidence of tumors. Curves of the proportions surviving without
an observed tumor were computed as in Saffiotti et al. (1972).
The week during which an animal died naturally or was sacrificed
was entered as the time point of tumor observation. Cox's
methods of comparing these curves were used for two groups;
Tarone's extension to testing for linear trend was used for three
groups. The statistical tests for the incidence of tumors which
used life-table methods were one-tailed and, unless otherwise
noted, in the direction of a positive dose relationship.
Significant departures from linearity (P less than 0.05, two-
tailed test) were also noted.
The approximate 95 percent confidence interval for the relative
risk of each dosed group compared to its control was calculated
from the exact interval on the odds ratio (Gart, 1971). The
relative risk is defined as Pt/p where p is the true
19

binomial probability of the incidence of a specific type of tumor
in a dosed group of animals and p is the true probability of
the spontaneous incidence of the same type of tumor in a control
group. The hypothesis of equality between the true proportion of
a specific tumor in a dosed group and the proportion in a control
group corresponds to a relative risk of unity. Values in excess
of unity represent the condition of a larger proportion in the
dosed group than in the control.
The lower and upper limits of the confidence interval of the
relative risk have been included in the tables of statistical
analyses. The interpretation of the limits is that in
approximately 95% of a large number of identical experiments, the
true ratio of the risk in a dosed group of animals to that in a
control group would be within the interval calculated from the
experiment. When the lower limit of the confidence interval is
greater than one, it can be inferred that a statistically
significant result (P less than 0.025 one-tailed test when the
control incidence is not zero, P less than 0.050 when the control
incidence is zero) has occurred. When the lower limit is less
than unity, but the upper limit is greater than unity, the lower
limit indicates the absence of a significant result while the
upper limit indicates that there is a theoretical possibility of
20

the Induction of tumors by the test chemical, which could not be
detected under the conditions of this test.
21

22
III. RESULTS - RATS
A. Body Weights and Clinical Signs (Rats)
Mean body weights of the dosed male rats were slightly lower than
those of corresponding vehicle controls during the last 40 weeks
of the bioassay (figure 1); mean body weights of the females were
unaffected. Other clinical signs occurred at comparable frequen
cies in dosed and control groups and included hunched or thin
appearance, body sores, alopecia, urine stains, respiratory
involvements, and various lesions of the eyes. The eye lesions
were noted in all groups at increasing frequency from week 10 to
termination of the study.
B. Survival (Rats)
The Kaplan and Meier curves estimating the probabilities of
survival for male and female rats administered sulfisoxazole by
gavage at the doses of this bioassay, together with those of the
vehicle controls, are shown in figure 2. Two control groups, a
vehicle-control and an untreated-control, were used in this
study. However, in the statistical analysis, only the
23

8 s o fi S fi A §
D O
(9 a ui 3 o o m z UI 5
MALE RATS A
D VEHICLE CONTROL 100H
O LOW DOSE
A HIGH DOSE
40 80 60 70
TIME ON STUDY (WEEKS)
I 300
<
2
FEMALE RATS
D VEHICLE CONTROL
O LOW DOSE
A HIGH DOSE
70
TIME ON STUDY (WEEKS)
Figure 1. Growth Curves for Rats Administered Sulfisoxazole by Gavage
24

PR
OB
AB
ILIT
Y O
F S
UR
VIV
AL
P
RO
BA
BIL
ITY
OF
SU
RV
IVA
L
p
p
a
p
o
o
o
p
p
o
§
g S
g
S
>
O D
>
o <
5 I I
i 1
P ?
m
n>
8
S
5 s'
g 15 S
<»
o
S
H
QJ
m
|S
»
s i 6
v>
£
2
a.
o— •

vehicle-control group is used, because the test conditions of the
vehicle-control group more closely resemble those of the dosed
groups. The result of the Tarone test for dose-related trend in
mortality is not significant in either sex.
In male rats, 36/50 (72%) of the high-dose group, 32/50 (64%) of
the low-dose group, and 38/50 (76%) of the vehicle-control group
lived to the end of the bioassay. In females, 40/50 (80%) of the
high-dose group, 43/50 (86%) of the low-dose group, and 35/50
(70%) of the vehicle-control group lived to the end of the
bioassay.
Sufficient numbers of rats of each sex were at risk for the
development of late-appearing tumors.
C. Pathology (Rats)
Histopathologic findings on neoplasms in rats are summarized in
Appendix A, tables Al and A2; findings on nonneoplastic lesions
are summarized in Appendix C, tables Cl and C2.
A variety of neoplastic and nonneoplastic lesions were observed
in this study. These were of a type, incidence, and distribution
26
commonly observed in aged Fischer 344 rats and are therefore
considered spontaneous and not related to compound administration.
Based on the pathologic examination, sulfisoxazole was neither
carcinogenic nor toxic to Fischer 344 rats under the conditions
of this bioassay.
D. Statistical Analyses of Results (Rats)
Tables El and E2 in Appendix E contain the statistical analyses
of the incidences of those primary tumors that occurred in at
least two animals of one group and at an incidence of at least 5%
in one or more than one group. Two control groups, a
vehicle-control and an untreated-control, were used in this
study. However, in the statistical analysis, only the
vehicle-control group is used, because the test conditions of the
vehicle-control group more closely resemble those of the dosed
groups.
In male rats, the result of the Cochran-Armitage test for
dose-related trend in the incidences of tumors and those of the
Fisher exact test comparing the incidence of tumors in the
27

vehicle-control group with that in each dosed group are not
significant.
In female rats, the results of the Cochran-Armitage test for the
incidence of raonocytic leukemia and the combined incidence of
malignant lymphocytic lymphoma and monocytic leukemia of the
hematopoietic system are significant (P = 0.016 and P = 0.033,
respectively), but those of the Fisher exact test are not. There
is no other incidence of tumors in female rats with significant
statistical test results.
In each of the 95% confidence intervals for relative risk, shown
in the tables, the value of one is included; this indicates the
absence of significant positive results. It should also be noted
that each of the intervals has an upper limit greater than one,
indicating the theoretical possibility of the induction of tumors
by sulfisoxazole, which could not be detected under the
conditions of this test.
28

IV. RESULTS - MICE
A. Body Weights and Clinical Signs (Mice)
Mean body weights of the high-dose female mice were slightly
lower than those of corresponding vehicle controls during the
last 50 weeks of the bioassay (figure 3); mean body weights of
the males were unaffected. Other clinical signs occurred at
comparable rates for dosed and control groups and included
hunched or thin appearance, body sores, alopecia, genital
irritation and swelling, and distended abdomen.
B. Survival (Mice)
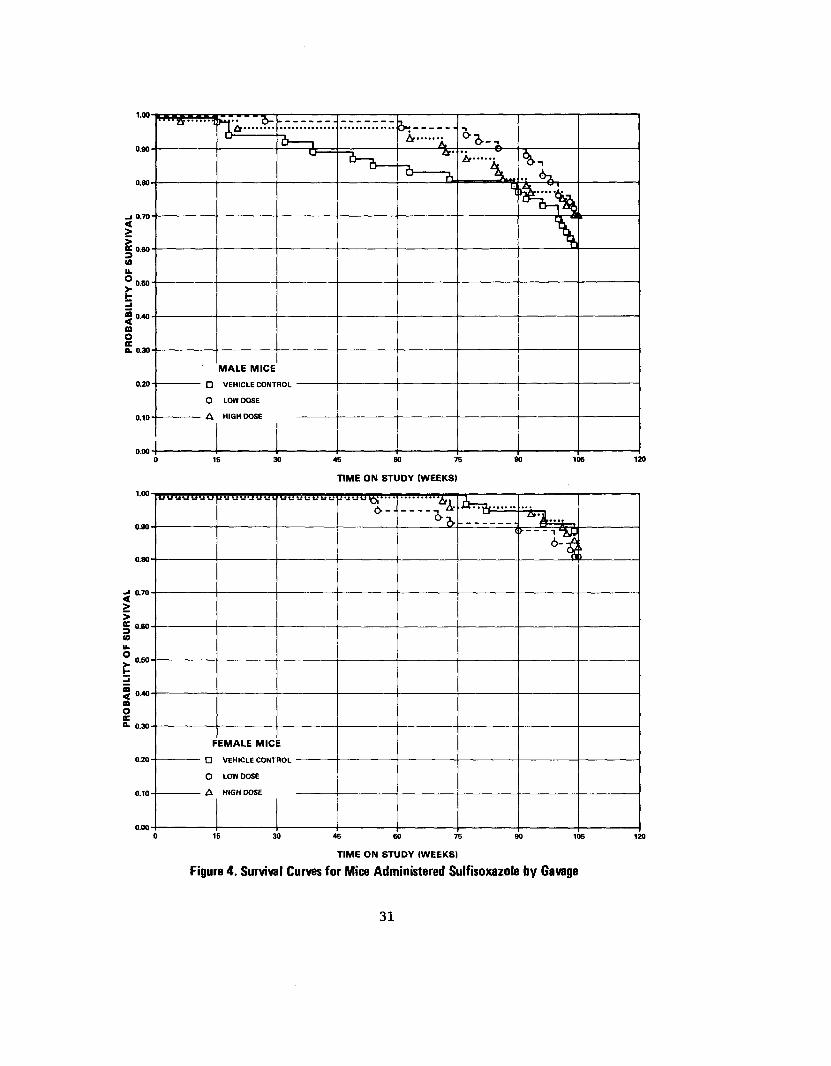
The Kaplan and Meier curves estimating the probabilities of
survival for male and female mice administered sulfisoxazole by
gavage at the doses of this bioassay, together with those of the
vehicle controls, are shown in figure 4. Two control groups, a
vehicle-control and an untreated-control, were used in this
study. However, in the statistical analysis, only the
vehicle-control group is used, because the test conditions of the
vehicle-control group more closely resemble those of the dosed
29

o o g O
a A a
D n n 8
A ° CD°
A
X 30(9 u! S no Q O <a Z
111 5
MALE MICE
D VEHICLE CONTROL
O LOW DOSE
A HIGH DOSE
40 60 60 70 100
TIME ON STUDY (WEEKS)
n a B Orfi O Qu
QO u
a a
a o a
iu S
"\r &
,A
g o 8
FEMALE MICE
Q VEHICLE CONTROL
O LOW DOSE
A HIGH DOSE
10 20 30 40 50 70 80 90 100 110
TIME ON STUDY (WEEKS)
Figure 3. Growth Curves for Mice Administered Sulfisoxazole by Gavage
30
1.00
0.90
45 60 75
TIME ON STUDY (WEEKS)
::::>A^_ 6--
< k >
0) u. o
AB
ILIT
Y
IB O C
FEMALE MIC E
0.20 D VEHICLE CONTROL
O LOW DOSE
0.10 A HIGH DOSE
000
TIME ON STUDY (WEEKS)
Figure 4. Survival Curves for Mice Administered Sulfisoxazole by Gavage
31

groups. In each sex of mice, the vehicle-control group was
started on study 1 week earlier than the dosed groups; however,
the Tar one test for dose-related trend in mortality is applied as
if the three groups were started on study at the same time. The
Cox test is also used to compare the survival of the
vehicle-control group with that of each dosed group. The result
of the Tarone test is not significant in either sex. The results
of the Cox test comparing the survival of the vehicle-control
group with that of each dosed group are also not significant in
either sex.
In male mice, 34/50 (68%) of the high-dose group, 36/50 (72%) of
the low-dose group, and 30/50 (60%) of the vehicle-control group
lived to the end of the bioassay. In females, 42/50 (84%) of the
high-dose group, 40/50 (80%) of the low-dose group, and 43/50
(86%) of the vehicle-control group lived to the end of the
bioassay.
Sufficient numbers of mice of each sex were at risk for the
development of late-appearing tumors.
32

C. Pathology (Mice)
Histopathologic findings on neoplasms in mice are summarized in
Appendix B, tables Bl and B2; findings on nonneoplastic lesions
are summarized in Appendix D, tables Dl and D2.
There was a high incidence of primary liver tumors in dosed male
mice. It was also high in both untreated- and vehicle-control
males. This finding is considered to be unrelated to compound
administration.
A moderate number of hematopoietic neoplasms and a low incidence
of other neoplasms were observed in both control and dosed groups
of mice. These neoplasms were of the usual number and type
observed in B6C3F1 mice of this age.
Other degenerative, proliferative, and inflammatory lesions
observed were also of the usual number and kind observed in aged
B6C3F1 mice, and their incidences in control and dosed groups of
mice were comparable.
Based on the pathologic examination, sulfisoxazole at the dosage
used was neither carcinogenic nor toxic to B6C3F1 mice under the
conditions of this bioassay.
33

D. Statistical Analyses of Results (Mice)
Tables Fl and F2 in Appendix F contain the statistical analyses
of the incidences of those primary tumors that occurred in at
least two animals in one group and at an incidence of at least 5%
in one or more than one group. Two control groups, a
vehicle-control and an untreated-control, were used in this
study. However, in the statistical analysis, only the
vehicle-control group is used, because the test conditions of the
vehicle-control group more closely resemble those of the dosed
groups. In each sex of mice, the vehicle-control group was
started on study 1 week earlier than the dosed groups; however,
the Cochran-Armitage test for dose-related trend in the incidence
of tumors is applied as if the three groups were started on study
at the same time.
In male mice, the result of the Cochran-Armitage test for
positive dose-related trend in the incidence of tumors and the
results of the Fisher exact test are not significant. In female
mice, the Fisher exact test comparing the incidence of
hepatocellular carcinomas in the low-dose and vehicle-control
groups indicates a P value of 0.030, which is above the 0.025
level for significance when the Bonferroni inequality criterion
is used for multiple comparison. The incidence of this tumor in
34

the high-dose females is not significant, nor is the result of
the Cochran-Armitage test for the females. The result of the
Cochran-Armitage test on the incidence of female mice with either
alveolar/bronchiolar adenoma or carcinoma is significant (P =
0.006). The Fisher exact comparison of incidences in the
high-dose and control groups indicates a P value of 0.030, which
is above the 0.025 level required for significance when the
Bonferroni inequality criterion is used for multiple comparison.
Significant results in the negative direction are observed in the
incidence of lung tumors in male mice and in the incidence of
adenocarcinomas of the nummary gland in female mice.
In most of the 95% confidence intervals for relative risk, shown
in the tables, the value of one or less than one is included;
this indicates the absence of significant positive results. It
should also be noted that each of the intervals (except that for
the incidence of adenocarc inomas of the mammary gland in
high-dose female mice) has an upper limit greater than one,
indicating the theoretical possibility of the induction of tumors
by sulfisoxazole, which could not be detected under the
conditions of this test.
35

36
V. DISCUSSION
Mean body weights of the high-dose male rats and female mice were
slightly lower than those of the corresponding vehicle controls
during the last 40 to 60 weeks of the bioassay; mean body weights
of the dosed female rats and male mice were unaffected. No other
clinical signs were observed that could be related to
administration of the test compound. Survival rates of both rats
and mice were unaffected by the test chemical. All dosed groups
of rats and mice could probably have tolerated higher doses.
Adequate numbers of rats and mice in dosed and control groups
were at risk for the development of late-appearing tumors.
In the male rats and male mice, no tumors occurred in the dosed
groups at incidences that were significantly higher than those of
the vehicle-control groups.
In the female rats, monocytic leukemia occurred at incidences
that were dose related (P = 0.016), as did combined monocytic
leukemia and lymphocytic lymphoma (P = 0.033); however, in direct
comparisons, the incidence of these tumors in the individual
dosed groups were not significantly higher than those for the
vehicle-control groups, and, in addition, there were four animals
37

with monocytic leukemia among the untreated controls. Thus, the
occurrence of these tumors in the dosed groups of female rats
cannot be clearly related to administration of the test chemical.
In the female mice, alveolar/bronchiolar adenomas or carcinomas
occurred at incidences that were dose related (P = 0.006), and,
in a direct comparison, the incidence of the tumors in the
high-dose group was higher (P = 0.030) than that for the
vehicle-control group. Similarly, hepatocellular carcinomas
occurred in the low-dose group at an incidence that was higher
(P = 0.030) than that for the vehicle-control group. However,
these P values for direct comparisons of dosed groups with
control groups are above the level of P *= 0.025 required for
significance when the Bonferroni inequality criterion is used for
multiple comparison. Thus, the occurrence of alveo
lar/bronchiolar adenomas or carcinomas in the high-dose group and
of hepatocellular carcinomas in the low-dose group cannot be
clearly related to administration of the test material.
The oral U&CQ of sulfisoxazole has been reported as 10,000
rag/kg for white rats and albino mice (Schnitzer et al., 1946).
When the rats were administered sulfisoxazole in the diet for 26
weeks at daily doses beginning at 2,190 rag/kg and ending at 1,350
mg/kg, they showed no inhibition of growth and no macroscopic or
38

microscopic change that could be attributed to the chemical. A
number of sulfonamides have been reported to induce hyperplasia
of the thyroid gland in rats of unspecified strain (Astwood et
al., 1943; Mackenzie and Mackenzie, 1943); this effect was
believed to be mediated by pituitary thyrotropin (Swarm et al.,
1973). When Charles River CD rats were administered sulfa
methoxazole, the hyperplasia progressed to adenoma formation and
metastases to the lung (Swarm et al., 1973). No evidence of
effects on the thyroid is found in reports on sulfisoxazole,
including the 26-week chronic study by Schnitzer et al. (1946)
and the present 103-week study.
It is concluded that under the conditions of this bioassay,
sulfisoxazole was not carcinogenic for either Fischer 344 rats or
B6C3F1 mice.
39

40

VI. BIBLIOGRAPHY
American Medical Association, Sulfonamides. In: AMA Drug Evaluations, PSG Publishing Co., Inc., Littleton, Mass., 1971, pp. 769-785 and 966.
Armitage, P., Statistical Methods iji Medical Research, John Wiley & Sons, Inc., New York, 1971, pp. 362-365.
Astwood, E. B., Sullivan, J., Bissell, A., and Tyslowitz, R., Action of certain sulfonamides and thiourea upon the function of the thyroid gland of the rat. Endocrinology 32;210-225, 1943.
Berenblum, I., ed., Carcinogenicity Testing, A Report o_f the Panel on Carcinogenicity of the Cancer Research Commission p_f the UICC, Vol. 2, International Union Against Cancer, Geneva, 1969.
Cox, D. R., Regression models and life tables. J^ R_ Statist. Soc. B 34:187-220, 1972.
Cox, D. R., Analysis of Binary Data, Methuen & Co., Ltd., London, 1970, pp. 48-52.
Gart, J. J., The comparison of proportions: a review of significance tests, confidence limits and adjustments for stratification. Rev. Int. Statist. Inst. 39(2) ;148-169, 1971.
Hayton, W. L., Ong, J. T. H., Runkel, R. A., and Welling, P. G., Sulfisoxazole. J^ Am. Pharm. Assoc. 16(11);617-620, 1976.
Kaplan, E. L. and Meier, P., Nonparametric estimation from incomplete observations. J. Amer. Statist. Assoc. 53:457-481, 1958.
Kastrup, E. K. and Schwach, G. H., Sulfonamides. In: Facts and Comparisons, Facts and Comparisons, Inc., St. Louis, Missouri, 1977, p. 364.
Korolkovas, A. and Burckhalter, J. H., Sulfonamides. In: Essentials £f Medicinal Chemistry, Wiley-Interscience Publication, New York, 1976, pp. 464-479.
Lehninger, A. L., The biosynthesis of nucleotides. In: Biochemistry, Worth Publishers, Inc., New York, 1975, pp. 730-732 and 739.
41

Linhart, M. S., Cooper, J. A., Martin, R. L., Page, N. P., and Peters, J. A., Careinogenesis bioassay data system. Comp. and Biomed. Res. 7;230-248, 1974.
Mackenzie, J. B. and Mackenzie, C. G., The effect pf "Sulfa" drugs on the thyroid gland in rats and mice. Federation Proceedings 1 :122-123, 1942.
Miller, R. G., Jr., Simultaneous Statistical Inference, McGraw-Hill Book Co., New York, 1966, pp. 6-10.
National Disease and Therapeutic Index, IMS America, Ltd., Ambler, Pa., April, 1977, pp. 105-106.
Physician's Desk Reference, Medical Economics Co., Oradell, N. J., 1977.
Sadtler Standard Spectra, Sadtler Research Laboratories, Philadelphia, Pa., IR No. R663.
Saffiotti, U., Montesano, R., Sellakumar, A. R., Cefis, F., and Kaufman, D. G., Respiratory tract carcinogenesis in hamsters induced by different numbers of administrations of benzo (a) pyrene and ferric oxide. Cancer Res. 32:1073-1081, 1972.
Schnitzer, R. J., Foster, R. H. K., Ercoli, N., Soo-Hoo, G., Mangieri, C. N., and Roe, M. D., Pharmacologicol and chemotherapeutic properties of 3,4 -dimethyl-5-sulfanilamido-isoxazole. £r Pharmacol. Exp. Ther. 88: 47-57, 1946.
Stanford Research Institute, Sulfisoxazole. Chemical Dossier, Stanford Research Institiute, Menlo Park, Calif., 1973.
Stecher, P. G., ed., The Merck Index. An Encyclopedia of Chemicals and Drugs, Merck & Co., Inc., Rahway, N. J., 1968, p. 1002.
Swarm, R. L., Roberts, G. K. S., Levy, A. C., and Hines, L. R., Observations on the thyroid gland in rats following the administration of sulfamethoxazole and trimethoprim. Toxicol. Appl. Pharmacol. 24:351-363, 1973.
Tarone, R. E., Tests for trend in life table analysis. Biometrika 62(3);679-682, 1975.
Turczan, J. and Medwick, T., Identification of sulfonamides by NMR spectroscopy. J^ Pharm. Sci. £1:434-443, 1972.
42

United States Pharmacopeial Convention, Sulfisoxazole. In: The United States Pharmacopeia XIX, United States Pharmacopeial Convention, Inc., Rockville, Md., 1975, pp. 480-482.
Weinstein, L., Antimicrobial agents. In: The Pharmacological Basis of Therapeutics, Goodman, L. S. and Oilman, A., eds., Macmillan Publishing Co., Inc., New York, 1975, pp. 1113-1124.
43

44

APPENDIX A
SUMMARY OF THE INCIDENCE OF NEOPLASMS IN
RATS ADMINISTERED SULFISOXAZOLE BY GAVAGE
45

46

TABLE A1.
SUMMARY OF THE INCIDENCE OF NEOPLASMS IN MALE RATS ADMINISTERED SULFISOXAZOLE BY GAVAGE
—— • T . —
UNTREATED CONTROL
VEHICLE CONTROL LOW DOSE HIGH DOSE
A N I B A L S I N I T I A L L Y IN STUDYSNIKtLS N E C R O F S I E DS N I B A L S E X A M I N E D H I S T O P A T H O L O G I C A L L Y
50 19
19
505050
50 50 50
50 50 50
I N T E G U M E N T A R Y SYSTEM
*SK.INP A P I L L O M A , NOSS Q U A M O U S CELL P A P I L L O M A S u O A H O O S CELL C A E C I N O B AB A S A L - C E 1 L C A R C I N O M A
(49]f 1 (2*)
1 ( 2 X )
(50)1
2
(2%)
(«%)
(50) 1 (2X)
(50) 1 (2X) 1 (2X)
1 (2X)
*SUBCUT T I S S U EF I B P O M AFIBBOSAPCCBfH E M A N G I O S B F C O M A OS7EOSAHCC1-A NEGEOFIBFCBA
(19) 1 ( 2 K ) 2 ( IX)
(50)12
(2*) (UX)
(50) 6 (12X) 1 (2X)
1 (2X) 2 (IX)
(50) 2
2
(»X)
OX)
EESPIBATOPY SYSTEB
# T P A C H E AFOLLICULAR-CELL CABCINOMS, BETAS
(18) (50) (50) 1 (2X)
(19)
* L U N GALVEOLAE/EPCNCHIOLAF ADENOMAA L V E O L A E / E P O N C H I O I A ? C A F C I N C M AIJJTERSTITIfL-CELl Tt lKOR, M E T t S T BPHEOCHSOMOCYTOHA, METASTATIC F I B S O S A F C C C A , B E T A S T f T I C C S T E O S A P C C M A , METASTATIC
(48) 2 (IX) 1 (2X) 1 (2*)
(50)1 (2X) (50)
1 (2X)
1 (2X) 1 ( 2 X )
(50) 1 (2X)
1 (2X)
B5MATOPOIETIC SYSTEM
*BULTIPLE OFGANSM A L I G . L Y M E H C M A , UNDIFFEP-TYPE MALIG.LYBPHOBA^ LYMPHOCYTIC TYPE
(19)
1 (2X)
(50)1 (2X) (50)
1 12%)
(50)
« NUMBEE OF ANIHALS WITH TISSOE EXAMINED BICEOSCOPICHLLY * NOBBEE OF ASIMALS NECEOPSIED
47

TABLE A1. MALE RATS: NEOPLASMS (CONTINUED)
UNTRCON
EATED TROL
VEHICLE CONTROL
OSDIFFERENHATED LEUKEMIA BYEIOMOHOCYTIC LEOKBBIA HOHOCTTIC 1BOKEHIA
16 (12%)
(2X) 1 (2%)
8 (16t)
•SHBCDT TISSUI/GHOIH BALIS. L Y H P H O M A . HISTIOCYTIC TYPE
(«9) (50)
ISPLfiEN F I B R O S A R C C H A , HETASTATIC HBSOTHELICKA, HETASTATIC A H G I O S A R C C M A MALIG. LYMPHCMA. HISTIOCYTIC TYPE
(18) 1 (2*)
(50) *
tBPONCHIAL IYBPHFIBROSARCCFA,
NODE METASTATIC
(U7) 1 (2%)
(50)
tMESENTEBIC I . NODE F I B P O S A R C C H A , METASTATIC
(17) 1 (2X)
(50)
* LIVED MONOCYTIC 1EUKEMIA
(18) (50) 1 (2%)
C I R C U L A T O R Y SYSTEM
tHEART (18) (50) A D E N O C A R C I N O H A , NOS, METASTATIC ALVEOLAR/ERONCHIOLAB CA, BETASTA F I B R O S A B C C B A , BETASTATIC
DIGESTIVE SYSTIM
tLIV£P (18) (50) NEOPLASTIC NODOLE 1 (2%) HEPATOCEUUIAP C f ? C I N O M A 2 ( U % )
iPANCBEAS (18) (50) FIBBnsAECCr.A, BETASTATIC 1 (2X) ><E£OTHE1ICRA, BETiSTATIC
tESOPHAGOS (18) (17) FOLlICOH?-CEtI CIIBCIBOI1A, PIETAS
tSMALL INTESTINE (U8) (50)
I NUMBER OF ANIMALS WITH TISSUE EXAMINED BICPOSCOPICA1LY * NUMBEK OF ANIMALS NECROFSIED
LOW DOSE
6 (12%)
(50)
(50)
1 (2%)
(18)
(18)
(50)
(50)
1 (2%) 1 (2%)
(50) 2 (1«) 2 (1%)
(19)
1 (2%)
(16) 1 (2%)
(18)
HIGH DOSE
8 (16%)
(50) 1 (2%)
(50)
1 (2%) 1 (2%)
(50)
(50)
(50)
(50) 1 (2X)
(50) 2 (IX)
(50)
(17)
(50)
48

TABLE A1. MALE RATS: NEOPLASMS (CONTINUED)
————— ...
UNTREATED VEHICLE CONTROL CONTROL
tDOODENUM ("8) (50) fBUCINOOS ADEKOCARCINOBA 1 (2*)
tILEOB (48) (50) ADENOBATOOS POLYP, NCS
O B I N A R Y S Y S T E M
tKIDNEY (48) (50) M I X E D TOHOE, BENIGN
ENDOCRINE SYSTEM
•PITUITARY (47) (49) C A B C I N O H A . N O S 1 (2%) CHBOBOPHCEE ADENOBA 1 (2%) 4 (8«)
IADP.ENAL (48) (50) COBTICAL A D E N C M A 1 (2«) PHEOCHBOMOCYTOMA 5 (10*) 3 (6S) PHEOCHBOMOCYT01A, MALIGNANT 2 (4%) MESOTHELICBA, HETASTATIC OSTEOSAPCCBA, METASTATIC
tADEiKAL BEDOILA (48) (50) G A N G L I C N E D 5 C B A 1 (2%)
tTHYRCID (48) (49) FOLLICULAB-CELL ADEHOBA 1 (2*) FOLLICDLAF-CELL CABCINOHA C-CELL CABCINCBA 2 (4*) 1 (2%)
« P A P A T H Y S O I E (37) (37) ADENOMA, NCS
•PANCREATIC ISLETS (48) (50) ISLET-CEII ADENCMA 3 (6X) 2 (4%)
REPRODUCTIVE SYSTEM
*H»!1I!ARY GLBNI («9) (50)
* NUMBER OF ANIMALS WITH TISSUE EXAMINED MICPOSCOPICAILY * NUBBE? OF ANIMALS NECRCPSIED
LOW DOSE
(48)
(48)
(50) 1 (2*)
(44)
4 (9»)
(50)
10 (20%)
1 (2%) 1 (2%)
(50)
(44) 1 (2*) 1 (2X) 1 (2*)
(34) 1 (3X)
(19) 1 (2*)
(50)
HIGH DOSE
(50)
(50) 1 (2*)
(50)
(50)
5 (10*)
(50) 1 (2%) 9 (18K) 1 (2*)
(50)
(48)
2 (4*)
(40)
(50)
(50)
49

TABLE A1. MALE RATS: NEOPLASMS (CONTINUED)
UNTREATED VEHICLE CONTROL CONTROL
*PEEPUTIAL G I A N C C A F C I N O H A . N O S
(19) 3 (6%)
(50)2 (U<)
• S Q U A M O U S CELL C A R C I N O M A 1 (2%) A D E N O M A , DCS
*TESTIS (it It) (48)INTERSTITIAL-CELL "OKOR 39 (89%) U5 (9IIX)INTERSTITIAL-CELl TIJHOH, PI ALIGN A 1 ( 2 % ) M B S O T H E L I C N A , H A L I G N S N T M £ S O T H E L I C K A , METASTATIC
*EPIDIDYBIS ( U 9 ) (50)NESOTHELICP.A, METASTATIC
K E P V O U S S Y S T E M
TONE
SPECIAL SENSI CEGA1S
*ZTHBAL'S GLAlil (U9) (50) CAPCINOM»,1 IOS
BOSCI'LOSKELETAI SYSTEfl
•BONE/OPPER IXTBIWITY (19) (50) OSTEOSARCCMA
BODY CAVITIES
* MEDIASTINUM (l»9) (50) ALVEOLAR/ERONCHIOLAB CA, HET&STA FIBROSARCCKA
*HESENTEPY (50) FIEROSARCCHA 1 (2%) M£SOTHELIOHA. MALIGNANT
"TUNICA VAGINALIS (50) HeSOTHELICgA._»QS
* NUHBEP. OF ANIMALS WITH TISSUE EXAHINED MICROSCOPICALLY * NUMBER OF ANIMALS NECROPSIED
50
LOW DOSE
( = C) i| (8%)
1 (2*)
(19) « 3 (88%)
1 (2%) 1 (2%)
(50) 1 (2%)
(50)1 (2%)
(50) 1 (2%)
(50)1 (2%) 1 (2%)
(50)
1 (2%)
(50)
HIGH DOSE
(50) 3 (6%)
2 (»%)
(«9) U6 (9tt%)
(50)
(50)
(50)
(50)
(50)
(50)

TABLE A1. MALE RATS: NEOPLASMS (CONTINUED)
ALL OTHER SYSTIHS
*HOLIIPLB ORGANSHBSOTHELICMA, DOS
DIAPHRAGM FIBROSARCCEA, METASTATIC
ANIMAL DISPOSITION S U M M A R Y
ANIHALS INITIALLY IN STUDYNATURAL DEATHSMORIBUND SACRIFICESCREDULID SACRIFICE ACCIDBNTALIY KIHED TERMINAL SACRIFICEANIMAL HISSING
9 INCLUDES AOTCLYZED A N I M A L S
TUMOR SUMMARY
TOTAL A N I M A L S WITH P R I M A R YTOTAL PRIRARY TOMOPS
TUHORS*
TOTAL A N I M A L S BITH BENIGN TUMORSTOTAL BENIGN TUMORS
TOTAL A N I H A I S BITH MALIGNA*1" T U M O ' STOTAL HA1IGNANT TOMOSS
TOTAL A N I M A L S WITH SECONDARY TUMORS*TOTAL S E C O N D A R Y T U M O E S
TOTAL ANIMALS HITH TUMORS UNCERTAINBENIGN OR M A L I G N A N T
TOTAL U N C E R T A I N T U M O K S
TOTAL ANIHAIS WITH TUMORS UNCERTAINPRIMARY OR METASTATIC TOTAL UNCERTAIN TUMORS
UNTREATED VEHICLE CONTROL CONTROL LOW DOSE
(l»9) (50) (50) 2 (»X)
1
50 50 50 19 11 16
1 2
31 38 32
U3 «8 <17 80 81 100
U2 47 K5 55 59 73
20 21 20 2« 21 23
2 c
5 1U
1 1 It 1 1 U
* PRIMARY TUMORS: ALL TUMORS EXCEPT SECONDARY TUMORS I SECONDARY TUMORS: METASTATIC TUMORS OR TUMORS INVASIVE INTO AN ADJACENT ORGAN
51
HI6H DOSE
(50)
50 12
1
1 36
49 93
<»7 71
18 20
2 2
2 2

TABLE A2.
SUMMARY OF THE INCIDENCE OF NEOPLASMS IN FEMALE RATS ADMINISTERED SULFISOXAZOLE BY GAVAGE
• • ~-l UNTREATED
CONTROL VEHICLE CONTROL LOW DOSE HI6H DOSE
ANIMALSANIMALSANIMALS
INITIULY IN STUDY NECROPSIED E X A M I N E D HISTOPATHOIOGICAUT
50 50 50
50 50 50
50 50 = 0
50 50 50
I N T E G U M E N T A R Y SYSTEM
•SKIM PAPILLOHA, HOS
•SUBCOT TISSUE FI BROOK FIBROSARCCHA
(50)
(50) 1 (2%)
(50)
(50)
(50) 2 {<»*)
(50)
(50)
(50)
1 (2*)
uESPIHATOHY SYSTEM
HOME
HEHiTOPOIETIC SYSTEM
*mJLHPLE ORGANSMAIIG.LYHPBCBA, LYMPHOCYTICLEUKEMIA, 8CS GBANOtOCYTIC LEUKEMIA HONOCYTIC LEOKEHIA
TYPE (50)
4 (8«)
(50) 1 (2%) 1 (2%) 1 (2%) 3 (6%)
(50)
3 (6%)
(50)
9 (18X)
CIRCULATORY SYSTEM
HONE
DIGESTIVE SYSTEM
tLIȣE HKPATOCEI LOLAS CARCINOMA
(50) (50) 1 (2X)
(50) (50)
SYSTER
t NUBBEB* NUMBER
OF OF
A N I M A L S A N I M A L S
WITH TISSDE E X A M I N E D NECROPSIED
MICROSCOPICALLY
52

TABLE A2. FEMALE RATS: NEOPLASMS (CONTINUED)
UNTREATED VEHICLE CONTROL CONTROL
INDOCRINE SYSTIM
tPITUITARY (»7) («9)ADENOMA, NCS 2 («) CHRONOPHCEI A D E N O M A 17 (36*) 18 (37%)
IAD9ENAL (50) («9)CORTICAL ADENOMA 1 (2*) 1 (2«) PHBOCHROHCCYTOHA 1 (2«)
tTHYRCID («9) (U7) C-CELL A D I R O H A 1 (2%) C-CELL C A R C I N O M A 1 (2«)
tPARATHTROID (33) (32)ADENOMA, NCS 1 (3%)
•PANCREATIC ISLETS (50) (50) ISLET-CELL A D E N O M A 1 (2*)
REPRODUCTIVE SYSTEM
• S A M H A P Y G L A N I (50) (50) ADENOMA, NCS 1 (2») 1 (2«) ADENOCARCINORA, NOS 1 (2*) PAPILLARY CYSTADENOHA, NOS 2 (««) FIBPOADEHCMA 6 (12U) 12 (2tt«)
*PREPOTIAL G L A N D (50) (50) C A P C I N C M A , K O S 1 <2«) 3 (6«) A D E N O M A , NCS 2 («X)
IUTEFOS (50) («9) CARCINOMA, NOS 1 (2*) PAPILLARY CYSTADENOKA, NOS ENDOHETRIA1 STROHAL EOLYP 6 (12») 5 (10*) BNDOHBTRIAL STROHAL SARCOMA 1 (2%)
NERVOUS SYSTEM
•CEREBROM (50) (50) . .ASTR.OCY.TCH.A. , ,, , .
* NOHBER OF ANIMALS 8ITH TISSUE EXAMINED MICROSCOPICALLY * NUMBER OF ANIMALS MECROFSIED
LOW DOSE
(50) 1 (2«)
19 (38X)
(50)
2 («%)
(50)
(38)
(50) 1 (2*)
(50)
1 (2»)
16 (32*)
(50)
(«9)
1 (2*) 6 (12«)
(50) 1 ltf\
HI8HDOSE
(-40) 1 (2*)
17 (3««)
(50)
<«9)
2 («*)
(13)
(«9)
(50)
15 (30*)
(50) 1 (2») 1 (21)
(•18)
8 (17*)
(50)
53

TABLE A2. FEMALE RATS: NEOPLASMS (CONTINUED)
UNTREATED VEHICLE CONTROL CONTROL LOW DOSE HIBHDOSE
SPECIAL SENSE C5GANS
• EYS/CONJUNCTIVA (50) (50) (50) (50) SytJAIIOOS CEIL C A R C I N O M A 1 (2V)
M O S C U L O S K E L E f A L SYSTEM
HONE
EOLY CAVITIES
HONE
ALI OTHER SYSTEMS
NONE
A N I M A L DISPOSITION S U M M A R Y
ASIMALS INITIALLY IN STODY 50 50 50 50 NATURAL DIATH9 11 15 « 8 nOBIBONi; SACPIFICE 3 2 SCHEDULED SACBIFICE ACCIDEHTAtlY R U L E D TERMINAL SACEIFICE 39 35 «3 «0 ANIHAI. HISSING
9 INCLDDES AyTOLYZED_ASHIAI.S
* N U H B E P OF A N I M A L S BITH TISSUE EXAHINED HICFOSCOPICALLY * 10MBEE OF ANIMALS NECBCPSIED
54

TABLE A2. FEMALE RATS: NEOPLASMS (CONTINUED)
UNTREATED VEHICLE CONTROL CONTROL LOW DOSE HIGH DOSE
T U M O B S U M M A R Y
TOTAL A N I M A L S WITH P B I H A R Y TUMORS* 30 38 37 35 TOT»L P R I M A R Y TUHOBS 42 56 5« 55
TOTAL A N I M A L S WITH BENIGN T U M O R S 27 32 36 32 TOTAL BENIGN TUMORS 3» us U8 H2
TOTAL ANIMALS WITH MALIGNANT TOBORS 8 11 6 11 TOTAL M A L I G N A N T TDMOPS 8 11 6 13
TOTAL A N I M A L S WITH SECONDARY TOMORSt TOTAL S E C C N D A P Y T U M O F S
TOTAL A N I M A L S WITH TUMORS U N C E R T A I N BENIGN OR MALIGNANT
TOTAL O N C E F T A I N TDMOFS
TO"AL A N I M A L S WITH T U M O R S tTNCEPTAIN-PRIdAP.Y OP HETASTATIC
TOTAL n N C E B T A I N T H M O P S
* P R I M A R Y TUMCBS: ALL T U M O R S EXCEPT SECONDARY TUMOPS * S E C O N D A R Y TOMOPS: METASTATIC T U M O R S OR TUMORS I N V A S I V E INTO AN ADJACINT O R G A N
55

56

APPENDIX B
SUMMARY OF THE INCIDENCE OF NEOPLASMS IN
MICE ADMINISTERED SULFISOXAZOLE BY GAVAGE
57

58

TABLE B1.
SUMMARY OF THE INCIDENCE OF NEOPLASMS IN MALE MICE ADMINISTERED SULFISOXAZOLE BY GAVAGE
UNTREATED CONTROL
VEHICLE CONTROL LOW DOSE HI6H DOSE
A N I M A L S INITIAILY IN STUDYANIMALS HISSINGANIMALS NECROISIEDARIBAL5 E X A M I N E D HISTOPATHOLOGICAILI
50 1
!»9 !»9
50
50 50
50
50 50
50
1*9 U9
IHTIGUHENTARY SISTER
»SKIH BASAL-CELLFIBROMA
TOHOP (*9)
1 (2*) (50) (50)
1 (2%)
(«9)
*SOBCDT TISSOE FIBROMA PIBSOSARCCHA FIBROUS HISTIOCYTOMA
(49)
6 (12%)
(50)
"» (8*) 1 (2%)
(50) 25
(«%) (10%)
(U9)
3 (6%)
FKSPIBATOEY SYSTEM
tLUNG HBPATOCEILDLAR CARCINOMA. METAST ALVBOLAB/ERONCHIOLAR ADENOMA ALVEOLAB/BROKCHIOLAR CARCINOMA CORTICAL CARCINOMA, BETASTATIC SEBACEOUS ADENOCABCIHOHA, BETAST FIB80SABCCMA, HETASTATIC
(49) 2 (U%) 8 (16%) 1 (2%)
1 (2%)
(50) 2 <U%) 3 (6%) 1 (2%) 1 (2%) 1 (2%) 1 (2%)
(50) 3 (6%) 3 (6%) 2 ("»%)
(U9) 1 (2X)
HEMATOPOIETIC SYSTEM
•MULTIPLE O R G A N SMALIG.LYJ1IHOBA, LYBPHOCYTIC TYPEHiLIG.LYHEHOMA, HISTIOCYTIC TYPEBALIGNANT IYBPHOMA, MIXED TYPEGHANOLOCYTIC L E U K E M I A
(19) 1 (2%) U (8%) 1 (2%)
(50) 12
1
(2%) («%)
(2%)
(50) 5 (10%) 3 (6% )
31 (6%) (2%)
tSPLEEMHBBANGICBA HJSHANGIOSABCOMA
(U9) (50)
2 ( U % )
(50) 1 (2% )
(U9)
1 (2%) 1 t2%)
I NDMBER OP ANIMALS WITH TISSUE EXAMINED* NOMBEB OF ANIMALS NECROPSIED
MICPOSCOPICALLY
59

TABLE B1. MALE MICE: NEOPLASMS (CONTINUED)
UNTREATED VEHICLE CONTROL CONTROL
• CDOOEMOR (09) (09)M A L I G . L Y H P H O H A , HISTIOCYTIC TYPE 1 (2%)
•THYHDS (19) (22)LIPOSARCCKA 1 (5%)
CIRCULATORY SYSTEM
MOMS
DIGESTIVE SYSTEM
•LIVSR (09) (50)HZPATOCELLOLAP ADENOMA 3 (6%) HEPATOCBIIOLAB CARCIMOMA 17 (35%) 15 (30%)HEHAMGIOSASCOHA 2 (0%)
•81 Li DIICT (09) (50)CiPCIMOSIFCOMA 1 (2%)
• PANCREAS (49) (50)CORTICAL CASCIMOMI, KETASTATIC 1 (2%)
• STOMACH (09) (09)CARCINOMA, MOS 1 (2%) SQUAMOOS CELL PAPILLOMA 1 (2%) ADENOMATOOS POLYP, NOS
•SHALL IMTESTIMZ (09) (09)HEHAHGIOSAFCOMA, METASTATIC 1 (2%)
•JEJUNDM (09) (09)CARCIHOHK.MOS 1 (2%)
OPIMAHY SYSTEM
• U R I N A R Y BUEIBH (09) (50)TBAMSITICNA1-CELL PAPILLOMA 1 (2%)
EIOOCSIME SYSTEM
•ADPSNAL (U9) COPTIC^L AtBMOMA
t BOMBER OF ANIMALS ilTH TISSUE EXAMINED MICROSCOPICALLY » ROHBEP OF ANIMALS MECRCPSIED
LOW DOSE
(50)
(22)
(50)
13 (26%) 1 (2%)
(50)
(09)
(09)
(50)
(50)
(50)
HIGH DOSE
(09)
(8)
(09) 1 (2%)
20 (01%) 2 (0%)
(09)
(08)
(09) 1 (2%)
1 (2%)
(09)
(09)
(09)
(09)
60
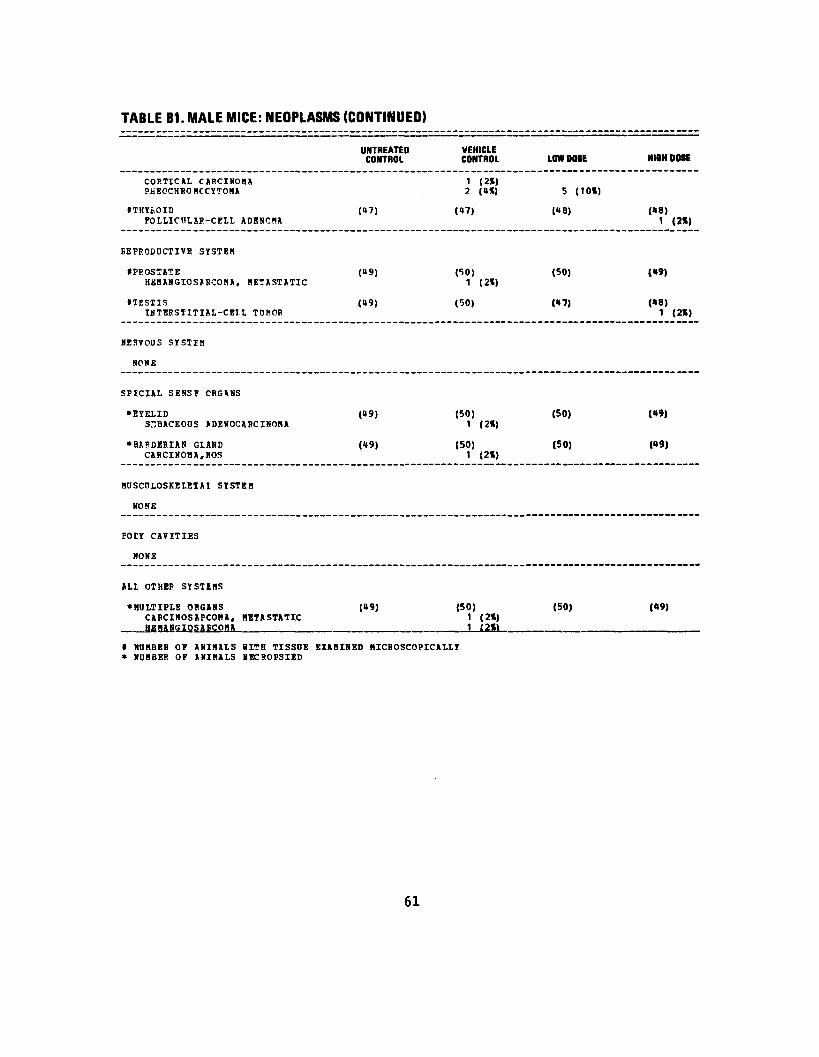
TABLE B1. MALE MICE: NEOPLASMS (CONTINUED)
UNTREATEDCONTROL
VEHICLE CONTROL LOW DOSE HI6HDOSE
CORTICAL C A R C I N O M AP K E O C H R O M C C Y T O H A
tTHYEOIDFOLLICOLAP-CELL A D E N O M A
(47)
1 (2*) 2 («%)
(47)
5 (10*)
(48) (US) 1 (2*)
REPRODUCTIVE SYSTEM
•PROSTATEH t t M A N G I O S f B C O H A . METASTATIC
(49) (50) 1 (2%)
(50) (19)
ITESTISINTERSTITIAL-CELL TDHOR
(U9) (50) («7) («8) 1 (2%)
MESVOUS SYSTEM
NONE
SPICI1L SENSE CROONS
*EYELIDS.-BACEOUS AOENOCARCINOHA
(M9) (50) 1 (2X)
(50) (»9)
• H U P D E H I A N GLANDCARCINCRA.NOS
(49) (50) 1 (2«)
(SO) (19)
BUSCnLOSKELETAI SYSTEM
NONE
EOEY CAVITIES
RONE
ALL OTHEP SYSTEMS
* MULTIPLE ORGANS C A R C I N O S A F C O H A ,HZHANSIOSAECOBA
t NOMBER OF A N I M A L S* ROHBER OF A N I M A L S
METASTATIC
ilTH TISSUE NBCHOFSIED
(49) (50) 1 (2%)
_ 1-I2SL
EXAMINED MICROSCOPICALLY
(50)
61

TABLE 61. MALE MICE: NEOPLASMS (CONTINUED)
UNTREATED VEHICLE CONTROL CONTROL
ANIMAL DISPOSITION SUMMARY
ANIMALS INITIALLY IN STUDY 50 50 NATURAL DEATHS 12 18 HORIBUND SACRIFICE 1 SCHEDULED SACRIFICE ACCIDENTALLY KILLED 1 1 TERMINAL SACRIFICE 36 30 ANIMAL HISSING 1
3 INCLUDES AUTCLYZID ANIMALS
TUHOR SUMMARY
TOTAL ANIMALS WITH PRIMARY TUMORS* 32 29 TOTAL PRIMARY TUMORS 45 43
TOTAL A N I M A L S WITH BENIGN TOHORS 12 TOTAL BENIGN TUMORS 13
TOTAL A N I M A L S WITH M A L I G N A N T T U M O R S 26 25 TOTAL MALIGNANT TUMOPS 32 35
TOTAL A N I M A L S WITH SECONDARY TUMORS* 3 7 TOTAL S E C O N D A R Y T U M O R S 3 9
TOTAL ANIMALS WITH TUMORS UNCERTAINE E N I G N OR M A L I G N A N T
TOTAL U N C E R T A I N TUMORS
TOTAL A N I M A 1 S WITH TUMORS UNCERTAINPRIMARY OR METASTATIC
TOTAL U N C E R T A I N T U M O R S
* P R I M A R Y T U M C R S : ALL T U M O R S EXCEPT SECONDAFY TUMORS » SECONDARY TDHOPS: METASTATIC T U M O R S OR TUMORS I N V A S I V E INTO All
LOW DOSE
50 14
36
31 41
9 12
25 29
3 3
A D J A C E N T ORGAN
HI6H DOSE
50 11
2 34
28 36
25 32
62

TABLE B2.
SUMMARY OF THE INCIDENCE OF NEOPLASMS IN FEMALE MICE ADMINISTERED SULFISOXAZOLE BY GAVAGE
UNTREATED VEHICLE CONTROL CONTROL LOW DOSE HIGH DOSE
A N I B A L S INITIAILY IN STUDY 50 50 50 50 ARIBALS BISSING 1 ANIBALS NECROFSIED 50 49 50 50 ANIBALS EXABIHED HISTOPATHOLOGICALLY 50 U9 50 50
INTEGUHENTARY SYSTEM
»SUBCOT TISSDE (50) (49) (50) (50) FIBSOSARCCBA 1 (2*) HEBANGIGBA 1 (2*) 1 (2*)
RESPIRATORY SYSTEB
• L U N G (50) (49) (50) (50) ADENOCARCINOBA. NOS, BETASTATIC 1 (2*) ALVEOLAR/ERONCHIOLAR ADENOBA 2 (U*) 1 (2*) 3 (6*) ALVKOLAB/BFONCHIOLAR CAPCINOBA 2 (»*)
HIMATOPOIETIC SYSTEB
*BOITIPLE O R G A N S (50) (49) (50) (50)B A L I G . L Y B P H O B A , LYBPHOCYTIC TYPE 3 (6*) 6 (12*) 7 (14*) 10 (20*) BALIG.LYBPHOMA. HISTIOCYTIC TYPE . 10 (20*) 7 (14*) 6 (16*) 10 (20*) M A L I G N A N T LYBPHOHA, MIXED TYPE 3 (6*) 3 (6*) 1 (2*) GRANOLOCYTIC LEOKEHIA 1 (2*) 1 (2*)
t SPLEEN (50) (49) (50) (50) HBBANGIOSAPCOMA 1 (2*)
IRESENTERIC I. NODE (48) (48) (50) (50) M A L I G N A N T 1YMPBOHJ, BIXED TYPE 1 (2X)
CIRCULATORY SYSTEB
NONE
t NHBBER OF ASIBALS WITH TISSUE EXABINED MICROSCOPICALLY * NUKBEH OF ANIMALS NECRCPSIFD
63

TABLE B2. FEMALE MICE: NEOPLASMS (CONTINUED) — — ,.— -„._-—«__-, «. -_ ! -——-„_ .. .
UNTREATED VEHICLE CONTROL CONTROL LOW DOSE
DIGESTIVE SYSTIM
•LITEE (50) (49) (50) HSPATOCEllDLAP A D E N O M A 1 (2*) HEPATOCELLOLAR CARCINOMA 2 (4%) 5 (10*)
•PANCREAS (50) (49) (50) C A R C I N O M A , NOS, HETASTATIC 1 (2%)
•STOMACH (50) (49) (49) CARCINOMA, NOS 1 (2%)
U B I N A H Y SYSTEM
NON£
INEOCfilNE SYSTEM
tPITUITAPY (45) (42) (44) CHPOHOPHOEI A D E N O M A 1 (2X) 2 (5X) 1 (2*)
•ADPENAL (50) (48) (49) PHEOCHROMCCYTCHA 1 (2%) 1 (2%)
•THYROID (49) (48) (48) FOLLICULAR-CEIL ADENOMA 1 (2*) 1 <2X)
REPRODUCTIVE SYSTEM
•MAMMARY GLANE (50) (49) (50) A D E N O M A , NCS ADENOCABCIKCMA, NOS 1 (2X) 5 (10X) 1 (2X) F I B H O A D E N C K A 1 (2X)
•UTERUS (50) (49) (50) FIBROSAPCCKA BSDOMBTRIAI STRCMAL FOLYP 1 (2X) 1 (2*) 2 (4X) H£HANGIOMA 1 (2X) 1 (2%) BE MA NG IDSA SCO MA 1 (2*) 1 (2%)
•OVARY (50) (49) (50) S£PTOLI-CJIL_ TJMOF 1 X2S.L.
* NUMBER OF «.NIHALS WITH TISSUE EXAMINED MICROSCOPICALLY * NUMBER OF ANIMALS NECROPSIED
HIGH DOSE
(50)
2 (4%)
(50)
(50)
(31) 1 (3X)
(50)
(46) 2 (4X)
(50) 1 (2X)
(50) 1 (2X)
1 (2X)
(50)
64

TABLE 62. FEMALE MICE: NEOPLASMS (CONTINUED)
UNTREATED VEHICLE CONTROL CONTROL LOW DOSE HIGH DOSE
t M E S O V A R I U M (50) (U9) (50) (50) CARCINOMA, NOS, METASTATIC 1 (2%)
N E R V O U S S Y S T E M
N O N E
SPECIAL SENS! C E G A N S
* H A R D E R I A N G1AND (50) («9) (50) (50) ADENOMA, NCS 2 (U») 2 (US)
HUSCULOSKELETSI SYSTEM
NONE
EOEY CAVITIES
NONE
All OTHER SYSTEMS
'MULTIPLE ORGANS (50) («9) (50) (50) F IBROSARCCKA 1 (2*)
JNIMAL DISPOSITION S U M M A R Y
ANIMALS INITIALLY IN STUDY 50 50 50 50 N A T U R A L DIATH3 M O R I B U N D SACRIFICE SCHEDULED SACRIFICE ACCIDENTALIY KILLED 1 TERMINAL SACRIFICE 10 tt2 Atl lHAL MISSING
8 INCLUDES AaTCLYZED A N I M A L S
t N U M B E R OF A N I M A L S WITH TISSUE E X A M I N E D MICROSCOPICALLY * NUMBER OF A N I M A L S NECROPSIED
65

TABLE B2. FEMALE MICE: NEOPLASMS (CONTINUED)
UNTREATEDCONTROL
VEHICLE CONTROL LOW DOSE HIGH DOSE
THROB S U M M A R Y
TOTAL A N I M A L S WITH P R I M A R Y TUMORS*TOTAL P R I M A R Y TUMORS
26 30
2« 31
29 35
31 35
TOTAL A N I M A L S WITH BENIGN TUMORSTOTAL EEHIGH TUMORS
7 8
7 8
10 11
7 7
TOTAL A N I M A L S KITH M A L I G N A N T TOMORSTOTAL HAIIGNANT TUMORS
22 22
20 23
22 21
26 28
TOTAL A N I M A L S WITH SECONDARY TOHOPS*TOTAL SECONDARY TUMORS
1 2
1 1
TOTAL A N I M A L S WITH TUMORSBENXGN OR H A I I G N A N T
TOTAL UNCERTAIN TUMOES
UKCEPTAIN
TOTAL A N I M A L S WITH TUMORSPRIMARY OH RETASTATIC
TOTAL UNCEmiN T O M O R S
UNCERTAIN
* P R I M A R Y TOflCBS: ALL T U M O R S EXCEPT SECONDARY TUMOPS * SECONDARY TUMORS: METASTATIC T U M O R S OR TUMOPS I N V A S I V E INTO AN A D J A C E N T O R G A N
66

APPENDIX C
SUMMARY OF THE INCIDENCE OF NONNEOPLASTIC LESIONS
IN RATS ADMINISTERED SULFISOXAZOLE BY GAVAGE
67

68

TABLE C1.
SUMMARY OF THE INCIDENCE OF NONNEOPLASTIC LESIONS IN MALE RATS ADMINISTERED SULFISOXAZOLE BY GAVAGE
UNTREATED CONTROL
VEHICLE CONTROL LOW DOSE HIGH DOSE
ANIMALS INITIAILT IN STUDY JHIKALS NECP.OESIED AHIHALS IXAHIHID HIS V JPATHOLOGICALIY
50 U9 49
50 50 50
50 50 50
50 50 50
IHTEGUHEHIAPY SYSTEM
• SKIN EPIDERMAL INCLU ' OH CYST RYPERKERATCSIS ACAHTHOSIS
C»9> 1 (2X) 1 (2*) 1 <2«)
(50) 3 (6*)
1 (2%)
(50) 1 (2%)
(50)
1 (2%)
*SDBCOT TISSUE STEATITIS I N F L A M M A T I O N , C - ONIC
l"*9) 1 (2%)
(SO)
1 (2%)
(50) (50)
FBSPIRATORY SYSTEM
tLl'HG MINERALIZATION H f c H O R R H A G E I N F L A M M A T I O N , SINFLAHHATICN, AP N E U n O H I A , CHFO
P0RATIVE TE
C H O P I N E
(«8)
5 (10X) 1 (2%)
39 (81*)
(50) 1 (2X) 2 («%)
U6 (92%)
(50)
6 (12%)
1 (2%) «3 (86%)
(50)
5 (10%)
t« (88%)
HEBATOPOIETIC SYSTEM
•SPLEEN ECTOPIA FIBPOSIS FIBPOSIS, FOCAL AHYLOIDOSIS HEHOSIDE5CSIS HJiHATOPOIISIS
(48)
1 (2%) 1 <2X)
5 (10»)
(50)
1 (2*)
1 (2*) 3 {6»)
(50) 2 (»*)
1 (2%) 1 (2%)
(50)
2 <«%)
ISPLEHIC CAPSULE FIBPOSIS, FOCAL
(K8) (50) (50) 1 (2%)
(50)
tLYHPH NODE A,THQP_aXi "53
("7) . .1_1281_.._. _
(50) ««B) <50)
» NOMBER OF ANIMALS WITH TISSOE EXAHIHED MICROSCOPICALLY * SOBBE5 OF AKINALS HECROPSIED
69

TABLE C1. MALE RATS: NONNEOPLASTIC LESIONS (CONTINUED)
UNTREATED VEHICLE CONTROL CONTROL
•CERVICAL LYiPH RODE (47) (50) AHYLOIDOSIS 1 (2X)
•BRONCHIA! IYMPH RODE (47) (50) HEMORRHAGE 1 (2X) ATROPHY, NCS 1 (2X)
IHESBRTERIC I. NODE (47) (50) LYNPHARGIECTASIS 1 (2X) AHYLOIDOSIS 1 (2*) ATROPHY, NCS 1 (2X)
CIRCULATORY SYSTEM
•HEART/ATRIDN (48) (50) THROMBOSIS, ROS 8 (17X) 2 (4X)
•HYOCARDIOB (48) (50) INFLAHHATICN, CHRORIC 6 (13X) 13 (26X) FIBHOSIS 23 (48X) 27 (54X) FIBROSIS, fOCAL 2 (4X) DBGBNERATICN, ROS 11 (23X) 6 (12X)
•AORTA (49) (50) THROMBOSIS, ROS INFLAMMATION, CHRONIC 1 (2X)
DIGESTIVE SYSTEM
•SALIVARY GLAND (48) (49) IMFLAMRATIOR, ACOTE IVFLAMHATICR, CHRORIC
•LIVER (48) (50) FIBROSIS 1 (2X) CIRRHOSIS, POSTAL 3 (6X) HEPATITIS, TOXIC 2 (»X) 2 <«X) PBLIOSIS HEPATIS NECROSIS, ROS 2 (4X) 2 (4X) HBTARORPHOSIS FATTY 1 (2X) 2 (4X) HEMOSIDERCSIS FOCA1 CEL1DLAR CHARGE 25 (52X1 28 156X1
t SOMBER OF ASIHALS VITH TISSUE EXAMINED MICROSCOPICALLY * NOMBEP OF AHIRALS NECSOPSIED
LOW DOSE
(48)
(48)
1 (2X)
(48) 1 (2X)
1 (2X)
(50) 4 (8X)
(50) 1 (2X)
34 (68X) 1 (2X) 2 («X)
(50) 1 (2X)
(49) 1 (2X) 1 (2X)
(50) 1 (2X)
1 (2X) 1 (2X) 1 (2X)
1 (2X) 20 <40X>
HIGH DOSE
(50)
(50) 1 (2X)
(50) 1 (2X)
(50) 1 (2X)
(50) 2 (IX) 32 (64X)
9 (18X)
(50)
1 (2X)
(50)
(50)
2 {»«)
1 (2X)
18 (36X)
70

TABLE C1. MALE RATS: NONNEOPLASTIC LESIONS (CONTINUED)
LOW DOSE UNTREATED VEHICLE
CONTROL CONTROL
HEBJITOEOIESIS 1 (2*)
tPOPIAL T R A C T (48) (50) FIBROSIS 1 (2%)
tLIVEP/CENTF IIOBU1AR (48) (50) NECROSIS, VOS 5 (10X) 1 (2X>
*LIVER/PERIFCFTAL (48) (50) FIBROSIS 1 (2%)
tSILE DUCT 118) (50) I N F L A f M A T I C I , NOS 1 (2%) I N F L A K M A T I C H , CHRONIC " (8X) FIBROSIS 3 (6*) 7 (14*) HYPERPLASIA, NOS 33 (69*) 31 (62X)
*PfNCPEAS (48) (50) I N F L A B B A T I C N , CHRONIC 4 (8X) 3 (6*) PBRIARTEPITIS 3 (6*) 1 (2X) A T F O P H Y , N C S 6 (13*) 6 (12X)
•STOMACH (48) (48) HEf!0"FHAGE 1 (2X) ULCER, NOS INFLAMBATICN, CHRONIC 2 (4X) NECROSIS, NOS 1 (2%) 2 {<»*) NECROSIS, FOCAL 2 (t%) ACANTHOSIS
*1APGE I N T E S T I N E C»8) (50) PAEASITISfl 8 (17*) 7 (14X) I»FASCT, NCS
O B I N A B Y SYSTF.B
• K I D N E Y (48) (50) IKFLABBATICN, CHRONIC 42 (88*) 45 (90X) CALCIFICATION, DOS 1 (2*) PIGHENTATIC», DOS HEMOSIDEFCSIS 2 (IX)
*KIDHEI/TOB01E C*8) (50) PJtGHfNTiTICN. KOS 1 12SL_ .
I NOBBER OF fNIHAlS WITH TISSUE EXAMINED HICRCSCOPICAILY * NOBBE3 OF ANIBAtS NECPCPSIED
HIGH DOSE
(50)
(50) 2 (4X)
(50)
(50)
10 (20X) 36 (72X)
(50)
3 (6X) 13 (26X)
(U8)
1 (2X) 1 (2X) 1 (2X)
(U9) 7 (14X)
(50) 45 (90%)
(50)
(50)
(50) 3
(50)
(50)
26
32
(49)
211
(49) 11
1
1
(49) 12
1
(50) 44
2
(50)
(6X)
(4*) (12X) (64*)
O«) (22X)
(2X) (2X)
(2X)
(2X)
(24*) (2X)
(88X)
( tX)
71
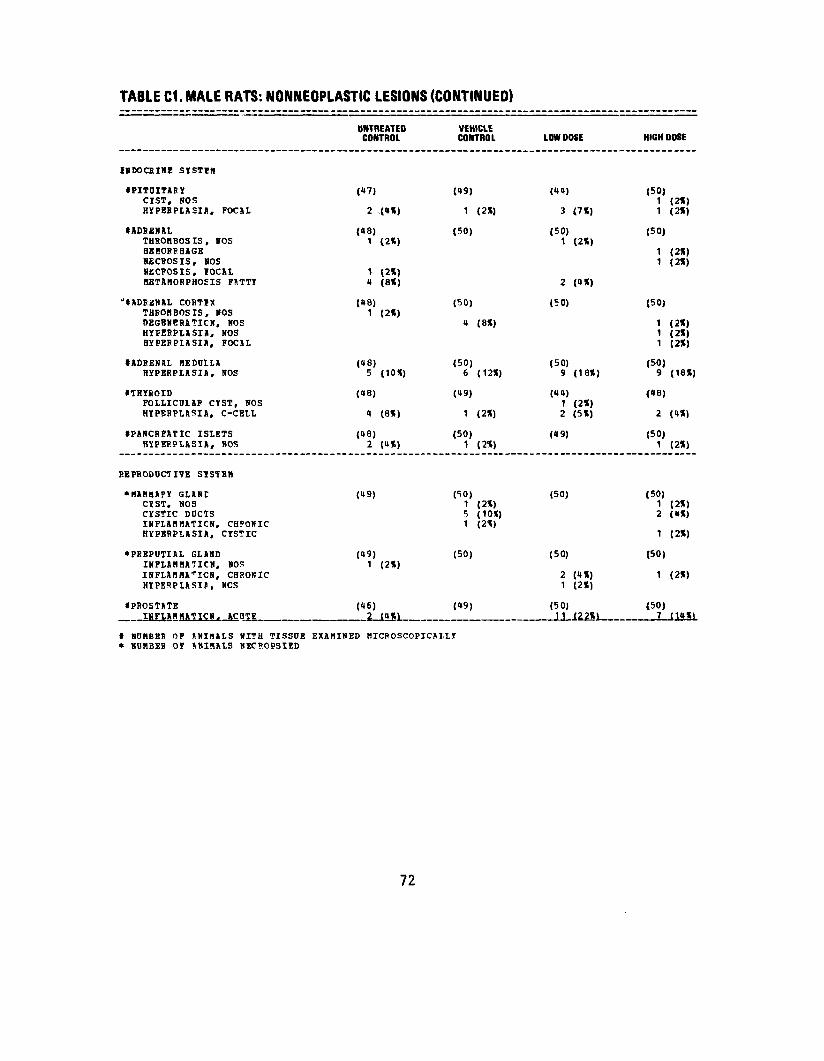
TABLE C1. MALE RATS: NONNEOPLASTIC LESIONS (CONTINUED)
UNTREATED VEHICLE CONTROL CONTROL
ENDOCRINE SYSTIH
•PITUITARY (*7) («9J CYST. NOS HYPEEPLASIA, FOCAL 2 («*} 1 (2*)
•ADRENAL («8) (50) THROMBOSIS, NOS 1 (2%) H B R O R R H A G B NECROSIS, NOS HECPOSIS, FOCAL 1 (2*) BBTABOBPHOSIS PUTTY It (8«)
J»ADEENAL COBTIX (U8) (50) THEOHBOSIS, HOS 1 (2*) D E G E N E R A T I O N , HOS 1 (8*) HYFERPLASIA. NOS H Y P E B P L A S I A , FOCAL
t A D B E N A L M E D U L L A («8) (50) R Y P E B P L A S I A , NOS 5 (10») 6 (12X)
•THYBOID («8) (l»9) FOLLICULAP CYST, BOS HYPERPLASIA, C-CELL l» (8*) 1 (2«)
•PANCREATIC ISLETS (18) (50) RYPEBPLASIA, NOS 2 (»*) 1 (2%)
REPRODUCTIVE SYSTEM
* B A B H A P Y G L A N T <t9> 050) CYST, HOS 1 (2«) CYSTIC DUCTS 5 (10X) INPLABBATICN. CHPONIC 1 (2*) HYPBRPLASIA, CYSTIC
•PEEPUTIAL G L A N D (U9) (50) IHPLABSATICN. NOS 1 (2*) INFLABBA^ICH, CHRONIC HYPEHPLASIf, HCS
•PROSTATE («6) (49) IBFtAHHATICH. ACOTE 2 <1J> _„„ . , , . _
t NHBBER OF ANIMALS HITH TISSUE EXAMINED MICBOSCOPICA1LI * NUMBER OF SHIBALS NECHOPSIED
72
LOW DOSE
(««)
3 (7«)
(50) 1 (2«)
2 (««)
(50)
(50) 9 (18*)
( O K ) 1 (2*) 2 (5*)
(«9)
(50)
(50)
2 («%) 1 (2%)
(50) 1j (22X)
HIGH DOSE
(50J 1 (2X) 1 (2%)
(50)
1 (2») 1 (2%)
(50)
1 (2%) 1 (2«) 1 (2*)
(50) 9 (18%)
(«8)
2 («*)
(50) 1 (2*)
(50) 1 (2*) 2 (»*)
1 (2*)
(50)
1 (2*)
(50) 7 n»«)
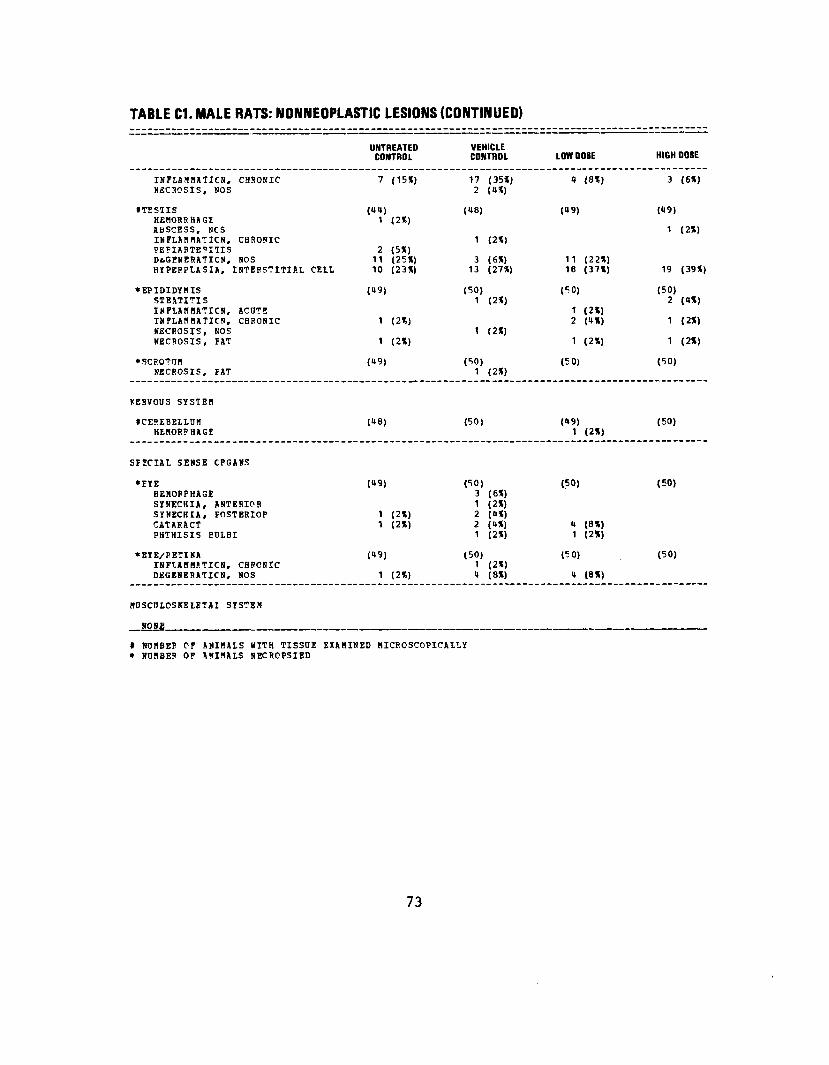
TABLE C1.MALE RATS: NONNEOPLASTIC LESIONS (CONTINUED)
UNTREATED CONTROL
VEHICLE CONTROL
INFLABBATICN, CHSOKIC NECSOSIS, »OE
7 (15*) 17 (35X) 2 (UX)
fTESHS HEMORRHAGE ABSCESS, NCS INFLABBATICN, CHROMIC PEFIARTERITIS DiGENERATICN, NOS HYPERPLASIA, INTERSTITIAL CEIL
(UI4) 1 (2X)
2 (5X) 11 (25*) 10 (23X)
(18)
1 (2X)
3 (6X) 13 (27X)
*EPIDIDYMIS STE.VTITIS ISFLAHBATICN, ACOTE INFLAMMATION, CHRONIC NECROSIS, KOS NECROSIS, FAT
(U9)
1
1
(2%)
(2X)
(50) 1 (2X)
1 <2X)
*SCROTIIB NECROSIS, FAT
(U9) (50) 1 (2X)
fERVOUS SYSTEM
ICEREBELLDH (U8) (50) HEMORRHAGE
SPECIAL SENSE ORGANS
*EYE (U9) (50) HEBORFHAGE 3 (6X) SYNECHIA, ANTERIOR 1 (2X) SYNECHIA, POSTERIOR 1 (2X) 2 (!»*) CiTARACT 1 (2X) 2 («*) PHTHISIS 3ULBI 1 (2X)
•EYE/FETINA (K9) (50) INFLAMMATION, CHRONIC 1 (2X) DEGENERATION, NOS 1 (2*) 1) (8X)
MUSCULOSKELETAI SYSTEM
NON£
* NUBBER OF ANIBALS HITH TISSOE EXAHINED BICROSCOPICALLY * NUBBE? OF ANIBALS NECROPSIED
• "~ "*~~~* **-•
LOW DOSE HIGH DOSE
« (8*) 3 (6X)
(19) (19)
1 (2X)
11 (22X) 18 (37X) 19 (39X)
(50) (50) 2 («X)
1 (2X) 1 1 2*)
1 (2X) 1 (2X)
(50) (50)
(49) (50) 1 (2X)
(50) (50)
4 (8X) 1 (2X)
(50) (50)
1 (8X)
73

TABLE C1. MALE RATS: NONNEOPLASTIC LESIONS (CONTINUED)
UNTREATED CONTROL
VEHICLE CONTROL LOW DOSE HIGH DOSE
BODY CAVITIES
• MEDIASTINUM HEMORRHAGE
(19) 1 (2%)
(50) (5C) (50)
• ABDOMINAL CAVITY STEATITIS NBCROSIS, FAT
(49) (50)7 (1U%)
(50) (50)
1 12%)
•MESENTERY STEATITIS I N F L A M M A T I C N .PERIARTERITIS NECROSIS, FAT
CHRONIC
(M9) 1 (2*)
(50) (50)
1 (2*) 2 (K%)
(50) 21 («*) (2X)
ALL OTHER SYSTEMS
NONE
SPECIAL (IOPPHCIOGY SUMBAFY
NO LESION BEPORTED AUTO/NECPCPSY/HISTO PESF ADTOLYSIE/KO NECROPSY
» NUHBER OF ANIMALS HITH TISSOE EXAMINED KICROSCOPICALLY * NUMBER OF BNIMALS NECROPSIED
74
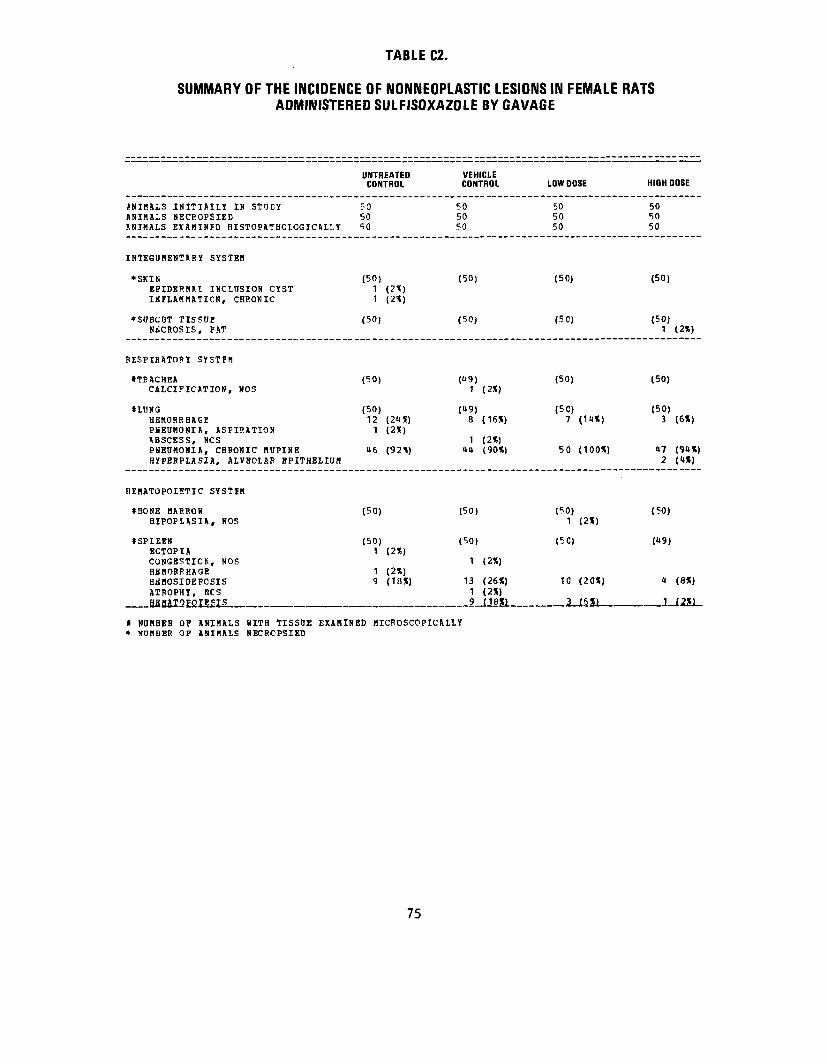
TABLE C2.
SUMMARY OF THE INCIDENCE OF NONNEOPLASTIC LESIONS IN FEMALE RATS ADMINISTERED SULFISOXAZOLE BY GAVAGE
UNTREATED VEHICLE CONTROL CONTROL LOW DOSE
A N I M A L S I N I T I A L L Y IN STIJEY 50 50 50 A N I M A L S N E C R O P S I E D 50 50 50 ANIMALS E X A M I N E D HISTOPATHOLOGICSLLY 50 50 50
I N T E G U M E N T A R Y SYSTEM
*SKI(i (50) (50) (50) E P I D E R M A L INCLUSION CYST 1 (2%) I N F L A M M A T I O N , CHBONIC 1 (2%)
*SOBCOT TISSUE (50) (50) (50) NECROSIS. FAT
R E S P I R A T O R Y S Y S T E M
tTEACHEA (50) ("9) (50) CALCIFICATION, NOS 1 (2%)
t L U N G (50) {»9) <5C) H E M O R R H A G E 12 (2U«) 8 (16%) 7 (14%) P N E U M O N I A , A S P I P A T I O N 1 ( 2 X ) ABSCESS, NCS 1 (2%) P N E U M O N I A , CHRONIC H U P I N E U6 (92%) 44 (90%) 50 (100%) HYPEBPLASIA, ALVEOLA? EPITHELIUM
HEMATOPOIETIC SYSTEM
*BON£ HARROW (50) (50) (50) H Y P O P L A S I A , NOS 1 (2%)
tSPLEEH (50) (50) (50) ECTOPIA 1 (2%) CONGESTICR, NOS 1 (2%) H E M O R R H A G E 1 (2%) HfiMOSIDEEOSIS 9 (18%) 13 (26%) 10 (20%) A T R O P H Y , NCS 1 (2%)
_ ,. ._ HEMATOFOIEEIS 9 (18Si _ _ 3 (6%) _.
I NUMBER OP ANIMALS HITH TISSDE EXAMINED MICROSCOPICALLY * NDHBEB OF ANIHALS NECROPSIED
HIGH DOSE
50 50 50
(50)
(50) 1 (2%)
(50)
(50) 3 (6%)
47 (94%) 2 (4%)
(50)
(49)
4 (8%)
1 (2%)
75
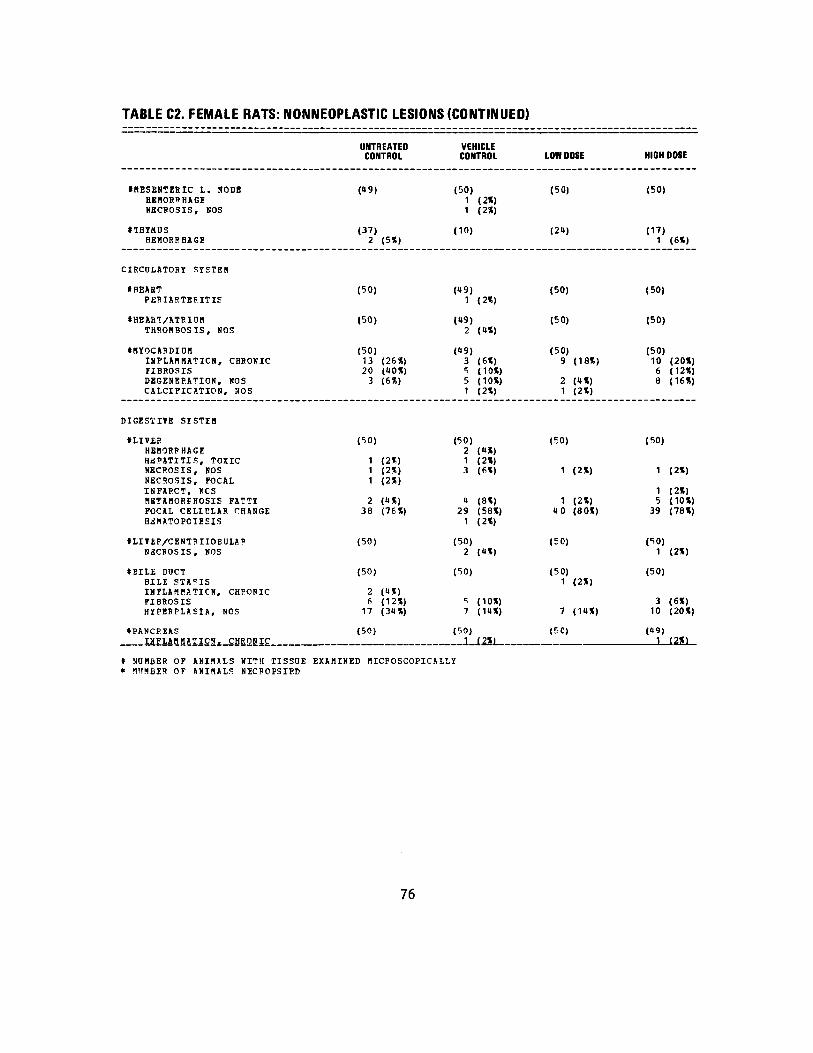
TABLE C2. FEMALE RATS: NONNEOPLASTIC LESIONS (CONTINUED)
IHESENTERIC t. NODE HEHOR1HAGI HECPOSIS, NOS
*THYSUS HEMORRHAGE
CIRCOLATOBI SYSTEM
tHEABT PERIARTBFITIS
*HEAET/ATRIOI1 THROMBOSIS, NOS
•MYOCARDIUM INFLAMMATION, CHRONIC FIBROSIS DEGENERATION, NOS CALCIFICATION, NOS
DIGESTIVE SYSTIM
t LIVER HEMORRHAGE HEPATITIS, TOXIC NECROSIS, KOS NECROSIS, FOCAL INFAPCT, NCS MBTAMORFHOSIS FATTY FOCAL CELLGLAR CHANGE HENATOPOIEEIS
ILIVEF/CENTPIIOBULAR NSCROSIS, NOS
*BILE DOCT BILE STA?IS INFLAMMATICN, CHRONIC FIB30SIS HYPERPLASIA, NOS
*PANCEEAS INFLAMMATION. CHRONIC
* N O M B E R OF ANI f lSLS WITH TISSUE* W'MBES OF A N I M A L S NECPOPSIED
UNTREATED VEHICLE CONTROL CONTROL
(U9) (50) 1 (2*) 1 (2%)
(37) (10) 2 (5%)
(50) (19) 1 (2X)
(50) («9) 2 (a*)
(50) (t9) 13 (26%) 3 (6X) 20 (UOX) 5 (10%) 3 (6*) 5 (10X)
1 (2*)
(50) (50) 2 (««)
1 (2X) 1 (2*) 1 <2t) 3 (6%) 1 <2X)
2 («*) U (8%) 38 (76X) 29 (58%)
1 (2%)
(50) (50) 2 («X)
(50) (50)
2 («*) 6 (12X) 5 (10%) 17 (31%) 7 d«%)
(50) (50) 1 12»i_ _
E X A M I N E D M I C R O S C O P I C A L L Y
76
LOW DOSE
(50)
(2«)
(50)
(50)
(50) 9 (18%)
2 (<*%) 1 (2%)
(50)
1 (2%)
1 (2%) 10 (80%)
(50)
(50) 1 (2%)
7 (11%)
(50)
HIGH DOSE
(50)
(17) 1 (6«)
(50)
(50)
(50) 10 (20%) 6 (12%) 8 (16%)
(50)
1 (2%)
1 (2%) 5 (10%)
39 (78%)
(50) 1 (2%)
(50)
3 (6%) 10 (20%)
(«9) 1 (2*1
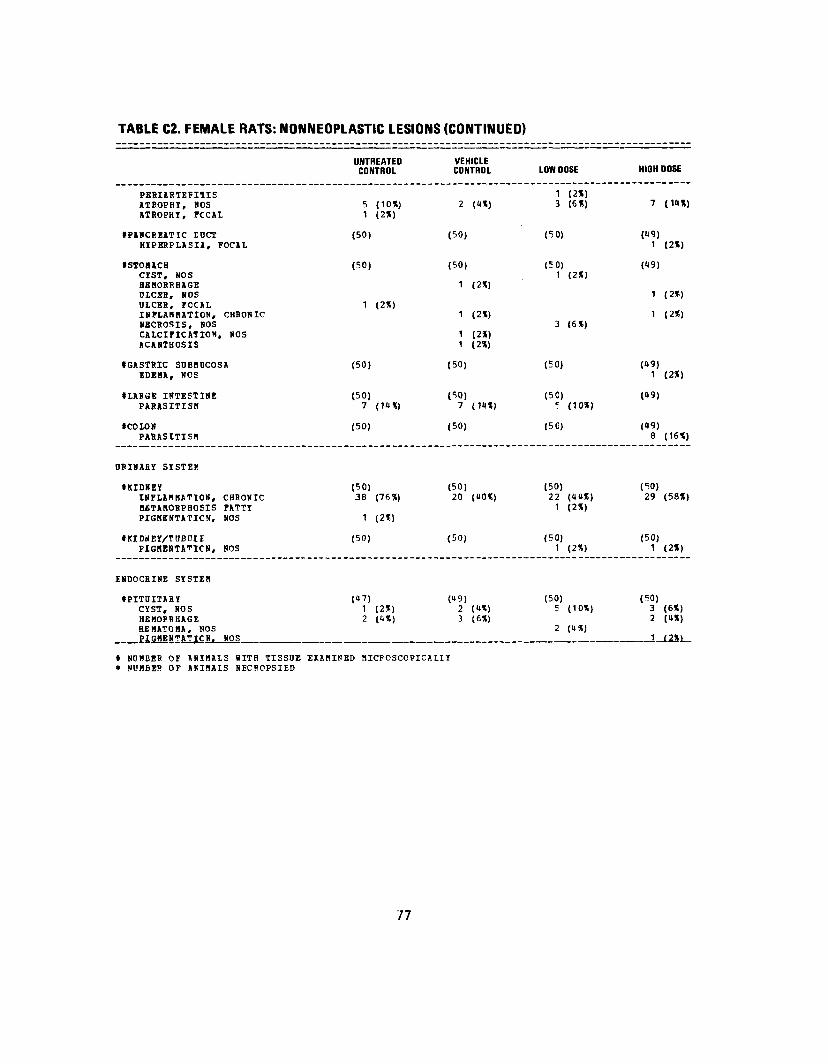
TABLE C2. FEMALE RATS: NONNEOPLASTIC LESIONS (CONTINUED)
PESIARTEFniS ATROPHY, NCS ATROPHY, FCCAL
IPANCREATIC IOCT HYPERPLASIA, FOCAL
ISTOHACH CYST, NOS HEMORRHAGE DICER, NOS ULCER, FOCAL INFLAMMATION, CHRONIC NECROSIS, DOS CALCIFICATION, NOS ACANTHOSIS
IGASTRIC SUBMOCOSA IDEHA, DOS
tLARGE INTESTINE PARASITISM
1 COLON PARASITISM
UBINABY SYSTEK
(KIDNEY INFLAMMATION, CHRONIC METAMORPHOSIS FATTY PI6MENTATICN, NOS
IKIDSEY/TUBDII PIGMENTATION, NOS
ENDOCRINE SYSTEM
«PITDITAHY CYST, NOS HEMORRHAGE HEMATOHA, DOS PIGMENTATION, NOS _
UNTREATED CONTROL
5 (10%) 1 (2X)
(50)
(50)
1 (2%)
(50)
(50) 7 (1U%)
(50)
(50) 38 (76X)
1 (2t)
(50)
(U7) 1 (2*) 2 (»*)
VEHICLE CONTROL
2 (4X)
(50)
(50)
1 (2*)
1 (2%)
1 (2X) 1 (2*)
(50)
(50) 7 (1U%)
(50)
(50) 20 («OX)
(50)
(49) 2 C»%) 3 (6%)
LOW DOSE
1 (2%) 3 (6*)
(50)
(50) 1 (2X)
3 (6»)
(50)
(50) 5 (10%)
(50)
(50) 22 (UU%) 1 (2%)
(50) 1 (2%)
(50) 5 (10%)
2 (U%)
HIGH DOSE
7 (1«X)
(K9) 1 (2%)
(t9>
1 (2*)
1 (2%)
(U9) 1 (2%)
(«9)
(H9) 8 (16%)
(50) 29 (58%)
(50) 1 (2%)
(50) 3 (6%) 2 («%)
1 (2%)
i NUMBER OF ANIMALS UITH TISSUE EXAMINED MICPOSCOPICALLY * NUMBE? OF ASIMALS NECROPSIED
77

TABLE C2. FEMALE RATS: NONNEOPLASTIC LESIONS (CONTINUED) -1 _,. ... 11 __ IT -_r
UNTREATED VEHICLE CONTROL CONTROL
H Y P E R P L A S I A .H Y P B B P L A S I A ,ANGIECTASIS
NOS FOCAL
1a
(2*) (9%)
1 (2*) 5 (10%) 1 (2X)
I A D 5 E N A L (50) C*9) THROMBOSIS , NOS 1 (2X) H E M O R R H A G E 1 (2%) A N G I E C T A S I S 1 (2%)
I A D S B N A L COPTIX (50) (U9) THROMBOSIS , NOS D E G E N E R A T I O N , NOS « <8X) « (8X) ANGIECTASIS 2 (<t%)
fADRENAL HEC01LA (50) (U9) HYPERP1ASIA, NOS •3 (6«)
tTHYFOID («9) (t7) I N F L A M M A T I O N , CHSONIC FIBROSIS H Y P E R P L A S I A , C-CELL
1 (2%) 1 (2*) 3 (6X) 2 («X)
tPANCPEATIC ISLETS (50) (50) H Y P E R P L A S I A , NOS
REPRODUCTIVE SYSTEM
• M A M M A R Y G L A H I (50) (50) GALACTOCELF 2 (»X) 1 < 2 X ) CYST, NOS 9 (18%) 2 («X) CYSTIC DUCTS 7 (1»X) 22 (tttX) I N F L A M M A T I O N , ACOTB 1 (2X) I N F L A M M A T I O N , CHRONIC 1 (2%) H Y P E R P L A S I A , NOS HYPEPPLAEI i , CYSTIC
*PSEPOTIAL GIAND (50) (50) NECROSIS, NOS 1 (21)
*DTEHUS (50) (l»9) H Y D R O M E T R A 1 < 2 X ) 1 (2X) H E M O R R H A G E PYOHETBA
*OTEBOS/ENDC BETE IDM (50) (i»9) _ INFLAMHiTICN, VESICULAR 3 MOSL
I NUMBER OF ANIMALS KITH TISSUE EXAMINED MICROSCOPICALLY * NUMBEP OF ANIMALS NECSOPSIED
LOW DOSE
3 (6X) 1 (8X)
(50)
1 (2X)
(50) 2 («X) 5 (10X)
(50) 3 (6X)
(50)
3 (6X)
(50) 1 (2X)
(50)
22 (K«X)
1 (2X). 2 (UX)
(50)
(«9)1 < 2 X )
C»9)
HIGH DOSE
1 (2X) 3 (6X)
(50)
1 (2X)
(50)
5 (10X)
(50)
(H9)
8 (16X)
l«9)
(50) 3 (6X) 1 <2X)
24 (USX)
(50)
(«8)
1 (2X) 1 (2X)
(«8) „ , . „ , <
78

TABLE C2. FEMALE RATS: NONNEOPLASTIC LESIONS (CONTINUED)
— — • —— —— —— UNTREATED VEHICLE CONTROL CONTROL LOW DOSE
*OVARY/PAROVARIAN (50) (19) (19) NECROSIS, FAT 1 (2*)
tOVA&Y (50) (U9) (19) CYST. NOS 1 (2*) 1 (2X) 3 (6%) PAROVARIAN CYST 1 (2*) HEMORRHAGE 1 (2*)
NERVOUS SYSTEM
i BRAIN (SO) (50) (50) HYDROCEPEA1US, NOS 1 (2%)
tCEHEBELLUM (50) (50) (50) HEMORRHAGE 1 (2«)
SPECIAL SENSE ORGANS
*EYE (50) (50) (50) SYNBCHIA, ANTERIOR 1 (2%) 1 (2%) SYNECHIA, POSTERIOR 1 (2%) CATARACT 1 <2X) 1 (2*) PHTHISIS BDLBI
*EYE/CORNEA (50) (50) (50) INFLAMMATION, CHRONIC 1 (2%)
•EYE/IRIS (50) (50) (50) INFLAMMATION, CHRONIC 1 (2%)
•EYE/FETINA (50) (50) (50) INFLAMMATION, CHRONIC 1 (2%) DEGENERATION, NOS 1 (2%) 1 (2%) U (8%)
HOSCULOSKELETA1 SYSTEM
NONE
EOtY CAVITIES
*ABDOMINAL CAVITY (50) (50) (50) ST.EATITIS ...... 1 (2%>
t NUMBER OF ASIMALS WITH TISSOE EXAMINED MICROSCOPICALIY * BOMBER OF ANIMALS NECSOPSIID
HI6H DOSE
(18,
(<»S)
(50)
(50)
(50)
1 (2*)
(50)
(50)
(50)
1 (2%)
(50) 1 (2%i
79

TABLE C2. FEMALE RATS: NONNEOPLASTIC LESIONS (CONTINUED)
UNTREATED CONTROL
VEHICLE CONTROL LOW DOSE HI8H DOSE
NECROSIS,
•HESHHTBRY NECROSIS,
FAT
TAT
1
(50)
1
(2*)
(2X)
3
(50)
(6*) 2 (»«)
(SO)
1 (2*)
2
(50)
{«*)
ALL OTHER SYSTEMS
HONE
SPECIAL BOBPHC10GI SOBHAPY
AUTO/NECBCESY/HISTO PERF
f N U H B E R OF AHIHALS WITH TISSUE* NPMBER OF AHIHAIS NECRCPSIED
E X X H I N E D MICPOSCOPIC*ILT
80

APPENDIX D
SUMMARY OF THE INCIDENCE OF NONNEOPLASTIC LESIONS
IN MICE ADMINISTERED SULFISOXAZOLE BY GAVAGE
81

82
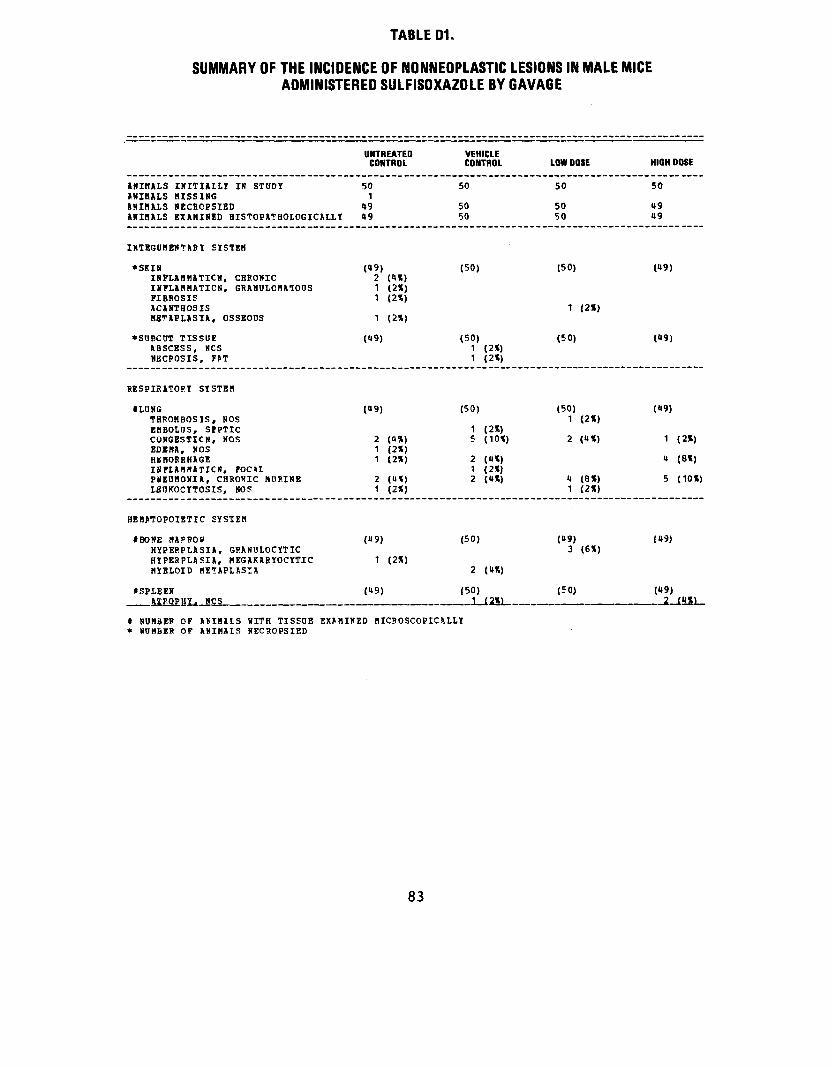
TABLE D1.
SUMMARY OF THE INCIDENCE OF NONNEOPLASTIC LESIONS IN MALE MICE ADMINISTERED SULFISOXAZOLE BY GAVAGE
•" LJ*~ -ir-_-i_J--_ i—' IIP. . ' —
UNTREATED CONTROL
VEHICLE CONTROL LOW DOSE HIGH DOSE
ANIMALS INIT1AILY IN STUDY 1NIBALS HISSING A N I M A L S NECP.CPSIED ANIMALS EXAHINBD HISTOPATHOLOGICALLY
50 1
149 49
50
50 50
50
50 50
50
49 l»9
I N T E G U M E N T A R Y SYSTEM
•SKIS INFLAMMATION, CHRONIC I N F L A M M A T I O N . GP.ANULCMATOUS FIBBOSIS ACANTHOSIS METAPLASIA, OSSEOOS
(49) 2 («*} 1 (2%) 1 (2%)
1 (2*)
(50) (50)
1 (2*)
(<»9)
*SOBCUT TISSUE ABSCESS, NCS NECPOSIS, FfT
(49) (50) 1 (2%) 1 (2*)
(50) C»9)
RESPIRATORY SYSTEM
*LUNG THROMBOSIS, NOS EMBOLHS, SIPTIC CONGESTION, NOS EDEMA, NOS HSMOBBHAGE INFLAMMATICN, FOCAL PNEUMONIA, CHBONIC MORINE LEUKOCYTOSIS, NO?
(49)
2 (4%) 1 (2*) 1 (2*)
2 (4«) 1 <2»)
(50)
1 (2*) 5 (10%)
2 (4*) 1 (2%) 2 (4»)
(50) 1 (2%)
2 (4»)
4 (8%) 1 (2*)
(49)
1 (2%)
4 (8«)
5 (10%)
HEHATOPOIETIC SYSTEM
IBONE MARROW HYPERPLASIA, GRANOLOCYTIC HYPEHPLASIA, MEGAKABYOCYTIC MYELOID METAPLASIA
(49)
1 (2%)
(50)
2 (4«)
("9) 3 (6%)
(49)
tSPLEEN A1F.OPHY€ NCS
(49) .
(50) 1...X2SL-..,- ,.
(50) .. • ,
(49) 2_X*L&I_
t NUMBER* HDH6EB
OF OF
A K I H A L S ANIMALS
WITH TISSDE NEC30PSIED
E X A M I N E D MICROSCOPICALLY
83

TABLE 01. MALE MICE: NONNEOPLASTIC LESIONS (CONTINUED)
UNTP IEATED VEH IICLE CON ITROL CON TROL LOW 01 ISE HIGH IDOSE
LSUKEMCID FEACTION H Y P E R P L A S I A , L Y M P H O I D HEMATOPOIESIS
8 3
(16X) (6X)
1 1 2
(2X)(2X) («*)
1 7
(2X) (10X)
2 3
<«*)(6X)
*CE"VICAL L Y M P H NODE I N F L A M M A T I O N , NOS
(09) (50) 1 (2X)
(50) (09)
*MESENTBPIC L. NODE L Y M P H A N G I E C T A S I S C C N G B S T I C N , NOS I N F L A M M A T I O N , NOS I N F L A M M A T I O N , ACUTE H Y P E R P L A S I A , RETICOLUMHYPE8PLASIA, L Y M P H O I D HfiMATOPOIESIS
CELL
(09) 1 3 3 1 1
13 1
(2X) ( f iX) («X) (2X) (2X)(27X) (2X)
(50)
11
5
(22X)
(10X)
(50)
2 2 1
5 1
(OX) (OX) (2X)
(10X) (2X)
(09)
2
3 1
(0*)
(6X) (2X)
CISCOiATORY SYSTEM
•HEART (89) (50) (50) MINERALIZATION < 2 X ) DILATATION, NOS 1 (2%) 1 (2X) PiRIARTERITIS 1 (2X) METAPLASIA, C5SEODS 1 (2%)
tAOPICUHR A P P E N D A G E (09) (50) (50) T H R O M B O S I S , NCS 1 (2%)
•MYOCARDIUM (50) (50) (09) INFLAMMATION, FOCAL 1 (2X) DEGENERATION, NOS 1 (2X)
•AORTA (09) (50) (50) INFLAMMATION, NOS 1 (2X)
DIGESTIVE S Y S T E M
tLIVEE (tt9) (50) (50) (09) CYST, NOS "HHOHBOSIS, NOS
1 (2*) 2 (OX) 1 (2X)
ABSCESS, NCS 1 (2X)
NECROSIS, KOS INPARCT, NCS
33
(6X) (6»)
1 (2%) 10
(2X) <8X)
AHYLOIDOSIS
* N U M B E R OF A M M A L S HITH TISSUE E X A M I N E D MICROSCOPICALLY * N U M B E R OF A N I M A L S NECRCPSIED
84
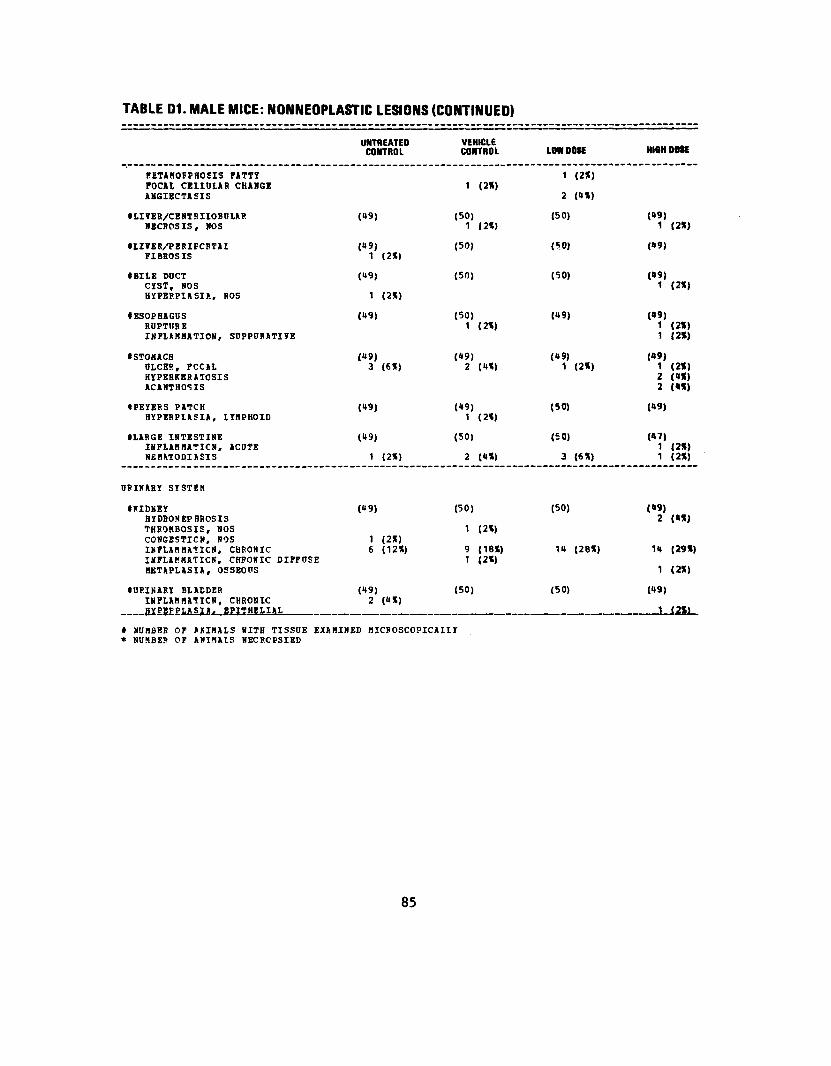
TABLE 01. MALE MICE: NONNEOPLASTIC LESIONS (CONTINUED)
UNTREATED VEHICLE CONTROL CONTROL
KETANOBPHOSIS FATTY FOCAL CELIUIAR CHANGE 1 (2%) AMGIBCTASIS
•LITER/CENTRIIOBOLAR (09) (50) NECROSIS, NOS 1 (2%)
•LITER/PERIPCBTAI (09) (50) FI BROS IS 1 (2%)
• BILE DUCT (09) (50) CYST, NOSHYPEPPIASIA, NOS 1 (2»)
• ESOPHAGUS (09) (50) RUPTURE 1 (2%) INFLAMMATION, SUPPURATIVE
•STOMACH (09) (09) OLCES, FCCAL 3 (6%) 2 (0%) HYPERKERATOSIS AC1NTHOSIS
•PEYERS PATCH (09) (09) HYPERP1ASIA, LYHPHOID 1 (2%)
• LARGE INTESTINE (09) (50) INFLANNATICN. ACUTE NEMATODIASIS 1 (2<) 2 (0%)
DRINABY SYSTEM
• KIDNEY (09) (50) HYDRONEPBROSIS THROMBOSIS, BOS 1 (2%) CONGESTION, ROS 1 (2X) INFLAMMATICN, CHRONIC 6 (12%) 9 (18%) ISFLAKHATICN. CHRONIC DIFFUSE 1 (2%) MKTAPLASIA, OSSEOUS
•URINARY BLADDER (09) (50) INFLAMMATION, CHRONIC 2 (0%) HYPEFPLASIA. EPITHELIAL
* NUMBER OF ANIMALS HITH TISSUE EXAMINED MICROSCOPICA1LY * NUMBE? OF ANIMALS NECRCESIED
85
LOW DOSE
1 (2%)
2 (0%)
(50)
(•50)
(50)
(09) 1 (2%)
(50)
(50)
3 (6%)
(50)
10 (28%)
(50)
., .,_
HIBHDOSE
(09) 1 (2%)
(09)
(09) 1 (2%)
1 (2%) 1 (2%)
(09) 1 (21) 2 (0») 2 («)
(09)
(07) 1 (2%) 1 (2%)
(09) 2 (0%)
10 (29%)
1 (2%)
(09)
1 12»

TABLE 01. MALE MICE: NONNEOPLASTIC LESIONS (CONTINUED)
UNTREATED VEHICLE CONTROL CONTROL
INDOCilNE SYSTEM
•PITUITARY («0) (33) CYST, HOS 2
IADPENAL CONGESTION, NOS
IADRBHAL M E D U L L A (48) (49) H Y P E R P L A S I A , NOS 2 (4«)
tTHYROID (47) (47) HYPEHPLASIA, C-CELL 1 (2»)
REPRODUCTIVE SYSTEM
•PREPUTIAL G I A N D (49) (50) DISTBNTICN
tPROSTATE (49) (50) INFLAHHA^ICN, SUPPORATIVE 1 (2*) INFLAMMATION, ACUTE
•SEMINAL VESICLE (49) (50) DISTENTICS ATROPHY, NCS 1 (2*)
tTESTIS (49) (50) ATROPHY, KCS 2 (4%) HYPOSPERHATOGENESIS
•EPIDIDYMIS (19) (50) S B A N U L O M A , SPEBNATIC
MEHVOUS SYSTEM
NONE
SPECIAL SENSE CRGA8S
*IYE (49) (50) ABSCESS. CHBONIC 1 (2X1
t NUHBER OF ANIMALS RITH TISSUE EXAMINED MICROSCOPICALLY * NDMBEP OF ANIMALS HECROPSIED
86
LOW DOSE
(46)
(49)
(48)
(50)
(50)
1 <2X)
(SO)
1 (2X)
(47) 4 (9«)
(50) 2 (4%)
(50)
HIGH DOSE
(39)
(49)
0»8)
(49) 1 (2X)
(49)
(49) 2 («*)
(48)
1 (2X)
(49) 1 (2%)
(49)

TABLE 01. MALE MICE: NONNEOPLASTIC LESIONS (CONTINUED)
UNTREATEDCONTROL
VEHICLE CONTROL LOW DOSE HIGH DOSE
HOSCULOSKELETAL SYSTEM
NONE
EODY CAVITIES
•HEDIASTINUMI N F L A M M A T I O N , CHBONIC
(49) (50) (50) (19) 2 (4%)
•ABDOMINAL CAVITYNECROSIS, FAT
(49) (50) (50) (49) 1 (2*)
•PERITONEUMI N F L A M H A T I C N , NOS
(49) (50) (50) (49) 1 (2%)
*PLEUBAI N F L A M M A T I O N ,I N F L A M H A T I C N ,
SOPPURATIVE CHFONIC S O P P U R A T I V
(49) (50) 1 (2%)
(50) (49)
1 (2»)
•PERICARDIUMI N F L A M M A T I O N . CHBONIC
(49) (50) (50) (49) 1
ALL OTHEF SYSTIMS
•MULTIPLE ORGANSEMBOIUS, SIPTICLEUKOCYTCSIS, NOSLEDKEMOID PBACTION
(U9) 1 (2X)
1 (2%)
(50) (50)
1 (2%)
(49)
SPECIAL MOFPHCLOGY SDMMABY
N O LESION BEPOBTEDA N I M A L HISSING/NO NECROPSYAUTOLYSIS/NO NECROPSY
1 5 7 8 7
1
I N U M B E R* NUMBER
OF OF
A N I M A L S A N I M A L S
HITH TISSUE E X A M I N E D NECROPSIED
MICROSCOPICALLY
87

TABLE D2.
SUMMARY OF THE INCIDENCE OF NONNEOPLASTIC LESIONSIN FEMALE MICE ADMINISTERED SULFISOXAZOLE BY GAVAGE
UNTREATED CONTROL
VEHICLE CONTROL LOW DOSE HIGH DOSE
IKIHALS INITIAILY IN STOEY INIMALS HISSING JNIHALS HECPCFSIED MIHALS E X A M I N E D HISTOPATHO LOGICALLY
50
50 50
50 1
U9 49
50
50 50
50
50 50
WEGUMENTASY SYSTEM
NONE
RESPIRATORY SYSTEM
*LUNG CONGESTION, NOS HEMORRHAGE PiiEOMONI*, CHPONIC MURINE PIGMENTATION. NOS ALVEOLAR KACROPHAGES LEUKOCYTGSIS, NOS
(50) 1 (2%)
3 (6X)
1 (2»)
(119) 1 (2X) 0 (8X) a (8%) 1 <2X) 1 (2X)
(50) 1 (2*)
1 (2%)
(50) 2 (»%)
2 («%)
HEMATOPOIETIC SYSTEM
•BONE HARROW riB?0!IS OSTEODYSTROPHY HYPEPPLASIA, GRANOLOCYTIC
(50)
1 (2*)
(«9) (50) 1 (2«)
(50)
ISPLiEN HYPERPLASIA. LYMPHOID HSMATOPCIESIS
(50) 31 (6%) (2X)
(U9) 7 (1ttX)
(50) 5 (10X) 3 (6%)
(50) 1 (2») 2 («»)
ICERVICAL LYMFH NODE HYPERPL1SIA, LYMPHOID
(<»8) (It8) 1 (2X)
(50) (50)
tMESENTEPIC L. NODE INFLAMMATION, NOS HYPERPLASIA, LYMPHOID
(U8)
H (8X)
(«8) 1 (2X) 5 (10%)
(50)
5 (10X)
(50)
« (8»)
IREN1L LYMPH NODE HYPEKPIASIA, IYMPHOID
(18) ,
(«8) -, . „ ..„ _
(50) 1 I2X)
(50)
* N U M B E R* NUNBE5
OF OF
A N I M A L S A N I M A L S
WITH TISSUE NECROPSIED
E X A M I N E D MICROSCOPICALLY
88

TABLE 02. FEMALE MICE: NONNEOPLASTIC LESIONS (CONTINUED)
fTHYMUS HYPEHPLASIJ, LYHPHOID
CIPCHLATORY SYSTEM
» HEART PBRIARTERITIS
DIGESTIVE SYSTEM
•LIViR CONGESTION, NOS H£HORP.HAGE NECROSIS, NOS
tBILE DOCT CYST, NOS
•PANCREAS CYSTIC DtlCTS
iPANCREATIC ACINUS ATBOPHY, NOS
tSTOMACH INFLAMMATION, FOCAL OJ.CER, FCCAL INFLAHHATICN, CHPONIC
IGASTHIC HOCCSA RYPEEPLASIA, FOCAL
IGASTHIC SOBHDCOSA 1DENA. NOS
ILARGE INTESTINE NSHATODIASIS
08INASY SYSTEE
IKIDNET CYST. NOS
UNTREATED CONTROL
(29)
(50) 1 (2«)
(50) 1 (2%) 1 (2*) 1 (2%)
(50)
(50) 3 (6*)
(50) 1 (2%)
(50)
(50)
(50)
C»9) 1 (2%)
(50) 1 12%)
VEHICLE CONTROL
(29) 1 (3X)
(U9)
(49)
(U9)
(19) 3 (6%)
(U9) 1 (2X)
(U9)
2 (1%) 1 (2%)
(U9)
(U9)
(U9)
(19)
LOW DOSE
(21)
(50)
(50)
1 (2X)
(50) 1 (2«)
(50) « (8X)
(50)
(19)
1 (2»)
(19) 1 (2«)
(«9) 1 (2%)
(50) 1 (2%)
(50)
HIGH DOSE
(20)
(50)
(50)
(50) 1 (2%)
(50)
(50) 1 (2%)
(50) 1 (2%) 1 (2X)
(50)
(50)
(50) 1 (2X)
(50)
* NUMBER OF ANIHALS KITH TISSUE EXAMINED MICBOSCOPICALLY » HDHBER OF ANIMALS NECPCPSIED
89

TABLE 02. FEMALE MICE: NONNEOPLASTIC LESIONS (CONTINUED)
UNTREATED VEHICLE CONTROL CONTROL
PYELONEPHRITIS, NOS INFLAHHATICN, CHPONIC 5 (10*) PtfRIARTEBITIS GLOHHSULOfCLBBOSIS.AMYLOIDOSIS
ROS 1 (2*) 1 (2X) 1 (2«)
METAPLASIA. OSSEOUS
tKIDMEY/TUBOLE (50) (49)PIGHBNTATICN, NOS
tORINARY ELIEDER (49) (48)AHYLOIDOSIS 1 (2*)
ERDOCEIHE SYSTEN
•ADRENAL CORTIX (50) (48)DEGENERATION, ROS HYPERTROPHY, NOS
tTHYBOID (49) CYSTIC F011ICLBS 1 (2*) I N F L A M M A T I O N , CHRONIC 1 (2*) HYPBRPLASIA. FOLLICULAR-CBLL 1 (2X)
{••PRODUCTIVE SYSTEM
•MAMMARY GLAMI (50) METAPLASIA, SQOAHOUS 1 (2X)
IDTBRUS (50) (49) HYDROMETRA 1 (2%) THROMBOSIS, ROS ANGIECTASIS 1 (2*)
IUTB1US/BNDC HETBI0n (50) (49) INFLAMMATION, SUPPOBATIVE HYPBRPLASIA, CYSTIC 41 (82*) 45 (921)
tOTARY (50) (49) CYSTIC FOIIICLBS POLLICDLAP CYST, ROS 4 (8*) PAROTARIAN CYST 7 (14X) 9 (18X) HSHORHHAGIC CYST
I ROHBBR OF AHIHALS WITH TISSOE EXAMINED MICROSCOPICALLY * NUMBER OF ANIMALS NECRCPSIED
90
LOW DOSE
1 (2*) 3 (6*)
(50) 1 (2X)
(49)
(49)
(48)
(50)
(50)
1 (2X)
(50)
42 (84X)
(50)
4 (8X) 5 (10X) 1 IU*1
HI6H DOSE
1 (2()
1 (2»)
(50)
(50)
(50) 1 (2*)
(46)
(50)
(50) 1 (2*)
(50)
44 (88X)
(50)
8 (16*) 11 (22*) 1 (2«)

TABLE 02. FEMALE MICE: NONNEOPLASTIC LESIONS (CONTINUED) — . > '
UNTREATEDCONTROL
VEHICLE CONTROL LOW DOSE HIGH DOSE
I N F L A H H A T I C N , NOS
f RIGHT OTABT PAROTARIAN CYST THROMBOSIS, NOS
ILEFI OTARI THRONBOS, ORGANIZED HKMOPHHAGIC CYST
1 (2%)
(50)
1 (2%)
(50)1 (2*)
(«9)
(U9)
(50) 1 (2V)
(50)
1 (2%)
(50)
(50)
NIRVOUS SYSTEH
tBFAIN COMPRESSION HSHATOfOIBSIS
(50) (U8) (50) 1 (2%) 1 (2*)
(50)
SPECIAL SENSE ORGANS
•EYE INFLAHHATICN, NOS PHTHISIS EtlLBI
(50) (K9) 1 (2%) 1 (2»)
(50) (50)
MQSCQLOSKBLETAI SYSTEM
• SKELETAL MOSCLEPARASITISM
(50) 1 (2%)
(19) (50) (50)
BODY CAVITIES
• PERITONEUMINFLAMMATION, NOS
(50) 2 («*)
(49) (50) (50)
ALL OTHER SYSTEMS
NONE
SPECIAL MORPHOLOGY SUMMARY
NO LESION FEEOBTED ] 2 1—
* NOHBEB OF A1IHALS ilTH TISSOE EXAMINED HICPOSCOPICALtY * ROBBER OF ANIMALS NECRCPSIED
91

TABLE 02. FEMALE MICE: NONNEOPLASTIC LESIONS (CONTINUED)
UNTREATED VEHICLE CONTROL CONTROL LOW DOSE HIGH DOSE
AHIBAL HISSING/NO NECROPSY
* NOHBBH OF ANIMALS ilTH TISSDE EXAMINED MICROSCOPICALLY * NUMBER OF ANIMALS NECPOPSIED
92

APPENDIX E
ANALYSES OF THE INCIDENCE OF PRIMARY TUMORS
IN RATS ADMINISTERED SULFISOXAZOLE BY GAVAGE
93

94

Table El. Analyses of the Incidence of Primary Tumors in Male Rats Administered Sulfisoxazole by Gavage (a)
Vehicle Low Topography; Morphology Control Dose
Integumentary System: Fibroma of the Subcutaneous Tissue (b) 1/50 (2) 6/50 (12)
P Values (c,d) N.S. N.S.
Departure from Linear Trend (e) P = 0.026
Relative Risk (f) 6.000 vo Lower Limit 0.768
Upper Limit 269.891
Weeks to First Observed Tumor 106 96
Hematopoietic System: Monocytic Leukemia (b) 9/50 (18) 6/50 (12)
P Values (c,d) N.S. N.S.
Relative Risk (f) 0.667 Lower Limit 0.211 Upper Limit 1.935
Weeks to First Observed Tumor 96 101
High Dose
2/50 (4)
N.S.
2.000 0.108
115.621
85
8/50 (16)
N.S.
0.889 0.325 2.382
91

Table El. Analyses of the Incidence of Primary Tumors in Male Rats Administered Sulfisoxazole by Gavage (a)
(continued)
Topography; Morphology
Hemato pole tic System: All Lymphoma or Leukemia (b)
P Values (c,d)
Relative Risk (f) Lower Limit Upper Limit
Weeks to First Observed Tumor
VO
Liver: Hepatocellular Carcinoma or Neoplastic Nodule (b)
P Values (c,d)
Relative Risk (f) Lower Limit Upper Limit
Weeks to First Observed Tumor
Vehicle Control
11/50 (20)
N.S.
96
1/50 (2)
N.S.
106
Low Dose
7/50 (14)
N.S.
0.636 0.228 1.645
101
4/50 (8)
N.S.
4.000 0.415
192.805
106
High Dose
10/50 (20)
N.S.
0.909 0.381 2.140
88
2/50 (4)
N.S.
2.000 0.108
115.621
105
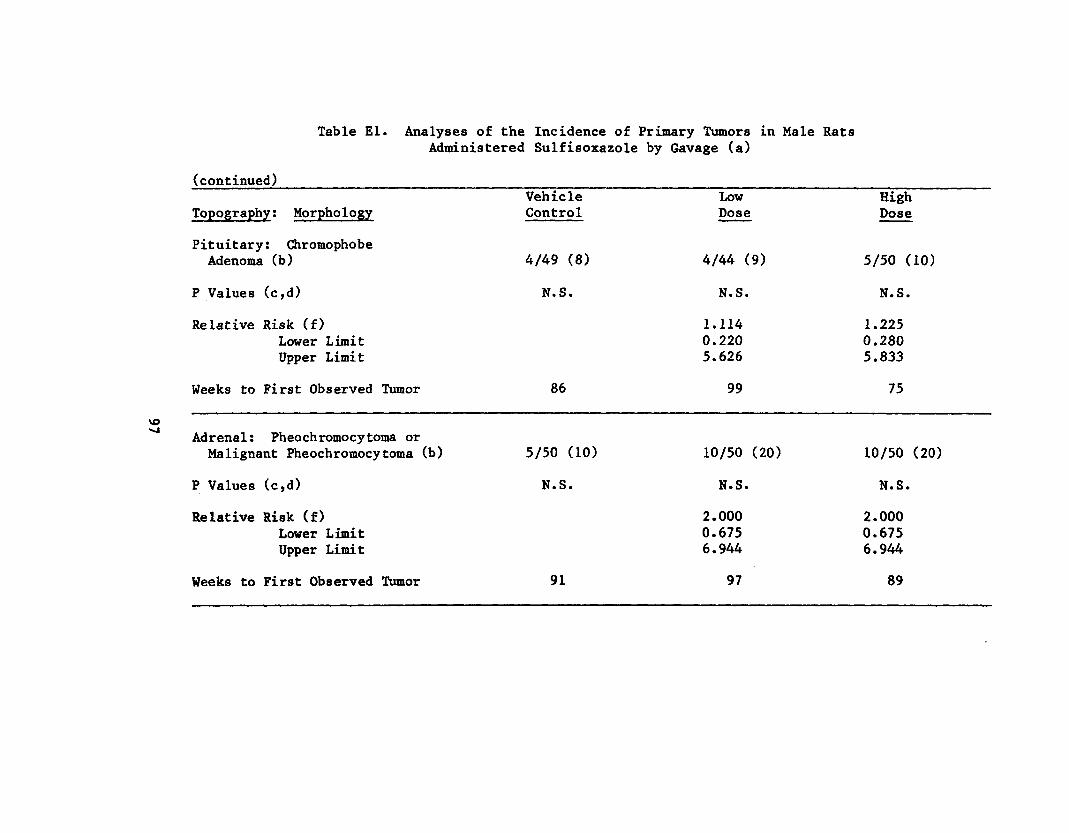
Table El. Analyses of the Incidence of Primary Tumors in Male Rats Administered Sulfisoxazole by Gavage (a)
(continued)
Topography: MorphologyVehicle
Control Low Dose
High Dose
Pituitary: Chromophobe Adenoma (b) 4/49 (8) 4/44 (9) 5/50 (10)
P Values (c,d) N.S. N.S. N.S.
Relative Risk (f) Lower Limit Upper Limit
1.114 0.220 5.626
1.225 0.280 5.833
Weeks to First Observed Tumor 86 99 75
vo Adrenal: Pheochromocy toma or Malignant Pheochromocy toma (b) 5/50 (10) 10/50 (20) 10/50 (20)
P Values (c,d) N.S. N.S. N.S.
Relative Risk (f) Lower Limit Upper Limit
2.000 0.675 6.944
2.000 0.675 6.944
Weeks to First Observed Tumor 91 97 89

Table El. Analyses of the Incidence of Primary Tumors in Male Rats Administered Sulfisoxazole by Gavage (a)
(continued) Vehicle Low
Topography; Morphology Control Dose
Preputial Gland: Carcinoma, NOS (b) 2/50 (4) 4/50 (8)
P Values (c,d) N.S. N.S.
Relative Risk (f) * .000 Lower Limit 0.301 Upper Limit 21.316
Weeks to First Observed Tumor 106 103
VO Testis: Interstitial-cell 00
Tumor (b) 45/48 (94) 43/49 (88)
P Values (c,d) N.S. N.S.
Relative Risk (f) 0.936 Lower Limit 0.843 Upper Limit 1.082
Weeks to First Observed Tumor 87 85
High Dose
3/50 (6)
N.S.
1.500 0.180 17.329
105
46/49 (94)
N.S.
1.001 0.907 1.106
66

Table El. Analyses of the Incidence of Primary Tumors in Male Rats Administered Sulfisoxazole by Gavage (a)
(continued)
(a) Dosed groups received 100 or 400 rag/kg.
(b) Number of tumor-bearing animals/number of animals examined at site (percent).
(c) Beneath the incidence of tumors in the vehicle-control group is the probability level for the Cochran-Armitage test when P is less than 0.05; otherwise, not significant (N.S.) is indicated. Beneath the incidence of tumors in a dosed group is the probability level for the Fisher exact test for the comparison of that dosed group with the vehicle-control group when P is less than 0.05; otherwise, not significant (N.S.) is indicated.
(d) A negative trend (N) indicates a lower incidence in a dosed group than in the vehicle-control group.
vo (e) The probability level for departure from linear trend is given when P is less than 0.05 for any comparison.
(f) The 95% confidence interval of the relative risk between each dosed group and the vehicle-control group.

Table E2.
Topography: Morphology
Hematopoietic System: Monocytic Leukemia (b)
P Values (c,d)
Relative Risk (f) Lower Limit Upper Limit
o o Weeks to First Observed Tumor
Hematopoietic System: Malignant Lymphocytic Lymphoma or Monocytic Leukemia (b)
P Values (c,d)
Relative Risk (f) Lower Limit Upper Limit
Weeks to First Observed Tumor
Analyses of the Incidence of Primary Tumors in Female Rats Administered Sulfisoxazole by Gavage (a)
High Dose
9/50 (18)
N.S.
3.000 0.803 16.338
91
9/50 (18)
N.S.
2.250 0.676 9.394
91
Vehicle Control
3/50 (6)
P = 0.016
98
4/50 (8)
P = 0.033
98
Low Dose
3/50 (6)
N.S.
1.000 0.140 7.133
106
3/50 (6)
N.S.
0.750 0.115 4.206
106

Table E2. Analyses of the Incidence of Primary Tumors in Female Rats Administered Sulfisoxazole by Gavage (a)
(continued)
Topography! Morphology
Hematopoietic System: All Lymphoma or Leukemia (b)
P Values (c,d)
Relative Risk (f) Lower Limit Upper Limit
Weeks to First Observed Tumor
Pituitary: Chromophobe Adenoma (b)
P Values (c,d)
Relative Risk (f) Lower Limit Upper Limit
Weeks to First Observed Tumor
Veh ic leControl
6/50 (12)
N.S.
98
18/49 (37)
N.S.
75
Low High Dose Dose
3/50 (6) 9/50 (18)
N.S. N.S.
0.500 1.500 0.085 0.517 2.200 4.749
106 91
19/50 (38) 17/50 (34)
N.S. N.S.
1.034 0.926 0.590 0.513 1.821 1.667
77 77

Table E2. Analyses of the Incidence of Primary Tumors in Female Rats Administered Sulfisoxazole by Gavage (a)
(continued)
Vehicle Low High Topography: Morphology Control Dose Dose
Mammary Gland: Fibroadenoma (b) 12/50 (24) 16/50 (33) 15/50 (30)
P Values (c,d) N.S. N.S. N.S.
Relative Risk (f) 1.333 1.250 Lower Limit 0.663 0.611 Upper Limit 2.754 2.615
Weeks to First Observed Tumor 88 99 103
o Preputial Gland: Carcinoma, NOS (b) 3/50 (6) 0/50 (0) 1/50 (2) 10
P Values (c,d) N.S. N.S. N.S.
Relative Risk (f) 0.000 0.333 Lower Limit 0.000 0.006 Upper Limit 1.663 3.983
Weeks to First Observed Tumor 94 106
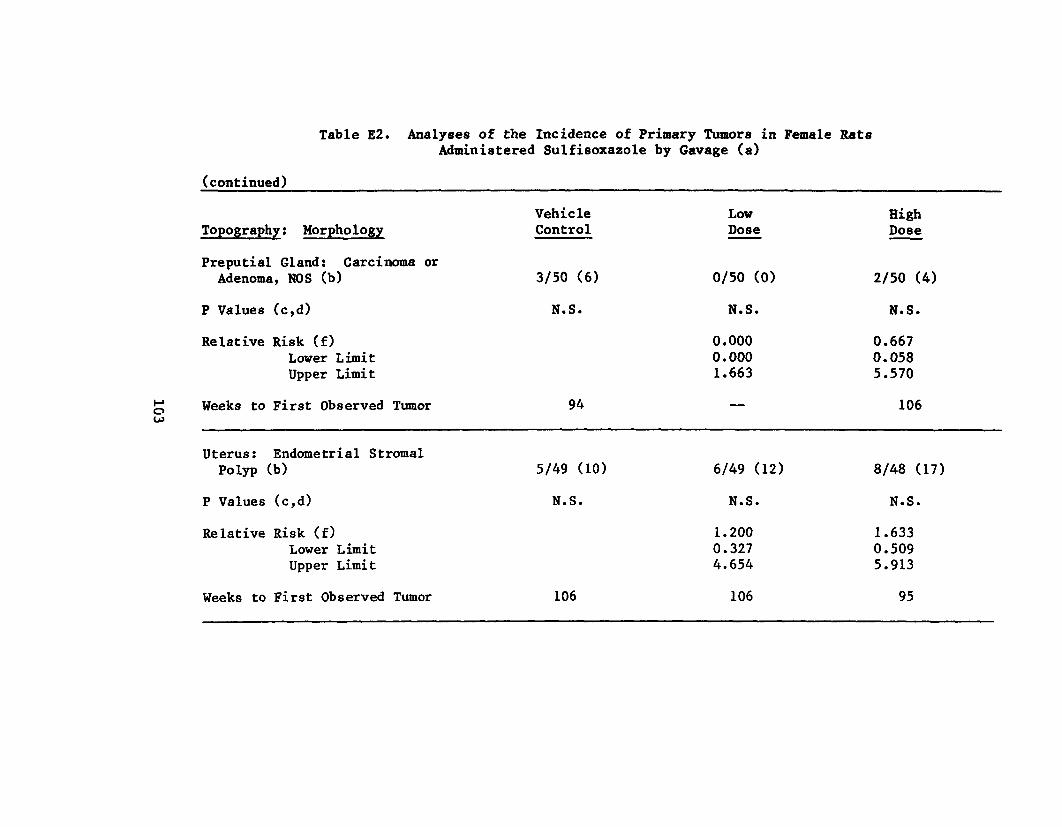
Table E2. Analyses of the Incidence of Primary Tumors in Female Rats Administered Sulfisoxazole by Gavage (a)
(continued)
Vehicle Low Topjography Morphology Control Dose
Preputial Gland: Carcinoma or Adenoma, NOS (b) 3/50 (6) 0/50 (0)
P Values (c,d) N.S. N.S.
Relative Risk (f) 0.000 Lower Limit 0.000 Upper Limit 1.663
Weeks to First Observed Tumor 94 o CO —
Uterus: Endometrial Stromal Polyp (b) 5/49 (10) 6/49 (12)
P Values (c,d) N.S. N.S.
Relative Risk (f) 1.200 Lower Limit 0.327 Upper Limit 4.654
Weeks to First Observed Tumor 106 106
High Dose
2/50 (4)
N.S.
0.667 0.058 5.570
106
8/48 (17)
N.S.
1.633 0.509 5.913
95

Table E2. Analyses of the Incidence of Primary Tumors in Female Rats Administered Sulfisoxazole by Gavage (a)
(continued)
(a) Dosed groups received 100 or 400 mg/kg.
(b) Number of tumor-bearing animals/number of animals examined at site (percent).
(c) Beneath the incidence of tumors in the vehicle-control group is the probability level for the Cochran-Armitage test when P is less than 0.05; otherwise, not significant (N.S.) is indicated. Beneath the incidence of tumors in a dosed group is the probability level for the Fisher exact test for the comparison of that dosed group with the vehicle-control group when P is less than 0.05; otherwise, not significant (N.S.) is indicated.
(d) A negative trend (N) indicates a lower incidence in a dosed group than in the vehicle-control group.
(e) The probability level for departure from linear trend is given when P is less than 0.05 for any comparison.
(f) The 95% confidence interval of the relative risk between each dosed group and the vehicle-control group.

APPENDIX F
ANALYSES OF THE INCIDENCE OF PRIMARY TUMORS
IN MICE ADMINISTERED SULFISOXAZOLE BY GAVAGE
105

106

Table Fl. Analyses of the Incidence of Primary Tumors in Male Mice Administered Sulfisoxazole by Gavage (a)
Topography; Morphology
Integumentary System: Fibro sarcoma of the Subcutaneous Tissue (b)
P Values (c,d)
Relative Risk (f) Lower Limit Upper Limit
Weeks to First Observed Tumor
Lung: Alveolar/Bronchiolar Adenoma or Carcinoma (b)
P Values (c,d)
Relative Risk (f) Lower Limit Upper Limit
Weeks to First Observed Tumor
VehicleControl
4/50 (8)
N.S.
100
4/50 (8)
P = 0.029 (N)
73
Low High Dose Dose
5/50 (10) 3/49 (6)
N.S. N.S.
1.250 0.765 0.286 0.118 5.954 4.288
80 92
5/50 (10) 0/49 (0)
N.S. N.S.
1.250 0.000 0.286 0.000 5.954 1.100
104

Table Fl. Analyses of the Incidence of Primary Tumors in Male Mice Administered Sulfisoxazole by Gavage (a)
(continued)
Topography: MorphologyVehicle
Control Low Dose
High Dose
Hematopoietic System: All Lymphoma (b) 3/50 (6) 8/50 (16) 5/49 (10)
P Values (c,d) N.S. N.S. N.S.
Relative Risk (f) Lower Limit Upper Limit
2.667 0.685 14.816
1.701 0.351 10.426
o oo Weeks to First Observed Tumor 90 77 104
Hematopoietic System: All Lymphoma or Leukemia (b) 4/50 (8) 8/50 (16) 5/49 (10)
P Values (c,d) N.S. N.S. N.S.
Relative Risk (f) Lower Limit Upper Limit
2.000 0.576 8.539
1.276 0.292 6.070
Weeks to First Observed Tumor 89 77 104

Table Fl. Analyses of the Incidence of Primary Tumors in Male Mice Administered Sulfisoxazole by Gavage (a)
(continued)
Topography: Morphology
All Sites: Hemangios arcoma (b)
P Values (c,d)
Relative Risk (f) Lower Limit Upper Limit
o Weeks to First Observed TumorNO
All Sites: Hemangios arcoma or Hemangioma (b)
P Values (c,d)
Relative Risk (f) Lower Limit Upper Limit
Weeks to First Observed Tumor
Vehicle Control
5/50 (10)
N.S.
63
5/50 (10)
N.S.
63
Low Dose
1/50 (2)
N.S.
0.200 0.004 1.699
100
2/50 (4)
N.S.
0.400 0.040 2.313
100
High Dose
3/49 (6)
N.S.
0.612 0.100 2.967
63
3/49 (6)
N.S.
0.612 0.100 2.967
63

Table Fl. Analyses of the Incidence of Primary Tumors in Male Mice Administered Sulfisoxazole by Gavage (a)
(continued)
Topography ; Morphology
Liver: Hepatocellular Carcinoma (b)
P Values (c,d)
Relative Risk (f) Lower Limit Upper Limit
Weeks to First Observed Tumor
Liver: Hepatocellular Carcinoma or Adenoma (b)
P Values (c,d)
Relative Risk (f) Lower Limit Upper Limit
Weeks to First Observed Tumor
Vehicle Low High Control Dose Dose
15/50 (30) 13/50 (26) 20/49 (41)
N.S. N.S. N.S.
0.867 1.361 0.426 0.755 1.741 2.493
100 93 71
15/50 (30) 13/50 (26) 21/49 (43)
N.S. N.S. N.S.
0.867 1.429 0.426 0.802 1.741 2.592
100 93 71

Table Fl. Analyses of the Incidence of Primary Tumors in Male Mice Administered Sulfisoxazole by Gavage (a)
(continued)
Topography; Morphology Vehicle Control
Low Dose
High Dose
Adrenal: Pheochromocytoma 2/49 (4) 5/49 (10) 0/49 (0)
P Values (c,d) N.S. N.S. N.S.
Relative Risk (f) Lower Limit Upper Limit
2.500 0.433 25.265
0.000 0.000 3.379
Weeks to First Observed Tumor 104 93 —
(a) Dosed groups received 500 or 2,000 mg/kg.
(b) Number of tumor-bearing animals/number of animals examined at site (percent).
(c) Beneath the incidence of tumors in the vehicle-control group is the probability level for the Cochran-Armitage test when P is less than 0.05; otherwise, not significant (N.S.) is indicated. Beneath the incidence of tumors in a dosed group is the probability level for the Fisher exact test for the comparison of that dosed group with the vehicle-control group when P is less than 0.05; otherwise, not significant (N.S.) is indicated.
(d) A negative trend (N) indicates a lower incidence in a dosed group than in the vehicle-control group.
(e) The probability level for departure from linear trend is given when P is less than 0.05 for any comparison.
(f) The 95% confidence interval of the relative risk between each dosed group and the vehicle-control group.

Table F2. Analyses of the Incidence of Primary Tumors in Female Mice Administered Sulfisoxazole by Gavage (a)
Vehicle Low High Topography; Morphology Control Dose Dose
Lung: Alveolar /Bronchiolar Adenoma or Carcinoma (b) 0/49 (0) 1/50 (2) 5/50 (10)
P Values (c,d) P = 0.006 N.S. P = 0.030
Relative Risk (f) Infinite Infinite Lower Limit 0.053 1.237 Upper Limit Infinite Infinite
Weeks to First Observed Tumor 105 96
Hematopoietic System:Lymphoma (b)
All 16/49 (33) 16/50 (32) 20/50 (40)
P Values (c,d) N.S. N.S. N.S.
Relative Risk (f) Lower Limit Upper Limit
0.980 0.521 1.847
1.225 0.690 2.205
Weeks to First Observed Tumor 77 73 71
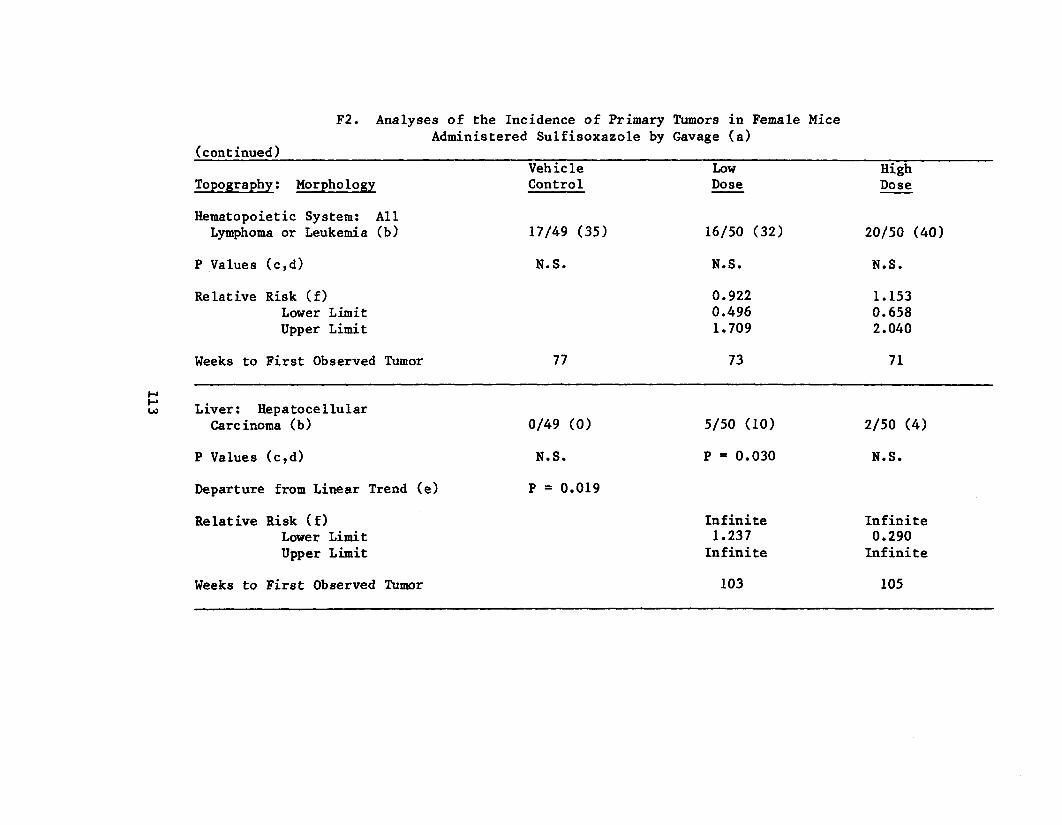
F2. Analyses of the Incidence of Primary Tumors in Female Mice Administered Sulfisoxazole by Gavage (a)
(continued)
Topography: Morphology
Hematopoietic System: All Lymphoma or Leukemia (b)
P Values (c,d)
Relative Risk (f) Lower Limit Upper Limit
Weeks to First Observed Tumor
Liver: Hepatocellular Carcinoma (b)
P Values (c,d)
Departure from Linear Trend (e)
Relative Risk (f) Lower Limit Upper Limit
Weeks to First Observed Tumor
Vehicle Control
17/49 (35)
N.S.
77
0/49 (0)
N.S.
P = 0.019
Low Dose
16/50 (32)
N.S.
0.922 0.496 1.709
73
5/50 (10)
P = 0.030
Infinite 1.237 Infinite
103
High Dose
20/50 (40)
N.S.
1.153 0.658 2.040
71
2/50 (4)
N.S.
Infinite 0.290 Infinite
105

Table F2. Analyses of the Incidence of Primary Tumors in Female Mice Administered Sulfisoxazole by Gavage (a)
(continued)
Topography: Morphology
Pituitary: Chromophobe Adenoma (b)
P Values (c,d)
Relative Risk (f) Lower Limit Upper Limit
Weeks to First Observed Tumor
Mammary Gland: Adenocarc inoma, NOS (b)
P Values (c,d)
Relative Risk (f) Lower Limit Upper Limit
Weeks to First Observed Tumor
Vehicle Control
2/42 (5)
N.S.
104
5/49 (10)
P = 0.018 (N)
104
Low Dose
1/44 (2)
N.S.
0.477 0.008 8.824
105
1/50 (2)
N.S.
0.196 0.004 1.665
105
High Dose
1/31 (3)
N.S.
0.677 0.012 12.354
105
0/50 (0)
P = 0.027 (N)
0.000 0.000 0.777

Table F2. Analyses of the Incidence of Primary Tumors in Female Mice Administered Sulfisoxazole by Gavage (a)
(continued) Vehicle Low High
Topography; Morphology Control Dose Dose
All Sites: Hetnangioma or Hemangiosarcoma (b) 2/49 (4) 4/50 (8) 1/50 (2)
P Values (c,d) N.S. N.S. N.S.
Relative Risk (f) 1.960 0.490 Lower Limit 0.296 0.008 Upper Limit 20.886 9.103
Weeks to First Observed Tumor 104 105 105
(a) Dosed groups received 500 or 2,000 mg/kg.
(b) Number of tumor-bearing animals/number of animals examined at site (percent).
(c) Beneath the incidence of tumors in the vehicle-control group is the probability level for the Cochran-Armitage test when P is less than 0.05; otherwise, not significant (N.S.) is the indicated. Beneath the incidence of tumors in a dosed group is the probability level for the Fisher exact test for the comparison of that dosed group with the vehicle-control group when P less than 0.05; otherwise, not significant (N.S.) is indicated.
(d) A negative trend (N) indicates a lower incidence in a dosed group than in the vehicle-control group.
(e) The probability level for departure from linear trend is given when P is less than 0.05 for any comparison.
(f) The 95% confidence interval of the relative risk between each dosed group and the vehicle-control group.

116

Review of the Bioassay of Sulfisoxazole* for Carcinogenicity by the Data Evaluation/Risk Assessment Subgroup of the
Clearinghouse on Environmental Carcinogens
August 31, 1978
The Clearinghouse on Environmental Carcinogens was established in May, 1976, in compliance with DHEW Committee Regulations and the Provisions of the Federal Advisory Committee Act. The purpose of the Clearinghouse is to advise the Director of the National Cancer Institute (NCI) on its bioassay program to identify and to evaluate chemical carcinogens in the environment to which humans may be exposed. The members of the Clearinghouse have been drawn from academia, industry, organized labor, public interest groups, State health officials, and quasi-public health and research organizations. Members have been selected on the basis of their experience in carcinogenesis or related fields and, collectively, provide expertise in chemistry, biochemistry, biostatistics, toxicology, pathology, and epidemiology. Representatives of various Governmental agencies participate as ad hoc members. The Data Evaluation/Risk Assessment Subgroup of the Clearinghouse is charged with the responsibility of providing a peer review of reports prepared on NCI-sponsored bioassays of chemicals studied for carcinogenicity. It is in this context that the below critique is given on the bioassay of Sulfisoxazole for carcinogenicity.
The primary reviewer noted that Sulfisoxazole is a widely used antibiotic for urinary tract infections. She agreed with the conclusion in the report that Sulfisoxazole was not carcinogenic, under the conditions of test. She briefly described the experimental design and noted the absence of any unusual highlights in the conduct or results of the study. The primary reviewer remarked on the lack of toxicity displayed in treated rats and mice, suggesting that maximum tolerated doses may not have been achieved.
The secondary reviewer agreed with the conclusion in the report that Sulfisoxazole was not carcinogenic, under the conditions of test. Although the study was adequately conducted, he noted the four-fold difference in dose levels, in both treated rats and mice. He commented on the increased incidence of lung tumors in treated female mice, which appeared to be dose-related, and the negative association for these tumors among treated male rats. The secondary reviewer concluded that the study was a valid test for the carcinogenicity of Sulfisoxazole and that the compound would not appear to pose a risk to humans.
A motion was approved unanimously that the report on the bioassay of Sulfisoxazole be accepted as written.
117

Members present were;
Arnold Brown (Chairman), University of Wisconsin Medical School Joseph Highland, Environmental Defense Fund Michael Shimkin, University of California at San Diego Louise Strong, University of Texas Health Sciences Center (Kenneth Wilcox, Michigan State Health Department, submitted a written review)
Subsequent to this review, changes may have been made in the bioassay report either as a result of the review or other reasons. Thus, certain comments and criticisms reflected in the review may no longer be appropriate.
•6U.S. GOVERNMENT PRINTING OFFICE: 1978 381 217 3 2 6 5
118


HEW Publication No. (NIH) 79-1303