


![Applied Surface Science - jnu.edu.cn · 2019. 10. 9. · degradation of 2,4-Dichlorophenol (2,4-DCP) under ultraviolet light irradiation [32–34]. However, its absorption photon](https://static.fdocuments.in/doc/165x107/60fdcb346af8d07b3d64b3a0/applied-surface-science-jnueducn-2019-10-9-degradation-of-24-dichlorophenol.jpg)

Languages
Pages
Legal

NATIONAL TOXICOLOGY PROGRAM Technical Report Series No. 353
t
TOXICOLOGY AND CARCINOGENESIS
STUDIES OF
2,4=DICHLOROPHENOL
(CAS NO. 120-83-2)
IN F344/N RATS AND B6C3F1 MICE
(FEED STUDIES)
U.S. DEPARTMENT OF HEALTH AND HUMAN SERVICES Public Health Service
National Institutes of Health


NTP TECHNICAL REPORT
ON THE
TOXICOLOGY AND CARCINOGENESIS
STUDIES OF 2,4=DICHLOROPHENOL
(CAS NO. 120-83-2)
IN F344/N RATS AND B6C3F1 MICE
(FEED STUDIES)
R. Melnick, Ph.D., Chemical Manager
NATIONAL TOXICOLOGY PROGRAM P.O. Box 12233
Research Triangle Park, NC 27709
June 1989
NTP TR 353
NIH Publication No. 89-2808
U.S. DEPARTMENT OF HEALTH AND HUMAN SERVICES Public Health Service
National Institutes of Health
C0NT E NT S PAGE
ABSTRACT . . . . . . . . . . . . . . . . . . . . . . . . . . . . . . . . . . . . . . . . . . . . . . . . . . . . . . . . . . . . . . . . 3
EXPLANATION O F LEVELS O F EVIDENCE O F CARCINOGENIC ACTIVITY . . . . . . . . . . . . . . . . . . 5
CONTRIElUTORS . . . . . . . . . . . . . . . . . . . . . . . . . . . . . . . . . . . . . . . . . . . . . . . . . . . . . . . . . . . . 6
P E E R RElVIEWPANEL . . . . . . . . . . . . . . . . . . . . . . . . . . . . . . . . . . . . . . . . . . . . . . . . . . . . . . . . 7
SCMMARY O F P E E R REVIEW COMMENTS . . . . . . . . . . . . . . . . . . . . . . . . . . . . . . . . . . . . . . . . . 8
I . INTRODCCTION . . . . . . . . . . . . . . . . . . . . . . . . . . . . . . . . . . . . . . . . . . . . . . . . . . . . . . . . 9
I1. MATERIALS AND METHODS . . . . . . . . . . . . . . . . . . . . . . . . . . . . . . . . . . . . . . . . . . . . . . 15
III . RESULTS . . . . . . . . . . . . . . . . . . . . . . . . . . . . . . . . . . . . . . . . . . . . . . . . . . . . . . . . . . . . . 31
RATS . . . . . . . . . . . . . . . . . . . . . . . . . . . . . . . . . . . . . . . . . . . . . . . . . . . . . . . . . . . . . 32
MICE . . . . . . . . . . . . . . . . . . . . . . . . . . . . . . . . . . . . . . . . . . . . . . . . . . . . . . . . . . . . . 39
GENETICTOXICOLOGY . . . . . . . . . . . . . . . . . . . . . . . . . . . . . . . . . . . . . . . . . . . . . . . 47
IV . DISCUSSION .4ND CONCLUSIONS . . . . . . . . . . . . . . . . . . . . . . . . . . . . . . . . . . . . . . . . . . . 53
1.. REFERENCES . . . . . . . . . . . . . . . . . . . . . . . . . . . . . . . . . . . . . . . . . . . . . . . . . . . . . . . . . 57
APPEXDIXES
APPENDIX A SUMAMARY O F LESIONS IN MALE RATS IN T H E TWO-YEAR F E E D STUDY OF 2.4.DICHLOROPfIENOL . . . . . . . . . . . . . . . . . . . . . . . . . . . . . . . . . . . . . . . . . 63
APPENDIX B SUMMARY O F LESIONS IN FEMALE RATS IN T H E TWO-YEAR F E E D STCDY O F 2 . 4.DICHLOROPHENOL . . . . . . . . . . . . . . . . . . . . . . . . . . . . . . . . . . . . . . . . . 91
APPENDIX C SCMMARY O F LESIONS IN MALE MICE IN THE TWO-YEAR F E E D STCDY O F 2 . 4.DICHLOROPHESOL . . . . . . . . . . . . . . . . . . . . . . . . . . . . . . . . . . . . . . . . . 115
APPENDIX D SUMMARY O F LESIONS I N FEMALE MICE I N T H E TWO-YEAR F E E D STUDY O F 2.4.DICHLOROPHESOL . . . . . . . . . . . . . . . . . . . . . . . . . . . . . . . . . . . . . . . . . 141
APPENDIX E SENTIKEL ANIMAL PROGRAM ...................................... 165
APPENDlIX F F E E D AND COMPOUND CONSUMPTION BY RATS AND MICE I N T H E TWO-YEAR F E E D STUDIES O F 2. 4.DICHLOROPHEh.OL ............................. 169
APPENDIIX G INGREDIENTS. NUTRIENT COMPOSITION. AND CONTAMINANT LEVELS IN 9 I H 07 RAT AND MOUSE RATION ................................... 175
APPENDIX H AUDIT SUMMARY . . . . . . . . . . . . . . . . . . . . . . . . . . . . . . . . . . . . . . . . . . . . . . . 181
2;l.Dichlorophenol. XTP TR 353 2
OH
Cl
2.4-DICHLOROPHENOL
CAS No. 120-83-2
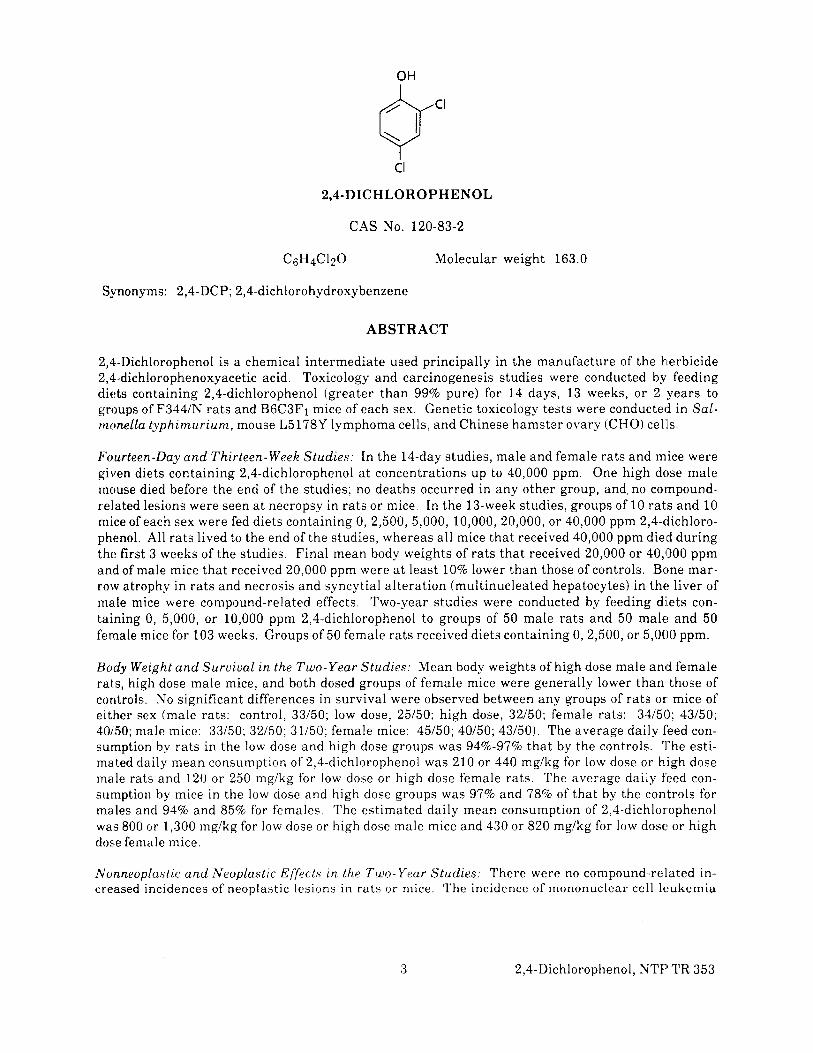
C6H4C120 Molecular weight 163.0
Synonyms: 2,4-DCP; 2,4-dichlorohydroxybenzene
ABSTRACT
2,4-Dichlorophenol is a chemical intermediate used principally in the manufacture of the herbicide 2,4-dichlorophenoxyacetic acid. Toxicology and carcinogenesis studies were conducted by feeding diets containing 2,4-dichlorophenol (greater than 99% pure) for 14 days, 13 weeks, or 2 years to groups of F344/N rats and B6C3F1 mice of each sex. Genetic toxicology tests were conducted in Sal -rnonellu typhimurium, mouse L5178Y lymphoma cells, and Chinese hamster ovary (CHO)cells.
Fourteen-Day and Thirteen-Week Studies: In the 14-day studies, male and female rats and mice were given diets containing 2,4-dichlorophenol a t concentrations up to 40,000 ppm. One high dose male mouse died before the end of the studies; no deaths occurred in any other group, and, no compound- related lesions were seen a t necropsy in rats or mice. In the 13-week studies, groups of 10 rats and 10 mice of each sex were fed diets containing 0, 2,500, 5,000, 10,000, 20,000, or 40,000 ppm 2,4-dichloro- phenol. All rats lived to the end of the studies, whereas all mice that received 40,000 ppm died during the first 3 weeks of the studies. Final mean body weights of rats that received 20,000 or 40,000 ppm and of male mice that received 20,000 ppm were a t least 10% lower than those of controls. Bone mar- row atrophy in rats and necrosis and syncytial alteration (multinucleated hepatocytes) in the liver of male mice were compound-related effects. Two-year studies were conducted by feeding diets con- taining 0, 5,000, or 10,000 ppm 2,4-dichlorophenol to groups of 50 male rats and 50 male and 50 female mice for 103 weeks. Groups of 50 female rats received diets containing 0,2,500, or 5,000 ppm.
Body Weight and Survival i n the Two-year Studies: Mean body weights of high dose male and female rat,s, high dose male mice, and both dosed groups of female mice were generally lower than those of controls,. N o significant differences in survival were observed between any groups of rats or mice of either sex (male rats: control, 33/50; low dose, 25/50; high dose, 32/50; female rats: 34/50; 43/50; 40150; male mice: 33/50; 32/50; 31150; female mice: 45/50; 40150; 43/50). The average daily feed con- sumption by rats in the low dose and high dose groups was 94%-97% that by the controls. The esti- ma.ted daily mean consumption of 2,4-dichlorophenol was 210 or 440 mg/kg for low dose or high dose male rats and 120 or 250 mg/kg for low dose or high dose female rats. The average daily feed con- sumption by mice in the low dose and high dose groups was 97% and 78% of that by the controls for males and 94% and 85% for females. The estimated daily mean consumption of 2,4-dichlorophenol was 800 or 1,300 mg/kg for low dose or high dose male mice and 430 or 820 mg/kg for low dose or high dose female mice.
Nonneoplastic and Neoplastic Effects in thp T w o -Yeur Studies: There were no compound-related in- creased incidences of neoplastic lesions in rats o r mice. The incidence of mononuclear cell leukemia
3 2,4-Dichlorophenol, NTP' TR 353

was decreased in dosed male rats relative to that in controls (control, 31/50; low dose, 17/50; high dose, 17/50); the incidence of malignant lymphomas was decreased in high dose female mice (4150) relative to that in controls (12/50). Syncytial alteration of hepatocytes was observed at increased incidences in dosed male mice (11/50;33/49; 42/48).
Gcnetic Toxicology: The mutagenic effect of 2,4-dichlorophenol in S. typhimurium strain TA1535 was considered to be equivocal only in the presence of hamster S9; 2,4-dichlorophenol produced no in- creases in revertant colonies in strains TA98, TA100, or TA1537 with or without exogenous metabolic activation. 2,4-Dichlorophenol increased trifluorothymidine (Tft) resistance in the mouse L5178Y as- say without metabolic activation; i t was not tested with activation. In cultured CHO cells, 2,4-di- chlorophenol did not induce chromosomal aberrations but did significantly increase the frequency of sister chromatid exchanges ( S C E s ) both in the presence and absence of S9.
Audit: The data, documents, and pathology materials from the 2-year studies of 2,4-dichlorophenoI have been audited. The audit findings show that the conduct of the studies is documented adequately and support the data and results given in this Technical Report.
Conc1uc;ions: Under the conditions of these 2-year feed studies, there was no evidence of carcinogenic activityCfor male F344/N rats fed diets containing 5,000 or 10,000 ppm 2,4-dichlorophenol or for fe- male F344/N rats fed diets containing 2,500 or 5,000 ppm 2,4-dichlorophenol. There was no evidence orcarcinogenic activity for male or female B 6 C 3 F 1 mice fed diets containing 5,000 or 10,000 ppm 2,4- d ichlorophenol.
SLMMARY OF THE TWO-YEAR AND GENETIC TOXICOLOGY STUDIES OF 2,4-DICHLOROPHENOL
Male F344/N Rats Female F344/N Rats Male B6C3F1 Mice Female B6C3F1 Mice
Dietary concentrations 0 ,5,000,or 10,000ppm 0,2,500, or 5,000 ppm 0,5,000,or 10,000 ppm 0,5,000, or 10,000 ppm 2,4-dichlorophenol 2,4-dichlorophenol 2,4-dichlorophenol 2,4-dichlorophenol
Body weights in the 2-year study Lower in high dose group Lower in high dose group Lower in high dose group Lower in dosed groups
Survival rates in the 2-year study 33/50;25,‘50; 32/50 34/50; 43/50; 40/50 33/50; 32/50; 31/50 45/50;40/50; 43/50
Nonneoplastic effects None None Syncytial alteration of None
hepatocytes
Neoplastic effects None None None None
Level of evidence of carcinogenic activity hi] evidence No evidence No evidence N o evidence
Genetic toxicology S. typhimurium Mouse L5178YmK”- CHO cells in vitro
( R e n e mutation) (Tft resistance) SCE Aberration Negative without S9, Positire Rithout S9; Positive with and Negative with and equivocal with S9 not tested with S9 without S9 without S9
*Explanation of Levels of Evidence of Carcinogenic Activity is on page 5. A summary ofthe Peer Review comments and the public discussion on this Technical Report appears on page 8 .
2,4-Dichlorophenol, NTP TR 353 4

EXPLANATION OF LEVELS OF EVIDENCE OF CARCINOGENIC ACTIVITY
The National Toxicology Program describes the results of individual experiments on a chemical agent and notes the strength of the evidence for conclusions regarding each study, Negative results, in which the study animals do not have a greater incidence of neoplas,ia than control animals, do not necessarily mean that a chemical is not a carcinogen, inasmuch a s the experiments are conducted under a limited set of conditions. Positive results demonstrate that a chemical is carcinogenic for laboratory animals under the conditions of the study and indicate that exposure to the chemical has the potential for hazard to humans. Other organizations, such a s the International Agency for Research on C,ancer, assign a strength of evidence for conclusions based on an examination of all available evidence including: animal studies such as those conducted by the NTP, epidemiologic studies, and estimates of exposure. Thus, the actual determination of risk to humans from chemicals found to be carcinogenic in labora- t o r y animals requires a wider analysis tha t extends beyond the purview ofthese studies.
Fii;e categories of evidence of carcinogenic activity are used in the Technical Report series to summarize the strength ofthe evi- dence observed in each experiment: two categories for positive results (“Clear Evidence” and “Some Evidence”); ont? category for uncertain findings (“Equivocal Evidence”); one category for no observable effects (“No Evidence”); and one category for ex- periment,s tha t because of major flaws cannot be evaluated (“Inadequate Study”). These categories of interpretative conclusions were first, adopted in J u n e 1983 and then revised in March 1986 for use in the Technical Reports series to incorporate more specifically the concept of actual weight of evidence of carcinogenic activity. For each separate experiment (male rats, female rats, male mice, female mice), one of the following quintet is selected to describe the findings. These categories refer to the strength of the experimental evidence and not to either potency or mechanism.
Clear Evidence of Carcinogenic Activity is demonstrated by studies tha t are interpreted a s showing a dose-related ( i ) increase of malignant neoplasms, (ii) increase of a combination of malignant and benign neoplasms, or (ii.i) marked increase ofbenign neoplasms if there is an indication from this or other studies ofthe ability of such tumors to progress to malignancy.
Some Evidence of Carcinogenic Activity is demonstrated by studies that a t e interpreted a s showing a chemically related increased incidence of neoplasms (malignant, benign, or combined) in which the strength of the respcinse is less than tha t required for clear evidence.
E:quivocal Evidencc of Carcinogenic Activity is demonstrated by studies that are interpreted a s showing a mar- ginal increase of neoplasms t h a t may be chemically related.
No Evidence of Carcinogenic Activity is demonstrated by studies tha t a re interpreted a s showing no cheinically re- ltated increases in malignant or benign neoplasms.
I n a d e q u a t e S t u d y of Carcinogenic Activity is demonstrated by studies t h a t because of major qualitative or quanti- tative limitations cannot be interpreted a s valid for showing either the presence or absence of carcinogenic activity.
When a conclusion statement for a particular experiment is selected, consideration must be given to key factors thal; would ex- tend the actual boundary of an individual category of evidence. This should allow for incorporation of scientific experience and current understanding of long-term carcinogenesis studies in laboratory animals, especially for those evaluations that may be on the borderline between two adjacent levels. These considerations should include:
e The adequacy of the experimental design and conduct; e Occurrence of common versus uncommon neoplasia; e Progression (or lack thereon from benign to malignant neoplasia a s well a s from preneoplastic to neoplastic lesions; 0 Some benign neoplasms have the capacity to regress but others (of the same morphologic type) progress. At present, it
is impossible to identify the difference. Therefore, where progression is known to be a possibility, the most prudent course is to assume that benign neoplasms of those types have the potential to become malignant;
e Combining benign and malignant tumor incidences known or tholight to represent stages of progression in tlne same or-gan or tissue;
e Latency in tumor induction; e Multiplicity in site-specific neoplasia; e Metastases; e Supporting information from proliferative lesions (hyperplasia) in the same site of neoplasia or in other experiments
(same lesion in another sex or species); The presence or absence of dose relationships; The statistical significance of the observed tumor increase; The concurrent control tumor incidence as well as the historical control rate and variability for a specific neoplasm; Survival-adjusted analyses and false positive or false negative concerns; Structure-activity correlations; and in some cases, genetic toxicology.
5 2,4-Dichlorophenol,NTP TR 353
CONTRIBUTORS
The NTP Technical Report on the Toxicology and Carcinogenesis Studies of 2,4-Dichlorophenol is based on the 13-week studies that began in April 1980 and ended in July 1980 and on the 2-year studies that began in February 1981 and ended in March 1983 a t Battelle Columbus Laboratories (Columbus, Ohio).
National Toxicology Program (Evaluated Experiment, Interpreted Results, and Reported Findings)
R. Melnick, Ph.D., Chemical Manager John Bucher, Ph.D. Joseph K. Haseman, Ph.D. Scot L. Eustis, D.V.M., Ph.D. James Huff, Ph.D.
(Discipline Leaders and Principal Contributors) Jack Bishop, Ph.D. G.N. Kao,D.V.M.,Ph.D. Ilouglas W. Bristol, Ph.D. B.A. Schwetz, D.V.M., Ph.D. K. Chhabra, Ph.D. M. Vernon, Ph.D. C.W.Jameson, Ph.D. Douglas Walters, Ph.D. E.E. McConnell, D.V.M.
NTP Pathology Working Group (Evaluated Slides and Prepared Pathology Report for Rats on 1/14/87)
Kunitoshi Mitsumori, D.V.M., Ph.D. (Chair) (NTP) Gary Riley, M.V.Sc., Ph.D. (Experimental Roger Alison, B.V.Sc., M.R.C.V.S. (NTP) Pathology Laboratories, Inc.) Scot Euistis, D.V.M., Ph.D. (NTP) George Szczech, D.V.M., Ph.D. (Burroughs Charles Montgomery, D.V.M. (NTP) Wellcome Laboratories) Konald Persing, D.V.M. (Battelle Columbus
Laboratories) (Evaluated Slides and Prepared Pathology Report for Mice on 1/29/87)
Frank 'ioelker, D.V.M., Ph.D. (Chair) (Pathology Michael Elwell, D.V.M., Ph.D. (NTP) Associates, Inc. Micheal Jokinen, D.V.M. (Experimental
Curt Barthel, D.V.M., Ph.D. (Toxpath Services) Pathology Laboratories, Inc.) (Airy Dill, J r . , D.V.M. (Battelle Columbus Kunitoshi Mitsumori, D.V.M., Ph.D. (NTP)
Laboratories) Linda Uraih, D.V.M., M.S. (NTP) Ilarlene Dixon, D.V.M., Ph.D. (Rockefeller
University) Principal Contributors at Battelle Columbus Laboratories
(Conducted Studies and Evaluated Tissues) A,. Peters, D.V.M. M. Chang, Ph.D. E. Leighty, Ph.D. R. Wilson, B.S. K.Persing, D.V.M. A. Killmeyer, B.S. G. Dill, J r . , D.V.M.
Principal Contributors at Experimental Pathology Laboratories, Inc. (Provided Pathology Quality Assurance)
J. Gauchat G. Riley, M.V.Sc., Ph.D. M. Jokinen, D.V.M.
Principal Contributors at Carltech Associates, Inc. (Contractor for Technical Report Preparation)
William D. Theriault, Ph.D. John Warner, M.S. Abigail C. Jacobs, Ph.D. Naomi Levy, B.A.
2,4-Dichlorophenol, NTP TR 353 6

PEER REVIEW PANEL
The members of the Peer Review Panel who evaluated the draft Technical Report on 2,4-tlichloro- phenol on April 18,1988,are listed below Panel members serve as independent scientists, not as rep-rwentatives of any institution, company, or governmental agency. In this capacity, Panel members have five major responsibilities. (a) to ascertain that all relevant literature data have been ade- quately cited and interpreted, (b) to determine if the design and conditions of the NTP studies were appropriate, (c) to ensure that the Technical Report presents the experimental results and conclu- sions fully and clearly, (d) to judge the significance of the experimental results by scientific criteria, and (e) to assess the evaluation of the evidence of carcinogenicity and other observed toxic responses
National Toxicology Program Board of Scientific Counselors Technical Reports Review Subcommittee
Robert A Scala, Ph.D (Chair) Senior Scientific Advisor, Medicine and Environmental Health Department
Research and Environmental Health Division, Exxon Corporation East Millstone, New Jersey
Yiichael A. Gallo, Ph D (Principal Reviewer) Frederica Perera, Dr. P H. (Principal Associate Professor, Director of Toxicology Reviewer) Division of Environmental Department of Environmental and Community Sciences, School of Public Health
Medicine, UMDNJ - Rutgers Medical School Columbia University Piscataway, New Jersey New York, New York
Ad Hoc Subcommittee Panel of Experts .John Ashby, Ph.D.
Imperial Chemical Industries, PLC Central Toxicology Laboratory Alderley Park, England
Charles C. Capen, D.V.M., Ph.D. Department of Veterinary Pathobiology Ohio State University Columbus, Ohio
Vernon M. Chinchilli, Ph.D. Department of Biostatistics Medical College of Virginia Virginia Commonwealth university Richmond, Virginia
ti im €fooper, Ph.D. Eiazard Evaluation System and
Information Services Ilepartment of E-Iealth Services State of California I3e ir keIey , Ca1if0 r nia
[Ionald f f . Hughes, Ph.D. Scientific Coordinator, Regulatory Services
Division, The Procter and Gamble Company Cincinnati. Ohio
*Unable to attend
William Lijinsky, Ph.D. (Principal Reviewer) Director, Chemical Carcinogenesis Frederick Cancer Research Facilit,y Frederick, Maryland
Franklin E. Mirer, Ph.D.* Director, Health and Safety Department International Union, United Auto
Workers, Detroit, Michigan
James A. Popp, D.V.M., Ph.D. Head, Department of Experimental
Pathology and Toxicology Chemical Industry Institute of Toxicology Research Triangle Park, North Carolina
Andrew Sivak, Ph.D. Vice President, Biomedical Science Arthur D. Little, Inc. Cambridge, Massachusetts
7 2,4-l)ichlorophenol, NTP TR 353
SUMMARY OF PEER REVIEW COMMENTS ON THE TOXICOLOGY AND CARCINOGENESIS STUDIES OF
2,4-DICHLOROPHENOL
On April 18, 1988, the draft Technical Report on the toxicology and carcinogenesis studies of 2,4- dichlorophenol received peer review by the National Toxicology Program Board of Scientific Coun- selors’ Technical Reports Review Subcommittee and associated Panel of Experts. The review meeting was he1.d at the National Institute of Environmental Health Sciences (NIEHS), Research Triangle Park, K’orth Carolina.
Dr. R.L,. Melnick, NIEHS, began the discussion by reviewing the experimental design, results, and proposed conclusions (no evidence of carcinogenic activity for male or female rats or for male or fe- male mice).
Dr. Lijinsky, a principal reviewer, agreed with the conclusions. He asked for the rationale for selec- ting a t,op dose for male ra ts which was double that for female rats. Dr. Melnick said that the se- lection of 5,000 ppm as the high dose for female rats was based on the observation of bone marrow atrophy in 6/10 female rats given 10,000ppm in the 13-week study.
Ilr. Perera, the second principal reviewer, agreed with the conclusions. She suggested that the chemi- cal might have been evaluated better in an initiation-promotion assay, a s it had been shown to be positive as a promoter in a mouse skin model.
Ilr. Gallo, the third principal reviewer, agreed with the conclusions. He questioned why drinking water was not the route of administration because the presence of 2,4-dichlorophenol in drinking water was one rationale for conducting the studies. Dr. Melnick replied that the limited water solu- bility of 2,4-dichlorophenol would have reduced the top dose to less than half that used in the feed studies.
There was some discussion about the positive trend for forestomach tumors ih male mice and why this finding was not given more weight. Dr. J. Huff, NIEHS, explained that the lack of an increased inci- dence in hyperplasia in male and female mice, together with the negative trend for these lesions in fe- male mice, suggested that the forestomach tumors were not chemically related.
Dr. Lijinsky moved that the Technical Report on 2,4-dichlorophenol be accepted with minor revisions and with the conclusions as written for male and female rats and mice, no evidence of carcinogenic ac- tivity. Dr. Perera seconded the motion, which was approved unanimously with 10 votes.
2,4Dichlorophenol, NTP TR 353 8
I. INTRODUCTION
Physical and Chemical Properties, Use, Production, and Exposure
Metabolism and Pharmacokinetics Animal Toxicity Developmental Toxicity Carcinogenicity Genetic Toxicology Human Effects Study Rationale
9 2,CDichlorophenol, NTP TR 353
I. IN'I'RODUCTION
OH
Cl
2,4-DICHLOROPHENOL
CAS NO. 120-83-2
Synonyims: 2,4-DCP; 2,4-dichlorohydroxybenzene
Physical and Chemical Properties, Use, Production, and Exposure
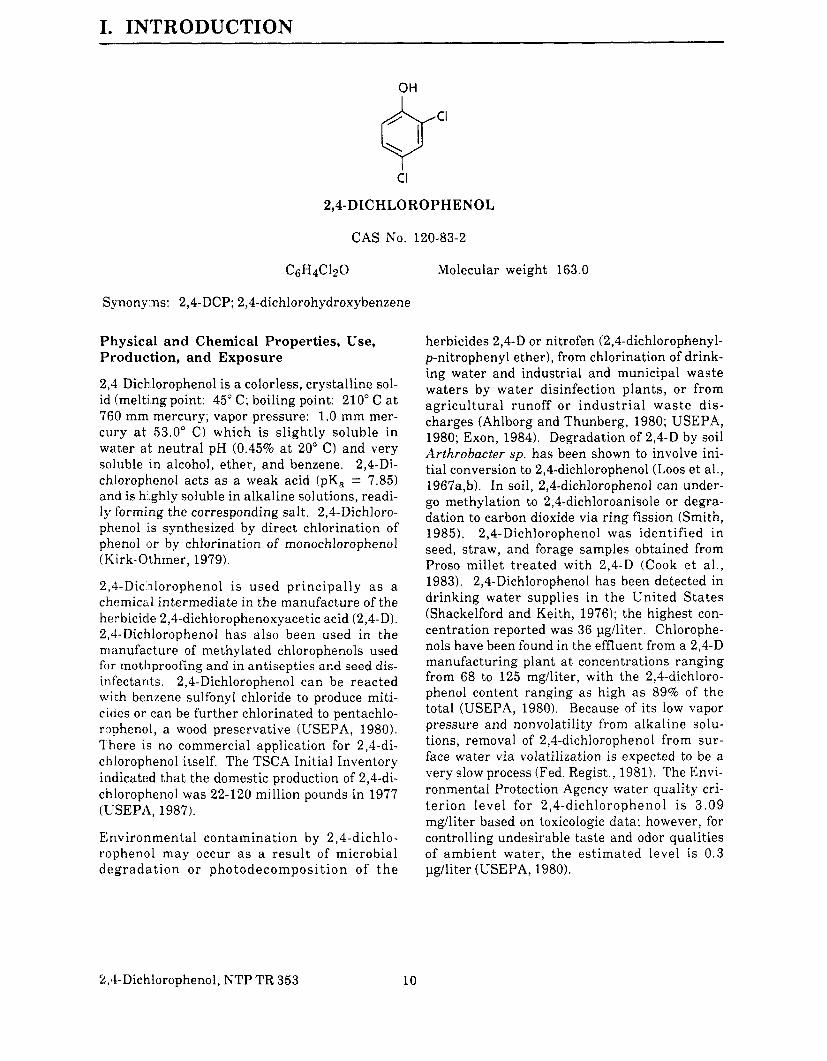
2,4-Dichlorophenol is a colorless, crystalline sol- id (melting point: 45" C; boiling point: 210" C a t 760 mm mercury; vapor pressure: 1.0 mm mer- cury a t 53.0" C) which is slightly soluble in water at neutral pH (0.45% at 20" C) and very soluble in alcohol, ether, and benzene. 2,4-Di-chlorophenol acts as a weak acid (pK, = 7.85) and is hiighly soluble in alkaline solutions, readi- ly forming the corresponding salt. 2,4-Dichloro- phenol is synthesized by direct chlorination of phenol lor by chlorination of monochlorophenol (Kirk-Othmer, 1979).
2;l--Dicliloropheno1 i s used pr incipal ly a s a chemical intermediate in the manufacture of the herbicicle 2,4-dichlorophenoxyaceticacid (2,4-D). 2,.l.-Dichlorophenol has also been used in the nianufacture of methylated chlorophenols used for mothproofing and in antiseptics and seed dis- intectants. 2,4-Dichlorophenol can be reacted with benzene sulfonyl chloride to produce miti- cides or can be further chlorinated to pentachlo- rophenol, a wood preservative (USEPA, 1980). There is no commercial application for 2,4-di- chiorophenol itself. The TSCA Initial Inventory indicated that the domestic production of 2,4-di- chlorophenol was 22-120 million pounds in 1977 (USEPA, 1987).
Environmental contamination by 2,4-dichlo- rophenol may occur as a resul t of microbial degrada t ion or photodecomposi t ion of t h e
Molecular weight 163.0
herbicides 2,4-D or nitrofen (2,4-dichlorophenyl- p-nitrophenyl ether), from chlorination of drink- ing water and industrial and municipal waste waters by water disinfection plants, or from agricul tural runoff or indus t r ia l was te dis- charges (Ahlborg and Thunberg, 1980; USEPA, 1980; Exon, 1984). Degradation of 2,4-D by soil Arthrobacter sp. has been shown to involve ini- tial conversion to 2,4-dichlorophenol (Loos et al., 1967a,b). In soil, 2,4-dichlorophenol can under- go methylation to 2,4-dichloroanisole or degra- dation to carbon dioxide via ring fission (Smith, 1985). 2,4-Dichlorophenol was identified in seed, straw, and forage samples obtained from Proso millet t reated with 2,4-D (Cook e t a l . , 1983). 2,4-Dichlorophenol has been detected in drinking water supplies in the United S ta tes (Shackelford and Keith, 1976); the highest con- centration reported was 36 pgiliter. Chlorophe- nols have been found in the effluent from a 2,4-D manufacturing plant at concentrations ranging from 68 to 125 mg/liter, with the 2,4-dichloro- phenol content ranging as high a s 89% of the total (USEPA, 1980). Because of its low vapor pressure and nonvolatility from alkaline solu- tions, removal of 2,4-dichlorophenol from sur- face water via volatilization is expected to be a very slow process (Fed. Regist., 1981). The Envi- ronmental Protection Agency water quality cri- t e r ion level for 2,4-dichlorophenol i s 3 . 0 9 mg/liter based on toxicologic data; however, for controlling undesirable taste and odor qualities of ambient water , the estimated level is 0 .3 pg/liter (USEPA, 1980).
%,4-Dichlorophenol, NTP TR 353 10
I. INTRODUCTION -.--
Metabolism and Pharmacokinetics
2,4-.Dichlorophenol (0.1 mM) inhibited the ac- tivity of rat liver microsomal arylhydrocarbon hydroxylase and UDP-glucuronosyltransferase to about; 60% of control levels (Ahotupa et al., 1981). It was suggested that inhibition of these enzymes could affect the in vivo biotransforma- tion of other xenobiotics.
Chlorophenols a re readily absorbed from the gastrointestinal tract and are excreted rapidly in urine as sulfonate or glucuronide conjugates (Exon, 1984).
The metabolism and distribution of 2,4-dichloro- phenol were studied in male Sprague Dawley rats administered 10 mg/kg 2,4-dichlorophenol by intravenous injection (Somani and Khalique, 1982). 2,4-Dichlorophenol was rapidly metab- olized to the glucuronide and other conjugates that were rapidly eliminated; conjugates of 2,4- dichlorophenol were detected in plasma within 10 minutes af ter adminis t ra t ion of the com- pound; the half-lives of 2,4-dichlorophenol and its conjugates in plasma, liver, kidney, fat, and brain ranged from 4 to 30 minutes . The tis- sue/plasma concentration ratios of 2,4-dichloro- phenol and its conjugates were higher in the kid- ney than in the l iver , fa t , o r b ra in . Sixty minutes after intravenous administration, tis- sue/plasma concentration ratios €or 2,4-dichloro- phenol and total conjugates were 116.8 and 3.96 for the kidney, 30.0 and 0.38 for the liver, 5.75 and 0.02 for fat, and 0.25 and 0 00 for the brain. Residues of 2,4-dichlorophenol were found in the kidney and liver, but not in fat or muscle, of sheep and cattle fed diets containing up to 2,000 ppm of 2,4-D for 28 days (Clark e t a l . , 1975). Thus, the kidney and liver appear to be the or- gans with the greatest affinity €or 2,4-dichloro- phenol <and its conjugates. In rats dosed with [14C]pentachlorophenol through drinking water for 4 weeks, the highest levels of radioactivity were also found in the liver and kidney (Ahlborg and Thunberg, 1980).
Somani et al. (1984) isolated two metabolites of 2,4-dichlorophenol in isolated perfused rat liver; these were tentatively identified as dichloro-methoxyphenols. The principal metabolite of
2,4-dichlorophenol was the glucuronide conju- gate of the parent compound.
Animal Toxicity
In rats, the acute LD50 of 2,4-dichlorophenol was 580 mg/kg after oral administration arid 1,730 mg/kg af te r subcu taneous a d m i n ist r a t io n (Deichmann, 1943). Vernot e t a l . (1!377) re- ported a n acute oral LD50 of 2,830 mg/kg; for 2,4- dichlorophenol in male Sprague Dawley rats and 1,630 mg/kg in male CF-1 mice. In another study, the acute oral LD50 of 2,4-dichlorophenol was reported to be 1,630 mg/kg in ICR mice and 3,670 and 4,500 mg/kg in ma le and female Sprague Dawley rats, respectively (Kobayashi e t al., 1972). Similar acute oral LD50 values were reported by Borzelleca et al. (1985a) for 2,4-di- chlorophenol in CD-1 mice (male: 1,276 mg/kg; female: 1,352 mg/kg). The LD50 in ra ts admin- istered 2,4-dichlorophenol in olive oil by intra- peritoneal injection was 430 mg/kg (Farquhar- son e t al., 1958). Differences in the acute toxic- ity of 2,4-dichlorophenol may be due in. part to the different vehicle solvents used. In general, LD50 values in mice are lower than those in rats.
Clinical signs of toxicity in ra t s admi:nistered fatal doses of chlorophenols include restlessness, increased rate of respiration, and motor weak- ness; tremors, clonic convulsions, dyspnea, and coma followed and continued until death (Deich- mann, 1943). Clinical signs of intoxication by 2,4-dichlorophenol in mice include ataxia, loss of righting reflex, slight tremors, saliva.tion, la- bored breathing, and depression (Bormlleca e t al., 1985b).
Groups of male ICR mice were fed diets con- taining 0, 200, 500, 1,000, or 2,000 ppm 2,4-di- chlorophenol for 6 months (Kobayashi e t a l . , 1972). The estimated average intake of 2,4-di-chlorophenol in the three highest dose groups was 45, 100, and 230 mg/kg per day, respec- t ively. T h e r e were no c o m p o u n d - r e l a t e d changes in behavior, growth rate, serum gluta- mate-oxaloacetate transaminase activit,y, or se-rum glutamate-pyruvate transaminase activity. Minor histologic changes in the liver ((infiltra- tion of round cells and swelling of hepatocytes) were observed in the 230 mg/kg dose group.
11 2,4-Dichlorophenol, NTP TR 353

I. INTRODUCTION
Administration of 2,4-dichlorophenol in dr ink- ing water (containing 10% Emulphor) to CD-1 mice for 90 days a t concentrations of 0.2, 0.6, or 2.0 mg/ml resulted in mean daily doses of 40, 114, or 383 mg/kg for males and 50, 143, or 491 mg/kg for females (Borzelleca et al., 1985b); no significant a l terat ions i n body weight, organ weights, or hepatic microsomal mixed function oxidase activity were observed. It was concluded that consumption of 2,4-dichlorophenol at mean daily doses of 40-491 mg/kg does not cause sig- nificant toxicologic alterations in mice.
Female Sprague Dawley rats were exposed to 2,4-dichlorophenol in their dr inking water a t concentrations of 0, 3, 30, or 300 ppm (Exon et al , 1984). For prenatal exposure, dams were dosed continuously from 3 weeks of age through breeding and parturition; for combined prenatal and postnatal exposure, dams were dosed con- tjnuously from 3 weeks of age through breeding, parturition, and lactation, and the progeny were given drinking water containing 2,4-dichloro- phenol until 13 weeks of age. Compared with those of' controls, liver and spleen weights were increased in ra ts that received combined pre- natal and postnatal exposure of up to 300 ppm 2,4-dichlorophenol, and spleen weights were in- creased in ra ts that received 300 ppm 2,4-dichlo- rophenol by prenatal exposure only There were no microscopic changes in the liver, spleen, or thymus of 2,4-dichlorophenol-exposedra ts com- pared with controls Humoral immune respon- siveness was enhanced and cell-mediated immu- nity was depressed in r a t s tha t received the combined prenatal and postnatal exposure. Pha- gocytic activity of macrophages in dosed groups v, no1 significantly different from that in con- trols. It was suggested that the immune system mily be a sensitive target for 2,4-dichlorophenol toxicity
2,4-Dichlorophenol caused a 70% stimulation of oxygen uptake in rat brain homogenates at a concenixation of 2.5 X 10⁻⁴ M , indicating that this chemical may interfere with oxidative phos- phorylation (Farquharson et al., 1958). 2,4-Di- chlorophenol was a much less potent uncoupler of' oxidative phosphorylation in rat liver mito-c h o n d r i a t h a n w a s p e n t a c h l o r o p h e n o l (Weinbach and Garbus, 1965). With increasing
chlorination, there is a n increase in the toxicity (Farquharson et al., 1958) as well as the potency of chlorophenols to uncouple oxidative phos- phorylation (Weinbach and Garbus, 1965). 2,4- Dichlorophenol was also found to inhibit passive chloride permeability in ox erythrocytes, a pro-perty shared by agents that uncouple oxidative phosphorylation (Motais et al., 1978), and to in- crease the conductance of biomolecular phospho- lipid membranes by selectively transporting hy- drogen ions through the membrane (Liberman and Topaly, 1968). Thus, toxicity of chlorophe- nols may involve interference with mitochon- drial oxidative phosphorylation or other energy- linked, membrane-dependent processes.
The LC50 of 2,4-dichlorophenol for rainbow trout is about 70 pglliter, whereas that for catfish and goldfish varies from 260 to 1,700 pg/liter (Birge et al., 1979). Survival of fathead minnows was reduced after 28 days of exposure to 2,4-dichloro- phenol at 460 pglliter or more, whereas growth was reduced a t 1,240 pglliter (Holcombe et al., 1982).
Liver and kidney changes have been observed in toxicology studies of other chlorophenols. 2,4,5- Trichlorophenol administered daily by gavage to rabbits for 28 days produced liver and kidney le-sions a t doses of 100.500 mg/kg (McCollister e t al., 1961). Dietary administration of 2,4,5-tri- chlorophenol to rats for 96 days a t concentra- tions of 3,000 and 10,000 ppm (equivalent to about 0.3-1.0 g/kg per day) produced degenera- tive changes in the liver and kidney. Toxic in- juries caused by 2-chlorophenol in rats include fatty infiltration of the liver, erythrocyte casts in the tubules of the kidney, and hemorrhages in the in tes t ines (Deichmann and Kep l inge r , 1981).
Developmental Toxicity
Oral administration of 2,4dichlorophenol in corn oil to pregnant F344 rats a t doses of 0, 200, 375, or 750 mg/kg per day on days 6-15 of gesta- tion caused a dose-related decrease in maternal weight gain (Rodwell e t a l . , 1984). The inci- dence of embryonic death increased and fetal body weight decreased in the high dose group, but no evidence of teratogenicity was observed.
2.4-Dichlorophenol, NTP TR 353
I. INTRODUCTION I._
Continuous exposure of female Sprague Dawley rats to 2,4-dichlorophenol at 3-300 ppm in drink- ing water from 3 weeks of age through breeding and parturition did not appear to affect repro- ductive performance, including conception, litter size, pup birth weight, number of stillborn pups, or s'urvival to weaning (Exon et al., 1984).
Commercial-grade pentachlorophenol was re- ported to be embryotoxic and fetotoxic in rats, causing dose-related increases in resorptions, subcutaneous edema, dilated ureters, and anom- alies of the skull, ribs, vertebrae, and sternebrae (Schwetz et al., 1974a). The no-effect dose for commercial-grade pentachlorophenol in preg- nant Sprague Dawley rats was 5 mg/kg per day. Cc) xnmerci a 1-grade and purified 2,3,4,6- t e t r a -chlorophenol were fetotoxic (causing delayed os- sification of skull bones) but not embryolethal or teratogenic in Sprague Dawley rats (Schwetz et a l , 1974b). The no-effect dose for this chlorina- ted phenol was 10 mg/kg per day.
Sperm plenetration of mouse ova in vitro was de- pressed by exposure to 2,5-, 3,4-, or 3,5-dichloro- phenol but not by exposure to 2,4-dichlorophenol (Seyler e t al., 1984). In addition, neither sperm penetration of ova nor sperm motility was af- fected b:y exposure of CD-1 mice to 2,4-dichloro- phenol (50-500 mg/kg per day) in drinking water for 90 days.
Carcinogenici ty
2,4Dichlorophenol was found to act as a skin tumor-promoting agent with the same order of activity as phenol when topically applied to the back of female Sutter mice twice per week for 15- 24 weeks (Boutwell and Bosch, 1959). The appli- cation of 2,4-dichlorophenol (25 1.11 of a 20% solu- tion in benzene) began 1 week after a single ini- tiating dose of 0.3% dimethylbenzCa1anthracene (DMBA) in benzene. Based on the applied dose that gave a maximal tumor response, phenol was about 20 times less active than croton oil as a mouse skin tumor-promoting agent. 2-Chloro-phenol, 3-chlorophenol, and 2,4,5-trichlorophe- no1 were also shown to act as promoting agents in sirnilmar studies, whereas 2,4,6-trichlorophenol and pentachlorophenol were inactive. No long-term toxicology or carcinogenesis studies with 2,4-dichlorophenol have been reported.
2,4,6-Trichlorophenol was found to be carcino- genic to F344 rats and B6C3F1 mice when ad- ministered in feed for 2 years (NCI, 1979). Doses were 5,000 or 10,000ppm for rats and mille mice and 5,214 or 10,428 ppm (time-weighted aver- age) for female mice (equivalent to about 250- 750 mg/kg per day for rats and 500-1,500 mg/kg per day for mice). Dose-related increased inci- dences of lymphomas or leukemia (combined) in male ra ts and increased incidences of hepatocel- lular neoplasms in dosed male and female mice compared with those in controls were observed.
Carcinogenesis studies of pentachlorophenol were conducted by feeding diets containing 0, 100, or 200 ppm technical-grade pentilchloro- phenol (equivalent to about 17 or 35 mg/kg per day) or 0, 100, 200, or 600 ppm Dowicide EC-7 (equivalent to about 17, 35, or 116 mg/kg per day) to groups of B6C3F1 mice of each sex for 2 years (NTP, 1989). Dose-related increaised inci- dences of hepatocellular neoplasms and pheo- chromocytomas in male and female mice and increased incidences of hemangiosarcomas in the spleen and liver in dosed female mice com- pared with those in controls were observed.
Genet ic Toxicology
Results of most tests for induction of gene muta- tion in bacterial systems by 2,4-dichlorophenol were negative (Simmon et al., 1977; Rasanen e t a l . , 1977; Rapson e t a l . , 1980; Probst e t al., 1981). The one exception is the Haworth et al. (1983) study that, although finding no (evidence for induction of gene reversion in Salmonella typhimurium strains TA98, TA100, or 'TA1537, did report a n equivocal increase in rever tant colonies in strain TA1535 when exposure to 2,4- dichlorophenol occurred in the presence of Aro- clor 1254-induced male Syrian hamster liver S9 (Table 19). Haworth et al. (1983) also included test results from all the other dichlorophenols: 2,3-, 2,5-, 2,6-, 3,4-, and 3,5-dichlorophenol; all were negative in Salmonella except 3,5-dichloro- phenol, which produced a n equivocal response in strain TA100 in the presence of Aroclor 1254- induced male Syrian hamster liver S9. The general lack of mutagenicity in Salmonella by s t ructural analogs of 2,4-dichlorophenol h a s been reported by others (Rasanen et al., 1977; Rapson e t a l . , 1980; Nestmann e t a l . , 1980).
13 2,4-Dichlorophenol, NTP TR 353

I . INTRODUCTION
2,6-Dichlorophenol also did not produce an in- crease in revertants when tested for mutagenic activity in Saccharomyces cerevisiae XV185-14C without S9 act ivat ion ( N e s t m a n n and Lee, 1983). 3,5-Dichlorocatechol, a potential inter- mediat’e metabolite of 2,4-dichlorophenol, has also been shown to be nonmutagenic in Sal-monella (Rasanen et al., 1977; Rapson e t al., 1980; Nazar e t al., 1981). 2,4-Dichlorophenol was inactive in tests for induction of DNA repair (unscheduled DNA synthesis) in pr imary cul- tures of ra t hepatocytes (Probst e t al., 1981).
In p lan ts , a low percentage of mitot ic a b - normalities (primarily delayed anaphases and a slight increase in chromosomal “stickiness”) was reported in root tip cells from the monocot AZ-lium tepa after up to 5 days of growth in tap water containing 1-50 ppm 2,4-dichlorophenol (Fiskesjo et al., 1981). However, about 11.8%of pollen mother cells from Vicia faba flower buds (adicot,yledon) treated with a 0.1% aqueous solu- tion of 2,4-dichlorophenol exhibited increased meiotic irregularities such as chromosome stick- iness, lagging chromosomes, and anaphase bridge formation (Amer and Ali, 1968). A sec- ond study in which 0.39 ppm 2,4-dichlorophenol in water was administered by spraying the plants for 5 consecutive days or by soaking seeds for 24 hours in the chemical solution also report- ed stickiness, chromosomal fragmentation and lagging, and bridge formation in dividing pollen mother cells (Amer and Ali, 1974). Treatment of
V. faba root tip cells with 62.5 mg/liter 2,4- dichlorophenol resulted in mitotic abnormalities including stickiness, anaphase bridge formation, and lagging in 3.9% of the examined metaphase/ anaphase cells (Amer and Ali, 1969).
Human Effects
Dermatoses, including photoallergic contact der- matitis, were reported in humans exposed to tri- chlorophenols and tetrachlorophenols (Deich- mann and Keplinger, 1981). Acquired chloracne and porphyria were reported in workers in- volved in the manufacture of 2,4-dichlorophenol and 2,4,5-trichlorophenol (Bleiberg et al., 1964). The causal agent(s) of these diseases may also have been dioxin or furan contaminants.
The threshold odor and taste concentrations for 2,4-dichlorophenol were reported to be 40 and 0.3 pglliter, respectively (USEPA, 1980).
Study Rationale
2,4-Dichlorophenol was selected for toxicology and carcinogenicity studies because it was found in drinking water a t several locations in the United States and because it was known to have skin tumor-promoting activity in mice. The feed route of administration was selected because 2,4-dichlorophenol has a low solubility in water and because the most common route of human exposure is oral.
2,4-DiehlorophenoI,NTP TR 353 14
II. MATERIALS AND METHODS
PROCUREMENT AND CHARACTERIZATION OF 2,4-DICHLOROPHENOL
PREPARATION AND CHARACTERIZATION OF FORMULATED DIETS
FOURTEEN-DAY STUDIES
THIRTEEN-WEEK STUDIES
TWO-YEAR STUDIES Study Design Source and Specifications of Animals Animal Maintenance Clinical Examinations and Pathology Statistical Methods
GENETIC TOXICOLOGY
15 2,4-Dichlorophenol, NTP TR 353

II. MATERIALS AND METHODS
PROCUREMENT AND CHAR,ACTERIZATION OF 2,4-DI@HLOROPHENOL
2,4-Dic hlorophenol (special laboratory-distilled, greater than 99% pure) was obtained from Dow Chemical USA in two lots (Table 1). Lot no. OCR-640-57 was obtained in two batches (on 6/26/78 and 11/16/81) which were analyzed sep- arately. Purity and identity analyses were con- ducted a t Midwest Research Inst i tute (MRI) I Kansas City, Missouri). MRI reports on analy- ses performed in support of the 2,4-dichlorophe- no1 studies a re on file at NIEHS Both lots were identified as 2,4-dichlorophenol by infrared, ul- traviolet/visible, and nuclear magnetic reson- ance spectroscopy. Al1 spectra (representative spectra. a re presented in Figures 1 and 2) were consistent with those expected for the structure m d with the literature spectra (Sadtler Stand- ,ird Spectra).
Purity for both lots of the study chemical was de- termined by elemental analysis, Karl Fischer water analysis, t i t ra t ion in water for lot no. OCR-640-57 or in methanol for lot no. OCR-808- 125 of the phenol group with 0 1 N sodium hy- droxide, thin- layer chromatography, and gas chromatography. Thin-layer chromatography was performed with two solvent systems: tolu-ene:methanol (95:5) (system 1)and hexane:ace- tone (9O:lO) (system 2). Gas chromatography was performed with flame ionization detection
and a 1% SP1240 DA column (system 1) or a 3% SP2100 column (system 2).
Cumulative data indicated that lot no. OCR-640- 57, batch 1,was at least 99% pure. The results of elemental analyses for carbon, hydrogen, and chlorine agreed with the theoretical values. Wa- ter content was 0.21%. Titration of the phenol group indicated a purity of 100.46%. Thin-layer chromatography revealed one trace impurity by both systems. Gas chromatography by system 1 showed two impuri ty peaks with a combined area 0.59% of the major peak area. Gas chro- matography by system 2 showed two impurity peaks with a combined relative area of 0.04%.
Cumulative data indicated that lot no. OCR-640- 57, batch 2, was at least 99% pure. The results of elemental analyses for carbon, hydrogen, and chlorine agreed with the theoretical values. Wa- ter content was 0.056%. Titration of the phenol group indicated a purity of 100.5%. Thin-layer chromatography by system 1 showed two trace impurities, whereas system 2 revealed a single trace impurity. Gas chromatography by system 1 showed two impurity peaks, one eluting as a shoulder before the major peak and one after the major peak, with a combined area 0.70% of the major peak area. Gas chromatography by sys-tem 2 showed a major peak and two impurity peaks with a combined area 0.20% of the major peak area.
TABLIE 1. IDENTITY AND SOURCE OF 2,I-DICHLOROPHENOL USED IN THE FEED STUDIES
Fourteen-Day!Studies
Thirteen-Week Studies
Two-yearStudies
Lot Nuimbers OCR-6410-57, batch 1 OCR-640-57, batch 1 OCR-640-57, batches 1 and 2; OCR-808-125
Date of Initial Use 8/11/79 4/14/80 Lot no. OCR-640-57: batch 1 - 3/4/81; batch 2-
12/28/81; lot no. OCR-808-125--3/22/82
Supplier Dow Chemical USA (Midland, MI) Dow Chemical USA (Midland,MI) Dow Chemical USA (Midland, MI)
2,4-Dichlorophenol, NTP TR 353 16

0
z E4 0
5: 3
p:sWafa
2,4-Dichlorophenol,NT
P 'TR353 17

INS
OCT
O•acro3O
•TART OF SWEEPI ,..,.,...., ,.-..
1
>-H> END OF SWEEP1 |..f.||...,-..*|....| ..,|,...,,..,|..M,.<.'|....|I
OrCo
oo
Int«ar«tionObs«rv»d Theoraticjl
(•) 3.71(b) 6.87tc) 7.10(d) 7. S3
h-,, a HI1.05O.94
10
FIGURE 2. NUCLEAR MAGNETIC RESONANCE SPECTRUM OF 2,4-DICHLOROPHENOL (LOT NO. OCR-808-125)
""" "'"
--
II. MATERIALS AND METHODS -.--
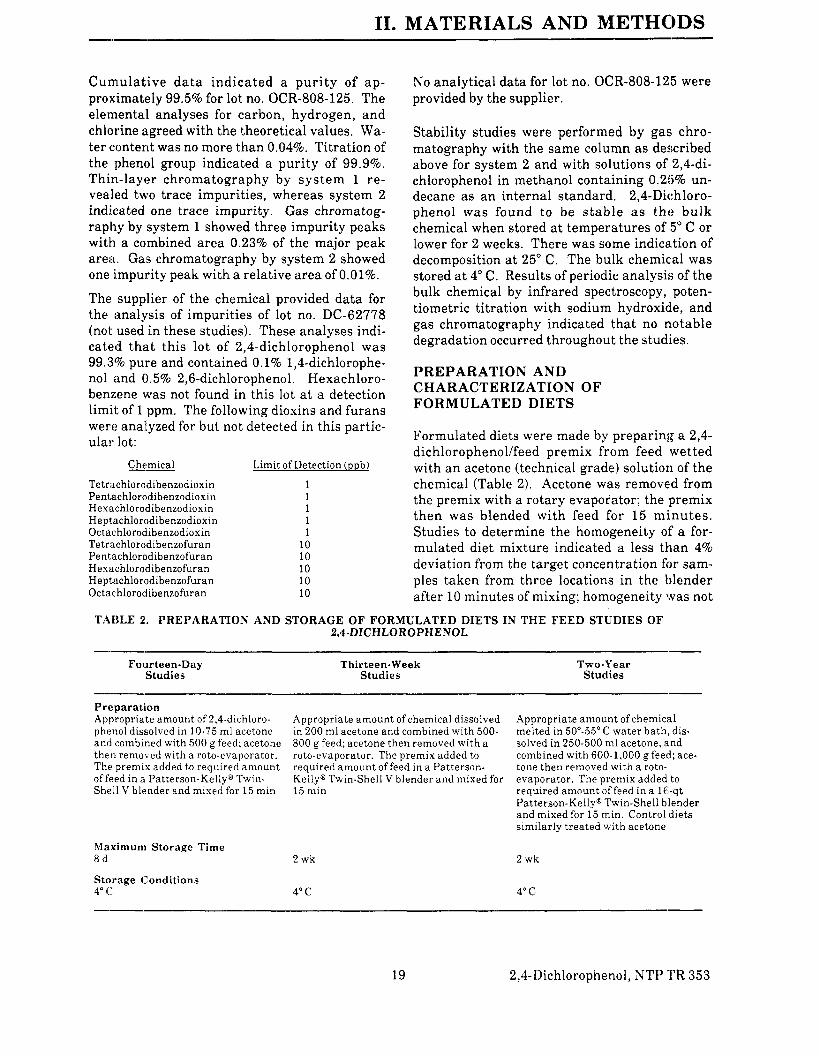
Cumula t ive d a t a indicated a pur i ty of ap - proximately 99.5% for lot no. OCR-808-125. The elemental analyses for carbon, hydrogen, and chlorine agreed with the theoretical values. Wa- ter content was no more than 0.04%. Titration of the phenol group indicated a purity of 99.9%. Thin-layer chromatography by sys tem 1 re-vealed two trace impurities, whereas system 2 indicated one trace impurity. Gas chromatog- raphy by system 1 showed three impurity peaks with a combined area 0.23%of the major peak area. Gas chromatography by system 2 showed one impurity peak with a relative a rea of 0.01%.
The supplier of the chemical provided data for the analysis of impurities of lot no. DC-62778 (not used in these studies). These analyses indi- cated tha t this lot of 2,4-dichlorophenol was 99.3% pu:re and contained 0.1% 174-dichlorophe-no1 and 0.5% 2,6-dichlorophenol. Hexachloro-benzene was not found in this lot a t a detection limit of 1ppm. The following dioxins and furans were analyzed for but not detected in this partic- ular lot:
Chemical Limit of Detection (ppb)
Tetrachlorodibenzodioxin 1 Pentachlorodibenzodioxin 1 Hexachlorodibenzodioxin 1 Heptachlorodibenzodioxin 1 Octac hlorodibenzodioxin 1 Tetrachlorodibenzofuran 10 Pentachlorodibenzofuran 10 Hexachlorodibenzofuran 10 Heptachlorodibenzofuran 10 Octac hlorodibenzofuran 10
No analytical data for lot no. OCR-808-125 were provided by the supplier.
Stability studies were performed by gas, chro- matography with the same column as described above for system 2 and with solutions of 2,4-di- chlorophenol in methanol containing 0.2'"7,) o un-decane as a n internal standard. 2,4-Dichloro-phenol was found to be s t ab le as the bulk chemical when stored at temperatures of 5" C or lower for 2 weeks. There was some indica.tion of decomposition at 25" C. The bulk chemical was stored at 4" C. Results of periodic analysis of the bulk chemical by infrared spectroscopy, poten- tiometric titration with sodium hydroxide, and gas chromatography indicated that no notable degradation occurred throughout the studies.
PREPARATION AND CHARACTERIZATION O F FORMULATED DIETS
Formulated diets were made by preparing a 2,4-dichlorophenollfeed premix from feed wetted with a n acetone (technical grade) solution of the chemical (Table 2). Acetone was removed from the premix with a rotary evaporator; the premix then was blended with feed for 15 minu tes . Studies to determine the homogeneity of a for-mulated diet mixture indicated a less than 4% deviation from the target concentration for sam- ples taken from three locations in the blender after 10 minutes of mixing; homogeneity was not
TABLE 2. PREPARATION AND STORAGE OF FORMULATED DIETS IN THE FEED STUDIES OF
Fourteen-DayStudies
Preparation Appropriate amount of 2,4-dichloro-phenol dissolved in 10-75ml acetone and combined with 500 g feed; acetone then removed with a roto-evaporator. The premix added to required amount off'eed in a Patterson-Kelly@ Twin- Shell V blender and mixed for 15 min
Maximum Storage Time 8 d
Storage Conditions 4" c
2,4-DICHLOROPHENOL
Thirteen-Week Studies
Appropriate amount of chemical dissolved in 200 ml acetone and combined with 500-800 g feed; acetone then removed with a roto-evaporator. The premix added to required amount of feed in a Patterson-Kelly@ Twin-Shell V blender and mixed for 15min
2 wk
4" c
Two-year Studies
Appropriate amount of chemiciil melted in 50"-55"C water bath, dis- solved in 250-500 ml acetone, a.nd combined with 600-1,000 g feed; ace- tone then removed with a roto- evaporator. The premix added to required amount of feed in a 1Cs-qt Patterson-Kelly@ Twin-Shell blender and mixed for 15min. Control diets similarly treated with acetone
2 wk
4" c
19 2,4-Dichlorophenol, NTP TR 353

II. MATERIALS AND METHODS-
improved after 15 minutes of mixing. The re- covery of 2,4-dichlorophenol from formulated diets by methanol extraction, although essen- tially complete immediately after preparation, decrealsed with time to about 58% after 7 days. The addition of 1% hydrochloric acid to the methanol extracting solvent resulted in only a marginal improvement in the amount recovered. Consequently, for the study of compound sta- bility in feed, acid digestion of the feed mixtures was carried out before extraction with ether:hex- ane ( l : l ) , and a recovery of 88% from feed sam- ples stored for 2 weeks a t 25" C was obtained. 2,4-DichlorophenoI a t a concentration of 4,000 ppm in feed was stable for 5 weeks a t -20" C. Recovtery of 2,4-dichlorophenol from the feed mixture stored under these conditions was 95% relative to the zero-time recovery. For different samples of this feed mixture stored for 2 weeks a t 5" C:, recovery of 2,4-dichIorophenol was 93%. In the 13-week and 2-year studies, formulated diets ,were stored a t 4" C for no longer than 2 weeks.
Periodic analyses of formulated diet mixtures of 2,4-dichlorophenol were conducted a t the study laboratory and the analytical chemistry labora- tory. Feed samples were extracted with metha- nol, centrifuged, and analyzed by gas chroma- tography with the same column as described before for system 1,with phenol in methanol as an internal standard. Formulated diets were analyzed once during the 13-week studies. The results were within specifications and ranged from 92.2% to 105.6% of the target concentra- tions (Table 3).
During the 2-year studies, the formulated diets were analyzed at approximately 8-week inter- vals and were within f10% of the target concen- trations approximately 82% (42/51) of the time throughout the 2-year studies (Table 4). Referee analyses were periodically performed by the study and analytical chemistry laboratories; re- sults between the laboratories varied from 1% to 6% (Table 5).
TABL,E 3. RESULTS OF ANALYSIS OF FORMULATED DIETS IN THE THIRTEEN-WEEK FEED STUDIES OF 2,4-DICHLOROPHENOL (a)
Concentration of 2,4-Dichlorophenol in Feed (ppm) Determined as a Target Determined (b) Percent of Target
( c )40,000 td)40,000 (e)40,000
20,000 10,000 5,000
tc ) 2,500 (d)2,500 (e)2,500
( a )Date mired: 6/17/80 (b)Resjults of duplicate analysis ( c )Samples taken from bottom ofblender td) Samples taken from top right ofblender (e)Samples taken from top left ofblender
37,750 94.4 37,730 94.3 37,790 94.5 18,440 92.2 9,440 94.4 4,880 97.6 2,510 100.4 2,640 105.6 2,570 102.8
%,4-Dichlorophenol, NTP TR 353 20
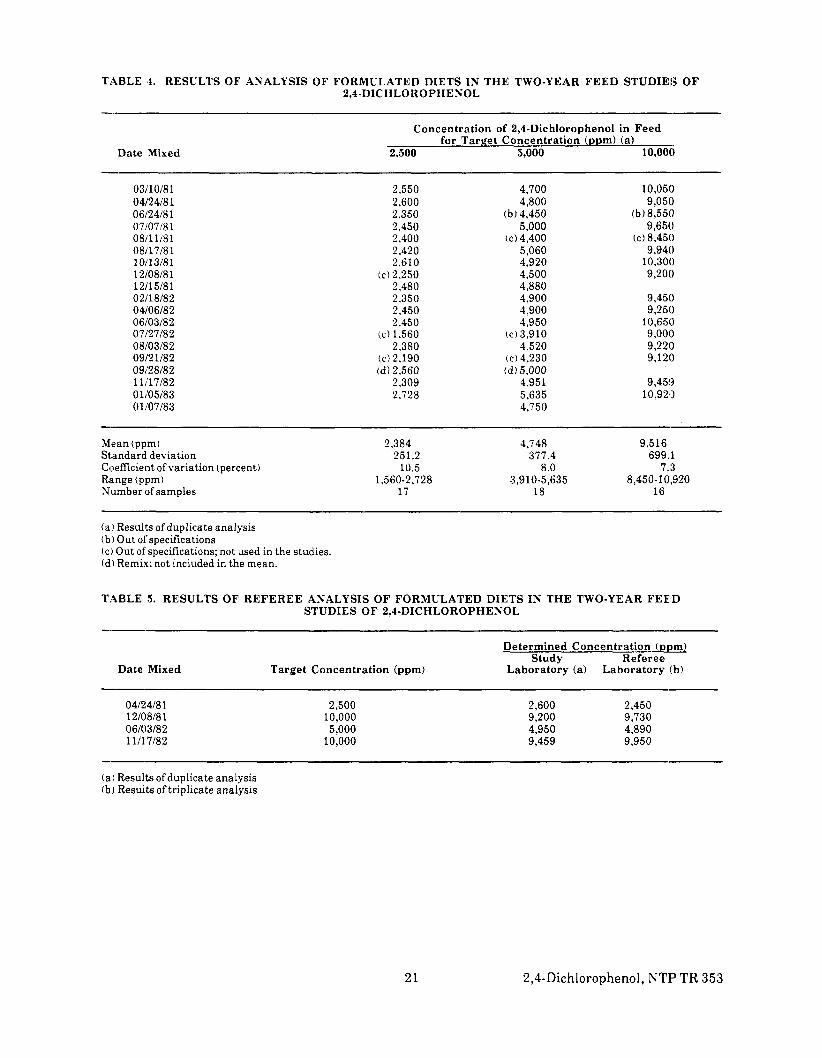
TABLE ,4. RESULTS O F ANALYSIS O F FORMULATED DIETS I N T H E TWO-YEAR F E E D STUDIEB O F 2,I-DICHLOROPHENOL
-.--Concentrat ion of 2,l-Dichlorophenol in F e e d
for Targe t Concentrat ion (ppm) (a) Date Mixed 2,500 5,000 10,ooti
I-
03/10/8 1 2.550 4,700 10,050 04124181 2,600 4,800 9,050 06124181 2,350 (b)4,450 ( b )8,550 07107181 2,450 5,000 9,650 08/11181 2,400 (c)4,400 (c)8,450 OW17181 2.420 5,060 9,940 10/13/81 2,610 4,920 10,300 12/08/81 (c) 2,250 4,500 9,200 121 15/81 2,480 4,880 0211 8/82 2,350 4,900 9,450 04106182 2,450 4,900 9,250 06/03/82 2,450 4,950 10,650 07/27/82 (c) 1.560 ( C ) 3,910 9,000 08i03i82 2.380 4,520 9,220 09/21/82 09/28/8 2
(c) 2.190 (d)2,560
( c ) 4,230 td)5,000
9,120
11/17/82 2.309 4,951 9,45!3 01/05/83 2,728 5,635 10,920 01/07/83 4,750
Mean (ppm) 2,384 4,748 9,516 Standard deviation 251.2 377.4 699.1 Coefficient of variation (percent) 10.5 8.0 7.3 Range (piprn) 1,560-2,728 3,910-5.635 8,450- 10,920 Number (ofsamples 17 18 16
( a )Results of duplicate analysis ( b )Out ofspecifications ( c )Out ofspecifications; not used in the studies. ( d ) Remix; not included in the mean.
TABLE 5. RESULTS O F R E F E R E E ANALYSIS O F FORMULATED DIETS IN THE TWO-YEAR FEElD STUDIES O F 2,4-DICHLOROPHENOL
Determined Concent ra t ion (ppm) S tudy Referee
Date Mixed Targe t Concentrat ion (ppm) Labora to ry (a) Labora to ry (b )
0412 418 1 2,500 2,600 2,450 12/08/81 10,000 9,200 9,730 06/03/82 5,000 4,950 4,890 1111.7182 10,000 9,459 9,950
( a )Results of duplicate analysis (b)R e d t s of triplicate analysis
21 2,4-Dichlorophenol,NTP TR 353

II. M.ATERIALS AND METHODS
FOURTEEN-DAY STUDIES
Male and female F344/N rats and B6C3F1 mice were obtained from Charles River Breeding Lab- oratories and observed for 15 days before the studies began. The rats were 6 weeks old when placed on study, and the mice were 7 weeks old.
Groups of five rats and five mice of each sex were fed diets containing 0, 2,500, 5,000, 10,000, 20,000, lor 40,000 ppm 2,4-dichlorophenol for 14 consecu1,ive days. Animals were housed five per cage. Water and feed were available ad libitum. The rats and mice were observed twice per day and weighed on days 0, 7 , and 14. A necropsy was performed on all animals. Further experi- mental details a re summarized in Table 6.
THIRTEEN-WEEK STUDIES
Thirteen-week studies were conducted to evalu- a te the cumulative toxic effects of repeated expo- sure to 2,4-dichlorophenol and to determine the concentrations to be used in the 2-year studies.
Four-week-old male and female F344/N rats and 6 week-old male and female B6C3F1 mice were obtained from Charles River Breeding Labora- tories, (observed for 24 days , d i s t r ibu ted to weight classes, and then assigned to cages ac- cording to a table of random numbers. Cages were assigned to dosed and control groups ac- cording to another table of random numbers. Groups of 10 males and 10 females of each spe- C I P S were fed diets containing 0, 2,500, 5,000, 10,000, 20,000, or 40,000 ppm 2,4-dichloro-phcnol for 13 weeks. Further experimental de- tails are summarized in Table 6.
Animal!; were observed twice per day; moribund animals were killed. Feed consumption was measured by cage. Individual animal weights were recorded once per week. At the end of the 13-week: studies, survivors were killed. A nec- ropsy was performed on all animals except those excessively autolyzed or cannibalized. Tissues and groups examined are listed in Table 6.
TWO-YEAR STUDIES
Study Design
Diets containing 0, 5,000, or 10,000 ppm 2,4-di- chlorophenol were fed to groups of 50 male rats and 50 male and 50 female mice for 103 weeks. Groups of 50 female rats received diets contain- ing 0,2,500, or 5,000 ppm.
Source and Specifications of Animals
The male and female F344/N rats and B6C3F1 (C57BL/6N7 female X C3H/HeN MTV-, male) mice used in these studies were produced under strict barrier conditions a t Charles River Breed- ing Laboratories under a contract to the Carci- nogenesis Program. Breeding stock for the foun- da t ion colonies a t t h e p roduc t ion f ac i l i t y originated a t the National Institutes of Health Repository. Animals shipped for study were progeny of defined microflora-associated parents that were transferred from isolators to barrier- maintained rooms. Animals were shipped to the study laboratory at 5-6 weeks of age and were quarantined for approximately 2 weeks. There- after, a complete necropsy was performed on five animals of each sex and species to assess their health status. The rodents were placed on study at 7-8 weeks of age. The health of the animals was monitored during the course of the studies according to the protocols of the NTP Sentinel Animal Program (Appendix E).
A quality control skin grafting program has been in effect since early 1978 to monitor the ge- netic integrity of the inbred mice used to produce the hybrid B6C3F1 study animal. In mid-1981, data were obtained that showed incompatibility between the NIH C3H reference colony and the C3H colony from a Program supplier. In August 1981, inbred parental lines of mice were further tested for genetic integrity via isozyme and pro- tein electrophoresis profiles t ha t demonstrate phenotype expressions of known genetic loci.
The C57BL/6N mice were homogeneous a t a l l loci tested. Eighty-five percent of the C3H mice
2,4-Dichlorophenol, NTP TR 353 22
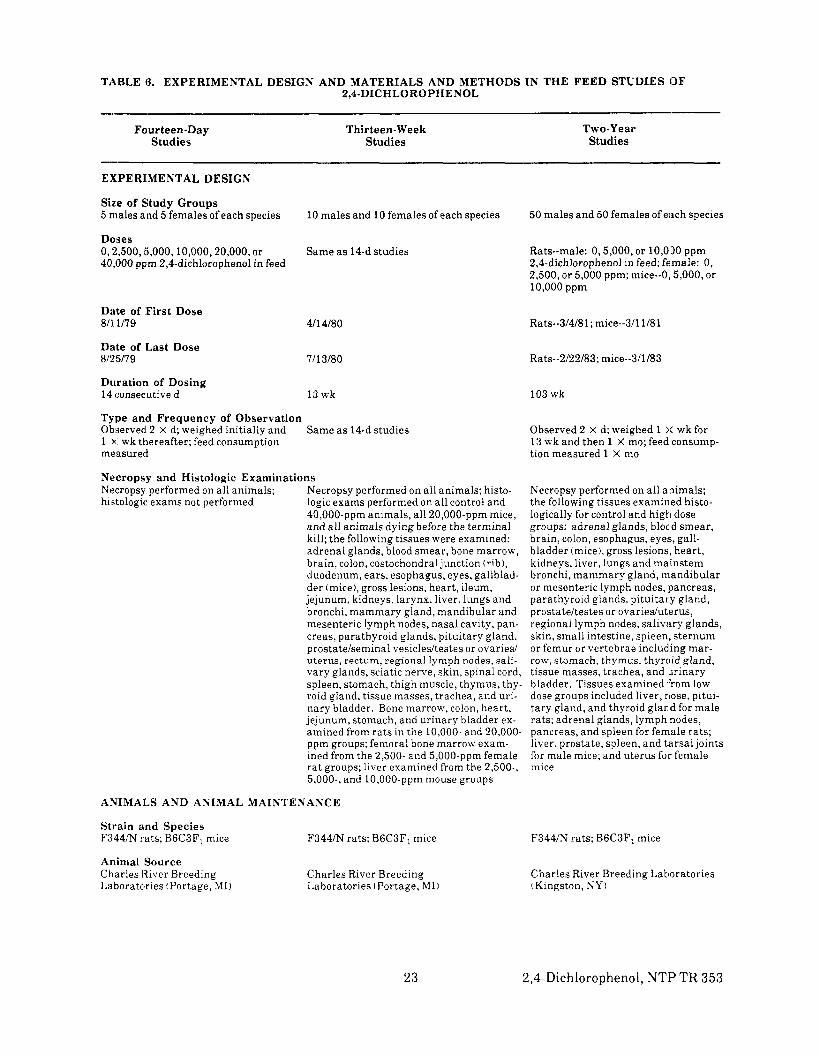
TABLE (3. EXPERIMENTAL DESIGN AND MATERIALS AND METHODS I N THE F E E D STUDIES O F 2,4-DICHLOROPHENOL
Fourteen-Day Thir teen-Week Two-year Studies S tudies Studies
EXPERIMENTAL DESIGN
Size of S t u d y Groups5 males and 5 females of each species
Doses 0,2,50O,Ii,OOO, 10,000,20,000, or 40,000 ppm 2,4-dichlorophenol in feed
Date of Firs t Dose 811 1/79
Date of Last Dose 8/25/79
Durat ion of Dosing 14 consecutive d
Type a n d F r e q u e n c y of Observat ion Observed 2 X d; weighed initially and 1 X: wk thereafter; feed consumption measured
10 males and 10 females of each species
Same as 14-d studies
4/14/80
7/13/80
13wk
Same as 14-d studies
Necropsy and Histologic Examinat ions Necropsy performed on all animals; Necropsy performed on all animals; histo- histologic exams not performed logic exams performed on all control and
40,000-ppm animals, all 20,000-ppm mice, and all animals dying before the terminal kill; the following tissues were examined: adrenal glands, blood smear, bone marrow, brain, colon, costochondral junction (rib), duodenum, ears, esophagus, eyes, gallblad- der (mice), gross lesions, heart, ileum, jejunum, kidneys, larynx, liver, lungs and bronchi, mammary gland, mandibular and mesenteric lymph nodes, nasal cavity, pan- creas, parathyroid glands, pituitary gland, prostateiseminal vesicles/testes or ovaries/ uterus, rectum, regional lymph nodes, sali-vary glands, sciatic nerve, skin, spinal cord, spleen, stomach, thigh muscle, thymus, thy- roid gland, tissue masses, trachea, and uri- nary bladder. Bone marrow, colon, heart, jejunum, stomach, and urinary bladder ex- amined from rats in the 10,000- and 20,000-ppm groups; femoral bone marrow exam- ined from the 2,500-and 5,000-ppm female ra t groups; liver examined from the 2,500-, 5,000-, and 10,000-ppm mouse groups
ANIMALS AND ANIMAL MAINTENANCE
St ra in a n d Spec ies F344/N rats; B6C3F1 mice
Animal Source Charles River Breeding Laboratories (Portage, MI)
F344/N rats; B6C3F1 mice
Charles River Breeding Laboratories (Portage, M I )
50 males and 50 females of each species
Rats--male: 0,5,000, or 10,000 ppm 2,4-dichlorophenol in feed; female: 0, 2,500, or 5,000 ppm; mice--0,5,000, or 10,000 ppm
Rats--3/4/81; mice--3/11/81
Rats--2/22/83; mice--3/1/83
103 wk
Observed 2 X d; weighed 1 )<wk for 13 wk and then 1 X mo; feed consump- tion measured 1 X mo
Necropsy performed on all animals; the following tissues examined histo- logically for control and high dose groups: adrenal glands, blocid smear, brain, colon, esophagus, eyes, gall- bladder (mice), gross lesions, heart, kidneys, liver, lungs and mainstem bronchi, mammary gland, mandibular or mesenteric lymph nodes, pancreas, parathyroid glands, pituitary gland, prostateitestes or ovaries/uterus, regional lymph nodes, salivary glands, skin, small intestine, spleen, sternum or femur or vertebrae including mar- row, stomach, thymus, thyroid gland, tissue masses, trachea, and urinary bladder. Tissues examined from low dose groups included liver, nose, pitui- tary gland, and thyroid g1ac.d for male rats; adrenal glands, lymph nodes, pancreas, and spleen for female rats; liver, prostate, spleen, and tarsal joints for male mice; and uterus for female mice
F344M rats; B6C3F1 mice
Charles River Breeding Laboratories (Kingston, NY 1
23 2,4-Dichlorophenol, NTP TR 353

TABLE 6. EXPERIMENTAL DESIGN AND MATERIALS AND METHODS I N T H E F E E D STUDIES OF 2,I-DICHLOROPHENOL (Continued)
Fourteen-Day Thir teen-Week Studies Studies
ANIMALS AND ANIMAL MAINTENANCE (Continued)
S t u d y Labora tory Battelle Columbus Laboratories
Method alf Animal Identification Toe clip
Time Held Before S t u d y 15 t i
Age When Placed o n S t u d y Rat.s--6 wk; mice-7 wk
Age When Killed R:xt.s--9wk; mice--10 wk
Necropsy Dates Rat.s--8/21179; mice--8/28179
Method of Animal Distr ibut ion Animals distributed to weight classes arid assigned to cages by one table of ra ndom numbers and to groups by another table of random numbers
Feed Rodent Laboratory Chow 5001" meal (Ralston Furina Co., St. Louis, MO); available ad libitum
Bedding Absorb-dri hardwood chips (Absorb-Dlri, Inc., Garfield, N J )
Water Aut.omatic watering system (Edstrom Industries,, Waterford, WI); available ad libiturri
Cages Polycarbonate (Lab Products, Inc., Rwhelle Park, NJ )
Cage Fi l ters Rermay spun-bonded polyester filters t Snow Filtxation, Cincinnati, OH)
Animals per Cage 5
Battelle Columbus Laboratories
Toe clip
24 d
Rats-7 wk; mice--9 wk
Rats-21 wk; mice-22 wk
Rats-711 4180-7/15/80; mice-711 5180-7/16/80
Same a s 14-d studies
NIH 07 Rat and Mouse Ration (Zeigler Bros., Inc., Gardners, PA); available ad libitum
Same a s 14-d studies
Same as 14-d studies
Same as 14-d studies
Same a s 14-d studies
5
Other Chemicals on S t u d y in the S a m e Room None None
Animal Itoom Envi ronment T~mp--70'-73"F; hum--40%-60%; Same a s 14-d studies fluorescent light 12 Wd; 15room air changesk
T w o - y e a r S tudies
Battelle Columbus Laboratories
Toe and ear clip
Rats-14 d; mice--15 d
Rats-7 wk; mice--8 wk
Rats-111 wk; mice.-112 wk
Rats--2/28/83-313183; rnice--3/7/83-3110/83
Same as 14-d studies
Same as 13-wk studies
Same a s 14-d studies
Same as 14-d studies
Same a s 14-d studies
Same a s 14-d studies
5
None
Temp--53"-83"F; hum--29%-73%; fluorescent light 12 Wd; 15 room air changesk
2,4-Dichlorophenol,NTP TR 353 24.
II. MATERIALS AND METHODS
monitored were variant a t one to three loci, indi- cating some heterogeneity in the C3H line from this supplier. Yevertheless, the genome of this line is more homogeneous than that of randomly bred stocks.
Male mice from the C3H colony and female mice from the C57BL/6N colony were used as parents for the lhybrid B6C3F1 mice used in these stud- ies. The influence of the potential genetic non- uniformity in the hybrid mice on these results is not, known, but results of the studies a re not af- fected because concurrent controls were included in each study.
Animal Maintenance
Animalis were housed five per cage. Feed and water were available ad libitum. Cages were not rotated during the studies. Further details of animal maintenance are given in Table 6.
CLinical Examinations and Pathology
All animals were observed twice per day; clinical signs were recorded once per day for 21 months and then once per month. Body weights were re- corded once per week for the first 13weeks of the studies and once per month thereafter. Mean body weights were calculated for each group. Animals found moribund and those surviving to the end of the studies were humanely killed. A necropsy was performed on all animals includ- ing those found dead, unless they were exces- sively autolyzed or cannibalized, missexed, or missing. Thus, the number of an imals from which particular organs or tissues were exam- ined microscopically varies and is not necessari- ly equal to the number of animals t ha t were placed on study.
During necropsy, all organs and tissues were ex- amined for grossly visible lesions. Tissues were preserved in 10% neutral buffered formalin, em- bedded in paraffin, sectioned, and stained with hematoxylin and eosin. Histopathologic exami- nation of tissues was performed according to a n “inverse pyramid” design (McConnell, 1983a,b). That is, complete histopathologic examinations (Table 6) were performed on all high dose and control animals. In addition, histopathologic ex- aminations were performed on all grossly visible
lesions in all dose groups. Potential t a r g e t organs for chemically related neoplaistic and nonneoplastic effects were identified from the short-term studies or the literature and were de- termined by examination of the pathola’gy data; these target organs/tissues in the lower dose group were examined histopathologically. If mortality in the highest dose group exceeded that in the control group by 15%, complete histo- pathologic examinations were performed on all animals in the second highest dose group in ad- dition to those in the high dose group.
When the pathology evaluation was completed, the slides, paraffin blocks, and residual wet tis- sues were sent to the NTP Archives for inven- tory, slide/block match, and wet tissue audi t . The slides, individual animal data records, and pathology tables were sent to a n independent quality assessment laboratory. The individual animal records and tables were compared for ac- curacy, slides and tissue counts were verified, and histotechnique was evaluated. All tumor di- agnoses, all target tissues, and all tissues from a randomly selected 10% of the animals were eval- uated by a quality assessment pathologist. The quality assessment report and slides were sub-mitted to the Pathology Working Group (PWG) Chairperson, who reviewed al l t a rge t tissues and those about which there was a disagreement between the laboratory and quality assessment pathologists.
Representative slides selected by the Chairper- son were reviewed by the PWG, which includes the laboratory pathologist, without knowledge of previously rendered diagnoses. When the con- sensus diagnosis of the PWG differed from that of the laboratory pathologist, the laboratory pa- thologist was asked to reconsider the original di- agnosis. This procedure has been described, in par t , by Maronpot and Boorman (1982) a n d Boorman et al. (1985). The final diagnoses rep- resent a consensus of contractor pathologists and the NTP Pathology Working Group. For subse-quent analysis of pathology data, the diagnosed lesions for each tissue type a re combined accord- ing to the guidelines of McConnell e t al. (1986).
Slidedtissues a re generally not evaluated in a blind fashion (i.e., without knowledge of dose group) unless the lesions in question are subtle
25 2,4-Dichlorophenol, NTP TR 353
II. MATERIALS AND METHODS
or unless there is a n inconsistent diagnosis of le- sions by the laboratory pathologist. Nonneo-plastic lesions a re not examined routinely by the quality assessment pathologist or PWG unless they are considered part of the toxic effect of the chemica 1.
Stat is t ical Methods
Data Recording: Body weight and feed con- sumption data on this experiment were recorded in the Carcinogenesis Bioassay Data System (Linhar’t et al., 1974). Other data were recorded in the T’oxicology Data Management System. The data elements include descriptive informa- tion on t,he chemicals, animals, experimental de- sign, survival, and individual pathology results, a s recommended by the Internat ional Union Against Cancer (Berenblum, 1969).
Survival Analyses: The probability of survival was estimated by the product-limit procedure of Kaplan and Meier (1958) and is presented in the form of graphs. Animals were censored from the survival analyses a t the time they were found to be missing or dead from other than na tu ra l causes; animals dying from natural causes were not cens80red. Statistical analyses for a possible dose-related effect on survival used the method of Cox (1972) for testing two groups for equality and Tarone’s (1975) life table tes t for a dose-related trend. When significant survival differ- ences were detected, additional analyses using these procedures were carried out to determine the time point at which significant differences in t h ~survival curves were first detected. All re- ported i’ values for the survival analysis a r e two-sided.
Calculation of Incidence: The incidence of neo- plastic or nonneoplastic lesions is given as the ratio of the number of animals bearing such le- sions a t a specific anatomic site to the number of animals in which that site was examined. In most instances, the denominators include only those animals for which the site was examined histologically. However, when macroscopic ex- amination was required to detect lesions (e.g., skin or mammary tumors) prior to histologic sampling, or when lesions could have appeared at mul t ip l e sites (e .g . , l y m p h o m a s ) , t h e
denominators consist of the number of animals on which a necropsy was performed.
Analysis of Tumor Incidence: Three statistical methods a re used to analyze tumor incidence data: life table tests, logistic regression, and Fisher exactlcochran-Armitage trend analyses. Tests of significance include pairwise compari- sons of high dose and low dose groups with con- trois and tests for overall dose-response trends. For studies in which administration of the study compound has little effect on survival, the re- sults of the three alternative analyses will gen- erally be similar. When differing resul ts a r e obtained by the three methods, the final inter- pretation of the data will depend on the extent to which the tumor under consideration is regarded as being the cause of death. Continuity-cor-rected tests are used in the analysis of tumor in- cidence, and reported P values a re one-sided. The procedures described below also were used to evaluate selected nonneoplastic lesions.
Life Table Analyses--This method of analysis as- sumes that all tumors of a given type observed in animals dying before the end of the study were “fatal”; i.e., they ei ther directly or indirectly caused the death of the animal. According to this approach, the proportions of tumor-bearing animals in the dosed and control groups were compared at each point i n time at which a n animal died with a tumor of interest. The de- nominators of these proportions were the total number of animals a t risk in each group. These results, including the data from animals killed at the end of the study, were then combined by the Mantel-Haenszel method (1959) to obtain an overall P value. This method of adjusting for in- tercurrent mortality is the life table method of Cox (1972) and of Tarone (1975). The under- lying variable considered by this analysis is time to death due to tumor. If the tumor is rapidly lethal, then time to death due to tumor closely approximates time to tumor onset. In this case, the life table test also provides a comparison of the time-specific tumor incidences.
Logistic Regression Analyses--This method of analysis assumes that all tumors of a given type were “incidental”; i.e., they did not alter the risk of death and were discovered merely as the
2.4-Dich1loropheno1, NTP TR 353 26
II. MATERIALS AND METHODS
result of death from a n unrelated cause. Accord- ing to this approach, tumor prevalence was modeled as a logistic function of dose and time. Both linear and quadratic terms in time were in- corporated initially, and the quadratic term was eliminated if it did not significantly enhance the f i t of the model. The dosed and control groups were compared on the basis of the likelihood score test for the regression coefficient of dose. This method of adjusting for intercurrent mor- tality ILSthe prevalence analysis of Dinse and [,agakos (19831, fur ther described and i l lus- trated by Dinse and Haseman (1986). If the tu- mor type is nonlethal, this comparison of the ti me-specific tumor prevalence also provides a compai-ison of the time-specific tumor incidences (McKnight and Crowley, 1984).
Fisher ExactiCochran-Armitage Trend Analy- ses--In addition to survival-adjusted methods, the reslults of the Fisher exact test for pairwise
lmparisons and the Cochran-Armitage linear trend test (Armitage, 1971; Gart e t al., 1979) a re given in the appendixes containing the analyses ( I f tumor incidence These two tests are based on the overall proportion of tumor-bearing animals arid do not adjust for survival differences.
Historical Control Data: Although the concur- r m t control group is always the first and most dppropriate control group used for evaluation, there are certain instances in which historical control data can be helpful in the overall assess- ment of tumor incidence. Consequently, control tumor incidences from the N T P h is tor ica l control data base (Haseman et al., 1984, 1985) 'ire included for those tumors appearing to show CO m po 1.1 nd -re 1a t ed e ffec t s.
GE N ET IC TOXIC 0L0GY
SnLmoneLLa Protocol Testing was performed as PI ported by Ames et al (1975) with modifica- T ions listed below and described in greater detail h v €Iaworth et al. (1983). Chemicals were sent to the laboratories as coded aliquots from Radian (:orporation (Austin, Texas). The study chemi- c,<I was incubated with the S. t yph imur ium tclster s t r a ins TA98, TA100, TA1535, a n d TA1537 either in buffer or S9 mix (metabolic ac- tivation enzymes and cofactors from Aroclor 1254-induced male Sprague Dawley r a t o r
Syrian hamster liver) for 20 minutes at 37"C be-fore the addition of soft agar supplemeinted with L-histidine and D-biotin and subsequent plating on minimal glucose agar plates. Incubation was continued for a n additional 48 hours.
Chemicals were tested in a series (four strains used) or in a hierarchy (initial testing in TA98 and TA100; if resuIts were negative, then the chemical was tes ted f u r t h e r i n add i t iona l strains). If all results were negative, the chemi- cal was retested in all strains with a different concentration of S9.
Each test consisted of triplicate plates of concur- rent positive and negative controls and of a t least five doses of the study chemical. The high dose was limited by toxicity or solubi1ii;y but did not exceed 10 mg/plate. All negative assays were repeated, and all positive assays were re- peated under the conditions tha t elicited the positive response.
A positive response w a s def ined a s a re-producible, dose-related increase i n histidine- independent ( rever tant) colonies i n a n y one straidactivation combination. An equivocal re- sponse was defined as a n increase in revertants which was not dose related, not reproducible, or of insufficient magnitude to support a deter-mination of mutagenicity. A response was con- sidered negative when no increase in revertant colonies was observed after chemical treatment.
Mouse Lymphoma Protocol: The expt?rimental protocol is presented in detail by Mqhr et al. (1985) and follows the basic format of Clive et al. (1979). All study chemicals were supplied as coded aliquots from Radian Corporation (Austin, Texas). The highest dose of the study compound was determined by solubility or toxicity and did not exceed 5 mg/ml. Mouse lymphoma L5178Y cells were maintained a t 37" C as suspension cul- tures in Fischer's medium supplemented with 2 mM L-glutamine, 110 pg/ml sodium pyruvate, 0.05% pluronic F68, antibiotics, and heat-inac- tivated horse serum; normal cycling time was about 10 hours. To reduce the number (of sponta- neously occurring trifluorothymidine (Tft)-resis- tant cells, subcultures were exposed once to me- d ium conta in ing thymidine , hypoxanth ine , m e t h o t r e x a t e , a n d g lyc ine fo r 1 d a y , t o
27 2,4-l)ichlorophenol,N T P T K 3 5 3

II. MATERIALS AND METHODS
thymidine, hypoxanthine, and glycine for 1 day, and to normal medium for 3-5 days. For cloning, horse serum content was increased and Noble agar was added. Freshly prepared S9 metabolic activation factors were obtained from the liver of either Aroclor 1254-induced or noninduced male F344 rats.
All doses within a n experiment, including con- current positive and solvent controls, were repli- cated. Treated cultures contained 6 X 10‘ cells in 10 ml of medium. This volume included the S9 fractiion in those experiments performed with metabolic activation Incubation with the study chemical continued for 4 hours, after which time the medium plus chemical was removed and the cells were resuspended in 20 ml of fresh medium and incubated for an additional 2 days to express the mutant phenotype. Cell density was moni- tored so that log phase growth was maintained. After the 48-hour expression period, 3 X 10’ cells were plated in medium and soft agar sup- plemented with Tft for selection of Tft-resistant cells (TIC’’’), and 600 cells were plated in non- selective medium and soft agar to determine cloning efficiency. Plates were incubated a t 37°C under 5% carbon dioxide for 10-12 days. All data. were evaluated statistically for both trend and peak response. Both responses had to be significant (P<0.05) for a chemical to be con- sidered capable of inducing Tft resistance; a sin-gle significant response led to a “questionable” conclusion, and the absence of both a trend and a peak response resulted in a “negative” call.
Minimum criteria for accepting an experiment as valid and a detailed description of the statis- tical analysis and data evaluation are presented in Myhr et al. (1985). This assay was initially performed without S9; if a clearly positive re- sponse was not obtained, the experiment was re- peated with induced S9.
Chinese Hamster Ovary Cytogenetics Assays: Testing was performed as reported by Galloway et al. (1985, 1987) and is described briefly below. Chemicals were sent to the laboratories a s coded aliquots, from Radian Corporat ion (Aus t in , Texas). Chemicals were tested in cultured Chi- nese hamster ovary (CHO) cells for induction of sister chromatid exchanges (SCEs) and chromo- somal aberrat ions both in the presence and
absence of Aroclor 1254-induced male Sprague Dawley r a t liver S9 and cofactor mix. Cultures were handled under gold lights to prevent photo- lysis of bromodeoxyuridine (BrdUbsubstituted DNA. Each test consisted of concurrent solvent and positive controls and of at least three doses of the study chemical; the high dose was limited by toxicity or solubility but did not exceed 5 mg/ml.
In the SCE test without S9, CHO cells were incu- bated for 26 hours with the study chemical in McCoy’s 5A medium supplemented with 10% fe- tal bovine serum, L-glutamine (2 mM), and anti- biotics. BrdU was added 2 hours after culture initiation. After 26 hours, the medium contain- ing the study chemical was removed and re- placed with fresh medium plus BrdU and colce- mid, and incubation was continued for 2 more hours. Cells were then harvested by mitotic shake-off, fixed, and stained with Hoechst 33258 and Giemsa. In the SCE test with S9, cells were incubated with the chemical, serum-free medi- um, and S9 for ‘2 hours. The medium was then removed and replaced with medium containing BrdU and no study chemical; incubation pro- ceeded for a n additional 26 hours, with colcemid present for the final 2 hours. Harvesting and staining were the same as for cells treated with- out s9.
In the chromosomal aberration test without S9, cells were incubated in McCoy’s 5A medium with the study chemical for 8 hours; colcemid was added, and incubation was continued for 2 hours. The cells were then harvested by mitotic shake-off, fixed, and stained with Giemsa. For the chromosomal aberration test with S9, cells were treated with the study chemical and S9 for 2 hours, after which the treatment medium was removed and the cells were incubated for 10 hours in fresh medium, with colcemid present for the final 2 hours. Cells were harvested in the same manner as for the treatment without S9.
For the SCE test, if significant chemical-induced cell cycle delay was seen, incubation time was lengthened to ensure a sufficient number of scorable cells. The harvest time for the chromo- somal aberration test was based on the cell cycle information obtained in the SCE test; if cell cycle delay was ant ic ipated, the incubat ion period was extended approximately 5 hours.
2,4C)ichlorophenol,NTP TR 353 28

II. MATERIALS AND METHODS _.--
(?ells were selected for scoring on the basis of good rnorphology and completeness of karyotype (21 k 2 chromosomes) All slides were scored blind, ,md those from a single tcst were read by the same person. For the SCE test, 50 second-division metaphase cells were usually scored for frequency of SCEs per cell from each dose; LOO (more recently, 200) first-division metaphase cells were scored a t each dose for the chromoso- mal aberration test. Classes of aberrations in- cluded simple (breaks and terminal deletions), CO m plex (rearrange men t s and t r a n s 1oca t io ns 1, and other (pulverized cells, despiralized chromo- somes , a n d ce l l s c o n t a i n i n g 10 o r m o r e aberrations).
Statistical an:ilyses wcre conducted or1 both thc slopes of the dose-response curves and the indi-vidual dose points. An SCE frequcncy 20% above the concurrent solvent control value was chosen a s a statistically conservative positive re- sponse. The probability of this level of difference occurring by chance a t o n e dose point is less than 0.01; the probability for such a chance occur- rence a t two dose points is less than 0.001. Chro-mosomal aberration data are presented a s per- centage of cells with aberrations. As with SCEs, both the dose-response curve and individual dose points were statistically analyzed. A statis-tically significant (P<0.003) effect on the slope of the curve or on a dose point (P<0.05) was suf-ficient for a conclusion of positive for a !,est.
29 2,4-Dichlorophenol, NTP TR 353
2,4Dichlorophenol, S T P TR 353 3Cl
III. RESULTS
RATS
FOURTEEN-DAY STUDIES
THIRTEEN- WEEK STUDIES
TWO-YEAR STUDIES Body Weights, Feed Consumption, and Clinical Signs Survival Pathology and Statistical Analyses of Results
MICE
FOURTEEN-DAY STUDIES
THIRTEEN-WEEK STUDIES
TWO-YEAR STUDIES Body Weights, Feed Consumption, and Clinical Signs Survival Pathology and Statistical Analyses of Results
GENETIC TOXICOLOGY
31 2,4-Dichlorophenol, NTI? TK 353

---
--
III. R.ESULTS: RATS
FOU RT 13EN -DAY STUDIES
All rats lived to the end of the studies (Table 7). Clinical signs recorded for r a t s t ha t received 40,000 ppm 2 , 4 - d i c h l o r o p h e n o l i n c l u d e d hunched posture, rough hair coats, and a dehy- drated appearance. For male or female rats that received 40,000 ppm, the f inal mean body weights were lower than the initial mean body weights. The final mean body weight of r a t s that received 20,000 ppm was 19% lower than that of controls for males and 9'70 lower for fe-males. Feed consumption by rats that received 40,000 ppm was about 20% that by controls during the first week of the studies and about 50% duri.ng the second week. Feed consumption by males at 20,000 ppm and females a t all di-etnry coi-~centrations was about 20%-50qo lower than that by controls. The loss in body weight in the 40,000-ppm groups was probably due to the
reduced palatability of the feed mixture a t this concentration of 2,4-dichlorophenol. No com-pound-related lesions were observed a t necropsy.
THIRTEEN-WEEK STUDIES
All ra ts lived to the end of the studies (Table 8). The final mean body weight of rats that received 20,000 or 40,000 ppm 2,4-dichlorophenol was 20% or 40% lower than that of controls for males and 11%or 2170 lower for females. Feed con- sumption by rats in the 40,000-ppm groups was about 7 5 7 ~ 4 5 %that by controls. Rats that re- ceived 40,000 ppm had hunched posture and rough hair coats. Bone marrow atrophy was seen in all males and females a t 20,000 and 40,000 ppm 2,4-dichlorophenol and in 6/10 fe-males a t 10,000 ppm. Both erythroid and my-elocytic elements were depleted.
TABLE 7. SURVIVAL, MEAN BODY WEIGHTS, A S D FEED COXSUMPTION OF RATS I S THE FOURTEEN-DAY FEED STUDIES OF 2,I-DICHLOROPHENOL
Mean Body Weights (grams) Final Weight Relative Feed Con- Concentration Survival Initial (b) Final Change I C ) to Controls . sumption id)
(Ppm) (a) [percent) Week 1 Week 2
MALE
0 515 123 205 +82 14.7 19.1 2.500 515 126 186 +60 91 11.9 18.4 5,000 515 122 20 1 +79 9 s 13.2 17.4
10,000 515 125 199 +74 97 14.8 16.5 20.000 515 128 166 +38 d l 9.- 15.9 40.000 515 127 98 - 29 -18 2.5 6.0
FEMALE
0 515 100 139 +39 16,: 14.5 2.500 515 99 138 +39 99 10.7 12.3 5.000 5/5 98 134 +36 96 12.5 11.8
10,000 515 99 133 + 34 96 9.9 11.4 2OD00 5i5 100 127 +'L: 91 7.8 11.2 -10.000 515 101 92 - 9 66 "3 9.0
rat Number survivtng/nurnber initially in group cb) Ini t ie~lgroup mean body \!eight ( C I Mean body weight change ofthe group id)Grnnis per animal per day; not corrected for scatter
2,4-Dichlorophenol, NTP TR 353 32

TABLEI 8. SURVIVAL, MEAN BODY WEIGHTS, AND FEED CONSUMPTION OF RATS IN THE THIRTEES-WEEK FEED STUDIES OF 2.4-DICHLOROPHENOL
Mean Body Weights (grams) Final Weight Relative Feed Con-Concentration Survival Initial (b) Final Change (c) to Controls sumption (d)
(ppm) (a) (percent) Week 7 Week 13
MALE
0 10110 159 f 3 346 f 5 +187 f 6 14.9 17.4 2,500 10/10 163 k 3 3 4 4 k 5 +181 f 6 99 15.6 16.9 5,000 10/10 166 k 4 337 f 7 +171 f 5 97 13.5 17.6
10,000 10/10 164 f 4 327 f 3 +163 f 6 95 14.6 18.6 20,000 10/10 161 k 3 2 7 8 5 3 + 1 1 7 f 4 80 14.1 16.1 40,000 10/10 163 k 3 206 f 13 + 4 3 +_ 12 60 12.4 12.6
FEMALE
0 10/10 129 i 3 205 k 4 + 7 6 k 4 12.6 12.5 2,500 lo l l0 132 ?l3 1 9 7 f 2 + 6 5 k 3 96 11.9 12.1 5,000 10/10 130 f 3 1 9 0 5 3 + 6 0 f 2 93 9.8 11.7
10,000 10/10 131 f 3 196 f 4 + 6 5 + 3 96 12.2 12.3 20,000 10/10 130 k 3 183 f 2 + 5 3 f 2 89 10.1 11.5 40,000 10/10 129 f 2 162 f 2 +33 f 2 79 10.3 10.1
..-Ia ) Number surviving/number initially in group 1 b ) Initial grouo mean body weight k standard error of the mean I C ) Mean body weight change of the group f standard error ofthe mean ~ d ) Grains per animal per day; not corrected for scatter.
Dose Selection Rationale: Because of lower from week 3 to the end of the study (Table 9 and weight gain and bone marrow atrophy a t higher Figure 3). Mean body weights of high dose fe- concentrations, dietary concentrations selected male rats were 6%-12%lower than those of con- fiir ra ts for the 2-year studies were 5,000 and trols from week 31 to the end of the study. The 10,000 ppm 2,4-dichlorophenol for males and average daily feed consumption by rats in the 2,500and 5,000ppm for females. low dose and high dose groups was 95% of that
by the controls for males and 97% and 94% for fe- TWO-YEAR STUDIES males (Appendix F, Tables F1 and F2). The esti-
mated daily mean consumption of 2,4-dichloro-Body Weights, Feed Consumption, and phenol was 210 or 440 mg/kg for low dose or high Clinical Signs dose male rats and 120 or 250 mg/kg for low dose
Mean body weights of high dose male rats were or high dose female rats. No compound-related generally 5%-11%lower than those of controls clinical signs were observed.
33 2,4-Dichlorophenol, NTP TR 353

TABLE 9. MEAN BODY WEIGHTS AND SURVIVAL OF RATS IN THE TWO-YEAR FEED STUDIES OF 2.4-DICHLOROPHENOL
Weeks Control Low Dose High Dose an Av. Wt. No. of Av. Wt. Wt. (percent No. of Av. Wt. Wt. (percent No. of
Study (grams) Survivors (grams) of controls) Survivors (grams) of controls) Survivors
MALE
0 1 2 3 4 5 6 7 8 9
10 11 12 13 18 22 27 31 36 41 45 50 54 58 63 68 72 76 81 85 89 93 97
L O 1 L03
FEMALE
0 1 2 3 4 5 6 7 8 9
10 11 12 13 18 22 27 31 36 41 45 50 54 58 63 68 72 76 81 85 89 93 97
101 103
121 157 177 215 239 256 271 276 289 299 309 311 324 326 359 387 402 420 433 441 453 459 464 467 470 469 468 469 465 469 466 464 456 443 438
105 123 139 149 160 167 175 177 185 189 193 196 198 199 210 222 23 1 231 239 244 251 257 26.3 271 281 289 295 301 312 314 322 329 332 33 1 334
5,000 ppm 10,000 ppm
50 121 100 50 120 99 50 157 100 50 153 97 50 177 100 50 172 97 50 214 100 50 205 95 50 236 99 50 226 95 50 253 99 50 240 94 50 266 98 50 255 94 50 280 101 50 270 98 50 284 98 50 275 95 50 294 98 SO 284 95 50 302 98 50 291 94 50 311 100 50 297 95 50 323 100 50 307 95 50 321 98 50 310 95 50 351 98 50 335 93 50 375 97 50 360 93 50 385 96 50 368 92 50 403 96 50 384 91 50 412 95 50 395 91 50 422 96 50 404 92 50 432 95 50 412 91 50 442 96 50 416 91 50 444 96 50 423 91 50 445 95 50 427 91 49 451 96 48 4 28 91 49 454 97 46 424 90 48 452 97 46 421 90 48 451 96 45 425 91 47 451 97 43 425 91 46 439 94 41 419 89 45 448 96 39 415 89 44 443 95 37 421 91 35 433 95 3 1 417 91 34 422 95 27 409 92 33 436 100 25 415 95
2,500 ppm 5,000 ppm
50 106 101 50 105 100 50 123 100 50 123 100 50 136 98 50 136 98 50 148 99 50 148 99 50 158 99 50 158 99 50 163 98 50 163 98 50 170 97 50 171 98 50 175 99 50 175 99 50 180 97 50 178 96 50 187 99 50 185 98 50 189 98 50 188 97 50 193 98 50 186 95 50 195 98 50 190 96 50 195 98 50 188 94 50 206 98 50 199 95 50 216 97 50 211 95 50 231 100 49 221 96 50 228 99 49 218 94 J0 233 97 49 223 93 49 241 99 49 228 93 49 243 97 49 229 91 49 248 96 49 231 90 49 253 96 49 240 91 49 261 96 49 244 90 48 268 95 49 250 89 48 277 96 49 254 88 48 280 95 49 262 89 48 284 94 49 268 89 47 297 95 48 275 88 46 299 95 47 281 89 45 308 96 46 288 89 44 316 96 45 288 88 43 319 96 44 304 92 36 323 98 44 301 91 34 331 99 43 306 92
50 50 50 50 50 50 50 50 50 50 50 50 50 50 50 50 50 50 49 49 49 49 49 49 49 48 48 47 47 46 43 41 34 32 32
50 50 50 50 50 50 50 50 50 50 50 50 50 50 50 50 50 50 50 49 49 49 49 49 48 48 47 47 46 45 45 44 41 41 40
2,4-DichIorophenol,NTP TR 353 34

5 0 0 . 0
4 5 0 . 0
v, 4 0 0 . 0I U a 0
3 5 0 . 0z t I c3 5 0 0 . 0W B >-0 0 2 5 0 . 0 m Z 4 W 2 0 0 . 0I
150 .0
100 .0 i
W E E K S ON STUDY
5 0 0 . 8 5ee.t3
4 5 0 . 0 4 5 0 . 0
v) 4 0 0 . 04 0 0 . 0I 4 K Cl
3 5 0 . 0 3 5 0 . 0z t-I 0 3 0 0 . 03 0 0 . 0W 3* 0 0 2 5 0 . 0 2 5 0 . 0 m Z Q W 2 0 0 . 02 0 0 . 0I
150 .0150 .0
1 0 0 . 0 J 0 45 6 0 ? 5 SO 1 5
1 0 0 . 0 I I I , I
W E E K S ON STUDY
FIGURE 3. GROWTH CURVES FOR RATS FED DIETS CONTAINING 2.4-DICHLOROPHENOL FOR TWO YEARS
35 2,4-Dichlorophenol,NTP TR 353
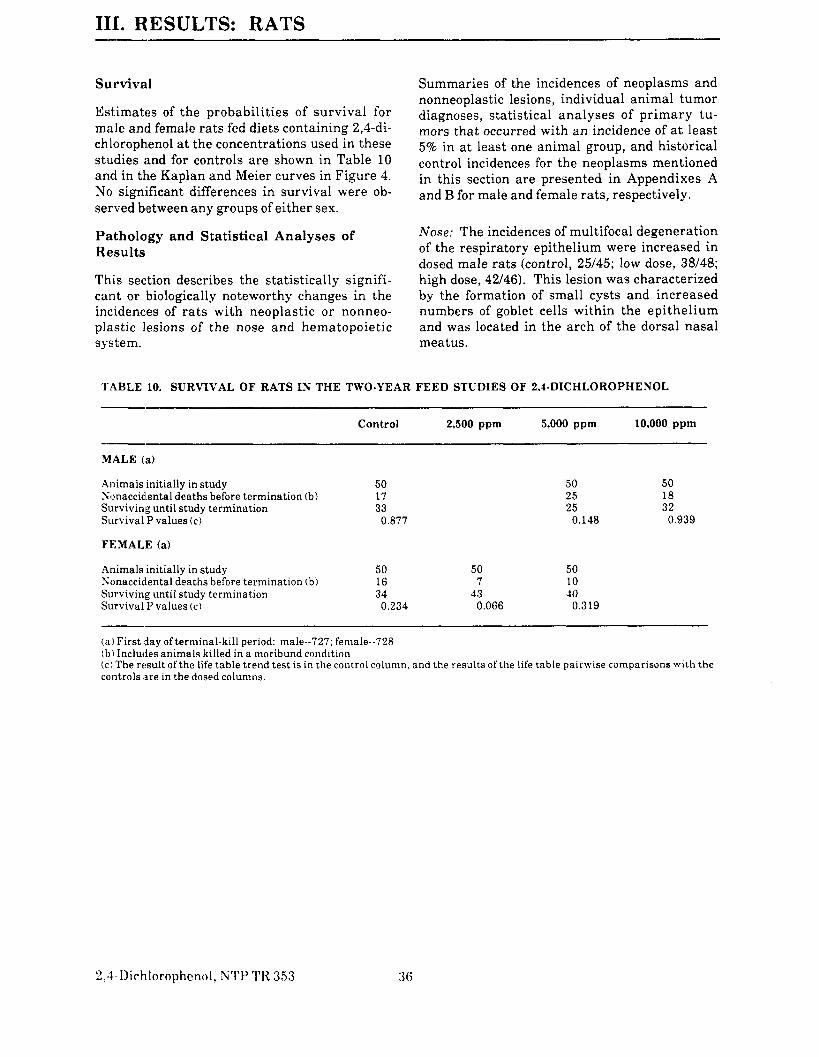
III. RESULTS: RATS
Survival
Estimates of the probabilities of survival for male and female rats fed diets containing 2,4-di- chlorophenol at the concentrations used in these studies and for controls are shown in Table 10 and in the Kaplan and Meier curves in Figure 4. No significant differences in survival were ob-served between any groups of either sex.
Patholo’gy and Statistical Analyses of Resul t s
This section describes the statistically signifi- cant or biologically noteworthy changes in the incidences of r a t s with neoplastic or nonneo- plastic lesions of the nose and hematopoietic system.
Summaries of the incidences of neoplasms and nonneoplastic lesions, individual animal tumor diagnoses, statistical analyses of pr imary tu- mors that occurred with a n incidence of at least 5% in at least one animal group, and historical control incidences for the neoplasms mentioned in this section a re presented in Appendixes A and B for male and female rats, respectively.
Nose: The incidences of multifocal degeneration of the respiratory epithelium were increased in dosed male rats (control, 25/45; low dose, 38/48; high dose, 42/46). This lesion was characterized by the formation of small cysts and increased numbers of goblet cells within the epi thel ium and was located in the arch of the dorsal nasal meatus.
TABLE 10. SURVIVAL OF RATS IN THE TWO-YEAR FEED STUDIES O F 2,4-DICHLOROPHENOL
Control 2,500 ppm 5,000 ppm 10,000 p p m
MALE (a)
Animals initially in study Xonacciclental deaths before termination (b) Surviving until study termination Survival P values (c)
50 17 33 0.877
50 25 25
0.148
50 18 32
0.939
FEMALE (a)
Animals initially in study Nonaccidental deaths before termination tb) Surviving until study termination Survival P values (c)
50 16 34
0.234
50 7
43 0.066
50 10 40
0.319
( a )First $day of terminal-kill period: male-727; female--728 ( b )Includes animals killed in a moribund condition ((9The result of the life table trend test is in the control column, and the results of the life table pairwise comparisons with the controls are in the dosed columns.
‘2;t-l)ichlorophcnol, NTP TI<353 36
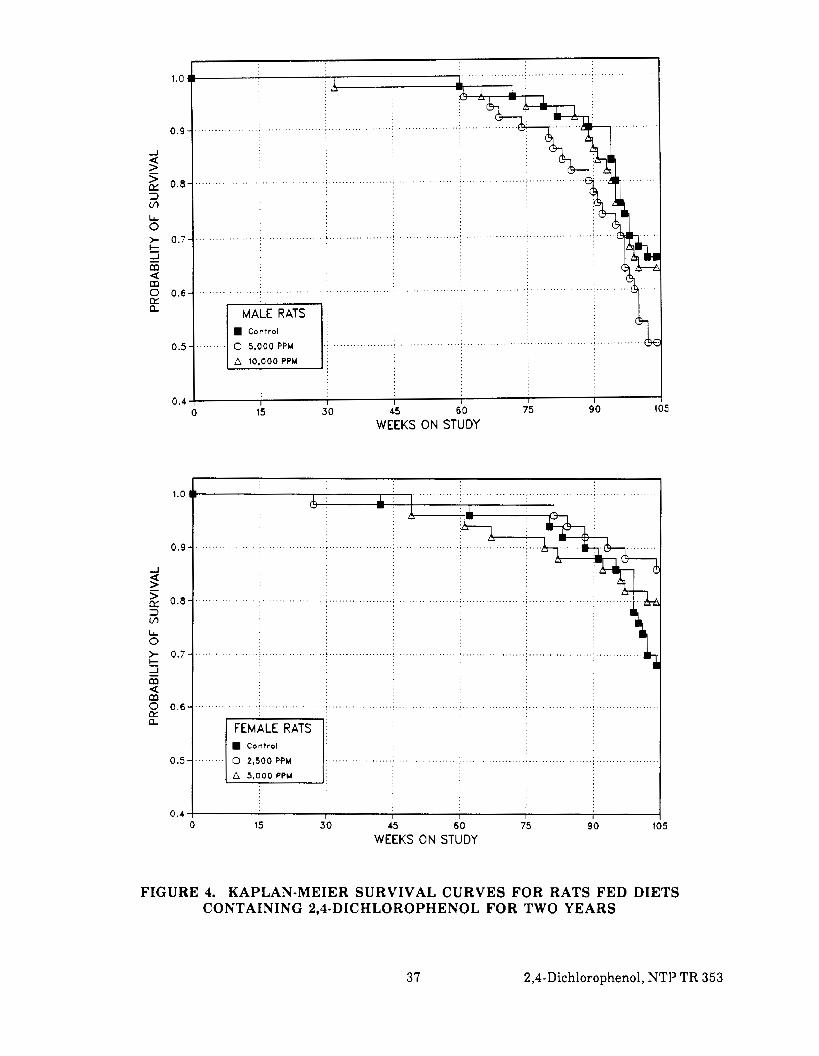
1.0
0.9
0.0
0.7
0.6
0.5 Control
0 5,000 PPM
0.4 I 15
I 30
I I 45 60
WEEKS ON STUDY
I 75
I 90 5
1.0
0.9
L L 0 > 0.7t m a m 0 0.6 E
. . . . . . . . . . . . . I . . . . . . . . . . . . . . . . . . . . . . . . . . . . . . . , . . . . . . . . . . . .I . . . . . . . . . . . . . . . , . . . . . . . . . . .. . . . . . I . . . . . . . . . . . . . . .
0.5 . . . . . . Control
0 2,500 PPM
0 .4 . I
15 I
30 I I
45 60 WEEKS ON STUDY
I
75 I
90 1(
FIGURE 4. KAPLAN-MEIER SURVIVAL CURVES FOR RATS FED DIETS CONTAINING 2,4-DICHLOROPHENOL FOR TWO YEARS
37 2,4-Dichlorophenol,NTP TR 353
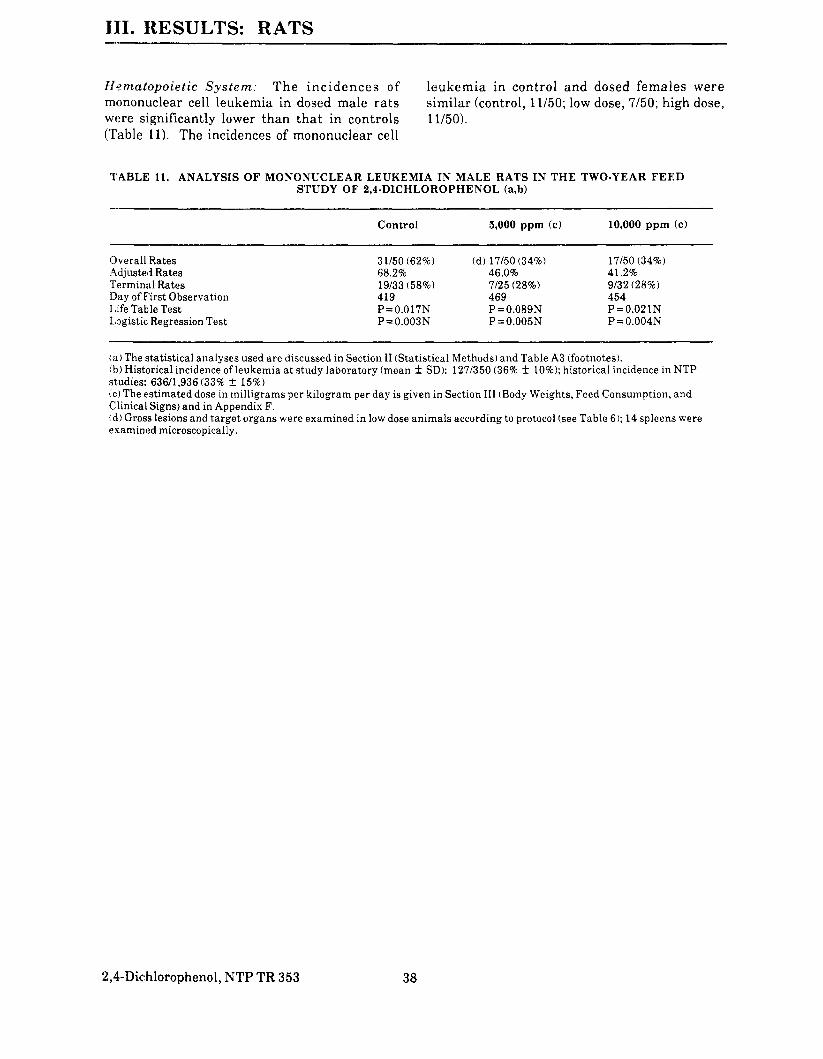
III. RESULTS: RATS
Hematopoietic Sys t em: T h e inc idences of leukemia in control and dosed femaIes were mononuclear cell leukemia in dosed male rats similar (control, 11/50; low dose, 7/50; high dose, were significantly lower than tha t in controls 11/50). (Table 11). The incidences of mononuclear cell
TABLE 11. ANALYSIS OF MONONUCLEAR LEUKEMIA IN MALE RATS IN THE TWO-YEAR FEED STUDY OF 2,4-DICHLOROPHENOL (a,b)
Control 5,000 ppm (c) 10,000 ppm (c)
Overall Rates 31/50 (62%) (d) 17/50 (34%) 17/50 (34%) Adjusted Rates 68.2% 46.0% 41.2% Termini11 Rates 19/33(58%) 7/25 (28%) 9/32 (28%) Day of First Observation 419 469 454 Life Table Test P = 0.017N P =0.089N P =0.021N Logistic Regression Test P =0.003N P=0.005N P=0.004N
1 a) The statistical analyses used are discussed in Section II (Statistical Methods) and Table A3 (footnotes). 1 b) Historical incidence of leukemia at study laboratory (mean k SD): 127!350 (36% f 10%); historical incidence in NTP st.udies: 636/1,936 (33% f 15%) ( c )The estimated dose in milligrams per kilogram per day is given in Section III (Body Weights, Feed Consumption, and Clinical Signs) and in Appendix F. (d )Gross lesions and target organs were examined in low dose animals according to protocol (see Table 6); 14 spleens were examined microscopically.
2,4-Dic:hlorophenol, NTP TR 353 38
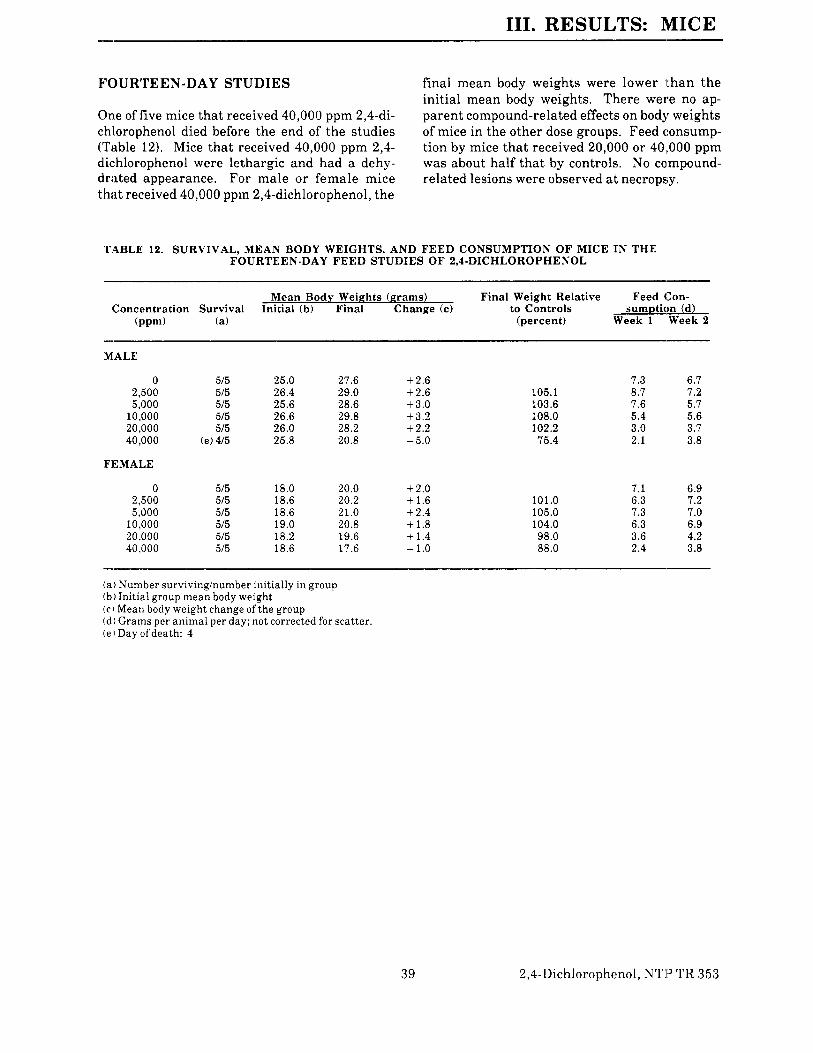
III. RESULTS: MICE
FOURTEEN -DAY STUDIES final mean body weights were lower than the initial mean body weights. There were no ap-
One of five mice that received 40,000 ppm 2,4-di- parent compound-related effects on body weights chlorophenol died before the end of the studies of mice in the other dose groups. Feed consump- (Table 12). Mice that received 40,000 ppm 2,4- tion by mice that received 20,000 or 401,000 ppm dichlorophenol were lethargic and had a dehy- was about half that by controls. No compound-drated appearance. For male or female mice related lesions were observed a t necropsy. that received 40,000 ppm 2,4-dichlorophenol, the
TABLE 12. SURVIVAL, MEAN BODY WEIGHTS, AND FEED CONSUMPTION OF MICE IN THE FOURTEEN-DAY FEED STUDIES OF 2,4-DICHLOROPHENOL
Concentration (ppm)
Survival (a)
Mean Body Weights (grams) Initial (b) Final Change (c)
Final Weight Relative to Controls
(percent)
Feed Con- sumption (d)
Week 1 Week 2
MALE
0 515 25.0 27.6 +2.6 7.3 6.7 2,!500 515 26.4 29.0 +2.6 105.1 8.7 7.2 5,000 515 25.6 28.6 +3.0 103.6 7.6 5.7
10,000 515 26.6 29.8 +3.2 108.0 5.4 5.6 20,000 515 26.0 28.2 +2.2 102.2 3.0 3.7 40,000 (e)415 25.8 20.8 -5.0 75.4 2.1 3.8
FEMALE
0 2,!500
515 515
18.0 18.6
20.0 20.2
+2.0+ 1.6 101.0 7.1 6.3
6.9 7.2
5,000 10,000 20,000
515 515 515
18.6 19.0 18.2
21.0 20.8 19.6
f 2.4 + 1.8 + 1.4
105.0 104.0 98.0
7.3 6.3 3.6
7.0 6.9 4.2
40,000 515 18.6 17.6 - 1.0 88.0 2.4 3.8
( a )Number surviving/number initially in group (11) Initial group mean body weight ( c )Mean body weight change of the group (d )Grams per animal per day; not corrected for scatter. (c1 Day of death: 4
39 2,4-Dichlorophenol, NTI? TR 353

III. RIESULTS: MICE
THIRTEEN-WEEK STUDIES mice. Feed consumption by the 20,000- and 40,000-ppm groups was about 70%-80%of that
All mice that received 40,000 ppm 2,4-dichloro- by the controls at week 13. Rough hair coats phenol died in the first 3 weeks of the studies were seen for male and female mice tha t re- (Table 13). The final mean body weight of male ceived 10,000 ppm or more. A compound-related mice that received 20,000 ppm was 12% lower increase i n the incidence of hepatocel lular than that of controls. Mean body weights of necrosis was observed in male mice (Table 14); female mice in the 20,000-ppm group were about the severity of this lesion in the 2,500-, 5,000-, 10%-154b lower than those of controls for most of and 10,000-ppm groups was minimal. Syncytial the stud,y; this effect was not apparent at the end alteration, characterized by a n increase in mul- of the study, since the mean body weight of con- tinucleated hepatocytes, was also observed in trol fem4ale mice decreased by nearly 10% in the the liver of dosed male mice. Renal tubular epi- final week. There were no apparent compound- thelial necrosis was observed in eight males and related adverse effects in the other groups of three females receiving 40,000 ppm.
TABLE 13. SURVIVAL, MEAN BODY WEIGHTS, AND FEED CONSUMPTION OF MICE IN THE THIRTEEN-WEEK FEED STUDIES OF 2,4-DICHLOROPHENOL
Mean Body Weights (grams) Final Weight Relative Feed Con-Concentration Survival Initial (b) Final Change (c) to Controls sumption (d)
(Ppm) (a) (percent) Week 7 Week 13 I---
MALE
0 (e)9/10 25.3 f 0.4 35.1 f 0.9 +9.9 f 0.6 7.0 7.3 2,500 tf,9/10 24.7 k 0.4 34.1 k 0.6 +9.6 f 0.7 97.2 11.0 7.3 5,000 10/10 25.0 f 0.4 34.9 k 0.8 +9.9 f 0.6 99.4 10.9 7.4
10,000 10/10 24.5 f 0.4 34.5 k 0.6 + 10.0 f 0.4 98.3 3.8 5.7 20,000 10/10 24.4 f 0.4 31.0 k 0.3 +6.6 k 0.3 88.3 3.7 4.5 40,000 (g)O/lO 24.1 f 0.4 (h) (h) (h ) (h) (h )
FEMAL,E
0 10/10 20.3 k 0.3 25.2 & 0.6 +4.9 k 0.5 12.7 7.8 2,500 10/10 21.1 f 0.2 30.3 k 0.8 t 9 . 2 k 0.6 120.2 12.9 7.1 5,000 10/10 20.8 k 0.2 27.2 f 0.6 +6.4 f 0.5 107.9 13.1 10.2
10,000 10/10 20.6 k 0.3 27.1 k 0.3 +6.5 f 0.4 107.5 9.6 6.2 20,o 00 10/10 20.2 f 0.3 25.7 f 0.5 +5.5 f 0.3 102.0 3.6 5.4 40,000 ( i )0/10 20.2 f 0.2 th) (h ) th) ( h ) (h )
( a )Number surviving/number initially in group (b )Initial group mean body weight f standard error of the mean. Subsequent calculations are based on animals surviving to Ihe end of the study. ( c ) Mean body weight change ofthe survivors f standard error of the mean ( d )G r a m per animal per day; not corrected for scatter. (e)Weekofdeath: 1 Cf, Week of death: 9 Cg)Week ofdeath: 1,1,1,1,1,1,2,2,2,3 ( h )No data are reported due to the 100%niortality in this group. 1i)Week.ofdeath: t,1,1,1,1,1,2,3,3,3
%,4-Dichlorophenol,NTP TR 353 40

TABLE 14. INCIDENCES OF LIVER AND KIDNEY LESIONS IN MICE IN THE THIRTEEN-WEEK FEED STUDIES OF 2,4-DICHLOROPHENOL
SiiteLesion 0 2,500 -MALE
Liver Necrosis 0110 4110 Syncytial alteration 0110 0110
Kidney Tubular necrosis 0110 (a)
FEMALE
Liver Necrosis 3110 ( a )
Kidney Tubular necrosis 0110 (a)
(a) Ncit examined
Llose Selection Rationale: Because of the 100% morta.lity in mice of each sex at 40,000 ppm and hepatocellular necrosis in males, dietary concen- trations of 2,4-dichlorophenol selected for mice for the 2-year studies were 5,000 and 10,000 Ppm.
TWO-YEAR STUDIES
Body Weights, Feed Consumpt ion , a n d Clinical Signs
Mean body weights of high dose male mice were generally 3%-9% lower than those of controls be- t.ween week 25 and week 86 (Table 15 and
Concent ra t ion (ppm) 5,000 10,000 20,000 40,000
4/10 6/10 loll0 019 0110 10110 10110 019
(a) ( a ) 0110 819
(a) (a) 2/10 0110
(a) ( a ) 0110 3/10
Figure 5 ) . Mean body weights of high dose fe- male mice were consistently and progressively lower than those of controls throughout t he study. Mean body weights of low dose female mice were 5%-11% lower than those of controls from week 34 to the end of the study. The average daily feed consumption by mice in the low dose and high dose groups was 97(% and 78% of that by the controls for males and 94% and 85% for females (Tables F3 and F4). The estima- ted daily mean consumption of 2,4-dichlorophe- no1 was 800 or 1,300 mg/kg for low dose or high dose male mice and 430 or 820 mg/kg for low dose or high dose female mice. No compound-related clinical signs were observed.
41 2,4-Dichlorophenol, N'TPTR 353
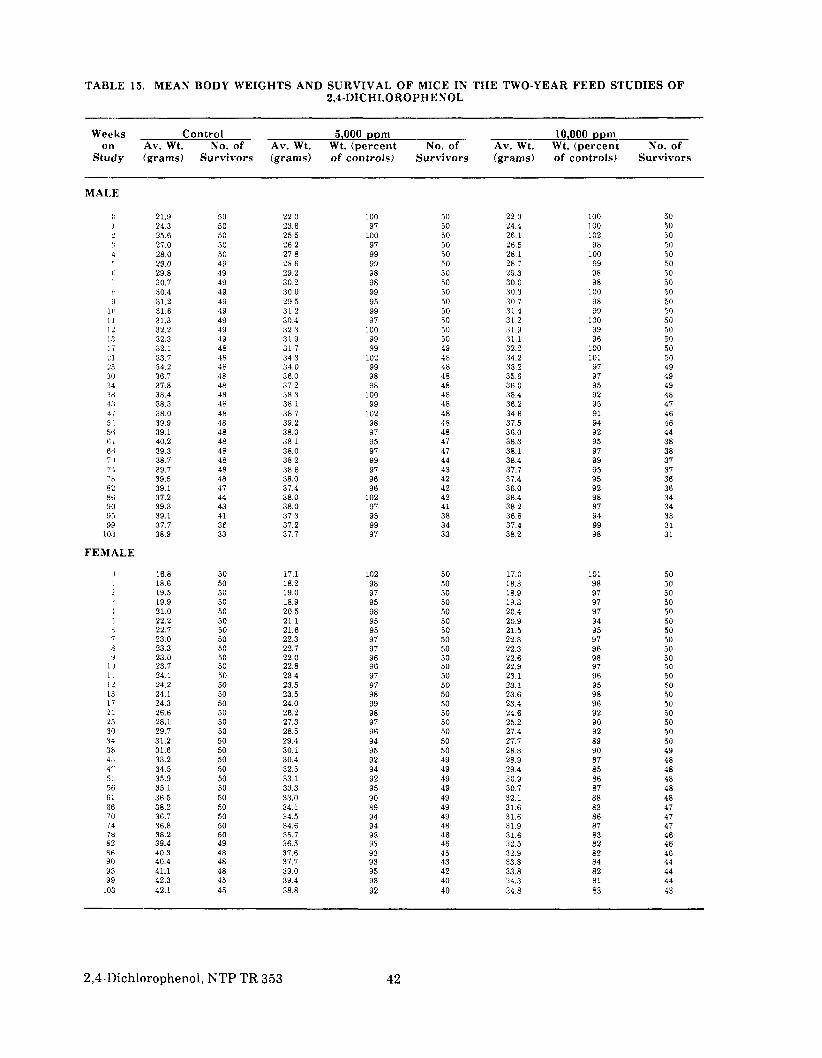
TABLE 15. MEAN BODY WEIGHTS AND SURVIVAL OF MICE IN THE TWO-YEAR FEED STUDIES OF 2,4-DICHLOROPHENOL
Weeks on
Study
- Control Av. Wt. No. of (grams) Survivors
Av. Wt. (grams)
5,000 ppmWt. (percent of controls)
No. of Survivors
Av. Wt. (grams)
10,000 ppmWt. (percent of controls)
No. of Survivors
MAIX
0 1
:I 4
r:
I. i
1 0 I I 1:: 1:I 1'L 2.1 25 30 34 'iH 4:1 47 5 I Sl i f i 1 66 " I I ".$
-0
HZ 8ti 90 $35 1x3
103
FEMALE
1)
>
3 4
c 7 3 I
I I I 1: 1.3 1. 7 21 L, 30 3: 33 I I 4 7 5 1. 56 61 ti6 7 (1 7 4 78
21.9 24.3 25.6 27.0 28.0 29.0 29.8 30.7 30.4 31.2 31.6 31.3 32.2 32.3 32.1 33.7 34.2 36.7 37.8 38.4 38.3 38.0 39.9 39.1 40.2 39.3 38.7 39.7 39.5 39.1 37.2 39.3 39.1 37.7 38.9
16.8 18.6 19.5 19.9 21.0 22.2 22.7 23.0 23.3 23.0
50 50 50 50 50 49 49 49 49 49 49 49 J 9 J 9 48 48 48 48 J 8 46 46 48 48 48 48 48 48 48 48 47 44 43 41 36 33
50 50 50 50 50 50 50 50 50 50
22.0 23.6 25.5 26.2 27.8 28.6 29.2 30.2 30.0 39.5 31.2 30.4 32 .3 31.9 31 7 34.3 34.0 36.0 37 2 38 .3 38.1 38.7 39 2 38.0 38.1 38.0 38.2 38.6 38.0 37.4 38.0 38.0 37 .3 37.2 37.7
17.1 18.2 19.0 18.9 20.5 21.1 21.6 22.3 22.7 22.0
100 97
100 97 99 99 98 98 99 95 99 97
100 99 99
102 99 98 98
100 99
102 98 97 95 97 99 97 96 96
102 97 95 99 97
102 98 97 95 98 95 95 97 97 96
50 50 50 50 50 50 50 50 50 50 50 50 50 50 49 48 48 48 48 48 48 48 48 48 47 47 44 43 42 42 42 41 38 34 3 3
50 50 50 50 50 50 50 50 50 50
22.0 24.4 26.1 26.5 28.1 28.7 29.3 30.0 30.3 30.7 31.4 31.2 31.9 31.1 32.2 34.2 33.2 35.6 36.0 35.4 36.2 34.6 37.5 36.0 38.3 38.1 38.4 37.7 37.4 36.0 36.4 38.2 36.8 37.4 38.2
17.0 18.3 18.9 19.3 20.4 20.9 21.5 22.3 22.3 22.6
100 100 102 98
100 99 98 98
100 98 99
100 99 96
100 101 97 97 95 92 95 9 1 94 92 95 97 99 95 95 92 98 97 94 99 98
101 98 97 97 97 94 95 97 96 98
50 50 50 50 50 50 50 50 50 50 so 50 50 50 50 50 49 49 49 48 47 46 46 44 38 38 37 37 36 36 34 34 33 31 31
50 50 50 50 50 50 50 50 50 50
1:) 1 23.7 50 22.8 96 50 22.9 97 50 ?4.1 24.2 24.1 24.3 26.6 28.1 29.7 31.2 31.6 33.2 34.5 35.9 35.1 36.5 38.2 36.7 36.8 38.2
50 50 50 50 50 50 50 50 50 50 so 50 50 50 50 50 50 50
23.4 23.5 23.5 24.0 26.2 27.3 28.5 29.4 30 .1 30.4 32 .5 33.1 33.3 33.0 34.1 34.5 34.6 35.7
97 97 98 99 98 97 96 94 95 92 94 92 95 90 89 94 94 93
50 50 50 50 50 50 50 50 50 49 49 49 49 49 49 49 48 46
23.1 23.1 23.6 23.4 24.6 25.2 27.4 27.7 28.3 28.9 ?9.4 30.9 30.7 32 .1 31.6 31.6 31.9 31.6
96 95 98 96 92 90 92 89 90 87 8 5 86 87 8 8 83 86 87 83
50 50 50 50 50 50 50 50 49 48 48 48 48 48 47 41 47 46
:?(j 39.4 49 36.5 93 46 32.5 8 2 46 8 6 40.3 48 37.6 93 45 92.9 82 46 90 40.4 48 37.7 93 43 33.8 84 44 95 41.1 48 39.0 95 42 33.8 82 44 913 42.3 45 39.4 93 40 '14.3 81 44
.03 42.1 4 5 38.8 92 40 34.8 83 43
2,4-I)ichlorophenol,NTP TR 353 42

45 .0 45 0
4 0 . 0
3 5 . 0
3 0 . 0
2 5 . 0
2 0 . 0
15.0
4 5 . 0
4 0 . 0
3 5 . 0
3 0 . 0
2 5 . 0
2 0 . 0
15 .0
4 0 . 0
3 5 0
3 0 0
2 5 . 0
2 0 . 0
15.13
4 5 . 0
4 0 . 0
3 5 . 0
3 0 . 0
2 5 . 0
2 0 . 0
15.0
FIGURE 5. GROWTH CURVES FOR MICE FED DIETS CONTAINING 2,I-DICHLOROPHENOL FOR TWO YEARS
43 2,4-Dichlorophenol,NTP TR 353
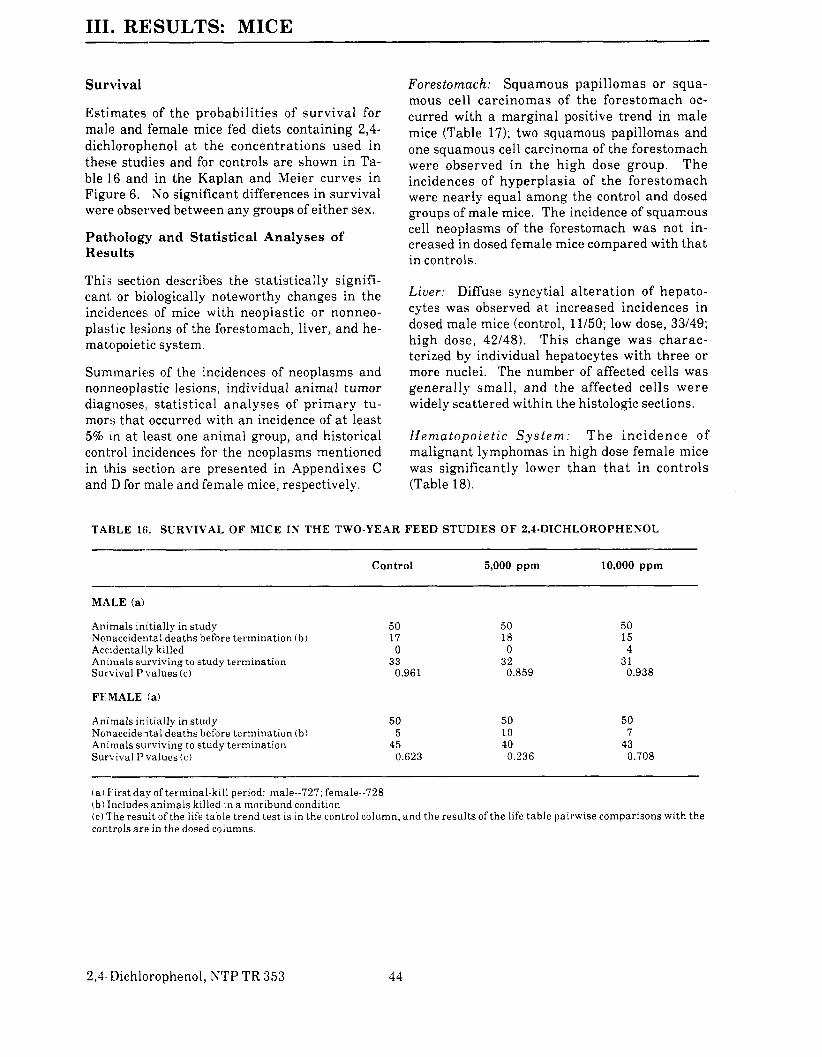
III. RESULTS: MICE
Survival Forestomach: Squamous papillomas or squa-mous cell carcinomas of the forestomach oc-
Estimates of the probabilities of survival for curred with a marginal positive trend in male male and female mice fed diets containing 2,4- mice (Table 17); two squamous papillomas and dichlorophenol at the concentrations used in one squamous cell carcinoma of the forestomach these studies and for controls are shown in Ta- were observed in the high dose group. T h e ble L6 and in the Kaplan and Meier curves in incidences of hyperplasia of the forestomach Figure 6. No significant differences in survival were nearly equal among the control and dosed were observed between any groups of either sex. groups of male mice. The incidence of squamous
cell neoplasms of the forestomach was not in- Pathology and Statistical Analyses of creased in dosed female mice compared with that Results in controls. This section describes the statistically signifi-
Liver: Diffuse syncytial a l terat ion of hepato-cant, or biologically noteworthy changes in the cytes was observed a t increased incidences in incidences of mice with neoplastic or nonneo-dosed male mice (control, 11150; low dose, 33149; plastic lesions of the forestomach, liver, and he- high dose, 42148). This change was charac- mat,opoie t ic system. terized by individual hepatocytes with three or
Summaries of the incidences of neoplasms and more nuclei. The number of affected cells was nonneoplastic lesions, individual animal tumor generally small, and the affected cells were diagnoses, statistical analyses of pr imary tu- widely scattered within the histologic sections. mors that occurred with a n incidence of at least 5% in at least one animal group, and historical Hematopoie t ic S y s t e m : T h e inc idence of control incidences for the neoplasms mentioned malignant lymphomas in high dose female mice in this section a re presented in Appendixes C was significantly lower than tha t in controls and I> for inale and female mice, respectively. (Table 18).
TABLE 16. SURVIVAL OF MICE I N T H E TWO-YEAR F E E D STUDIES O F P94-DICHLOROPHENOL
Control 5,000 ppm 10,000 ppm
MALE (a)
Animals initially in study 50 50 50 Nonaccidental deaths before termination (b ) 17 18 15 Accidentally killed 0 0 4 Animals surviving to study termination 33 32 31 Survival P values ( c ) 0.961 0.859 0.938
FEMALE (a)
Animals initially in study 50 50 50 Nonaccidental deaths before termination (b) 5 10 7 Animals surviving to study termination 45 40 43 Survival P values (c) 0.623 0.236 0.708
( a )First day of terminal-kill period: male-727; feniale--728 (b)Includes animals killed in a moribund condition (c)The result of the life table trend test is in the control column, and the results of the life table pairwise comparisons with the controls a r e in the dosed columns.
2,4.Dichlorophenol, NTP TR 353 44
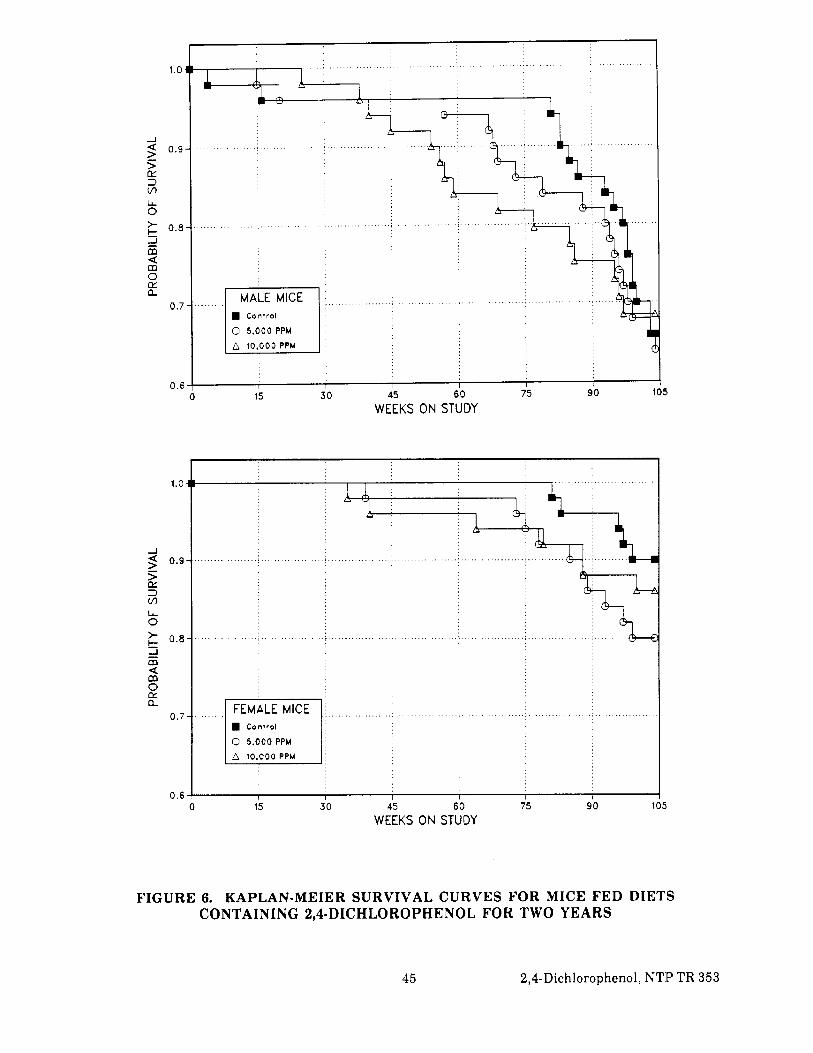
1.0
0.9
0.8
MALE MICE . .0.7 Control
0 5.000 PPM I-1A 10,000PPM
0.6 I I I I I I 15 30 45 60 75 90
WEEKS ON STUDY
1.0
0.9
0.8
0.7 Control
0 5.000 PPM
0.6 I I I I I I 15 30 45 60 75 90
WEEKS ON STUDY
FIGURE 6. KAPLAN-MEIER SURVIVAL CURVES FOR MICE FED DIETS CONTAINING 2,4-DICHLOROPHENOL FOR TWO YEARS
45 2,4-Dichlorophenol,NTP TR 353

TABLE 17. ANALYSIS OF FORESTOMACH LESIONS I N MICE IN THE TWO-YEAR FEED STUDIES OF 2,4-DICHLOROPHENOL (a)
-."--Control 5,000 ppm (b\ 10,000 ppm (b)
MALE
Hyperplasia Overall Rates 5/50(10%) 6/50(12%) 4/50 (8%)
Squamous Papilloma or Squamous Cell Carcinoma (c) Overall Rates 0150 (0%) (d)0150 3/50 (6%) Adjusted Rates 0.0% 0.0% 9.7% rerminal Rates 0/33 (0%) 0/32 (0%) 3/31 (10%) [lay of First Observation 727 Life Table Tests P=0.033 (e) P=O.110 Logistic Regression Tests P=0.033 (e) P=O.110
FEMALE
Hyperplasia Overall Rates 10/50 (20%) 10/50 (20%) 4/50 (8%)
Squamous Papilloma or Squamous Cell Carcinoma (0 Overall Rates 4/50 (8%) td) 3/50 (6%) 4 /50 (0%)
( a )The statistical analyses used are discussed in Section II (Statistical Methods) and Table D3 (footnotes). ( b )The estimated dose in milligrams per kilogram per day is given in Section III (Body Weights, Feed Consumption, and Clinical Signs)-and in Appendix F. (c Historii:al incidence of stomach squamous cell tumors at study laboratory (mean f SD): 1/329 (0.3% f 0.8%);historical incidence In NTP studies: 8/1,986 (0.4% f 0.9%) tdj Gross Il?sions and target organs were examined in low dose animals according to protocol (see Table 6). (elNo P value is reported because no tumors were observed in the 5,000-ppm and control groups. tfi fIistorica1 incidence of stomach squamous cell tumors a t study laboratory (mean f SD): 2/342 (0.6% f 0.8%);historical incidence i.n NTP studies: 18/1,994 (0.9% f 2%)
T.ZBLE 18. ANALYSIS OF MALIGNANT LYAMPHOMAS IN FEMALE MICE IN THE TWO-YEAR FEED STUDY OF 2,4-DICHLOROPHENOL (a)
-.....-
Control 5,000 ppm 10,000 ppm -."I.-
Oirra l l Riites 12/50 (24%) (b)6/50(12%) 4150 (8%)Adjusted Rates 26.1% 14.1% 9 3% Tcirminal Rates 11/45 (24%) 4/40(10%) 4/43 (9%) Day of First Observation 679 616 728 Life Table Tests P = 0.025N P=0.156N P=0.036N Logistic Regression Tests P=0.022N P=0.118N P=0.036N
( a )Historical incidence of lymphomas or leukemia (combined) a t study laboratory (mean f SD): 97/349 (28% f 10%); historical incidence in NTP studies: 636/2,040 (31% f 13%) (b )Gross lesions and target organs were examined in low dose animals according to protocol (see Table 6); five livers and nine spleens were examined microscopically.
2,3-Dichlorophenol,NTP TR 353 46

III. RESULTS: GENETIC TOXICOLOGY
2,4-Dichlorophenol exhibited a n equivocal re- sponse 5or mutagenicity in Salmonella typhi-murium st ra in TA1535 when exposure occurred in the presence of Aroclor 1254-induced male Syrian hamster liver S9; the chemical produced no increases in rever tant colonies in s t ra ins TA98, TA100, or TA1537 with or without Aro- clor 1254-induced male Sprague Dawley rat or Syrian hamster liver S9 (Haworth et al., 1983; Table 1'9). 2,4-Dichlorophenol increased the number of trifluorothymidine-resistant cells in
the mouse L5178Y assay without exo,genous metabolic activation; it was not tested i n the presence of S9 (Table 20). In cytogenetic tests with cultured Chinese hamster ovary cells, 2,4- dichlorophenol caused a significant increase in the frequency of s is ter chromatid exchanges both in the presence and absence of S9 (Table 21) but did not induce chromosomal aberrations with or without Aroclor 1254-induced male Sprague Dawley ra t liver S9 (Table 22).
47 2,4-Dichlorophenol, S T P TR 353

TABLE 19. MUTAGENICITY OF 2,4-DICHLOROPHENOL IN SALMONELLA TYPHlMURlUM (a)
RevertantdPlate (b)Strain Dose - s 9 t S9 (hamster) t S 9 (rat)
(pdplate) Trial 1 Trial 2 Trial 1 Trial 2 Trial 1 Trial 2
TA100 0 115 f 8.3 148 f7.5 121 f 3.8 156 f 4.1 104 f 7.8 117 f 18.1 3.3 105 f 7.3 146 f6.4 118 f 0.7 134 & 10.5 108 f 5.2 146 f 2.3
10 117 f 8.3 134 f2.6 129 f 7.5 143 rf: 4.8 101 f 2.0 131 f 6.1 33 108 f 9.0 144 f 3.8 112 f 9.7 141 f 6.6 114 ? 6.7 145 f 6.4
100 113 k 10.1 143 f 1.5 I52 f 10.5 145 rf: 4.9 130 2 1.7 144 f 7.6 333 Toxic Toxic (c) 107 f 9.3 (c) 124 f 20.5 (c)100 f 15.3 ( ~ 1 8 7f 2.1
Trial summary Negative Negative Equivocal Negative Negative Negative Positive control (d) 1,490 k 67.6 2,172 k 56.8 2500 i 5 9 . 8 1,086 f 8 1 . 9 1,171 f 36.2 1,139 f 57.5
T41535 0 20 f 2.3 27 f0.3 11 1 3 . 2 8 f0.9 12 ? 1.5 10 f 1.2 3.3 13 h 1.3 20 f 4.3 9 f 0.9 10 f 0.9 8 f 1.7 10 rf: 1.2
10 21 k 1.2 23 f 3.5 15 rf: 1.7 10 f 1.7 10 k 1.5 9 f 2.6 33 24 k 5.7 27 f 2.9 13 f 1.2 15 F 2.5 15 k 2.7 11 F 1.3
100 20 k 1.5 30 h 1.9 21 f 1.5 14 ? 0.9 14 f 1.8 15 f 4.7 333 Toxic Toxic ( c )21I 1.5 ( c )17 f 0.7 (c ) 18 F 1.5 13 F 2.0
T,.in.l summary Negative Negative Weakly Equivocal Negative Negative positive
Pii!.itivecontrol(d) 1,232 ? 47.6 1,876 k 33.0 158 rf: 3.7 71 f 2.2 81 f 11.3 64 h 1.0
TA1537 0 9 f 1.2 10 f 2.8 11 k 3 . 5 9 k 1.5 12 f 0.6 9 i 1.8 3.3 9 ? 1.8 9 f 1.2 10 ? 0.7 13 ?I 1.2 13 f 1.0 8 f 1.3
10 8 k 2.3 10 f 1.2 12 k 2.5 10 f 2.0 10 f 1.7 9 f 1.2 33 6 i0.3 9 h 0.6 9 f 1.5 8 k 1.5 12 f 1.2 7 h 2.3
100 6 f 1.0 8 f 1.5 8 f 1.2 7 k 0.3 13 k 2.0 6 f 0.7 333 Toxic Toxic ( c ) 9 k 0.6 9 f 0.9 ( c )4 k 0.6 ( c )5 F 1.2
T . i d summary Negative Negative Negative Negative Negative Negative Pwiitive control (d) 700 F 50.7 537 k 386.0 278 f 11.5 137 & 5.8 133 h 1.5 72 f 3.6
TA98 0 19 F 2.8 16 h 1.0 28 i 1.0 28 2 2.3 23 h 3.2 29 k 0.6 3.3 20 iz 2.3 22 f 2.4 33 f 1.2 32 k 7.0 24 t 2.0 24 * 3.5
10 28 h 3.3 17 k 0.7 30 f 2.3 32 h 5.6 31 i 1.7 22 f 6.2 33 20 k 3.6 23 F 0.3 28 iz 3.7 24 k 2.5 27 f 3.8 28 k 1.0
100 18 _+ 2.0 19 ?I0.0 24 k 5.5 19 k 1.2 25 _+ 1.2 19 f 4.0 333 Toxic (c) 10 k 1.7 (c) 18 f 3.1 21 k 2.2 (c) 14 F 0.3 17 1 3 . 2
T u a l summary Negative Negative Negative Negative Negative Negative Pzbsitive c ~ n t r o l td) 1,253 i 20.3 1,827 f 8.7 1,768 k 33.0 1,639 h 36.9 1,239 F 12.8 1,385 k 63.8
( a 1 Study performed a t EG&G Mason Research Institute. The detailed protocol IS presented in Haworth et al. (19831. Cells and study compound or solvent (dimethyl sulfoxide) were incubated in the absence of exogenous metabolic activation ( -S9) or with Arriclor 1254-induced S9 from male Syrian hamster liver or male Sprague Dawley rat liver. High dose was limited by toxicity or solubil,.ty; 0 pg/plate dose is the solvent control. ( b I Revertants are presented as niean i standard error from three plates. ( c ) Slight Loxicity ((11 Positive control; 2-aminoanthracene was used on all strains in the presence ofS9. In the absence of metabolic activation, 4-nitro-o-p~ienylenediaminewas tested on TA98, sodium azide was tested on TA100 and'TA1535, and 9-aniinoacridine was tested 01.1 TA1537.
2.3-Dichlorophenol,NTP TR 353 48
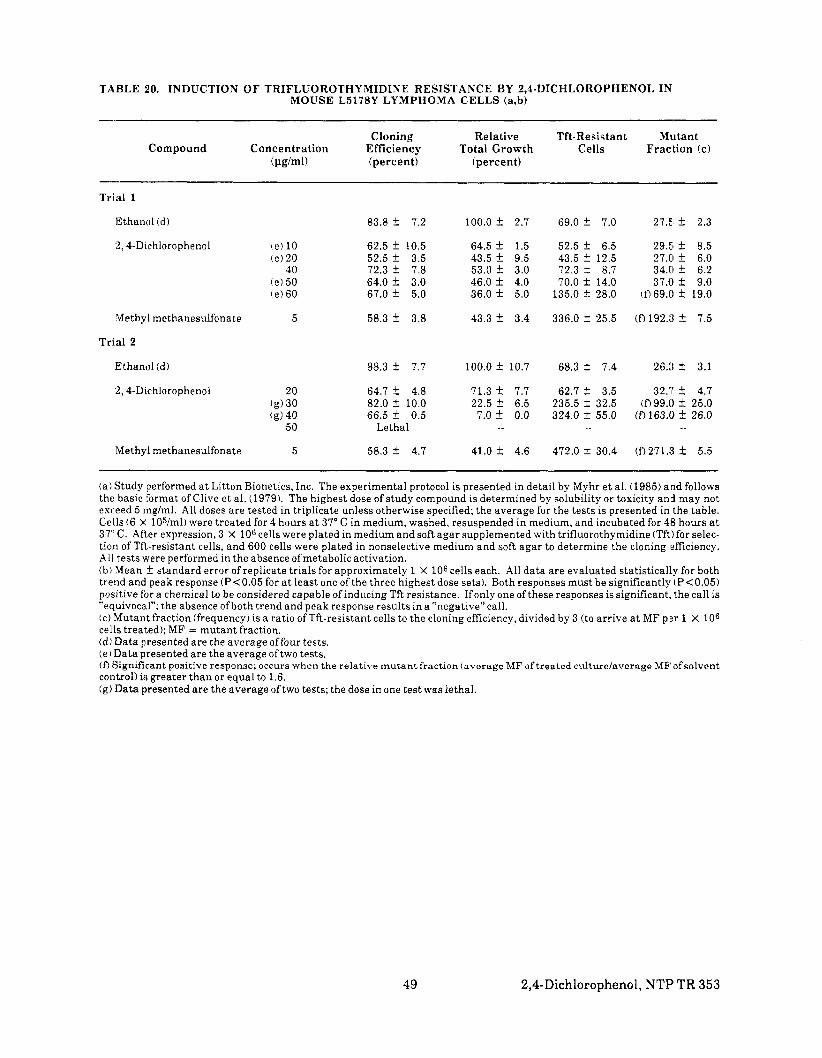
TABLE 20. INDUCTION OF TRIFLCOROTHYMIDINE RESISTANCE BY 2,I-DICHLOROPHENOL IN MOUSE L5178Y LYMPHOMA CELLS (a,b)
Compound Concent ra t ion (pg/ml)
Cloning Efficiency (percent )
Relative Total Growth
(percent )
Tft-Resis tant Cells
Mutant Frac t ion (c)
-._.-Trial 1
Ethanol (d) 83.8k 7.2 100.0f 2.7 69.0f 7.0 27.5,f 2.3
2,4-Dichlorophenol (e)10 (e)20 40
62.5f 10.5 52.5f 3.5 72.3k 7.8
64.5f 1.5 43.5f 9.5 53.0F 3.0
52.5f 6.5 43.5f 12.5 72.3k 8.7
29.51k 8.5 27.0f 6.0 34.0f 6.2
(e)50 (e)60
64.0k 3.0 67.0f 5.0
46.0f 4.0 36.0f 5.0
70.0f 14.0 135.0f 28.0
37.0f 9.0 (069.0f 19.0
Methyl methanesulfonate 5 58.3k 3.8 43.3i 3.4 336.0f 25.5 (0192.3F 7.5 Trial 2
Ethanol (d) 88.3f 7.7 100.0f 10.7 68.3f 7.4 26.3k 3.1
2,4-Dichlorophenol 20 (g)30 (g)40
50
64.7k 4.8 82.0f 10.0 66.5f 0.5
Lethal
71.3f 7.7 22.5f 6.5 7.0f 0.0
62.7f 3.5 235.5k 32.5 324.0f 55.0
32.7f 4.7 (099.0rf: 25.0 (D163.0k 26.0 _ _
Methyl methanesulfonate 5 58.3f 4.7 41.0f 4.6 472.0f 30.4 (0271.3k 5.5
(a)Study performed at Litton Bionetics, Inc. The experimental protocol is presented in detail by Myhr e t al. (1985)and follows the basic ,format of Clive e t al . (1979).The highest dose of study compound is determined by solubility or toxicity an’d may not exceed 5 mg/ml. All doses are tested in triplicate unless otherwise specified; the average for the tests is presented in the table. Cells (6 X lO5/ml) were treated for 4 hours at 37”C in medium, washed, resuspended in medium, and incubated for 48hours at 37°C.After expression, 3 X 10⁶cells were plated in medium and soft agar supplemented with trifluorothymidine (Tft) for selec- tion of Tft-resistant cells, and 600 cells were plated in nonselective medium and soft agar to determine the cloning efficiency. All tests were performed in the absence of metabolic activation. (bb Mean f standard error of replicate trials for approximately 1 X 10⁶ cells each. All data are evaluated statistically for both trend and peak response (P<0.05 for at least one ofthe three highest dose sets). Both responses must be significantly (P<0.05) positive for a chemical to be considered capable of inducing Tft resistance. If only one of these responses is significant, the call is “equivoca.1”; the absence of both trend and peak response results in a “negative” call. (c )Mutant fraction (frequency) is a ratio of Tft-resistant cells to the cloning efficiency, divided by 3 (to arrive at M F pi?r 1 X 10⁶ cells treated); MF = mutant fraction. (d t Data presented are the average offour tests. (e1 Data presented are the average of two tests. (D Significant positive response; occurs when the relative mutant fraction (average MF of treated culture/average M F of solvent control) is greater than or equal to 1.6. (g)Data presented a re the average oftwo tests; the dose in one test was lethal.
49 2,bDichlorophenol, NTP TR 353
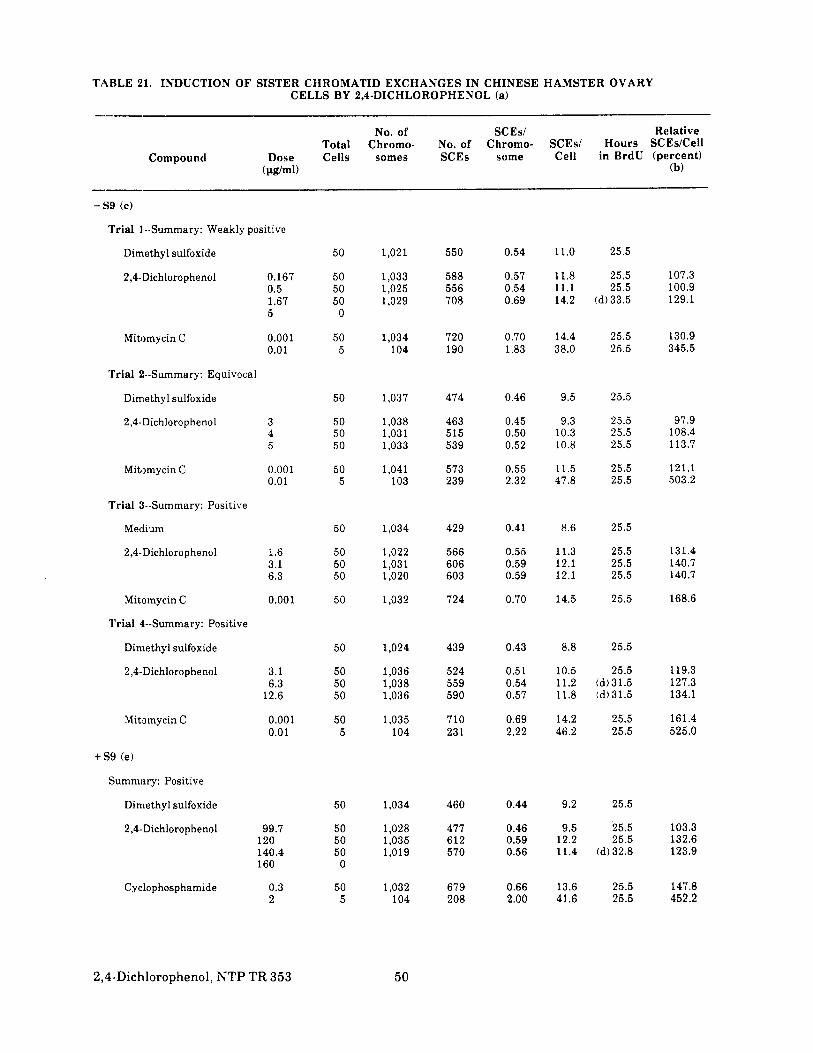
TABLE 21. INDUCTION OF SISTER CHROMATID EXCHANGES IN CHINESE HAMSTER OVARY CELLS BY 2,4-DICHLOROPHENOL (a)
~~~~
No. of SCEs/ Relative Total Chromo- No. of Chromo- SCEs/ Hours SCEs/Cell
Compound Dose Cells somes SCEs some Cell in BrdU (percent)(Wrn1) (b)
-s9 (c)
Trial I --Summary: Weakly positive
Dimethyl sulfoxide 50 1,021 550 0.54 11.0 25.5
2,4- Dichlorophenol 0.167 50 1,033 588 0.57 11.8 25.5 107.3 0.5 50 1,025 556 0.54 11.1 25.5 100.9 1.67 50 1,029 708 0.69 14.2 (d) 33.5 129.1 5 0
Mitomycin C 0.001 50 1,034 720 0.70 14.4 25.5 130.9 0.01 5 104 190 1.83 38.0 25.5 345.5
Trial Z!--Summary: Equivocal
Dimethyl sulfoxide 50 1,037 474 0.46 9.5 25.5
2,4-Dichlorophenol 3 50 1,038 463 0.45 9.3 25.5 97.9 4 50 1,031 515 0.50 10.3 25.5 108.4 5 50 1,033 539 0.52 10.8 25.5 113.7
Mitomycin C 0.001 50 1,041 573 0.55 11.5 25.5 121.1 0.01 5 103 239 2.32 47.8 25.5 503.2
Trial 31-Summary: Positive
Medium 50 1,034 429 0.41 8.6 25.5
2,4-Dichlorophenol 1.6 50 1,022 566 0.55 11.3 25.5 131.4 3.1 50 1,031 606 0.59 12.1 25.5 140.7 6.3 50 1,020 603 0.59 12.1 25.5 140.7
Mitomycin C 0.001 50 1,032 724 0.70 14.5 25.5 168.6
Trial 41--Summary: Positive
Dimethyl sulfoxide 50 1,024 439 0.43 8.8 25.5
2,4-Dichlorophenol 3.1 50 1,036 524 0.51 10.5 25.5 119.3 6.3 50 1,038 559 0.54 11.2 (d)31.5 127.3
12.6 50 1,036 590 0.57 11.8 (d)31 .5 134.1
Mitomycin C 0.001 50 1,035 710 0.69 14.2 25.5 161.4 0.01 5 104 231 2.22 46.2 25.5 525.0
t S 9 (e)
Summary: Positive
Dimethyl sulfoxide 50 1,034 460 0.44 9.2 25.5
2,4-Dichlorophenol 99.7 50 1,028 477 0.46 9.5 25.5 103.3 120 50 1,035 612 0.59 12.2 25.5 132.6 140.4 50 1,019 570 0.56 11.4 (d) 32.8 123.9 160 0
Cyclop hosphamide 0.3 50 1,032 679 0.66 13.6 25.5 147.8 2 5 104 208 2.00 41.6 25.5 452.2
'2,4-DicEilorophenol,NTP TR 353 50
TABLE 121. INDUCTION OF SISTER CHROMATID EXCHANGES IN CHINESE HAMSTER OVARY CELLS BY 2,I-DICHLOROPHENOL (Continued)
( a )Study performed at Litton Bionetics, Inc. SCE = sister chromatid exchange; BrdU = bromodeoxyuridine. A detailed de- scription of the SCE protocol is presented by Galloway e t al. (1985). Briefly, Chinese hamster ovary cells were incubated with study compound or solvent (dimethylsulfoxide) a s described in (c) and (e) below, and cultured for sufficient time to reach second metaphasmedivision. Cells wete then collected by mitotic shake-off, fixed, air-dried, and stained. (blSCEs/cell of culture exposed to study chemical relative to those of culture exposed to solvent ( e l In the :absence ofS9, cells were incubated with study compound or solvent for 2 hours at 37" C. Then BrdU was added and in- cubation was continued for 24 hours. Cells were washed, fresh medium containing BrdU and colcemid was added, and incuba- tion was continued for 2-3 hours. td) Becawe some chemicals induce a delay in the cell division cycle, harvest times are occasionally extended to maximize the proportion of second division cells available for analysis. ( e )In the presence of S9, cells were incubated with study compound or solvent for 2 hours at 37"C. The cells were then washed, and medium containing BrdU was added. Cells were incubated for a further 26 hours, with colcemid present for the final 2-3 hours. S9was from the liver of Aroclor 1254-induced male Sprague Dawley rats.
5 'I 2,4-Dichlorophenol, NTP TR 353
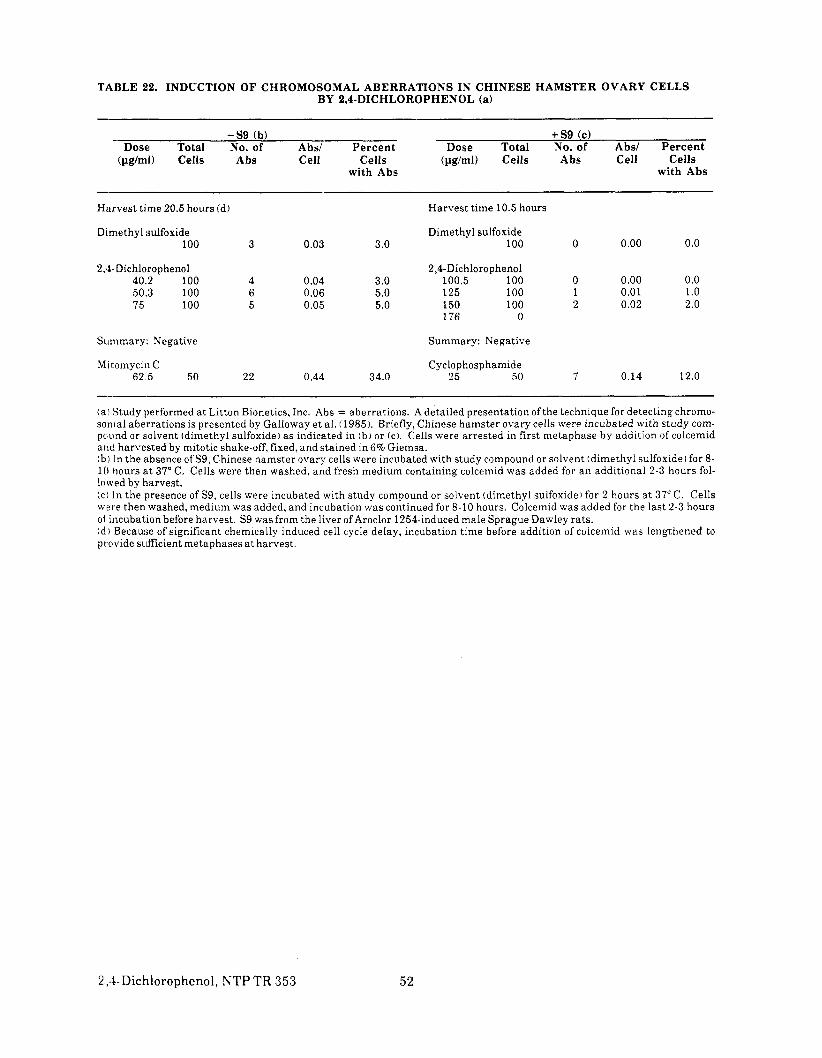
TABLE 22. INDUCTION OF CHROMOSOMAL ABERRATIONS IN CHINESE HAMSTER OVARY CELiLS BY 2,4-DICHLOROPHENOL (a)
_- -S9 (b) +s9 ( C l Dose Total No. of Absl Percent Dose Total No. of Abs/ Percent
@g/ml) Cells Abs Cell Cells (pg/ml) Cells Abs Cell Cells with Abs with Abs
~~~ ~~~~ ~ ~ ~~.
Harvest time 20.5 hours (d) Harvest time 10.5 hours
Dimethyl sulfoxide Dimethyl sulfoxide 100 3 0.03 3.0 100 0 0.00 0.0
2.4- Dichlorophenol 2,4-Dichlorophenol 40.2 100 4 0.04 3.O 100.5 100 0 0.00 0.0 50.3 100 6 0.06 5.0 125 100 1 0.01 1.o 75 100 5 0.05 5.0 150 100 2 0.02 2.0
176 0
Siinimary. Negative Summary: Negative
Mitomycin C Cyclophosphamide 62.5 50 22 0.44 34.0 25 50 7 0.14 12.0
( a )Study performed a t Litton Bionetics, inc. Abs = aberrations. A detailed presentation ofthe technique for detecting chromo- somal aberrations is presented by Galloway et al. (1985). Briefly, Chinese hamster ovary cells were incubated with study com- pc'und or siolvent (dimethyl sulfoxide) as indicated in (b ) or (c). Cells were arrested in first metaphase by addition of colcemid arid harvested by mitotic shake-off, fixed, and stained in 6%Giemsa. tb) In the absence of S9, Chinese hamster ovary cells were incubated with study compound or solvent (dimethyl sulfoxide) for 8-10 hours a t 37" C. Cells were then washed, and fresh medium containing colcemid was added for a n additional 2-3 hours fol- lowed by harvest. ( c ) In the presence of S9, cells were incubated with study compound or solvent (dimethyl sulfoxide) for 2 hours a t 37°C. Cells were then washed, medium was added, and incubation was continued for 8-10 hours. Colcemid was added for the last 2-3 hours of incubation before harvest. S9 was from the liver of Aroclor 1254-induced male Sprague Dawley rats. ( d )Because of significant chemically induced cell cycle delay, incubation time before addition of colcemid was lengthened to provide silfficient metaphases at harvest.
2 ,l-Dichlorophenol,NTP TR 353 52
IV. DISCUSSION AND CONCLUSIONS
53 2,CDichlorophenol, NTP TR 353
--- IV. DISCUSSION AND CONCLUSIONS
Tcixicology and carcinogenesis studies of 2,4-di- chlorophenol, a chemical i n t e rmed ia t e used largely in the manufacture of the herbicide 2,4- dichlorophenoxyacetic acid, were conducted by administ,ration of this chemical (greater t han 99% pure) in NIH 07 Rat and Mouse Ration to male and female F344/N rats and B6C3F1 mice. Tho selection of doses of 2,4-dichlorophenol for the 2-year studies, 5,000 or 10,000 ppm for male ra ts and male and female mice and 2,500 or 5,000 ppm for female rats, was based on results of the 13-week feed studies.
In the 13-week studies, ra ts and mice of each sex were adrninistered 2,4-dichlorophenol in the diet a t concentrations ranging from 2,500 to 40,000 ppm. 2,4-Dichlorophenol a t these concentra- tions did. r:ot cause any deaths in rats; however, final mean body weights of male and female rats that received the higher doses of 2,4-dichloro- phenol were more than 10% lower than those of controls. Bone marrow atrophy, involving both erythroid and myelocytic e lements , was ob-served i n these animals. In a drinking water study in which Sprague Dawley rats were ad- ministered 300 ppm 2,4-dichlorophenol in a com-bined in utero and postnatal exposure, chemical- related depression of cell-mediated immunity and enhancement of humoral immune respon- siveness were observed; however, no compound- related effects in the bone marrow were reported (Exon et al., 1984). The doses of 2,4-dichlorophe- no1 used in the study by Exon e t al. (1984) were much lower than those that caused bone marrow atrophy in the present studies. For the current 2-year studies of 2,4-dichlorophenol in rats, di- etary concentrations were selected (5,000 and 10,000 ppm for males and 2,500 and 5,000 ppm for females) which did not appreciably affect body weight gain or produce bone marrow atro- phy in the 13-week studies. Bone marrow atro- phy was1 observed in female rats that received 10,000 ppm 2,4-dichlorophenol for 13 weeks but not in male ra ts receiving that concentration.
Dietary administration of 2,4-dichlorophenol to B6C3F1 mice for 13 weeks caused deaths of all animals in the 40,000-ppm groups and a reduc-t i o n in m e a n body w e i g h t g a i n i n t h e 20,000-ppm groups. The most notable toxico- logic lesion in mice that survived until the end of the study was hepatocellular necrosis in males
(see Table 14). The incidence and severity of this lesion increased with dose. In the 2,500-, 5,000-, and 10,000-ppm groups, the severity of the hepa- tocellular necrosis W ~ Sconsidered to be mini- mal. Syncytial alteration (multinucleated hepa- tocytes) was also observed in the liver of dosed male mice. Neither hepatocellular necrosis nor syncytial alteration was reported in the liver of ICR mice fed diets containing 200-2,000 ppm 2,4-dichlorophenol for 6 months (Kobayashi e t al., 1972) or of CD-1 mice exposed for 90 days to 2,4-dichlorophenol in drinking water at concen-trat ions of 200-2,000 ppm (Borzelleca e t al., 1985b). The doses of 2,4-dichlorophenol in those studies were lower than those tha t produced hepatocellular necrosis or multinucleated hepa- tocytes in B6C3F1 mice in the current studies (see Table 14). For the 2-year studies of 2,4- dichlorophenol in mice, dietary concentrations were selected (5,000 and 10,000 ppm for males and females) which in the 13-week studies did not appreciably affect body weight gain or pro- duce potentially life-threatening hepatocellular necrosis.
The 2-year s tudies of 2,4-dichlorophenol i n F344/N rats and B6C3F1 mice were remarkable because few chemical-related effects were ob- served, There were no significant differences in survival between any groups of ra ts or mice of either sex. Mean body weights of dosed male and female rats were about 5%-10% lower than those of controls. Similar effects of compound administration on body weight were observed in the studies in mice, except that the mean body weights of high dose female mice were about 10%-20% lower than those of controls.
There were no increased incidences of neoplastic lesions in dosed male or female rats compared with those in controls. A reduction in the inci- dence of mononuclear cell leukemia was ob- served in high dose male r a t s compared with that in controls; however, this change was not considered to be necessarily related to exposure to 2,4-dichlorophenol, since the incidence of leu- kemia in high dose male ra ts was similar to the historical incidence of leukemia in untreated F344/N male rats (Table A4). The incidence of leukemia in control male rats was nearly twice that generally observed.
2.4-Dicblorophenol, NTP TR 353 54

IV. DISCUSSION AND CONCLUSIONS
In male mice given diets containing 2,4-dichloro- phenol for 2 years, two squamous papillomas and one squamous cell carcinoma of the fore- stomach were observed in three animals in the high dose group. Squamous cell neoplasms of the forestomach are uncommon in untreated B6C3F1 mice (historical incidence in NTP stud- ies: 0.4% [8/1,9861 for males and 0.9% [18/1,9941 for females). However, because there was a neg-ative trend for squamous cell neoplasms in fe- male mice, with a n unusually high incidence in controls (8%), and because there was no appar- ent effect of 2,4-dichlorophenol on the incidence of hyperplasia of the forestomach in male mice, the three forestomach neoplasms observed in male mice were not considered to be caused by 2,4-dichlorophenol. Chemical-induced neoplasia of the forestomach generally is not sex specific.
Syncytial alteration of hepatocytes, a chemical- related effect noted in the 13-week study, was also observed a t increased incidences in dosed male mice in the 2-year study. 2,4-Dichloro-phenol may block normal cell division in mouse hepatocytes by reducing the levels of ATP.
The only histopathologic change observed in fe- male mice was a decrease in the incidence of ma- lignant, lymphomas in the high dose group com- pared with that in the controls. This decrease may not have been due to exposure to 2,4-dichlo- rophenol, since malignant lymphomas in female B6C3F1 mice a re common and the change in in- cidence in th i s s tudy was only margina l ly significant.
In 2-year feed studies of other chlorophenols, 2,4,6-trichlorophenol was carcinogenic for F344 rats and B6C3F1 mice (NCI, 19791, and tech- nical-grade pentachlorophenol caused cancer in I36C3F1 mice ( ra t s were not s tudied) (NTP, 1989). The doses of 2,4-dichlorophenol used in the present 2-year studies were similar to those used in the 2,4,6-trichlorophenol studies and about 20 times greater than those used in the pentachlorophenol studies. The reason for the difference in carcinogenicity between 2,4-dichlo- rophen'ol and 2,4,6-trichlorophenol or technical-grade pentachlorophenol is not readily apparent. Although the relative toxicities of the various chlorophenols may be related to differences in their potency a s uncouplers of mitochondrial
oxidative phosphorylation (Farquharson e t a l . , 1958; Weinbach and Garbus, 1965), it is unlikely that this factor was critical in the carcinogenic responses to the chlorophenols in ra ts or mice, since doses selected for the 2-year studies of these compounds varied, based on their toxico- logic potential. In a skin tumor-promot ing study, 2,4-dichlorophenol, but not 2,4,6-trichlo-rophenol or pentachlorophenol, was found to pro- mote DMBA-initiated sk in tumors in mice (Boutwell and Bosch, 1959).
Negative responses observed in NTP-sponsored mutagenicity assays with bacteria on 2,4-dichlo- rophenol, 2,4,6-trichlorophenol, and pentachlo- rophenol corroborate similar negative results re- ported by others (Simmon et al., 1977; Rasanen et al., 1977; Rapson et al., 1980; Nestmann et al., 1980; Probst e t al., 1981; Haworth e t al., 1983). Furthermore, all of the chlor inated phenols tested by the NTP, including three chlorophe- nols, six dichlorophenols, six trichlorophenols, three tetrachlorophenols, and pentachlorophe- nol, gave negative responses in the Salmonella assay. These results indicate that chlorinated phenols lack mutagenic activity in Salmonella.
However, NTP-sponsored cytogenetic tests with cultured Chinese hamster ovary (CHO) cells did exhibit a mixture of positive and negative re-sponses with the seven chlor inated phenols tested to date. An increase in chromosomal ab- errations w a s produced by 2,3,4- and 2,3,6-tri- chlorophenol, 2,3,5,6-tetrachlorophenol,a n d pentachlorophenol but not by 2,4-dichlorophe- nol, 2,4,6-trichlorophenol, or 3,4,5-trichlorophe-nol. An increase in sister chromatid exchanges was produced by 2,4-dichlorophenol, 2,3,4-tri- chlorophenol, 2,3,5,6-tetrachlorophenol,and pentachlorophenol but not by 2,3,6-, 2,4,6-, or 3,4,5-trichlorophenol. No relationship between the observed responses and either the number or position of the chlorine atoms is apparent from these results. In addition, no apparent relation- ship is evident between the responses observed in the cytogenetic tests in CHO cells with 2,4- dichlorophenol and the negative carcinogenic ac- tivity in ra ts and mice.
The experimental and tabulated da ta for the NTP Technical Report on 2,4-dichlorophenol
55 2,4-Dichlorophenol, NTP TR 353

IV. DISCUSSION AND CONCLUSIONS
were examined for accuracy, consistency, com- pleteness, and compliance with Good Laboratory Practice regulations. As summarized in Ap- pendix H:, the audit revealed no major problems with the conduct of the studies or with collection and documentation of the experimental data . No discrepancies were found that influenced the firial in te rpre ta t ion of t he r e su l t s of these studies.
Under the conditions of these 2-year feed stud- ies, there was no evidence of carcinogenic activi- ty* for male F344/N rats fed diets containing 5,000 or 10,000ppm 2,4-dichlorophenol or for fe- male F344/N rats €ed diets containing 2,500 or 5,000 ppm 2,4-dichlorophenol. There was no evi-dence of carcinogenic activity for male or female B6C3F1 mice fed d ie t s conta in ing 5,000 o r 10,000 ppm 2,4-dichlorophenol.
*Explanation of Levels of Evidence of Carcinogenic Activity is on page 5 . A summary ofthe Peer Review comments and the public discussion on this Technical Report appears on page 8.
2,3-Dichlorophenol, NTP TR 353 56

W'. REFERENCES
57 2,4-Dichlorophenol,NTP TR 353

V., REIFERENCES
1.Ahlborg, U.G.; Thunberg, T.M. (1980) Chlori- nated phenols: Occurrence, toxicity, metabo- lism, and environmental impact. CRC Crit. Rev. Toxicol. 7:l-35.
2. Ahotupa, M.; Hietanen, E. ; Nienstedt, W. (1981) Drug metabolizing enzyme activities in rats exposed to chlorinated phenols. Adv. Phys- ioloy. Sci 29:421-431.
3. Amer, S.M.; Ali, E.M. (1968) Cytological ef- fects of pesticides. II. Meiotic effects of some phenols. Cytologia 33:21-33.
4. Amer, S.M.; Ali, E.M. (1969) Cytological ef- fects of pesticides. IV. Mitotic effects of some phenols. Cytologia 34:533-540.
5. Amer, S.M.;Ali, E.M. (1974) Cytological ef- fect s of pesticides. V. Effects of some herbicides on Vicia fibs. Cytologia 39:633-643.
6. Ames, B.N.; McCann, J.;Yamasaki, E. (1975) Met hods for detecting carcinogens and muta- gens with the Salmonella/mammalian-micro- some mutagenicity test. Mutat. Res 31:347-364.
7. Armitage, P. (1971) Statistical Methods in Medical Research. New York: John Wiley & Sons, Inc., pp. 362-365.
8. 13erenblum, I. , Ed. (1969) Carcinogenicity Testing: A Report of the Panel on Carcinogenici- ty of the Cancer Research Commission of UICC, Vol. 2. Geneva: International Union Against Cancer.
12. Borzelleca, J .F. ; Hayes, J .R . ; Condie, L.W.; Egle, J.L., J r . (1985a) Acute toxicity of mono-chlorophenols, dichlorophenols, and pent,achlo- rophenol in the mouse. Toxicol. Lett. 29:39-42.
13. Borzelleca, J .F. ; Hayes, J .R . ; Condie, L.W.; Egle, J.L., Jr. (1985b) Acute and subchroriic tox- icity of 2,4-dichlorophenol in CD-1 mice. Fun-dam. Appl. Toxicol. 5:478-486.
14. Boutwell, R.K.; Bosch, D .K. (1959) The tu- mor-promoting action of phenol and related com- pounds for mouse skin. Cancer Res. 19:413-424.
15. Clark, D.E.; Palmer, J.S.; Radeleff, R.D.; Crookshank, H.R.; Farr, F.M. (1975) Residues of chlorophenoxy acid herbicides and their phe- nolic metabolites in tissues of sheep and cattle. J. Agric. Food Chem. 23:573-578.
16. Clive, D.; Johnson, K.O.; Spector, J.F.;S.; Bat- son, A.G.;Brown, M.M.M. (1979) Validation and characterization of the L5178Y/TK ' I - mouse lymphoma mutagen assay system. Mutat. Res. 59:61-108.
17. Cook, L.W.; Zach, F.W.; Klosterman, H . J . ; Bristol, D.W. (1983) Comparison of free and total residues of (2,4-dichlorophenoxy)aceticacid and 2,4-dichlorophenol in millet resulting from post- emergence and preharvest treatment. J. Agric. Food Chem. 31:268-271.
18. Cox, D.R. (1972) Regression models and life tables. J. R. Stat. SOC.B34:187-220.
9. Xjirge, W.J.; Black, J .A. ; Bruser, D.M. (1979) Toxicity of Organic Chemicals to Embryo-Larval Stages of Fish. Report No. EPA/560/11-79-007. U.S. Environmental Protection Agency, Office of Tosic Substances, Washington, DC.
10 Bleiberg, J . ; Wallen, M. ; Brodkin, R.; Apple- baiim, I.L. (1964) Industrially acquired porphy- ria Arch. Dermatol. 89:793-797.
1i Boorman, G.A.; Montgomery, C.A., Jr.: Eu-stis, S.L.; Wolfe, M.J.; McConnell, E.E.; Hardis- ty, J.F. (1985) Quality assurance in pathology for rodent carcinogenicity studies. Milman, H.; Weisburger, E., Eds.: Handbook of Carcinogen Testing. Park Ridge, NJ: Noyes Publications, pp 345-357.
19. Deichmann, W. (1943) The toxicity ofchloro- phenols for rats. Fed. Proc. 2:76-77.
20. Deichmann, W.B; Keplinger, M.L. (1981) Phenols and phenolic compounds. Clayton , G.D.;Clayton, F.E., Eds.: Patty's Industrial Hy- giene and Toxicology. New York: John Wiley & Sons, Inc., Vol. 2A, pp, 2567-2615.
21. Dinse, G.E.; Haseman, J .K . (1986) Logistic regression analysis of incidental-tumor d a t a from animal carcinogenicity experiments. Fun-dam. Appl. Toxicol. 6:44-52.
22. Dinse, G.E.; Lagakos, S.W. (1983)Reigression analysis of tumour prevalence data. J. R. Stat. SOC.C32i236-248.
2,4Dichlorophen01, NTP TR 353 58

-- V. REFERENCES
23. Exon, J .H . (1984) A review of chlorinated phenols. Vet. Hum. Toxicol. 26:508-520.
24. Exo'n, J .H . ; Henningsen, G.M.; Osborne, C.A.; Koller, L.D. (1984) Toxicologic, pathologic, and immunotoxic effects of 2,4-dichlorophenol in rats. J.Toxicol. Environ. Health 14:723-730.
25 Farcluharson, M.E.; Gage, J .C. ; Korthover, J. (1958) The biological action of chlorophenols. Br. J. Pharmacol. 13:20-24.
26. Federal Register (Fed. Regist.) (1981) U.S. Environmental Protection Agency: Petition to remove ethylbenzene, phenol, 2,4-dichlorophe- nol, 2,4,5-trichlorophenol, and pentachlorophe- nol from the #307(a)(l) List of toxic pollutants-- Final action. Fed. Regist. 46:2267-2273.
27 Fiskesjo, G.; Lassen, C.; Renberg, L. (1981) Chlorinated phenoxyacetic acids and chlorophe- nols in t,he modified Allium test. Chem. Biol. In- t e ract . 34:333-344.
28. Galloway, S.M.; Bloom, A.D.; Resnick, M.; Margolin, B.H.; N a k a m u r a , F.; Archer , P . ; Zeiger, E. (1985) Development of a standard pro- tocol for in vitro cytogenetic testing with Chi- nese hamster ovary cells: Comparison of results for 22 compounds in two laboratories. Environ. J111 tagen. 7: 1-5 1.
29 Galloway, S.M.; Armstrong, M.A.; Reuben, C , Colman, S.; Brown, B.; Cannon, C.; Bloom, A.D.;Nakamura, F.; Ahmed, M.; Duk, S.; Rim-PO, J . ; Margolin, B.H.; Resnick, M.; Anderson, B , Zeiger, E. (1987) Chromosome aberrat ion and sisler chromatid exchange tests in vitro in Chinese hamster ovary cells: Results for 108 chemicals. Environ. Molec. Mutagen. lO(Supp1. 10):1-175,
30. Gart, J.J.;Chu, K.C.; Tarone, R.E. (1979) Statistical issues in interpretat ion of chronic bioassay tes ts for carcinogenicity. J . Na t l . Cancer Inst. 62:957-974.
31. Haseman, J . K . ; Huff, J . ; Boorman, G.A. (1984) Use of historical control data in carcino- genicity studies in rodents. Toxicol. Pathol. 12:126- 135.
32. Haseman, J .K. ; Huff, J . ; Rao, G.N.; Arnold, J.;Boorman, G.A.; McConnell, E.E. (1985) Neo- plasms observed in untreated and corn oil ga- vage cont ro l g roups of F344 /N r a t s a n d (C57BL/6N X C3H/HeN)F1 (B6C3F1) mice. J. Natl. Cancer Inst. 75:975-984.
33. Haworth, S.; Lawlor, T.; Mortelmans, K. ; Speck, W.; Zeiger, E. (1983) Salmonella muta- genicity test results for 250 chemicals. Environ. Mutagen. Suppl. 1:3-142.
34. Holcombe, G.W.; Phipps, G.L.; Fiandt, J .T. (1982) Effects of phenol, 2,4-dimethylphenol, 2,4-dichlorophenol, and pentachlorophenol on embryo, larval, and early-juvenile fathead min- nows (Pimephales 'promelas) . Arch. Environ. Contam. Toxicol. 11:73-78.
35. Kaplan, E.L.; Meier, P. (1958) Nonpara- metric estimation from incomplete observations. J.Am. Stat. Assoc. 53:457-481.
36. Kirk-Othmer Encyclopedia of Chemical Technology (1979) 3rd ed., Vol. 5. New York: John Wiley & Sons, Inc., pp. 865-872.
37. Kobayashi, S.; Toida, S.; Kawamura , H.; Chang, H.S.; Fukuda, T.; Kawaguchi, K. (1972) Chronic toxicity of 2,4-dichlorophenol in mice. A simple design for the toxicity of residual metabo- lites of pesticides. Toho Igakkai Zasshi 19:356- 362.
38. Liberman, E.A.; Topaly, V.P. (1968) Se- lective transport of ions through bimolecular phospholipid membranes. Biochim. Biophys. Acta 163:125-136.
39. Linhart, M.S.; Cooper, J.;Martin, R.L.; Page, N.; Peters, J. (1974) Carcinogenesis Bioassay Data System. Comput. Biomed. Res. 7:230-248.
40. Loos, M.A.; Roberts, R.X.; Alexander, M . (1967a) Phenols a s intermediates in the decom- position of phenoxyacetates by an Arthrobacter species. Can. J. Microbiol. 13:679-690.
41. Loos, M.A.; Roberts, R .N. ; Alexander, M . (1967b) Formation of 2,4-dichlorophenol and 2,4- dichloroanisole from 2,4-dichlorophenoxyacetate by Arthrobacter sp. Can. J. Microbiol. 13:691- 699.
59 2,4-Dichlorophenol, NTP TR 353
-- V. REFERENCES
42 Mantel, N.; Haenszel, W. (1959) Statistical aspects o f the analysis of data from retrospective studies of disease. J. Natl. Cancer Inst. 22:719- 748
43. Maronpot, R.R.; Boorman, G.A. (1982) Inter- pre t ation of rodent hepa tocellular proliferative al1,eratioms and hepatocellular tumors in chemi- cal safety assessment. Toxicol. Pathol. 10:71-80.
44. McCollister, D.D.; Lockwood, D.T.; Rowe, V.K. (1961) Toxicologic information on 2,4,5-tri- chlorophenol. Toxicol. Appl. Pharmacol. 3:63- 70.
45. McConnell, E.E. (1983a) Pathology require- ments for rodent two-year studies. I. A review of current procedures. Toxicol. Pathol. 11:60-64.
46 McConnell, E.E. (1983b) Pathology require- ments for rodent two-year studies. II. Alterna-t i w approaches. Toxicol. Pathol. 11:65-76.
47. McConnell, E.E.; Solleveld, H.A.; Swenberg, J..4.;Boorman, G.A. (1986) Guidelines for com- bining neoplasms for evaluation of rodent car- cinogenesis s tud ies . J . Na t l . Cancer Ins t . 7 2 83-289.
4fl. McKnight, B.; Crowley, J. (1984) Tests for difi'erences in tumor incidence based on animal carcinogenesis experiments. J. Am. Stat. Assoc. 7%:639-648.
49. Motalis, R.; Sola, F.; Cousin, J .L . (1978) C'n- couplers of oxidative phosphorylation. A struc- ture-activity study of their inhibitory effect on passive chloride permeability. Biochim. Bio- ph>.s. Acta 510:201-207.
50. Myhr, B.; Bowers, L.; Caspary, W.J . (1985) Assays for the induction of gene mutations a t the thymidine kinase locus in L5178Y mouse lymphoma cells in culture. Prog. Mutat. Res. 51.555-568.
51 National Cancer Ins t i tu te (NC11 (1976) Gtiidelines for Carcinogen Bioassay in Small Ro- dtirits. :VCI Technical Report S o . 1. U.S. De-partment of Heal th , Education, and Welfare, P,iblic Health Service, Sa t iona l Inst i tutes of Health, Bethesda, MD.
52. National Cancer Institute (NCI) (1979) Bio- assay of 2,4,6-Trichlorophenol for Possible Car- cinogenicity. NC1 Technical Report No. 155. U.S. Department of Health, Education, arid Wel- fare, Public Health Service, National Institutes of Health, Bethesda, MD. 115p.
53. National Institutes of Health (NIH) (1978) Open Formula Rat and Mouse Ration (NIH-07). Specification NIH-11-1335. U.S. Department of Health, Education, and Welfare, Public Health Service, National Institutes of Health, Bethesda, MD.
54. National Toxicology Program (NTP) (1989) Toxicology and Carcinogenesis Studies of'Penta-chlorophenol in F344/N Rats and B6C3F1 Mice. NTP Technical Report 349. U.S. Departiment of Heal th and Human Services, Publ ic Heal th Service, National Institutes of Health, Bethesda, MD. 265p.
55. Nazar, M.A.; Rapson, W.H.; Brook, M.A.; May, S.;Tarhanen, J. (1981) Mutagenic reaction products of aqueous chlorination of catechol. Mutat. Res. 89:45-55.
56. Nestmann, E.R.; Lee, E.G.-H. (1983) Muta- genicity of constituents of pulp and paper mill ef- fluent in growing cells of Saccharomyct, 2s cere-visiae. Mutat. Res. 119:273-280.
57. Nestmann, E.R.; Lee, E.G.-H.; Matula, T.I.; Douglas, G.R.; Mueller, J .C . (1980) Mutagenici- ty of constituents identified in pulp and paper mill effluents using the Salmonella/ma mmali- an-microsome assay. Mutat. Res. 79:203-212.
58. Probst, G.S.; McMahon, R.E. ; Hill, L.E. ; Thompson, C.Z.; Epp, J . K . ; Neal, S.B (1981) Chemically-induced unscheduled D N A synthe-sis in primary ra t hepatocyte cultures: A com-parison with bacterial mutagenicity using 2 18 compounds. Environ. Mutagen. 3: 11-32.
59. Rapson, W.H. . Nazar, M.A ; Butsk.?;, V . V . (1980) Mutagenicity produced by aqueous chlori- nation of organic compounds. Bull. E:nviron. Contam. Toxicol. 24:590-596.
2 4-Dichilorophenol, NTP TR 353 60

--
60. Rasanen, L.; Hattula, M.L . ; Arst i la , A.U. (1977) The mutagenicity of MCPA and its soil metabolites, chlorinated phenols, catechols and some widely used slimicides in Finland. Bull. Environ. Contam. Toxicol. 18:565-571.
61 Rodwell, D.E.; Wilson, R.D.; Nemec, M.D.; Mercieca, M.D. (1984) A teratology study in Fischer 344 rats with 2,4-dichlorophenol. Toxi- cologist 4: 167.
62 Sadtler Standard Spectra. IR No. 8199; C'V No . 9786; NMR No. 6089-M. Phi lade lphia : Sadtler Research Laboratories.
63. Schwetz, B.A.; Keeler, P.A.; Gehring, P . J . (1974a) The effect of purified and commercial grade pentachlorophenol on ra t embryonal and fetal development. Toxicol. Appl. Pharmacol. 28:151-161.
64. Schwetz, B.A.; Keeler, P.A.; Gehring, P.J. ( 1974b) Effect of purified and commercial grade tetrachlorophenol on r a t embryonal and fetal development. Toxicol. Appl. Pharmacol. 28:146- 150.
65. Seyler, D.E.; East, J .M.; Condie, L.W.; Bor- zelleca, J.F. (1984) The use of in vitro methods for assessing reproductive toxicity. Dichlorophe- nols. Toxicol. Lett. 20: 309-3 15.
66. Shackelford, W.M.; Keith, L.H. (1976) Fre- quency of Organic Compounds Identified in Wa- ter. Athens, GA: U.S. Environmental Protec- tion Agency.
67. Simmon, V.F.; Kauhanen, K. ; Tardiff, R.G. (1977) Mutagenic activity of chemicals iden- tified in drinking water. Dev. Toxicol. Environ. Sci. 2:249-258.
V. REFERENCES
68. Smith, A.E. (1985) Identification of 2,4-di-chloroanisole and 2,4-dichlorophenol a s soil deg- radation products of ring-labelled [14C12,4-D. Bull. Environ. Contam. Toxicol. 34:150-157.
69. Somani, S.M.; Khalique, A. (1982) Distribu- tion and metabolism of 2,4-dichlorophenol in rats. J.Toxicol. Environ. Health 9:889-897.
70. Somani, S.M.; Smart, T.; Khalique, A. (1984) Metabolism of 2,4-dichlorophenol by isolated perfused ra t liver. J. Toxicol. Environ. Health 13:787-798.
71. Tarone, R.E. (1975) Tests for trend in life ta- ble analysis. Biometrika 62:679-682.
72. U.S . Envi ronmenta l Protect ion Agency (USEPA) (1980) Ambient Water Quality Cri- teria for 2,4-Dichlorophenol. Report No. EPA/ 440/5-80-042. U.S. Environmental Protection Agency, Office of Water Regulations and Stand- ards, Criteria and Standards Division, Washing- ton, DC.
73. U.S. Envi ronmenta l Protect ion Agency (USEPA) (1987) TSCA Initial Inventory.
74. Vernot, E.H.; MacEwen, J .D. ; Haun, C.C.; Kinkead, E.R. (1977) Acute toxicity and skin corrosion data for some organic and inorganic compounds and aqueous solutions. Toxicol. Appl. Pharmacol. 42:417-423.
75. Weinbach, E.C.; Garbus, J. (1965) The inter- action of uncoupling phenols with mitochondria and with mitochondrial protein. J. Biol. Chem. 24011811-1819.
61 2,4-Dichlorophenol, NTP TR 353

2,4-Dichlorophenol,NTP TR 353 62!
APPENDIX A
SUMMARY OF LESIONS IN MALE RATS IN
THE TWO-YEAR FEED STUDY OF
2,4-DICHLOROPHENOL
PAGE
TABLE Al SUMMARY OF THE INCIDENCE OF NEOPLASMS IN MALE RATS IN THE TWO- YEAR FEED STUDY O F 2,4-DICHLOROPHENOL 64
TABLE A2 INDIVIDUAL ANIMAL TUMOR PATHOLOGY OF MALE RATS IIX THE TWO-YEAR FEED STUDY OF 2,4-DICHLOROPHENOL 68
TABLE A3 ANALYSIS OF PRIMARY TCYORS IN MALE RATS IN THE TWO-YEAR FEED STUDY OF 2,4-DICHLOROPHENOL 80
TABLE fi4 HISTORICAL INCIDENCE OF LEUKEMIA IN MALE F344/N RATS RECEIVING NO TREATMENT 83
TABLE A5 SUMMARY OF THE INCIDENCE OF NONNEOPLASTIC LESIONS IN MALE RATS IN THE TWO-YEAR FEED STUDY OF 2.4-DICHLOROPHENOL 84
63 2,4-Dichlorophenol, NTP TR 353
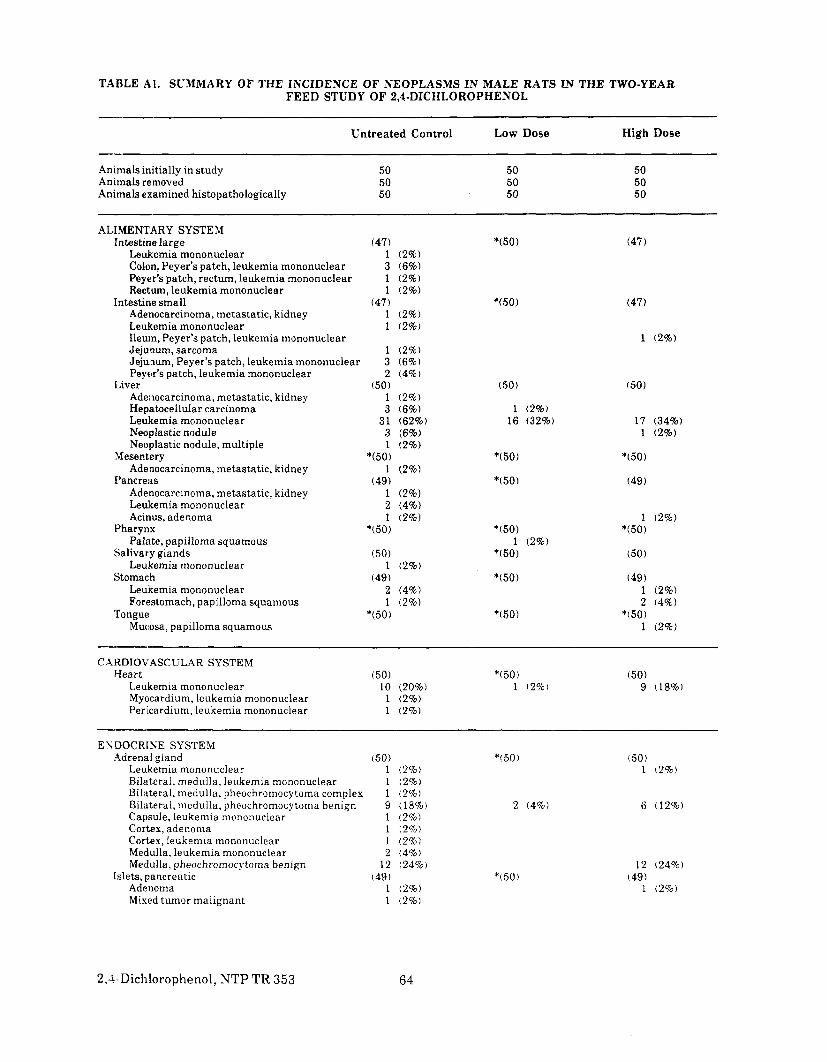
--
TABLE AI. SUMMARY OF THE INCIDENCE OF NEOPLASMS IN MALE RATS IN THE TWO-YEAR FEED STUDY OF 2,4-DICHLOROPHENOL
Untreated Control Low Dose
50 50 50
(50)
1 (2%) 16 (32%)
*(50) 1 (2%)
*i50)
*(50) 1 (2%)
*(50)
2 (4%)
High Dose
50 50 50
(47)
(47)
1 (2%)
(50)
17 (34%) 1 (2%)
*(50)
(49)
(49) 1 (2%) 2 (4%)
*(50) 1 (2%)
( 5 0 ) 9 (18%)
(50) 1 (2%)
6 (12%)
Animals initially in study Animals removed Animals examined histopathologically
AL1MENTARY SYSTEM Intestine large
Leukemia mononuclear Colon, Peyer’s patch, leukemia mononuclear Peyer’s patch, rectum, leukemia mononuclear Rectum, leukemia mononuclear
Intestine small Adenocarcinoma, metastatic, kidney Leukemia mononuclear Ileum, Peyer’s patch, leukemia mononuclear Jejunum, sarcoma Jejunum, Peyer’s patch, leukemia mononuclear Peyer’s patch, leukemia mononuclear
Liver Adenocarcinoma, metastatic, kidney Hep,atocellular carcinoma Leukemia mononuclear Neoplastic nodule Neolplastic nodule, multiple
Mesentery Adenocarcinoma, metastatic, kidney
E’ancreiis Adenocarcinoma, metastatic, kidney Leulkemia mononuclear Acinus, adenoma
Pharynx Palate, papilloma squamous
Salivary glands Leukemia mononuclear
Stomach Leukemia mononuclear Forestomach, papilloma squamous
Tongue! Mucosa, papilloma squamous
CARDIOVASCULAR SYSTEM Heart
Leukemia mononuclear Myocardium, leukemia mononuclear Pericardium, leukemia mononuclear
EUDOCRrNE SYSTEM 4drenal gland
Leukemia mononuclear Bilateral, medulla, leukemia mononuclear Bilateral, medulla, pheochromocytoma complex Bilateral, medulla, pheochromocytoma benign Capsule, leukemia mononuclear Cortex, adenoma Cortex, leukemia mononuclear Medulla, leukemia mononuclear Medulla, pheochromocytoma benign
Islets, pancreatic Adenoma Mixed tumor malignant
50 50 50
(47) 1 (2%) 3 (6%) 1 (2%) 1 (2%)
(47) 1 (2%) 1 (2%)
1 (2%)3 (6%)2 (4%)
( 5 0 ) 1 (2%) 3 (6%)
31 (62%) 3 (6%) 1 (2%)
*(50) 1 (2%)
(49) 1 (2%)2 (4%) 1 (2%)
*(50)
(50) 1 (2%)
(49) 2 (4%)1 (2%)
*(50)
(50) 10 (20%) 1 (2%) 1 (2%)
(50) 1 (2%) 1 (2%) 1 (2%) 9 (18%) 1 (2%) 1 (2%) 1 (2%) 2 (4%)
12 (24%) (49 )
1 (2%) 1 (2%)
2,4-Dichlorophenol,NTP TR 353 64
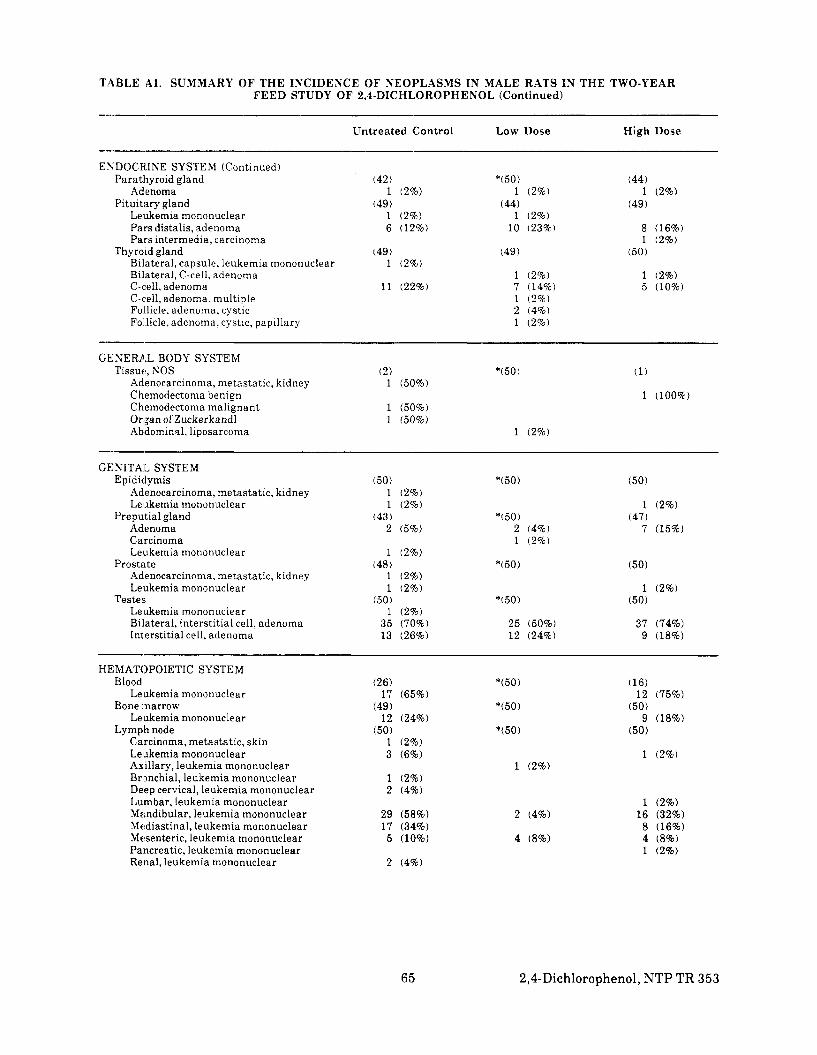
TABLE A l . SUMMARY OF THE INCIDESCE OF NEOPLASMS IN MALE RATS IN THE TWO-YEAR FEED STUDY OF 2,4-DICHLOROPHENOL (Continued)
-"._-Untrea ted Control Low Dose High Dose
---ENDOCRJNE SYSTEM (Continued)
Parathyroid gland
Pituitm-y gland Adenoma
Leukemia mononuclear Pars distalis, adenoma Pars intermedia, carcinoma
Bilateral, capsule, leukemia mononuclear Bilateral, C-cell, adenoma C-cell, adenoma C-cell, adenoma, multiple Follicle, adenoma, cystic Follicle, adenoma, cystic, papillary
Thyroid gland
(42)
(49) 1 (2%)
1 (2%) 6 (12%)
1 (2%)
11 (22%)
(49)
*(50)
(44) 1 (2%)
1 (2%) 10 (23%)
1 (2%) 7 (14%) 1 (2%) 2 (4%) 1 (2%)
(49)
(44)
(49) 1 (2%)
8 (16%) 1 (2%)
1 (2%) 5 (10%)
(50)
----GENERAL BODY SYSTEM
T~ssue,NOS Adenocarcinoma, metastatic, kidney
Chemodectoma malignant OrTan of Zuckerkandl
Chemodectoma benign
Abdominal, liposarcoma
(2) 1 (50%)
1 (50%) 1 (50%)
*(50)
1 (2%)
(1)
1 (100%)
GEN1TA:L SYSTEM Epididymis
Adenocarcinoma, metastatic, kidney Leukemia mononuclear
Preputial gland Adenoma Carcinoma Leukemia mononuclear
Adenocarcinoma, metastatic, kidney Le ukemia mononuclear
Leukemia mononuclear Bilateral, interstitial cell, adenoma Interstitial cell, adenoma
Prostate
Testes
(50) 1 (2%) 1 (2%)
2 (5%)
1 (2%)
1 (2%) 1 (2%)
1 (2%) 35 (70%) 13 (26%)
(43)
(48)
(50)
*(50)
*(50) 2 (4%) 1 (2%)
*(50)
*(50)
25 (50%) 12 (24%)
(50)
1 (2%)
7 (15%) (47)
(50)
1 (2%) (50)
37 (74%) 9 (18%)
HEMATOPOIETIC SYSTEM
Leukemia mononuclear
Leukemia mononuclear
Carcinoma, metastatic, skin Leukemia mononuclear Axillary, leukemia mononuclear Bmnchial, leukemia mononuclear Deep cervical, leukemia mononuclear Lumbar, leukemia mononuclear Mandibular, leukemia mononuclear Mediastinal, leukemia mononuclear Mesenteric, leukemia mononuclear Pancreatic, leukemia mononuclear Renal, leukemia mononuclear
Blood
Bone inarrow
Lymph node
(26) 17 (65%)
(49)
(50) 12 (24%)
1 (2%) 3 (6%)
1 (2%) 2 (4%)
29 (58%) 17 (34%) 5 (10%)
2 (4%)
*(50)
*(50)
*(50)
1 (2%)
2 (4%)
4 (8%)
(16)
(50)
(50)
12 (75%)
9 (18%)
1 (2%)
1 (2%) 16 (32%)
8 (16%) 4 (8%) 1 (2%)
66 2,4-Dichlorophenol,NTP TR 353

TABLE A l . SUMMARY OF T H E INCIDENCE O F NEOPLASMS I N MALE R A T S I N T H E TWO-YEAR F E E D STUDY O F 2,4-DICHLOROPHENOL (Continued)
~ ~~ ~~~~~
Untrea ted Control Low Dose High Dose
HE:MATOPOIETIC SYSTEM (Continued) Spleen
Leukemia mononuclear
Leukemia mononuclear Thymus
(50)31 (62%)
4 (10%) (39)
*(50) 12 (24%)
*(50)
(50) 17 (34%)
5 (12%) (43)
INTEGUMENTARY SYSTEM Mammary gland (25)
Adenocarcinoma 1 (4%)Fibroadenoma 1 (4%)
Basal cell adenoma Carcinoma 1 (2%) Fibrosarcoma Keratoacanthoma 1 (2%) Papdloma squamous 2 (4%) Squamous cell carcinoma Trichoepithelioma Abdominal, subcutaneous tissue, leukemia
mononuclear 1 (2%) Axillary, subcutaneous tissue, leukemia
mononuclear Face, subcutaneous tissue, leukemia mononuclear 1 (2%) Sebaceous gland, adenocarcinoma Subcutaneous tissue, fibroma 4 (8%)Subcutaneous tissue, fibrosarcoma Subcutaneous tissue, sarcoma 1 (2%) Subcutaneous tissue, schwannoma, NOS
Skin (49)
--
*(50) 1 (2%)3 (6%)
1 (2%)
1 (2%)
1 (2%)
1 (2%)
1 (2%)
1 (2%) 2 (4%) 2 (4%)
1 12%)
*(50)
(22)
1 (2%) 1 (2%) 2 (4%) 1 (2%)
1 (2%) 2 (4%)
(50)
MUSCULOSKELETAL SYSTEM None
NERVOUS SYSTEM E3rain
Carcinoma, metastatic, skin Leukemia mononuclear
(50) 1 (2%) 2 (4%)
*(50) (50)
1 (2%)
RESPIRATORY SYSTEM Lung (50)
Adenocarcinoma, metastatic, kidney 1 Adenocarcinoma, metastatic, mammary gland Alveolar/bronchiolar carcinoma 1 Carcinotna, metastatic, skin 1 Leukemia mononuclear 14 Liposarcoma, metastatic, tissue, NOS Sarcoma, metastatic 1 Interstitium, leukemia mononuclear 3 Interstitium, mediastinum, leukemia mononuclear 1 Mediastinum, leukemia mononuclear 3 Mediastinum, lipoma 1
Nose (45) Leukemia mononuclear 1 Turbinate, respiratory epithelium,
adenocarcinoma
(2%)
(2%') (2%) (28%)
(2%) (6%) (2%) (6%) (2%)
(2%)
*(50)
1 (2%) 1 (2%)
1 (2%)
(48)
1 (2%)
(50)
15 (30%)
(46)
2,4-DichlorophenoI,NTP TR 353 66
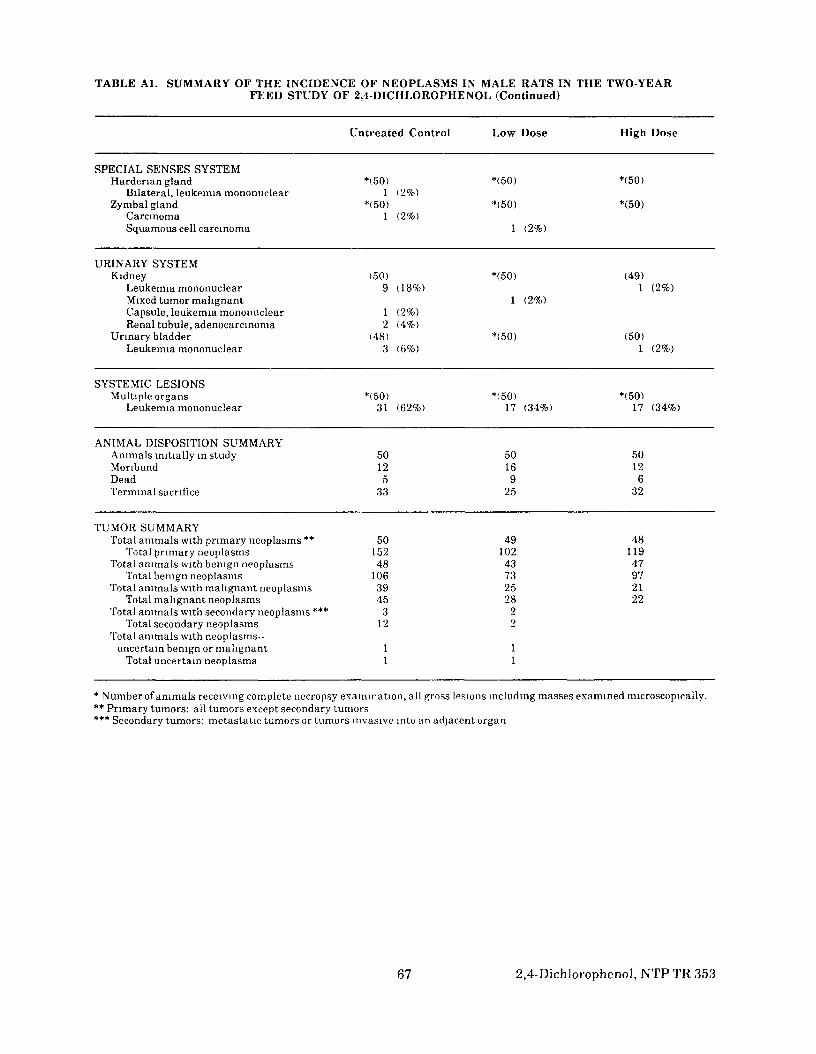
TABLE Al. SUMMARY OF THE INCIDENCE OF NEOPLASMS IN MALE RATS IN THE TWO-YEARFEED STUDY OF 2,4-DICHLOROPHENOL (Continued)
Untreated Control Low Dose High Dose
SPECIAL SENSES SYSTEMHardermn gland
Bilateral, leukemia mononuclearZymbal gland
CarcinomaSquamous cell carcinoma
*<50>1 (2%)
*(50)1 (2%)
*(50)
*<50)
1 (2%)
*(50)
*(50)
URINARY SYSTEMKidney
Leukemia mononuclearMixed tumor malignantCapsule, leukemia mononuclearRenal tubule, adenocarcmoma
Urinary bladderLeukemia mononuclear
SYSTEMIC LESIONSMultiple organs
Leukemia mononuclear
ANIMAL DISPOSITION SUMMARYAnimals initially in studyMoribundDeadTerminal sacrifice
TUMOR SUMMARYTotal animals with primary neoplasms **
Total primary neoplasmsTotal animals with benign neoplasms
Total benign neoplasmsTotal animals with malignant neoplasms
Total malignant neoplasmsTotal animals with secondary neoplasms ***
Total secondary neoplasmsTotal animals with neoplasms-
uncertain benign or malignantTotal uncertain neoplasms
(50)9 (18%)
1 (2%)2 (4%)
(48)3 (6%)
*<50)31 (62%)
50125
33
5015248
1063945
312
11
*(50)
1 (2%)
*(50)
*(50)17 (34%)
50169
25
4910243732528
22
11
(49)1
(50)1
*(50)17
50126
32
4811947972122
(2%)
(2%)
(34%)
* Number of animals receiving complete necropsy examination, all gross lesions including masses examined microscopically.** Primary tumors: all tumors except secondary tumors*** Secondary tumors: metastatic tumors or tumors invasive into an adjacent organ
67 2,4-Dichlorophenol, NTP TR 353
-
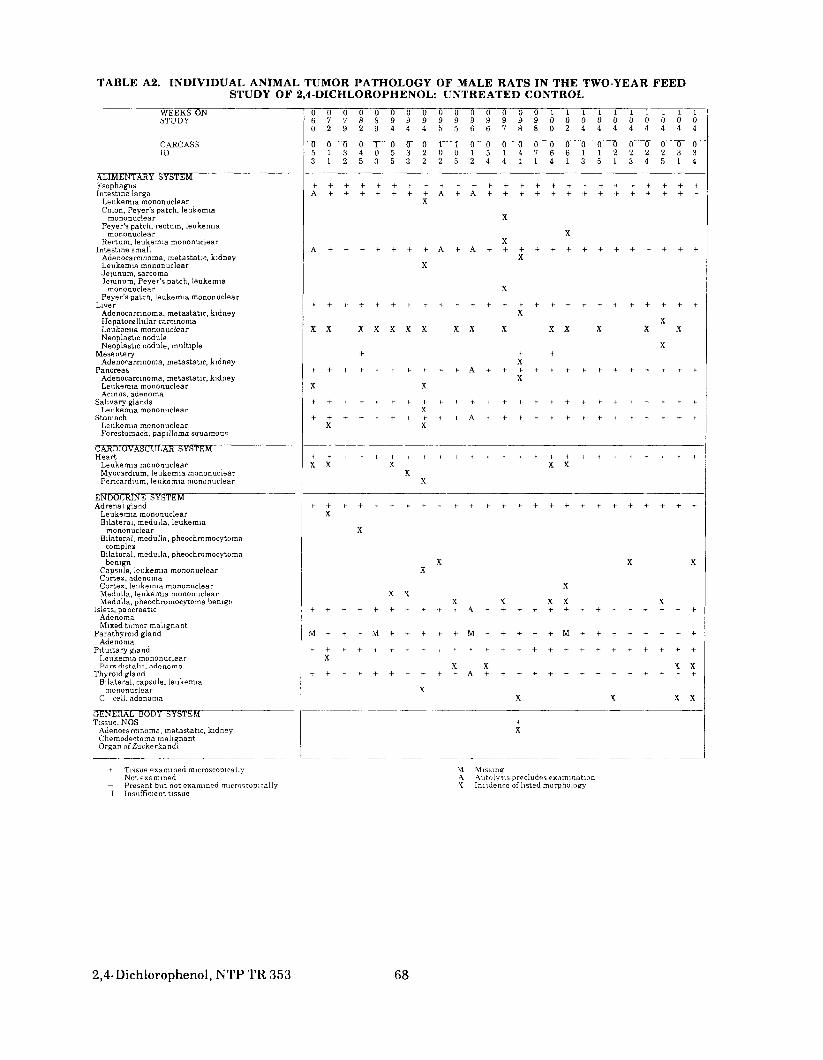
TABLE A2. INDIVIDUAL ANIMAL TUMOR PATHOLOGY OF MALE RATS IN THE TWO-YEAR FEEDSTUDY OF 2,4-DICHLOROPHENOL: UNTREATED CONTROL
WEEKS ONSTUDY
CARCASSID
ALIMENTARY SYSTEMEsophagusIntestine large
Leukemia mononuclearColon, Peyer's patch, leukemia
mononuctearPeyer's patch, rectum, leukemia
mononuclearRectum, Leukemia mononuclear
Intestine smallAdenocarcinoma, metastatic, kidneyLeukemia mononuclearJejunum, sarcomaJejunum, Peyer's patch, leukemia
mononuclearPeyer's patch, leukemia mononuclear
LiverAdenocarcinoma, metastatic, kidneyHepatocellular carcinomaLeukemia mononuciearNeoplastic noduleNeoplastic nodule, multiple
MesenteryAdenocarcinoma, metastatic, kidney
PancreasAdenocarcinoma, metastatic, kidneyLeukemia mononuclearAcinus, adenoma
Salivary glandsLeukemia mononuclear
StomachLeukemia mononuclearForestomach, papilloma squamous
CARDIOVASCULAR SYSTEMHeart
Leukemia mononuclearMyocardium, leukemia mononuclearPericardium, leukemia mononuclear
ENDOCRINE SYSTEMAdrenal gland
Leukemia mononuclearBilateral, medulla, leukemia
mononuclearBilateral, medulla, pheochromocytoma
complexBilateral, medulla, pheochromocytoma
benignCapsule, leukemia mononuclearCortex, adenomaCortex, leukemia mononuclearMedulla, leukemia mononuclearMedulla, pheochromocytoma benign
Islets, pancreaticAdenomaMixed tumor malignant
Parathyroid glandAdenoma
Pituitary glandLeukemia mononuclearPars distah1?, adenoma
Thyroid glandBilateral, capsule, leukemia
mononuclearC-cell, adenoma
GENERAL BODY SYSTEMTissue, NOS
Adenocarcinoma, metastatic, kidneyChemodectoma malignantOrgan of Zuckerkandl
0 0 0 0 0 0 0 0 0 0 0 0 0 0 0 1 1 1 1 1 1 1 16 7 7 8 8 9 9 9 9 9 9 9 9 9 9 0 0 0 0 0 0 0 00 2 9 2 9 4 4 4 5 5 6 6 7 8 8 0 2 4 4 4 4 4 4
O O O O i O O O i i O O O O O O O O O O O O O5 1 3 4 0 5 3 2 0 0 1 5 1 4 7 6 6 1 1 2 2 2 23 1 2 5 3 5 3 2 2 5 2 4 4 1 1 4 1 3 5 1 3 4 5
f + + -t + + - t - f + + + + + + + + + + + + + + +
X
X
XX
XX
X
XX
X X X X X X X X X X X X X X
X4 + +
X
XX X
X
X X
X X X X XX
X
X
X
X XX
XX X
X X X X X
M + + f M + + + f + - M + + + + + M + f + + + +
XX X
+ + f . + + f + f f A + + + + + + + t + + + +
XX X
1 10 04 4
0 03 31 4
+ +
X
+ -t
X
+ +
X X
X X
X
•f Tissue examined microscopicallyNot examined
Present but not examined microscopicallyI Insufficient tissue
VI Missing\ \utolysis precludes examinationX Incidence of listed morphology
2,4-Dichlorophenol, NTP TR 353 68
-
-
-
-
-
-
—
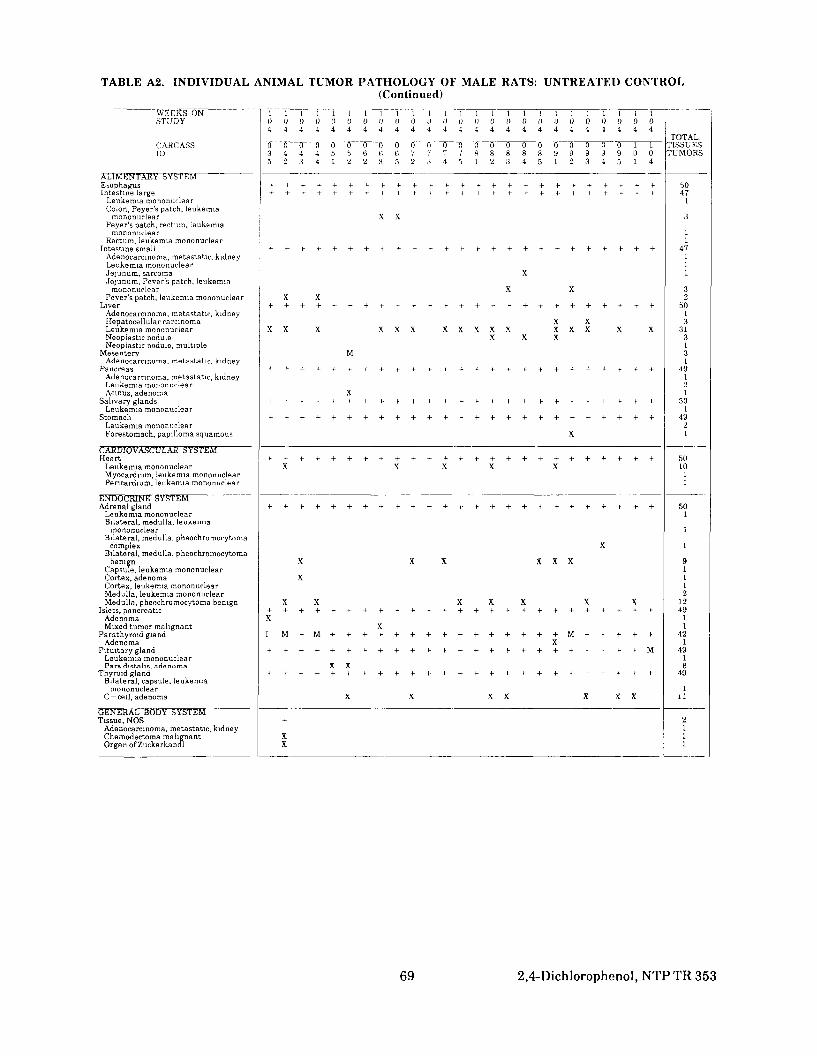
TABLE A2. INDIVIDUAL ANIMAL TUMOR PATHOLOGY OF MALE RATS: UNTREATED CONTROL(Continued)
WEEKS ONSTUDY
CARCASSID
ALIMENTARY SYSTEMEsophagusIntestine large
Leukemia mononuclearColon, Peyer's patch, leukemia
mononuclearPeyer's patch, rectum, leukemia
mononuclearRectum, leukemia mononuclear
Intestine smallAdenocarcmoma, metastatic, kidneyLeukemia mononuclearJejunum, sarcomaJejunum, Pever's patch, leukemia
mononuciearPeyer's patch, leukemia mononuclear
LiverAdenocarcmoma, metastatic, kidneyHepatocellular carcinomaLeukemia mononuclearNeoplastic noduleNeoplastic nodule, multiple
MesenteryAdenocarcmoma, metastatic, kidney
PancreasAdenocarcmoma, metastatic, kidneyLeukemia mononuclearAcinus, adenoma
Salivary glandsLeukemia mononuclear
StomachLeukemia mononuclearForestomach, papilloma squamous
CARDIOVASCULAR SYSTEMHeart
Leukemia mononuclearMyocardium, leukemia mononuclearPericardium, leukemia mononuclear
ENDOCRINE SYSTEMAdrenal gland
Leukemia mononuclearBilateral, medulla, leukemia
mononuclearBilateral, medulla, pheochromorytoma
complexBilateral, medulla, pheochromocytoma
benignCapsule, leukemia mononuclearCortex, adenomaCortex, leukemia mononuclearMedulla, leukemia mononuclearMedulla, pheochromocytoma benign
Islets, pancreaticAdenomaMixed tumor malignant
Parathyroid glandAdenoma
Pituitary glandLeukemia mononuclearPars distahs, adenoma
Thyroid glandBilateral, capsule, leukemia
mononuclearC cell, adenoma
GENERAL BODY SYSTEMTissue, NOS
Adenocarcmoma, metastatic, kidneyChemodectoma malignantOrgan of Zuckerkandl
1 L 1 L 1 1 1 1 1 1 1 1 1 1 L 1 1 1 1 L 1 1 L i 10 0 I) 0 0 0 0 0 0 0 0 0 0 0 0 0 0 0 0 0 0 0 0 0 0
0 0 0 0 0 0 0 0 0 0 0 0 0 0 0 0 0 0 0 0 0 0 0 1 T3 4 4 4 5 5 6 6 ( 5 7 7 7 7 8 8 8 8 8 9 9 9 9 9 0 05 2 3 4 1 2 -2. 3 5 2 3 4 5 L 2 3 4 5 L 2 3 4 5 1 4
f + + + + + f . ^ + f ( f + 4 + + 4 - + f f + ^
X X
X
X XX X
X XX X X X X X X X X X X X X X X X
X X X
M
X
X
t- + ^ + + + + + + + ^ t . + + + + + + + + + + + + +X X X X X
X
X X X X X X
X
X X X X X X X
XX
X
X X
X X X X X X X
+
XX
TOTAL:TISSUESTUMORS
5047
1
3
1I
47111
32
5013
31313I
49121
501
4921
501011
501
1
1
91112
124911
421
4916
49
111
2111
69 2,4-Dichlorophenol, NTPTR 353
- - t
—

TABLE A2. INDIVIDUAL ANIMAL TUMOR PATHOLOGY OF MALE RATS: UNTREATED CONTROL(Continued)
WEEKS ONSTUDY
CARCASSID
GENITAL SYSTEMEpididymis
Adenocarcmoma, metastatic, kidneyLeukemia mononuclear
Preputial glandAdenomaLeukemia mononuciear
ProstateAdanocarcmoma, metastatic, kidneyLeukemia mononuclear
TestesLeukemia mononuclearBilateral, interstitial cell, adenomaInterstitial cell, adenoma
HEMATOPOIETIC SYSTEMBlood
Leukemia mononuciearBone marrow
Leukemia mononuclearLymph node
Carcinoma, metastatic, skinLeukemia mononuclearBronchial, leukemia mononuclearDeep cervical, leukemia mononuclearMandibular, leukemia mononuclearMediastmai, leukemia mononuclearMesentenc, leukemia mononuclearRenal, leukemia mononuclear
SpieenLeukemia mononuclear
ThymusLeukemia mononuclear
INTEGUMENTARY SYSTEMMammary gland
AdenocarcmomaFibroadenoma
SkinCarcinomaKeratoacanthomaPapilloma squamousAbdominal, subcutaneous tissue.
leukemia mononuclearFace, subcutaneous tissue, leukemia
mononuclearSubcutaneous tissue, fibromaSubcutaneous tissue, sarcoma
MUSCULOSKELETAL SYSTEMBone
NERVOUS SYSTEMBrain
Carcinoma, metastatic, skinLeukemia mononuclear
RESPIRATORY SYSTEMLung
Adenocarcmoma, metastatic, kidneyAlveolar/bronchiolar carcinomaCarcinoma, metastatic, skinLeukemia mononuclearSarcoma, metastaticInterstitium, leukemia mononuclearInterstitium, mediastinum, leukemia
mononuclearMediastinum, leukemia mononuclearMediastinum, hpoma
NOSPLeukemia mononuclear
Trachea
SPECIAL SENSES SYSTEMEyeHardenan gland
Bilateral, leukemia mononuclearZymbal gland
Carcinoma
URINARY SYSTEMKidney
Leukemia mononuclearCapsule, leukemia mononuclearRenal tubule, adenocarcinoma
Urinary bladderLeukemia mononuclear
0 0 0 0 0 0 0 06 7 7 8 8 a 9 90 2 9 2 9 4 4 4
0 0 0 0 1 0 0 05 1 3 4 0 5 3 23 1 2 5 3 5 3 2
M - M M - f - f + 4-
X4- 4- M 4- + t- 4- +
X
XX X X X X
X
4 M 4 + 4X X X X
X X X X X
X X
XX X X X X XX X X X
X
X X X X X X XI I M 4- + 4- + 4-
X X
+ 4- 4- + M + 4-
X
X
X
X
0 0 0 0 0 0 0 1 1 1 1 1 1 1 1 1 19 9 9 9 9 9 9 0 0 0 0 0 0 0 0 0 0
1 1 0 0 0 0 0 0 0 0 0 0 0 0 0 0 00 0 1 5 1 4 7 6 6 1 1 2 2 2 2 3 32 5 2 4 4 1 1 4 1 3 5 1 3 4 5 1 4
XX
t-M + + - + + + + + + + + + + + +
X
X X X X X X X X XX X X X X X X X
+ + + + + + + + + +X X X X X X
X X X
X
X
X X X X X X X XX X X X
X XX X
X X X X X X X Xf + + • ( - - ( - M I + + - 1 - 4 - + f + 4- + +
X
1- f - M - + M + M M + + + + - M - f
X
X X
X
+ + , + . + + + + + + + H- H- I + . + . + + + + + +
X X
X X X X XX
X X
XX
M M M M M + +• +X
+ M-t- -t-
X
+ + + + + + + +X X X
X
- t - f + + -t + + +X X
+ + + + + + + + + + + + + + + + +X
+ + + + + + + + + + + + + + + + +X
XX
X X X X
X
+ + A + + + + + + + + + + + + + +
+ + I +
+ + + -,. + + + + + + -,- + + + -,- + -,-X X
X
2,4-Dichlorophenol, NTPTR353 70
~~ ~
— - - - -
-

TABLE A2. INDIVIDUAL ANIMAL TUMOR PATHOLOGY OF MALE RATS: UNTREATED CONTROL(Continued)
WEEKS ONSTUDY
CARCASSID
GENITAL SYSTEMEpididvmis
Adenocarcmoma, metastatic, kidneyLeukemia mononuclear
Preputial glandAdenomaLeukemia mononuclear
ProstateAdenocarcmoma, metastatic, kidneyLeukemia mononuclear
TestesLeukemia mononuclearBilateral, interstitial cell, adenomaInterstitial cell, adenoma
HEMATOPOIETIC SYSTEMBlood
Leukemia mononuclearBone marrow
Leukemia mononuclearLymph node
Carcinoma, metastatic, skinLeukemia mononuclearBronchial, leukemia mononuclearDeep cervical, leukemia mononuclearMandibular, leukemia mononuclearMediastinal, leukemia mononuclearMesentenc, leukemia mononuclearRenal, leukemia mononuclear
SpleenLeukemia mononuclear
ThymusLeukemia mononuclear
INTEGUMENTARY SYSTEMMammary gland
AdenocarcmomaFibroadenoma
SkinCarcinomaKeratoacanthomaPapilloma squamousAbdominal, subcutaneous tissue.
leukemia mononuclearFace, subcutaneous tissue, leukemia
mononuclearSubcutaneous tissue, fibromaSubcutaneous tissue, sarcoma
MUSCULOSKELETAL SYSTEMBone
NERVOUS SYSTEMBrain
Carcinoma, metastatic, skinLeukemia mononuclear
RESPIRATORY SYSTEMLung
Adenocarcmoma. metastatic, kidneyAlveolarforonchiolar carcinomaCarcinoma, metastatic. skip.Leukemia mononuclearSarcoma, metastaticInterstitium, leukemia mononiirlearInterstitium, mediastinum, leukemia
mononuclearMediastinum, leuKprma mononuclearMediastinum, hpoma
NoseLeukemia mononuclear
Trachea
SPECIAL SENSES SYSTEMEyeHardenan gland
Bilateral, leuicemia mononuc learZymbal gland
Carcinoma
URINARY SYSTEMKidney
Leukemia mononuclearCapsule, leukemia mononudearRenal tubule, adenotarcmoma
Unnary bladderLeukemia mononuclear
1 1 1 1 1 1 1 1 1 1 1 1 1 1 1 1 1 1 1 1 1 1 1 1 10 0 0 0 0 0 0 0 0 0 0 0 0 0 0 0 0 0 0 0 0 0 0 0 0
0 0 0 0 0 0 0 0 0 0 0 0 0 0 0 0 0 0 0 0 0 0 0 1 13 4 4 4 5 5 6 6 6 7 7 7 7 8 8 8 8 8 9 9 9 9 9 0 05 2 3 4 1 2 2 3 5 2 3 4 5 1 2 3 4 5 1 2 3 4 5 1 4
+ + + + + + + + + + + + + + + + + + + + + + + + +
+ + + + + + + + + + +M+ + + + + + + + + + + + +X X
+ M+ + + + + + - I - + + I- + + + + + + + + + + + + +
x x x x x x x x x x x x x x x x x x x x xX X X X
-f + + + + + -* + + + + - h -X X X X X X X
+ + + + f + + + + + + + + + + + + + + + + + 4 + +X X X X
+ + + + + + + + + + + + + + + + + + + + + + + + +
X
XX X X X X X X X X X X X X X XX X X X X X X X X
X X
X X X X X X X X X X X X X X X XM + -t- + + + + f t + I I + + + < - < - + ! + 4 - 1 + + M
X
+ M ( - M M M M M M + M M M M + + M + + + M + + M MX
X
X X X
+ + + + + + + + + + + + + + + + + + + + + + + + +
X X X X X
X
X X
M
M +X
X X X X
X+ M+ f 4- + -t- -t- + -t- f t - - t - - t - - t - + + + - t - - t - + + + - t - + -
X
TOTAL:TISSUESTUMORS
5011
43
14811
501
3513
26174912501312
291752
503139
4
2511
49112
1
141
49
5012
50111
1413
131
451
49
443
I11
50912
483
71 2,4-Dichlorophenol, NTP TR 353
- - — - - — --- - — - — —
-
-
-
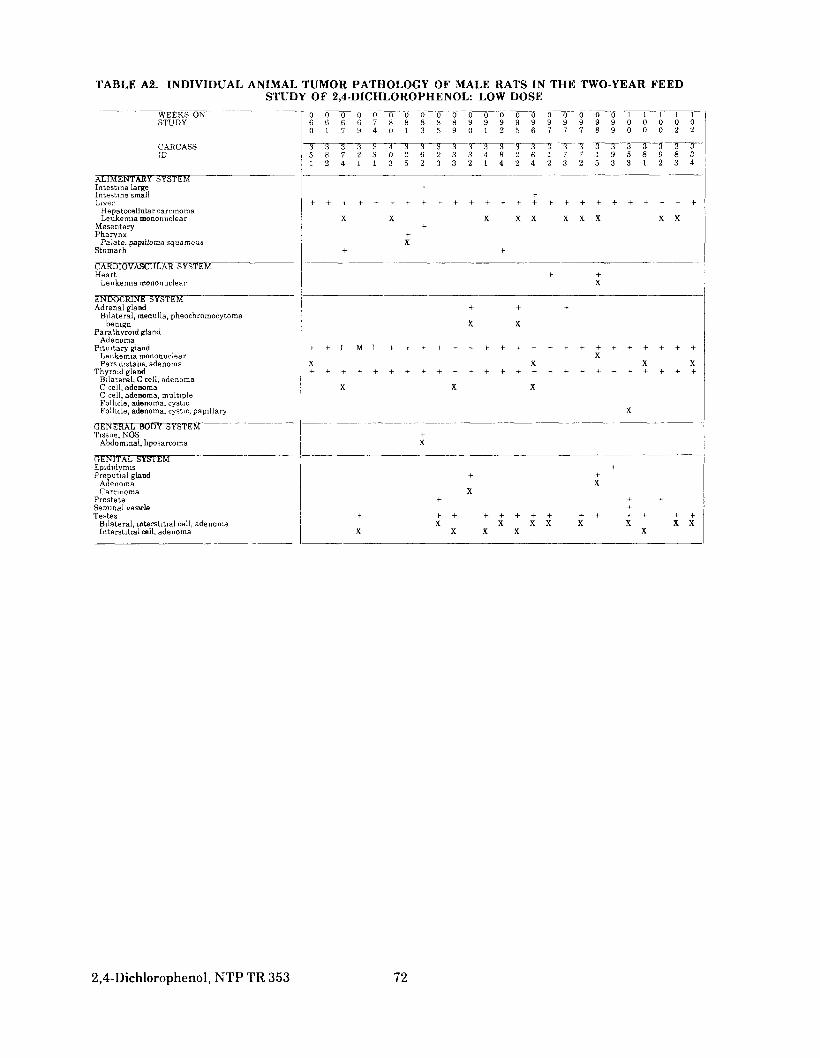
TABLE A2. INDIVIDUAL ANIMAL TUMOR PATHOLOGY OF MALE RATS IN THE TWO-YEAR FEEDSTUDY OF 2,4-DICHLOROPHENOL: LOW DOSE
WEEKS ONSTUDY
CARCASSID
ALIMENTARY SYSTEMIntestine largeIntestine smallLiver
Hepatocellular carcinomaLeukemia mononuclear
MesenteryPharynx
Palate, papilloma squamousStomach
CARDIOVASCULAR SYSTEMHeart
Leukemia mononuclear
ENDOCRINE SYSTEMAdrenal gland
Bilateral, medulla, pheochromocytomabenign
Parathyroid glandAdenoma
Pituitary glandLeukemia mononuclearPars d'.stahs, adenoma
Thyroid glandBilateral, C-cell, adenomaC cell, adenomaC cell, adenoma, multipleFollicle, adenoma, cysticFollicle, adenoma, cystic, papillary
GENERAL BODY SYSTEMTissue, NOS
Abdominal, hposarcoma
GENITAL SYSTEMEpididymisPreputial gland
AdenomaCarcinoma
ProstateSeminal vesicleTestes
Bilateral, interstitial cell, adenomaInterstitial cell, adenoma
0 0 0 0 0 0 0 0 0 0 0 0 0 0 0 06 6 6 6 7 8 8 8 8 8 9 9 9 9 9 90 1 7 9 4 0 1 3 5 9 0 1 2 5 6 7
3 3 3 3 3 4 3 3 3 3 3 3 3 3 3 35 8 7 2 3 0 2 6 2 3 3 4 8 2 6 11 2 4 1 1 3 5 2 3 3 2 1 4 2 4 2
+
+
X X X X X+
+X
4 +
0 0 0 0 1 1 1 1 19 9 9 9 0 0 0 0 07 7 8 9 0 0 0 2 2
3 3 3 3 3 3 3 3 37 7 1 9 5 8 9 8 33 2 5 3 3 1 2 3 4
X X X X X
X
+ +
X X
+ + I MI + + + + + + + • + • + + +
X X
X X X
+
X
f
X-h
X X X XX X X X
+
XX X
X
-t+X
-f -t-+
X X X XX
2,4-Dichlorophenol, NTP TR 353 72
-
-
--
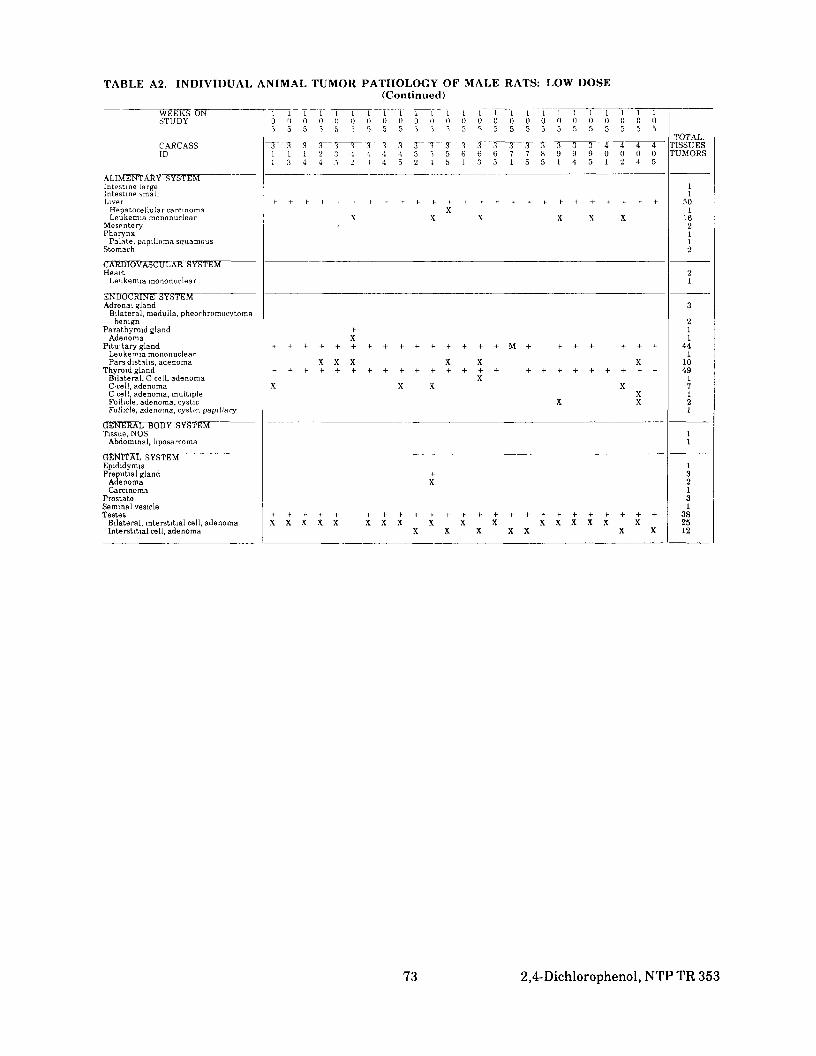
TABLE A2. INDIVIDUAL ANIMAL TUMOR PATHOLOGY OF MALE RATS: LOW DOSE(Continued)
WEEKS ONSTUDY
CARCASSID
ALIMENTARY SYSTEMIntestine largeIntestine smallLiver
Hepatocellular carcinomaLeukemia mononuclear
MesenteryPharynx
Palate, papilloma squamousStomach
CARDIOVASCULAR SYSTEMHeart
Leukemia mononuclear
ENDOCRINE SYSTEMAdrenal gland
Bilateral, medulla, pheochromocytomabenign
Parathyroid glandAdenoma
Pituitary glandLeukemia mononuclearParsdistahs, adenoma
Thyroid glandBilateral, C-ce!l, adenomaC-cell, adenomaC cell, adenoma, multipleFollicle, adenoma, cysticFollicle, adenoma, cystic, papillary
GENERAL BODY SYSTEMTissue, NOS
Abdominal, hposarcoma
GENITAL SYSTEMEpididymisPreputial gland
AdenomaCarcinoma
ProstateSeminal vesicleTestes
Bilateral, interstitial cell, adenomaInterstitial cell, adenoma
1 1 1 1 1 1 1 1 1 1 1 1 1 1 1 1 1 1 1 1 1 1 1 1 10 0 0 0 » 0 0 0 0 0 0 0 0 0 0 0 0 0 0 0 0 0 0 0 05 5 5 ) 5 > > 5 5 > i i 5 5 5 5 5 5 5 5 5 5 5 5 5
3 3 3 IT 1 T 3 1 3 3 1 3 3 3 3 3 3 3 3 3 3 4 4 4 41 1 1 2 3 4 4 4 4 5 5 5 6 6 6 7 7 8 9 9 9 0 0 0 01 3 4 4 5 ^ 1 4 5 2 1 5 1 3 5 1 5 5 1 4 5 1 2 4 5
XX X X X X X
+
+X
X X X X X X+ + + + + + + + + + + + + + + + + + + + + + + +
XX X X X
XX X
+X
+ + ^ + + + + + + + + + + + + + + + + + + + + +X X X X X X X X X X X X X X X X X
X X X X X X X
TOTAL.TISSUESTUMORS
11
501
162112
21
3
211
441
1049
17121
11
132131
382512
73 2,4-Dichlorophenol, NTP TR 353
r
~
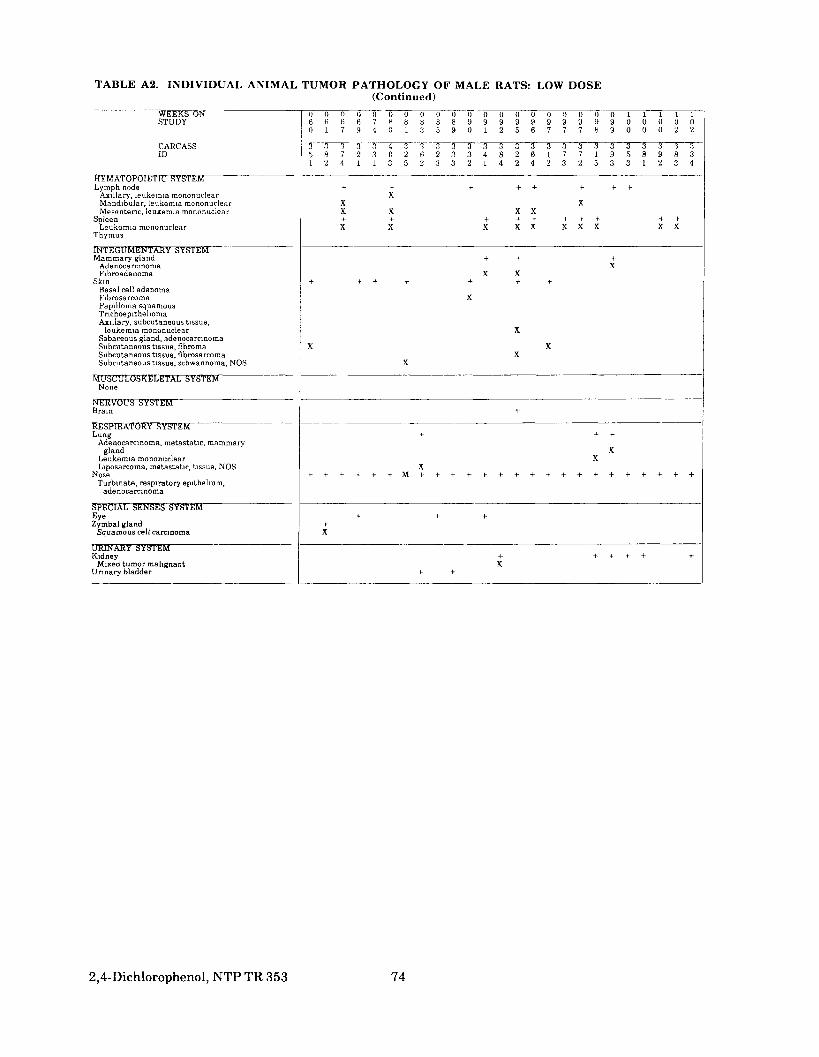
TABLE A2. INDIVIDUAL ANIMAL TUMOR PATHOLOGY OF MALE RATS: LOW DOSE(Continued)
WEEKS ONSTUDY
CARCASSID
HEMATOPOIETIC SYSTEMLymph node
Axillary, leukemia mononuciearMandibular, leukemia mononuciearMesenteric, leukemia mononuciear
SpleenLeukemia mononuciear
Thymus
INTEGUMENTARY SYSTEMMammary gland
AdenocarcinomaFibroadenoma
SkinBasal cell adenomaFibrosarcomaPapilloma squamousTnchoepithehomaAxillary, subcutaneous tissue.
leukemia mononuciearSebaceous gland, adenocarcinomaSubcutaneous tissue, fibromaSubcutaneous tissue, fibrosarcomaSubcutaneous tissue, schwannoma, NOS
MUSCULOSKELETAL SYSTEMNone
NERVOUS SYSTEMBrain
RESPIRATORY SYSTEMLung
Adenocarcinoma, metastatlc, mammarygland
Leukemia mononuciearLiposarcoma, metastatlc, tissue, NOS
NoseTurbinate, respiratory epithelium.
ade noca rci noma
SPECIAL SENSES SYSTEMEyeZymbal gland
Squamous cell carcinoma
URINARY SYSTEMKidney
Mixed tumor malignantUrinary bladder
0 0 0 0 0 0 0 0 0 0 0 0 0 0 0 0 0 0 0 0 1 1 1 1 16 B B B 7 8 8 8 8 8 9 9 9 9 9 9 9 9 9 9 0 0 0 0 00 1 7 9 4 0 1 3 5 9 0 1 2 5 6 7 7 7 8 9 0 0 0 2 2
3 3 3 3 3 4 3 3 3 3 3 3 3 3 3 3 3 3 3 3 3 3 3 3 35 8 7 2 3 0 2 6 2 3 3 4 8 2 6 1 7 7 1 9 5 8 9 8 31 2 4 1 1 3 5 2 3 3 2 1 4 2 4 2 3 2 5 3 3 1 2 3 4
•f f -1- + + - ( - - ( - +•X
X XX X X X
X X X X X X X X X X
+ +- -t-X
X X+ + f -t + -t -t
X
X
X XX
X
+
f + +
XX
X
+ + +X
+ f + + + +X
+ +
2,4-Dichlorophenol, NTP TR 353 74
- - -
-
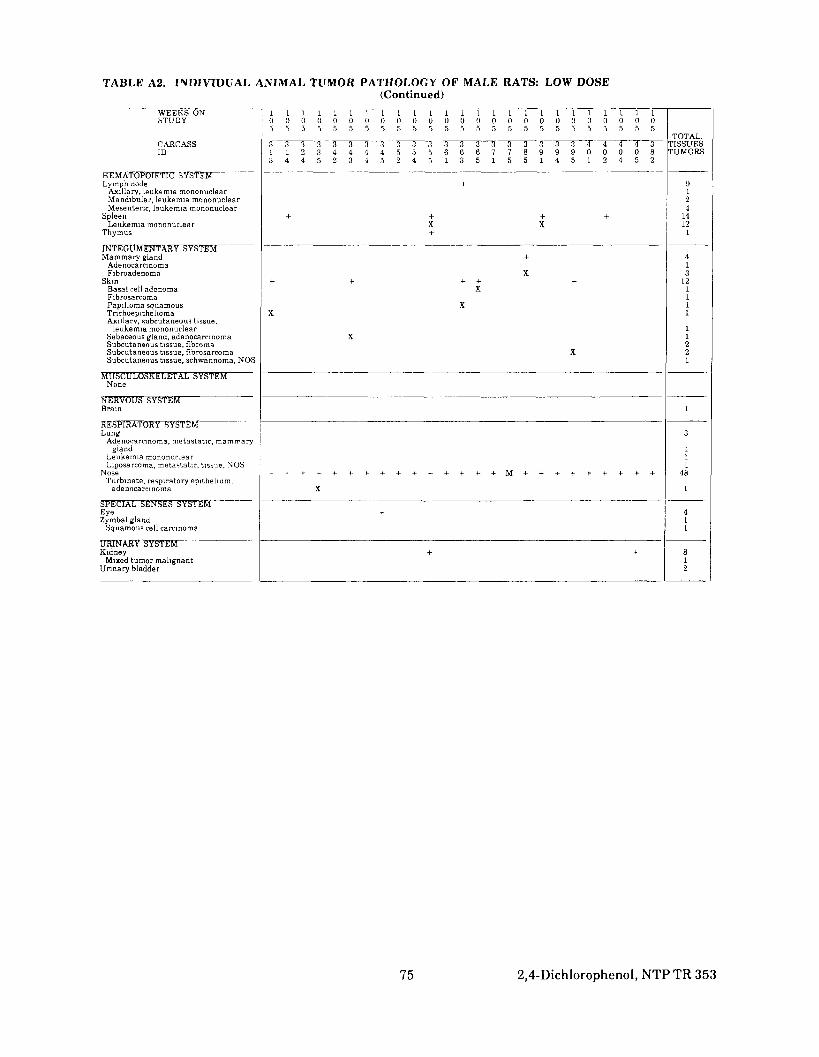
TABLE A2. INDIVIDUAL ANIMAL TUMOR PATHOLOGY OF MALE RATS: LOW DOSE(Continued)
WEEKS ONSTUDY
CAHCASSID
HEMATOPOIETIC SYSTEMLymph node
Axillary, leukemia mononuclearMandibular, leukemia mononuclearMesentenc, leukemia mononuclear
SpleenLeukemia mononuclear
Thymus
INTEGUMENTARY SYSTEMMammary gland
AdenocarcmomaFibroadenoma
SkinBasal cell adenomaFibrosarcomaPapilloma squamousTnchoepithehomaAxillary, subcutaneous tissue.
leukemia mononuclearSebaceous gland, adenocarnnomaSubcutaneous tissue, fibromaSubcutaneous tissue, fibrosarcomaSubcutaneous tissue, schwannoma, NOS
MUSCULOSKELETAL SYSTEMNone
NERVOUS SYSTEMBrain
RESPIRATORY SYSTEMLung
Adenocarcmoma, metastatlc, mammarygland
Leukemia mononurlearLiposarcoma, metastatlc, tissue, NOS
NoseTurbmate, respiratory epithelium,
adenocarcinoma
SPECIAL SENSES SYSTEMEyeZymbal gland
Squamous cell carcinoma
URINARY SYSTEMKidney
Mixed tumor malignantUnnary bladder
l l l L l l l l l l l l l t l l l l l l l l l . l l0 0 0 0 0 0 0 0 0 0 0 0 0 0 0 0 0 0 0 0 0 0 0 0 05 5 5 5 5 5 5 5 5 5 5 5 5 5 5 5 5 5 5 5 5 5 5 5 5
3 3 3 3 3 3 3 3 3 3 3 3 3 3 3 3 3 3 3 3 4 4 4 4 3
3 4 4 5 2 3 4 5 2 4 5 1 3 5 1 5 5 1 4 5 1 2 4 5 2
f
+ + + -tX X+
-t
X4- + -t- + +
X
XX
X
X
+ + + + + + + + + + + + + + + M + + + + + + + + +
X
+
+ +
TOTAL.TISSUESTUMORS
9124
1412
1
413
121111
11221
1
3
11I
48
1
411
812
75 2,4-Dichlorophenol, NTP TR 353
-
-
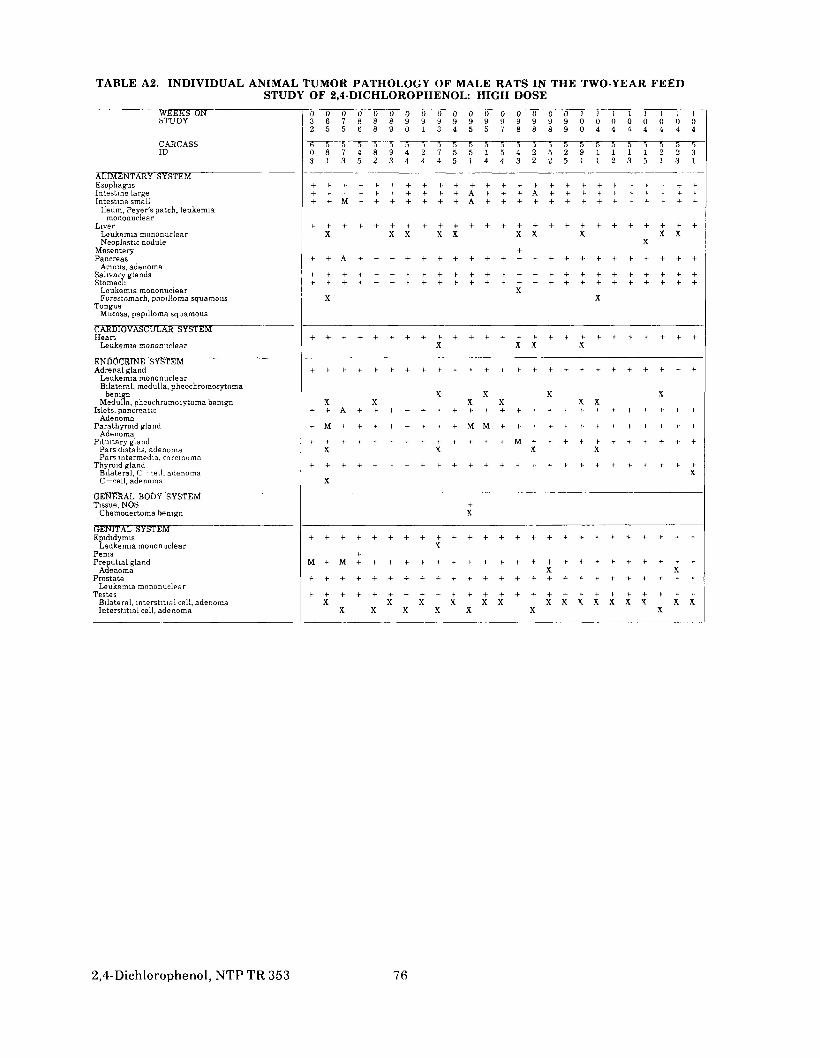
TABLE A2. INDIVIDUAL ANIMAL TUMOR PATHOLOGY OF MALE RATS IN THE TWO-YEAR FEEDSTUDY OF 2,4-DICHLOROPHENOL: HIGH DOSE
WEEKS ONSTUDY
CARCASSID
ALIMENTARY SYSTEMEsophagusIntestine largeIntestine small
Ileum, Peyer's patch, leukemiamononuclear
LiverLeukemia mononuclearNeoplastic nodule
MesenteryPancreas
Acinus, adenomaSalivary glandsStomach
Leukemia mononuclearForestomach, paoilloma squamous
TongueMucosa, papilloma squamous
CAKDIOVASCULAB SYSTEMHeart
Leukemia mononnclear
ENDOCRINE SYSTEMAdrenal gland
Leukemia mononuclearBilateral, medulla, pheochromocytoma
benignMedulla, pheochromocytoma benign
Islets, pancreaticAdenoma
Parathyroid glandAdenoma
Pituitary glandPars distahs, adenomaPars intermedia, carcinoma
Thyroid glandBilateral, C cell, adenomaC cell, adenoma
GENERAL BODY SYSTEMTissue, NOS
Chemodectoma benign
GENITAL SYSTEMEpididymis
Leukemia mononuclearPenisPreputial gland
AdenomaProstate
Leukemia mononuclearTestes
Bilateral, interstitial cell, adenomaInterstitial cell, adenoma
O O O O O O O O O O O O O O O O O l l t l L l l L3 6 7 8 8 8 9 9 9 9 9 9 9 9 9 9 9 0 0 0 0 0 0 0 0
6 5 5 5 5 5 5 5 5 5 5 5 5 5 5 5 5 5 5 5 5 5 5 5 50 8 7 4 8 9 4 2 7 5 5 1 5 4 2 5 2 9 1 1 1 1 2 2 33 1 3 5 2 3 4 4 4 5 1 4 4 3 2 2 5 1 1 2 3 5 1 3 1
+ + + 4 + + + + + + A + + + A + + + + + + + + + ++ - t - M f + + + + + + A 4 + + + + + + + + + + + + +
X X X X X X X X X XX
++ + A + + + + + + + T + + + + + + + + + + + + + +
+ + + + + H - J - + + + + + + + + -F + + + + + + 1- + +
XX X
+ + + + + + + + + + + + + + + + + + + + + + + + +X X X X
+ + + + + + + + + + + + + + + + + + + + + -*• + + +
X X X XX X X X X X
+ + & + + + + + + + + + + + + + + + + + + + + + +
+ M+ f + + + t + + M . M . + + + + + + + + + + + + +
+ + + + + + + + + + + + +M+ + + + + + + + + + +X X X X
XX
-tX
X+
M + M + + + -t- + + + + + - t - - t - + + -t- + + + + + + -l- +X X
T - - I + + + + + + + + + + + + + + + + + + + + + + +
t- + + + + + + + + -t+ + + + + + + + + -t- + + + t- +X X X X X X X X X X X X X X X
X X X X X X X
2,4-Dichlorophenol, NTP TR 353 76
--
—
-
-
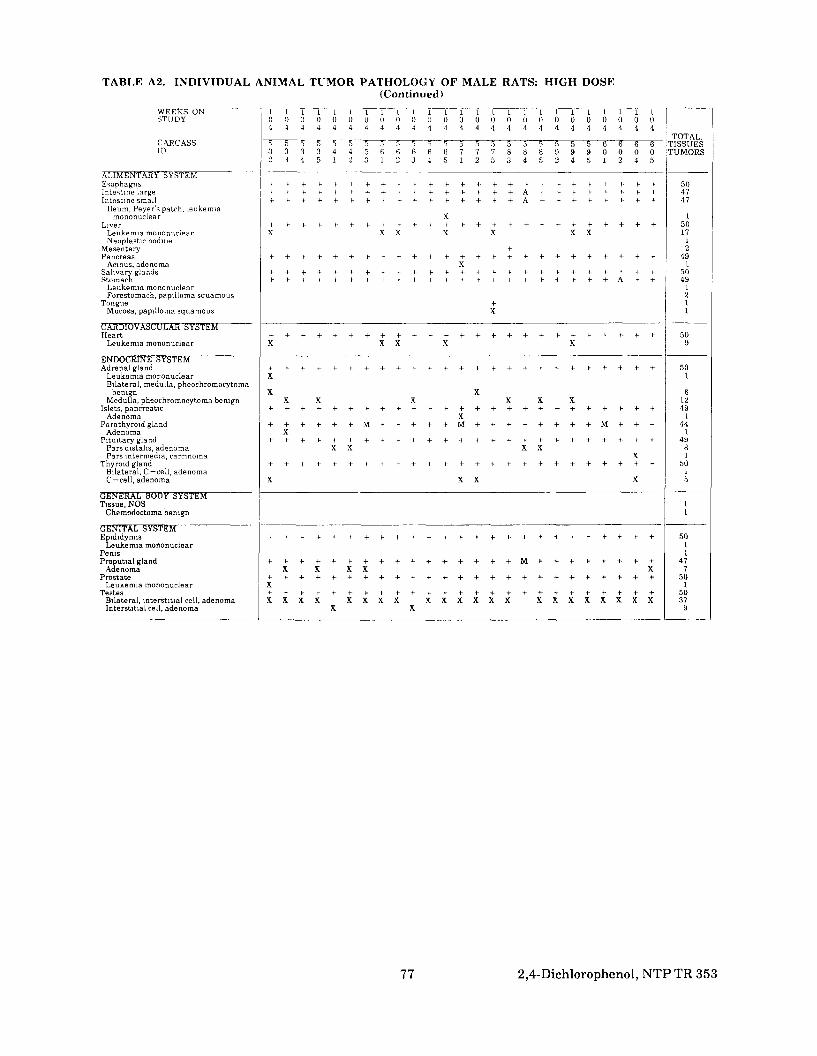
TABLE A2. INDIVIDUAL ANIMAL TUMOR PATHOLOGY OF MALE RATS: HIGH DOSE(Continued)
WEEKS ON 1 1 L 1 1 I 1 1 1 1 1 1 1STUDY
CARCASSID
ALIMENTARY SYSTEMEsophagusIntestine largeIntestine small
Ileum, Peyer's patch, leukemiamononuclear
LiverLeukemia mononuclparNeoplastic nodule
MesenteryPancreas
Acinus, adenomaSalivary glandsStomach
Leukemia mononuclearForestomach, papilloma squamous
TongueMucosa, papilloma squamous
CARDIOVASCULAR SYSTEMHeart
Leukemia mononuclear
ENDOCRINE SYSTEMAdrenal gland
Leukemia mononuclearBilateral, medulla, pheochromocytoma
benignMedulla, pheochromocytoma benign
Islets, pancreaticAdenoma
Parathyroid glandAdenoma
Pituitary glandPars distahs, adenomaPars intermedia, carcinoma
Thyroid glandBilateral, C cell, adenomaC cell, adenoma
GENERAL BODY SYSTEMTissue, NOS
Chemodectoma benign
GENITAL SYSTEMEpididymis
Leukemia mononuclearPenisPreputial gland
AdenomaProstate
Leukemia mononuclearTestes
Bilateral, interstitial cell, adenomaInterstitial cell, adenoma
o o o o o o u o o o n o o
5 5 " i S 1 5 5 5 5 5 1 y 53 3 3 3 4 4 5 6 6 6 fi 6 72 3 4 5 1 2 3 1 2 3 4 5 1
X
X X X X
X+ + + + + + + + + + f f - t
X X X X
X
XX X X
X+ + + f + - f M t - 4 + + + M
X
X X
+ + + + f + + + + + + -t +
X X
1 I 1 1 1 I 1 1 1 1 1 I0 0 0 0 0 0 0 0 0 0 0 0
S 5 5 5 5 5 5 5 6 6 6 67 7 8 8 8 9 9 9 0 0 0 02 5 3 4 5 2 4 5 1 2 4 5
+ t + A + - f - ) - f < - t - - f +
X X X
-t
+X
X
XX X X
X XX
X X
X X X X+ + + + + + + + + + + + +X
X X X X X X X X X X XX X
+ + +M.+ + + + + + + +X
X X X X X X X X X X X
TOTALTISSUESTUMORS
504747
1501712
491
5049
1211
509
501
61249
I44
149
81
5015
11
501I
477
501
5037
9
77 2,4-Dichlorophenol, NTP TR 353
r
-
-
-
-—
—
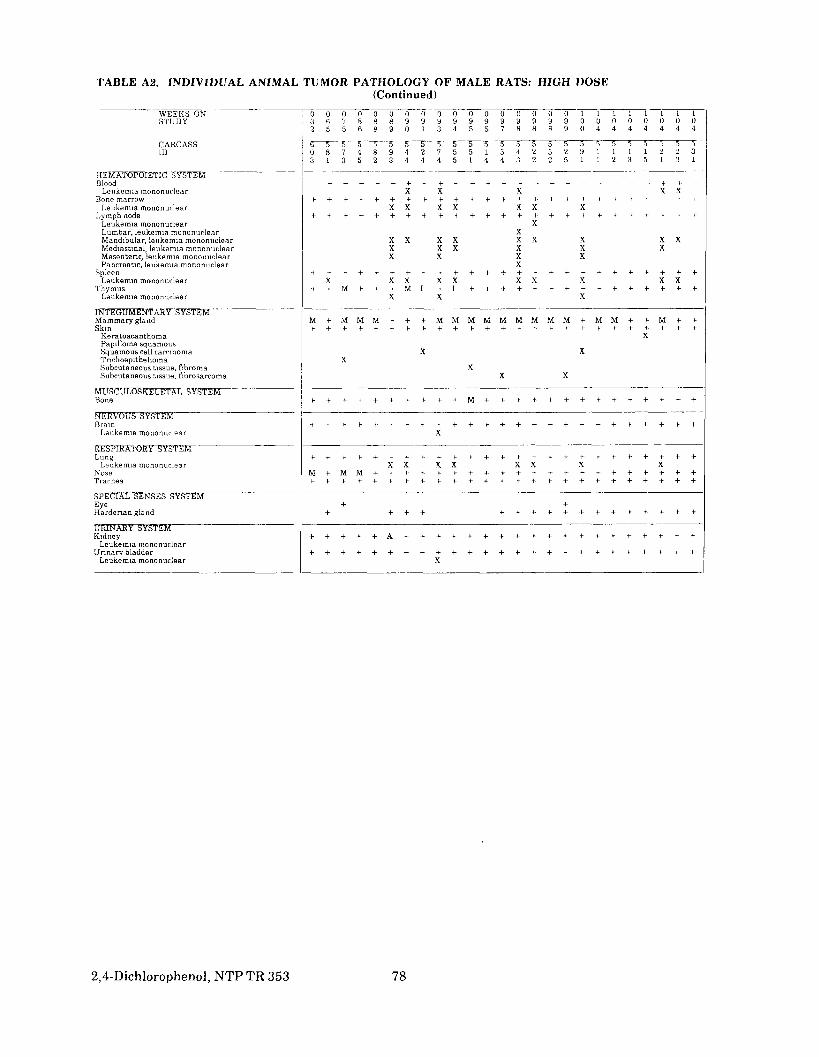
TABLE A2. INDIVIDUAL ANIMAL TUMOR PATHOLOGY OF MALE RATS: HIGH DOSE(Continued)
WEEKS ONSTUDY
CARCASSID
HEMATOP01ET1C SYSTEMBlood
Leukemia mononuclearBone marrow
Leukemia mononurlearLymph node
Leukemia mononuclearLumbar, leukemia mononuclearMandibular, leukemia mononuclearMediastinal leukemia mononuclearMesentenc, leukemia mononuclearPancreatic, leukemia mononuclear
SpleenLeukemia mononurlear
ThymusLeukemia mononuclear
INTEGUMENTARY SYSTEMMammary glandSkin
KeratoacanthomaPaptlloma squamousSquamous cell carcinomaTnchoepithehomaSubcutaneous tissue, fibromaSubcutaneous tissue, fibrosarcoma
MUSCULOSKELETAL SYSTEMBone
NERVOUS SYSTEMBrain
Leukemia mononuclear
RESPIRATORY SYSTEMLung
Leukemia mononuclearNoseTrachea
SPECIAL SENSES SYSTEMEyeHardenan giand
URINARY SYSTEMKidney
Leukemia mononuclearUnnarv bladder
Leukemia mononuclear
0 0 0 0 0 0 0 0 0 0 0 0 0 0 0 0 O l l l l l l . i l3 6 7 8 8 8 9 9 9 9 9 9 9 9 9 9 9 0 0 0 0 0 0 0 0
(5 5 5 5 5 5 5 5 5 5 5 5 5 5 5 5 5 5 5 5 5 5 , 5 50 8 7 4 8 9 4 2 7 5 5 1 5 4 2 5 2 9 1 1 1 1 H 2 33 1 3 5 2 3 4 4 4 5 1 4 4 . 1 2 2 5 1 1 2 3 5 1 3 1
4 - 4 - - - 4 -t f - - - - + - + •X X X X X
X X X X X X Xf + ^ + + + + 4 +• t + +• + + + + f + + + + f + + +
XX
X X X X X X X X XX X X X X XX X X X
X
X X X X X X X X X X•f +- M f + + M I + 1 + + + + + - + - + + +- + + H - 4 - + +
X X X
M + - M M M ¥ + 4 - M M M M M M M M M + M M + + M + ++ +*- + + + + + + + + + + + +• + + -<- + + + -<- + + +
X
X XX
XX X
+ + f + + + f + f + M + + + + + + + + + + + + + +
X
+ + f + + +- + + + + + + + + +- + + + + - 4 - + + f + +X X X X X X X X
M + M M + + + + + 4- + + + + +. + + 4- + + + +- + + ++ + + + + 4- + + i - 4 - + + + + -l- + + + +- + + + + + +
+ +
+ + + + + A + - t - - l - + - + + + + + + + + +- + ^ + + + +
+ + + + + + + + + + + + + + t- + + + + + + -l- + + +X
2,4-Dichlorophenol, NTP TR 353 78
'
— — — - — - - - - — - - —
-
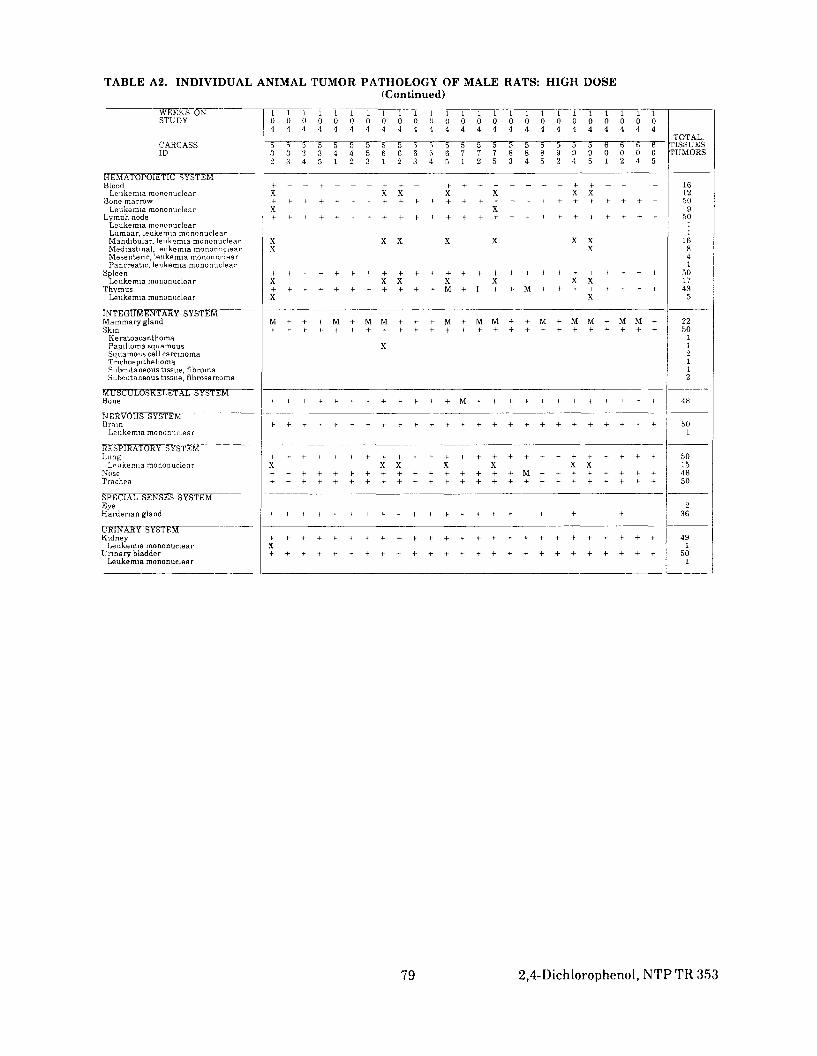
TABLE A2. INDIVIDUAL ANIMAL TUMOR PATHOLOGY OF MALE RATS: HIGH DOSE(Continued)
WEEKS ONSTUDY
CARCASSID
HEMATOPOIETIC SYSTEMBlood
Leukemia mononuclearBone marrow
Leukemia mononuclearLymph node
Leukemia mononuclearLumbar, leukemia mononuclearMandibular, leukemia mononuclearMediastinal, leukemia mononuclearMesentenc, leukemia mononuclearPancreatic, leukemia mononuclear
SpleenLeukemia mononuclear
ThvmiisLeukemia mononuclear
INTEGUMENTARY SYSTEMMammary glandSkin
KeratoacanthomaPapilloma squamousSquamous cell carcinomaTnchoepithehomaSubcutaneous tissue, fibromaSubcutaneous tissue, fibrosarcoma
MUSCULOSKELETAL SYSTEMBone
NERVOUS SYSTEMBrain
Leukemia mononuclear
RESPIRATORY SYSTEMLung
Lpukemia mononuclearNoseTrachea
SPECIAL SENSES SYSTEMEyeHardenan giand
URINARY SYSTEMKidney
Leukemia mononuciearUnnary bladder
Leukemia mononuclear
1 1 1 1 1 1 1 10 0 0 0 0 0 0 0
5 ^ 5 5 5 5 5 53 3 3 3 4 4 5 62 3 4 5 1 2 3 1
- ( - - - f - - - +•X X
X
X XX
X X
X
M + + + M + M M
X
1 1 1 1 1 1 1 1 1 1 1 1 1 1 1 1 10 0 0 0 0 0 0 0 0 0 0 0 0 0 0 0 0
5 5 5 5 5 5 5 5 5 5 5 5 5 6 6 6 66 6 6 6 7 7 7 8 8 8 9 9 9 0 0 0 02 3 4 5 1 2 5 3 4 5 2 4 5 1 2 4 5
+ - f + - + - - - - + f - - - -X X X X X
X
X X X X XX
X X X X X
X
+ + ^ M + M M + + M + M M + M M +
, , + + + , + + + . + + M + + + + + . + . + + + +
X X+ + t + + + f + + + + + + + + f f
X X X X X
+ + + + + + + + + + + + + + + + +
X
TOTAL.TISSUESTUMORS
1612509
5011
16841
5017435
2250
112112
48
501
50154650
236
491
501
79 2,4-Dichiorophenol, NTP TR 353

TABLE A3. ANALYSIS OF PRIMARY TUMORS IN MALE RATS IN THE TWO-YEAR FEED STUDY OF2,4-DICHLOROPHENOL
Adrenal Gland Medulla: PheochromocytomaOverall Rates (a)Adjusted Rates (c)Terminal Rates (d)Day of First ObservationLife Table Test (e)Logistic Regression Test (e)Fisher Exact Test (e)
Adrenal Gland Medulla: Pheochromocytoma orOverall Rates (a)Adjusted Rates (c)Terminal Rates (d)Day of First ObservationLife Table Test (e)Logistic Regression Test (e)Fisher Exact Test (e)
Preputial Gland: AdenomaOverall Rates (a)Adjusted Rates (c)Terminal Rates (d)Day of First ObservationLife Table Test (e)Logistic Regression Test (e)Fisher Exact Test (e)
Liver: Neoplastic NoduleOverall Rates (a)Adjusted Rates (c)Terminal Rates (d)Day of First ObservationLife Table Tests (e)Logistic Regression Tests (e)Cochran Armitage Trend Test (e)Fisher Exact Test (e)
Liver: Hepatocellular CarcinomaOverall Rates (a)Adjusted Rates (c)Terminal Rates (d)Day of First ObservationLife Table Tests (e)Logistic Regression Tests (e)Cochran Arrmtage Trend Test (e)Fisher Exact Test (e)
Control
21/50(42%)550%16/33 (48%)663
5,000 ppm
(b) 2/3 (67%)
10,000 ppm
18/50(36%)439%10/32(31%)454P 0398NP 0364NP 0341N
Malignant Pheochromocytoma22/50 (44%)576%17/33 (52%)663
2/43 (5%)63%2/32 (6%)727
4/50(8%)12 1%4/33(12%)727P 0094NP 0094NP 0082N
3/50(6%)91%3/33(9%)727P 0071NP 0071NP 0060N
(b) 2/3 (67%)
(b) 2/3 (67%)
0/50 (0%)00%0/25 (0%)
P 0 102NP 0 102N
P 0059N
1/50 (2%)40%1/25 (4%)727p 0 408Np 0408N
P 0309N
18/50(36%)439%10/32(31%)454P 0329NP 0292NP 0270N
7/47(15%)21 6%6/31(19%)681P 0074P 0072P 0101
1/50(2%)3 1%1/32 (3%)727P 0 187NP 0 187N
P 0 181N
0/50 (0%)00%0/32(0%)
P 0 126NP 0 126N
P 0 121N
Liver: Neoplastic Nodule or Hepatocellular CarcinomaOverall Rates (a)Adjusted Rates (c)Terminal Rates (d)Day of First Obset vationLife Table Tests (e)Logistic Regression Tests (e)Cochran Armitage Trend Test (e)Fisher Exact Test (e)
5/50(10%)152%5/33(15%)727P 0057NP 0057NP 0049N
1/50(2%)40%1/25(4%)727P 0 174Np 0 174N
P 0102N
1/50(2%)3 1%1/32(3%)727P 0 108NP 0 108N
P 0 102N
2,4-Dichlorophenol, NTP TR 353 80
= = =
= = =
= = =
= =
=
= =
=
= =
=
= = =
= = =
= = =
= =
=
= =
=
= =
=

---
T4BLE 113. ANALYSIS OF PRIMARY TUMORS IN MALE RATS I N T H E TWO-YEAR F E E D STUDY OF 2,4-DICHLOROPHENOL (Continued)
Control
Mammary Gland: F ibroadenoma Overall Rates ( a ) 1/50 (2%) Adjusted Rates (c) 3.0% Terminal Rates (d) 1/33 (3%) Day of First Observation 727 Life Tatble Tests (e) P=0.397N L0gist.x Regression Tests (e) P =0.381N Cochran-Armitage Trend Test (e) P =0.378N Fisher Exact Test ( e )
Mammary Gland: F ibroadenoma or Adenocarc inoma Overa!.l Rates (a) -4djusted Rates (c) 'Terminal Rates td) Day of First Observation Life Table Tests (e) Logistic Regression Tests (e) Cochran-Armitage Trend Test (e ) Fisher Exact Test ( e )
Pitui tary GlandiPars Distalis: Adenoma Overall Rates (a) Adjusted Ra'es (c) 'Terminal Rates (d) Day of First Observation Life Table Tests (e) Logistic Regression Tests (e) Cochrtin-Armitage Trend Test (e) Fisher Exact Test (e)
2/50 (4%) 6.1% 2/33 (6%) 727 P =0.244N P =0.228N P =0.222N
6/49 (12%) 16.9% 4/32 (13%) 665 P=0.345 P=0.341 P =0.343
Skin: S q u a m o u s Papi l loma or S q u a m o u s Cell C a r c i n o m a Overall Rates (a) Adjusted Rates (c) Terminal Rates (d) Day of First Observation Life Table Tests ( e ) Logistic Regression Tests (e) Cochran-Armitage Trend Test ( e ) Fisher Exact Test (e)
Subcutaneous Tissue: F i b r o m a Overall Rates (a)Adjusted Rates (c) Terminal Rates (d) Day of First Observation Life Table Tests (e) Logistic Regression Tests (e) Cochran-Armitage Trend Test (e) Fisher Exact Test (e)
Subcutaneous Tissue: F i b r o m a or Fibrosarcoma Overall Rates (a) Adjust.ed Rates ( c ) Terminal Rates td) Day of First Observation Life Table Tests (e) Logistic Regression Tests (e) Cochran-Armitage Trend Test (e) Fisher Exact Test (e)
2/50 (4%) 5.3% 1/33 (3%) 663 P =0.388 P =0.394 P=0.399
4/50 (8%) 11.5% 3/33 (9%) 674 P =0.133N P =0.104N P=O.l18N
4/50 (8%) 11.5% 3/33 (9%) 674 P=0.441N P=0.410N P =0.424N
5,000 p p m
3/50 (6%) 9.0% 1/25 (4%) 636 P=0.240 P=0.294
P=0.309
4/50 (8%) 11.9% 1/25 (4%) 636 P =0.254 P=0.311
P=0.339
10/44 (23%) 36.5% 6/22 (27%) 414 P =0.072 P =0.133
P=0.144
1/50 (2%) 4.0% 1/25 (4%) 727 P =0.579N P =0.535N
P=0.500N
2/50 (4%) 4.8% 0/25 (0%) 414 P=0.417N P=0.287N
P=0.339N
4/50 (8%) 11.1% 1/25 (4%) 414 P =0.545 P = 0.610N
P=0.643N
10,000 p p m
0/50 (0%) 0.0% 0/32 (0%)
P =0.506N P =0.506N
P =0.500N
0/50 (0%)0.0% 0/32 (0%)
P =0.245N P=0.245N
P =0.247N
8/49 (16%) 21.6% 5/32 (16%) 454 P=0.384 P=0.386
P =0.387
3/50 (6%) 8.2% 1/32 (3%) 63 1 P=0.481 P=0.500
P =0.500
1/50 (2%) 2.5% 0/32 (0%)659 P=0.192N P =0.184N
P=0.181N
3/50 (6%) 7.9% 0/32 (0%) 659 P=0.513N P = 0.506N
P=0.500N
81 2,4-Dichlorophenol,NTP TR 353
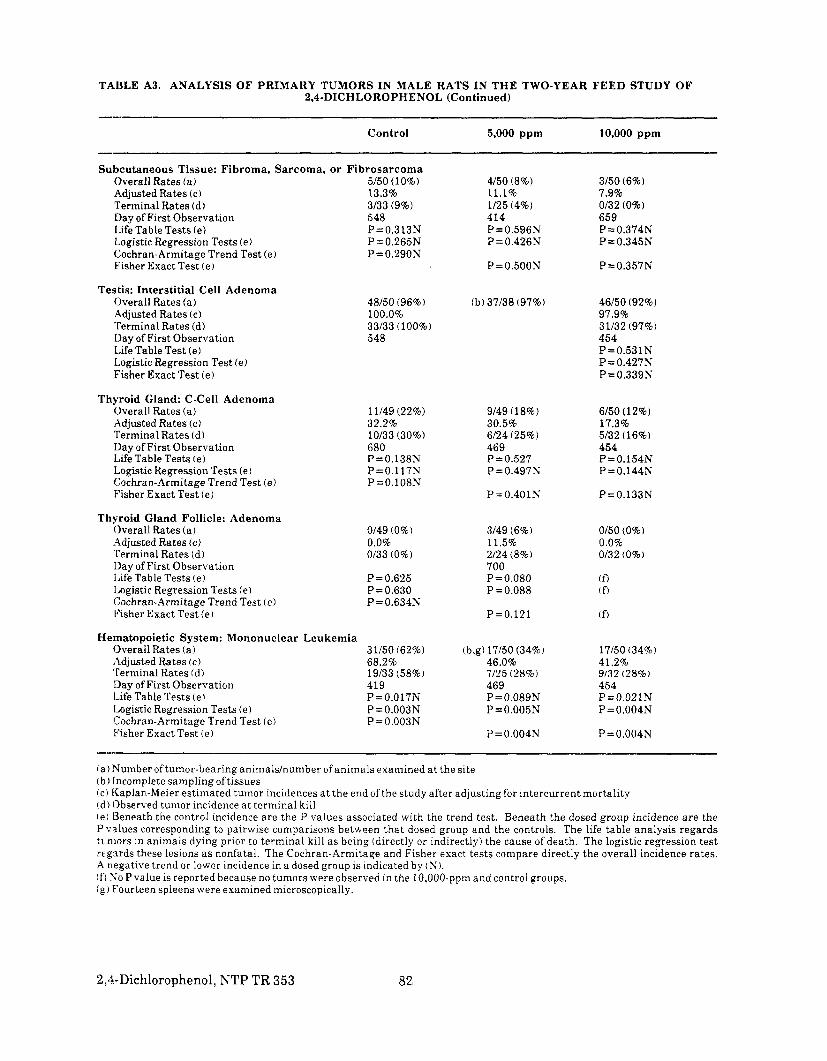
TABLE A3. ANALYSIS O F PRIMARY TUMORS I N MALE RATS I N T H E TWO-YEAR F E E D STUDY O F 2,4-DICHLOROPHENOL (Continued)
Control 5,000 p p m 10,000 p p m
Subcutaneous Tissue: Fibroma, Sarcoma, or Fibrosarcoma Overall Rates (a) 5/50 (10%) 4/50 (8%) 3/50 (6%) Adjusted Rates (c) 13.3% 11.1% 7.9% Terminal Rates (d) 3/33 (9%) 1/25 (4%) 0132 (0%) Day of First Observation 548 414 659 l i f e Table Tests (e) P=0.313N P=0.596N P =0.374N Logistic Regression Tests (e) P =0.265N P=0.426N P = 0.345N Cochran-Armitage Trend Test (e) P=0.290N Fisher Exact Test (e) P=0.500N P=0.357N
Testis: Interstitial Cell Adenoma Overall Rates (a) 48/50 (96%) (b) 37/38 (97%) 46/50 (92%) Adjusted Rates (c) 100.0% 97.9% Terminal Rates (d) 33/33 (100%) 31/32 (97%) Day of First Observation 548 454 Life Table Test (e) P =0.531N Logistic Regression Test (e) P =0.427N Fisher Exact Test (e) P=0.339N
Thyroid Gland: C-ce l l Adenoma Overall Rates (a) 11/49 (22%) 9/49 (18%) 6/50(12%) Adjusted Rates (c) 32.2% 30.5% 17.3% Terminal Rates (d) 10/33 (30%) 6/24 (25%) 5/32 (16%) Llay of First Observation 680 469 454 Life Table Tests (e) P=0.138N P=0.527 P= 0.154N Logistic Regression Tests (e) P=O.l17N P =0.497N P =0.144N Cochran-Armitage Trend Test (e) P = 0.108N Fisher Exact Test (e) P =0.401N P=0.133N
Thyroid Gland Follicle: Adenoma Overall Rates ( a ) 0149 (0%) 3/49 (6%) 0/50 (0%) Adjusted Rates ( c ) 0.0% 11.5% 0.0% 'Terminal Rates (d) 0/33 (0%) 2/24 (8%) 0132 (0%) Day of First Observation 700 Life Table Tests ( e ) P=0.625 P=0.080 t f , Logistic Regression Tests (e) P=0.630 P =0.088 tfl Cochran-Armitage Trend Test (e) P=0.634N Fisher Exact Test (e) P=0.121 t f l
Hematopoietic System: Mononuclear Leukemia Overall Rates (a) 31/50 (62%) (b,g) 17/50 (34%) 17/50 (34%) Adjusted Rates (c) 68.2% 46.0% 41.2% Terminal Rates (d) 19/33 (58%) 7/25 (28%) 9/32 (28%) Day of First Observation 419 469 454 Life Table Tests (e) P =0.017N P=0.089N P = 0.021N Logistic Regression Tests (e) P=0.003N P =0.005N P =0.004N Cochran-Armitage Trend Test (e) P =0.003N Fisher Exact Test (e) P =0.004N P=0.004N
( a )Number oftumor-bearing animals/number of animals examined at the site tb) Incomplete sampling oftissues (c)Kaplan-Meier estimated tumor incidences a t the end of the study after adjusting for intercurrent mortality ( d )Observed tumor incidence a t terminal kill ( e )Beneath the control incidence are the P values associated with the trend test. Beneath the dosed group incidence a r e the P values corresponding to pairwise comparisons between tha t dosed group and the controls. The life table analysis regards t w i o r s in animals dying prior to terminal kill as being (directly or indirectly) the cause of death. The logistic regression test regards these lesions a s nonfatal. The Cochran-Armitage and Fisher exact. tests compare directly the overall incidence rates. A negative trend or lower incidence in a dosed group is indicated by ( N ) . t f l No Pvalue is reported because no tumors were observed in the 10,000-ppm and control groups. (g) Fourteen spleens were examined microscopically.
2,4-Dichlorophenol, NTP TR 353 82,
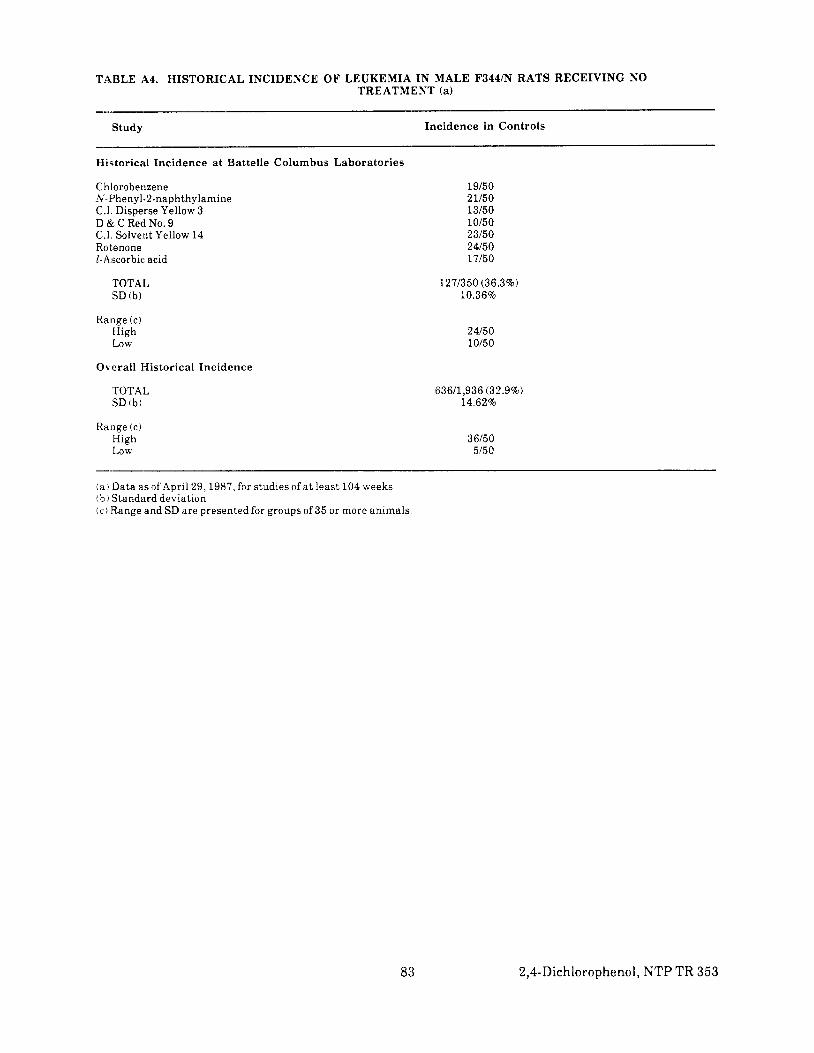
TABLE A4. HISTORICAL INCIDENCE OF LEUKEMIA IN MALE F344/N RATS RECEIVING NO TREATMENT (a)
Study
Historical Inc idence a t Battelle Columbus Labora tor ies
Chlorobetizene A; .Phenyl-2-naphthylamine C.I. Disperse Yellow 3 D & C Red No. 9 C.l. Solvent Yellow 14 Rot enone L-Ascorbic acid
TOTAL SD (b)
Range (c) High Low
Overall I-Iistorical Inc idence
TOTAL SD ( b )
Range ( c ) High Low
(a )Data a s of'April 29,1987, for studies of a t least 104 weeks ( b )Standard deviation ( c ) Range and SD are presented for groups of 35 or more animals.
Inc idence in Controls
19/50 21/50 13/50 10150 23/50 24150 17/50
127/350 (36.3%) 10.36%
2 415 0 10150
63611,936 (32.9%) 14.62%
36/50 5/50
83 2,4-Dichlorophenol,NTP TR 353
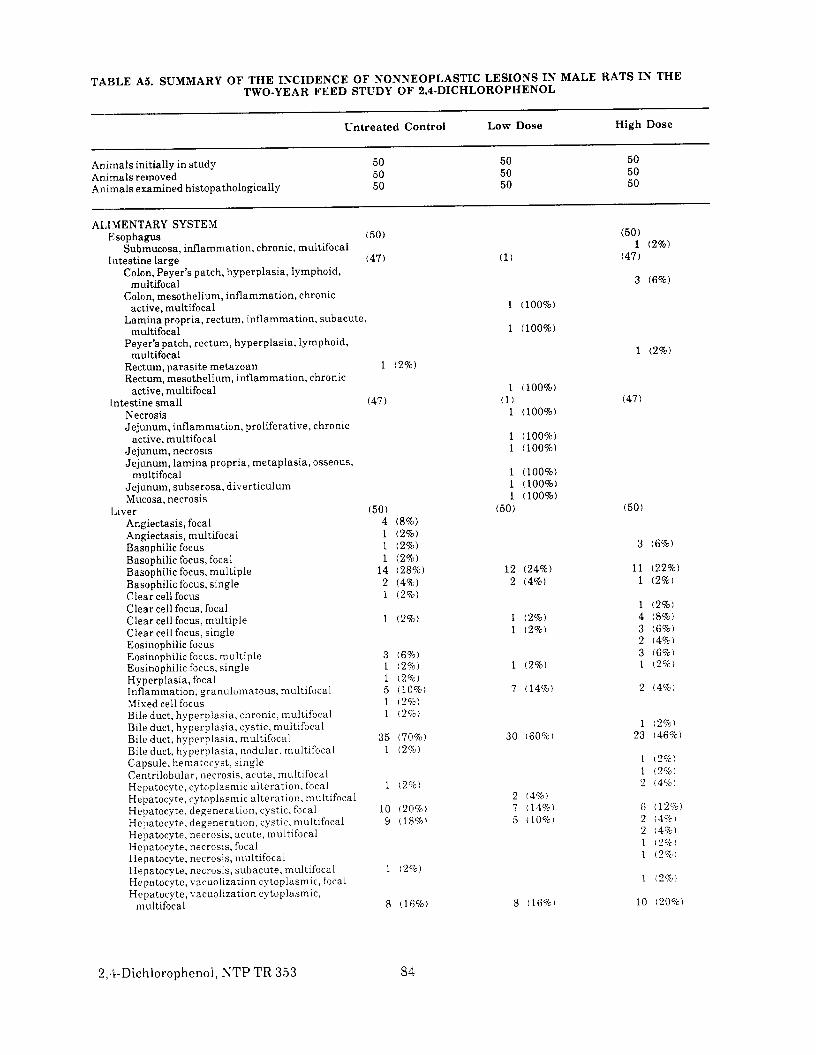
TABLE A5. SUMMARY OF THE INCIDENCE OF NONNEOPLASTIC LESIONS IN MALE RATS IN THE TWO-YEAR FEED STUDY OF 2,4-DICHLOROPHENOL
Untrea ted Control Low Dose
Animals initially in study 50 50 Animals removed 50 50 An imals examined histopathologically 50 50
ALIMENTARY SYSTEM Esophagus (50)
Submucosa, inflammation, chronic, multifocal Intestine large (47) (1)
Colo'n, Peyer's patch, hyperplasia, lymphoid, multifocal
Colon, mesothelium, inflammation, chronic active, multifocal 1 (100%)
Lamina propria, rectum, inflammation, subacute, mudtifoial- 1 (100%)
Peyer's patch, rectum, hyperplasia, lymphoid, multifocal
Recixm, parasite metazoan 1 (2%) Rectum, mesothelium, inflammation, chronic
active, multifocal 1 (100%) Intestine small (47) (1)
Necrosis 1 (100%) Jejunum, inflammation, proliferative, chronic
active, multifocal 1 (100%) Jejunum, necrosis 1 (100%) Jejunum, lamina propria, metaplasia, osseous,
multifocal 1 (100%) Jejunum, subserosa, diverticulum 1 (100%) Mucosa, necrosis 1 (100%)
Liver (50) (50) Angiectasis, focal 4 (8%) Angiectasis, multifocal 1 (2%) Basophilic focus 1 (2%) Basophilic focus, focal 1 (2%) Basophilic focus, multiple 14 (28%) 12 (24%) Basophilic focus, single 2 (4%) 2 (4%) C1e;sr cell focus 1 (2%) Cle:sr cell focus, focal C h a r cell focus, multiple 1 (2%) 1 (2%) C1e.ar cell focus, single 1 ( 2 % ) Eosinophilic focus Eosinophilic focus, multiple 3 ( 6 % ) Eosinophilic focus, single 1 (2%) 1 (2%) Hyperplasia, focal 1 ( 2 % ) Inflammation, granulomatous, multifocal 5 (10%) 7 (14%) Mixed cell focus 1 ( 2 % ) Bile duct, hyperplasia, chronic, multifocal 1 ( 2 % ) Bile duct, hyperplasia, cystic, multifocal Bile duct, hyperplasia. multifocal 35 (70%) 30 (60%) Bile duct, hyperplasia, nodular, multifocal 1 (2%) Capsule. hematocyst, single Centrilobular, necrosis, acute, multifocal Hepatocyte, cytoplasmic alteration. focal 1 ( 2 % ) Hepatocyte, cytoplasmic alteration, multifocal 2 (4%l Heimtocyte, degeneration. cystic, focal 10 (20%) 7 (14%) Hepatocyte, degeneration, cystic, multifocal 9 (18%) 5 (10%) Heipatocyte, necrosis, acute, tnultifocal He,patocyte, necrosis, focal Hepatocyte, necrosis, multifocal He patucyte, necrosis, subacute, multifocal 1 ( 2 % ) Hepatocyte, vacuolization cytoplasmic, focal Hepatocyte, vacuolization cytoplasmic.
multifocal 8 (16%) 8 11681
High Dose
50 50 50
(50) 1 (2%)
(47)
3 (6%)
1 (2%)
(47)
(50)
3 (6%)
11 (22%) 1 (2%)
1 (2%) 4 (8%) 3 ( 6 % ) 2 (4%) 3 (6%) 1 (2%)
2 (4%)
F (12%) 2 (4%) 2 i4%) 1 ( 2 % ) 1 (2%)
1 12%l
10 (20%)
2,9-Dicl~lorophenol,NTP TR 353 84
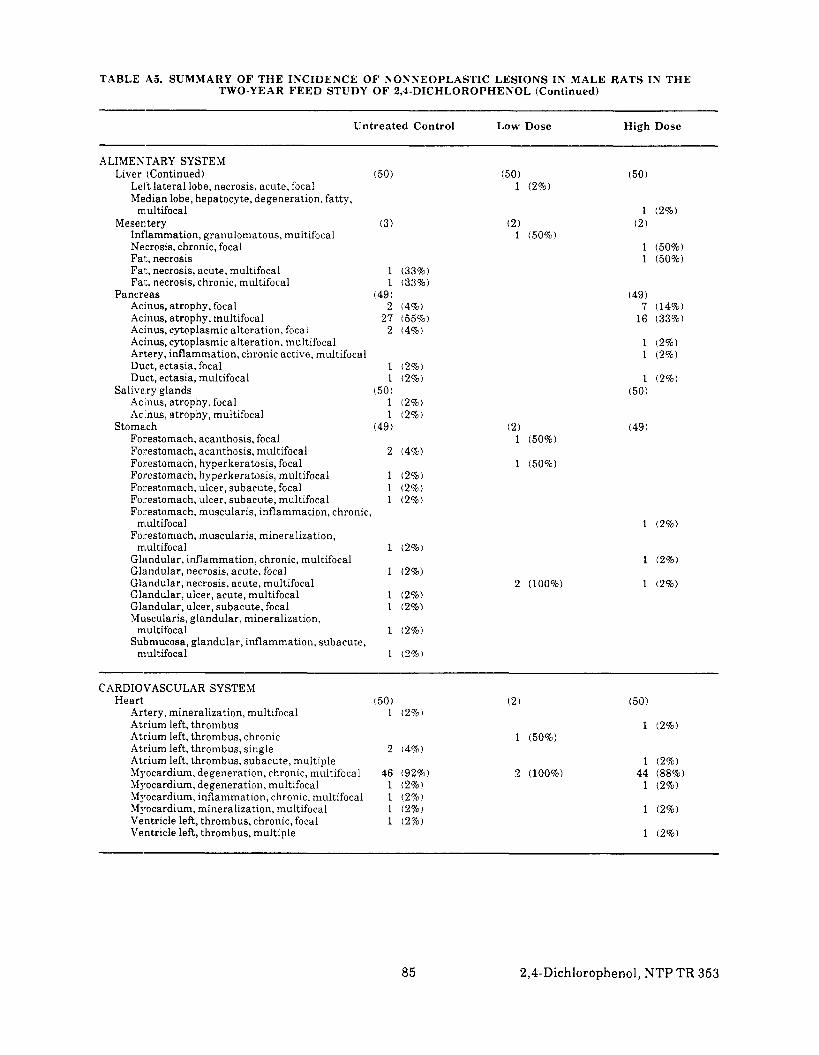
TABLE A5. SUMMARY OF THE INCIDENCE OF NONNEOPLASTIC LESIONS IN MALE RATS IN THE TWO-YEAR FEED STUDY OF 2,4-DICHLOROPHENOL (Continued)
Unt rea ted Control
ALIMENTARY SYSTEM Liver (Continued) (50)
Left lateral lobe, necrosis, acute, focal Median lobe, hepatocyte, degeneration, fatty,
m.ultifoca1 Mesen.tery (3)
Inflammation, granulomatous, multifocal Necrosis, chronic, focal Far:, necrosis Fai;, necrosis, acute, multifocal 1 (33%)Fa!:, necrosis, chronic, multifocal 1 (33%)
Pancrsas (49)Ac.inus, atrophy, focal 2 (4%) Ac:inus, atrophy, multifocal 27 (55%)Acinus, cytoplasmic alteration, focal 2 (4%)Acinus, cytoplasmic alteration, multifocal Artery, inflammation, chronic active, multifocal Duct, ectasia, focal 1 (2%) Duct, ectasia, multifocal 1 (2%)
Saliva.ry glands (50) Acinus, atrophy, focal 1 12%) Acinus, atrophy, multifocal 1 (2%)
Stoma.ch (49)Forestomach, acanthosis, focal Forestomach, acanthosis, multifocal 2 14%) Forestomach, hyperkeratosis, focal Forestomach, hyperkeratosis, multifocal 1 12%) Forestomach, ulcer, subacute, focal 1 (2%)Forestomach, ulcer, subacute, multifocal 1 (2%) Forestomach, muscularis, inflammation, chronic,
multifocal Forestomach, muscularis, mineralization,
multifocal 1 (2%)Glandular, inflammation, chronic, multifocal Glandular, necrosis, acute, focal 1 (2%) Glandular, necrosis, acute, multifocal Glandular, ulcer, acute, multifocal 1 (2%) Glimdular, ulcer, subacute, focal 1 (2%)Muscularis, glandular, mineralization,
multifocal 1 (2%)Submucosa, glandular, inflammation, subacute,
niultifocal 1 (2%)
CARDIOVASCULAR SYSTEM Heart (50)
Artery, mineralization, multifocal 1 (2%) Atrium left, thrombus Atrium left, thrombus, chronic Atrium left, thrombus, single 2 14%)Atrium left, thrombus, subacute, multiple Myocardium, degeneration, chronic, multifocal 46 (92%)Myocardium, degeneration, multifocal 1 (2%)Myocardium, inflammation, chronic, multifocal 1 (2%)Myocardium, mineralization, multifocal 1 (2%) Ventricle left, thrombus, chronic, focal 1 (2%)Ventricle left, thrombus, multiple
Lou: Dose High Dose
(50) (50)1 (2%)
1 (2%) (2) 12) 1 (50%)
1 (50%) 1 (50%)
(49)7 (14%)
16 (33%)
1 12%) 1 (2%)
1 (2%) (50)
(2) (49) 1 (50%)
1 (50%)
1 (2%)
1 (2%)
2 (100%) 1 (2%)
(2) 50)
1 (2%) 1 (50%)
1 (2%) 2 (100%) 44 (88%)
1 (2%)
1 (2%)
1 (2%)
85 2,CDichlorophenol, NTP TR 353
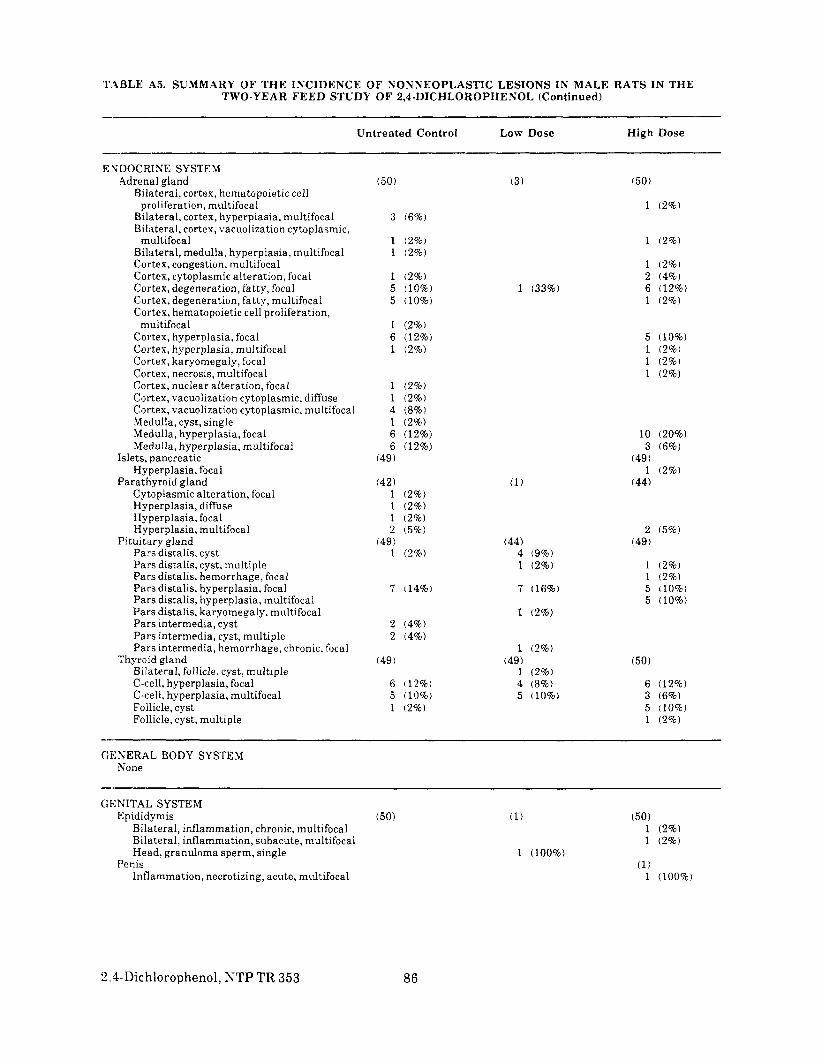
T.9BLE M. SUMMARY OF T H E INCIDENCE OF NONNEOPLASTIC LESIONS I N MALE RATS IN T H E TWO-YEAR FEED STUDY O F 2,4-DICHLOROPHENOL (Continued)
ENDOCRINE SYSTEM Adrenal gland
Bilateral, cortex, hematopoietic cell proliferation, multifocal
Bilateral, cortex, hyperplasia, multifocal Bilateral, cortex, vacuolization cytoplasmic,
multifocal Bilateral, medulla, hyperplasia, multifocal Cortex, congestion, multifocal Cortex, cytoplasmic alteration, focal Cortex, degeneration, fatty, focal Cortex, degeneration, fatty, multifocal Cortex, hematopoietic cell proliferation,
multifocal Cortex, hyperplasia, focal Cortex, hyperplasia, multifocal Cortex, karyomegaly, focal Cortex, necrosis, multifocal Cortex, nuclear alteration, focal Cortex, vacuolization cytoplasmic, diffuse Cortex, vacuolization cytoplasmic, multifocal Medulla, cyst, single Medulla, hyperplasia, focal Medulla, hyperplasia, multifocal
Islets, pancreatic Hyperplasia, focal
Parathyroid gland Cytoplasmic alteration, focal Hyperplasia, diffuse Hyperplasia, focal Hyperplasia, multifocal
Pituitary gland Pars distalis, cyst Pars distalis, cyst, multiple Pars distalis, hemorrhage, focal Pars distalis, hyperplasia, focal Pars distalis, hyperplasia, multifocal Pars distalis, karyomegaly, multifocal Pars intermedia, cyst Pars intermedia, cyst, multiple Pars intermedia, hemorrhage, chronic. focal
Thyroid glandBdateral, follicle, cyst, multiple C-cell, hyperplasia, focal C-cell, hyperplasia, multifocal Follicle, cyst Follicle, cyst, multiple
C:E;NERAL BODY SYSTEM None
GENITAL SYSTEM Epididymis
Bilateral, inflammation, chronic, multifocal Bilateral, inflammation, subacute, multifocal Head, granuloma sperm, single
Penis Inflammation, necrotizing, acute, multifocal
Unt rea ted Control
(50)
3 (6%)
1 (2%) 1 (2%)
1 (2%)5 (10%) 5 (10%)
1 (2%) 6 (12%) 1 (2%)
1 (2%)1 (2%) 4 (8%)1 (2%)6 (12%) 6 (12%)
(49)
(42) 1 (2%)1 (2%)1 (2%)2 (5%)
(49) 1 (2%)
7 (14%)
2 (4%) 2 (4%)
(49)
6 (12%) 5 (10%) 1 (2%)
(50)
Low Dose
(3)
1 (33%)
(1)
(44) 4 (9%) 1 (2%)
7 (16%)
1 (2%)
1 (2%) (49)
1 (2%) 4 (8%) 5 (10%)
(1)
1 (100%)
High Dose
(50)
1 (2%)
1 (2%)
(2%) (4%) (12%) (2%)
(10%) (2%) (2%) (2%)
10 (20%) 3 (6%)
(49) 1 (2%)
(44)
2 (5%) (49)
(2%) (2%) (10%) (10%)
(50)
6 (12%) 3 (6%) 5 (10%) 1 (2%)
(50) 1 (2%) 1 (2%)
(1) 1 (100%)
2,4-Dichlorophenol, 86NTP TR 353

TABLE Pi5. SUMMARY OF T H E INCIDENCE OF NONNEOPLASTIC LESIONS IN MALE RATS I N T H E TWO-YEAR F E E D STUDY OF 2,4-DICHLOROPHENOL (Continued)
Unt rea ted Control Low Dose High Dose
GENITAL, SYSTEM (Continued) Preputial gland
Abscess Hyperplasia, glandular, focal Hyperplasia, glandular, multifocal
(43) 1 (2%) 1 (2%) 1 (2%)
(3) (47)
Hyperplasia, nodular, squamous, multifocal Infiltration cellular, mononuclear cell,
1 (2%)
mononuclear cell, multifocal 1 (2%) Inflammation, chronic, multifocal Inflammation, chronic active, multifocal Inflammation, necrotizing, chronic active,
1 (2%) 4 (9%) 3 (6%)
Inflammation, subacute, multifocal multifocal
2 (5%) 1 (2%)
Bilateral, hyperplasia, glandular, multifocal Bilateral, inflammation, chronic active,
1 (2%)
Bilateral, duct, ectasia, focal Bilateral, duct, ectasia, multifocal Duct, ectasia, focal Duct, ectasia, multifocal Right, duct, ectasia, diffuse
Dilatation, multifocal Inflammation, chronic, multifocal Inflammation, chronic active, multifocal Inflammation, granulomatous, multifocal Inflammation, subacute, focal Inflammation, subacute, multifocal Inflammation, suppurative. chronic, multifocal Epithelium, hyperplasia, multifocal Serosa, inflammation, chronic, multifocal
Dilatation, multifocal
m dtifocal
Prostate
Seminal vesicle
27 (63%) 1 (2%) 6 (14%)
1 (2%) 1 (2%)
(48)
6 (13%)
1 (2%)
2 (4%) 2 (4%) 1 (2%)
(3) 1 (33%)
2 (67%)
(1) 1 (100%)
36 (77%) 1 (2%) 2 (4%) 3 (6%) 1 (2%)
(50)
3 (6%) 2 (4%)
1 (2%) 3 (6%)
1 (2%)
Atrophy, multifocal Bihteral , atrophy, multifocal Bihteral , interstitial cell, hyperplasia,
Bilateral, seminiferous tubule, atrophy,
'Testes
multifocal
(50)
1 (2%)
2 (4%)
(38) (50) 1 (2%)
4 (8%)
Bilateral, seminiferous tubule, atrophy, chronic, multifocal 1 (2%)
Intsrstitial cell, hyperplasia, multifocal Intrerstitial tissue. hemorrhage, chronic
multifocal
active, multifocal
27 (54%) 20 (53%) 4 (11%)
1 (3%)
20 (40%)2 (4%)
Left, atrophy, multifocal Left, interstitial cell, hyperplasia, focal Left, interstitial cell, hyperplasia, multifocal Left, seminiferous tubule, atrophy, multifocal
5 (10%) 6 (12%)
1 (3%)
4 (11%) 3 ( 8 % )
1 (2%) 2 (4%)4 (8%)
Right, interstitial cell, hyperplasia, multifocal 8 (16%) 3 (8%) 3 ( 6 % )
Right, interstitial tissue, hemorrhage, chronic active, multifocal 1 (3%)
Right, seminiferous tubule, atrophy, multifdcal Seminiferous tubule, atrophy, multifocal
5 (10%) 4 ( 8 % )
4 (11%) 4 (11%)
3 ( 6 % ) 3 ( 6 % )
Vein, ectasia, chronic, multifocal 1 (3%)
87 2,4-Dichlorophenol,NTP TR 353

TABLE M. SUMMARY OF THE INCIDENCE OF NONNEOPLASTIC LESIONS IN MALE RATS IN THE TWO-YEAR FEED STUDY OF 2,4-DICHLOROPHENOL (Continued)
--.~-Untreated Control Low Dose High Dose
---HEMATOPOIETIC SYSTEM
Blood (26)
Bone marrow (49) Neutrophilia 2 (8%)
Hyperplasia, neutrophil, multifocal 4 (8%) Myelofibrosis, multifocal 1 (2%) My'eloid cell, erythroid cell, hypoplasia,
Myeloid cell, erythroid cell, hypoplasia, diffuse
multifocal 2 (4%)
Depletion lymphoid, multifocal Hyperplasia, lymphoid, multifocal 1 (2%) Inguinal, inflammation, granulomatous,
Lumbar, inflammation, granulomatous, multifocal
Lymph node (50)
multifocal
Mandibular, cyst Mandibular, depletion lymphoid, multifocal Mandibular, hemorrhage, multifocal Mandibular, hyperplasia, lymphoid, multifocal Mandibular, hyperplasia, plasma cell, multifocal Mandibular, infiltration cellular, plasma cell,
Mandibular, inflammation, chronic, multifocal Mandibular, inflammation, granulomatous,
multifocal
3 (6%)
3 (6%) 6 (12%)
1 (2%) 1 (2%)
(9)
1 (11%) 1 (11%)
(16)
(50) 1 (2%)
1 (2%)
1 (2%) (50)
1 (2%) 1 (2%) 5 (10%) 5 (10%)5 (10%)
1 (2%) 1 (2%)
Mediastinal, hemorrhage, multifocal Mediastinal, hyperplasia, lymphoid, multifocal Mediastinal, inflammation, chronic, multifocal Mediastinal, inflammation, chronic active,
multifocal 3 (6%) 1 (2%)
1 (11%)
1 (2%) 4 (8%)
Mediastinal, inflammation, granulomatous, m.uItifoca1 1 (11%)
Mediastinal, inflammation, subacute, multifocal Mediastinal, pigmentation, hemosiderin,
Mesenteric, cyst
m.ultifoca1
multifocal
1 (2%) 1 (2%)
1 (2%) 1 (11%)
3 (6%)
Mesenteric, cyst, multiple Mesenteric, hemorrhage, multifocal Mesenteric, hyperplasia, lymphoid, multifocal Mesenteric, inflammation, chronic, multifocal Mesenteric, inflammation, granulomatous,
multifocal
1 (2%) 1 (2%) 1 (2%) 1 (2%)
1 (2%)
1 (11%)
1 ( 1 1 % )
1 (2%)
Pancreatic, cyst Pancreatic, hemorrhage, multifocal
1 (2%) 2 (4%)
Spleen ' (50) Necrosis, subacute, diffuse 1 (2%)Capsule, cyst, multiple Lymphoid follicle, necrosis, acute, multifocal Red pulp, fibrosis, chronic, focal Red pulp, fibrosis, chronic, multifocal 1 (2%) Red pulp, fibrosis, focal 2 (4%) Red pulp, fibrosis, multifocal 3 (6%)Red pulp, hematopoietic cell proliferation,
multifocal 2 (4%) Red pulp, pigmentation, hemosiderin, multifocal 1 (2%)
Depletion lymphoid, multifocal 30 (77%)Artery, mediastinum, inflammation,
Thymus (391 (1)
(14)
1 (7%)
1 (7%) 1 (7%) 1 (7%) 1 (7%)
(50)
1 (2%)
1 (2%)
5 (10%) 2 (4%)
33 (77%) ( 4 3 )
proliferative, chronic, multifocal Epithelial cell, hyperplasia, multifocal
1 (3%) 1 (100%)
:!;&Dichlorophenol, XTP TR 353 88

TABLE A5. SUMMARY O F T H E INCIDENCE O F NOYNEOPLASTIC LESIONS I N MALE RATS IN THE TWO-YEAR F E E D STUDY OF 2.4-DICHLOROPHENOL (Continued)
Unt rea ted Control Low Dose High Dose
INTEGUMENTARY SYSTEM Mammary gland (25)
Acinus, hyperplasia, cystic, multifocal 19 Acinus, hyperplasia, multifocal 1
Skin (49) Abdominal, inflammation, suppurative, chronic,
Abdominal, subcutaneous tissue, edema, subacute,
Inguinal, abscess Inguinal, ulcer, chronic active, focal Inguinal, subcutaneous tissue, inflammation,
Tail, hyperkeratosis, multifocal 1
focal
multifocal
1
chronic active, multifocal
Thciracic, subcutaneous tissue, hemorrhage, chronic active, diffuse
(76%) (4%)
(2%)
(2%)
(4)
(12)
1 (8%)
(22) 12 (55%) 2 (9%)
(50)
1 (2%)
1 (2%) 1 (2%)
1 (2%)
MUSCULOSKELETAL SYSTEM Bone
Femur, osteopetrosis, multifocal (49)
3 (6%) (48)
1 (2%)
NERVOC'S SYSTEM Brain (50)
Cerebellum, hemorrhage, acute, multifocal 1
Cerebrum, hemorrhage, acute, multifocal 1 Cerebrum, hemorrhage, focal 1
Cerebellum, cerebrum, hemorrhage, multifocal
Medulla, cerebrum, hemorrhage, acute, multifocal Third ventricle, hemorrhage, focal
(2%)
(2%) (2%)
(1)
1 (100%)
(50)
1 (2%) 1 (2%)
RESPIRA.TORY SYSTEM Lung (50)
Congestion, acute, diffuse Inflammation, granulomatous, multifocal 1 Alveolar epithelium, hyperplasia, multifocal 2 Bronchiole, epithelium, hyperplasia, multifocal 1 Interstitium, inflammation, acute, focal Interstitium, inflammation, chronic, focal Interstitium, inflammation, chronic, multifocal 6 Interstitium, inflammation, subacute, multifocal Interstitium, metaplasia, osseous, focal 1 Interstitium, mineralization, multifocal 1 Mediastinum, inflammation, granulomatous,
Nose (45) multifocal
Degeneration, multifocal Nasolacrimal duct, inflammation, chronic,
multifocal 1 Nasolacrimal duct, inflammation, multifocal 1 Nasolacrimal duct, inflammation, subacute, focal 4 Nasolacrimal duct, inflammation, subacute,
multifocal 20 Respiratory epithelium, degeneration,
multifocal 25 Respiratory epithelium, inflammation, chronic,
focal 1 Respiratory epithelium, inflammation, subacute,
multifocal 2 Respiratory epithelium, metaplasia, squamous,
multifocal 2
(2%) (4%) (2%)
(12%)
(2%) (2%)
(2%) ( 2 % ) (9%)
(44%)
(56%)
(2%)
(4%)
(4%)
(3)
1 (33%)
1 (33%)
(48)
1 (2%)
19 (40%)
38 (79%)
(50)1 1
1 (46)
1
6
11
42
(2%) (2%)
(4%)
(2%)(2%)
(2%)
(2%)
(13%)
(24%)
(91%)
89 2,PDichlorophenol, NTP TR 353

TABLE A5. SUMMARY OF THE INCIDENCE OF NONNEOPLASTIC LESIONS IN MALE RATS IN THE TWO-YEAR FEED STUDY OF 2,4-DICHLOROPHENOL (Continued)
_ _ _ ~ ~~~~ ____
Untrea ted Control Low Dose High Dose
RESPIRATORY SYSTEM Nose (Continued)
Suhmucosa, olfactory epithelium, inflammation, subacute, multifocal
Submucosa, respiratory epithelium, concretion, multifocal
Submucosa, respiratory epithelium, inflammation, acute, focal
Submucosa, respiratory epithelium, inflammation, acute, multifocal
Submucosa, respiratory epithelium, inflammation, chronic, multifocal
Submucosa, respiratory epithelium, inflammation, multifocal
Submucosa, respiratory epithelium, inflammation, subacute, focal
Submucosa, respiratory epithelium, inflammation, subacute, multifocal
Submucosa, respiratory epithelium, inflammation, suppurative, chronic, multifocal
inflammation, suppurative, multifocal Submucosa, respiratory epithelium,
(45)
1 (2%)
1 (2%)
4 (9%)
1 (2%)
19 (42%)
2 (4%)
(48)
1 (2%)
3 (6%)
2 (4%)
23 (48%)
(46)
1 (2%)
1 (2%)
1 (2%)
22 (48%)
1 (2%)
1 (2%)
SPECIAL, SENSES SYSTEM Eye
Cornea, inflammation, subacute, multifocal Lens, cataract Lens, cataract, multifocal Retina, atrophy, multifocal
Hyperplasia, glandular, focal Harderian gland
(4) 1 (25%)
2 (50%) 3 (75%)
(43)
(4)
2 (50%) 2 (50%)
(2)
1 (50%)
1 (50%) (36)
1 (3%) Hyperplasia, glandular, multifocal Inflammation, granulomatous, multifocal
1 (2%) 1 (3%)
Inflammation, subacute, multifocal 3 (8%) ---URINARY SYSTEM
Kidney Congestion, multifocal
(50) (8) 1 (13%)
(49)
CpjtCyljt, multiple 1 (2%)
1 (13%)
Polycystic kidney Bilateral, nephropathy, chronic, multifocal 49 (98%)
1 (13%)6 (75%) 48 (98%)
Bilateral, cortex, cyst, multiple Bilateral, cortex, mineralization, multifocal
1 (13%) 1 (13%)
Bilateral, pelvis, hydronephrosis, multifocal Cortex, cyst
Cortex, cyst, single Cortex, cyst, multiple
3 (6%)
4 (8%) 2 (4%)
1 (13%) 1 (13%)
Left, nephropathy, chronic, multifocal Papilla, epithelium, hyperplasia, multifocal
1 (2%) 1 (2%)
Renal tubule, pigmentation, multifocal 1 (2%) Right, cyst
Inflammation, hemorrhagic, acute, multifocal
Muscularis, inflammation, chronic active,
Urinary bladder
Mucosa, hyperplasia, multifocal
(48)
1 (2%)
1 (13%)
1 (50%) (2)
1 (50%)
(50)
1 (2%)
multifocal 1 (50%)
2,L4-Dichlorophenol,NTP TR 353 90
APPENDIX B
SUMMARY OF LESIONS IN FEMALE RATS IN
THE TWO-YEAR FEED STUDY OF
2,4-DICHLOROPHENOL
PAGE
TABLE B1 SUMMARY OF THE INCIDENCE OF NEOPLASMS IN FEMALE RATS IN THE TWO- YEAR FEED STUDY OF 2,4:-DICHLOROPHENOL 93
TABLE El2 INDIVIDUAL ANIMAL TCMOR PATHOLOGY OF FEMALE RATS IN THE TWO-YEAR FEED STUDY OF 2,4-DICHLOROPHENOL 96
TABLE EL3 ANALYSIS OF PRIMARY TUMORS IN FEMALE RATS IN THE TWO-YEAR FEED STUDY OF 2,4-DICHLOROPHENOL 106
TABLE E14 SUMMARY OF THE INCIDENCE OF NONNEOPLASTIC LESIONS IN FEMALE RATS IN THE TWO-YEAR FEED STUDY OF 2.4.DICHLOROPHENOL 109
91 2,4-Dichlorophenol, NTP TR 353

i!;i-Dichlorophenol, NTP TR 353 92

TABLE B1. SUMMARY OF THE INCIDENCE OF NEOPLASMS IN FEMALE RATS IN THE TWO-YEAR FEED STUDY OF 2,4-DICHLOROPHENOL
I_--
Untrea ted Control
Animals irlitially in study 50 Animals removed 50 Animals examined histopathologically 50
__-
ALIMENTARY SYSTEM Intestine large
Colon, Peyer’s patch, leukemia mononuclear Lamina propria, rectum, leukemia mononuclear
Intestine small Jejunum, Peyer’s patch, leukemia mononuclear Muscularis,jejunum. leiomyoma
Liver Leukemia mononuclear Neoplastic nodule
E’a ncr e as Leukemia mononuclear
Pharynx Pakite, papilloma squamous
Salivary glands Leukemia mononuclear
Stomach Leukern18 mononuclear Glandular, leukemia mononuclear
(48) 1 (2%) 1 (2%)
(48) 2 (4%) 1 (2%)
(50) 11 (22%)
(50) 1 (2%)
*(50)
(50) 1 (2%)
(49) 1 (2%)
Glandular, lamina propria, leukemia mononuclear 1 (2%) Tongut1
Mucosa, papilloma squamous
CARDIOVASCULAR SYSTEM Heart
Leukemia mononuclear
ENDOCRINE SYSTEM Adrenal gland
Bilrtteral, cortex, leukemia mononuclear Bilateral, medulla, leukemia mononuclear Bilateral, medulla, pheochromocytoma benign Cortex, adenoma Cortex, carcinoma Medulla, leukemia mononuclear Medulla, pheochromocytoma benign Medulla, pheochromocytoma benign, multiple
Islets, pancreatic Adenoma
Pituitary gland Leukemia mononuclear Pars distalis, adenoma Pars distalis, adenoma, multiple Pars distalis, carcinoma Pars distalis, leukemia mononuclear Pars intermedia, adenoma
Thyro1.d gland Leukemia mononuclear Bilateral, C-cell, adenoma C-cell, adenoma C-cell, adenoma, multiple C-cell, carcinoma
*(50)
(50)5 (10%)
(50)
2 (4%) 1 (2%)
1 (2%)4 (8%)
(50) 1 (2%)
(50)
29 (58%) 1 (2%) 2 (4%)
(50) 1 (2%)
8 (16%) 1 (2%) 3 ( 6 % )
Low Dose
50 50 50
*(50)
*(50)
*(50) 4 ( 8 % ) 1 (2%)
(48)
*(50)
*(50)
*(50)
*(50)1 (2%)
*(50)
(49) 1 (2%) 2 (4%)
1 (2%)
3 (6%)
*(50)
(32)
24 (75%)
1 (3%) 1 (3%)
*(50)
High Dose
50 50 50
(49)
(49)1 (2%)
(50) 11 (22%)
(49) 1 (2%)
*(50) 1 (2%)
(50) 1 (2%)
( 5 0 )
1 (2%)
*(50)
(50) 3 (6%)
(49)
1 (2%) 1 (2%) 1 (2%)
1 (2%) 1 (2%)
(49)
(48) 1 (2%)
22 (46%) 1 (2%) 5 (10%)
1 (2%) (49)
1 (2%) 1 (2%) 6 (12%)
3 (6%)
93 2,CDichlorophenol, NTP TR 353

TABLE ES1. SUMMARY OF THE INCIDENCE OF NEOPLASMS IN FEMALE RATS IN THE TWO-YEAR FEED STUDY OF 2,4-DICHLOROPHENOL (Continued)
-_ Untrea ted Control Low Dose High Dose
GENERAL BODY SYSTEM None
GENITAL SYSTEM Clitoral gland
Adenoma Leukemia mononuclear
Leukemia mononuclear
Adenoma Leukemia mononuclear Polyp stromal Sarcoma Bilateral, polyp stromal Cervix, sarcoma stromal Endometrium, deciduoma, NOS
Ovary
Uterus
(38)5 (13%) 1 (3%)
2 (4%)
1 (2%) 1 (2%)
1 1 (22%)
(50)
(50)
1 (2%)1 (2%) 1 (2%)
"(50) 2 (4%)
6 (12%)1 (2%)
(40) 3 (8%)
1 (2%) 10 (20%)
1 (2%)
HEMATOPOIETIC SYSTEM
Leukemia mononuclear
Leukemia mononuclear
Carcinoma, metastatic, skin Leukemia mononuclear Axillary, leukemia mononuclear Deep cervical, leukemia mononuclear Mandibular, leukemia mononuclear Mediastinal, leukemia mononuclear Mesenteric, leukemia mononuclear Pancreatic, leukemia mononuclear Renal, leukemia mononuclear
Leukemia mononuclear
Carcinoma, metastatic, skin Leukemia mononuclear
Blood
Bone marrow
Lymph node
Spleen
Thymus
1 1 10 9 3 1 1
(50)11
(39)
4
(83%)
(10%)
(2%) (2%)(21%)(19%) (6%) (2%)(2%)
(22%)
(10%)
1
2
1
(2%)
(4%)
(2%)
(15%)
( 8 )
(49)
(50)
5 (63%)
2 (4%)
1 (2%)
8 (16%)3 (6%)1 (2%) 1 (2%)
(50)
(47) 1 1 (22%)
1 (2%) 1 (2%)
IYTEGUMENTARY SYSTEM
Adenocarcinoma Fibroadenoma Fibroadenoma, multiple Leukemia mononuclear
Basosquamous tumor benign Papilloma squamous Trichoepithelioma Subcutaneous tissue, carcinoma Subcutaneous tissue, fibroma Subcutaneous tissue, fibrosarcoma Thoracic, subcutaneous tissue, lipoma
Mammary gland
Skin
(46) 1 (2%) 8 (17%)1 (2%) 1 (2%)
(50)
1 (2%)
1 (2%)
*(50) 1 (2%) 7 (14%) 1 (2%)
1 (2%)
(46)
3 (7%) 1 (2%)
(50) 1 (2%)
1 (2%) 1 (2%) 2 (4%)
1 (2%)
MUSCULOSKELETAL SYSTEM
Lumbar, osteosarcoma Bone (49) (50)
1 (2%)
~~ ~ ~~
:!.a-Dichlorophenol, NTP TR 353 94

TABLE Bl. SUMMARY OF THE INCIDENCE OF NEOPLASMS IN FEMALE RATS IN THE TWO-YEARFEED STUDY OF 2,4-DICHLOROPHENOL (Continued)
Untreated Control Low Dose
SPECIAL SENSES SYSTEM
High Dose
NERVOUS SYSTEMBrain
Carcinoma, metastatic, pituitary glandLeukemia mononuclearCerebrum, granular cell tumor benignMedia, astrocytoma malignant
RESPIRATORY SYSTEMLung
Carcinoma, metastatic, skinCarcinoma, metastatic, thyroid glandLeukemia mononuclear
(50) *(50)1 (2%)1 (2%)
(50) *(50)
1 (2%)10 (20%)
(48)2111
(50)115
(4%)(2%)(2%)(2%)
(2%)(2%)(10%)
Zymbal glandCarcinoma
URINARY SYSTEMKidney
Leukemia mononuclearRenal tubule, adenoma
Urinary bladderLeukemia mononuclearTransitional epithelium, papilloma
SYSTEMIC LESIONSMultiple organs
Leukemia mononuclear
ANIMAL DISPOSITIONSUMMARYAnimals initially in studyTerminal sacrificeMoribundDead
TUMOR SUMMARYTotal animals with primary neoplasms **
Total primary neoplasmsTotal animals with benign neoplasms
Total benign neoplasmsTotal animals with malignant neoplasms
Total malignant neoplasmsTotal animals with secondary neoplasms***
Total secondary neoplasmsTotal animals with neoplasms
uncertain benign or malignantTotal uncertain neoplasms
*(50)
(50)2 (4%)1 (2%)
(50)1 (2%)
*(50)11 (22%)
5034142
47954375171922
11
*(50)1 (2%)
*(50)
*(50)
*(50)7 (14%)
504334
365833461212
*(50)
(49)1 (2%)
(48)
1 (2%)
*(50)11 (22%)
504082
448337612022
46
* Number of animals receiving complete necropsy examinations, all gross lesions including masses examined microscopically.** Primary tumors, all tumors except secondary tumors***Secondary tumors, metastatic tumors or tumors invasive into an adjacent organ
95 2,4-Dichlorophenol, NTP TR 353

TABLE B2. INDIVIDUAL ANIMAL TUMOR PATHOLOGY OF FEMALE RATS IN THE TWO-YEAR FEEDSTUDY OF 2,4-DICHLOROPHENOL: UNTREATED CONTROL
WEEKS ONSTUDY
CARCASSID
ALIMENTARY SYSTEMEsophagusIntestine large
Colon, Payer's patch, leukemiamononuclear
Lamina propna, rectum, leukemiamononuclear
Intestine smallJejunum, Peyer's patch, leukemia
mononuclearMusculans, jejunum, ieiomyoma
LiverLeukemia mononuclear
MesenteryPancreas
Leukemia mononuclearSalivary glands
Leukemia mononuclearStomach
Leukemia mononuclearGlandular, lamina propna, leukemia
mononuclear
CARDIOVASCULAR SYSTEMHeart
Leukemia mononuclear
ENDOCRINE SYSTEMAdrenal gland
Bilateral, medulla, leukemiamononuclear
Bilateral, medulla, pheochromocytomabenign
Medulla, leukemia mononuclearMedulla, pheochromocytoma benign
Islets, pancreaticAdenoma
Parathyroid glandPituitary gland
Pars distahs, adenomaPars distahs, adenoma, multiplePars distalis, carcinoma
Thyroid glandLeukemia mononuclearC cell, adenomaC cell, adenoma, multipleC-cell, carcinoma
GENERAL BODY SYSTEMTissue, NOS
0 0 0 0 0 0 0 0 0 0 0 14 6 8 8 8 9 9 9 9 9 9 02 2 0 3 8 1 5 9 9 9 9 0
1 1 1 1 1 1 1 1 1 1 2 19 6 7 9 2 6 5 8 8 9 0 33 1 2 1 3 3 2 2 1 4 4 3
+ + + + + + f , f + + +
X
X
X
X X X+ -t
X
X
+ + + + + + + + + + + f
X
x x x x x x x x
X
X
+
1 1 1 1 1 1 L 1 1 1 1 1 10 0 0 0 0 0 0 0 0 0 0 0 01 2 2 4 5 5 5 5 5 5 5 5 5
1 1 1 2 1 1 1 1 1 1 1 1 15 4 4 0 1 1 1 1 1 2 2 2 24 3 5 5 1 2 3 4 5 1 2 4 5
+ M + f + + + + + + -t + +
X
X X X X X
+ + + + + + + + + + + + +X X X
+ + 1. + ^ + + + + + + + +X X
X
X X X X X X
X XX
-( Tissue examined microscopicallyNot examined
Present but not examined microscopicallyI Insufficient tissue
M MissingA Autolysis precludes examinationX Incidence of listed morphology
2,4-Dichlorophenol, NTPTR353 96
"
-
-
—
-
-

TABLE B2. INDIVIDUAL ANIMAL TUMOR PATHOLOGY OF FEMALE RATS: UNTREATED CONTROL(Continued)
WEEKS ONSTUDY
CARCASSID
ALIMENTARY SYSTEMEsophagusIntpst ine large
Colon, Payer's patch, leukemiamononuclear
Lamina propna, rectum, leukemiamononuclear
Intestine smallJejunum, Peyer's patch, leukemia
mononuclearMusculans, jejunum, leiomyoma
LiverLeukemia mononuclear
MesenteryPancreas
Leukemia mononuclearSalivary glands
Leukemia mononuclearStomach
Leukemia mononuclearGlandular, lamina propna, leukemia
mononuclear
CARDIOVASCULAR SYSTEMHeart
Leukemia mononuclear
ENDOCRINE SYSTEMAdrenal gland
Bilateral, medulla, leukemiamononuclear
Bilateral, medulla, pheochromocytomabenign
Medulla, leukemia mononuclearMedulla, pheochromocytoma benign
Islets, pancreaticAdenoma
Parathyroid glandPituitary gland
Pars distalis, adenomaPars distalis, adenoma, multiplePars distalis, carcinoma
Thyroid glandLeukemia mononuclearC cell, adenomaC —cell, adenoma, multipleC-cell, carcinoma
GENERAL BODY SYSTEMTissue, NOS
l l l l l l l l l l l l l l l l l l l l L l l l l0 0 0 0 0 0 0 0 0 0 0 0 0 0 0 0 0 0 0 0 0 0 0 ( ) 1)
1 1 1 1 1 1 1 1 1 1 1 1 1 1 1 1 1 1 1 1 1 1 2 2 23 3 , ! 3 4 4 4 5 5 5 6 6 6 7 7 7 7 8 8 8 9 9 0 0 01 2 4 5 1 2 4 1 3 5 2 4 5 1 3 4 5 3 4 5 2 5 1 2 3
+ + + - • - - * - + f + 4 f + + -t + + + + 4 - - f + + + + +
X
+ + + + + + + + + + - t - 4 - - t + + + + + + - 4 + + + + -lX X X
X+ + + + + + + + + + + + + + + + + + + + + + + + +
X+ + + + + + + + + + + + + + + + + + + + + + + + +
X
X
+ + + + + 4 + + + + + + +f + + < + + + -l + + + +
X
X X X+ + 4 + f + + + + + + + f + + 4 + f + + f f + ^ +
X+ + + + + + h + + + t - M M M + + - + M + + + M + 4 - M
X X X X X X X X X X X X X X XX
X X
XX X X X X
X X
TOTALTISSUESTUMORS
4948
1
148
21
50112
501
501
491
1
505
50
2
114
501
365029
12
501813
I
97 2,4-Dichlorophenol, NTP TR 353
- i - - -
- - -
—
-
-
-
-
-
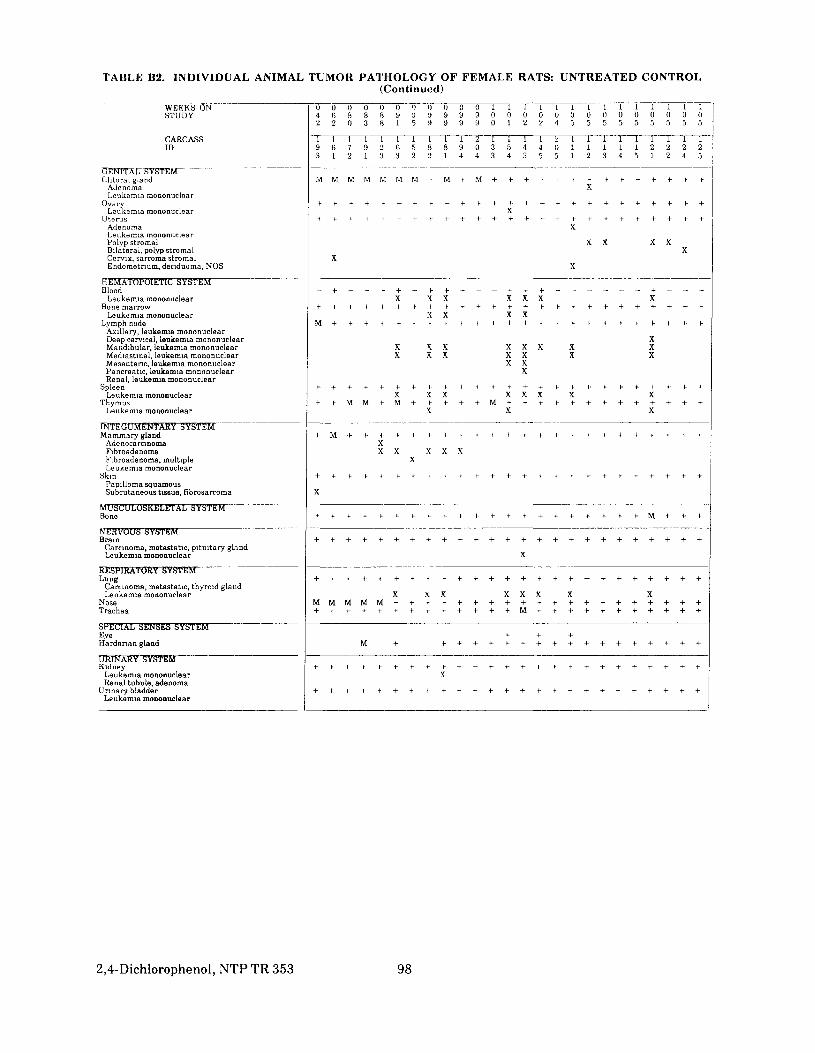
TABLE B2. INDIVIDUAL ANIMAL TUMOR PATHOLOGY OF FEMALE RATS: UNTREATED CONTROL(Continued)
WEEKS ONSTUDY
CARCASSID
GENITAL SYSTEMChtoral gland
AdenomaLeukemia mononuclear
OvaryLeukemia mononuclear
UterusAdenomaLeukemia mononuclearPolyp stromalBilateral, polyp stromalCervix, sarcoma stromalEndometnum, deciduoma, NOS
HEMATOP01ETIC SYSTEMBlood
Leukemia mononuclearBone marrow
Leukemia mononuclearLymph node
Axillary, leukemia mononuclearDeep cervical, leukemia mononuclearMandibular, leukemia mononuclearMediastinal, leukemia mononuclearMesentenc, leukemia mononuclearPancreatic, leukemia mononuclearRenal, leukemia mononuclear
SpleenLeukemia mononuclear
ThymusLeukemia mononuclear
INTEGUMENTARY SYSTEMMammary gland
AdenocarcinomaFibroadenomaFibroadenoma, multipleLeukemia mononuclear
SkinPapilloma squamousSubcutaneous tissue, fibrosarcoma
MUSCULOSKELETAL SYSTEMBone
NERVOUS SYSTEMBrain
Carcinoma, metastatic, pituitary glandLeukemia mononuclear
RESPIRATORY SYSTEMLang
Carcinoma, metastatic, thyroid glandLeukemia mononuclear
NoseTrachea
SPECIAL SENSES SYSTEMEyeHardenan gland
URINARY SYSTEMKidney
Leukemia mononuclearRenal tubule, adenoma
Unnarv bladderLeukemia mononuclear
0 0 0 0 0 0 0 0 0 0 0 1 1 1 1 1 1 1 1 1 1 14 6 8 8 8 9 9 9 9 9 9 0 0 0 0 0 0 0 0 0 0 02 2 0 3 8 1 5 9 9 9 9 0 1 2 2 4 5 5 5 5 5 5
1 1 1 1 1 1 1 1 1 1 2 1 1 1 1 <i 1 1 1 1 1 19 6 7 9 2 6 5 8 8 9 0 3 5 4 4 0 1 1 1 1 1 23 1 2 1 3 3 2 2 1 4 4 3 4 3 5 5 1 2 3 4 5 1
X
X
X
X X X
XX
-t + f + + + + +X X X X X X X
+ + + + + + + t- + + + + + + + + + + + + + -t-X X X X
XX X X X X X X XX X X X X X X
X XX
X X X X X X X X+ + M M + M + <- + + +}A+ + + + + + + + + +
X X X
XX X X X X
X
X
1 1 10 0 05 5 5
1 1 12 2 22 4 5
XX
-f- -1- -t-
-t- + -t-
+ + +
+ + + + + + + * + + + + . + + + + + + + + M + H .
X
X X X X X X X X
+ + +
-t + +•M + + + + + + + + + + + + + + + + + +
X
2,4-Dichlorophenol, NTP TR 353 98
-
-
--

TABLE B2. INDIVIDUAL ANIMAL TUMOR PATHOLOGY OF FEMALE RATS: UNTREATED CONTROL(Continued)
WEEKS ONSTUDY
CARCASSID
GENITAL SYSTEMChtoral gland
AdenomaLeukemia mononuclear
OvaryLeukemia mononuclear
UterusAdenomaLeukemia mononuclearPolyp stromalBilateral, polyp stromalCervix, sarcoma stromalEndometnum, deciduoma, NOS
FTEMATOPOIETIC SYSTEMBlood
Leukemia mononuclearBone marrow
Leukemia mononuciearLymph node
Axillary, leukemia mononuclearDeep cervical, leukemia mononuclearMandibular, leukemia mononuclearMediastmal, leukemia mononuclearMesentenc, leukemia mononuclearPancreatic, leukemia mononuclaarRenal, leukemia mononuclear
SpleenLeukemia mononuclear
ThymusLeukemia mononuclear
INTEGUMENTARY SYSTEMMammary gland
AdenocarunomaFibroadenomaFibroadenoma, multipleLeukemia mononuclear
SkinPapilloma sauamousSubcutaneous tissue, fibrosarcoma
MUSCULOSKELETAL SYSTEMBone
NERVOUS SYSTEMBrain
Carcinoma, metastatic, pituitary glandLeukemia mononuclear
RESPIRATORY SYSTEMLung
Carcinoma, metastatic, thyroid glandLeukemia mononuclear
NoseTrachea
SPECIAL SENSES SYSTEMEyeHardenan gland
URINARY SYSTEMKidney
Leukemia mononuclearRenal tubule, adpnoma
Unnary bladderLeukemia mononuclear
l l l l l l l l l l l l l l l l l l l l l l l l l0 0 0 0 0 0 0 0 0 0 0 0 0 0 0 0 0 0 0 0 0 0 0 0 05 5 5 5 5 5 5 5 5 5 5 5 5 5 5 5 5 5 5 5 5 5 5 5 5
1 1 1 1 1 1 1 1 1 1 1 1 1 1 1 1 1 1 1 1 1 1 2 2 23 3 3 3 4 4 4 5 5 5 6 6 6 7 7 7 7 8 8 8 9 9 0 0 01 2 4 5 1 2 4 1 3 5 2 4 5 1 3 4 5 3 4 5 2 5 1 2 3
-f + + M + + + t f + f - 4 - t - + - - t - i - f f + f + t - M +X X X X
K
X
XX X X X X X X
+ + + +X X X
X
X
X XX X
X
X
X X X
X
X X X
X
X
+ + + + + + + + + + + + + + + + + + + + + + + + ++ + + + + + + + + + + + + + + + + + + + + + + + +
X
XX X
4
XX
X
TOTALTISSUESTUMORS
3851
502
5011
11111
1210505
4811
109311
501139
4
461811
5011
49
5011
50I
104549
440
5021
501
99 2,4-Dichlorophenol, NTPTR353
-
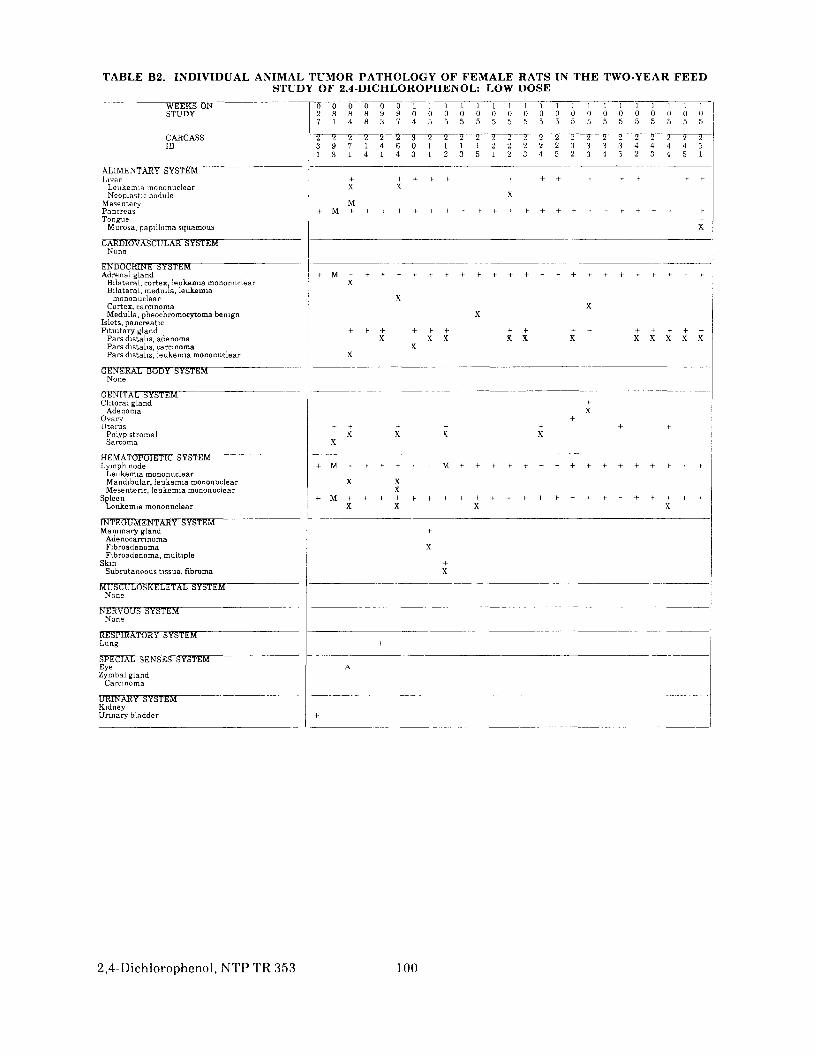
TABLE B2. INDIVIDUAL ANIMAL TUMOR PATHOLOGY OF FEMALE RATS IN THE TWO-YEAR FEEDSTUDY OF 2,4-DICHLOROPHENOL: LOW DOSE
WEEKS ONSTUDY
CARCASSID
ALIMENTARY SYSTEMLiver
Leukemia mononuclearNeoplastic nodule
MesenteryPancreasTongue
Mucosa, papilloma squamous
CARDIOVASCULAR SYSTEMNone
ENDOCRINE SYSTEMAdrenal gland
Bilateral, cortex, leukemia mononuclearBilateral, medu l l a , leukemia
mononuclearCortex, carcinomaMedulla, pheochromocytoma benign
Islets, pancreaticPituitary gland
Pars distahs, adenomaPars distahs, carcinomaPars distahs, leukemia mononuclear
GENERAL BODY SYSTEMNone
GENITAL SYSTEMChtoral gland
AdenomaOvaryUterus
Polyp stromalSarcoma
HEMATOPOIETIC SYSTEMLymph node
Leukemia mononuclearMandlbular, leukemia mononuclearMesentenc, leukemia mononuclear
SpleenLeukemia mononuclear
INTEGUMENTARY SYSTEMMammary gland
AdenocarcinomaFibroadenomaFibroadenoma, multiple
SkinSubcutaneous tissue, fibroma
MUSCULOSKELETAL SYSTEMNone
NERVOUS SYSTEMNone
RESPIRATORY SYSTEMLung
SPECIAL SENSES SYSTEMEyeZymbal gland
Carcinoma
URINARY SYSTEMKidneyUrinary bladder
0 0 0 0 0 0 1 1 1 1 1 1 1 1 1 1 1 1 1 1 1 1 12 8 8 8 9 9 0 0 0 0 0 0 0 0 0 0 0 0 0 0 0 0 07 1 4 8 3 7 4 5 5 5 5 5 5 5 5 5 5 5 5 5 5 5 5
2 2 2 2 2 2 3 2 2 2 2 2 2 2 2 2 2 2 2 2 2 2 23 9 7 1 4 6 0 1 1 1 1 2 2 2 2 2 3 3 3 3 4 4 41 3 1 4 1 4 3 1 2 3 5 1 2 3 4 5 2 3 4 5 2 3 4
.
+ f + f + + + + + - f fX X
XM
+ M f + + + + ^ + + + + + + + + + + + ^ + + +
1 10 05 5
2 T~4 55 1
+ {
+f
X
X
XX
X
+ f + + f + ++ H - + + + fX X X X X X X X X
XX
fX
++ + + + -t + +
X X K XX
+ M + + . f + + T M + + + + f + + + + + + + + +
X XX
X X X X
^X
fX
+ .
A
+ +X X
+
2,4-Dichlorophenol, NTP TR 353 100
- —
-
-
-
-
-——— -— — —————

TABLE B2. INDIVIDUAL ANIMAL TUMOR PATHOLOGY OF FEMALE RATS: LOW DOSE(Continued)
WEEKS ONbTUDY
CARCASSID
ALIMENTARY SYSTEMLi\ ei
Leukemia mononur lea rNeoplastic nodule
MesenteryPancreasTongue
Murosa, papilloma squamous
CARDIOVASCULAR SYSTEMNone
ENDOCRINE SYSTEMAdrenal gland
Bilateral, cortex, leukemia mononuclearBilateral, medulla, leukemia
mononuclearCortex, carcinomaMedulla, pheochromocytoma benign
Islets, pancreaticPituitary gland
Pars distahs, adenomaPars distahs, carcinomaPars distahs, leukemia mononuclear
GENERAL BODY SYSTEMNone
GENITAL SYSTEMChloral gland
AdenomaOvaryUterus
Polyp stromalSarcoma
HEMATOPOIETIC SYSTEMLymph node
Leukemia mononuclearMandibular, leukemia mononuclearMesentenc, leukemia mononuclear
SpleenLeukemia mononuclear
INTEGUMENTARY SYSTEMMammary gland
Ade noca rcino maFibroadenomaFibroadenoma, multiple
SkinSubcutaneous tissue, fibroma
MUSCULOSKELETAL SYSTEMNone
NERVOUS SYSTEMNone
RESPIRATORY SYSTEMLung
SPECIAL SENSES SYSTEMEyeZymbal gland
Carrmoma
URINARY SYSTEMKidnevUnnary bladder
1 1 1 1 1 1 I 1 1 1 1 1 1 I I 1 1 1 1 1 1 L 1 1 I0 0 0 0 0 0 0 0 0 0 0 I) 0 0 (1 0 0 0 0 0 0 0 0 0 05 5 5 5 5 5 5 5 5 5 ) 5 5 5 5 5 5 5 5 5 5 5 5 5 5
> 2 2 '2 2 2 2 2 2 7 9 ? '> '-* lf * 2 2 2 1 1 3 i5 5 5 5 6 6 6 6 7 7 7 8 S S 8 8 •> 9 9 ) 0 0 0 02 3 4 5 1 2 5 5 2 ) 1 5 1 2 i ! 5 1 2 4 5 1 . 2 4 5
+ H f f t - +- f * - h fX X
X
X X+ -t
+ + + - 1 - + + + + + + + + + + + f +x x x x x x x x x x x x: x
+X
+ + + ++ + fX X
+ + + 1- + + + + + M f + + + + t + + + +- + + + + fX
X X X
+ + + + + + + fX
X X X X X XX
4
+-tX
+
TOTALTISSUESTUMORS
n41
4811
49i
2132
3224
11
225
106I
47121
487
917I21
1
111
1I
101 2,4-Dichlorophenol, NTP TR 353
( t '' - '' ' ' '
-
-
-
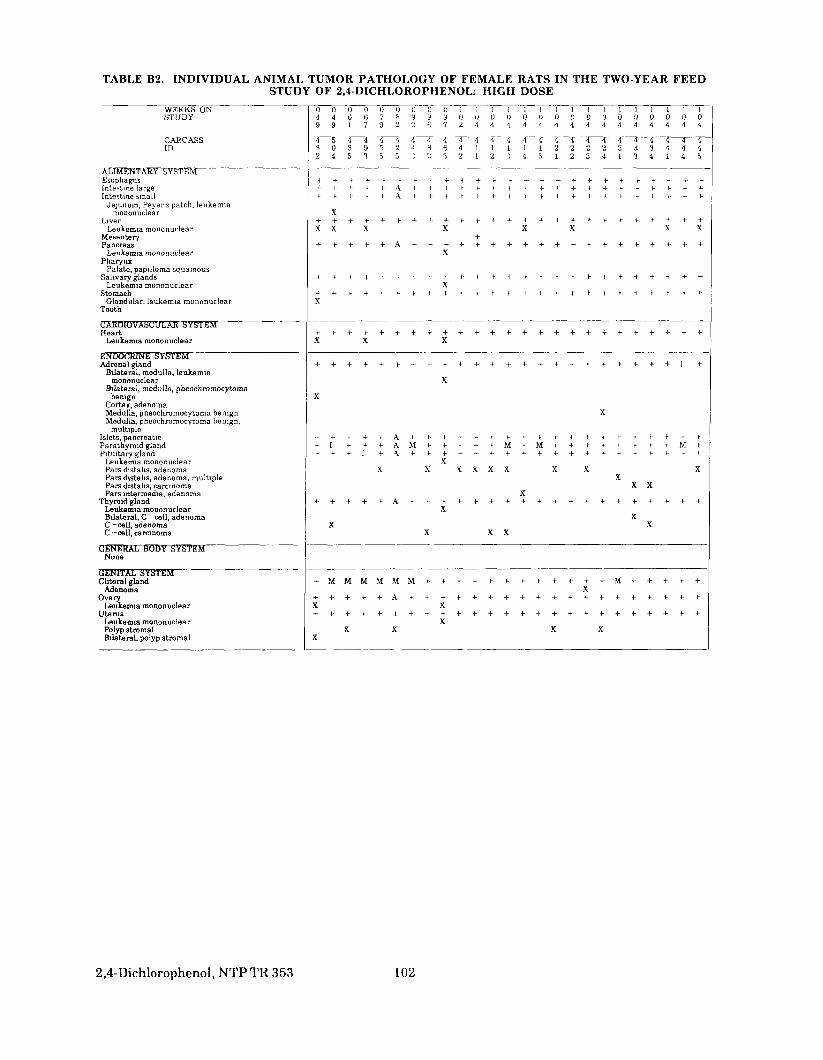
TABLE B2. INDIVIDUAL ANIMAL TUMOR PATHOLOGY OF FEMALE RATS IN THE TWO-YEAR FEEDSTUDY OF 2,4-DICHLOROPHENOL: HIGH DOSE
WEEKS ONSTUDY
CARCASSID
ALIMENTARY SYSTEMEsophagusIntestine largeIntestine iinall
Jejunum, Peyer's patch, leukemiamononuclear
LiverLeukemia mononurlear
MesenteryPancreas
Leukemia mononuclearPharynx
Palate, papilloma squamousSalivary glands
Leukemia mononuclearStomach
Glandular, leukemia mononuclearTooth
CARDIOVASCULAR SYSTEMHeart
Leukemia mononuclear
ENDOCRINE SYSTEMAdrenal gland
Bilateral, medulla, leukemiamononuclear
Bilateral, medulla, pheochromocytomabenign
Cortes, adenomaMedulla, pheochromocytoma benignMedulla, pheochromocytoma benign.
multipleIslets, pancreaticParathyroid glandPituitary gland
Leukemia mononuclearPars distalis, adenomaParsdistalis, adenoma, multiplePars distalis, carcinomaPars intermedia, adenoma
Thyroid glandLeukemia mononuclearBilateral, C-cell, adenomaC cell, adenomaC cell, carcinoma
GENERAL BODY SYSTEMNone
GENITAL SYSTEMChtoral gland
AdenomaOvary
Leukemia mononuclearUterus
Leukemia mononuclearPolyp stromalBilateral, polyp stromal
0 0 0 0 0 0 0 0 04 4 6 6 7 8 4 9 99 9 1 7 9 2 2 6 7
4 5 4 4 4 4 4 4 43 0 3 9 ri 2 4 8 62 4 5 1 5 5 1 2 5
X
X X X X
X
X
X
l l l l l l l l L L l l l l l l0 0 0 0 0 0 0 0 0 0 0 0 0 0 0 0
T 4 T~^ 4~~4 4 —3—4 4 ̂ 3 4 4 3 44 1 1 1 1 1 2 2 2 2 3 d 3 4 4 42 1 2 3 4 5 1 2 3 4 1 3 4 1 4 5
X X X X+
X X X
X
X
XX X
X
XX
X
X X X X X X XX
X XX
XX
X X
+ M M M M M M + +
+ -f- + -f -r- A f + +X X
XX X
X
+ + + + + + + + + 4 M + + + - , +X
X X
2,4-Dichlorophenol, NTP TR 353 102
— ~ — — —
—
-

TABLE B2. INDIVIDUAL ANIMAL TUMOR PATHOLOGY OF FEMALE RATS: HIGH DOSE(Continued)
WEEKS ONSTUDY
CARCASSID
ALIMENTARY SYSTEMEsophagnsIntestine laigeIntestine small
Jejunum, Payer's paten, leukemiamononuclear
LiverLeukemia mononuclear
MesenteryPancreas
Leukemia mononuclearPharynx
Palate, papilloma squamousSalivary glands
Leukemia mononuclearStomach
Glandular, leukemia mononuclearTooth
CARDIOVASCULAR SYSTEMHeart
Leukemia mononuclear
ENDOCRINE SYSTEMAdrenal gland
Bilateral, medulla, leukemiamononuclear
Bilateral, medulla, pheochromocytomabenign
Cortex, adenomaMedulla, pheochromocytoma benignMedulla, pheochromocytoma benign,
multipleIslets, pancreaticParathyroid glandPituitary gland
Leukemia mononuclearPars distahs, adenomaPars distahs, adenoma, multiplePars distahs, carcinomaPars intermedia, adenoma
Thyroid glandLeukemia mononuclearBilateral, C-cell, adenomaC —cell, adenomaC cell, carcinoma
GENERAL BODY SYSTEMNone
GENITAL SYSTEMChtoral gland
AdenomaOvary
Leukemia mononuclearUterus
Leukemia mononuclearPolyp stromalBilateral, polyp stromal
i l l l l l l l l l l L l l l L l l l l l l l l l0 0 0 0 0 0 0 0 0 0 0 0 0 0 0 0 0 0 0 0 0 0 0 0 0
4 4 4 4 4 4 4 4 4 4 4 1 4 4 4 4 4 4 4 4 4 5 $ 5 55 5 5 5 6 6 6 6 7 7 7 7 7 8 8 8 8 9 9 9 9 0 0 0 01 2 3 4 1 2 3 4 l 2 i 4 5 L i 4 5 l 2 4 5 1 2 3 5
f - f ^ r f - + + 4 - ^ + f - - h ^ l + + ^ f + + + f ) - - r - +
X X X+
+X
+
+ + + + + + + + + + + + + + + + + 4. + + + + + + +
+ + + + + + + + + + ^ + + + + + + + + + + + + + +
X
X
X X X X X X X X X X X X X
X X X
X X X X
+ f f + + M + + I + 1- + + + M + + + + + + + + -t- +X X
X X X X X X
TOTALTISSUESTUMORS
504949
15011
249
111
501
5011
503
49
1
I11
149.1948
122
151
491163
40i
492
301
101
103 2,4-Dichlorophenol, NTP TR 353
"
—
'
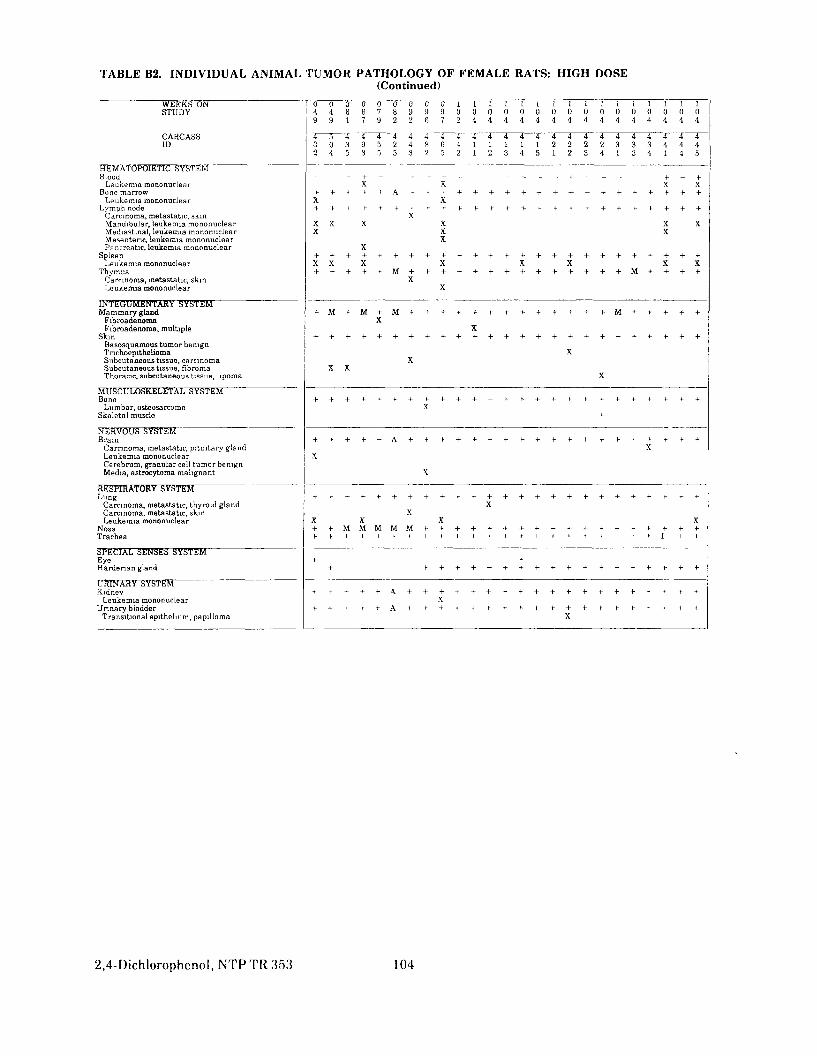
TABLE B2. INDIVIDUAL ANIMAL TUMOR PATHOLOGY OF FEMALE RATS: HIGH DOSE(Continued)
WEEKS ONSTUDY
CARCASSID
HEMATOPOIETIC SYSTEMBlood
Leukemia mononuclearBone marrow
Leukemia mononuclearLvmph node
Carcinoma, metastatic, skinMandibular, leukemia mononuclearMediastinal, leukemia mononuclearMesentenc, leukemia mononuclearPancreatic, leukemia mononuclear
SpleenLeukemia mononuclear
ThymusCarcinoma, metastatic, skinLeukemia mononuclear
INTEGUMENTARY SYSTEMMammary gland
FibroadenomaFibroadenoma, multiple
SkinBasosquamous tumor benignTnchoepitheliomaSubcutaneous tissue, carcinomaSubcutaneous tissue, fibromaThoracic, subcutaneous tissue, hpoma
MUSCULOSKELETAL SYSTEMBone
Lumbar, osteosarcomaSkeletal muscle
NERVOUS SYSTEMBrain
Carcinoma, metastatic, pituitary glandLeukemia mononuclearCerebrum, granular cell tumor benignMedia, astrocytoma malignant
RESPIRATORY SYSTEMLung
Carcinoma, metastatic, thyroid glandCarcinoma, metastatic, skinLeukemia mononuclear
NossTrachea
SPECIAL SENSES SYSTEMEyeHardenan gland
URINARY SYSTEMKidney
Leukemia mononuclearUnnary bladder
Transitional epithelium, papilloma
O O O O O O O O U 1 L 1 1 L 1 1 14 4 6 6 7 8 9 9 9 0 0 0 0 0 0 0 09 9 1 7 9 2 2 6 7 2 4 4 4 4 4 4 4
3 0 3 9 5 2 4 8 6 4 1 1 1 1 1 2 22 4 5 3 5 5 3 2 5 2 1 2 3 4 5 1 2
-1 + „ _ +X X
X X
XX X X XX X
XX
X X X X X X
XX
XX
XX
X X
X
X
X
XX
X X X+ + M M M M M 4 + + + + + + + + +
+ -t
+ l - 4 - 4 - f A 4 + + + + + + + + + +X
X
1 1 1 1 1 1 1 10 0 0 0 0 0 0 04 4 4 4 4 4 4 4
~4 4 4 4 4 4 4 4~2 2 3 3 3 4 4 43 4 1 3 4 1 4 5
+ +X X
X XX
X X
+ + M + + + + +
X
+
X
X
+ + + + +- I + +
2,4-Dichlorophenol, NTP TR 353 104
— — — — — — —
- — — - — — t- _ _ — — _ _ — - - - - —
-
-
-
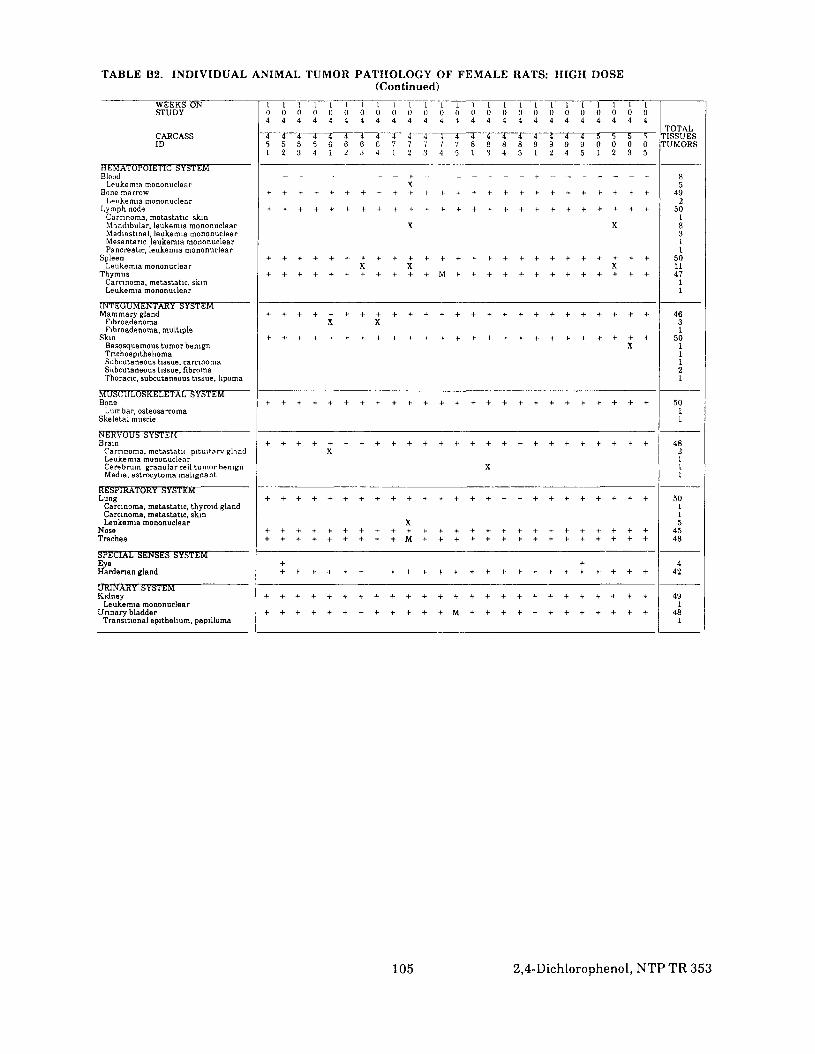
TABLE B2. INDIVIDUAL ANIMAL TUMOR PATHOLOGY OF FEMALE RATS: HIGH DOSE(Continued)
WEEKS ONSTUDY
CARCASSID
HEMATOPOIETIC SYSTEM
Leukemia mononuclearBone marrow
Leukemia mononuclearLymph node
Carcinoma, metastatlc skinM^ndibular, leukemia mononuclearMediastmal, leukemia mononuclearMesentenc leukemia mononuclearPancreatic, leukemia mononuclear
SpleenLeukemia mononuclear
ThvmusCarcinoma, metastatlc, skinLeukemia mononutlear
INTEGUMENTARY SYSTEMMammary gland
FibroadenomaFibroadenoma, multiple
SkinBasosquamous tumor benignTnchoepithehomaSubcutaneous tissue, carcinomaSubcutaneous tissue, fibromaThoracic, subcutaneous tissue, hpoma
MUSCULOSKELETAL SYSTEMBone
Lumbar, osteosarcomaSkeletal muscle
NERVOUS SYSTEMBrain
Carcinoma, metastatu pituitary glandLeukemia mononuclearCerebrum granular cell tumor benignMedia, astrocytoma malignant
RESPIRATORY SYSTEMLung
Carcinoma, metastatlc, thyroid glandCarcinoma, metastatlc, skinLeukemia mononuclear
NoseTrachea
SPECIAL SENSES SYSTEMEyeKardenan gland
URINARY SYSTEMKidney
Leukemia mononuclearUrinary bladder
Transitional epithelium, papilloma
1 1 1 1 1 1 1 1 I 10 0 0 0 0 0 0 0 0 0
4 4 4 4 4 4 4 4 4 45 5 5 5 6 6 6 6 7 71 2 3 4 I 2 j 4 1 2
f
X
X
X X
X X
+ + + + + + + + + +
X
X
+ + + + + + + + +M
1 1 1 I 1 I 1 1 1 1 1 1 1 I I0 0 0 0 0 0 0 0 0 0 0 0 0 0 0
7 7 7 8 8 8 8 9 9 9 9 0 0 0 03 4 5 1 3 4 5 1 2 4 5 1 2 3 5
+
X
X
X
+ + + + + + + + + + + + + + +
+ + + + + + + + + + + + + *- +
X
TOTALTISSUESTUMORS
85
492
501831I
50114711
4631
50I1121
5011
482I11
50115
4548
442
491
481
105 2,4-Dichlorophenol, NTP TR 353
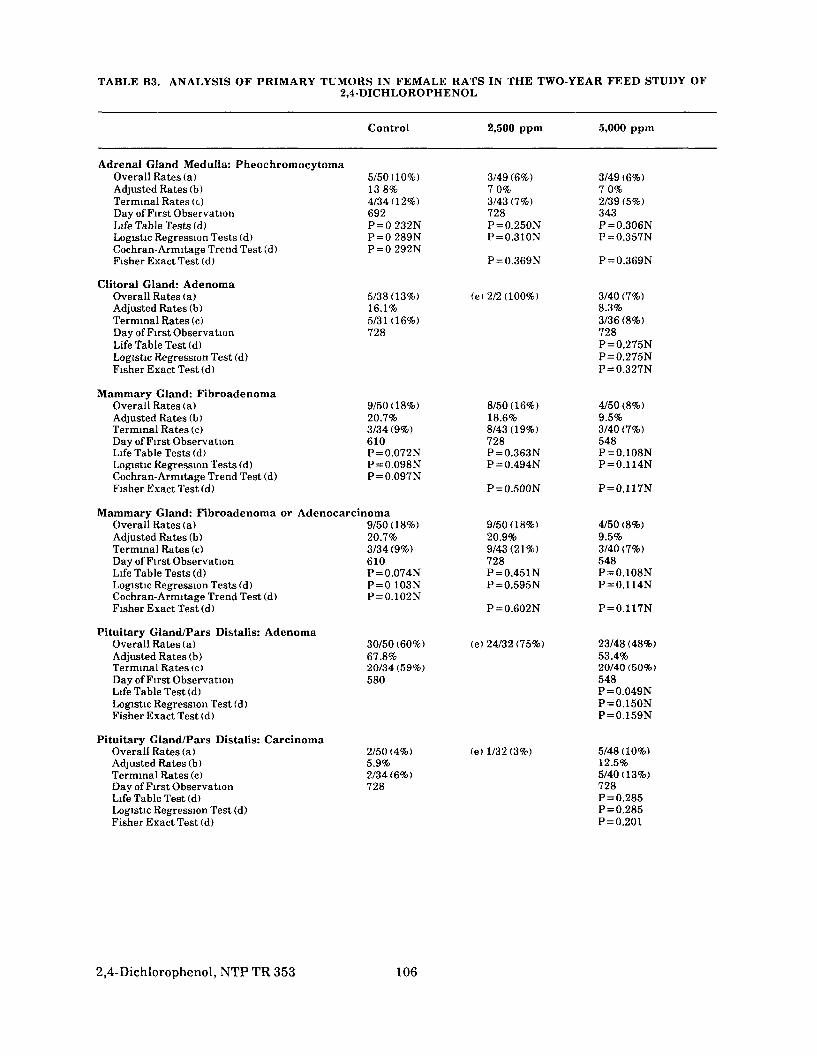
TABLE B3. ANALYSIS OF PRIMARY TUMORS IN FEMALE RATS IN THE TWO-YEAR FEED STUDY OF2,4-DICHLOROPHENOL
Control 2,500 ppm 5,000 ppm
Adrenal Gland Medulla: PheochromocytomaOverall Rates (a)Adjusted Rates (b)Terminal Rates (t)Day of First ObservationLife Table Tests (d)Logistic Regression Tests (d)Cochran-Armitage Trend Test (d)Fisher Exact Test (d)
Clitoral Gland: AdenomaOverall Rates (a)Adjusted Rates (b)Terminal Rates (c)Day of First ObservationLife Table Test (d)Logistic Regression Test (d)Fisher Exact Test (d)
Mammary Gland: FibroadenomaOverall Rates (a)Adjusted Rates (b)Terminal Rates (c)Day of First ObservationLife Table Tests (d)Logistic Regression Tests (d)Cochran-Armitage Trend Test (d)Fisher Exact Test (d)
5/50(10%)13 8%4/34(12%)692P 0232NP 0289NP 0292N
5/38(13%)16.1%5/31(16%)728
9/50(18%)20.7%3/34 (9%)610P 0.072NP 0.098NP 0.097N
3/49 (6%)70%3/43 (7%)728P 0.250NP 0.310N
P 0.369N
(e) 2/2 (100%)
8/50(16%)18.6%8/43(19%)728P 0.363NP 0.494N
P 0.500N
3/49 (6%)70%2/39 (5%)343P 0.306NP 0.357N
P 0.369N
3/40 (7%)8.3%3/36 (8%)728P 0.275NP 0.275NP 0.327N
4/50(8%)9.5%3/40 (7%)548P 0.108NP 0.114N
P 0.117N
Mammary Gland: Fibroadenoma or AdenocarcinomaOverall Rates (a)Adjusted Rates (b)Terminal Rates (c)Day of First ObservationLife Table Tests (d)Logistic Regression Tests (d)Cochran-Armitage Trend Test (d)Fisher Exact Test (d)
Pituitary Gland/Pars Distalis: AdenomaOverall Rates (a)Adjusted Rates (b)Terminal Rates (c)Day of First ObservationLife Table Test (d)Logistic Regression Test (d)Fisher Exact Test (d)
Pituitary Gland/Pars Distalis: CarcinomaOverall Rates (a)Adjusted Rates (b)Terminal Rates (c)Day of First ObservationLife Table Test (d)Logistic Regression Test (d)Fisher Exact Test (d)
9/50(18%)20.7%3/34 (9%)610P 0.074NP 0 103NP 0.102N
30/50(60%)67.8%20/34(59%)580
2/50(4%)5.9%2/34(6%)728
9/50(18%)20.9%9/43(21%)728P 0.451NP 0.595N
P 0.602N
(e) 24/32 (75%)
(e) 1/32(3%)
4/50 (8%)9.5%3/40 (7%)548P 0.108NP 0.114N
P 0.117N
23/48 (48%)53.4%20/40(50%)548P 0.049NP 0.150NP 0.159N
5/48(10%)12.5%5/40 (13%)728P 0.285P 0.285P 0.201
2,4-Dichlorophenol, NTP TR 353 106
= = =
= = =
= = =
= =
=
= =
=
= =
=
= =
=
= = =
= =
=
= =
=
= = =
= = =
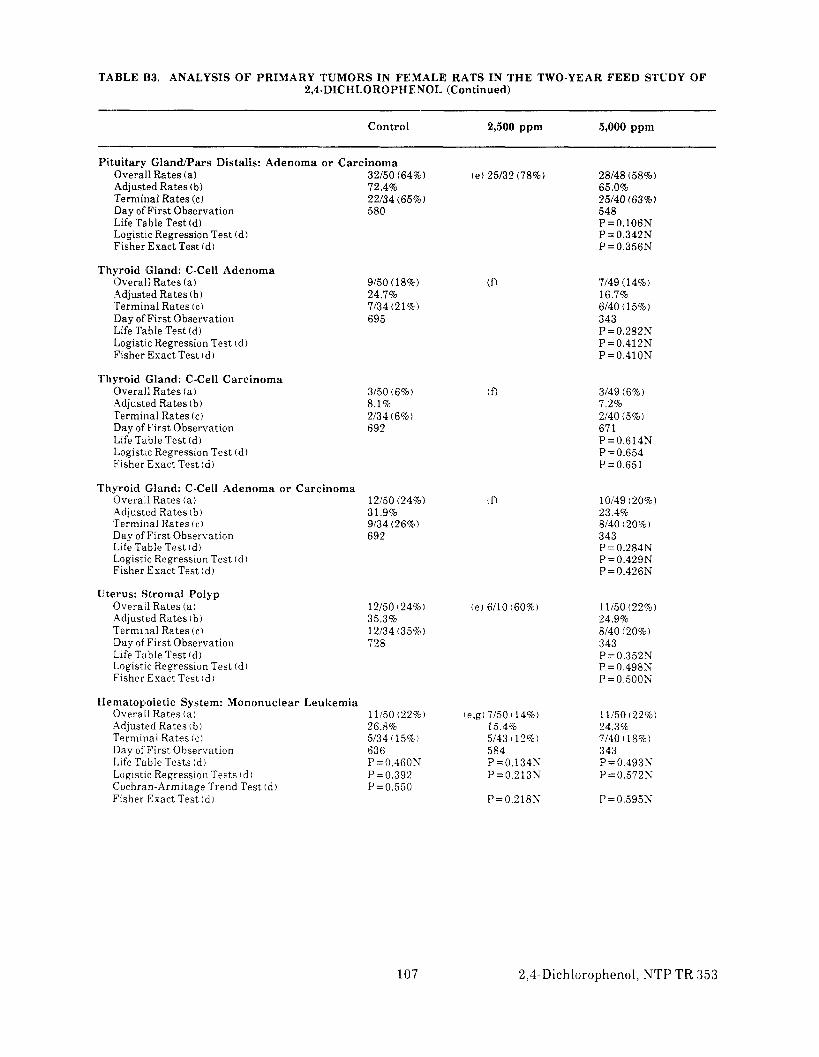
_____
TABLE 153. ANALYSIS OF PRIMARY TUMORS I N FEMALE R A T S IN T H E TWO-YEAR F E E D STUDY O F 2,4-DICHLOROPHENOL (Continued)
~ ~~ ~~ ~~
Control 2,500 p p m
Pi tui tary G l a n d p a r s Distalis: Adenoma o r C a r c i n o m a Overall Rates ( a ) 32/50 (64%) ( e )25/32 (78%) Adjusted Rates (b) 72.4% Terminal Rates (c) 22/34 (65%) Day of First Observation 580 Life Table Test (d) Logistic Regression Test (d) Fisher Exact Test (d)
Thyroid (Gland: C-ce l l Adenoma Overall Rates ( a ) 9/50 (18%) (f, .4djusted Rates (b) 24.7% Terminal Rates ( c ) 7/34 (21%) Day of First Observation 695 Life Ta.ble Test (dj Logistic Regression Test (d) Fisher Exact Test (d)
Thyroid Gland: C-cel l C a r c i n o m a Overall Rates ( a ) 3/50 (6%) (04djusted Rates (b) 8.1% 'Terminal Rates (c) 2/34 (6%) Day of First Observation 692 Life Talble Test (dj Logist:c Regression Test (d) Fisher Exact Test ( d )
Thyroid Gland: C-ce l l Adenoma o r Carc inoma Overa 1 Rates ( a ) 12/50 (24%) t f l Adjusted Rates 'bl 31 9% l?errninal Rates t c ) 9/34 (26%) Day of First Obsertation 692 Life Table Test (d ) Logistic Regression Test td) Fisher Exact Test (d)
Uterus: S t romal Polyp Overail Rates ( a ) 12/50 (24%) (e ) 6/10 (60%) Adjusted Rates ( b ) 35.3% Termiial Rates ( c ) 12/34(35%) Day of First Observation 728 Life Table Test (d ) Logistic Regression Test (d ) Fisher Exact Test ( d )
Hematopoiet ic System: Mononuclear Leukemia Overall Rates ( a ) 11/50 (22%) I e ,g)7/50(14%) Adjusted Rates t b ) 26.8% 15.4% Terminal Rates ( c ) 5/34 (15%) 5/43 (12%) Day ofFirst Observation 636 584 Life Table Tests (d ) P =0.4601 P=O.l34K Logistic Regression Tests i d ) P=0.392 P = 0,213K Cochran-Armitage Trend Test ( d ) P=0.550 Fisher Exact Test (dr P = 0.218N
5,000 p p m
28/48 158%) 65.0% 25/40 (63%) 548 P =0.106N P =0.342N P =0.356N
7/49 (14%) 16.7% 6/40 (15%) 343 P=0.282X P=0.412N P=O.41ON
3/49 (6%) 7.2% 2/40 (5%) 67 1 P=0.614N P =0.654 P = 0.651
10149 (20%) 23.4% 8/40 (20%) 343 P =0.284N P =0.429N P =0.426N
11/50(22%) 24.9% 8/40 (20%) 3 43 P=0.352N P=0.498X P =0.500N
11/50 (22%) 24.3% 7/40 i18%) 343 P=0 .4939 P=0.572N
P=0.595N
107 2,4-Dichlorophenol,N T P TR 353
TABLE 133. ANALYSIS OF PRIMARY TUMORS IN FEMALE RATS IN THE TWO-YEAR FEED STUDY OF 2,4-DICHLOROPHENOL (Continued)
(aI Number of tumor-bearing animals/number ofanimals examined a t t h e site ( b Kaplan-Meier estimated tumor incidences a t the end of the study after adjusting for intercurrent mortality (c)Observed tumor incidence at terminal kill td) Beneath the control incidence are the P values associated with the trend test. Beneath the dosed group incidence are the P values corresponding to pairwise comparisons between tha t dosed group and the controls. The life table analysis regards tumors in animals dying prior t o terminal kill as being (directly or indirectly) the cause of death. The logistic regression test regards these lesions as nonfatal. The Cochran-Armitage and Fisher exact tests compare directly the overall incidence rates. A negative trend or lower incidence in a dosed group is indicated by (N). ( e1 Incomplete sampling oftissues (fl No tissues were examined microscopically for the 2,500-ppm group. (g)Twenty-three livers were examined microscopically.
2,4-Dichlorophenol, NTP TR 353 108

TABLE 134. SUMMARY OF THE INCIDENCE OF NONNEOPLASTIC LESIONS IN FEMALE RATS IN THE TWO-YEAR FEED STUDY OF 2,4-DICHLOROPHENOL
Untreated Control
Animals initially in study Animals removed Animals examined histopathologically
ALIMENTARY SYSTEM Intestine large
Colon, parasite metazoan. single Rectum, parasite metazoan Rectum, parasite metazoan, multifocal Rec:tum, parasite metazoan. single
Intestine small Ileum, Peyer’s patch, hyperplasia, lymphoid,
multifocal Liver
Aniziectasis, focal Angiectasis. multifocal Basophilic focus, multiple Basophilic focus, single Clear cell focus Clear cell focus, multiple Clear cell focus, single Cy!jt Hemorrhage, acute, multifocal Hyperplasia, focal Inflammation, granulomatous, focal Inflammation, granulomatous, multifocal Inflammation, subacute, multifocal Inflammation, membranoproliferative, focal Bile duct, hyperplasia, multifocal Centrilobular, pigmentation, hemosiderin,
m.ultifoca1 Hepatocyte, degeneration, cystic, focal Hepatocyte, necrosis, acute, multifocal Hepatocyte, necrosis, multifocal Hepatocyte, vacuolization cytoplasmic,
rrmltifocal Hepatocyte, centrilobular, necrosis, subacute,
rrtultifocal Left lateral lobe, angiectasis, focal Median lobe, atrophy, chronic, multifocal Periportal, hematopoietic cell proliferation,
multifocal Periportal, infiltration cellular, lymphocytic,
acute, multifocal Sinusoid, subserosa, congestion, acute,
niultifocal Mesentery
Inflammation, chronic, multifocal Inflammation, granulomatous, focal Inflammation, granulomatous, multifocal
Pancreas Infiltration cellular, lymphocytic, multifocal Acinus, atrophy, focal Acinus, atrophy, multifocal
Stomach Forestomach, hyperkeratosis, multifocal Forestomach, hyperplasia, squamous, multifocal Glandular, ulcer, acute, multifocal
Tooth Peridontal tissue, inflammation, chronic
active, multifocal
50 50 50
(48)
2 (4%) 1 12%)
(48)
(50) 1 (2%)
33 (66%)2 (4%)
2 (4%)
1 ( 2 % )
26 152%)
8 (16%)
1 (2%) 3 (6%)
9 (18%)
2 (4%)
(2) 1 (50%) 1 (50%)
(50)
5 (10%) 15 (30%)
(49)
1 (2%)
Low Dose
50 50 50
(23)
1 (4%) 14 (61%) 2 19%) 2 (9%)
1 (4%)
2 19%) 7 130%)2 (9%)
2 (9%)
3 (13%)
148)
10 (21%) 8 (17%)
High Dose
50 50 50
(49) 1 (2%)
2 (4%) (49)
1 (2%) 150)
1 (2%) 42 (84%) 1 (2%)
1 (2%) 3 (6%)
1 (2%)
22 (44%)
1 (2%)7 (14%)
1 (2%)
1 (2%) 2 (4%)
6 (12%)
1 (2%) 1 (2%) 1 (2%)
1 (2%)
1 (2%) (2)
1 (50%) (49)
1 (2%) 2 (4%)6 (12%)
(50)1 (2%) 1 (2%)
(1)
1 (100%)
109 2,4-Dichlorophenol,NTP TR 353
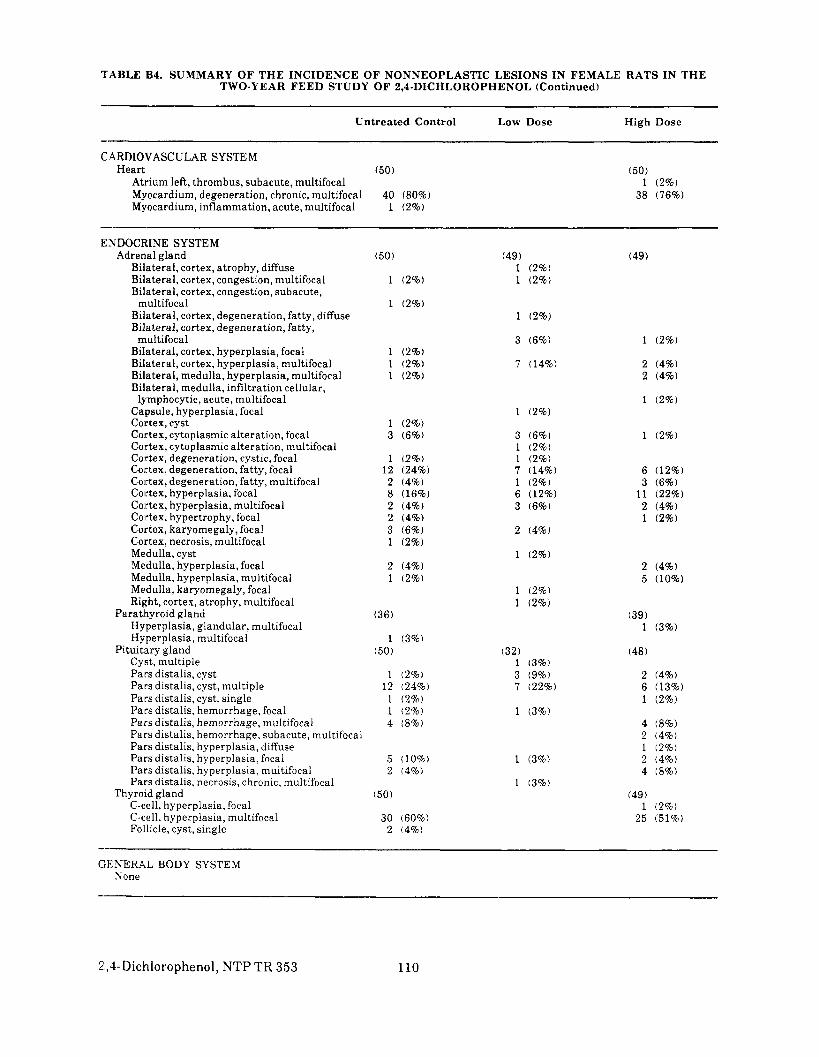
TABLE B4. SUMMARY O F T H E INCIDENCE O F NONNEOPLASTIC LESIONS IN FEMALE RATS IN T H E TWO-YEAR F E E D STUDY O F 2,4-DICHLOROPHENOL (Continued)
-~ Untrea ted Control Low Dose High Dose
--CARDIOVASCULAR SYSTEM
Heart Atrium left, thrombus, subacute, multifocal
Myocardium, inflammation, acute, multifocal Myocardium, degeneration, chronic, multifocal
(50)
1 (2%) 40 (80%)
(50) 1 (2%)
38 (76%)
ENDOCRINE SYSTEM Adrenal gland
Bilateral, cortex, atrophy, diffuse Bilateral, cortex, congestion, multifocal Bilateral, cortex, congestion, subacute,
Bilateral, cortex, degeneration, fatty, diffuse Bilateral, cortex, degeneration, fatty,
Bilateral, cortex, hyperplasia, focal Bilateral, cortex, hyperplasia, multifocal Bilateral, medulla, hyperplasia, multifocal Bilateral, medulla, infiltration cellular,
Capsule, hyperplasia, focal Cortex, cyst Cortex, cytoplasmic alteration, focal Cortex, cytoplasmic alteration, multifocal Cortex, degeneration, cystic, focal Cortex, degeneration, fatty, focal Cortex, degeneration, fatty, multifocal Cortex, hyperplasia, focal Cortex, hyperplasia, multifocal Cortex, hypertrophy, focal Cortex, karyomegaly, focal Cortex, necrosis, multifocal Medulla, cyst Medulla, hyperplasia, focal Medulla, hyperplasia, multifocal Medulla, karyomegaly, focal Right, cortex, atrophy, multifocal
Hyperplasia, glandular, multifocal Hyperplasia, multifocal
Cyst, multiple Pars distalis, cyst Pars distalis, cyst, multiple Pars distalis, cyst. single Pars distalis, hemorrhage, focal Pars distalis, hemorrhage, multifocal Pars distalis, hemorrhage, subacute, multifocal Pars distalis, hyperplasia, diffuse Pars distalis, hyperplasia, focal Pars distalis, hyperplasia, multifocal Pars distalis, necrosis, chronic, multifocal
C-cell, hyperplasia, focal C-cell, hyperplasia, multifocal Follicle, cyst, single
multifocal
multifocal
lymphocytic, acute, multifocal
Parathyroid gland
Pituitary gland
Thyroid gland
(50)
1 (2%)
1 (2%)
1 (2%) 1 (2%) 1 (2%)
1 (2%) 3 (6%)
1 (2%) 12 (24%) 2 (4%) 8 (16%) 2 (4%) 2 (4%) 3 (6%) 1 (2%)
2 (4%) 1 (2%)
(36)
1 (3%) (50)
1 (2%) 12 (24%) 1 (2%) 1 (2%) 4 (8%)
5 (10%) 2 (4%)
(50)
30 (60%) 2 (4%)
(49) 1 (2%) 1 (2%)
1 (2%)
3 (6%)
7 (14%)
1 (2%)
3 (6%) 1 (2%) 1 (2%) 7 (14%) 1 (2%) 6 (12%) 3 (6%)
2 (4%)
1 (2%)
1 (2%) 1 (2%)
(32) 1 (3%) 3 (9%) 7 (22%)
1 (3%)
1 (3%)
1 (3%)
(49)
1 (2%)
2 (4%) 2 (4%)
1 (2%)
1 (2%)
6 (12%) 3 (6%)
11 (22%) 2 (4%) 1 (2%)
2 (4%) 5 (10%)
(39) 1 (3%)
(48)
2 (4%) 6 (13%) 1 (2%)
4 (8%) 2 (4%) 1 (2%) 2 (4%) 4 (8%)
(49) 1 (2%)
25 (51%)
GENERAL BODY SYSTEM None
--
P8,4-Dichlorophenol,NTP TR 353 110
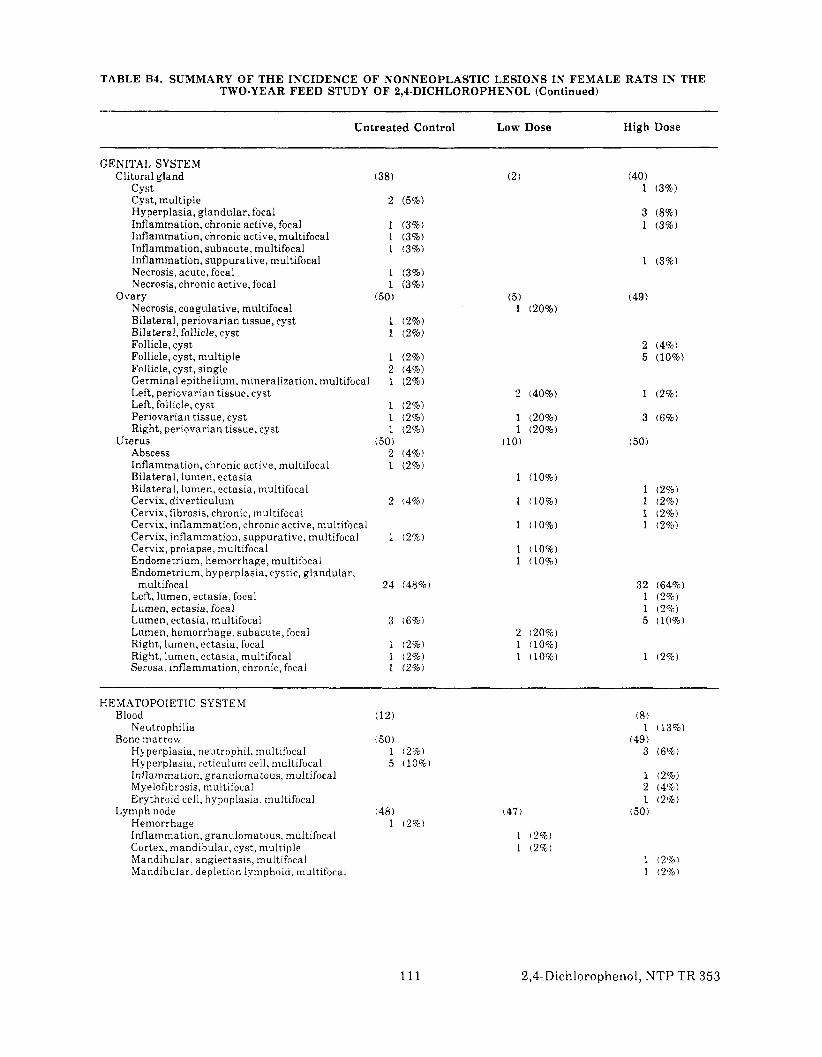
TABLE 134. SUMMARY OF THE INCIDENCE OF NONNEOPLASTIC LESIONS IN FEMALE RATS IN THE TWO-YEAR FEED STUDY OF 2,4-DICHLOROPHENOL (Continued)
Untreated Control
GENITAL SYSTEM Clitoral gland (38)
Cyst Cyst, multiple 2 (5%)Hyperplasia, glandular, focal Infl.ammation, chronic active, focal 1 (3%) Infllammation, chronic active, multifocal 1 (3%) Infllammation, subacute, multifocal 1 (3%)Infllammation, suppurative, multifocal Necrosis, acute, focal 1 (3%) Necrosis, chronic active, focal 1 (3%)
Ovary (50)Necrosis, coagulative, multifocal Bilateral, periovarian tissue, cyst 1 (2%) Bilateral, follicle, cyst 1 (2%)Follicle, cyst Follicle, cyst, multiple 1 (2%) Follicle, cyst, single 2 (4%)Germinal epithelium, mineralization, multifocal 1 (2%) Left, periovarian tissue, cyst Left, follicle, cyst 1 (2%) Periovarian tissue, cyst 1 (2%) Right, periovarian tissue, cyst 1 (2%)
Uterus (50)Abscess 2 (4%) Inflammation, chronic active, multifocal 1 (2%) Bilateral, lumen, ectasia Bilateral, lumen, ectasia, multifocal Cervix, diverticulum 2 (4%) Ceirvix, fibrosis, chronic, multifocal Cervix, inflammation, chronic active, multifocal Cervix, inflammation, suppurative, multifocal 1 (2%) Cervix, prolapse, multifocal Endometrium, hemorrhage, multifocal Endometrium, hyperplasia, cystic, glandular,
multifocal 24 (48%) Left, lumen, ectasia, focal Lumen, ectasia, focal Lumen, ectasia, multifocal 3 (6%) Lumen, hemorrhage, subacute, focal Right, lumen, ectasia, focal 1 (2%) Right, lumen, ectasia, multifocal 1 (2%)Serosa, inflammation, chronic, focal 1 (2%)
Low Dose High Dose
(2)
(5) 1 (20%)
2 (40%)
1 (20%) 1 (20%)
(10)
1 (10%)
1 (10%)
1 (10%)
1 (10%) 1 (10%)
2 (20%) 1 (10%) 1 (10%)
2 (4%) 5 (10%)
1 (2%)
3 (6%)
(50)
1 (2%) 1 (2%) 1 (2%) 1 (2%)
32 (64%) 1 (2%) 1 (2%) 5 (10%)
1 (2%)
HEMATOPOIETIC SYSTEM Blood
Neutrophilia (12)
Bone marrow Hyperplasia, neutrophil, multifocal Hyperplasia, reticulum cell, multifocal Inflammation, granuloma tous, multifocal Myelofibrosis, multifocal
( 5 0 ) 1 (2%) 5 (10%)
1 (2'%) 2 (4'%)
Erythroid cell, hypoplasia, multifocal Lymph node
Hemorrhage Inflammation, granulomatous, multifocal Cortex, mandibular, cyst, multiple Mandibular, angiectasis, multifocal
(48) 1 ( 2 % )
(47)
1 (2%) 1 (2%)
1 (21%) (50)
Mandibular, depletion lymphoid, multifocal
111 2,4-Dichlorophenol, NTP TR 353
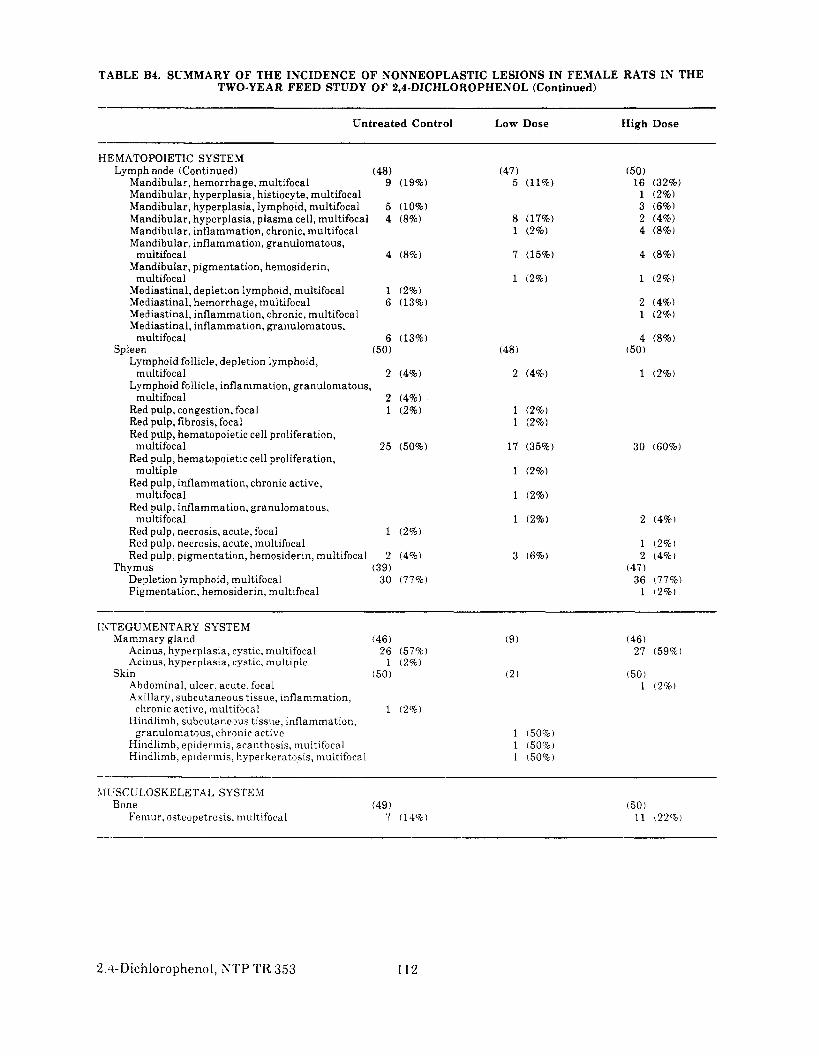
TABLE B4. SUMMARY OF THE INCIDENCE OF NONNEOPLASTIC LESIONS IN FEMALE RATS IN THE TWO-YEAR FEED STUDY OF 2,4-DICHLOROPHENOL (Continued)
Untrea ted Control Low Dose High Dose
HEMATOPOIETIC SYSTEM Lymph node (Continued)
Mandibular, hemorrhage, multifocal (48)
9 (19%) (47)
5 (11%) (50)
16 (32%) Mandibular, hyperplasia, histiocyte, multifocal Mandibular, hyperplasia, lymphoid, multifocal Mandibular, hyperplasia, plasma cell, multifocal Mandibular, inflammation, chronic, multifocal
5 (10%) 4 (8%) 8
1 (17%) (2%)
1 (2%) 3 (6%) 2 (4%) 4 ( 8 % )
Mandibular, inflammation, granulomatous, multifocal 4 (8%) 7 (15%) 4 (8%)
Mandibular, pigmentation, hemosiderin, multifocal
Mediastinal, depletion lymphoid, multifocal 1 (2%) 1 (2%) 1 12%)
Me'diastinal, hemorrhage, multifocal Mediastinal, inflammation, chronic, multifocal Me'diastinal, inflammation, granulomatous,
6 (13%) 2 (4%) 1 (2%)
multifocal Spleen
Lymphoid follicle, depletion lymphoid,
6 (13%) (50) (48)
4 (8%) (50)
multifocal Lymphoid follicle, inflammation, granulomatous,
2 (4%) 2 (4%) 1 (2%)
multifocal 2 (4%) Red pulp, congestion, focal Red pulp, fibrosis, focal Red pulp, hematopoietic cell proliferation,
1 (2%) 1 1
(2%) (2%)
Red pulp, hematopoietic cell proliferation, multifocal 25 (50%) 17 (35%) 30 (60%)
Red pulp, inflammation, chronic active, multiple 1 (2%)
Red pulp, inflammation, granulomatous,
Red pulp, necrosis, acute, focal 1 (2%) Red pulp, necrosis, acute, multifocal Red pulp, pigmentation, hemosiderin, multifocal 2 (4%)
Depletion lymphoid, multifocal 30 (77%) Pigmentation, hemosiderin, multifocal
multifocal
multifocal
Thymus (39) 3
(2%)
(2%)
(6%)
2 (4%)
1 (2%) 2 (4%)
36 177%) 1 12%)
(47)
1:ITEGU'MENTARY SYSTEM Mammary gland
Acinus, hyperplasia, cystic, multifocal Acinus, hyperplasia, cystic, multiple
Abdominal, ulcer, acute, focal Axillary, subcutaneous tissue, inflammation,
Hindlimb, subcutaneous tissue, inflammation,
Skin
chronic active, multifocal 1 (2%)
(46) 27 (59%)
(50) 1 12%)
Hindlimb, epidermis, acanthosis, multifocal Hindlimb, epidermis, hyperkeratosis, multifocal
granulomatous, chronic active 1 (50%) 1 (50%) 1 (50%)
l'[( 'SCUL.OSICELETAL SYSTEM Bone
Femur, osteopetrosis, multifocal (49)
7 (14%) 50 1 11 (22%)
2,-~-Diclilorophenol,NTP TR 353 112

TABLE 64. SUMMARY OF THE INCIDENCE OF NONNEOPLASTIC LESIONS IN FEMALE RATS IN THE TWO-YEAR FEED STUDY OF 2,4-DICHLOROPHENOL (Continued)
Untreated Control Low Dose High Dose
NERVOlJS SYSTEM Brain
Cerebellum, hemorrhage, acute, focal Cerebellum, hemorrhage, multifocal Cerebrum, compression, focal Cerebrum, hemorrhage, focal Cerebrum, perivascular cuffing, focal Medulla, hemorrhage, focal Memdulla, hemorrhage, multifocal Ventricle, hydrocephalus, multifocal
:50)1 (2%)
9 (18%)
1 (2%) 3 ( 6 % )
48)
1 (2%) 7 (15%) 1 (2%) 1 (2%) 1 (2%)
5 (10%)
--RESPIRATORY SYSTEM
Lung (50) Congestion, acute, diffuse Congestion, acute, multifocal 2 (4%) Hemorrhage, acute, multifocal 2 (4%) Pig:mentation, hemosiderin, multifocal Alveolar epithelium, hyperplasia, focal Alveolar epithelium, hyperplasia, multifocal 1 (2%) Bronchiole, epithelium, hyperplasia, multifocal Interstitium, inflammation, acute, focal 1 (2%) Inkrstitium, inflammation, acute, multifocal Interstitium, inflammation, chronic, focal Interstitium, inflammation, subacute, multifocal
Nasolacrimal duct, inflammation, subacute, focal 5 (11%) Nasolacrimal duct, inflammation, subacute,
multifocal 18 (40%) Respiratory epithelium, degeneration,
multifocal 19 (42%) Submucosa, respiratory epithelium, congestion,
acute, multifocal 1 (2%) Submucosa, respiratory epithelium,
inflammation, subacute, multifocal 21 (47%)
Nose (45)
Trachea (49) W,a11, hemorrhage, multifocal
( 1 ) 1 (100%)
(50)
1 (2%) 2 (4%)
1 (2%)
1 (2%) 1 (2%) 1 (2%)
7 (16%)
9 (20%)
17 (38%)
24 (53%)
(45)
(48) 1 ( 2 8 )
I--
SPECIAL SENSES SYSTEM Eye
Hemorrhage, acute, multifocal Lens, cataract Lens, cataract, multifocal Retina, atrophy, multifocal
Inflammation, subacute, focal
Bilateral, inflammation, subacute, multifocal
Hardlerian gland
Inflammation, subacute, multifocal
(4) 1 (25%)
1 (25%) 1 (25%)
1 (3%)
(40)
15 (38%)
(1)
1 (100%)
1 (100%)
(4)
3 (75%)
3 (75%)
2 (5%)
2 (5%)
(42)
8 (19%)
URINARY SYSTEM Kidney (50)
Bilateral, nephropathy, chronic, multifocal 46 (92%) Bilateral, nephropathy, multifocal Cortex, casts, single 1 (2%) Cortex, infarct, focal Cortex, inflammation, chronic, focal 1 (2%) Left, cortex, cyst, single Lcft, medulla, cyst, multiple 1 (2%) Renal tubule, degeneration, acute, multifocal 2 (4%) Renal tubule, hyperplasia, focal Renal tubule, vacuolization cytoplasmic, multifocal 1 (2%)
(1)
1 (100%)
(49) 33 (67%) 1 (2%)
1 (2%) 1 (2%) 1 (2%)
1 ( 2 % ) 1 (2%)
113 2,4-Dichlorophenol,ISTP TR 353
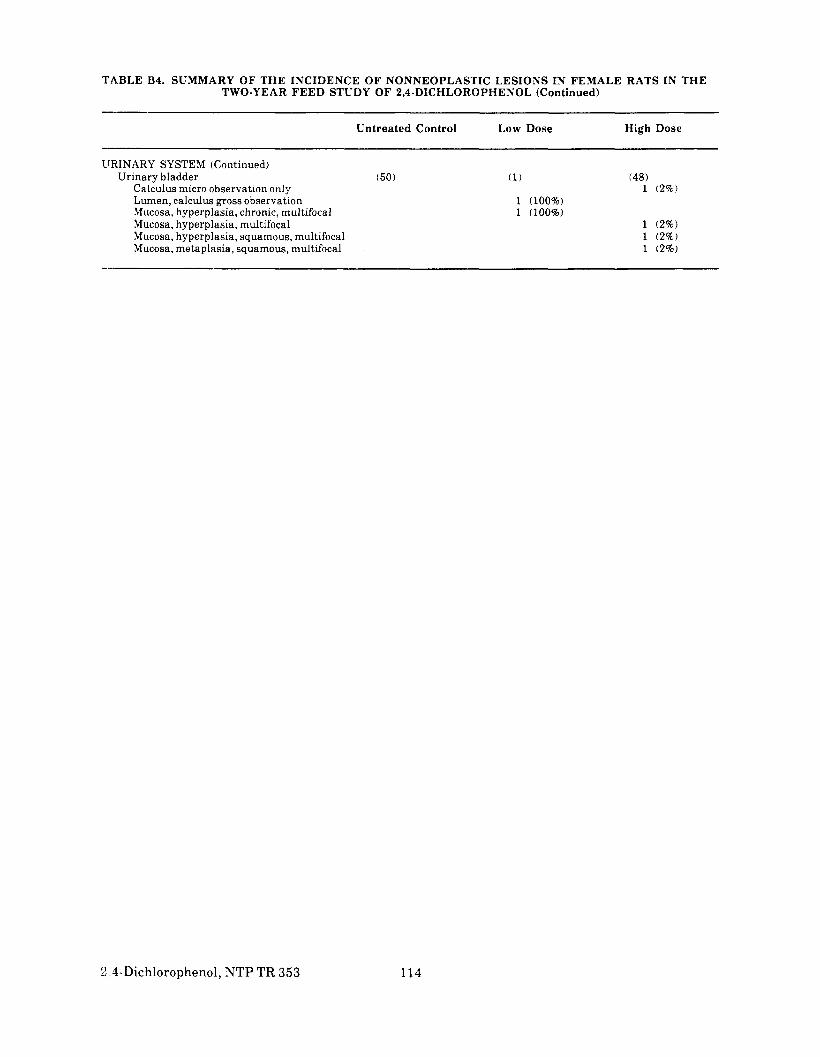
TABLE B4. SUMMARY OF THE INCIDENCE OF NONNEOPLASTIC LESIONS IN FEMALE RATS IN THE TWO-YEAR FEED STUDY OF 2,4-DICHLOROPHENOL (Continued)
Untreated Control Low Dose High Dose
URINARY SYSTEM (Continued) Urinary bladder
Calculus micro observation only Lumen, calculus gross observation Mucosa, hyperplasia, chronic, multifocal Mucosa, hyperplasia, multifocal Mucosa, hyperplasia, squamous, multifocal Mucosa, metaplasia, squamous, multifocal
(50) (1)
1 (100%) 1 (100%)
(48) 1 (2%)
:!,4-Dichlorophenol, NTP TR 353 114

APPENDIX C
SUMMARY OF LESIONS IN MALE MICE IN THE
TWO-YEAR FEED STUDY OF
2,4-DICHLOROPHENOL
PAGE
TABLE C l SUMMARY OF THE INCIDENCE OF NEOPLASMS IN MALE MICE IN THE TWO- YEAR FEED STUDY OF 2,4-DICHLOROPHENOL 117
TABLE (22 INDIVIDUAL ANIMAL TUMOR PATHOLOGY OF MALE MICE IN THE TWO-YEAR FEED STCDY OF 2,4-DICHLOROPHENOL 120
TABLE (23 ANALYSIS OF PRIMARY TUMORS IN MALE MICE IN THE TWO-YEAR FEED STUDY OF 2,4-DICHLOROPHENOL 130
TABLE (24 HISTORICAL INCIDENCE OF STOMACH SQUAMOLiS CELL TUMORS IN MALE B6C3F1 MICE RECEIVING NO TREATMENT 133
TABLE (25 SUMMARY OF THE INCIDENCE O F NONNEOPLASTIC LESIONS IN MALE MICE IN THE TWO-YEAR FEED STUDY OF 2,4-DICHLOROPHENOL 134
115 2,4-Dichlorophenol, NTP TR 353

2.4-Dichlorophenol,NTP TR 353 116

TABLE Cl. SUMMARY OF T H E INCIDENCE OF NEOPLASMS IN MALE MICE I N THE TWO-YEAR F E E D STUDY OF 2,4-DICHLOROPHENOL
Untrea ted Control
Animals initially in study 50 Animals removed 50 Animals examined histopathologically 50
ALIMENTARY SYSTEM Gallb1:adder (42)
Lymphoma malignant mixed 1 (2%) Intestine large (48)
Cecum, lymphoma malignant lymphocytic intestine small (44)
Jejunum, Peyer’s patch, lymphoma malignant mixed
Peyer’s patch, lymphoma malignant mixed Liver (50)
Hemangiosarcoma 1 (2%)Hemangiosarcoma, multiple Hepatocellular carcinoma 5 (10%)Hepatocellular carcinoma, trabecular, multiple 1 (2%) Hepatocellular carcinoma, multiple 1 (2%) Hepatocellular adenoma 3 (6%) Hepatocellular adenoma, multiple 1 (2%)Lymphoma malignant histiocytic Lymphoma malignant lymphocytic Lymphoma malignant mixed 1 (2%)
Mesentery *(50) Lymphoma malignant lymphocytic
Pancrt:as (49) Lymphoma malignant lymphocytic Lymphoma malignant mixed 1 (2%)
Salivary glands (50) Lymphoma malignant lymphocytic Lymphoma malignant mixed 1 (2%)
Stomach (48)Lymphoma malignant lymphocytic Forestomach, papilloma squamous Forestomach, squamous cell carcinoma
CARDIOVASCULAR SYSTEM Heart (50)
Alveolar/bronchiolar carcinoma, metastatic, lung
Lymphoma malignant lymphocytic
ENDOCRINE SYSTEM Adrenal gland (49)
Lymphoma malignant lymphocytic Lymphoma malignant mixed 1 (2%) Medulla, pheochromocytoma benign Spindle cell, adenoma 1 (2%)
Thyroid gland (50)Follicular cell, adenoma 2 (4%)
GENERAL BODY SYSTEM Tissue, NOS
Lymphoma malignant mixed
Low Dose
50 50 50
*(50)
1 (2%)
(49) 1 (2%) 1 (2%) 7 (14%)
5 (10%)
2 (4%)
*(50)
*(50)
1 (2%)
*(50)
*(50)
High Dose
50 50 50
3 (6%)
6 (13%)
1 (2%)
*(50)2 (4%)
(45) 2 (4%) 1 (2%)
(49) 1 (2%)
(46)1 (2%) 2 (4%) 1 (2%)
(50)
2 (4%)
(45)1 (2%)
1 (2%) 1 (2%)
(48)
117 2,4-Dichlorophenol,NTP TR 353
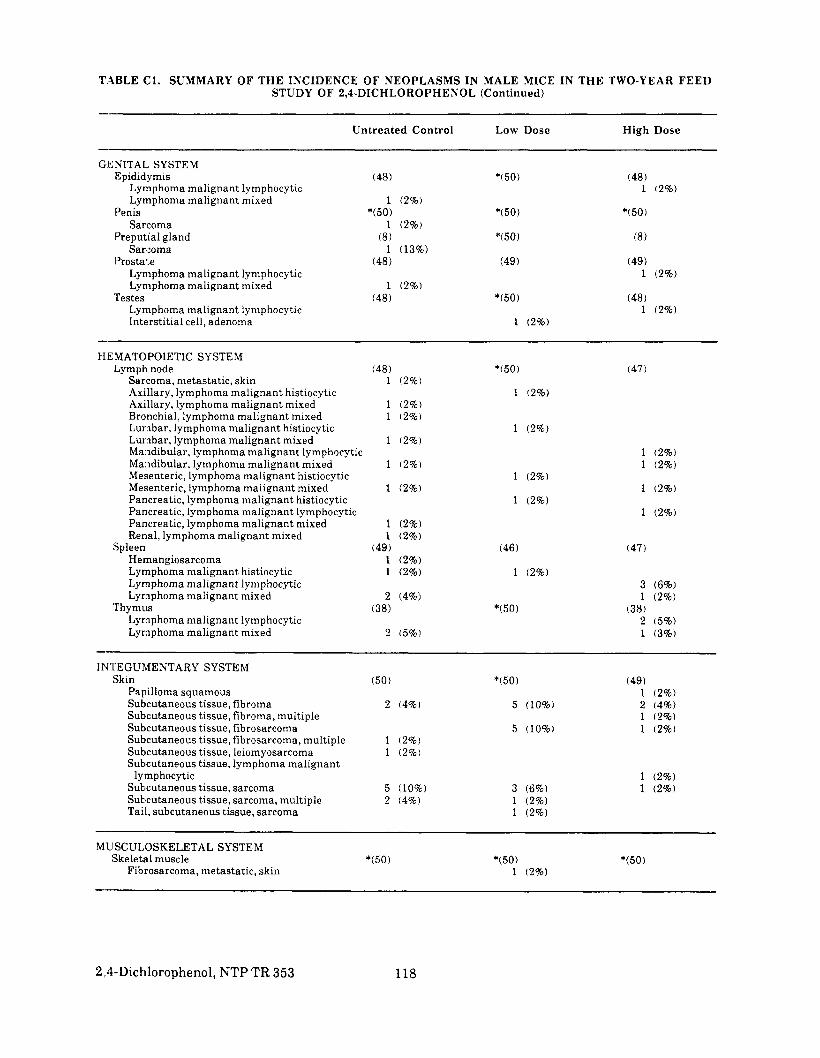
TABLE Cl. SUMMARY OF THE INCIDENCE OF NEOPLASMS IN MALE MICE IN THE TWO-YEAR FEED STUDY OF 2,4-DICHLOROPHENOL (Continued)
---Untreated Control Low Dose High Dose
-GENITAL, SYSTEM
Epididymis Lymphoma malignant lymphocytic Lymphoma malignant mixed
Penis Sarcoma
Preputial gland Sarcoma
Prostate Lymphoma malignant lymphocytic Lymphoma malignant mixed
Lymphoma malignant lymphocytic Interstitial cell, adenoma
Testes
(48)
1 (2%)
1 (2%)
1 (13%)
*(50)
(8)
(48)
1 (2%) (48)
(49)
'(50)
1 (2%)
(48)1 (2%)
(49) 1 (2%)
(48)1 (2%)
H E MATOPOIETIC SYSTEM Lymph. node
Sarcoma, metastatic, skin Axillary, lymphoma malignant histiocytic Axillary, lymphoma malignant mixed Bronchial, lymphoma malignant mixed Lumbar, lymphoma malignant histiocytic Lumbar, lymphoma malignant mixed Mandibular, lymphoma malignant lymphocytic Mandibular, lymphoma malignant mixed Mesenteric, lymphoma malignant histiocytic Mesenteric, lymphoma malignant mixed Pancreatic, lymp homa malignant histiocytic Pancreatic, lymphoma malignant lymphocytic Pancreatic, lymphoma malignant mixed Renal, lymphoma malignant mixed
Hemangiosarcoma Lyrnphoma malignant histiocytic Lyrnphoma malignant lymphocytic Lyrnphoma malignant mixed
Lyrnphoma malignant lymphocytic Lymphoma malignant mixed
Spleen
Thymus
(48) 1 (2%)
1 (2%) 1 (2%)
1 (2%)
1 (2%)
1 (2%)
1 (2%) 1 (2%)
1 (2%) 1 12%)
2 (4%)
2 ( 5 % )
(49)
(38)
*(50)
1 (2%)
1 (2%)
1 (2%)
1 (2%)
1 (2%)
(46)
*(50)
(47)
1 (2%) 1 (2%)
1 (2%)
1 (2%)
3 (6%)1 (2%)
2 (5%) 1 (3%)
(47)
(38)
-~ INTEGUMENTARY SYSTEM
Skin Papilloma squamous Subcutaneous tissue, fibroma Subcutaneous tissue, fibroma, multiple Subcutaneous tissue, fibrosarcoma Subcutaneous tissue, fibrosarcoma, multiple Subcutaneous tissue, leiomyosarcoma
Subcutaneous tissue, sarcoma Suhcutaneous tissue, sarcoma, multiple Tail, subcutaneous tissue, sarcoma
Subcutaneous tissue, lymphoma malignant lymphocytic
(50)
2 (4%)
1 (2%) 1 (2%)
5 (10%) 2 (4%)
*(50)
5 (10%)
5 (10%)
3 (6%) 1 (2%) 1 (2%)
(49) 1 (2%) 2 (4%)1 (2%) 1 (2%)
1 (2%)1 (2%)
MUSCULOSKELETAL SYSTEM Skeletal muscle
Fibrosarcoma, metastatic, skin '(50)
1 (2%) *(50)
2,4-Dichlorophenol,NTP TR 353 118

TABLE Cl. SUMMARY OF THE INCIDENCE OF NEOPLASMS IN MALE MICE IN THE TWO-YEAR FEEDSTUDY OF 2,4-DICHLOROPHENOL (Continued)
Untreated Control
NERVOUS SYSTEMBrain
Lymphoma malignant histiocytic
RESPIRATORY SYSTEMLung
Alveolar/bronchiolar adenomaAlveolar/bronchiolar adenoma, multipleAlveolar/bronchiolar carcinomaAlveolar/bronchiolar carcinoma, metastatic,
lungFibrosarcoma, metastatic, skmLymphoma malignant lymphocyticLymphoma malignant mixed
SPECIAL SENSES SYSTEMHarderian gland
AdenocarcmomaAdenoma
URINARY SYSTEMKidney
Fibrosarcoma, metastatic, skinLymphoma malignant lymphocyticLymphoma malignant mixed
Urinary bladderLymphoma malignant lymphocyticLymphoma malignant mixed
SYSTEMIC LESIONSMultiple organs
HemangiosarcomaLymphoma malignant histiocyticLymphoma malignant mixedLymphoma malignant lymphocytic
ANIMAL DISPOSITION SUMMARYAnimals initially in studyTerminal sacrificeDeadMoribundDrowned
TUMOR SUMMARYTotal animals with primary neoplasms **
Total primary neoplasmsTotal am mals with benign neoplasms
Total benign neoplasmsTotal animals with malignant neoplasms
Total malignant neoplasmsTotal animals with secondary neoplasms***
Total secondary neoplasms
(50)
(50)2
1
2
*(50)12
(49)
11
(48)
1
*(50)1121
5033125
293811132125
11
(4%)
(2%)
(4%)
(2%)(4%)
(2%)(2%)
(2%)
(2%)(2%)(4%)(2%)
Low
*(50)1
*(50)
11
11
*(50)
2
*(50)1
*(50)
*(50)221
5032144
29371314212325
Dose
(2%)
(2%)(2%)
(2%)(2%)
(4%)
(2%)
(4%)(4%)(2%)
High
(50)
(50)3
2
21
*(50)
4
(49)
3
(46)1
*(50)
13
50311234
243316211012
Dose
(6%)
(4%)
(4%)(2%)
(8%)
(6%)
(2%)
(2%)(6%)
* Vumber of animals receiving complete necropsy examination, all gross lesions including masses examined microscopically** Primary tumors all tumors except secondary tumors*** Secondary tumors metastatic tumors or tumors invasive into an adjacent organ
119 2,4-Dichlorophenol, NTP TR 353

TABLE C2. INDIVIDUAL ANIMAL TUMOR PATHOLOGY OF MALE MICE IN THE TWO-YEAR FEEDSTUDY OF 2,4-DICHLOROPHENOL: UNTREATED CONTROL
WEEKS ONSTUDY
CARCASSID
ALIMENTARY SYSTEMEsophagusGallbladder
Lymphoma malignant mixedIntestine largeIntestine smallLiver
HemangiosarcomaHepatocellula carcinomaHepatocellula carcinoma, trabecular.
multipleHepatocellula carcinoma, multipleHepatocellula adenomaHepatocellula adenoma, multipleLymphoma malignant mixed
MesenteryPancreas
Lymphoma malignant mixedSalivary glands
Lymphoma malignant mixedStomachTooth
CARDIOVASCULAR SYSTEMHeart
ENDOCRINE SYSTEMAdrenal gland
Lymphoma malignant mixedSpindle cell, adenoma
Islets, pancreaticParathyroid glandPituitary glandThyroid gland
Folhcular cell, adenoma
GENERAL SODY SYSTEMNone
GENITAL SYSTEMCoagulating glandEpididymis
Lymphoma ma ignant mixedPenis
SarcomaPreputial gland
SarcomaProstate
Lymphoma ma ignant mixedSeminal vesicleTestes
0 0 0 0 0 0 0 0 0 0 0 0 0 0 1 10 1 8 8 8 8 8 9 9 9 9 9 9 9 0 04 6 1 3 3 5 7 3 5 7 8 8 9 9 0 3
1 0 0 0 0 0 1 0 0 0 0 0 0 0 0 00 6 1 4 9 4 0 2 1 5 3 3 2 7 7 62 1 4 4 3 1 4 4 2 1 3 4 3 2 5 3
+ t t t A t l V l t M A + t t A + MX
+ + + A M + + + + f + + + + ^ +
XX X
X
X+ f
X
X
+ + + +fJL + + f + + + + + + + +X
+ + + + + + + M + + + + + + + +
+ +X
+X+X
XA + +
M+ + + M + + + + t + + + + + +
1 1 1 1 1 1 1 1 10 0 0 0 0 0 0 0 0
0 0 0 0 0 0 0 0 05 1 1 1 2 2 2 3 34 1 3 5 1 2 5 1 2
+ + + H- H- + + + +
X
4 +
+ + + + H + + + +
X
f + ^ t t t t + t
-f +
+ •» +
+ Tissue examined microscopically: Not examined. Present but not examined microscopicallyI: Insufficient tissue
M: MissingA: Autolysis precludes examinationX: Incidence of listed morphology
2,4-Dichlorophenol, NTP TR 353 120
-
-
-
-
-
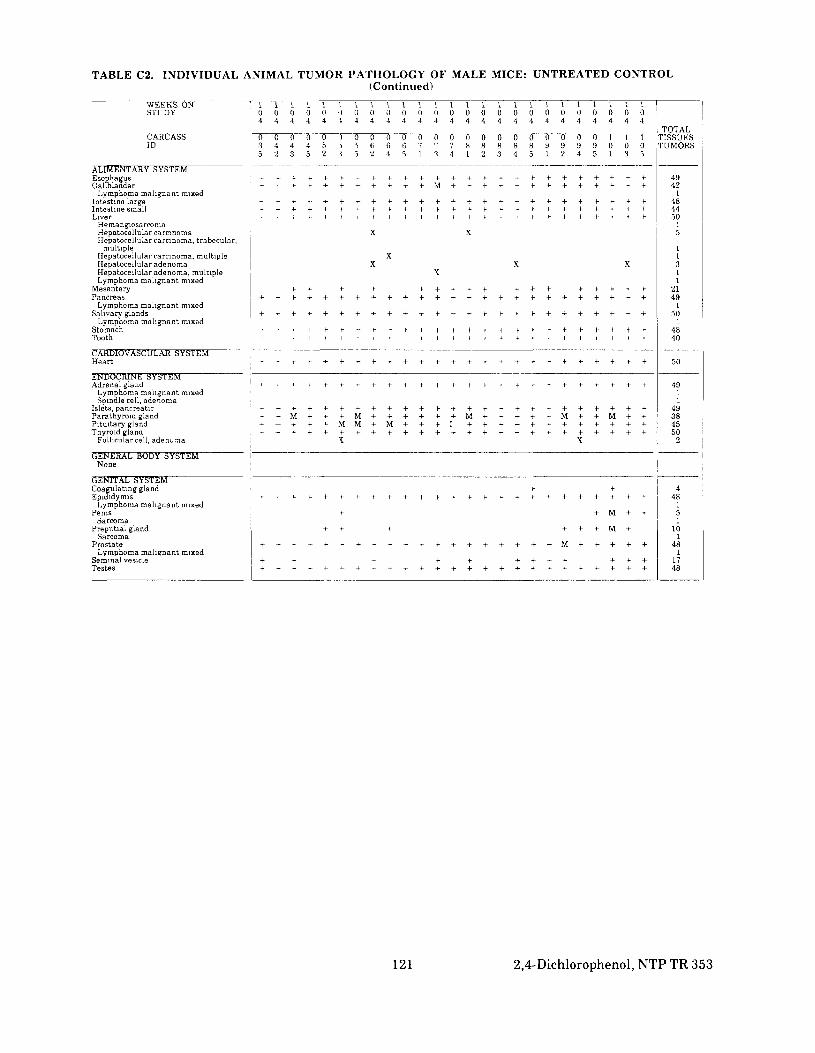
TABLE C2. INDIVIDUAL ANIMAL TUMOR PATHOLOGY OF MALE MICE: UNTREATED CONTROL(Continued)
WEEKS ONSTUDY
CARCASSID
ALIMENTARY SYSTEMEsophagusGallbladder
Lymphoma malignant mixedIntestine largeIntestine smallLiver
HemangiosarcomaHepatocellular carcinomaHepatocellular carcinoma, trabecular,
multipleHepatocellular carcinoma, multipleHepatocellular adenomaHepatocellular adenoma, multipleLymphoma malignant mixed
MesenteryPancreas
Lymphoma malignant mixedSalivary glands
Lymphoma malignant mixedStomachTooth
CARDIOVASCULAR SYSTEMHeart
l l l l l l l l l t l l l l l l l l l l l l l l l0 0 0 0 0 0 0 0 0 0 0 0 0 0 0 0 0 0 0 0 0 0 0 0 0
0 0 0 0 0 0 0 0 0 0 0 0 0 0 0 0 0 0 0 0 0 0 1 1 13 4 4 4 5 > 5 6 6 6 7 7 7 h 8 8 8 8 9 9 9 3 0 0 05 2 3 5 2 3 5 2 4 5 1 1 4 1 2 3 4 5 1 2 4 5 1 3 5
+ + + + + + + + + + + + + + + + + + + + + + + + +
X X
xX X X
X
4 - 4 - 4- 4- 4 - 4 - 4 - 4 - 4 - 4 - 4 - 4 - 4 - 4 - 4 - 4 - 4 -
ENDOCRINE SYSTEMAdrenal gland ' 4 - + 4- + + 4 - 4 - 4 - 4 - + 4 - 4 - + 4 - t - + 4 - 4 - + 4 - 4 - 4 - 4 - 4 - 4
Lymphoma malignant mixedSpindle cell, adenoma
Islets, pancreaticParathyroid glandPituitary glandThyroid gland
Follicular cell, adenoma
GENERAL BODY SYSTEMNone
GENITAL SYSTEMCoagulating glandEpididymis
Lymphoma malignant mixedPenis
SarcomaPrepntial gland
SarcomaProstate
Lymphoma malignant mixedSeminal vesicleTestes
+ * M + 4 - 4 - M + 4 - + 4- 4 4 - M 4 - 4 - + 4 - 4 - M 4 - 4 - M 4 - 4 -
X X
4- 4-
4- 4- M + 4-
4 - 4 - 4- 4 - 4 - 4 - M 4 -
+ + 4- + + 4 4 - 4 - 4 - + + 4- + 4 - 4 - 4 - 4 - 4 - 4 - M 4 - 4 - 4 - + 4-
4 - 4 - 4- 4 - 4 - 4 - 4 - 4 - 4 - 4 - 4 - 4 -
TOTALTISSUESTUMORS
49421
484450
15
11311
21491
501
4840
50
4911
49384550
2
448151
101
481
1748
121 2,4-Dichlorophenol, NTP TR 353

TABLE C2. INDIVIDUAL ANIMAL TUMOR PATHOLOGY OF MALE MICE: UNTREATED CONTROL(Continued)
WEEKS ONSTUDY
CARCASSID
HEMATOPOIETIC SYSTEMBloodBone marrowLymph node
Sarcoma, metastatic, skinAxillary, lymphoma malignant mixedBronchial, iymphoma malignant mixedLumbar, lymphoma malignant mixedMandibular, lymphoma malignant mixedMesentenc, lymphoma malignant mixedPancreatic, lymphoma malignant mixedRenal, lymphoma malignant mixed
SpleenHemangiosarcomaLymphoma malignant histiocyticLymphoma malignant mixed
ThymusLymphoma malignant mixed
INTEGUMENTARY SYSTEMMammary glandSkin
Subcutaneous tissue, fibromaSubcutaneous tissue, fibrosarcoma,
multipleSubcutaneous tissue, leiomyosarcomaSubcutaneous tissue, sarcomaSubcutaneous tissue, sarcoma, multiple
MUSCULOSKELETAL SYSTEMBone
NERVOUS SYSTEMBrain
RESPIRATORY SYSTEMLung
Alveolar/bronchiolar adenomaAlveolar/bronchiolar carcinomaLymphoma malignant mixed
NoseTrachea
SPECIAL SENSES SYSTEMEyeHardenan gland
AdenocarcmomaAdenoma
URINARY SYSTEMKidney
Lymphoma malignant lymphocyticLymphoma malignant mixed
Urinary bladderLymphoma malignant mixed
o o o o o o o o0 1 8 8 8 8 8 94 6 1 3 3 5 7 3
1 0 0 0 0 0 1 00 6 1 4 9 4 0 2
+ +•
XXXXXXX
XX
X
M M M M M M M M
XX
0 0 0 0 0 0 1 1 1 1 1 1 1 1 1 1 19 9 9 9 9 9 0 0 0 0 0 0 0 0 0 0 0
0 0 0 0 0 0 0 0 0 0 0 0 0 0 0 0 01 5 3 3 2 7 7 6 5 1 1 1 2 2 2 3 32 1 3 4 3 2 5 3 4 1 3 5 1 2 5 1 2
+ + + +
X
X
+ * - M + + + M M M + + -t + + + + +
M M M M M M M M M M M M M M M M M
X
X X XX X
+ + + +^+ + + + + + + + + + + + + + + + + + + + +
XM M M M M M M ++ + + + + + + +
X
+ + + + + + T + + + + + + + + ^ +
+ + + + M + + +
X
X
2,4-Dichlorophenol, NTP TR 353 122
-

TABLE C2. INDIVIDUAL ANIMAL TUMOR PATHOLOGY OF MALE MICE: UNTREATED CONTROL(Continued)
WEEKS ONSTUDY
CARCASSID
HEMATOPOIETIC SYSTEMBloodBone marrowLymph node
Sarcoma, metastatic, skinAxillary, lymphoma malignant mixedBronchial, lymphoma malignant mixedLumbar, lymphoma malignant mixedMandibular, lymphoma malig mixedMesentenc, lymphoma malignant mixedPancreatic, lymphoma malignant mixedRenal, lymphoma malignant mixed
SpleenHemangiosarcomaLymphoma malignant histiocyticLymphoma malignant mixed
ThymusLymphoraa malignant mixed
INTEGUMENTARY SYSTEMMammarv glandSkin
Subcutaneous tissue, fibromaSubcutaneous tissue, fibrosarcoma,
multipleSubcutaneous tissue, leiomyosarcomaSubcutaneous tissue, sarcomaSubcutaneous tissue, sarcoma, multiple
MUSCULOSKELETAL SYSTEMBone
NERVOUS SYSTEMBrain
RESPIRATORY SYSTEMLung
Alveolar/bronchiolar adenomaAlveolar/bronchiolar carcinomaLymphoma malignant mixed
NoseTrachea
SPECIAL SENSES SYSTEMEyeHardenan gland
Ade noca rci no maAdenoma
URINARY SYSTEMKidney
Lymphoma malignant lymphocyticLymphoma malignant mixed
Unnary bladderLymphoma malignant mixed
0 0 0 0 0 0 0 0 0 0 0 0 0 0 0
0 0 0 0 0 0 0 0 0 0 0 0 0 0 03 4 4 4 5 > 5 6 6 6 7 7 7 8 85 2 3 5 2 3 5 2 4 5 1 3 4 1 2
+ +
+ 4 - 4 - 4 - 4 + + + + + + + + + +
X
X
M M M M M M M M M M M M M M M
X
0 0 0 0 0 0 0 0 0 0
0 0 0 0 0 0 0 1 1 18 8 8 9 9 9 9 0 0 03 4 5 1 2 4 5 1 3 5
+ + + + M
M M M M M M M + M M
X X
+ + + + + ^ + + + + + + + + + + + + + + + + + +
XX
X
+ + + + + ^ + + + + + + + + +
X
X
+• M
XX
+ + + + + + + + + +
TOTALTISSUESTUMORS
125048
11111111
49112
382
150
2
1152
50
50
50212
4350
14412
4911
481
123 2,4-Dichlorophenol, NTP TR 353
c
-

TABLE C2. INDIVIDUAL ANIMAL TUMOR PATHOLOGY OF MALE MICE IN THE TWO-YEAR FEEDSTUDY OF 2,4-DICHLOROPHENOL: LOW DOSE
WEEKS ONSTUDY
CARCASSID
ALIMENTARY SYSTEMIntestine largeIntestine small
Jejunum, Peyer's patch, lymphomamalignant mixed
LiverHe ma ngiosarco maHemangiosarcoma, multipleHepatocellular carcinomaHepatocellular adenomaLymphoma malignant histiocytic
MesenteryStomach
CARDIOVASCULAR SYSTEMHeart
Alveolar/bronchiolar carcinoma,metastatic, lung
ENDOCRINE SYSTEMNone
GENERAL BODY SYSTEMNone
GENITAL SYSTEMPenisPreputial glandProstateSeminal vesicleTestes
Interstitial cell, adenoma
HEMATOPOIETIC SYSTEMBloodLymph node
Axillary, lymphoma malignanthistiocytic
Lumbar, lymphoma malignant histiocyticMesentenc, lymphoma malignant
histiocyticPancreatic, lymphoma malignant
histiocytic
Lymphoma malignant histiocytic
INTEGUMENTARY SYSTEMSkin
Subcutaneous tissue, fibromaSubcutaneous tissue, fibrosarcomaSubcutaneous tissue, sarcomaSubcutaneous tissue, sarcoma, multipleTail, subcutaneous tissue, sarcoma
MUSCULOSKELETAL SYSTEMBoneSkeletal muscle
Fibrosarcoma, metastatic, skin
NERVOUS SYSTEMBrain
Lymphoma malignant histiocytic
RESPIRATORY SYSTEMLung
Alveolar/bronchiolar adenoma, multipleAlveolar/bronchiolar carcinomaAlveolar/bronchiolar carcinoma.
metastatic, lungFibrosarcoma, metastatic, skin
SPECIAL SENSES SYSTEMHardenan gland
Adenoma
URINARY SYSTEMKidney
Fibrosarcoma, metastatic, skinUrethraUnnary bladder
0 0 0 0 0 0 0 0 0 0 0 0 0 0 0 0 1 1 1 1 1 1 1 1 11 2 5 6 6 6 7 7 8 9 9 9 9 9 9 9 0 0 0 0 0 0 0 0 05 0 7 7 8 9 3 9 8 3 4 5 6 7 8 9 3 4 5 5 5 5 5 5 5
2 2 2 2 2 2 3 2 2 2 2 2 2 2 2 3 2 2 2 2 2 2 2 2 24 6 2 4 5 2 0 8 9 8 4 7 9 1 8 0 5 5 1 1 1 1 2 2 24 1 5 2 1 1 4 4 2 3 3 2 4 2 5 5 4 2 1 3 4 5 2 3 4
4A
XX
X X X XX
X
+
+
X
4 M + ++ + +
4 44X
Mf + 4- 4- 4 4-
X
+ + + + 4- 4- 4- + 4 4- 4 + 4X
X X XX X X
X
M M M M M M M ^ M 4 4 4 4 4 4 M + 4 4 4 4 4 44
X
+X
4 4 4
X
XX
-1 +X
4- 4- 4 - 4 - 4X
4 4A 4 A 4 4
2,4-Dichlorophenol, NTP TR 353 124
-
-
--
-
-
-
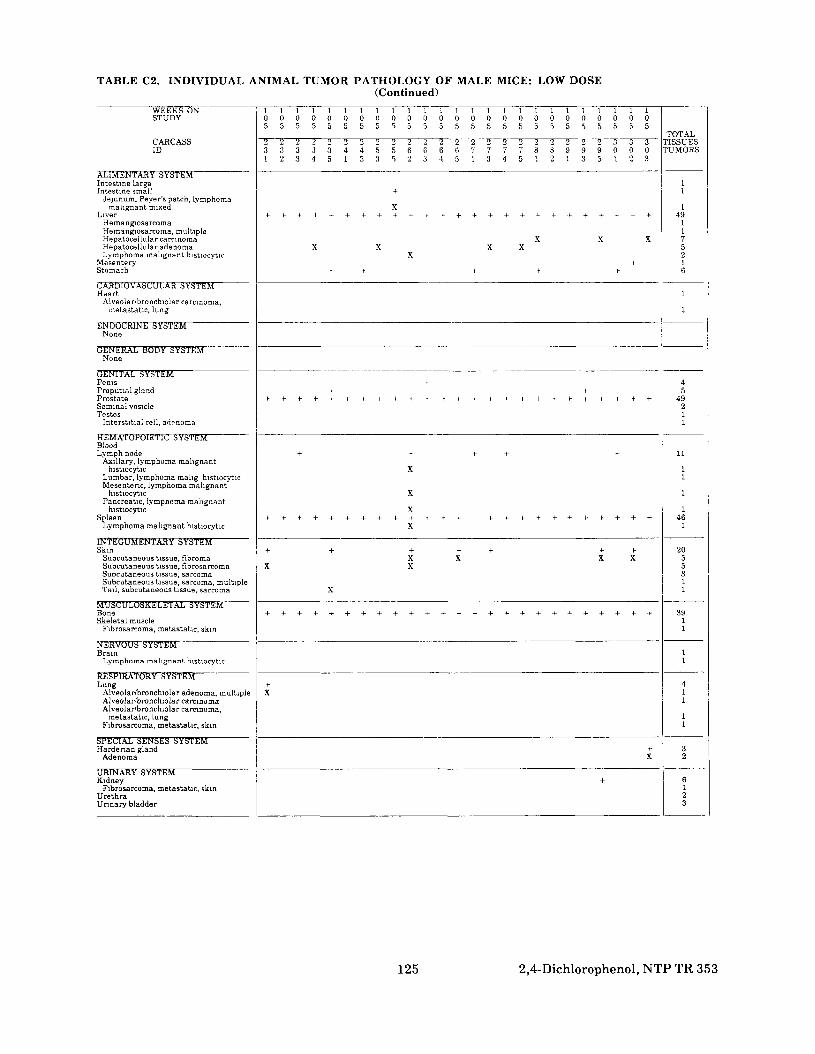
TABLE C2. INDIVIDUAL ANIMAL TUMOR PATHOLOGY OF MALE MICE: LOW DOSE(Continued)
WEEKS ONSTUDY
CARCASSID
ALIMENTARY SYSTEMIntestine largeIntestine small
Jejunum, Peyer's patch, lymphomamalignant mixed
LiverHemangiosarcomaHemangiosarcoma, multipleHepatocellular carcinomaHepatocellular adenomaLymphoma malignant histiocytic
MesenteryStomach
CARDIOVASCULAR SYSTEMHeart
Alveolar/bronchiolar carcinoma,metastatic, lung
ENDOCRINE SYSTEMNone
GENERAL BODY SYSTEMNone
GENITAL SYSTEMPenisPreputial glandProstateSeminal vesicleTestes
Interstitial cell, adenoma
HEMATOPOIETIC SYSTEMBloodLymph node
Axillary, lymphoma malignanthistiocytic
Lumbar, lymphoma mallg histiocyticMesentenc, lymphoma malignant
histiocyticPancreatic, lymphoma malignant
histiocyticSpleen
Lymphoma malignant histiocytic
INTEGUMENTARY SYSTEMSkm
1 1 1 1 1 1 1 1 1 10 0 0 0 0 0 0 0 0 05 5 5 5 5 5 5 5 5 5
2 2 2 2 2 2 2 2 2 23 3 3 3 3 4 4 5 5 61 2 3 4 5 1 5 3 5 2
4
X
X XX
4- 4-
l l l l l l l l l l l l l l l0 0 0 0 0 0 0 0 0 0 0 0 0 0 05 5 5 5 5 5 5 5 5 5 5 5 5 5 5
2 2 2 2 2 2 2 2 2 2 2 2 3 3 36 6 6 7 7 7 7 8 8 9 9 9 0 0 03 4 5 1 3 4 5 1 2 1 3 5 1 2 3
X X XX X
44 - 4 4-
+
4- 4-
X
X
X
X
4 - 4 - 4-Subcutaneous tissue, fibroma XSubcutaneous tissue, fibrosarcomaSubcutaneous tissue, sarcomaSubcutaneous tissue, sarcoma, multipleTail, subcutaneous tissue, sarcoma
MUSCULOSKELETAL SYSTEMBoneSkeletal muscle
Fibrosarcoma, metastatic, skin
NERVOUS SYSTEMBrain
Lymphoma malignant histiocytic
RESPIRATORY SYSTEMLung
Alveolar/bronchiolar adenoma, multipleAlveolar/bronchiolar carcinomaAlveolar/bronchiolar carcinoma.
metastatic, lungFibrosarcoma, metastatic, skin
SPECIAL SENSES SYSTEMHardenan gland
Adenoma
URINARY SYSTEMKidney
Fibrosarcoma, metastatic, skinUrethraUnnary bladder
X X
X
44
4 - 4 4 - 4 - 4 - 4 - 4 4 4 - 4 - 4 - 4 - 4 4 4
4 - 4 - 4-
4 4- 4 - 4 -X X X
4X
4X
4
TOTALTISSUESTUMORS
11
1491175216
1
1
45
49211
11
11
1
1461
2055311
3911
11
411
11
32
6123
125 2,4-Dichlorophenol, NTP TR 353
--
-
-
-
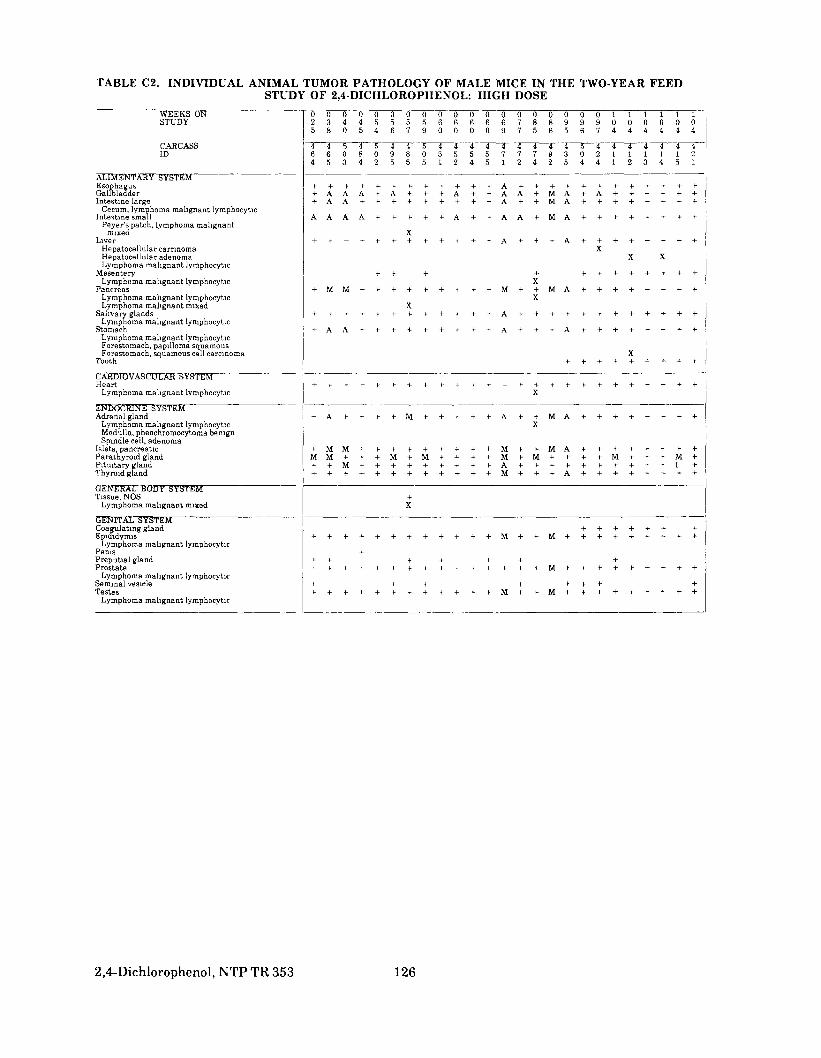
TABLE C2. INDIVIDUAL ANIMAL TUMOR PATHOLOGY OF MALE MICE IN THE TWO-YEAR FEEDSTUDY OF 2,4-DICHLOROPHENOL: HIGH DOSE
WEEKS ONSTUDY
CARCASSID
ALIMENTARY SYSTEMEsophagusGallbladderIntestine large
Cecum, lymphoma malignant lymphocyticIntestine small
Peyer's patch, lymphoma malignantmixed
LiverHepatocellular carcinomaHepatocellular adenomaLymphoma malignant lymphocytic
MesenteryLymphoma malignant lymphocytic
PancreasLymphoma malignant lymphocyticLymphoma malignant mixed
Salivary glandsLymphoma malignant lymphocytic
StomachLymphoma malignant lymphocyticForestomach, papilloma squamousForestomach, squamous cell carcinoma
Tooth
CARDIOVASCULAR SYSTEMHeart
Lymphoma malignant lymphocytic
SNDOCR1NE SYSTEMAdrenal gland
Lymphoma malignant lymphocyticMedulla, pheochromocytoma benignSpindle ceil, adenoma
Islets, pancreaticParathyroid glandPituitary glandThyroid gland
GENERAL BODY SYSTEMTissue, NOS
Lymphoma malignant mixed
GENITAL SYSTEMCoagulating glandEpididymis
Lymphoma malignant lymphocyticPenisPreputial glandProstate
Lymphoma malignant lymphocyticSeminal vesicleTestes
Lymphoma malignant lymphocytic
0 0 0 0 0 0 0 0 0 0 0 0 0 0 0 0 02 3 4 4 5 5 5 5 6 6 6 6 6 7 8 8 95 8 0 5 4 6 7 9 0 0 0 0 9 7 5 6 5
4 4 5 4 5 4 4 5 4 4 4 4 4 4 4 4 46 6 0 8 0 9 8 0 5 5 5 5 7 7 7 9 34 5 3 4 2 5 5 5 L 2 4 5 1 2 4 2 5
+ A A A + A -T + + A + + A A + M A
A A A A + + 4 + + A + 4 - A A + M A
X+ + + + + + + + + + + + A + + + A
-f- + + +X
XX
0 0 1 1 1 1 1 19 9 0 0 0 0 0 0
0 2 1 1 1 1 1 24 4 1 2 3 4 5 1
+ A + + + + + +
XX X
+ + <- + + + + +
X+ + + + + + + +
X
+ A f + + + M + + + + + A + + M AX
+ + + + + + + H + + + + M + + . , A
+ + M + + + M +4 + + + + + I +
X
f+ -t + + + +
+ -t + + +
+
+ + +
2,4-Dichlorophenol, NTP TR 353 126
-
-
-.
--
-
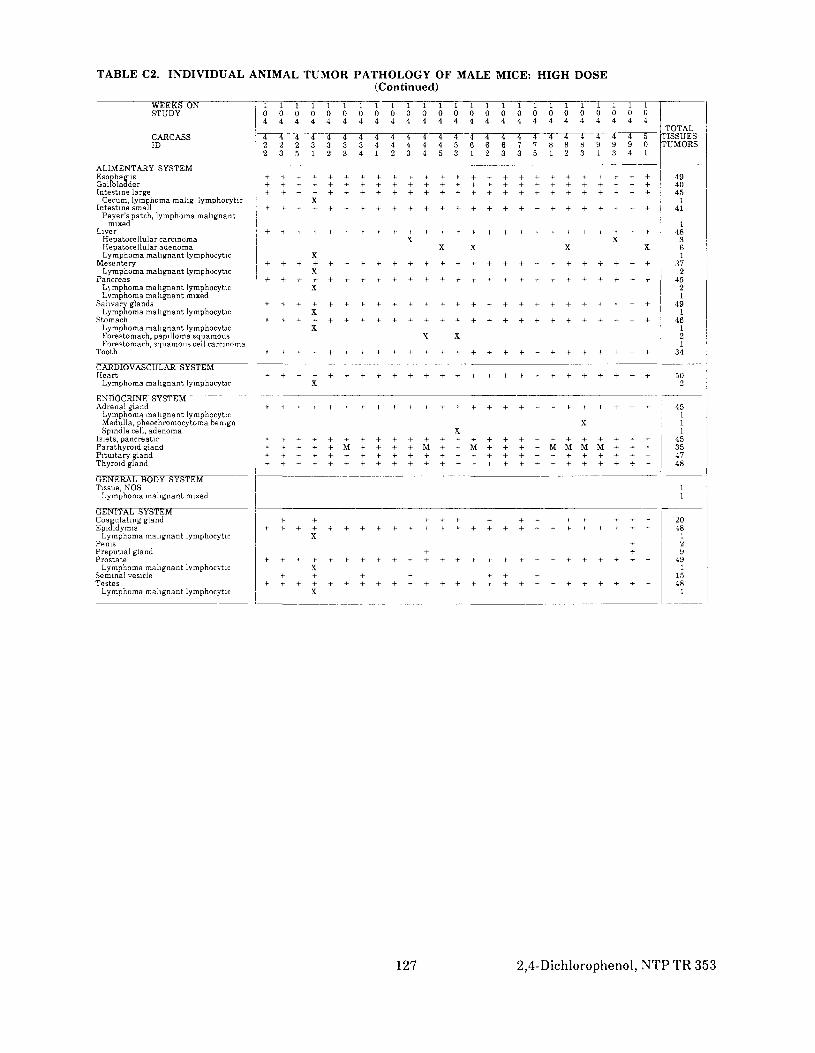
TABLE C2. INDIVIDUAL ANIMAL TUMOR PATHOLOGY OF MALE MICE: HIGH DOSE(Continued)
WEEKS ONSTUDY
CARCASSID
ALIMENTARY SYSTEMEsophagusGallbladderIntestine large
Cecum, lymphoma mahg lymphocyticIntestine small
Peyer's patch, lymphoma malignantmixed
LiverHepatocellular carcinomaHepatocellular adenomaLymphoma malignant lymphocytic
MesenteryLymphoma malignant lymphocytic
PancreasLymphoma malignant lymphocyticLvmphoma malignant mixed
Salivary glandsLymphoma malignant lymphocytic
StomachLymphoma malignant lymphocyticForestomach, papilloma squamousForestomach, squamous cell carcinoma
Tooth
CARDIOVASCULAR SYSTEMHeart
Lymphoma malignant lymphocytic
ENDOCRINE SYSTEMAdrenal gland
Lymphoma malignant lymphocyticMedulla, pheochromocytoma benignSpindle cell, adenoma
Islets, pancreaticParathyroid glandPituitary glandThyroid gland
GENERAL BODY SYSTEMTissue, NOS
Lymphoma malignant mixed
GENITAL SYSTEMCoagulating glandEpididymis
Lymphoma malignant lymphocyticPenisPreputial glandProstate
Lymphoma malignant IvmphocyticSeminal vesicleTestes
Lymphoma malignant lymphocytic
1 1 1 1 1 1 1 1 1 1 1 1 1 1 1 1 1 1 1 1 1 1 1 1 10 0 0 0 0 0 0 0 0 0 0 0 0 0 0 0 0 0 0 0 0 0 0 0 0
2 3 5 1 2 3 4 1 2 3 4 5 3 1 2 3 3 5 1 2 3 1 3 4 1
X
X XX X X X
X
X
X
X
XX X
X
XX
+ + + + + M + + + + M + + M+ + + + M M M M + + +
X4
4- 4-
X4- + + + 4 - 4 - 4 -
X
TOTALTISSUESTUMORS
494045
141
148361
372
4521
491
46121
34
502
45111
45354748
11
2048129
491
1548
1
127 2,4-Dichlorophenol, NTP TR 353
-

TABLE C2. INDIVIDUAL ANIMAL TUMOR PATHOLOGY OF MALE MICE: HIGH DOSE(Continued)
WEEKS ONSTUDY
CARCASSID
tfEMATOPOlETIC SYSTEMBloodBone marrowLymph node
Mandibular, lymphoma malignantlymphocytic
Mandibular, lymphoma malignant mixedMesentenc, lymphoma malignant mixedPancreatic, lymphoma malignant
lymphocyticSpleen
Lymphoma malignant lymphocyticLymphoma malignant mixed
ThymusLymphoma malignant lymphocyticLymphoma malignant mixed
INTEGUMENTARY SYSTEMMammary glandSkin
Papilloma squamousSubcutaneous tissue, fibromaSubcutaneous tissue, fibroma, multipleSubcutaneous tissue, fibrosarcomaSubcutaneous tissue, lymphoma
malignant lymphocyticSubcutaneous tissue, sarcoma
MUSCULOSKELETAL SYSTEMBone
NERVOUS SYSTEMBrain
RESPIRATORY SYSTEMLung
Alveolar/bronchiolar adenomaAlveolarforonchiolar carcinomaLymphoma malignant lymphocyticLymphoma malignant mixed
NoseTrachea
SPECIAL SENSES SYSTEMEyeHardenan gland
Adenoma
URINARY SYSTEMKidney
Lymphoma malignant lymphocyticUnnary bladder
Lymphoma malignant lymphocytic
0 0 0 0 0 0 0 0 0 0 0 0 0 0 0 0 0 0 0 1 1 1 1 1 12 3 4 4 5 5 5 5 6 6 6 6 6 7 8 8 9 9 9 0 0 0 0 0 0
6 6 0 8 0 9 8 0 5 5 5 5 7 7 7 9 3 0 2 1 1 1 1 1 24 5 3 4 2 5 5 5 1 2 4 5 1 2 4 2 5 4 4 1 2 3 4 5 1
XX
X
XX
XX
M M M M M M M M M M M M M M M M M M M M M M M M M
X
+ . + + + + + + + + + + + + + + + + + + + + + + +
+ ^ + + + ^ + + + + + + + + + + + + + + + + + + +X X
XM M M M M M M M M M M M M M M M + i + + + + + + +•
4 + + + + + +
X X
X
2,4 Dichlorophenol, NTP TR 353 128
-
-

TABLE C2. INDIVIDUAL ANIMAL TUMOR PATHOLOGY OF MALE MICE: HIGH DOSE(Continued)
WEEKS O N I l l l l l l l l l l l L l l LSTUDY | 0 0 0 0 0 0 0 0 0 0 0 0 0 0 0
CARCASSID
KEMATOPOIETIC SYSTEMBloodBone marrowLymph node
Mandibular, lymphoma malignantlymphocytic
Mandibular, lymphoma mahg mixedMesentenc, lymphoma malignant mixedPancreatic, lymphoma malignant
lymphocvticSpleen
Lymphoma malignant lymphocyticLvmphoma malignant mixed
ThymusLymphoma malignant lymphocyticLymphoma malignant mixed
INTEGUMENTARY SYSTEMMammary glandSkin
Papilloma sqnamousSubcutaneous tissue, fibromaSubcutaneous tissue, fibroma, multipleSubcutaneous tissue, fibrosarcomaSubcutaneous tissue, lymphoma
malignant IvmphocyticSubcutaneous tissue, sarcoma
MUSCULOSKELETAL SYSTEMBone
NERVOUS SYSTEMBrain
RESPIRATORY SYSTEMLung
Alveolar/bronchiolar adenomaAlveolar'bronchiolar carcinomaLvmphoma malignant IvmphocyticLvmphoma malignant mixed
NoseTrachea
SPECIAL SENSES SYSTEMEyeHardenan gland
Adenoma
URINARY SYSTEMKidney
Lymphoma malignant lymphocyticUrinary bladder
Lymphoma malignant lymphocytic
4 4 4 4 4 4 4 4 4 4 4 4 4 4 42 2 2 3 3 3 3 4 4 4 4 4 T> 6 62 3 5 1 2 3 4 1 2 3 4 5 3 1 2
___ . _ _ __ . _
+ + + +
X
X X
X
M M M M M M M M M M M M M M M
XX
X
X
i i i i i i i i 1 10 0 0 0 0 0 0 0 0 0
4 4 4 4 4 4 4 4 4 56 7 7 8 8 8 9 9 9 03 3 5 1 2 3 1 3 4 1
___ _____ _ _____
+ 4
+ + + + - ^ + f + + +
+ M + + + + + M + +
M M M M M M M M M M
X
X
X X X
X X
+
X
X X
X
+ + + + + + + + + +
X
TOTALTISSUESTUMORS
64947
111
14731
38
1
491211
11
50
50
503221
3448
130
4
493
461
129 2,4-Dichlorophenol, NTP TR 353
-
— — —-————— ———•
_____——— _____—

TABLE C3. ANALYSIS OF PRIMARY TUMORS IN MALE MICE IN THE TWO YEAR FEED STUDY OF2,4-DICHLOROPHENOL
Harderian Gland: AdenomaOverall Rates (a)Adjusted Rates (b)Terminal Rates (c)Day of First ObservationLife Table Tests (d)Logistic Regression Tests (d)Cochran-Armitage Trend Test (d)Fisher Exact Test (d)
Harderian Gland: Adenoma or AdenocarcinomaOverall Rates (a)Adjusted Rates (b)Terminal Rates (c)Day of First ObservationLife Table Tests (d)Logistic Regression Tests (d)Cochran-Armitage Trend Test (d)Fisher Exact Test (d)
Liver: Hepatocellular AdenomaOverall Rates (a)Adjusted Rates (b)Terminal Rates (c)Day of First ObservationLife Table Tests (d)Logistic Regression Tests (d)Cochran-Armitage Trend Test (d)Fisher Exact Test (dl
Liver: Hepatocellular CarcinomaOverall Rates (a)Adjusted Rates (b)Terminal Rates (c)Day of First ObservationLife Table Tests (d)Logistic Regression Tests (d)Cochran-Armitage Trend Test (d)Fisher Exact Test (d)
Liver: Hepatocellular Adenoma or CarcinomaOverall Rates (a)Adjusted Rates (b)Terminal Rates (c)Day of First ObservationLife Table Tests (d)Logistic Regression Tests (d)Cochran-Armitage Trend Test (d)Fisher Exact Test (d)
Lung: Alveolar/Bronchiolar AdenomaOverall Rates (a)Adjusted Rates (b)Terminal Rates (c)Day of First ObservationLife Table Test (d)Logistic Regression Test (d)Fisher Exact Test (d)
Control
2/50(4%)6.1%2/33 (6%)727P 0.227P 0.227P 0252
3/50(6%)9 1%3/33(9%)727P 0385P 0.385P 0417
4/50(8%)12.1%4/33(12%)727P 0.267P 0.267P 0.285
7/50(14%)18.6%4/33(12%)605P 0.203NP 0.209NP 0.151N
10/50(20%)27 0%7/33(21%)605P 0.541P 0.430P 0.492N
2/50 (4%)6.1%2/33 (6%)727
5,000 ppm
2/50 (4%)6.3%2/32(6%)727P=0.685P 0.685
P 0.691
2/50 (4%)6.3%2/32(6%)727P 0.514NP 0.514N
P 0.500N
5/49(10%)15.6%5/32(16%)727P 0.480P 0.480
P 0.487
7/49(14%)18.7%3/32 (9%)665P 0567P 0.587
P 0.597
12/49(24%)327%8/32(25%)665P 0.364P 0.352
P 0384
(e) 1/4(25%)
10,000 ppm
4/50(8%)12.9%4/31(13%)727P 0.307P 0.307
P 0.339
4/50(8%)12.9%4/31 (13%)727P 0.465P 0.465
P 0.500
6/48(13%)19.4%6/31(19%)727P 0.327P 0.327
P 0.344
3/48(6%)9.4%2/31(6%)675P 0.222NP 0.242N
P 0.176N
9/48(19%)28.1%8/31(26%)675P 0.592NP 0.494
P 0540N
3/50(6%)9.7%3/31 (10%)727P 0.471P 0471P 0.500
2,4-Dichlorophenol, NTP TR 353 130
= = =
= = =
= = =
= = =
= = =
=
=
= =
=
= =
=
= =
=
= =
=
= =
=
= =
=
= =
=
= =
=
= =
=
= = =

--
TABLE C3. ANALYSIS OF PRIMARY TUMORS IN MALE MICE IN THE TWO-YEAR FEED STUDY OF 2,4-DICHLOROPHENOL (Continued)
Control 5,000 ppm
Lung: AlveolarlBronchiolar Adenoma or Carcinoma Overall Rates ( a ) ,Adjusted Rates tb) Terminal Rates (c) Day of First Observation Life Ta.ble Test Id) Logistic Regression Test td) Fisher Exact Test ( d )
Subcutaneous Tissue: Fibroma Overall Rates (al kdjusted Rates (b) Terminal Rates ( c ) Day of First Observation Life Table Tests (d ) Logistic Regression Tests td) Cochran-Armitage Trend Test ( d ) Fisher Exact Test td)
Subcutaneous Tissue: Fibrosarcoma Overa11 Rates ( a ) Adjusted Rates tb) 'Terminal Rates (cl Day of First Observation Life Table Tests (d ) Logistic Regression Tests td) Cochran-Armitage Trend Test tdl Fisher Exact Test ( d )
Subcutaneous Tissue: Fibroma or Fibrosarcoma Overall Rates ( a ) Adjusted Rates t b 1 Terminal Rates ( c ) Day of First Observation Life Table Tests (d) Logistic Regression Tests td) Cochran-Armitage Trend Test (d ) Fisher Exact Test td)
Subcutaineous Tissue: Sarcoma Overall Rates tal Adjuskd Rates (bl Terminal Rates ( c ) Day ol'First Observation Life Table Tests td) Logistic Regression Tests tdl Cochran-Armrtage Trend Test td) Fisher Exact Test td)
Subcutaneous Tissue: Sarcoma or Fibrosarcoma Overall Rates tal iZdjusted Rates (b ) Terminal Rates tc) [lay oEFirst Observation Life Table Tests td) Logistic Regression Tests td) Cochran-Armitage Trend Test ( d ) Fisher Esact Test td)
3/50 (6%) (e) 2/4 (50%) 9.1% 3/33 (9%) 727
2/50 (4%) 5/50 (10%) 6.1% 15.6% 2/33 (6%) 5/32 (16%) 727 727 P=0.387 P=0.201 P=0.387 P =0.201 P =0.421
P=0.218
1/50 (2%) 5/50(10%) 2.6% 13.3% 0/33 (0%) 2/32 (6%) 687 510 P =0.535 P = 0.099 P =0.562 P=0.103 P =0.594
P=0.102
3/50 (6%) 9/50 (18%) 8.5% 24.9% 2/33 (6%) 6/32(19%) 687 510 P=0.374 P=0.058 P=0.320 P =0.054 P =0.436
P =0.061
7/50 (14%) 5/50 (10%) 16.9% 13.7% 1/33 ( 3 % ) 2/32 (6%) 65 1 547 P =0.050N P=0.432N P =0.034N P=0.388N P=0.025N
P=0.380N
8/50 ( 16%I 10/50 (20%) 19.1% 25.5% 1/33 (3%) 4/32 (13%) 65 1 510 P=0.106N P =0.356 P=0.072N P =0.389 P =0.053s
P=0.398
10,000 ppm
5/50 (10%) 16.1% 5/31 (16%) 727 P=0.320 P=0.320 P=0.357
3/50 (6%) 9.7% 3/31 (10%) 727 P=0.471 P=0.471
P =0.500
1/50(2%) 3.2% 1/31 (3%) 727 P=0.731 P=0.724
P=0.753N
4/50 (8%I 12.9% 4/31 (13%) 727 P =0.455 P =0.398
P=0.500
1/50(2%) 3.2% 1/31 (3%) 727 P = 0.063N P =0.046N
P =0.030N
2/50 (4%I 6.5% 2/31 (6%) 727 P =0.092N P =0.07 1 N
P =0.046N
131 2,4-Dichlorophenol, NTP TR 353

_____
---
TABLE (23. ANALYSIS OF PRIMARY TUMORS IN MALE MICE IN THE TWO-YEAR FEED STUDY OF 2,4-DICHLOROPHENOL (Continued)
~~
Control 5,000 ppm 10,000 ppm
Subcutaneous Tissue: Fibroma, Sarcoma, or Fibrosarcoma Overall Rates (al 1060 (20%) 14/50 (28%) 5/50 (10%) Adjusted Rates (b) 24.1% 36.1% 16.1% Terminal Rates (c) 3/33 (9%) 8/32 (25%) 5/31 (16%) Day of First Observation 651 510 727 Life Table Tests (d) P=0.215N P=0.220 P =0.21 1N Logistic Regression Tests (dl P = 0.209N P=0.221 P =0.219N Cochran-Armitage Trend Test td) P=0.127N Fisher Esact Test (dl P=0.241 P=O. l3 lK
Forestomach: Squamous Papilloma or Squamous Cell Carcinoma Overall Rates (a ) 0/50 (0%) (D 0/50(0%) 3/50 (6%) Adjust.ed Rates (b) 0.0% 0.0% 9.7% Terminal Rates (c) 0133 (0%) 0132 ( 0 % ) 3/31 (10%) Day of First Observation 727 Life Table Tests td) P =0.033 (g ) P=O.110 Logistic Regression Tests (d) P =0.033 (g) P=O.110 Cochran-Armitage Trend Test (d) P=0.037 Fisher Esact Test (d) (g ) P=0.121
Hematopoietic System: Lymphoma, All Malignant Overall Rates ( a ) 3/50 (6%) 3/50 (6%) 4/50 ( 8 % ) Adjusted Rates (bl 7.2% 8.2% 11.1% Terminal Rates ( c ) 1/33 (3%) 2/32 (6%) 2/31 (6%) Day of First Observation 575 469 394 Life Table Tests (d) P =0.354 P =0.637 P =0.423 Logistic Regression Tests td) P=0.456 P=0.653N P =0.539 Cochran-Armitage Trend Test (d ) P=0.421 Fisher Exact Test (d ) P =0.661N P =0.500
( i i i Xumber of tumor-bearing animals/number of animals examined at the site (1); Kaplan-Meier estimated tumor incidences at the end of the study after adjusting for intercurrent mortality ( ( )Observed tumor incidence at terminal kill ( ( 1 ; Beneath the control incidence are the P values associated with the trend test. Beneath the dosed group incidence are the P values corresponding to pairwise comparisons between that dosed group and the controls. The life table analysis regards tumors in animals dying prior to terminal kill as being (directly or indirectly) the cause of death. The logistic regression test regards these lesions as nonfatal. The Cochran-Armitage and Fisher exact tests compare directly the overall incidence rates. .A negative trend or lower incidence in a dosed group is indicated by (N). ( I ! ) Incomplete sampling oftissues Ii’) Gross lesions: and target organs in low dose group esamined according t o protocol (see Table 6) ; seven stomachs were es- ani ined microscopically. ii: 1 No P value is reported because no tumors were observed in the 5,000-ppm and control groups.
%,4Dichlorophenol,NTP TR 353 132
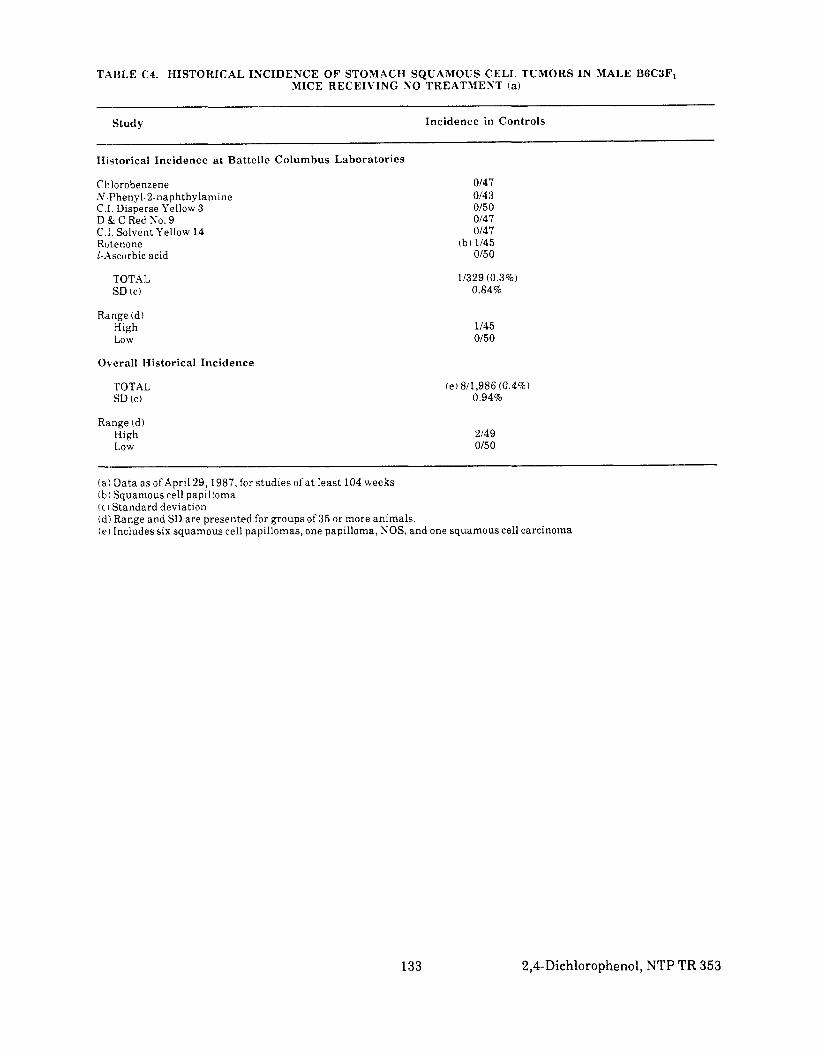
TABLE C 4 . HISTORICAL INCIDENCE OF STOMACH SQUAMOUS CELL TUMORS IN MALE B6C3F1 MICE RECEIVING NO TREATMENT (a)
Study Inc idence in Controls
Historical Inc idence a t Battelle Columbus Labora tor ies
Chlorobenzene 0147 N Phenyl-2-naphthylamine 0143 C.I. Disperse Yellow 3 0/50 D & C Red No. 9 0147 C.I. Solvent Yellow 14 0147 Rotenone (b, 1/45 I-Ascorbic acid 0150
TOTAL 1/329 (0.3%) SD (c) 0.84%
Range (d) High 1/45 Low 0150
Overall Historical Inc idence
TOTAL ( e )811,986 (0.4%) SD (ci 0.94%
Range (d) High 2/49 Low 0150
( a i Data as ofApril 29,1987, for studies ofat least 104 weeks ( h )Squamous cell papilloma ( c 1 Standard deviation ( d )Range and SD are presented for groups of 35 or more animals. ( e )Includes six squamous cell papillomas, one papilloma, NOS, and one squamous cell carcinoma
133 2,4-Dichlorophenol,NTP TR 353
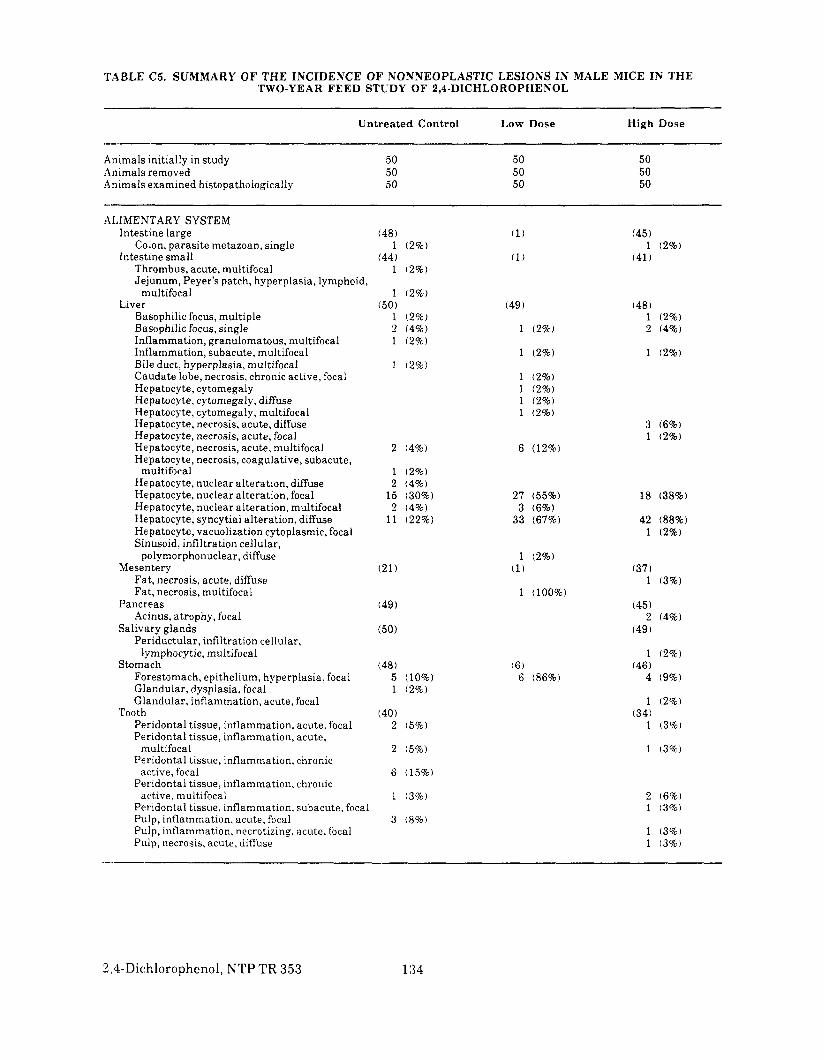
TABLE C5. SUMMARY OF THE INCIDENCE OF NONNEOPLASTIC LESIONS I N MALE MICE IN THE TWO-YEAR FEED STUDY OF P94-DICHLOR0PHENOL
Untrea ted Control Low Dose High Dose
Animals initially in study Animals removed Animals examined histopathologically
ALIMENTARY SYSTEM Intestine large
Colon, parasite metazoan, single Intestine small
Thrombus, acute, multifocal Jejunum, Peyer's patch, hyperplasia, lymphoid,
multifocal Liver
Basophilic focus, multiple Basophilic focus, single Inflammation, granulomatous, multifocal Inflammation, subacute, multifocal Bile duct, hyperplasia, multifocal Caudate lobe, necrosis, chronic active, focal Hepatocyte, cytomegaly Hepatocyte, cytomegaly, diffuse Hepatocyte, cytomegaly, multifocal Hepatocyte, necrosis, acute, diffuse Hepatocyte, necrosis, acute, focal Hepatocyte, necrosis, acute, multifocal Hepatocyte, necrosis, coagulative, subacute,
multifocal Hepatocyte, nuclear alteration, diffuse Hepatocyte, nuclear alteration, focal Hepatocyte, nuclear alteration, multifocal Heipatocyte, syncytial alteration, diffuse Hepatocyte, vacuolization cytoplasmic, focal Sinusoid, infiltration cellular,
polymorphonuclear, diffuse Mesentery
Fat, necrosis, acute, diffuse Fat, necrosis, multifocal
Pancreas Acinus, atrophy, focal
Salivary glands Periductular, infiltration cellular,
lymphocytic, multifocal Stomi2ch
Forestomach, epithelium, hyperplasia, focal Glandular, dysplasia, focal Glandular, inflammation, acute, focal
Tooth Peridontal tissue, inflammation, acute, focal Peridontal tissue, inflammation, acute,
multifocal Peridontal tissue, inflammation, chronic
a.ctive, focal Peridontal tissue, inflammation, chronic
a.ctive, multifocal Pemridontal tissue, inflammation, subacute, focal Pulp, inflammation, acute, focal Pulp, inflammation, necrotizing, acute, focal Pulp, necrosis, acute, diffuse
50 50 50 50 50 50 50 50 50
(48)
(44) 1 (2%)
1 (2%)
(1)
(1)
1 (2%)
1 (2%) 2 (4%)
(50) (49)
1 (2%)
(48) 1 (2%) 2 (4%)
1 (2%) 1 (2%) 1 (2%)
1 (2%) 1 (2%) 1 (2%) 1 (2%)
2 (4%)
1 (2%)
6 (12%)
3 1
(6%) (2%)
1 (2%) 2 (4%)
15 (30%) 2 (4%)
11 (22%)
27 (55%) 3 (6%)
33 (67%)
18 (38%)
42 (88%) 1 (2%)
(21) 1 (2%)
(1)
1 (100%)
(37 ) 1 (3%)
(49)
(50)
(45)
(49) 2 (4%)
(48) 5 (10%) 1 (2%)
( 6 ) 6 (86%)
1 (2%)
4 (9%)(46)
1 (2%) (40)
2 (5%) 1 (3%)(34)
2 (5%) 1 (3%)
6 (15%)
1 (3%) 2 (6%) 1 (3%)
3 (8%) 1 (3%) 1 (3%)
:2,4-Dichlorophenol,NTP TR 353 134

TABLE C5. SUMMARY OF THE INCIDENCE OF NONNEOPLASTIC LESIONS IN MALE MICE IN THE TWO-YEAR FEED STUDY OF 2,4-DICHLOROPHENOL (Continued)
Untreated Control Low Dose High Dose
DOCRINE SYSTEM '4E
CARDIOVASCULAR SYSTEM Heart
Myocardium, inflammation, acute, multifocal Myocardium, inflammation, chronic, focal Myocardium, inflammation, subacute, multifocal Myocardium, inflammation, suppurative, acute,
focal Ventricle right, necrosis, chronic, focal
-I-
Adrenal gland Accessory adrenal cortical nodule Accessory adrenal cortical nodule, focal Cortex, degeneration, fatty, focal Cortex, focal cellular change Cortex, focal cellular change, multifocal Cortex, hyperplasia, focal Cortex, hypertrophy Medulla, hyperplasia, focal Spindle cell, hyperplasia, focal Spindle cell, hyperplasia, multifocal
Parathyroid gland Infiltration cellular, lymphocytic, focal
Pituitary gland Pars distalis, inflammation, acute, focal
rhyroid gland Follicle, cyst, multiple Follicle, cyst, single Follicular cell, hyperplasia, focal Follicular cell, hyperplasia, multifocal
GENERAL BODY SYSTEM None
GENITAL SYSTEM Coagulating gland
Wall, inflammation, acute, multifocal Epididymis
Granuloma sperm, focal Inflammation, chronic, focal Epithelium, inflammation, necrotizing, diffuse
Penis Inflammation, acute, focal
Prepuiial gland Ab:jcess, chronic, focal Abscess, subacute, focal Bihteral , abscess. chronic Bilateral, inflammation. granulomatous,
suppurative, rnultifocal Duct, ectasia, focal Duct, ectasia, multifocal Left, abscess, chronic, focal Right. abscess, chronic, focal Right, abscess, chronic active, focal
(50)
1 (2%)
(49)
1 (2%) 4 (8%) 1 (2%) 3 (6%)
1 (2%)
7 (14%) (38)
1 (3%) (45)
(50)
5 (10%) 1 (2%) 2 (4%)
(4) 1 (25%)
(48) 1 (2%) 1 (2%)
( 5 ) 1 (20%)
(10) 3 (30%)
2 (20%)
1 (10%) 1 (20%) 1 (10%) 1 ( 2 0 % ) 1 (10%) 1 ( 2 0 % )
1 (20%) 1 (10%)
1 (20%)
(50) 1 (2%)
1 (2%)
1 (2%) 1 (2%)
(45) 1 (2%) 1 (2%)
4 (9%)2 (4%) 1 (2%) 3 17%) 1 (2%) 1 (2%)5 (11%)
(35)
(47) 1 (2%)
(48) 2 (4%) 2 (4%)
1 (2%)
(20)
(48)
1 (2%) ( 2 )
1 (50%) ( 9 )
1 (11%) 1 (13%)
2 ( 2 2 % ) 3 (33%)
135 2,4-Dichlorophenol, NTP TR 353
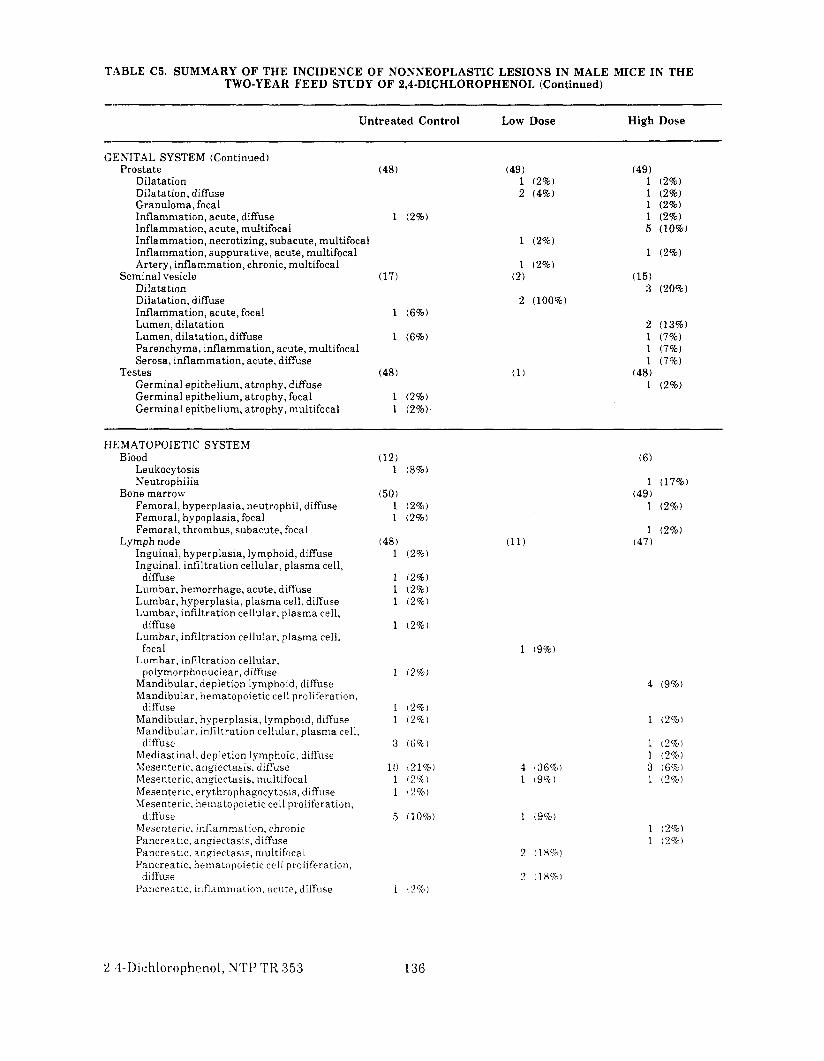
TABLE C5. SUMMARY OF THE INCIDENCE OF NONNEOPLASTIC LESIONS IN MALE MICE IN THE TWO-YEAR FEED STUDY OF !2,4-DICHLOROPHENOL (Continued)
Untreated Control Low Dose High Dose
GENITAL SYSTEM (Continued) Prostate
Dilatation Dilatation, diffuse Granuloma, focal Inflammation, acute, diffuse Inflammation, acute, multifocal Inflammation, necrotizing, subacute, multifocal Inflammation, suppurative, acute, multifocal Artery, inflammation, chronic, multifocal
Seminal vesicle Dilatation Dilatation, diffuse Inflammation, acute, focal Lumen, dilatation Lumen, dilatation, diffuse Parenchyma, inflammation, acute, multifocal Serosa, inflammation, acute, diffuse
Germinal epithelium, atrophy, diffuse Germinal epithelium, atrophy, focal Germinal epithelium, atrophy, multifocal
Testes
(48)
1
(17)
1
1
(48)
1 1
(2%)
(6%)
(6%)
(2%) (2%)
(49)1 (2%) 2 (4%)
1 (2%)
I (2%) (2)
2 (100%)
(1)
(49)1 1 1 1 5
1
(15) 3
2 1 1 1
(48)1
(2%) (2%)(2%) (2%) (10%)
(2%)
(20%)
(13%) (7%) (7%) (7%)
(2%)
HEMATOPOIETIC SYSTEM Blood
Leukocytosis Neutrophilia
Femoral, hyperplasia, neutrophil, diffuse Femoral, hypoplasia, focal
Bone marrow
(12) 1 (8%)
(50) 1 (2%) 1 (2%)
(6)
1 (17%)
1 (2%) (49)
Femoral, thrombus, subacute, focal
Inguinal, hyperplasia, lymphoid, diffuse Inguinal, infiltration cellular, plasma cell,
Lymph node (48)1 (2%)
(11) 1 (2%)
(47)
Lumbar, hemorrhage, acute, diffuse Lumbar, hyperplasia, plasma cell, diffuse Lumbar, infiltration cellular, plasma cell,
diffuse 1 (2%) 1 (2%) 1 (2%)
d.iffuse Lumbar, infiltration cellular, plasma cell,
1 (2%)
focal Lumbar, infiltration cellular,
1 (9%)
polymorphonuclear, diffuse Mandibular, depletion lymphoid. diffuse Mandibular, hematopoietic cell proliferation,
Mandibular, hyperplasia, lymphoid, diffuse Mandibular, infiltration cellular, plasma cell,
Mediastinal, depletion lymphoid, diffuse
diffuse
diffuse
1 12%)
1 ( 2 % ) 1 ( 2 % )
3 (6%)
4 (9%)
1 t2%1
1 12%) 1 ( 2 % )
Mesenteric, angiectasis. diffuse Mesenteric, angiectasis, multifocal
10 (21%) 1 (2%)
1 (36%) 1 (970)
3 (6%) 1 ( 2 % )
Mesenteric, erythrophagocytosis, diffuse Mesenteric, hematopoietic cell proliferation,
;!%)
Mesenteric. inflammation, chronic diffuse 10%) 1 (9%)
1 (2%) Pancreatic, angiectasis, diffuse 1 (270) Pancreatic, angiectasis, muitifocal Pancreatic, hematopoietic cell proliferation,
ditl’use Pancreatic, inflammalion. acute, difffise 2% 1
2,4-Dichlorophenol, YTP T R 353 136
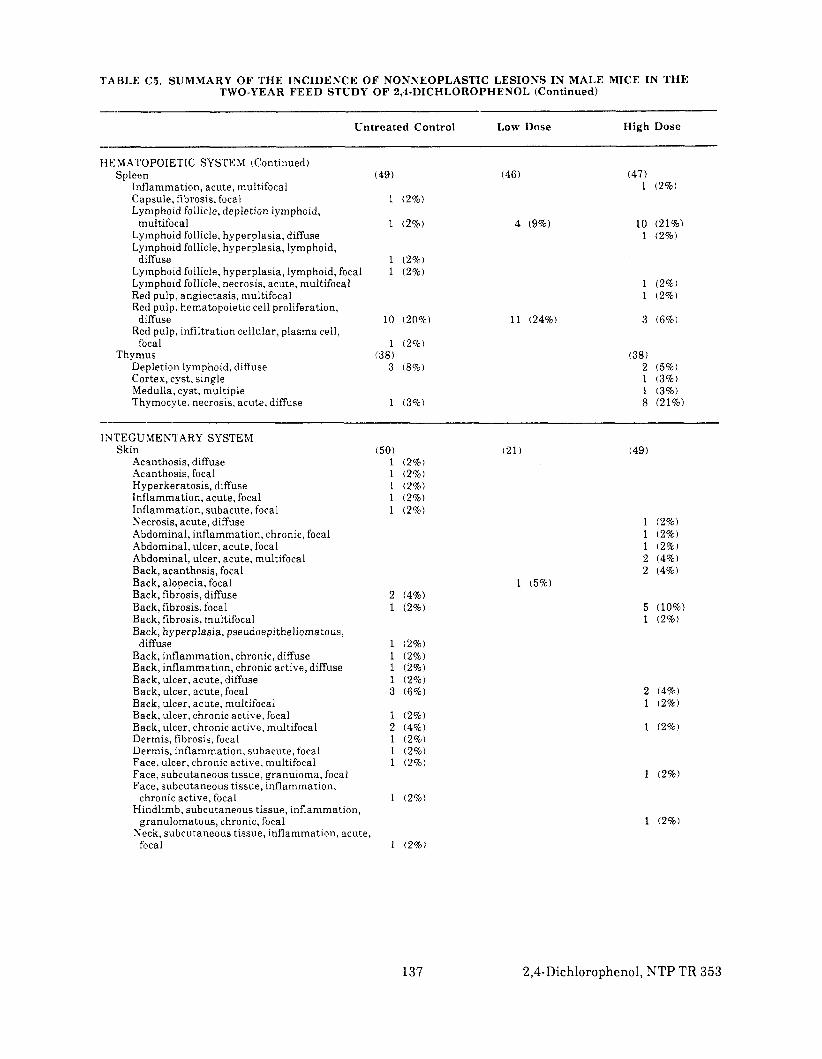
T 4 B L E (15. SUMMARY OF T H E INCIDENCE OF NONNEOPLASTIC LESIONS IN MALE MICE I N T H E TWO-YEAR F E E D STUDY OF 2,I-IIICHLOROPHENOL (Continued)
Unt rea ted Control Low Dose High Dose
IlEMATOiPOIETIC SYSTEM (Continued) Spleen
Inflammation, acute, multifocal Capsule, fibrosis, focal Lymphoid follicle, depletion lymphoid,
multifocal Lymphoid follicle, hyperplasia, diffuse Lymphoid follicle, hyperplasia, lymphoid,
diffuse Lymphoid follicle, hyperplasia, lymphoid, focal Lymphoid follicle, necrosis, acute, multifocal Red pulp, angiectasis, multifocal Red pulp, hematopoietic cell proliferation,
diffuse Red pulp, infiltration cellular, plasma cell,
focal Thymus
Depletion lymphoid, diffuse Cortex, cyst, single Medulla, cyst, multiple Thymocyte, necrosis, acute, diffuse
INTEGU MENI'ARY SYSTEM Skin
Acanthosis, diffuse Acanthosis, focal Hyperkeratosis, diffuse Inflammation, acute, focal Inflammation, subacute, focal Necrosis, acute, diffuse Abdominal, inflammation, chronic, focal Abdominal, ulcer, acute, focal Abdominal, ulcer, acute, multifocal Back, acanthosis, focal Back, alopecia, focal Back, fibrosis, diffuse Back, fibrosis, focal Back, fibrosis, multifocal Back, hyperplasia, pseudoepitheliomatous,
diffuse Back, inflammation, chronic, diffuse Back, inflammation, chronic active, diffuse Back, ulcer, acute, diffuse Back, ulcer, acute, focal Back, ulcer, acute, multifocal Back, ulcer, chronic active, focal Back, ulcer, chronic active, multifocal Dermis, fibrosis, focal Dermis, inflammation, subacute, focal Face, ulcer, chronic active, multifocal Face, subcutaneous tissue, granuloma, focal Face, subcutaneous tissue, inflammation,
chronic active, focal Hindlimb, subcutaneous tissue, inflammation,
granulomatous, chronic, focal Neck, subcutaneous tissue, inflammation, acute,
fiical
(49) (46)
1 (2%)
1 (2%) 4 (9%)
1 (2%) 1 (2%)
10 (20%) 11 (24%)
1 (2%) ( 3 8 )
3 (8%)
1 (3%)
(50) (21) 1 (2%) 1 (2%) 1 (2%) 1 (2%) 1 (2%)
1 ( 5 % ) 2 (4%) 1 (2%)
1 (2%) 1 (2%)1 (2%) 1 (2%) 3 (6%)
1 (2%) 2 (4%) 1 (2%) 1 (2%) 1 (2%)
1 (2%)
1 (2%)
(47) 1 (2%)
10 (21%) 1 (2%)
1 (2%) 1 (2%)
3 (6%)
(38 ) 2 ( 5 % ) 1 (3%) 1 (3%) 8 (21%)
(49)
1 (2%) 1 (2%) 1 (2%) 2 (4%) 2 (4%)
5 (10%) 1 (2%)
2 (4%) 1 (2%)
1 (2%)
1 (2%)
1 (2%)
137 2,4-Dichlorophenol,NTP TR 353
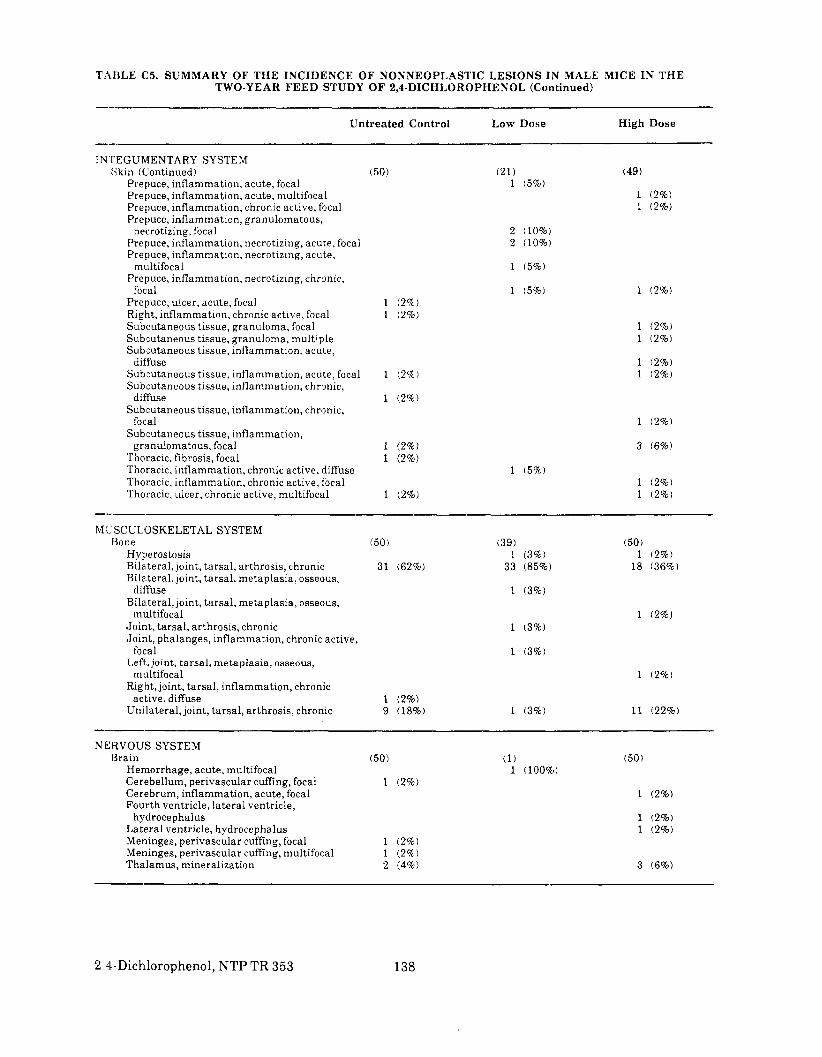
TAIILE C5. SUMMARY O F T H E INCIDENCE O F NONNEOPLASTIC LESIONS I N MALE MICE I N T H E TWO-YEAR F E E D STUDY O F 2,4-DICHLOROPHENOL (Continued)
Unt rea ted Control
INTEGUMENTARY SYSTEM Skin (Continued)
Prepuce, inflammation, acute, focal Prepuce, inflammation, acute, multifocal Prepuce, inflammation, chronic active, focal Prepuce, inflammation, granulomatous,
necrotizing, focal Prepuce, inflammation, necrotizing, acute, focal Prepuce, inflammation, necrotizing, acute,
multifocal Prepuce, inflammation, necrotizing, chronic,
focal Prepuce, ulcer, acute, focal Right, inflammation, chronic active, focal Subcutaneous tissue, granuloma, focal Subcutaneous tissue, granuloma, multiple Subcutaneous tissue, inflammation, acute,
difFuse Subcutaneous tissue, inflammation, acute, focal Subcutaneous tissue, inflammation, chronic,
diffuse Sub'cutaneous tissue, inflammation, chronic,
focal Subcutaneous tissue, inflammation,
granu!omatous, focal Thoracic, fibrosis, focal Thoracic, inflammation, chronic active, diffuse Thoracic, inflammation, chronic active, focal Thoracic, ulcer, chronic active, multifocal
(50)
1 (2%) 1 (2%)
1 (2%)
1 (2%)
1 (2%) 1 (2%)
1 (2%)
Low Dose High Dose
(21) (49) 1 (5%)
1 (2%) 1 (2%)
2 (10%) 2 (10%)
1 (5%)
1 (5%) 1 (2%)
1 ( 2 % ) 1 12%)
1 (2%) 1 (2%)
1 (2%)
3 ( 6 % )
1 ( 5 % ) 1 (2%) 1 (2%)
M [JSCCLOSKELETAL SYSTEM i3one
Hyperostosis Bila.tera1, joint, tarsal, arthrosis, chronic Bila.tera1, joint, tarsal, metaplasia, osseous,
Bilalteral, joint, tarsal, metaplasia, osseous,
Joint, tarsal, arthrosis, chronic Joint, phalanges, inflammation, chronic active,
dif'fuse
multifocal
(50)
31 (62%)
(39)1 (3%)
33 (85%)
1 (3%)
1 (3%)
(50) 1 (2%) 18 (36%)
1 (2%)
focal Left, joint, tarsal, metaplasia, osseous,
multifocal Right, joint, tarsal, inflammation, chronic
1 (3%)
1 (2%)
active, diffuse Unilateral, joint, tarsal, arthrosis, chronic
1 (2%)9 (18%) 1 (3%) 1 1 (22%)
NERVOUS SYSTEM t3rain
Hemorrhage, acute, multifocal (50) 50)
Cerebrum, inflammation, acute, focal Fourth ventricle, lateral ventricle,
Cerebellum, perivascular cuffing, focal 1 (2%) 1 (2%)
Lateral ventricle, hydrocephalus Meninges, perivascular cuffing, focal Meninges, perivascular cuffing, multifocal Thalamus, mineralization
hydrocephalus
1 (2%) 1 (2%) 2 (4%)
1 (2%) 1 (2%)
3 (6%)
2 4-Dichlorophenol,NTP TR 353 138
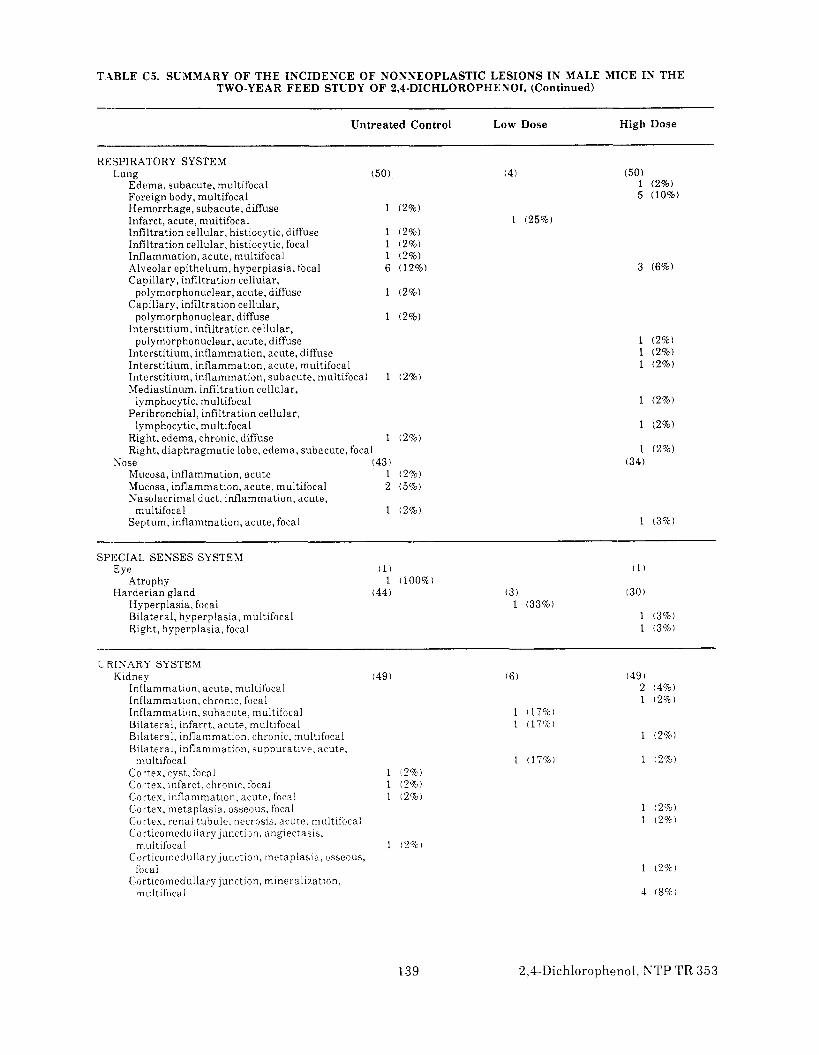
TABLE C 5 , SUMMARY OF THE INCIDENCE OF NONNEOPLASTIC LESIONS IN MALE MICE IN THE TWO-YEAR FEED STUDY OF 2,4-DICHLOROPHENOL (Continued)
Untreated Control Low Dose High Dose
--_-RESPIRATORY SYSTEM
Lung (50)Edema, subacute, multifocal Foreign body, multifocal Hemorrhage, subacute, diffuse 1 (2%) Infarct, acute, multifocal Infiltration cellular, histiocytic, diffuse 1 (2%) Infiltration cellular, histiocytic, focal 1 (2%) Inflammation, acute, multifocal 1 (2%) Alveolar epithelium, hyperplasia, focal 6 (12%) Capillary, infiltration cellular,
pcllymorphonuclear, acute, diffuse 1 (2%) Capillary, infiltration cellular,
pcllymorphonuclear, diffuse 1 (2%) Interstitiurn, infiltration cellular,
pcllymorphonuclear, acute, diffuse Interstitium, inflammation, acute, diffuse Interstitium, inflammation, acute, multifocal Interstitium, inflammation, subacute, multifocal 1 (2%) Mdiast inum, infiltration cellular,
lymphocytic, multifocal Peribronchial, infiltration cellular,
lymphocytic, multifocal Right, edema, chronic, diffuse 1 !2%) Right, diaphragmatic lobe, edema, subacute, focal
Nose (43) Mucosa, inflammation, acute 1 ( 2 % ) Mucosa, inflammation, acute, multifocal 2 ( 5 % ) Nasolacrimal duct, inflammation, acute,
multifocal 1 (2%) Septum, inflammation, acute, focal
SPECIAL SENSES SYSTEM Eye
Atrophy Harderian gland
Hyperplasia, focal Bilateral, hyperplasia, multifocal Right, hyperplasia, focal
L KINARY SYSTEM Kidney (49)
Inflammation, acute, multifocal Inflammation. chronic. focal Inflammation, subacute, multifocal Bilateral, infarct, acute, multifocal Bilateral, inflammation, chronic, multifocal Bilateral, inflammation, suppurative, acute,
III ultifocal Cortex, cyst, focal 1 ( 2 % ) Cortex, infarct, chronic. focal 1 ( 2 % ) Cortex, inflammation, acute. focal 1 12%) Cortex, metaplasia, osseous, focal Cortex. renal tuhule. necrosis. acute, multifocal Corticomedullary junction, angiectasis. rr~ult ifoca 1 1 12%)
Corticomedullary junction, metaplasia, OSSWUS,
focal Corticomedullary junction, mineralization,
multifocal
(4) (50)1 (2%) 5 (10%)
1 (25%)
3 (6%)
1 (2%) 1 (2%) 1 (2%)
1 (2%)
1 (2%)
1 (2%) (34)
1 (3%)
(1)
(31 (30) 1 (33%)
1 (3%) 1 ( 3 % )
( 6 )
1 (17%) 1 (17%)
1 !177e) 1 (2%)
1 ( 2 % ) 1 (2%)
1 ( 2 % )
4 ( 8 % )
139 2,4-Dichiorophenol, NTP TR 353
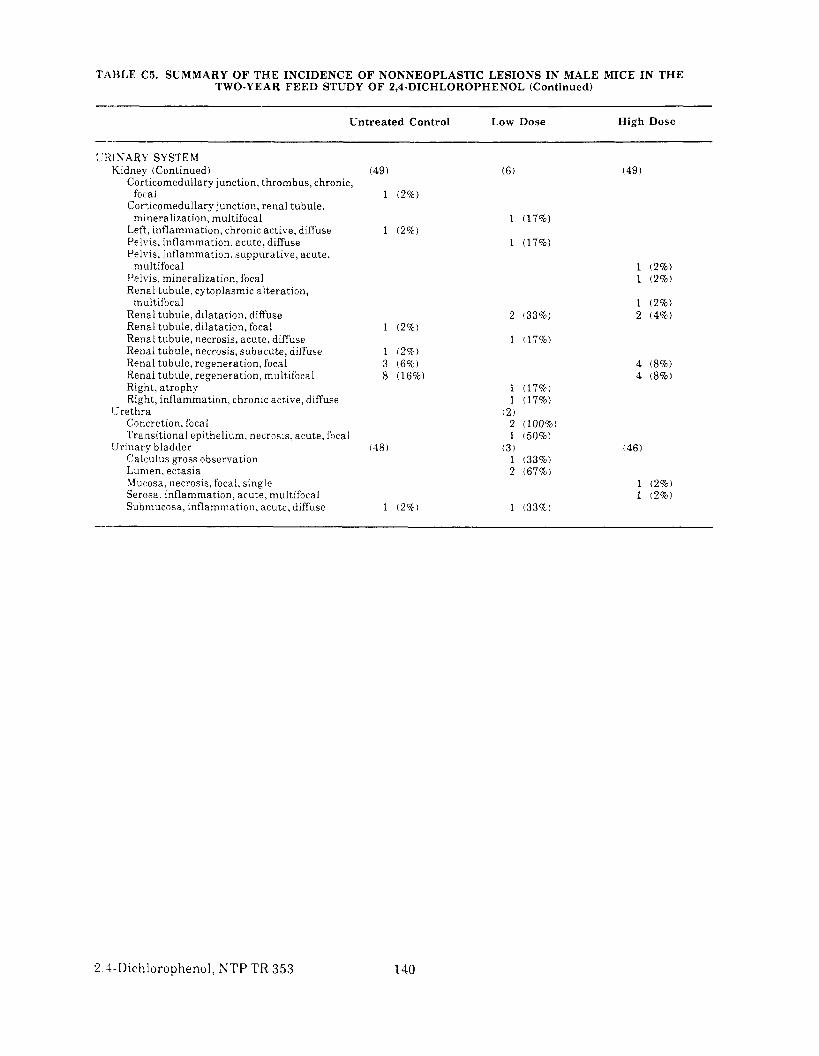
TABLE C 5 . SUMMARY OF THE INCIDENCE OF NONNEOPLASTIC LESIONS IN MALE MICE IN THE TWO-YEAR FEED STUDY OF 2,I-DICHLOROPHENOL (Continued)
-- .-
Untreated Control Low Dose High Dose --_-URINARY SYSTEM
Kidney (Continued) Corticomedullary junction, thrombus, chronic,
Cor’:icomedullary junction, renal tubule, focal
mineralization, multifocal Left. inflammation, chronic active, diffuse Pelvis, inflammation, acute, diffuse Pelvis, inflammation, suppurative, acute,
Pelvis, mineralization, focal Renal tubule, cytoplasmic alteration,
Renal tubule, dilatation, diffuse Renal tubule. dilatation, focal Renal tubule, necrosis, acute, diffuse Renal tubule, necrosis, subacute, diffuse
multifocal
mukifocal
1 (2%)
(49)
1 (2%)
1 (2%) 1 (17%)
1 (17%)
(6)
2 133%)
1 (17%)
1 (2%) 1 (2%)
1 (2%) 2 (4%)
(49)
Renal tubule, regeneration, focal Renal tubule, regeneration, maltifocal Right, atrophy Right, inflammation, chronic active, diffuse
Concretion, focal Transitional epithelium, necrosis, acute, focal
Calculus gross observation
Mucosa, necrosis, focal, single Serosa, inflammation, acute, multifocal Submucosa, inflammation, acute, diffuse
‘Jrethra
lJrinary bladder
Lumen. ectasia
1 (2%))
148)
1 (17%) 1 (17%)
2 (100%) 1 (50%)
1 (33%)
1 ( 3 3 % )
(2 )
( 3 )
2 (67%) 1 (2%) 1 (2%)
(46)
4 ( 8 % ) 4 ( 8 % )
2.-l-I)ictilorophenol, NTP TR 353 140

APPENDIX D
SUMMARY OF LESIONS IN FEMALE MICE IN
THE TWO-YEAR FEED STUDY OF
2,4-DICHLOROPHENOL
PAGE
TI\RLE D1 SUMMARY OF THE ISCIDENCE OF NEOPLASMS IN FEMALE MICE IN THE TWO- YEAR FEED STUDY O F 2,4-DICHLOROPHENOL 142
T4BLE D2 INDIVIDUAL ANIMAL TUMOR PATHOLOGY O F FEMALE MICE IN THE TWO-YEAR FEED STUDY OF 8,4-DICHLOROPHENOL 146
TABLE D3 ANALYSIS OF PRIMARY TUMORS IN FEMALE MICE IN THE TWO-YEAR FEED STUDY O F 2,4-DICHLOROPHENOL 156
T4BLE D4a HISTORICAL INCIDENCE OF STOMACH SQLAMOLS CELL TCMORS IN FEMALE B6C3F1 MICE RECEIVING NO TREATMENT 158
TABLE D4b HISTORICAL INCIDEXCE OF HEMATOPOIETIC SYSTEM TUMORS IN FEMALE B6C3F1 MICE RECEIVING NO TREATMENT 159
T9BLE D5 SUMMARY OF THE INCIDENCE OF NONNEOPLASTIC LESIONS IN FEMALE MICE IN THE TWO-YEAR FEED STUDY OF 2,4-DICHLOROPHENOL 160
141 2,4-Dichlorophenol, NTP TR 353

TABLE D1. SUMMARY O F THE INCIDENCE OF NEOPLASMS IN FEMALE MICE IN THE TWO-YEAR FEED STUDY OF 2,4-DICFILOROP€IENOL
-.“I-
Untrea ted Control Low Dose High Dose
Animals initially in study 50 Animals removed 50 Animals examined histopathologically 50
AL8[ MENTARY SYSTEM (;allbladder (46)
Papilloma 1 Intestim small (48)
Jejunum, Peyer’s patch, lymphoma malignant lymphocytic 4
Jejunum, Peyer’s patch, lymphoma malignant undifferentiated cell type 1
I .iver (50) Hepatocellular carcinoma 2 Hepatocellular adenoma Lymphoma malignant histiocytic 3 Lymphoma malignant lymphocytic 1
Mesentery *(50) Liposarcoma, metastatic, skin Lymphoma malignant histiocytic 2 Lymphoma malignant lymphocytic 1 Lymphoma malignant mixed 1 Sarcoma, metastatic, skin
I’ancre.as (49) Lymphoma malignant histiocytic 1 Lymphoma malignant undifferentiated cell type
Salivary glands (49) Lymphoma malignant lymphocytic Lymphoma malignant mixed 1
Stomach (49) Lymphoma malignant lymphocytic Lymphoma malignant mixed Forestomach, squamous cell carcinoma 1 Forestomach, squamous papilloma 3 Glandular, hepatocellular carcinoma, metastatic 1
Tooth *(50) Lymphoma malignant histiocytic 1 Lymphoma malignant lymphocytic
(2% I
(8%I
(2%1
(4%)
( 6 % ) (2%)
(4%) (2%) (2%)
(2%)
(2%)
(2%) (6%) (2%)
(2%)
50 50 50
*(50)
2
I
*(501
3
*(50)
50 50 50
(45)
(47)
(50) 1
(4%)
( 2 % ) 1 *(50)
1
1
1 (47)
1 (47)
1
(48) 1 1
(6%)
1
(2%)
(2%)
(2%)
(2%)
(2%)
(2%)
(2%)
( 2 % ) (2%)
(2%)
CAIZDIOVASCULAR SYSTEM IHeart
Lymphoma malignant lymphocytic ---
(50) *(50) 1 (2%)
(50) 1 (2%)
EYDOCRNE SYSTEM ldrena l gland
Lymphoma malignant histiocytic Lymphoma malignant lymphocytic Sarcoma, metastatic, skin Medulla, pheochromocytoma benign Spiindle cell, adenoma
Admoma
Lymphoma malignant lymphocytic Pars distalis, adenocarcinoma Pars distalis, adenoma Pars intermedla, adenoma
Follicular cell, adenoma
Islets, pancreatic
Pituitary gland
Thyroid gland
(49) 1 (2%)
2 (4%) 1 (2%)
4 (8%)
1 (2%)
(49)
(49)
(49)
*(50)
1 (2%)
‘(50)
*(50)
*(50)
(501
1 (2%) 2 (4%) 2 (4%)
1 (2%)
1 (2%) 1 (2%) 3 (6%) 1 (2%)
(47)
(48)
(47)
--”--
2,4-Dichlorophenol,NTP TR 353 14%

TABLE 111. SUMMARY OF THE INCIDENCE OF NEOPLASMS IN FEMALE MICE IN THE TWO-YEAR FEED STUDY OF 2,4-DICHLOROPHENOL (Continued)
Untreated Control
GENERAL BODY SYSTEM None
GENITAL SYSTEM Ovary
Choriocarcinoma (48)
Cystadenoma Granulosa cell tumor Lymphoma malignant histiocytic Lymphoma malignant lymphocytic
2 1
(4%) (2%)
Lymphoma malignant mixed Mesothelioma benign
1 1
(2%) (2%)
Bilateral, lymphoma malignant lymphocytic Periovarian tissue, lymphoma malignant mixed
Kteru:; (49) Lymphoma malignant histiocytic 2 (4%) Lymphoma malignant lymphocytic Lymphoma malignant mixed Polyp stromal Sarcoma
2 (4%)
Sarcoma stromal
HEMATOPOIETIC SYSTEM Blood (13)
Lymphoma malignant mised Bone marrow 150)
Hemangiosarcoma, metastatic, spleen 1 (2%) Lymphoma malignant lymphocytic 1 (2%) Lymphoma malignant mixed 2 (4%)
Lymph node (481 Lymphoma malignant lymphocytic Sarcoma, metastatic, skin Lumbar, lymphoma malignant histiocytic 1 (2%) Lumbar, lymphoma malignant lymphocytic 1 (2%) Lumbar, mediastinal, mandibular, lymphoma
malignant mixed 1 ( 2 % ) Mandibular, lymphoma malignant histiocytic 2 (4%) Mandibular, lymphoma niaiignant lymphocytic 2 (4%) Mandibular, lymphoma malignant mixed 1 (2%) Mandibular, lymphoma malignant
undifferentiated cell type 1 ( 2 % ) Mediastinal, lymphoma malignant histiocytic 1 ( 2 % ) Mediastinal, lymphoma malignant lymphocytic 1 ( 2 % ) Mediastinal, lymphoma malignant mixed 1 12401 Mesenteric, lymphoma malignant histiocytic 1 12%) Mesenteric, lymphoma malignant lymphocytic Mesenteric, lymphoma malignant
undifferentiated cell type Pancreatic, lymphoma malignant lymphocytic 1 (2 '6 , Pancreatic. lymphoma malignant mixed 1 (2'6) Renal, lymphoma malignant lymphocytic 2 14%)
Spleen 149) Hemangiosarcoma 1 ( 2 % ) LiFlosarcoma, metastatic, skin Lymphoma malignant histiocytic 1 (2%1 Lyinphoma malignant lymphocytic 2 14%1 Lymphoma malignant mixed 2 (4%) Lymphoma malignant undifferentiated cell type 1 (2%)
Low Dose
*(46)
1 (2%)
1 (2%)
*(46)
2 14%)
2 14%)
*(46)
*(46)
*(46)1 (2%)
2 (4%)
1 ( 2 % )
1 (2%) *(46 1
2 (4%) 3 (7%)
High Dose
~~ -
(48) 1 (2%) 1 (2%)1 (2%)
1 (2%)
1 (2%) 149)
1 (2%) 1 (2%) 1 (2%) 1 (2%) 1 ( 2 % )
( 7 ) 1 (14%)
(50)
1 (2%)
(46)
1 (2%)
1 ( 2 % )
1 (2%)
1 (2%)
1 (2%)
(49)
1 12%)
143 2,4-Dichlorophenol, NTP TR 353
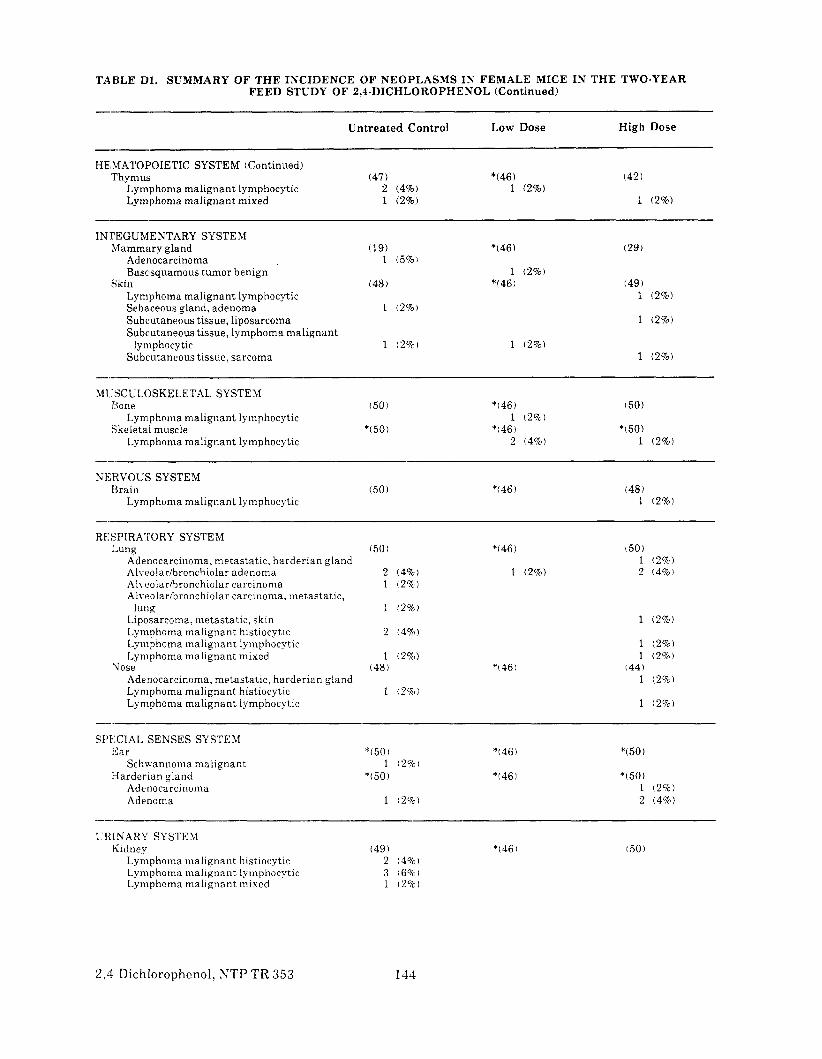
TAHLE D1. SUMMARY OF THE INCIDENCE OF NEOPLASMS IN FEMALE MICE IN THE TWO-YEAR FEED STUDY OF 2,4-DICHLOROPHENOL (Continued)
Untreated Control
HE MATOF'OIETIC SYSTEM (Continued) Thymus (47)
Lymphoma malignant lymphocytic 2 (4%) Lymphoma malignant mixed 1 (2%)
INTEGUMENTARY SYSTEM Mammary gland (19)
Adenocarcinoma 1 ( 5 % ) Basclsquamous tumor benign
Skin (48) Lymphoma malignant lymphocytic Sebamous gland, adenoma 1 ( 2 % ) Subcutaneous tissue, liposarcoma Sub( utaneous tissue, lymphoma malignant
lymphocytic 1 (2%) Subcutaneous tissue. sarcoma
MI -SCLLOSKELETAL SYSTEM I<one (50)
Lymphoma malignant lymphocytic Skeletal muscle *I501
Lymphoma malignant lymphocytic
KEKVOUS SYSTEM Rrain (50)
Lymphoma malignant lymphocytic
RE:SPIRArORY SYSTEM l.ung 150)
Adenocarcinoma, metastatic, harderian gland Alveolar/bronchiolar adenoma 2 14%) Alveolarhronchiolar carcinoma 1 (2%) Alveolar/bronchiolar carcinoma, metastatic,
lung 1 128) Liposarcoma, metastatic, skin Lymphoma malignant histiocytic Lymphoma malignant lymphocytic Lymphoma malignant mixed
Uose Adenocarcinoma, metastatic, harderian gland Lymphoma malignant histiocytic Lymphoma malignant lymphocytic
SI't.:CIAL SENSES SYSTEM Ear *( 5 0 )
Schwannoma malignant 1 (2%) IHarderian gland *150)
Adcnocarcinoma Adetionia 1 t P % l
I,' K INA R\' SYSTEM Kidney (49)
Lymphoma malignant histiocytic 2 (4%) Lymphoma malignant lymphocytic 3 (6%)Lymphoma tnalignant mixed 1 12%)
Low Dose
*(46) 1 12%)
*(46)
1 (2%)*(46l
1 12%)
*1461 1 (2%)
*146) 2 (4%)
*(46)
*(46)
1 12%)
+(461
*t46)
*(46)
*(46)
High Dose
(42)
1 (2%)
(29)
(491 1 12%)
1 (2%)
1 (2%)
150)
*(50) 1 (2%)
(481 1 (2%)
(50) 1 12%) 2 (4%l
1 (2%)
1 (2%) 1 (2%)
(441 1 127Ccl
1 (2%)
*(50)
*(50) 1 (2%) 2 (4%)
(50)
2.4-Dichlorophenol,NTP TR 353 144
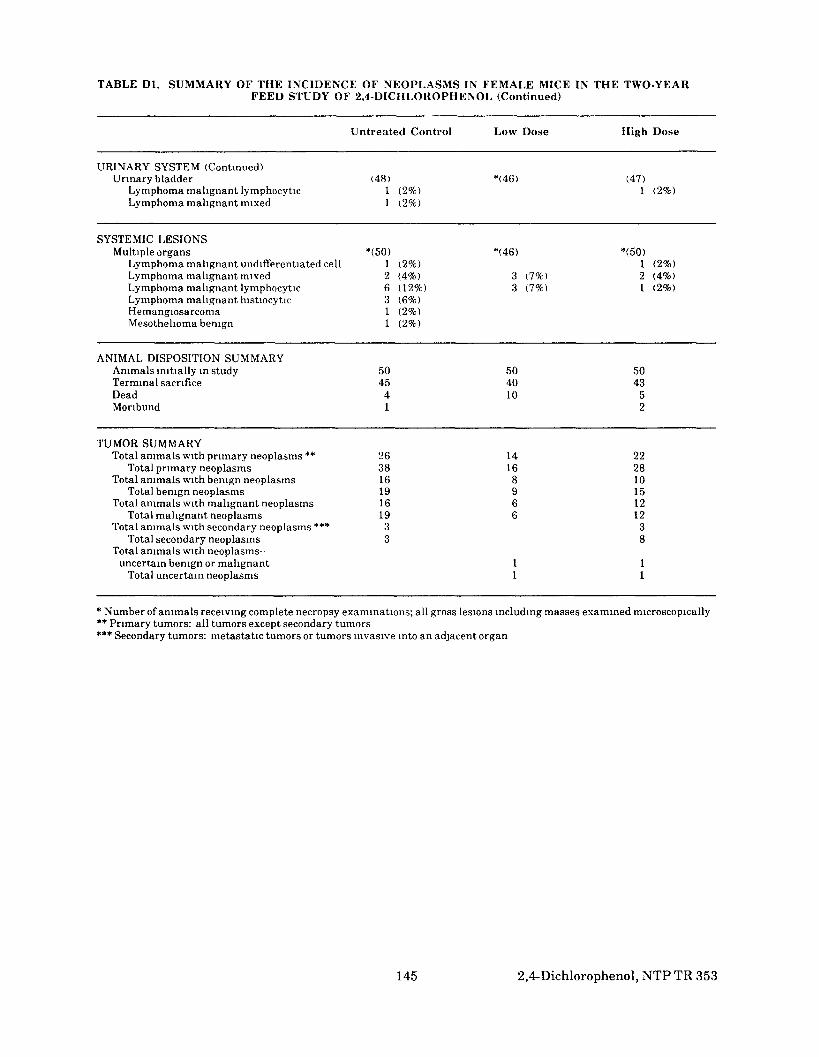
TABLE Dl. SUMMARY OF THE INCIDENCE OF NEOPLASMS IN FEMALE MICE IN THE TWO-YEARFEED STUDY OF 2,4-DICHLOROPHENOL (Continued)
Untreated Control Low Dose High Dose
URINARY SYSTEM (Continued)Urinary bladder
Lymphoma malignant lymphocyticLymphoma malignant mixed
SYSTEMIC LESIONSMultiple organs
Lymphoma malignant undifferentiated cellLymphoma malignant mixedLymphoma malignant lymphocyticLymphoma malignant histiocyticHemangiosarcomaMesothehoma benign
ANIMAL DISPOSITION SUMMARYAnimals initially in studyTerminal sacrificeDeadMoribund
TUMOR SUMMARYTotal animals with primary neoplasms **
Total primary neoplasmsTotal animals with benign neoplasms
Total benign neoplasmsTotal animals with malignant neoplasms
Total malignant neoplasmsTotal animals with secondary neoplasms ***
Total secondary neoplasmsTotal animals with neoplasms-
uncertain benign or malignantTotal uncertain neoplasms
(48)1 (2%)1 (2%)
*(50)1 (2%)2 (4%)6 (12%)3 (6%)1 (2%)1 (2%)
504541
26381619161933
*(46)
*(46)
3 (7%)3 (7%)
504010
14168966
11
(47)1 (2%)
*(50)1 (2%)2 (4%)1 (2%)
504352
22281015121238
11
* Number of animals receiving complete necropsy examinations; all gross lesions including masses examined microscopically** Primary tumors: all tumors except secondary tumors*** Secondary tumors: metastatic tumors or tumors invasive into an adjacent organ
145 2,4-Dichlorophenol,NTPTR353
-

TABLE D2. INDIVIDUAL ANIMAL TUMOR PATHOLOGY OF FEMALE MICE IN THE TWO-YEAR FEEDSTUDY OF 2,4-DICHLOROPHENOL: UNTREATED CONTROL
WEEKS ONSTUDY
CARCASSID
ALIMENTARY SYSTEMEsophagusGallbladder
PapillomaIntestine largeIntestine small
Jejunum, Fever's patch, lymphomamalignant lymphocytic
Jejunum, Peyer's patch, lymphomamalignant undifierentiated celltype
LiverHepatocellular carcinomaLymphoma malignant histiocyticLymphoma malignant lymphocytic
MesenteryLymphoma malignant histiocyticLymphoma malignant lymphocyticLymphoma malignant mixed
PancreasLymphoma malignant histiocytic
Salivary glandsLymphoma malignant mixed
StomachForestomach, squamous cell carcinomaForestomach, squamous papillomaGlandular, hepatocellular carcinoma.
metastaticTooth
Lymphoma malignant histiocytic
CARDIOVASCULAR SYSTEMHeart
ENDOCRINE SYSTEMAdrenal gland
Lymphoma malignant histiocyticMedulla, pheochromocytoma benignSpindle cell, adenoma
Islets, pancreaticParathyroid glandPituitary gland
Pars distahs, adenomaThyroid gland
Folhcular cell, adenoma
GENERAL BODY SYSTEMNone
GENITAL SYSTEMOvary
Lvmphoma malignant histiocyticLymphoma malignant lymphocyticLymphoma malignant mixedMesothehoma benign
UterusLymphoma malignant histiocyticPolvp stromal
O O O O O L l l l l l l l l l8 8 9 9 9 0 0 0 0 0 0 0 0 0 01 3 6 7 9 4 4 4 4 4 5 5 5 5 5
1 1 2 1 1 1 1 1 1 1 1 1 1 1 13 2 0 7 3 1 1 1 1 1 2 2 2 2 33 1 2 1 2 1 2 3 4 5 2 3 4 5 1
4 - 4 - A 4 - M I + 4- + + - 1 - + + + +X
+ + A+M + + + + + + + + + +
X
XX
X
+ 4- ^- + A + + f + + + + + + +
X X
X
•
+ + 4- + f 4 - ^ + f - + + + + +
+ + + +A + + + 4 - + + + + +X
MMM + M + + + + + + MM +
X+ + + +I + + + + + + + + + +
l l l l l l l l l l0 0 0 0 0 0 0 0 0 05 5 5 5 5 5 5 5 5 5
1 l 1 1 1 i 1 i t 14 5 1 2 3 4 5 1 2 3
+ + + + + + M + + +
XX
+ + + -*- + + + + + +
M + M + + + + + + ++ + + + + + + + + +
X X
+ + + + A + I + + + + + + + 4X
X
X
X
+• Tissue examined microscopicallyNot examined
Present but not examined microscopicallyI Insufficient tissue
M MissingA Autolysis precludes examinationX Incidence ofhsted morphology
2,4-Dichlorophenol, NTP TR 353 146
— —
-
-
—
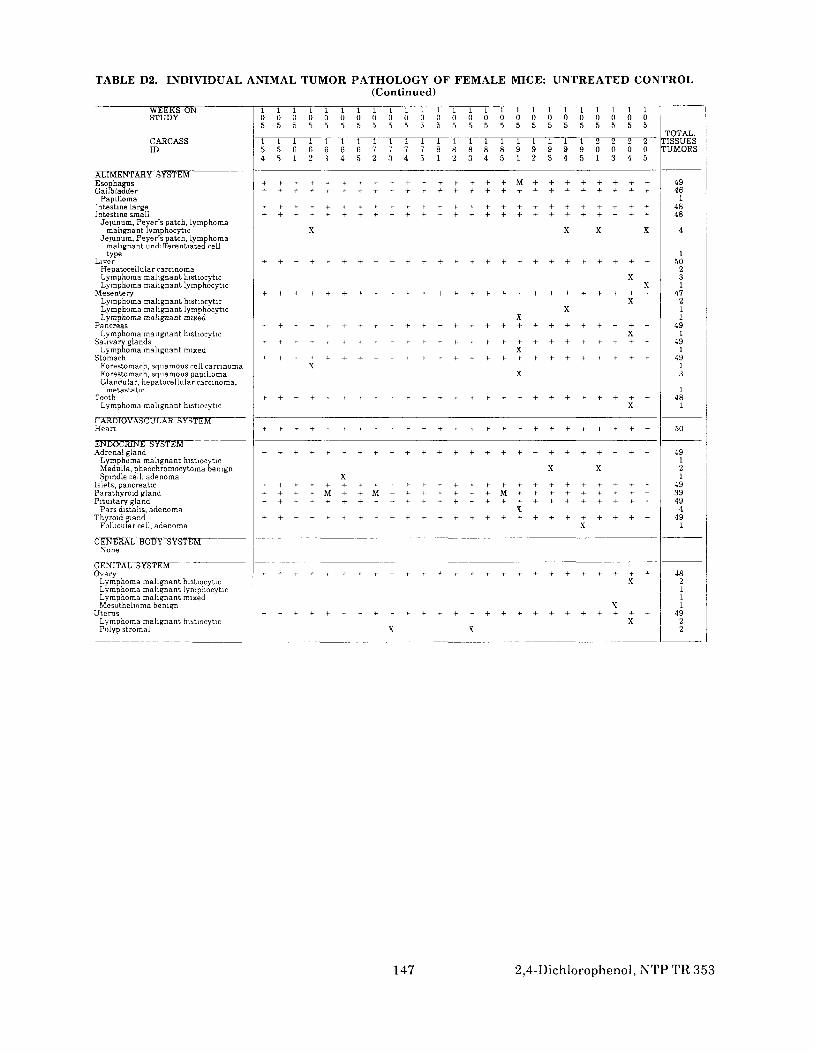
TABLE D2. INDIVIDUAL ANIMAL TUMOR PATHOLOGY OF FEMALE MICE: UNTREATED CONTROL(Continued)
WEEKS ONSTUDY
CARCASSID
ALIMENTARY SYSTEMEsophagusGallbladder
Papilloma'ntestme largeIntestine small
Jejunum, Payer's patch, lymphomamalignant lymphocytic
Jejunum, Peyer's patch, lymphomamalignant undifferentiated relltype
LiverHepatocellular carcinomaLymphoma malignant histiocyticLymphoma malignant lymphocytic
MesenteryLymphoma malignant histiocyticLymphoma malignant lymphocyticLymphoma malignant mixed
PancreasLymphoma malignant histiocytic
Salivary glandsLymphoma malignant mixed
StomachForestomach, squamous cell carcinomaForestomach, squamous papillomaGlandular, hepatocellular carcinoma.
metastaticTooth
Lymphoma malignant histiocytic
CARDIOVASCULAR SYSTEMHeart
ENDOCRINE SYSTEMAdrenal gland
Lymphoma malignant histiocyticMedulla, pheochromocytoma benignSpindle cell , adenoma
Islets, oancreaticParathyroid glandPituitary gland
Pars distahs, adenomaThyroid giand
Folhcularcell, adenoma
GENERAL BODY SYSTEMNone
GENITAL SYSTEMOvary
Lymphoma malignant histiocyticLymphoma malignant lymphocyticLymphoma malignant mixedMesothehoma benign
UterusLymphoma malignant tmtiocyticPolyp stromal
1 3 . 1 1 1 1 1 1 1 1 1 1 1 1 1 1 1 1 1 1 1 1 1 1 10 0 0 0 0 0 0 0 0 0 0 0 0 0 0 0 0 0 0 0 0 0 0 0 05 5 5 5 5 5 5 5 5 5 5 5 5 5 5 5 5 5 5 5 5 5 5 5 5
1 1 1 1 1 1 1 1 1 1 1 1 1 1 1 1 1 1 1 1 1 2 2 2 25 5 6 6 6 6 6 7 7 7 7 8 8 8 8 8 9 9 9 9 9 0 0 0 04 5 1 2 3 4 5 2 3 4 5 1 2 3 4 5 1 2 3 4 5 1 3 4 5
+ H- + + + + H- + + + H- + f H- + + M + + + + + H- + .
X X X X
XX
XX
X
X
X
XX
X
X XX
+ + - f + M + - t - M - * - + + + -*- + + M + + + + + + + -t- +
X
X
X
X
XX X
TOTAL.TISSUESTUMORS
49461
4848
4
150
231
47211
491
49I
4913
1481
50
49121
493949
449
1
482111
4922
147 2,4-Dichlorophenol, NTP TR 353

TABLE D2. INDIVIDUAL ANIMAL TUMOR PATHOLOGY OF FEMALE MICE: UNTREATED CONTROL(Continued)
WEEKS ONSTUDY
CARCASSID
HEMATOPOIETIC SYSTEMBloodBone marrow
Hemangiosarcoma, metastatic, spleenLymphoma malignant lymphocyticLymphoma malignant mixed
Lymph nodeLumbar, iymphoma malignant histiocyticLumbar, Iymphoma malignant lymphocyticLumbar, mediastmal, mandibular,
Iymphoma malignant mixedMandibular, Iymphoma malignant
histiocyticMandibular, Iymphoma malignant
lymphocyticMandibular, Iymphoma malignant mixedMandibular, Iymphoma malignant
undifferentiated cell typeMediastinal, Iymphoma malignant
histiocyticMediastinal, lymohoma malignant
lymphocyticMediastinal, Iymphoma malignant mixedMesentenc, Iymphoma malignant
histiocyticPancreatic, Iymphoma malignant
lymphocyticPancreatic, Iymphoma malignant mixedRenal, Iymphoma malignant lymphocytic
SpleenHemangiosarcomaLymphoma malignant histiocyticLymphoma malignant lymphocyticLvmphoma malignant mixedLymphoma malignant undifferentiated
cell typeThymus
Lymphoma malignant lymphocyticLymphoma malignant mixed
INTEGUMENTARY SYSTEMMammary gland
\denocarcinomaSkin
Sebaceous gland, adenomaSubcutaneous tissue, Iymphoma
malignant lymphocytic
MUSCULOSKELETAL SYSTEMBone
NERVOUS SYSTEMBrain
RESPIRATORY SYSTEM
0 0 0 0 0 1 1 1 1 1 18 8 9 9 9 0 0 0 0 0 01 3 6 7 9 4 4 4 4 4 5
1 1 2 ' 1 1 1 1 1 1 1 13 2 0 7 3 1 1 1 1 1 23 1 2 1 2 1 2 3 4 5 2
+ +
X
X
X
X
X
X
X
+ M M M M M + + + +
X
+ + ^ + + + + * + - + H-
Alveolar/bronchiolar adenoma jAlveolar/bronchiolar carcinoma XAlveolar/bronchiolar carcinoma,
metastatic, lungLvmphoma malignant histiocvticLymphoma malignant mixed
NoseLymphoma malignant histiocytic
Trachea
SPECIAL SENSES SYSTEMEar
Schwannoma malignantEyeHardenan gland
Adenoma
URINARY SYSTEMKidney
Lymphoma malignant histiocvticLymphoma malignant lymphocyticLymphoma malignant mixed
Urinary bladderLymphoma malignant lymphocyticLvmphoma malignant mixed
XX
^ J ^ _ ^ _ ( _ 4 j. 4. -4 _f + ^
+ ) - ( - + A - l - 4 - 1 - - f + +
+- - +- 4- *-
X
X
1 1 1 1 1 1 1 1 1 1 1 1 1 10 0 0 0 0 0 0 0 0 0 0 0 0 05 5 5 5 5 5 5 5 5 5 5 5 5 5
1 1 1 1 1 1 1 1 1 1 1 1 1 1
3 4 5 1 4 5 1 2 3 4 5 1 2 3
+ + +
X
+ M f M M M M M M M M + M
^ + - + +- + + + t - 4 + - ( - - + -t-
+ + + + t + + + + + + + + +
J -|- + - - ( - - ) - - - - r - + * - - ( - - ( - ) - i -
+ f + t + * r » + f ^ » ^ +
+X
+ * - f ^ i - ^ f f
X
2,4-Dichlorophenol, NTP TR 353 148
- -
- - _ - i l

TABLE D2. INDIVIDUAL ANIMAL TUMOR PATHOLOGY OF FEMALE MICE: UNTREATED CONTROL(Continued)
WEEKS ONSTUDY
CARCASSID
HEMATOPOIETIC SYSTEMBloodBone marrow
Hemangiosarcoma, metastatic, spleenLymphoma malignant lymphocyticLymphoma malignant mixed
Lymph nodeLumbar, lymphoma mahg histiocyticLumbar, lymphoma mahg lymphocyticLumbar, mediastinal, mandibular,
lymphoma malignant mixedMandibular, iymphoma malignant
histiocyticMandibular, lymphoma malignant
lymphocyticMandibular, lymphoma mahg mixedMandibular, lymphoma malignant
undifTerentiated cell typeMediastinal, lymphoma malignant
histiocyticMediastinal, lymphoma malignant
lymphocvticMediastinal, lymphoma mahg mixedMesentenc, lymphoma malignant
histiocyticPancreatic, lymphoma malignant
IvmphocyticPancreatic, lymphoma malignant mixedRenal, lymphoma mahg lymphocvtic
SpleenHemangiosarcomaLvmphoma malignant histiocyticLvmphoma malignant lymphocvticLymphoma malignant mixedLympnoma malignant undifferentiated
relltvpeThvmus
Lvmphoma malignant lymphocyticLymphoma malignant mixed
INTEGUMENTARY SYSTEMMammary gland
\denocaranomaSkin
Sebaceous gland, adenomaSubcutaneous tissue, lymphoma
malignant lymphocytic
MUSCULOSKELETAL SYSTEMBone
NERVOUS SYSTEMBrain
RESPIRATORY SYSTEMLung
Alveolar/bronchiolar adenomaAlveolar /b ronchio la r carcinomaAlveolar/bronchiolar carcinoma,
metastatic, lungLymphoma malignant histiocyticLymphoma malignant mixed
NoseLymphoma malignant histiocytic
Trachea
SPECIAL SENSES SYSTEMEar
Schwannoma malignantEyeHardenan gland
Adenoma
URINARY SYSTEMKidney
Lymphoma malignant histiocyticLymphoma malignant lymphocyticLymphoma malignant mixed
Urinary bladderLymphoma malignant lymphocyticLymphoma malignant mixed
1 1 1 1 1 1 1 1 1 1 1 1 1 1 1 1 1 1 1 1 1 1 1 1 10 0 0 0 0 0 0 0 0 0 0 0 0 0 0 0 0 0 0 0 0 0 0 0 05 5 5 5 5 5 5 5 5 5 5 5 5 5 5 5 5 5 5 5 5 5 5 5 5
1 1 I 1 1 1 1 1 1 1 1 L 1 1 1 1 1 1 1 1 1 2 2 2 25 5 6 6 6 6 6 7 7 7 7 8 8 8 8 8 9 9 9 9 9 0 0 0 04 5 1 2 3 4 5 2 3 4 5 1 2 3 4 5 1 2 3 4 5 1 3 4 5
- * - + + -t- + + + +
XX
X
X
X
X Xx
X
XX
X
XX
X X
XX
XX
X XX
X
X
+ ^ + + + + + + + + + + + + + + + + + + + + + + +X X
XX
X
+
XX X X
+ -t- + + + - t - - * - + -+- + + -t- + + -f- + - t - - t - 4 - + + -f + + +X
X
TOTALTISSUESTUMORS
1350
112
4811
1
2
21
1
1
11
1
112
491122
147
21
191
481
1
50
50
5021
121
481
49
111
351
49231
4811
149 2,4-Dichlorophenol, NTP TR 353
1
'
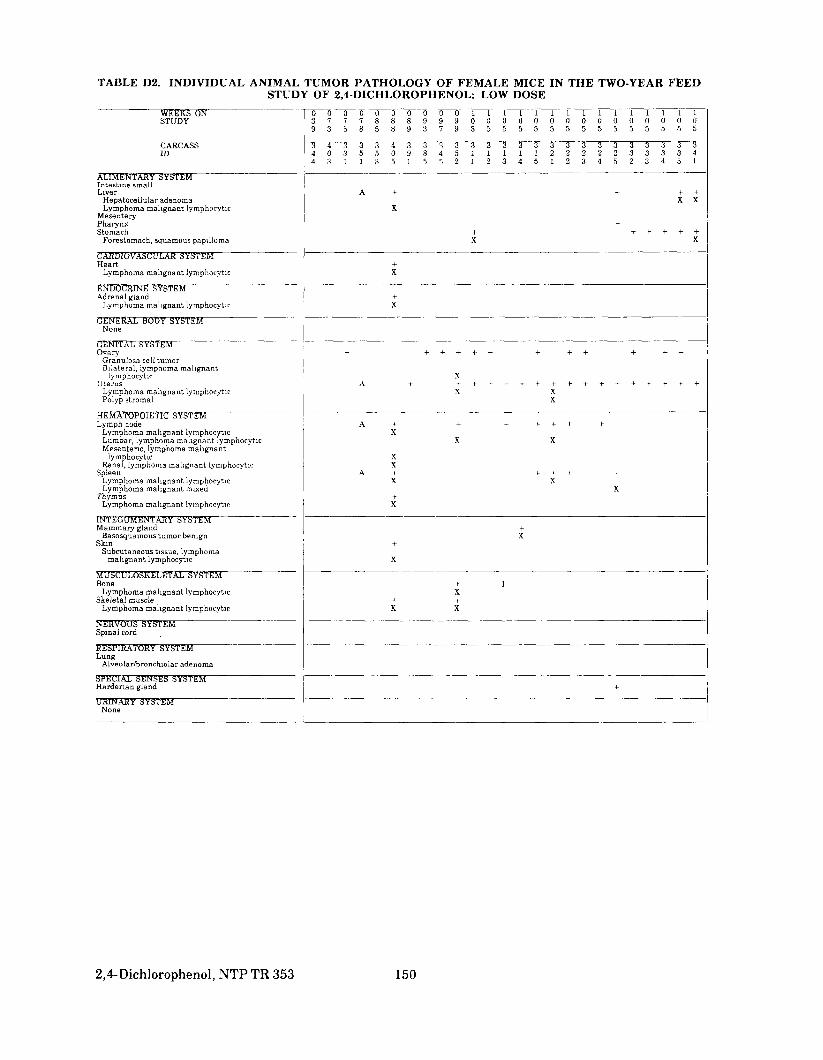
TABLE D2. INDIVIDUAL ANIMAL TUMOR PATHOLOGY OF FEMALE MICE IN THE TWO-YEAR FEEDSTUDY OF 2,4-DICHLOROPHENOL: LOW DOSE
WEEKS ONSTUDY
CAHCASSID
ALIMENTARY SYSTEMIntestine smallLiver
Hepatocellular adenomaLymphoma malignant lymphocytlc
MesenteryPharynxStomach
Forestomach, squamouspapilloma
CARDIOVASCULAR SYSTEMHeart
Lymphoma malignant lymphocytlc
ENDOCRINE SYSTEMAdrenal gland
Lymphoma malignant lymphocytlc
GENERAL BODY SYSTEMNone
GENITAL SYSTEMOvary
Granulosa cell tumorBilateral, lymphoma malignant
lymphocytlcUterus
Lymphoma malignant lymphocytlcPolyp stromal
HEMATOPOIETIC SYSTEMLymph node
Lymphoma malignant lymphocytlcLumbar, lymphoma malignant lymphocytlcMesentenc, lymphoma malignant
lymphocytlcRenal, lymphoma malignant lymphocytlc
SpleenLymphoma malignant lymphocytlcLymphoma malignant mixed
ThymusLymphoma malignant lymphocytlc
INTEGUMENTARY SYSTEMMammary gland
Basosquamous tumor benignSkin
Subcutaneous tissue, lymphomamalignant lymphocytlc
MUSCULOSKELETAL SYSTEMBone
Lymphoma malignant lymphocytlcSkeletal muscle
Lymphoma malignant lymphocytlc
NERVOUS SYSTEMSpinal cord
RESPIRATORY SYSTEMLung
Alveolar/bronchiolar adenoma
SPECIAL SENSES SYSTEMHardenan gland
URINARY SYSTEMNone
0 0 0 0 0 0 0 0 0 0 1 1 1 1 1 1 1 1 1 1 1 1 1 1 13 7 7 7 8 8 8 9 9 9 0 0 0 0 0 0 0 0 0 0 0 0 0 0 09 3 5 8 5 8 9 3 7 9 5 5 5 5 5 5 5 5 5 5 5 5 5 5 5
3 4 3 3 3 4 3 3 3 3 3 3 3 3 3 3 3 3 3 3 3 3 3 3 34 0 3 5 5 0 9 8 4 5 1 1 1 1 1 2 2 2 2 2 3 3 3 3 44 3 1 1 3 5 1 5 5 2 1 2 3 4 5 1 2 3 4 5 2 3 4 5 1
A + + + +X X
X
-t+ + + + + +X X
+X
+X
+ + + + + + + + + + + +
X
X XX
A 4 + + + + + +X
X X
xX
A + + + + +X X
Xf
X
-tX
+
X
+ IX
+ +X X
+
2,4-Dichlorophenol, NTP TR 353 150
-
-
-
-
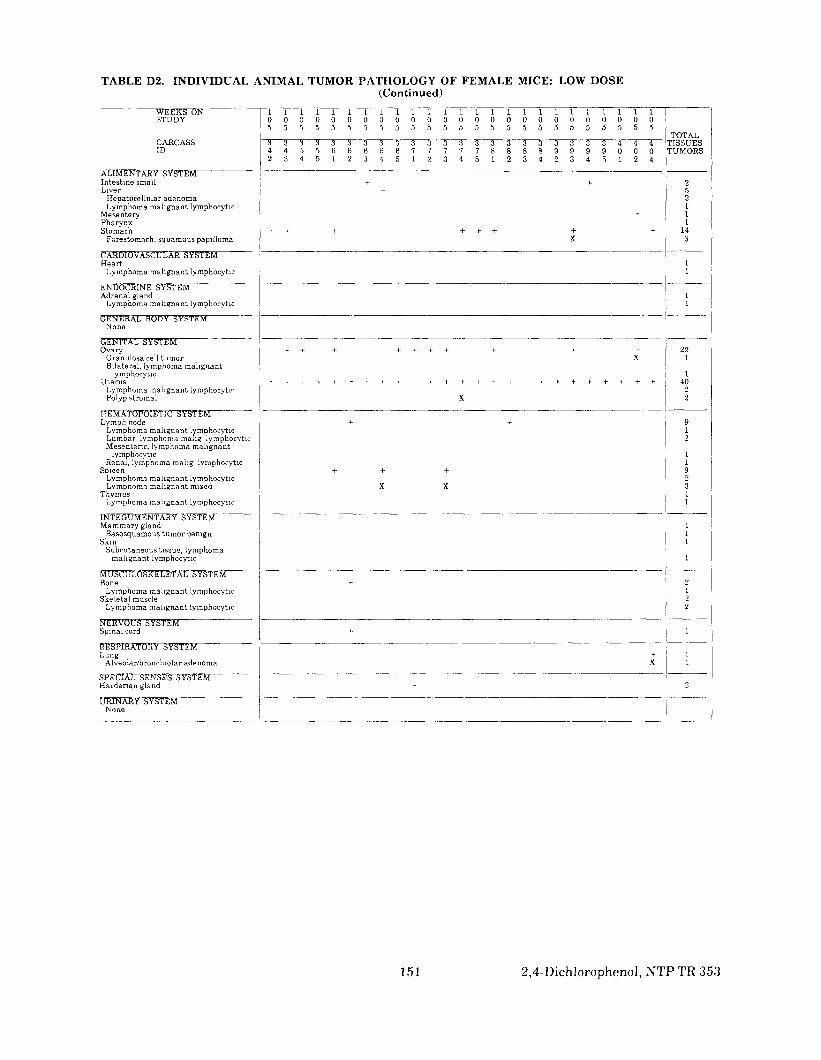
TABLE D2. INDIVIDUAL ANIMAL TUMOR PATHOLOGY OF FEMALE MICE: LOW DOSE(Continued)
WEEKS ONSTUDY
CARCASSID
ALIMENTARY SYSTEMIntestine smallLiver
Hepatocellular adenomaLymphoma malignant lymphocytlc
MesentervPharynxStomach
Forestomach, squamous papilloma
CARDIOVASCULAR SYSTEMHeart
Lymphoma malignant lymphocytlc
ENDOCRINE SYStSMAdrenal gland
Lymphoma malignant lymphocytlc
GENERAL BODY SYSTEMNone
GENITAL SYSTEMOvary
Granulosa cell tumorBilateral, lymphoma malignant
lymphocytlcUterus
Lymphoma malignant lymphocytlcPolyp fatromal
tfEMATOPOlEtlC SYSTEMLymph node
Lymphoma malignant lymphocytlcLumbar lymphoma mahg lymphocvticMesentenc, lymphoma malignant
lymphocvticRenal, lymphoma mahg Ivmphocytic
SpieenLymphoma malignant lymphocytlcLympnoma malignant mixed
ThymusLymphoma malignant lymphocytlc
INTEGUMENTARY SYSTEMMammary gland
Basosquamous tumor benignSkin
Subcutaneous tissue, lymphomamalignant lymphocytlc
MUSCULOSKELETAL SYSTEMBone
Lymphoma malignant lymphocytlcSkeletal muscle
Lymphoma malignant lymphocytlc
NERVOUS SYSTEMSpinal cord
RESPIRATORY SYSTEMLung
Alveolar/bronchiolar adenoma
SPECIAL SENSES SYSTEMHardenan gland
URINARY SYSTEMNone
1 1 1 1 1 1 1 1 1 1 1 1 1 1 1 1 1 1 1 1 1 1 1 1 10 0 0 0 0 0 0 0 0 0 0 0 0 0 0 0 0 0 0 0 0 0 0 0 05 5 5 5 5 5 5 5 5 5 5 5 5 5 5 5 5 5 5 5 5 5 5 5 5
3 3 3 3 3 3 3 3 3 3 3 3 3 3 3 3 3 3 3 3 3 3 4 4 44 4 5 5 6 6 6 6 6 7 7 7 7 7 8 8 8 8 9 9 9 9 0 0 02 3 4 5 1 2 3 4 5 1 2 3 4 5 1 2 3 4 2 3 4 5 1 2 4
4 +4
4
4 4 4 4 - 4 - + + +X
+ -* + 4 + + + + 4 4X
X
4 +
4 + 4
X X
^
v
+X
.... . — — . •-1
TOTALTISSUESTUMORS
2521I1
143
11
1I
221
140
22
912
1192311
111
1
9
1
2
1
1L
2
151 2,4-Dichlorophenol, NTPTR 353
- - -
—-
-
• — ~
-
- - - -
-
- -
-——
—
- ————— -—
__ — ____ — ___
—
-
— ————— _———_—_
— —_—— • —-——— ___— __ —
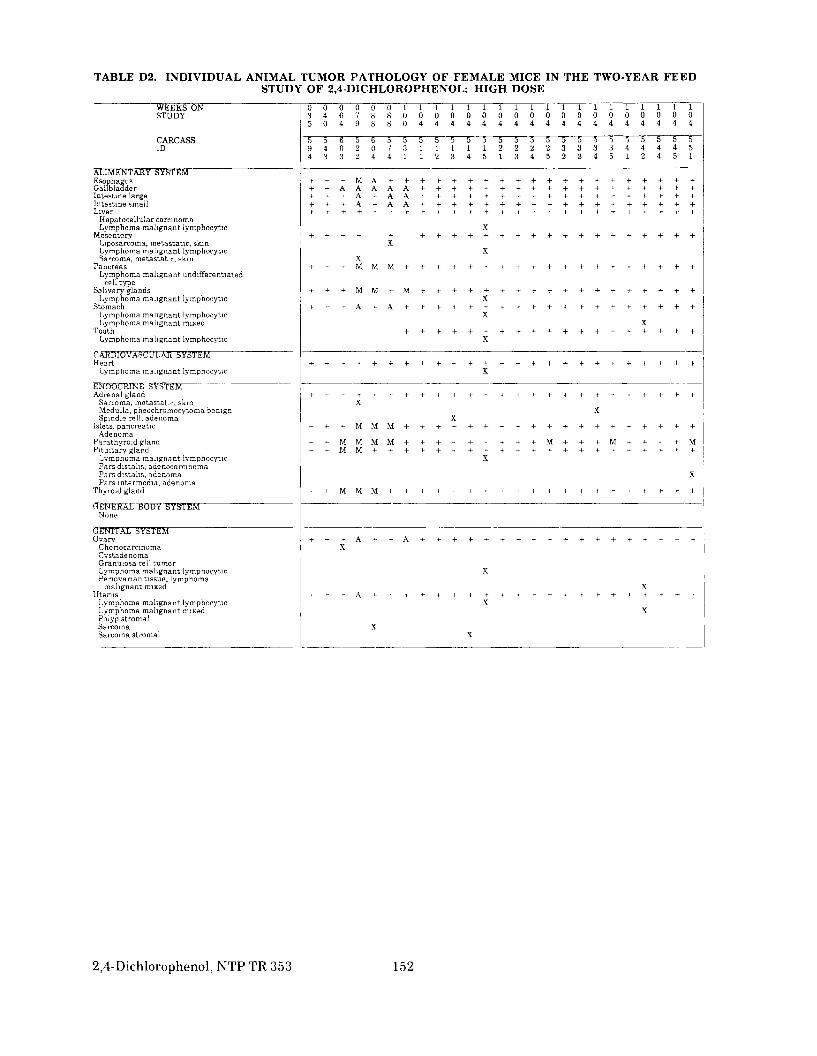
TABLE D2. INDIVIDUAL ANIMAL TUMOR PATHOLOGY OF FEMALE MICE IN THE TWO-YEAR FEEDSTUDY OF 2,4-DICHLOROPHENOL: HIGH DOSE
WEEKS ONSTUDY
CARCASSID
ALIMENTARY SYSTEMEsophagusGallbladderIntestine largeIntestine smallLiver
Hepatocellular carcinomaLymphoma malignant lymphocytlc
MesenteryLiposarcoma, metastatic, skinLymphoma malignant lymphocytlcSarcoma, metastatic, skin
PancreasLymphoma malignant undifferentiated
cell typeSalivary glands
Lymphoma malignant lymphocytlcStomach
Lymphoma malignant lymphocytlcLymphoma malignant rmxed
ToothLymphoma malignant lymphocytlc
CARDIOVASCULAR SYSTEMHeart
Lymphoma malignant lymphocytlc
ENDOCRINE SYSTEMAdrenal gland
Sarcoma, metastatic, skinMedulla, pheochromocytoma benignSpindle cell, adenoma
Islets, pancreaticAdenoma
Parathyroid glandPituitary gland
Lymphoma malignant lymphocytlcPars distahs, adenocarcmomaPars distahs, adenomaPars intermedia, adenoma
Thyroid gland
GENERAL BODY SYSTEMNonp
GENITAL SYSTEMOvary
0 0 0 0 0 0 1 1 1 1 1 1 1 1 1 1 1 1 1 1 1 1 1 1 13 4 6 7 8 8 0 0 0 0 0 0 0 0 0 0 0 0 0 0 0 0 0 0 0
5 5 6 5 6 5 5 5 5 5 5 5 5 5 5 5 5 5 5 5 5 5 5 5 59 4 0 2 0 7 3 1 1 1 1 1 2 2 2 2 3 3 3 3 4 4 4 4 54 3 3 2 4 4 1 1 2 3 4 5 1 3 4 5 2 3 4 5 1 2 4 5 1
+ + A A A A A + + + + + + + + + + + + + + + + + +
X
XX
X
X
XX
X
X
J + + + . ^ J r J r + + ^ + + + + + + + + + + + + + + +.X
XX
+ - M M M M + + + + + + + + + M + + + - M + 4 - + M
X
X
+ + M M M f + + + 4 - - H + + + + + + f + + + + + ^ +
ChonocarcinomaCystadenomaGranulosa cell tumorLymphoma malignant lymphocytlcPenovanan tissue, lymphoma
malignant mixedUterus
Lymphoma malignant lymphocytlcLymphoma malignant mixedPolyp stromalSarcomaSarcoma stroma!
2,4-Dichlorophenol, NTP TR 353 152
r
-
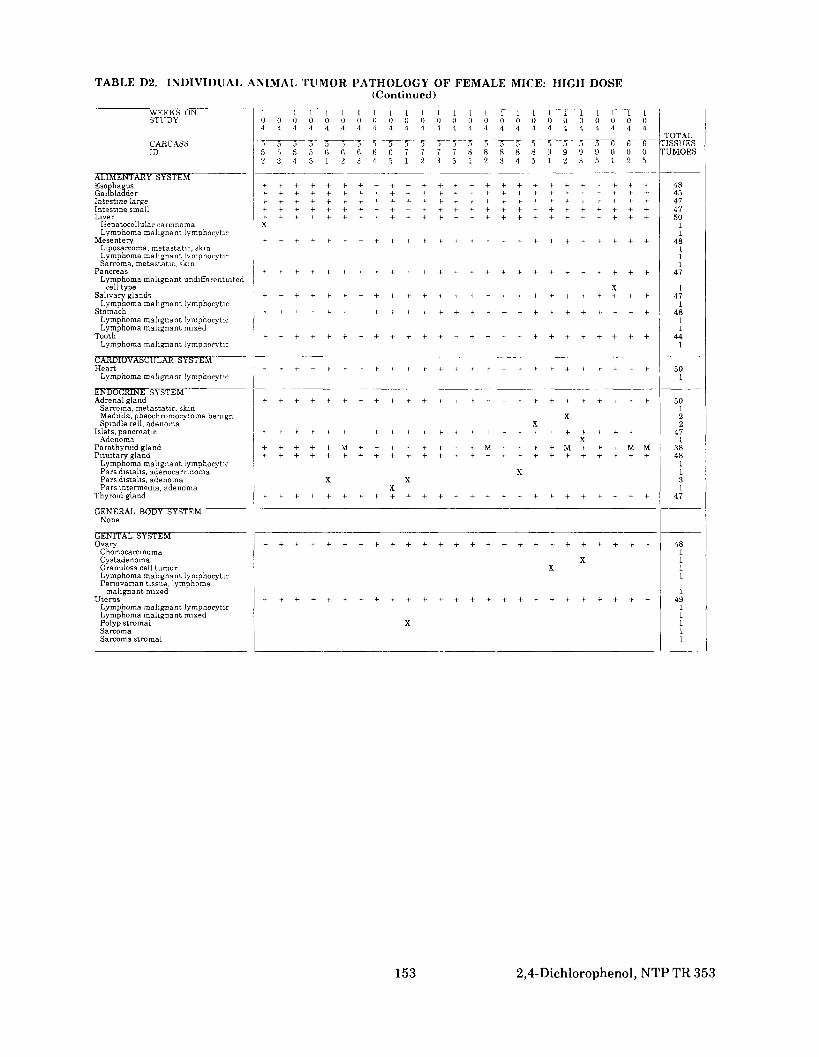
TABLE D2. INDIVIDUAL ANIMAL TUMOR PATHOLOGY OF FEMALE MICE: HIGH DOSE(Continued)
WEEKS ONSTUDY
CARCASSID
ALIMENTARY SYSTEMEsophagusGallbladderIntestine largeIntestine smallLiver
Hepatocellular carcinomaLymphoma malignant lymphocytlc
MesenteryLiposarcoma, metastatic, skinLymphoma malignant IvmphocyticSarcoma, metastatic, skin
PancreasLymphoma malignant undifferentiated
cell typeSalivary glands
Lvmphoma malignant IvmphocvticStomach
Lymphoma malignant IvmphocyticLymphoma malignant mixed
ToothLymphoma malignant lymphocytlc
CARDIOVASCULAR SYSTEMHeart
Lymphoma malignant lymphocytlc
ENDOCRINE SYSTEMAdrenal gland
Sarcoma, metastatic, skinMedulla, pheochromocytoma benignSpindle cell, adenoma
Islets, pancreaticAdenoma
Parathyroid glandPituitary gland
Lymphoma malignant lymphocytlcPars distahs, adenocarcinomaPars distahs, adenomaPars intermedia, adenoma
Thyroid gland
GENERAL BODY SYSTEMNone
GENITAL SYSTEMOvarv
ChonocarcinomaCystadenomaGranulosa cell tumorLymphoma malignant IvmphocyticPenovanan tissue, lymphoma
malignant mixedUterus
Lymphoma malignant lymphocytlcLymphoma malignant mixedPolyp stromalSarcomaSarcoma stromal
1 L 1 1 1 1 1 1 1 1 1 1 1 1 1 1 1 1 I 1 1 1 1 1 10 0 0 0 0 0 0 0 0 0 () 0 0 0 0 0 0 0 0 0 0 0 0 0 0
5 5 5 5 5 5 5 5 5 5 5 5 5 5 5 5 5 5 5 5 5 5 6 6 65 5 5 5 6 6 6 6 6 7 7 7 7 8 8 8 8 8 9 9 9 9 0 0 02 3 4 5 1 2 3 4 5 1 2 3 5 1 2 3 4 5 1 2 3 5 1 2 5
+ + + + + t + + + + i t 4 + + + + + + + +" + + + +
X
X
+ + + + + + + + + + + + + + + + + + + + + + + + +
+ + + + + + + + + + + + + + + + + + + + + + +
XX
X+ + + + + M + + + + + + + + M + + + + M + + + M M
XX X
X
XX
X
TOTALTISSUESTUMORS
484547475011
48111
47
1471
4811
441
501
50122
47I
38481131
47
481111
14911111
153 2,4-Dichlorophenol, NTP TR 353
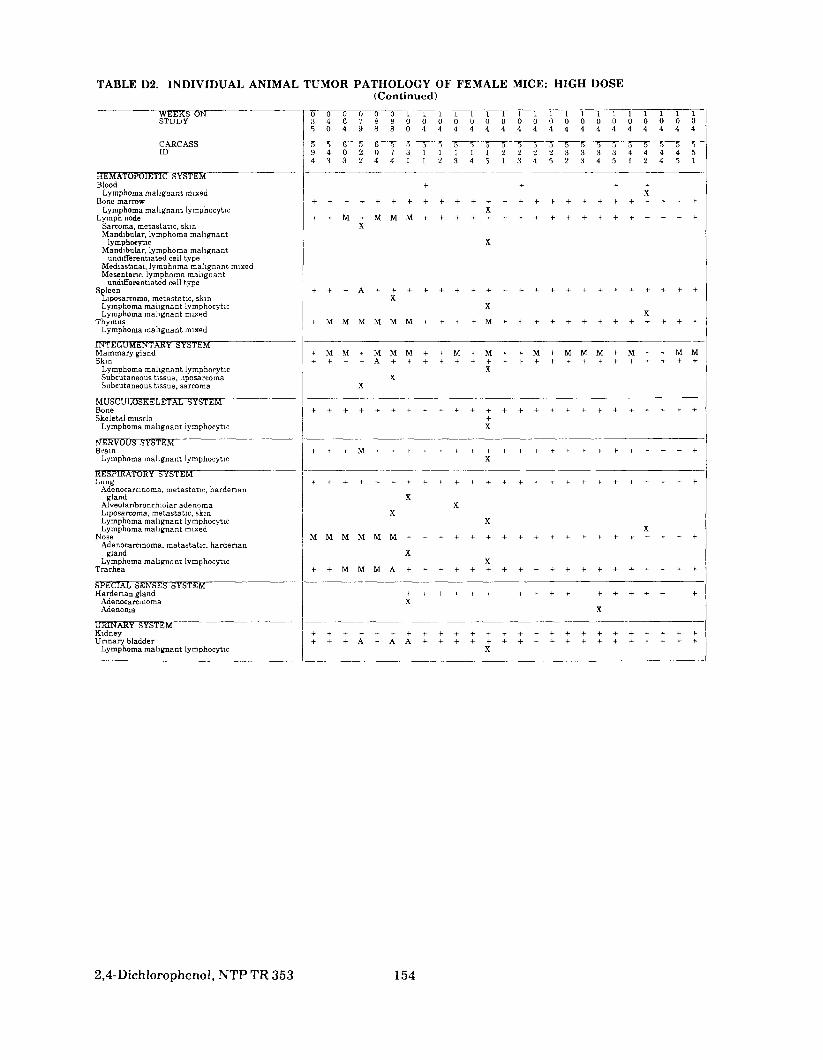
TABLE D2. INDIVIDUAL ANIMAL TUMOR PATHOLOGY OF FEMALE MICE: HIGH DOSE(Continued)
WEEKS ONSTUDY
CARCASSID
HEMATOPOIETIC SYSTEMBlood
Lymphoma malignant mixedBone marrow
Lymphoma malignant lymphocyticLymph node
Sarcoma, metastatic, skinMandibular, lymphoma malignant
lymphocyticMandibular, lymphoma malignant
undifferentiated cell typeMediastmal, lymphoma malignant mixedMesentenc, lymphoma malignant
undifferentiated cell typeSpleen
Liposarcoma, metastatic, skinLymphoma malignant lymphocyticLymphoma malignant mixed
ThymusLymphoma malignant mixed
INTEGUMENTARY SYSTEMMammary glandSkin
Lymphoma malignant lymphoryticSubcutaneous tissue, hposarcomaSubcutaneous tissue, sarcoma
MUSCULOSKELETAL SYSTEMBoneSkeletal muscle
Lymphoma malignant lymphocytic
NERVOUS SYSTEMBrain
Lymphoma malignant lymphocytic
RESPIRATORY SYSTEMLung
Adenocarcmoma, metastatic, hardenangland
Alveolar/bronchiolar adenomaLiposarcoma, metastatic, skinLymphoma malignant lymphocyticLymphoma malignant mixed
NoseAdenocarcmoma, metastatic, hardenan
glandLymphoma malignant lymphocytic
Trachea
SPECIAL SENSES SYSTEMHardenan gland
AdenocarcmomaAdenoma
URINARY SYSTEMKidneyUrinary bladder
Lymphoma malignant lymphocytic
o o b o o o i i i i i i i i i i i i i i i i i i i3 4 6 7 8 8 0 0 0 0 0 0 0 0 0 0 0 0 0 0 0 0 0 0 0
5 5 6 5 6 5 5 5 5 5 5 5 5 5 5 5 5 5 5 5 5 5 5 5 59 4 0 2 0 7 3 1 1 1 1 1 2 2 2 2 3 3 3 3 4 4 4 4 54 3 3 2 4 4 1 1 2 3 4 5 1 3 4 5 2 3 4 5 1 2 4 5 1
+• + + +X
X
X
X
XX
X4 - M M M M M M + + + + M+ + + + + + + + + + + + +
-•-
+ M M + M M M + + M + M + + M + M M M + M - H + M M
XX
X
+ + + + + + + + + + + + + + + + + + + + + + + + +-tX
X
XX
XX
X
XX
1 + M M M A + + + + + + + + + + + + + + + + + + +
+ -t + -t. + + + + + + + + + + + +X
X
+ + + + + ^ + + + + + + + + + + + + + + + + + + ++ + + A - f A A + -t- + - l - - t - 4 - + + -t- + + + + 4- + + + +
X
2,4-Dichlorophenol, NTP TR 353 154
- —
— •———— ——
-
-
-

TABLE D2. INDIVIDUAL ANIMAL TUMOR PATHOLOGY OF FEMALE MICE: HIGH DOSE(Continued)
WEEKS ONSTUDY
CARCASSID
HEMATOPOIETIC SYSTEMBlood
Lymphoma malignant mixedBone marrow
Lymphoma malignant lymphocyticLymph node
Sarcoma, metastatic, skinMandibular, lymphoma malignant
lymphocyticMandibular, lymphoma malignant
undifTerentiated cell typeMediastinal, lymphoma mahg. mixedMesentenc, lymphoma malignant
undifferentiated cell typeSpleen
Liposarcoma, metastatic, skinLymphoma malignant lymphocyticLymphoma malignant mixed
ThymusLymphoma malignant mixed
INTEGUMENTARY SYSTEMMammary glandSkin
Lymphoma malignant lymphocyticSubcutaneous tissue, hposarcomaSubcutaneous tissue, sarcoma
MUSCULOSKELETAL SYSTEMBoneSkeletal muscle
Lymphoma malignant lymphocytic
NERVOUS SYSTEMBrain
Lymphoma malignant lymphocytic
RESPIRATORY SYSTEMLung
Adenocarcinoma, metastatic, hardenangland
Alveolar/bronchiolar adenomaLiposarcoma, metastatic, skinLymphoma malignant lymphocyticLymphoma malignant mixed
NoseAdenocarcinoma, metastatic, hardenan
glandLymphoma malignant lymphocytic
Trachea
SPECIAL SENSES SYSTEMHardenan gland
AdenocarcinomaAdenoma
URINARY SYSTEMKidneyUnnary bladder
Lymphoma malignant Ivmphocytic
1 1 1 1 1 1 1 1 1 1 1 1 1 1 1 L 1 1 1 1 1 1 1 1 10 0 0 0 0 0 0 0 0 0 0 0 0 0 0 0 0 0 0 0 0 0 0 0 0
5 5 5 5 5 5 5 5 5 5 5 5 5 5 5 5 5 5 5 5 5 5 6 6 65 5 5 5 6 6 6 6 6 7 7 7 7 8 8 8 8 8 9 9 9 9 0 0 02 3 4 5 1 2 3 4 5 1 2 3 5 1 2 3 4 5 1 2 3 5 1 2 5
-t- + 4-
XX
X
X
X
+ + + 4 + ^ + + + + t + + + + + + + + + + + + +
+ + + + + + + + + + + + + + + + + + + + + + + +
X
X
4- + + -t- + ^ f » + f + 4 - 4 - + + + + - > - - t - ^ + + + + +
TOTAL:TISSUESTUMORS
71
501
461
1
11
149
112
421
2949111
5011
481
50
12I11
44
11
46
4112
50471
!
155 2,4-Dichlorophenol, NTP TR 353
-
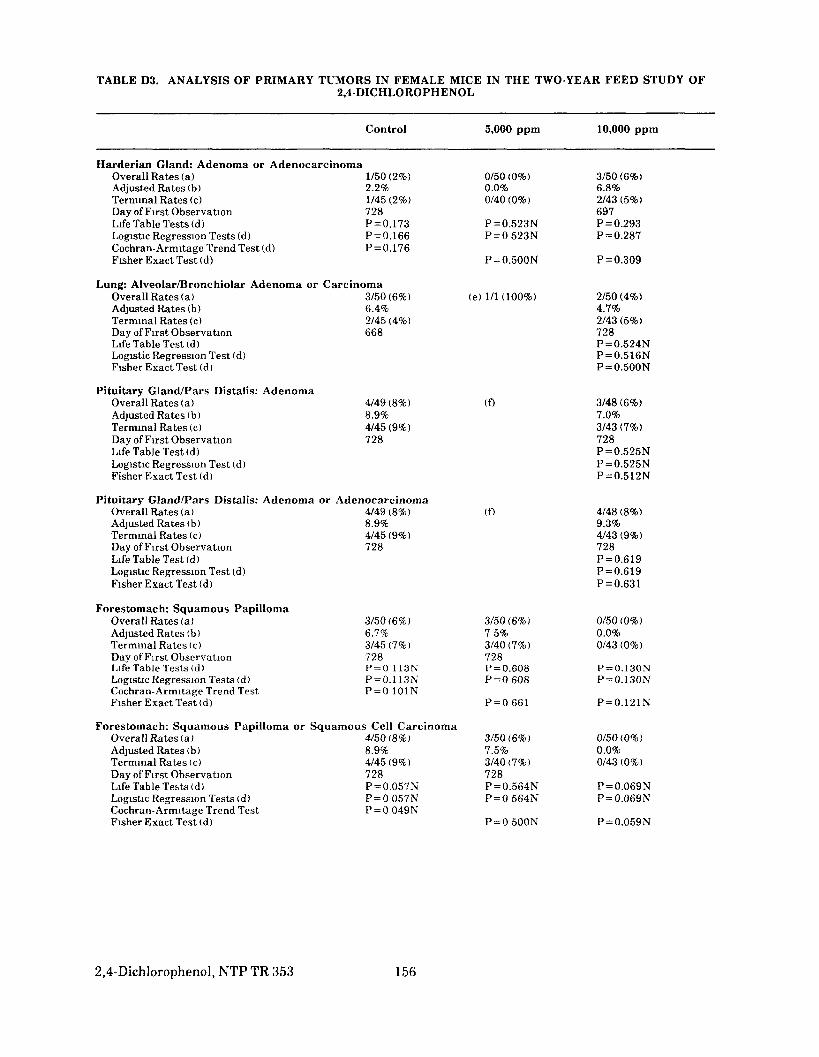
TABLE D3. ANALYSIS OF PRIMARY TUMORS IN FEMALE MICE IN THE TWO-YEAR FEED STUDY OF2,4-DICHLOROPHENOL
Control 5,000 ppm 10,000 ppm
Harderian Gland: Adenoma or AdenocarcinomaOverall Rates (a)Adjusted Rates (b)Terminal Rates (c)Day of First ObservationLife Table Tests (d)Logistic Regression Tests (d)Cochran-Armitage Trend Test (d)Fisher Exact Test (d)
Lung: Alveolar/Bronchiolar Adenoma orOverall Rates (a)Adjusted Rates (b)Terminal Rates (c)Day of First ObservationLife Table Test (d)Logistic Regression Test (d)Fisher Exact Test (d)
Pituitary Gland/Pars Distalis: AdenomaOverall Rates (a)Adjusted Rates (b)Terminal Rates (c)Day of First ObservationLife Table Test (d)Logistic Regression Test (d)Fisher Exact Test (d)
Pituitary Gland/Pars Distalis: AdenomaOverall Rates (a)Adjusted Rates (b)Terminal Rates (c)Day of First ObservationLife Table Test (d)Logistic Regression Test (d)Fisher Exact Test (d)
Forestomach: Squamous PapillomaOverall Rates (a)Adjusted Rates (b)Terminal Rates (c )Day of First ObservationLife Table Tests (d)Logistic Regression Tests (d)Cochran-Armitage Trend TestFisher Exact Test (d)
1/50 (2%)2.2%1/45 (2%)728P 0.173P 0.166P 0.176
Carcinoma3/50(6%)6.4%2/45 (4%)668
4/49 (8%)8.9%4/45 (9%)728
or Adenocarcinoma4/49 (8%)8.9%4/45 (9%)728
3/50(6%)6.7%3/45 (7%)728P 0 113NP 0.113NP 0 101N
0/50 (0%)0.0%0/40 (0%)
P 0.523NP 0523N
P 0.500N
(e) 1/1 (100%)
(f)
(f)
3/50 (6%)75%3/40(7%)728P 0.608P 0608
P 0661
3/50 (6%)6.8%2/43 (5%)697P 0.293P 0.287
P 0.309
2/50 (4%)4.7%2/43 (5%)728P 0.524NP 0.516NP 0.500N
3/48 (6%)7.0%3/43 (7%)728P 0.525NP 0.525NP 0.512N
4/48 (8%)9.3%4/43 (9%)728P 0.619P 0.619P 0.631
0/50 (0%)0.0%0/43 (0%)
P 0.130NP 0.130N
P 0.121N
Forestomach: Squamous Papilloma or Squamous Cell CarcinomaOverall Rates (a)Adjusted Rates (b)Terminal Rates (c)Day of First ObservationLife Table Tests (d)Logistic Regression Tests (d)Cochran-Armitage Trend TestFisher Exact Test (d)
4/50(8%)8.9%4/45 (9%)728P 0.057NP 0057NP 0049N
3/50(6%)7.5%3/40(7%)728P 0.564Np 0 564N
P 0500N
0/50(0%)0.0%0/43(0%)
P 0.069NP 0.069N
P 0.059N
2,4-Dichlorophenol, NTP TR 353 156
= = =
= = =
= = =
= =
=
= =
=
= =
=
= =
=
= = =
= = =
= = =
= =
=
= =
=

TABLE D3. ANALYSIS OF PRIMARY TUMORS IN FEMALE MICE IN THE TWO-YEAR FEED STUDY OF 2,4-DICHLOROPHENOL (Continued)
Contr 01 5,000 p p m 10,000 p p m
Hematopoietic System: Lymphoma, All Malignant Overall Rates ( a ) 12/50(24%) (e,g)6/50(12%) 4/50 (8%) AdjusLed Rates (b) 26.1% 14.1% 9.3% Terminal Rates ( c ) 11/45(24%) 4/40 (10%) 4143 (9%) Day of First Observation 679 616 728 Life Table Tests (d) P =0.025N P =0.156N P=0.036N Logistic Regression Tests td) P =0.022;r; P=0.118N P = 0.036N Cochrsn-Armitage Trend Test td) P=0.017N Fisher Exact Test (d) P =0.096N P =0.027N
( i i )Number oftumor-bearing animals/number of animals examined at the site (1)) Kaplan-Meier estimated tumor incidences at the end of the study after adjusting for intercurrent mortality ((:) Observed tumor incidence a t terminal kill ( d ) Beneath the control incidence are the P values associated with the trend test. Beneath the dosed group incidence are the P values corresponding to pairwise comparisons between that dosed group and the controls. The life table analysis regards tamors in animals dying prior to terminal kill as being (directly or indirectly) the cause of death. The logistic regression test regards these lesions as nonfatal. The Cochran-Armitage and Fisher exact tests compare directly the overall incidence rates. A negative trend or lower incidence in a dosed group is indicated by (N). ( e )Incomplete sampling of tissue (f7 No tissues were examined for the 5,000-ppm group. (g)Five livers and nine spleens were examined microscopically.
157 2,4-Dichlorophenol,NTP TR 353

TABLE D4a. HISTORICAL INCIDENCE OF STOMACH SQUAMOUS CELL TUMORS IN FEMALE B6C3F1 MICE RECEIVING NO TREATMENT (a)
I-. .--Study Incidence in Controls
Historical Incidence at Battelle Columbus Laboratories
N-F’henyl.2-naphthylamine 1149 I-Ascorbic acid 1/49 All others 01244
TOTAL (b) W342 (0.6%) SD (c) 0.79%
Overall Historical Incidence
TOTAL (d) 18/1,994 (0.9%) SD (c) 1.75%
Range (e) High 4/50 Low 0150
(al Data a s of April 29,1987, for studies ofa t least 104 weeks ( h )Squamous cell papillomas (c 1 Standard deviation (d)Includes 13 squamous papillomas, 1papilloma, NOS, 3 papillomatoses, and 1squamous cell carcinoma ( e )Range and SD are presented for groups of 35 or more animals.
2,4Dichlorophenol, NTP TR 353 158
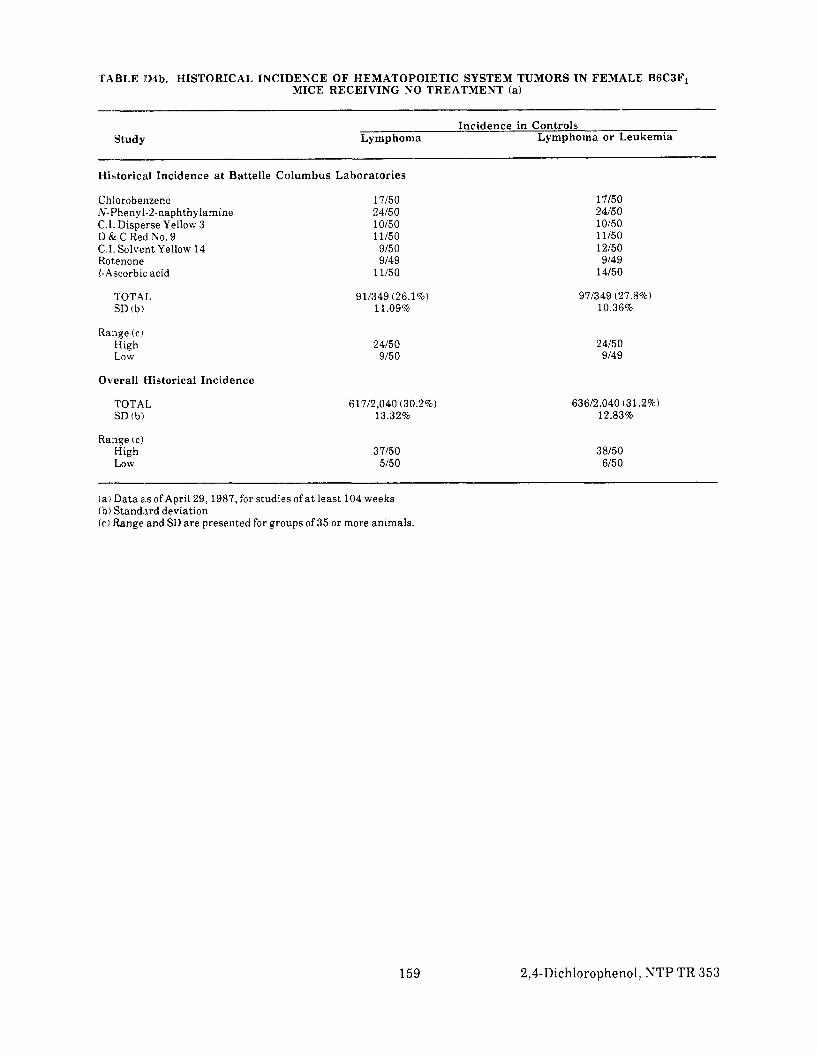
TABLE 1D4b. HISTORICAL INCIDENCE O F HElMATOPOIETIC SYSTEM TUMORS IN FEMALE B6C3F1 MICE RECEIVING NO TREATMENT (a)
Study Lymphoma
Historical Incidence a t Battelle Columbus Labora tor ies
Chlorobenzene ~%-Phenyl-2-naphthylamine (2.1 Disperse Yellow 3 D & C Red No. 9 C.1 Solvent Yellow 14 Rotenone I-Ascorbic acid
TOTAL SD tb)
Range ( c ) High Low
Overall IHistorical Incidence
TOTAL SD (b)
Range ( c ) High Low
17/50 24/50 10150 11/50 9/50 9/49
11/50
911349 (26.1%) 11.09%
24/50 9/50
61712,040 (30.2%) 13.32%
37/50 5/50
( a )Data as of April 29,1987, for studies of a t least 104 weeks ( b )Standard deviation (0Range and SD are presented for groups of 35 or more animals.
Inc idence in Controls Lymphoma o r Leukemia
17/50 24/50 10150 11/50 12/50 9/49
14/50
971349 (27.8%) 10.36%
24/50 9/49
63612,040 (31.2%) 12.83%
38/50 6/50
159 2,4-Dichlorophenol,NTP TR 353
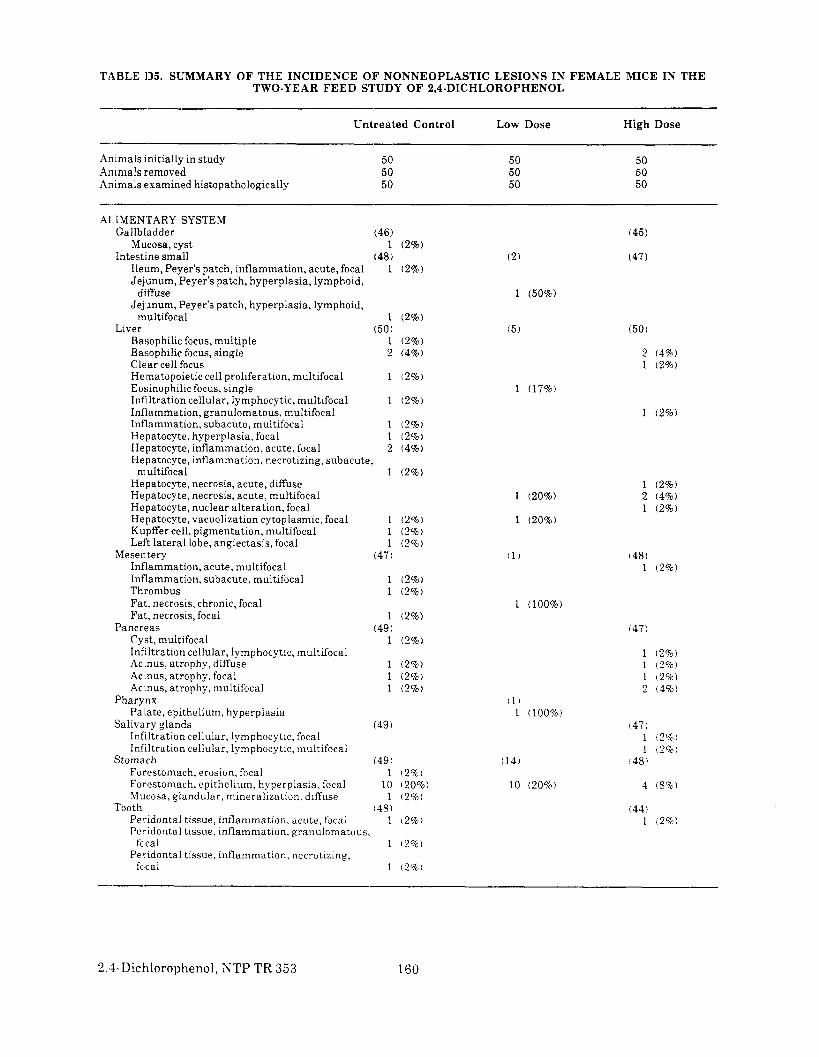
TABLE 135. SUMMARY OF THE INCIDENCE OF NONNEOPLASTIC LESIONS IN FEMALE MICE IN THE TWO-YEAR FEED STUDY OF 2,l-DICHLOROPHENOL
Untreated Control Low Dose High Dose
Animals initially in study 50 50 50 Animals removed 50 50 50 Animals examined histopathologically 50 50 50
ALSMEN'I'ARY SYSTEM Gallbladder (46) (45)
Mucosa, cyst 1 (2%) Intestine small (48) (47)
Ileum, Peyer's patch, inflammation, acute, focal 1 (2%) Jejunum, Peyer's patch, hyperplasia, lymphoid,
diffuse 1 (50%)Jej,unum, Peyer's patch, hyperplasia, lymphoid,
multifocal 1 (2%) Liver (50) (5) (50)
Basophilic focus, multiple 1 (2%) Basophilic focus, single 2 (4%) 2 (4%) Clear cell focus 1 (2%) Hematopoietic cell proliferation, multifocal 1 (2%) Eosinophilic focus, single 1 (17%)Infiltration cellular, lymphocytic, multifocal 1 (2%) Inflammation, granulomatous, multifocal 1 (2%)Inflammation, subacute, multifocal 1 ( 2 % ) Hepatocyte, hyperplasia, focal 1 (2%)Hepatocyte, inflammation, acute, focal 2 (4%) Hepatocyte. inflammation. necrotizing. subacute.. . -
multifocal I
1 12%) Hepatocyte, necrosis, acute, diffuse 1 (2%)Hepatocyte, necrosis, acute, multifocal 1 (20%) 2 (4%)Hepatocyte, nuclear alteration, focal 1 (2%)Hepatocyte, vacuolization cytoplasmic, focal 1 (2%) 1 (20%)Kupffer cell, pigmentation, multifocal 1 (2%) Left lateral lobe, angiectasis, focal 1 (2%)
Mesel: tery (47) (1 ) (48)Inflammation, acute, multifocal 1 (2%)Inflammation, subacute, multifocal 1 (2%)Thrombus 1 (2%) Fat, necrosis, chronic, focal 1 (100%)Fal;, necrosis, focal 1 (2%)
Pancmas (49) (47)Cyst, multifocal 1 (2%) Infiltration cellular, lymphocytic, multifocal 1 (2%)Acinus, atrophy, diffuse 1 (2%) 1 ( 2 % )Ac'inus, atrophy, focal 1 (2%) 1 (2%)Ac-inus, atrophy, multifocal 1 (2%) 2 (4%)
Pharynx (1) Palate, epithelium. hyperplasia 1 1100%)
Salivary glands (49) (47)Infiltration cellular, lymphocytic, focal 1 (2%)infiltration cellular, lymphocytic, multifocal 1 ( 2 % )
Stomach (49) (14) 148)Forestomach, erosion, focal 1 ( 2 % )Forestomach, epithelium, hyperplasia, focal 10 (20%) 10 (20%) 4 (8%)Mucosa, glandular, mineralization, diffuse 1 (2%)
Tooth (48) (44)Peridontal tissue, inflammation. acute, focal I (2%) 1 (2%)Pel-idontal tissue. inflammation, granuloniatous.
fcscal I ( 2 % ) Peiridontal tissue, inflammation, necrotizing,
focal I ( 2 % )
2,-LDichlorophenol, NTP TR 353 160

TABLE 1D5. SUMMARY OF THE INCIDENCE OF NONNEOPLASTIC LESIONS IN FEMALE MICE IN THE TWO-YEAR FEED STUDY OF 2,4-DICHLOROPHENOL (Continued)
Unt rea ted Control Low Dose High Dose
CARDIOVASCULAR SYSTEM Heart
Myocardium, mineralization, multifocal (50)
1 ( 2 % ) (1) (50)
ENDOCRINE SYSTEM Adrenal gland
Cortex, focal cellular change Cortex, hyperplasia, focal Medulla, hyperplasia, focal Medulla, hypertrophy Spindle cell, hyperplasia, diffuse Spindle cell, hyperplasia, multifocnl Subcapsular, cyst
Parathyroid gland Cy;jt Hyperplasia, focal
Pars distalis, angiectasis, focal Pars distalis, cyst Pars distalis, hyperplasia, focal Pars distalis, hyperplasia, multifocal Pars intermedia, hyperplasia, focal
Ectopic tissue Follicle, cyst Follicle, cyst, multiple Follicle, inflammation, granulomatous, focal Follicle, inflammation, subacute, multifocal Follicular cell, hyperplasia, cystic, focal Follicular cell, hyperplasia, multifocal
Pituitary gland
Thyroid gland
(49)3 (6%) 2 (4%) 2 (4%) 1 (2%)
45 (92%) 1 (2%) 1 (2%)
1 (3%)(39)
1 (3%) (49)
1 (2%)
3 (6%) 3 (6%)2 (4%)
1 (2%)
1 (2%)
(49)
1 (2%)
( 5 0 )
47 (94%) 1 (2%)
(38)
(48) 1 (2%) 1 (2%)3 (6%) 1 (2%)
(47)
2 (4%) 1 (2%) 1 (2%)1 (2%) 1 (2%) 3 (6%)
GENERA.L BODY SYSTEM None
GENITAIL SYSTEM Ovary (48)
Angiectasis, diffuse 1 (2%) Cyst 1 (2%) Hyperplasia, focal Bilateral, abscess, chronic active, multifocal 1 (2%) Bilateral, periovarian tissue, cyst 1 (2%) Folilicle, cyst 2 (4%)
Left, follicle, cyst 2 (4%)Periovarian tissue, cyst 1 (2%)
Right, follicle, cyst 1 ( 2 % )
Left, abscess, chronic, focal Left, periovarian tissue, cyst 3 (6%)
Right, abscess, chronic active, single Right, periovarian tissue, cyst 4 (8%)
Uterus (49) Hyperplasia, cystic, glandular, diffuse Endometrium, angiectasis
Endometrium, hyperplasia, cystic, glandular,
Endometrium, inflammation, suppurative, focal Endometrium, metaplasia, squamous 1 (2%) Lumen, dilatation 3 (6%) Lumen, dilatation, diffuse 1 (2%)
Endometrium, angiectasis, focal 1 (2%)
diffuse 48 (98%)
1 2 2 2 4 1 3 1 6 1
(40)
38 1
(5%) (9%) (9%) (9%) (18%) (5%) (14%) (5%) (27%) (5%)
(95%) (3%)
(48)
1
2 5
3 1 5
2
(49)1 1
44
(2%)
(4%) (10%)
( 6 % ) (2%) (10%)
(4%)
(2%) (2%)
(90%)
(2%) (2%) (2%)
161 2,CDichlorophenol,NTP TR 353

TABLE 135. SUMMARY OF THE INCIDENCE OF NONNEOPLASTIC LESIONS IN FEMALE MICE IN THE TWO-YEAR FEED STUDY OF 2,4-DICHLOROPHENOL (Continued)
-_.---Untreated Control Low Dose High Dose
HE:MATOPOIETIC SYSTEM Bone marrow
Lymph node Femoral, hyperplasia, neutrophil, diffuse
Bronchial, hyperplasia, lymphoid, diffuse
(50)
(48) 1 12%)
(9)
(50)
(46) 1 (2%)
Lumbar, hyperplasia, lymphoid, diffuse Lumbar, sinus, ectasia, focal 1 (2%)
1 111%)
Mandibular, hyperplasia, lymphoid, diffuse Mediastinal, hyperplasia, lymphoid, diffuse
1 (2%) 1 (2%)
Mediastinal, pigmentation, diffuse Mesenteric, angiectasis, diffuse
1 5
(2%) (10%)
Mesenteric, angiectasis, multifocal Mesenteric, hyperplasia, lymphoid, diffuse
1 (11%) 1 (11%)
Renal, hyperplasia, lymphoid, diffuse 1 111%) 1 (2%)
InE.ammation, chronic Spleer, (49)
1 (11%) 19) (49)
Capsule, inflammation, acute, diffuse Lymphoid follicle, depletion lymphoid, diffuse Lymphoid follicle, hyperplasia, lymphoid
2 1 (4%) (2%)
1 (2%) 1 (2%)
Lymphoid follicle, hyperplasia, lymphoid, diffuse 2 (4%) 1 111%) 4 18%)
Lymphoid follicle, hyperplasia, lymphoid,
Red pulp, angiectasis, multifocal multifocal 1
1 1 (2%)
Red pulp, hematopoietic cell proliferation, diffuse
Thymus Atrophy, diffuse Depletion lymphoid, diffuse
4 (47)
1 2
(2'%) (4%)
2 122%) (1)
2 (4%) 142)
1 12%) Medulla, hyperplasia, lymphoid, diffuse Thymocyte, necrosis, acute, diffuse
2 (5%) 1 12%)
INTEGU'MENTARY SYSTEM Skin
Face, subcutaneous tissue, inflammation, 148) 11) (49)
granulomatous, focal 1 (2%)
MLSCCLOSKE LETAL SYSTEM Bone (
Cranium, myelofibrosis Cranium, myelofibrosis, focal Crmium, myelofibrosis, multifocal Cranium, femur, myelofibrosis, diffuse Cranium, femur, myelofibrosis, multifocal Feinur, myelofibrosis, diffuse Feinur, myelofibrosis, focal Femur, myelofibrosis, multifocal Vertebra, myelofibrosis, multifocal
50) 12) (50) 2 (4%) 1 (2%)
1 (2%) 1 (2%) 2 (4%) 7 (14%)
2 (4%) 1 (2%) 4 (8%) 5 (10%)
19 (38%) 12 (24%) 1 (50%)
YFRVOIX SYSTEM Brain
Compression, focal Meninges, infiltration cellular, lymphocytic,
multifocal Thalamus, mineralization Third ventricle, infiltration cellular,
150)1 (2%)
3 (6%) 4 (8%)
(48)1 (2%)
1 (2%) 3 (6%)
lymphocytic, multifocal Spinal cord
'boracic, hemorrhage, acute, focal (1)
1 (100%)
1 12%)
2,4-Dic!hlorophenol, NTP TR 353 162
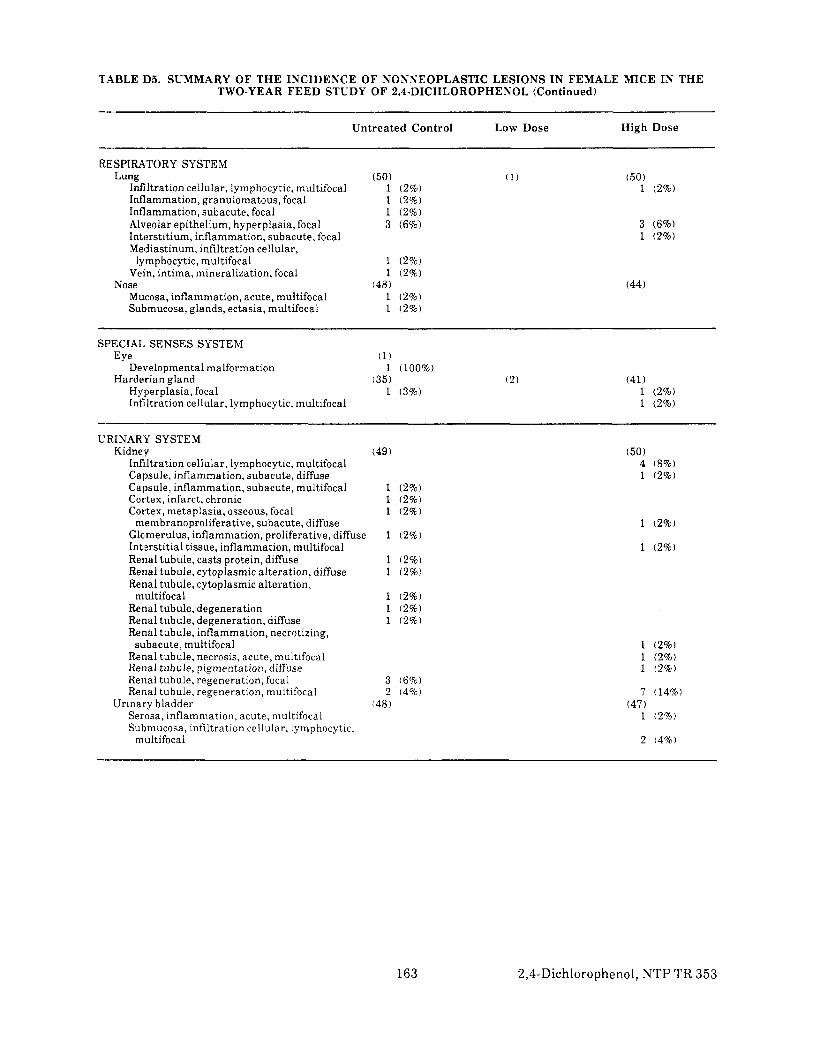
TABLE 135. SUMMARY O F T H E INCIDENCE O F NONNEOPLASTIC LESIONS I N FEMALE MICE I N T H E TWO-YEAR F E E D STLDY O F 2,4-DICHLOROPHENOL (Continued)
Unt rea ted Control Low Dose High Dose
RESPIRATORY SYSTEM Lung
Infiltration cellular, lymphocytic, multifocal Inflammation, granulomatous, focal Inflammation, subacute, focal Alveolar epithelium, hyperplasia, focal Interstitium, inflammation, subacute, focal Mediastinum, infiltration cellular,
lymphocytic, multifocal Vein, intima, mineralization, focal
Mucosa, inflammation, acute, multifocal Submucosa, glands, ectasia, multifocal
Nose
( 5 0 ) 1 (2%) 1 (2%) 1 (2%) 3 (6%)
1 (2%) 1 (2%)
t (2%) t (2%)
(48)
(50) t (2%)
3 (6%) 1 (2%)
(44)
SPECIAL SENSES SYSTEM Eye
Harderian gland Developmental malformation
Hyperplasia, focal Infiltration cellular, lymphocytic, multifocal
(1)
(35) 1 (100%)
1 (3%) (2 ) (41)
1 (2%)1 (2%)
~ ~ ~~
URINAR'Y SYSTEM Kidney
Infiltration cellular, lymphocytic, multifocal Capsule, inflammation, subacute, diffuse Capsule, inflammation, subacute, multifocal Cortex, infarct, chronic Cortex, metaplasia, osseous, focal
membranoproliferative, subacute, diffuse Glo~merulus, inflammation, proliferative, diffuse Int~arstitialtissue, inflammation, multifocal Renal tubule, casts protein, diffuse Renal tubule, cytoplasmic alteration, diffuse Renal tubule, cytoplasmic alteration,
Renal tubule, degeneration Renal tubule, degeneration, diffuse Renal tubule, inflammation, necrotizing,
Renal tubule, necrosis, acute, multifocal Renal tubule, pigmentation, diffuse Renal tubule, regeneration, focal Renal tubule, regeneration, multifocal
Serosa, inflammation, acute, multifocal Submucosa, infiltration cellular, lymphocytic,
multifocal
subacute, multifocal
Urinary bladder
multifocal
(49)
1 (2%) 1 (2%) 1 (2%)
1 (2%)
1 (2%) 1 (2%)
1 (2%) 1 (2%) 1 (2%)
3 (6%) 2 (4%)
(48)
(50)4 (8%) 1 (2%)
1 (2%)
1 (2%)
1 (2%) 1 (2%)1 (2%)
7 (14%)
t (2%)
2 (4%)
(47)
163 2,4-Dichlorophenol, NTP TR 353
1642,'2-Dichlorophenol, NTP TR 353

APPENDIX E
SENTINEL ANIMAL PROGRAM
PAGE
TABLE E l MURINE VIRUS ANTIBODY DETERMINATIONS FOR RATS AND MICE IN THE TWO-YEAR FEED STUDIES O F 2,4-DICHLOROPHENOL 167
165 2,4-Dichlorophenol, NTP TR 353
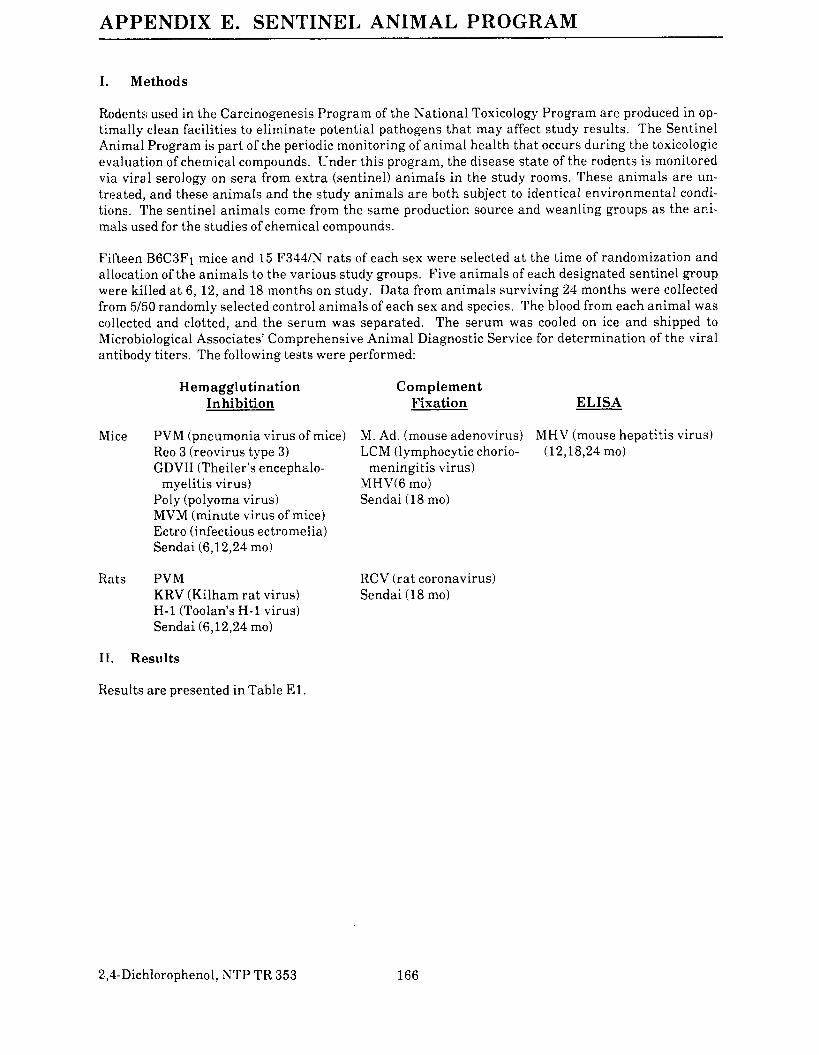
APP:ENDIX E. SENTINEL ANIMAL PROGRAM
I. Methods
Rodents used in the Carcinogenesis Program of the National Toxicology Program are produced in op-timally clean facilities to eliminate potential pathogens that may affect study results. The Sentinel Animal Program is part of the periodic monitoring of animal health that occurs during the toxicologic evaluation of chemical compounds. Under this program, the disease state of the rodents is monitored via viral serology on sera from extra (sentinel) animals in the study rooms. These animals are un- treated, and these animals and the study animals a re both subject to identical environmental condi- tions. The sentinel animals come from the same production source and weanling groups a s the ani- mals used for the studies of chemical compounds.
Fifteen B6C3F1 mice and 15 F344/N ra ts of each sex were selected a t the time of randomization and allocatifon of the animals to the various study groups. Five animals of each designated sentinel group were killed at 6, 12, and 18 months on study. Data from animals surviving 24 months were collected from 5/50 randomly selected control animals of each sex and species. The blood from each animal was collected and clotted, and the serum was separated. The serum was cooled on ice and shipped to Microbiological Associates’ Comprehensive Animal Diagnostic Service for determination of the viral antibody titers. The following tests were performed:
Hemagglutination Inhibition
Complement Fixation ELISA
Mice PVM (pneumonia virus of mice) Reo 3 (reovirus type 3)
M. Ad. (mouse adenovirus) LCM (lymphocytic chorio-
MHV (mouse hepatitis virus) (12,18,24mo)
GDVII (Theiler’s encephalo- meningitis virus) myelitis virus) MHV(6 mo)
Poly (polyoma virus) Sendai (18 mo) MVM (minute virus of mice) Ectro (infectious ectromelia) Sendai (6,12,24mo)
Rats PVM RCV (rat coronavirus) KRV (Kilham rat virus) Sendai (18 mo) H-1 (Toolan’s H-1 virus) Sendai (6,12,24mo)
II . Results
Results are presented in Table E l .
2,4-Dichlorophenol, NTP TR 353 166
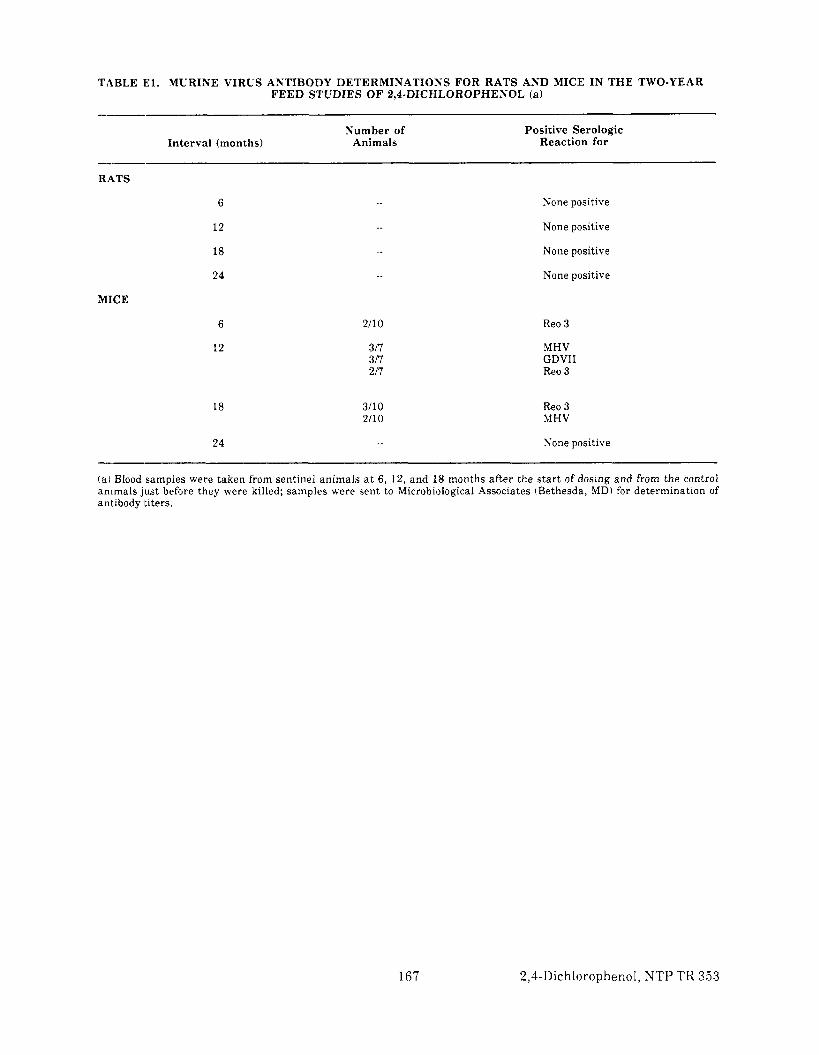
---
TABLE E l . MURINE VIRUS ANTIBODY DETERMINATIONS FOR RATS AND MICE IN THE TWO-YEAR FEED STUDIES OF 2,4-DICHLOROPHENOL (a)
In t e rva l (months) Number of
Animals Posit ive Serologic
React ion for
RATS
6 None positive
12 None positive
18 None positive
24 None positive
MICE
6 2110 Reo 3
12 317 MHV 3I7 GDVII 217 Reo 3
18 3/10 Reo 3 2/10 MHV
24 None positive
(al Blood samples were taken from sentinel animals a t 6, 12, and 18 months after the s tar t of dosing and from the control animals just before they were killed; samples were sent to Microbiological Associates (Bethesda, MD) for determination of antibody titers.
167 2,4-Dichlorophenol, NTP TR 353

2.1-Dichlorophenol,NTP TR 353 168

APPENDIX F
FEED AND COMPOUND CONSUMPTION BY
RATS AND MICE IN THE TWO-YEAR FEED STUDIES
OF 2,4-DICHLOROPHENOL
PAGE
TABLE F1 FEED AND COMPOUND CONSUMPTION BY MALE RATS IN THE TWO-YEAR FEED STUDY OF 2.4-DICHLOROPHENOL 170
TABLE F2 FEED AND COMPOUND CONSUMPTION BY FEMALE RATS IN THE TWO-YEAR FEED STUDY O F 2,CDICHLOROPHENOL 171
TABLE F3 FEED AND COMPOUND CONSUMPTION BY MALE MICE IN THE TWO-YEAR FEED STUDY O F 2.4-DICHLOROPHENOL 172
TABLE F4 FEED AND COMPOUND CONSUMPTION BY FEMALE MICE IN THE TWO-YEAR FEED STUDY O F 2.4-DICHLOROPHENOL 173
169 2,4-Dichlorophenol, NTP TR 353
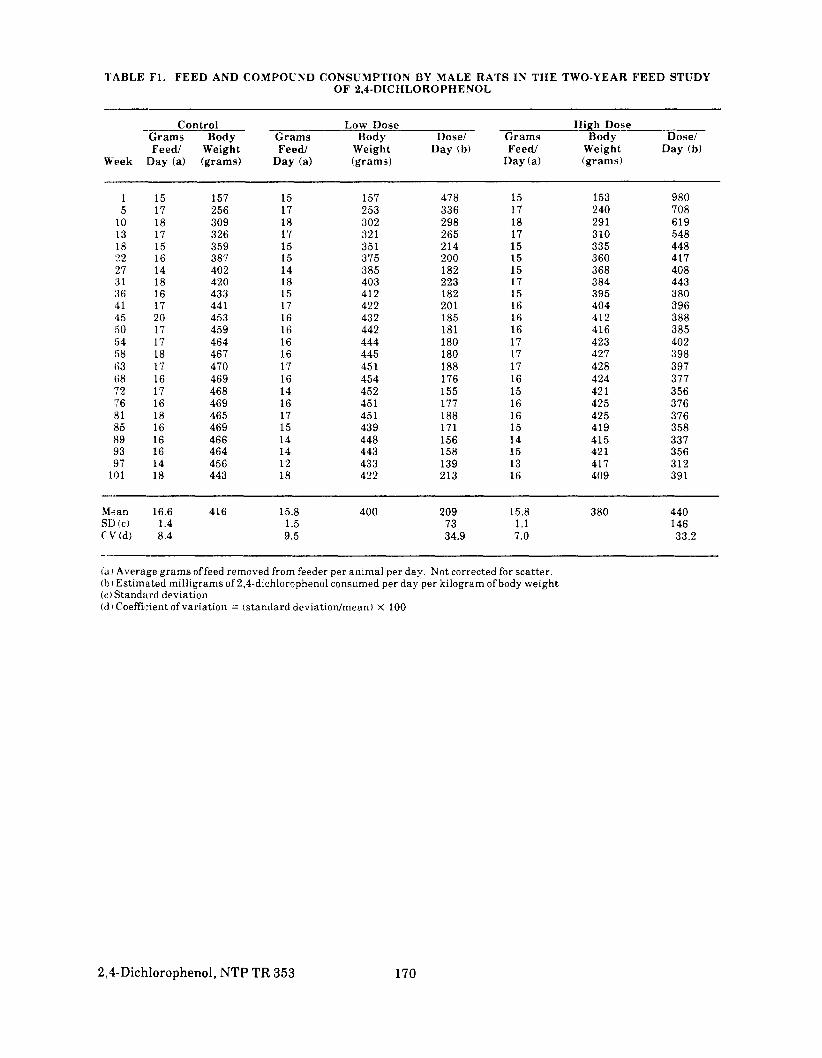
IABLE F1. FEED AND COMPOUND CONSUMPTION BY MALE RATS IN THE TWO-YEAR FEED STUDY OF 2,4-DICHLOROPHENOL
Week
-_ Control G r a m s Body Feedl Weight
]Day (a) (grams)
G r a m s F e e d
Day (a)
Low Dose Body
Weight(grams)
Dose/ Day (b)
G r a m s Feedl
Day (a)
High Dose Body
Weight (grams)
Dose/ Day (b)
~ ~ ~ ~~ ~~
1 15 157 15 157 478 15 153 980 5 17 256 17 253 336 17 240 708
LO 18 309 18 302 298 18 291 619 13 17 326 17 321 265 17 310 548 18 15 359 15 351 214 15 335 448 22 16 387 15 375 200 15 360 417 27 14 402 14 385 182 15 368 408 31 18 420 18 403 223 17 384 443 36 16 433 15 412 182 15 395 380 41 17 44 1 17 422 201 16 404 396 45 20 453 16 432 185 16 412 388 !jO 17 459 16 442 181 16 416 385 54 17 464 16 444 180 17 423 402 !j8 18 467 16 445 180 17 427 398 63 17 470 17 45 1 188 17 428 397 Ii8 16 469 16 454 176 16 424 377 72 17 468 14 452 155 15 42 1 356 76 16 469 16 45 1 177 16 425 376 81 18 465 17 451 188 16 425 376 85 16 469 15 43 9 171 15 419 358 H9 16 466 14 448 156 14 415 337 93 16 464 14 443 158 15 42 1 356 97 14 456 12 433 139 13 417 312
101 18 443 18 422 213 16 409 391
Mean 16.6 416 15.8 400 209 15.8 380 440 Sl.)(c) 1.4 1.5 73 1.1 146 C V (d) 8.4 9.5 34.9 7 .O 33.2
( a )Average grams of feed removed from feeder per animal per day. Not corrected for scatter. ( b 1 Estimated milligrams of 2,4-dichlorophenol consumed per day per kilogram of body weight ( c )Standard deviation (d 1 Coeffilxent ofvariation = (standard deviat ionhean) X 100
2,4-Diclilorophenol,NTP TR 353 170
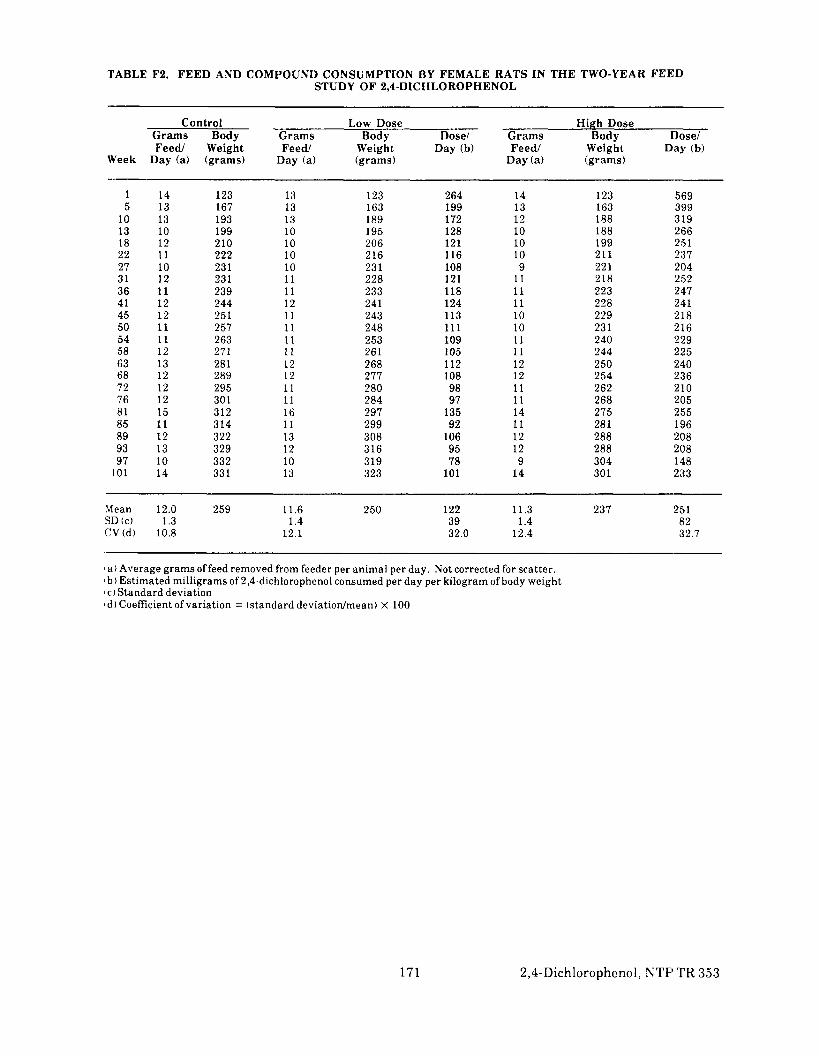
---
TABLE F2. FEED AND COMPOUND CONSUMPTION BY FEMALE RATS IN THE TWO-YEAR FEED
.-
STUDY OF 2,4-DICHLOROPHENOL
Control Low Dose High Dose Grams Body Grams Body Dose/ Grams Body I)ose/F e e d Weight Feed/ Weight Day (b) Feedl Weight D;ay (b)
Week Day (a) (grams) Day (a) (grams) Day (a) (grams)
1 14 123 13 123 264 14 123 569 5 13 167 13 163 199 13 163 399
10 13 193 13 189 172 12 188 319 13 10 199 10 195 128 10 188 266 18 12 210 10 206 121 10 199 251 22 11 222 10 216 116 10 211 237 27 10 231 10 231 108 9 221 204 31 12 231 11 228 121 11 218 252 36 11 239 11 233 118 11 223 247 41 12 244 12 241 124 11 228 241 45 12 25 1 11 243 113 10 229 218 50 11 257 11 248 111 10 231 216 54 I I 263 11 253 109 11 240 229 58 12 271 11 261 105 11 244 225 63 13 281 12 268 112 12 250 240 68 12 289 12 277 108 12 254 236 72 12 295 11 280 98 11 262 210 76 12 301 11 284 97 11 268 205 81 15 312 16 297 135 14 275 255 85 11 314 11 299 92 11 281 196 89 12 322 13 308 106 12 288 208 93 13 329 12 316 95 12 288 208 97 10 332 10 319 78 9 304 148
101 14 33 1 13 323 101 14 301 233
Mean 12.0 259 11.6 250 122 11.3 237 251 SD(c) 1.3 1.4 39 1.4 82 CV(d) 10.8 12.1 32.0 12.4 32.7
1 a ) Aver,age grams of feed removed from feeder per animal per day. Not corrected for scatter. 1 b) Estimated milligrams of 2,4-dichlorophenol consumed per day per kilogram of body weight 1 c 1 Standlard deviation Id) Coefficient ofvariation = (standard deviatiodmean) X 100
171 2,4-Dichlorophenol, NTF’ TR 353
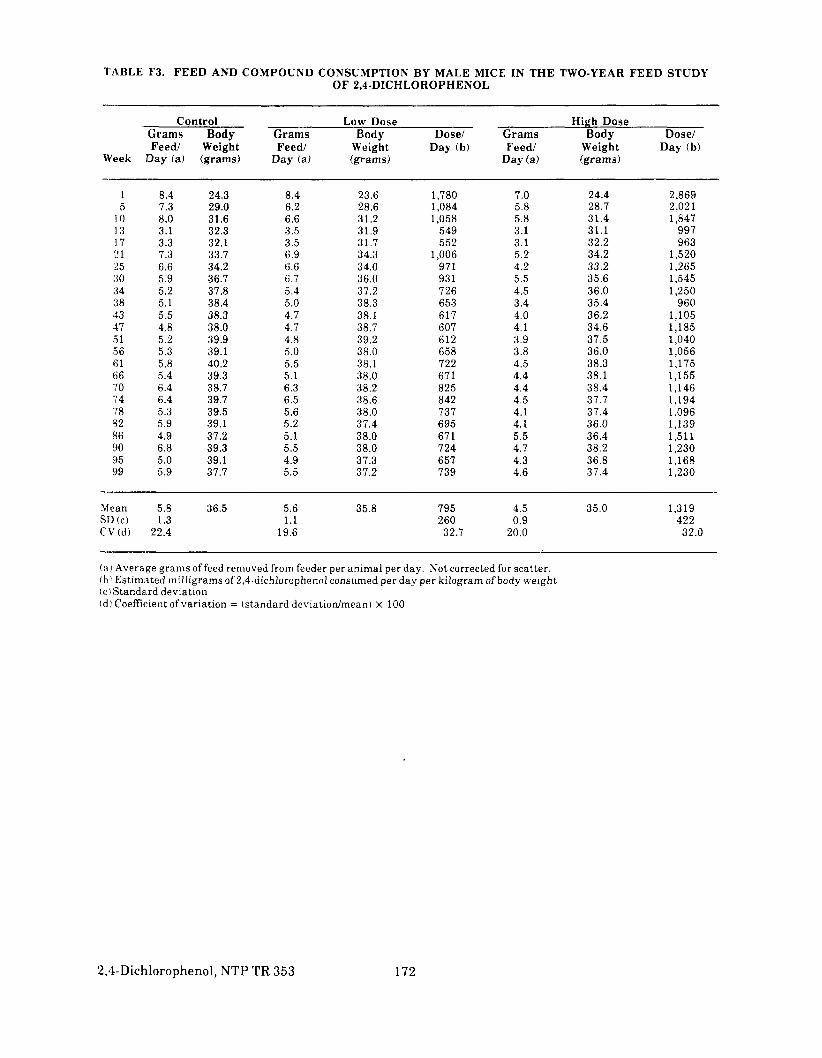
TABLE F3. FEED AND COMPOUND CONSUMPTION BY MALE MICE IN THE TWO-YEAR FEED STUDY OF 2,4-DICHLOROPHENOL
Week
Control Grams Body Feedl Weight
Day (a) (grams)
Grams Feedl
Day (a)
Low Dose Body
Weight (grams)
Dose1 Day (b)
Grams Feed/
Day (a)
High Dose Body
Weight (grams)
d05e1 Day (b)
1 5
8.4 7.3
24.3 29.0
8.4 6.2
23.6 28.6
1,780 1,084
7.0 5.8
24.4 28.7
2,869 2,021
I O 8.0 31.6 6.6 31.2 1,058 5.8 31.4 1,847 I3 3.1 32.3 3.5 31.9 549 3.1 31.1 997 17 3.3 32.1 3.5 31.7 552 3.1 32.2 963 :!1 7.3 33.7 6.9 34.3 1,006 5.2 34.2 1,520 35 6.6 34.2 6.6 34.0 971 4.2 33.2 1,265 :j0 5.9 36.7 6.7 36.0 93 1 5.5 35.6 1,545 J4 5.2 37.8 5.4 37.2 726 4.5 36.0 1,250 38 5.1 38.4 5.0 38.3 653 3.4 35.4 960 33 5.5 38.3 4.7 38.1 617 4.0 36.2 1,105 47 4.8 38.0 4.7 38.7 607 4.1 34.6 1,185 :i1 5.2 39.9 4.8 39.2 612 3.9 37.5 1,040 56 5.3 39.1 5.0 38.0 658 3.8 36.0 1,056 61 5.8 40.2 5.5 38.1 722 4.5 38.3 1,175 fi6 5.4 39.3 5.1 38.0 67 1 4.4 38.1 1,155 70 6.4 38.7 6.3 38.2 825 4.4 38.4 1,146 74 6.4 39.7 6.5 38.6 842 4.5 37.7 1,194 78 5.3 39.5 5.6 38.0 737 4.1 37.4 1,096 82 5.9 39.1 5.2 37.4 695 4.1 36.0 1,139 86 4.9 37.2 5.1 38.0 67 1 5.5 36.4 1,511 90 6.8 39.3 5.5 38.0 724 4.7 38.2 1,230 95 5.0 39.1 4.9 37.3 657 4.3 36.8 1,168 99 5.9 37.7 5.5 37.2 739 4.6 37.4 1,230
Mraan 5.8 36.5 5.6 35.8 795 4.5 35.0 1,319 SI:)(c) 1.3 1.1 260 0.9 422 C V ( d ) 22.4 19.6 32.7 20.0 32.0
( ; i i Average grams of feed removed from feeder per animal per day. Not corrected for scatter. ( t i ! E s t h a t e d milligrams of 2,4-dichIorophenoI consumed per day per kilogram of body weight (v\Standard deviation ( (1 ) Coefficient of variation = (standard deviat ionhean) X 100
2,4Dichlorophenol, NTP TR 353 172

TABLE: F4. FEED AND COMPOUND CONSUMPTION BY FEMALE MICE IN THE TWO-YEAR FEED STUDY OF 2,4-DICHLOROPHENOL
~~ ~~ _ _ _ _ _ ~ ~ ~~ ~
Control Grams Body Grams
Low Dose Body Dose/ Grams
Hiph Dose Body IZGi-
Week F e e d
Day (a) Weight (grams)
Feedl Day (a)
Weight (grams)
Day (b) Feed/ Day (a)
Weight (grams)
Day (b)
--1 7.8 18.6 9.1 18.2 1,250 8.6 18.3 2,350 5 7.2 22.2 6.8 21.1 806 7.0 20.9 1,675
10 8.4 23.7 7.7 22.8 844 7.0 22.9 1,528 13 2.1 24.1 2.8 23.5 298 3.2 23.6 678 17 2.3 24.3 3.0 24.0 313 2.2 23.4 470 21 6.1 26.6 6.8 26.2 649 6.6 24.6 1,341 25 6.0 28.1 4.9 27.3 449 4.3 25.2 853 30 6.6 29.7 5.0 28.5 439 5.4 27.4 985 34 5.0 31.2 4.3 29.4 366 4.0 27.7 722 38 4.0 31.6 4.1 30.1 341 3.4 28.3 601 43 4.6 33.2 3.4 30.4 280 3.5 28.9 606 47 4.6 34.5 4.1 32.5 315 4.3 29.4 731 51 4.5 35.9 4.8 33.1 363 4.3 30.9 696 56 4.9 35.1 5.5 33.3 413 4.7 30.7 765 61 6.6 36.5 5.1 33.0 386 4.0 32.1 623 66 4.9 38.2 4.1 34.1 30 1 3.6 31.6 570 70 6.2 36.7 5.9 34.5 428 3.7 31.6 585 74 6.0 36.8 4.8 34.6 3 47 4.0 31.9 627 78 4.8 38.2 3.8 35.7 266 3.1 31.6 491 82 4.8 39.4 4.8 36.5 329 3.0 32.5 462 86 5.0 40.3 4.8 37.6 319 3.9 32.9 593 90 4.9 40.4 4.8 37.7 318 4.7 33.8 695 95 3.7 41.1 3.7 39.0 237 3.4 33.8 503 99 4.5 42.3 4.2 39.4 266 3.2 34.3 466
Mean 5.2 32.9 4.9 30.9 430 4.4 28.7 817 SD(c) CV(d)
1.5 28.8
1.5 30.6
235 54.7
1.5 34.1
460 56.3
--(a )Average grams offeed removed from feeder per animal per day. Not corrected for scatter. tb) Estimated milligrams of 2,4-dichlorophenol consumed per day per kilogram of body weight ( c ) Standard deviation (d) Coeficient of variation = (standard deviationhean) X 100
173 B,CDichlorophenol,NTP TR 353

2,4-Dichlorophenol,NTP TR 353 174

APPENDIX G
INGREDIENTS, NUTRIENT COMPOSITION, AND
CONTAMINANT LEVELS IN
NIH 07 RAT AND MOUSE RATION
Pelleted Diet: December 1980 to January 1983 (Manufactured by Zeigler Bros., Inc., Gardners, PA)
PAGE
TABLE G1 INGREDIENTS OF NIH 07 RAT AND MOUSE RATION 176
'TABLE G2 VITAMINS AND MINERALS IN NIH 07 RAT AND MOUSE RATION 176
'TABLE G3 NUTRIENT COMPOSITIOX OF NIH 07 RAT AND MOUSE RATIOS 177
TABLE G4 CONTAMINANT LEVELS IN NIH 07 RAT AND MOUSE RATIOS 178
175 2,4-Dichlorophenol, NTP TR 353
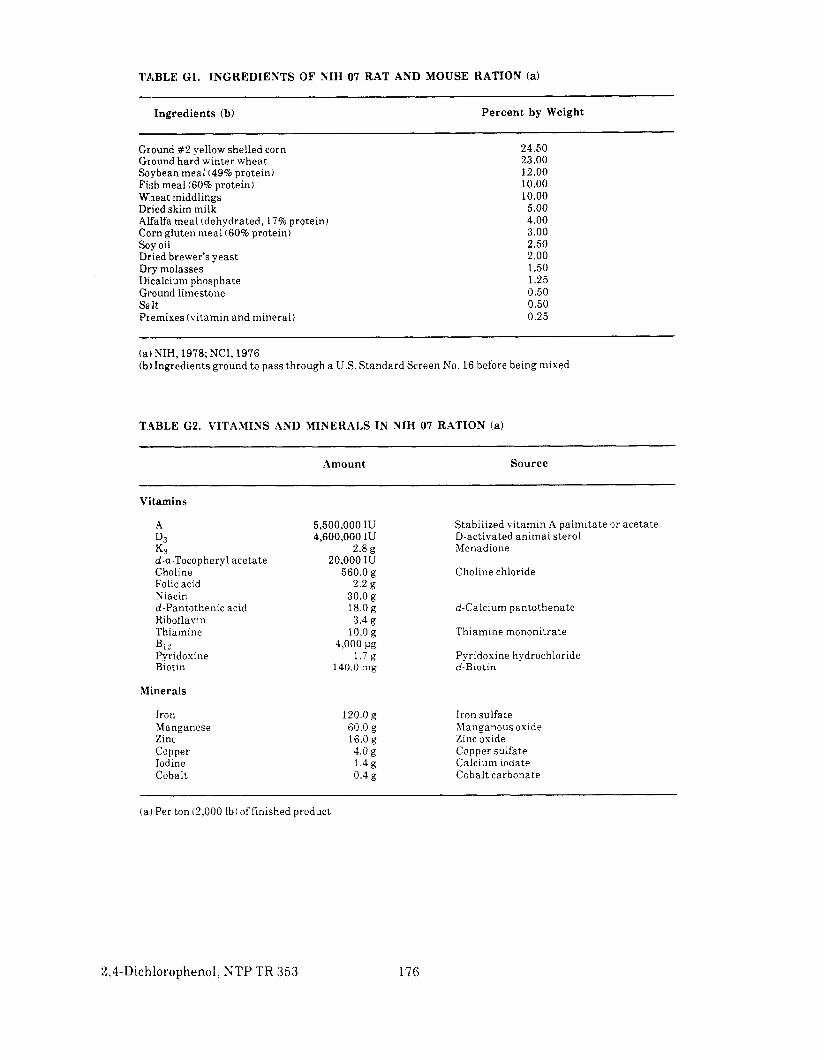
TABLE G1. INGREDIENTS OF NIH 07 RAT AND MOUSE RATION (a) -
Ingredients (b)
Ground #2 yellow shelled corn Ground hard winter wheat Soybean meal (49% protein) Fish meal (60% protein) W'heat middlings Dried skim milk Alfalfa meal (dehydrated, 17% protein) Corn gluten meal (60% protein) Soy oil Dried brewer's yeast Dry molasses Dicalcium phosphate Ground limestone Sa& Premixes (vitamin and mineral)
(a)NIH, 1978;NCI, 1976
Percent by Weight
24.50 23.00 12.00 10.00 10.00 5.00 4.00 3.00 2.50 2.00 1.50 1.25 0.50 0.50 0.25
(b)Ingredients ground to pass through a U S . Standard Screen No. 16 before being mixed
TABLE G2. VITAMINS AND MINERALS IN XIH 07 RATION (a)
Vitamins
A D3 K3 d-a-Tocopheryl acetate Choline Folic acid Niacin d-Pantothenic acid Riboflavin Thiamine B12 PyridoxineBiotin
Minerals
Iron Manganese Zinc Copper Iodine Cobalt
~~~ ~ ~ ~-~
Amount
5,500,000 IU 4,600,000 IU
2.8 g 20,000 IU
560.0 g 2.2 g
30.0 g 18.0g 3.4 g
10.0 g 4,000 pg
1.7 g 140.0mg
120.0 ,D 60.0 g 16.0 g 4.0 g 1.4 g 0.4 g
(a)Per ton (2,000lb) offinished product
%,4-Dichlorophenol,NTP T R 353 176
Source
Stabilized vitamin A palmitate or acetate D-activated animal sterol Menadione
Choline chloride
d-Calcium pantothenate
Thiamine mononitrate
Pyridoxine hydrochloride d-Biotin
Iron sulfate Manganous oxide Zinc oxide Copper sulfate Calcium iodate Cobalt carbonatp

--
TABLE G3. NUTRIENT COMPOSITION OF NIH 07 RAT AND MOUSE RATION (a)
Nutrients Mean f S t a n d a r d Deviation
( 'rude protein(percent by weight) ('rude fat (percent by weight) ('rude fiber (percent by weight) .Ish (percent by weight)
Amino '4cids (percent of total diet)
Arginine Cystine Glycine Histidine Isoleucine Leucine Lysine Methionine Phenylalanine Threonine Tryptophan Tyrosine Valine
23 85 f0 78 5 02 f 0 44 3 31 f 0.23 6 44 k 0.44
1.323 f 0.830 0.310 f 0.099 1.155f 0.069 0.572 f 0.030 0.910 f0.033 1.949 k 0.065 1.275 f 0.076 0.422 f 0.187 0.909 f 0.167 0.844 f 0.029
0.187 0.631 f0.094
1.11f0.050
Essentiial Fa t ty Acids (percent of total diet)
Linoleic Linolenic Arachidonic
Vitaminis
Vitatnin A ( I U k g ) Vitamin D ( I U k g ) a-Tocopherol (ppm) Thiamine (ppm) Ribollavin (ppm) Niacin (ppm) Pantothenic acid (ppn n) Pyridoxine (ppm) Folic acid (ppm) Biotin (ppm) Vitamin B,, (ppb) Choline (ppm)
Mineralls
Calcium (percent) Phosphorus (percent) Pota:;sium (percent) Chloride (percent) Sodium (percent) Magnesium (percent) Sulfur (percent) Iron ppm) Manganese (ppm) Zinc (ppm) Copper (ppm) Iodine (ppm) Chromium (ppm) Cobalt(ppm)
2.44 0.274 0.008
10,917 f 1,876 4,650
41.53 f 7.52 16.80 f 2.0
7.5 f 0.96 85.0 F 14.2 29.3 f 4.6
7.6 f 1.5 2.8 f0.88
0.27 f0.05 21.0 f 11.9
3,302.0 f 120.0
1.25 f0.15 0.98 f 0.06
0.862 f0.100 0.546 k 0.100 0.311 f 0.038 0.169 f 0.133 0.316 f0.070 447.0 f 57.3
90.6 f 8.20 53.6 f 5.27
10.77 k 3.19 2.95 f 1.051 1.81 f 0 . 2 8 0.68 f 0.14
Range Number of Samples
22.7-25.3 24 4.2-5.7 24 2.9-3.8 24
5.7-7.43 24
1.21-1.39 4 0.2 18-0.400 4
1.06-1.21 4 0.530-0.603 4 0.881-0.944 4
1.85-1.99 4 1.20-1.37 4
0.306-0.699 4 0.665- 1.04 4
0.824-0.886 4 0.171-0.21 1 3 0.566-0.769 4
1.05-1.17 4
2.37-2.52 3 0.256-0.308 3
1
8,210-15,000 24 3,000-6,300 2
31.1-48.9 4 14.0-21.0 ( b) 23 6.1-8.2 4
65.0-97.0 4 23.0-34.0 4
5.6-8.8 4 1.8-3.7 4
0.21-0.32 4 11.0-38.0 4
3,200.0-3,430.0 4
1.08-1.69 24 0.88- 1.10 24
0.772-0.974 3 0.442-0.635 4 0.258-0.350 4 0.151-0.181 4 0.270-0.420 4 409.0-523.0 4
81.7-95.5 4 46.1-58.6 4 8.09-15.39 4 1.52-3.82 4 1.44-2.09 4 0.49-0.80 4
( aI One 1;o four batches of feed analyzed for nutrients reported in this table were manufactured during 1983-85. 1 b ) One batch (7/22/81) net analyzed for thiamine
177 2,4-Dichlorophenol,NTP TR 353
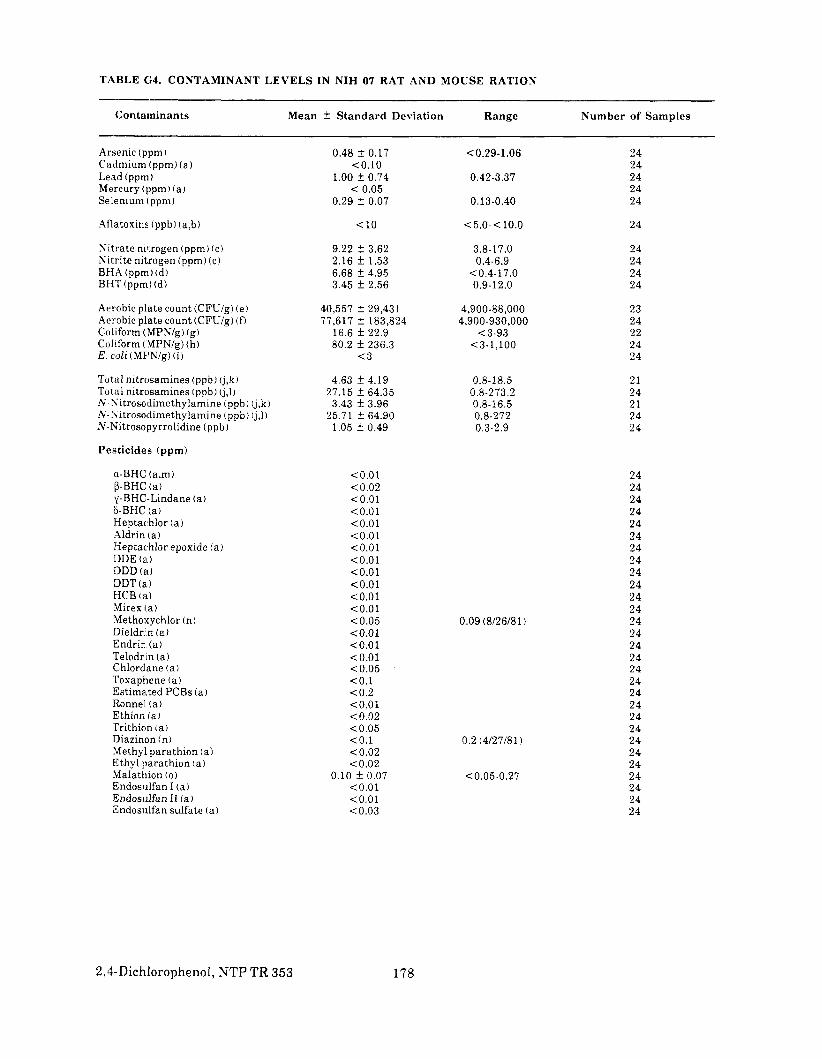
TABLE C;4. CONTAMINANT LEVELS IN NIH 07 RAT AND MOUSE RATION
Contaminants
Arsenic (plpm) Cadmium (ppm) ( a ) Lead (ppm) Mercury (ppm) (a ) Selenium (ppm)
Aflatoxins (ppbl (a,b)
Nitrate nitrogen (ppm) ( c ) Nitrite nitrogen (ppm) ( c ) BHA (ppm.) td) BIIT (ppmJ(d)
Aerobic plate count (CFU/g) (e) Aerobic plate count (CFU/g) (f, Coliform ( MPN/g) (g) Coliform ( MPN/g) (h) E . coli (MF’N/g) ( i )
Total nitrosamines (ppb) ( j ,k) Total nitrosamines (ppb) Q,l) N.Nitrosodimethylamine (ppb) (j,k) N-Nitroso,dimethylamine (ppb) (jJ N-Nitrosopyrrolidine (ppb)
Pesticides (ppm)
(1-BHC (a,m) (3-BHC ( a ) y-BHC-Lindane ( a ) II-BHC (a ) Heptachlor ( a ) .2ldrin (a) Heptachlor epoxide (a) DDE (ii)
DDD (ti)
DDT (a,) HCB (ii)
Mirex (,a) Methoxychlor (n ) Dieldrin (a) Endrin ( a ) ‘relodrin (a ) Chlordane (a) Toxaphene (a) Estimated PCBs (a) Ronnel ( a ) Ethion (a) Trithicm (a) Diazinon (n) Methyl parathion ( a ) Ethyl parathion ( a ) Malathion (01 Endosulfan I ( a ) Endosulfan II ( a ) Endosulfan sulfate (a)
~~~ ~~~
Mean f Standard Deviation
0.48 f 0.17 <0.10
1.00 f 0.74 < 0.05
0.29 f 0.07
<10
9.22 f 3.62 2.16 f 1.53 6.68 f 4.95 3.45 f 2.56
40,557 f 29,431 77,617 f 183,824
16.6 f 22.9 80.2 f 236.3
< 3
4.63 _+ 4.19 27.15 f 64.35
3.43 !c 3.96 25.71 f 64.90
1.05 f 0.49
<0.01 <0.02 CO.01 <0.01 <0.01 <0.01 10.01 <0.01 <0.01 <0.01 <0.01 <0.01 <0.05<o.oi <0.01 <0.01 <0.05 <0.1 <0.2 < O . O l <0.02 <0.05 <0.1 <0.02 <0.02
0.10 k 0.07 <0.01 <0.01 <0.03
~~~ ~~~~
Range
<0.29-1.06
0.42-3.37
0.13-0.40
<5.0-<10.0
3.8-17.0 0.4-6.9
<0.4- 17.0 0.9-12.0
4,900-88,000 4,900-930,000
<3-93 <3-1,100
0.8-18.5 0.8-273.2 0.8-16.5 0.8-272 0.3-2.9
0.09 (8126181)
0.2 (4/27/81)
<0.05-0.27
~~
Number of Samples
24 24 24 24 24
24
24 24 24 24
23 24 22 24 24
21 24 21 24 24
24 24 24 24 24 24 24 24 24 24 24 24 24 24 24 24 24 24 24 24 24 24 24 24 24 24 24 24 24
2,4-DichlorophenoI,NTP TR 353 178

--- TABLE G4. CONTAMIKANT LEVELS IN NIH 07 RAT AND MOUSE RATION (Continued)
(a,)All values were less than the detection limit, given in the table as the mean. (h)'l'he detection limit was reduced from 10 ppb to 5 ppb ;after 7/81. ( c )Source of contamination: alfalfa, grains, and fish tneal (d )'Source of contamination: soy oil and fish meal l e ) Mean, standard deviation, and range exclude one high value of 930,000 obtained for the batch produced on 12/22/82 (CE'U=colony forming unit). t f ) Mean, standard deviation, and range include the high value listed in footnote (e). Ig) Mean, standard deviation, and range exclude one high value of 1,100obtained for the batch produced on 12/16/80 and one high value of 460 obtained for the batch produced on 9/23/82 ( M P N = most probable number). ( h )Mean, standard deviation, and range include the high values listed in footnote (g). i i) All vallues were less than 3 MPNlg. Cj)All values were corrected for percent recovery. ( k l Mean, standard deviation, and range exclude three very high values in the range of 115-273.2 ppb for batches produced on 1'26/81,2/23/81, and 4/27/81, (1) Mean, istandard deviation, and range include the very high values given in footnote (k). ( r n ) BHC = hexachlorocyclohexane or benzene hexachloride ( I i ) There was one observation above the detection limit; the value and date i t was obtained are given under the range. ( c i ) Thirteen batches contained more than 0.05 ppm.
179 2,4-Dichlorophenol, NTP TR 353

2,4-Dichlorophenol,NTP TR 353 180
APPENDIX H
AUDIT SUMMARY
181 2,CDichlorophenol,NTP TR 353

APPENDIX H. AUDIT SUMMARY
The pat,hology specimens, experimental data, study documents, and the draft NTP Technical Report No. 353 for the 2-year studies of 2,4-dichlorophenol in F344/N rats and B6C3F1 mice were audited for the National Institute of Environmental Health Sciences at the National Toxicology Program (NTP) Archives in September and October 1987by Argus Research Laboratories, Inc. The audit incluided re-view of
(1) All records concerning animal receipt, quarantine, randomization, and disposition prior to study start.
(2) All inlife records including protocol, correspondence, animal husbandry, environmental condi- tions, dosing, external masses, mortality, animal identification, and serology. , i
(3) Elody weight and clinical observation data for a random 10% sample of animals in each study group.
(4) A11 chemistry records. (5) A11 postmortem records for individual animals concerning disposition codes, condition codes,
tissue accountability, correlations of masses or clinical signs recorded at the last inlife observa- t ion with gross observations and microscopic diagnoses, and correlations between gross obser- vations and microscopic diagnoses.
(6) A11 wet tissue bags for inventory, and wet tissues from a random 20% sample of animals from each study group plus other relevant cases to verify animal identity and to examine i'or un-trimmed potential lesions.
(7) Ellocks and slides of tissues from a random 20% sample of animals from each study group to ex- amine for proper match and inventory.
(8) Pi11 red-lined diagnoses on the intermediate pathology table to verify incorporation of changes into the final tables.
(9) Correlation between the data, results, and procedures for the 2-year studies presented in the preliminary draft Technical Report and the records available at the NTP Archives.
Review of the toxicology records and data revealed no instances that would affect the validity of these st udies. In a few instances (3118 rats and 18/76mice), the clinical observation records and the individ- ual animal necropsy records differed for the dates and/or disposition at death of animals that died be- fore the end of the studies. A small number of masses apparently observed clinically (5 in 1,he rat st iidies and 19 in the mouse studies) were not addressed among the gross observations recorded a t necropsy or among the microscopic diagnoses; for the most part, these were small, hard lumps in the rtbgion of the penis. Audits of the analytical chemistry data and the pathology specimens revealed no findings that would affect the interpretation of the data.
E'u11 details about these and other audit findings are presented in the audit reports. In conclusion, the data and results presented in the draft Technical Report for the 2-year exposure studies of 2,4- dichlorophenol a re supported by the records a t the NTP Archives.
2,4-Diclilorophenol, NTP TR 353 182
Top Related