


Languages
Pages
Legal


Towards the Green Data Centre
Lex Coors – Vice President Data Center Technology & Engineering Group
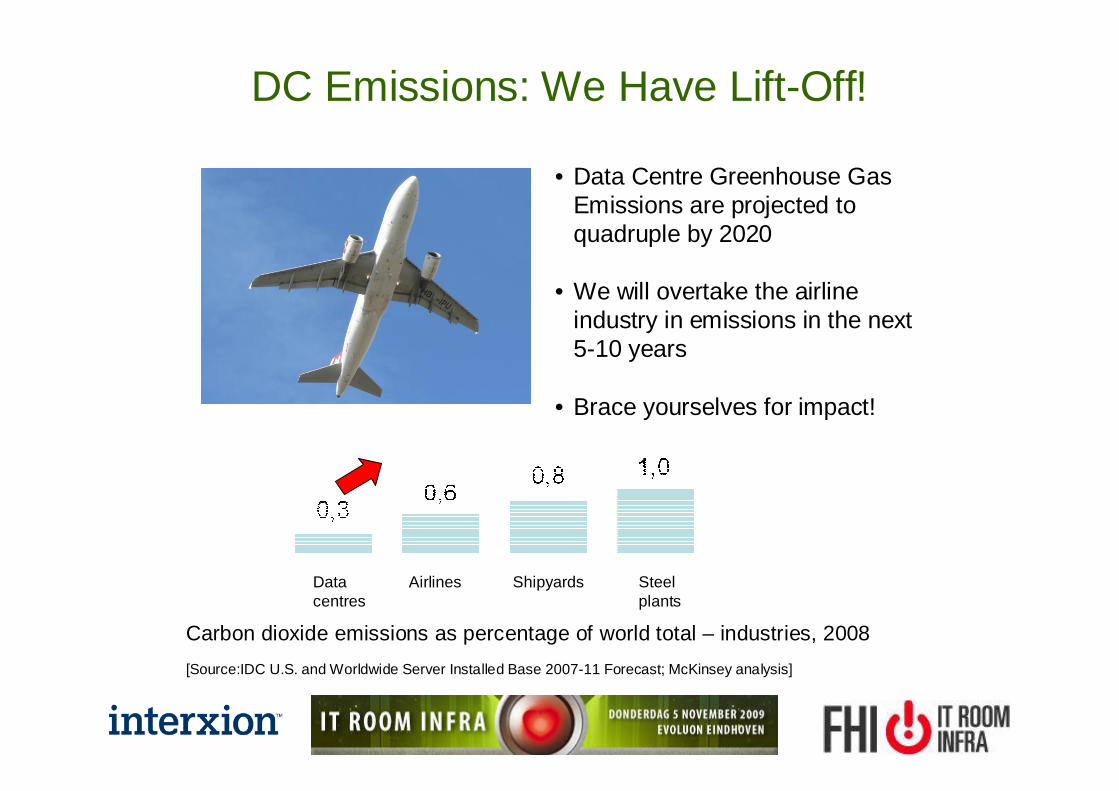
DC Emissions: We Have Lift-Off!
Carbon dioxide emissions as percentage of world total – industries, 2008
Data centres
Airlines Shipyards Steel plants
[Source:IDC U.S. and Worldwide Server Installed Base 2007-11 Forecast; McKinsey analysis]
• Data Centre Greenhouse Gas Emissions are projected to quadruple by 2020
• We will overtake the airline industry in emissions in the next 5-10 years
• Brace yourselves for impact!

1. Moving Parts

Power Overhead (fixed)Total Energy Usage (variable)
Power v Energy

AB=
PUE
A. Total Energy Usage
B. IT Energy Usage
Calculating PUE
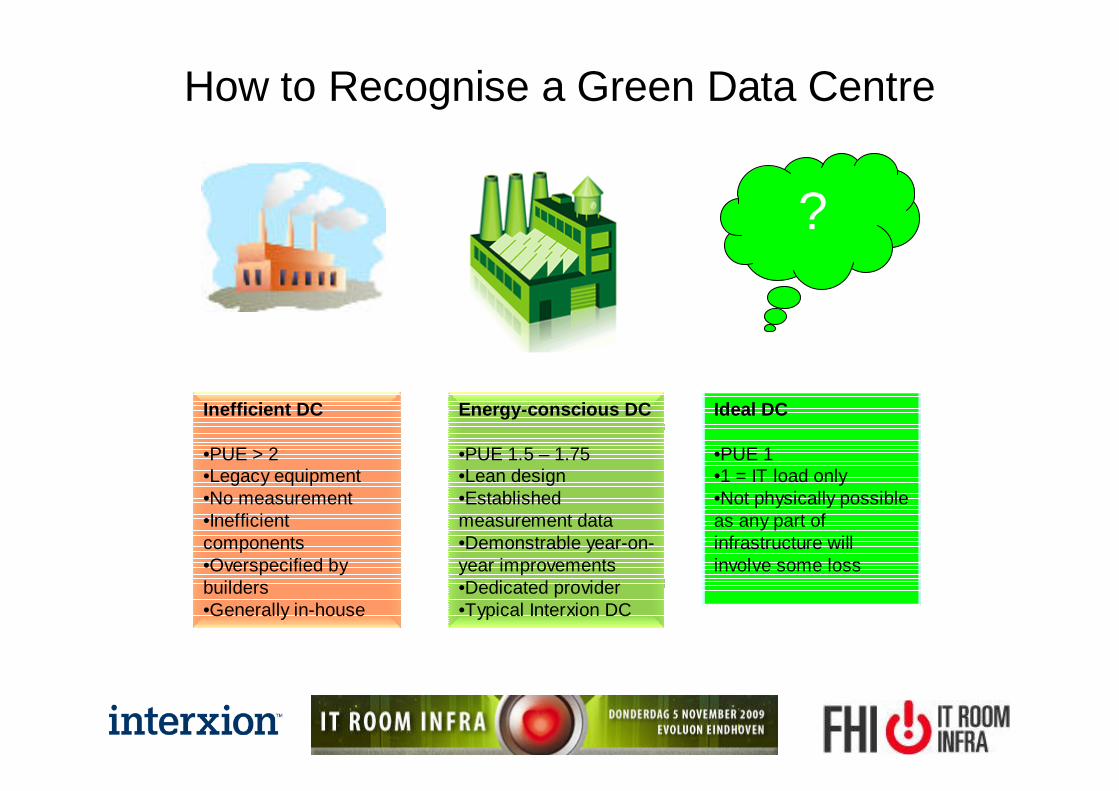
How to Recognise a Green Data Centre
?
Inefficient DC
•PUE > 2•Legacy equipment•No measurement•Inefficient components•Overspecified by builders•Generally in-house
Ideal DC
•PUE 1•1 = IT load only•Not physically possible as any part of infrastructure will involve some loss
Energy-conscious DC
•PUE 1.5 – 1.75•Lean design•Established measurement data•Demonstrable year-on-year improvements•Dedicated provider•Typical Interxion DC

2. Green Steps

Role of the Green Data Centre Provider• Interxion approach: active focus in 3 areas:
1. External efficiency focus : industry efficiency standards
3. Customer efficiency focus: proactive support and advice to improve IT efficiency
2. Internal efficiency focus :A.DesignB.Operations

Customer Focus: Support & Advice
2. Best practice customer installation checklist (efficiency gain 3-5%)
3. Customised hot/cold aisle designs
1. Hands-on expert support in energy efficiency implementation efforts
4. Senior advice and tools in the following areas:
• Measurement and analysis
• Implementing the latest efficiency ratings
• Developing and implementing first phase action plans
• Integrating figures and ratings with customer CSR

Customer Focus: Recommended Steps
Step Efficiency Gain
1. Eliminate Comatose servers
2. Virtualize
3. Upgrade older equipment
4. Reduce demand for new servers
5. Introduce greener and more power-efficient servers and enable power savings features
10–25%
10–20%
25-30%
10–20%
10–20%
Total65% +
Source: McKinsey and Up Time Insitute 2008

3. Internal DC Focus: Design & Operations
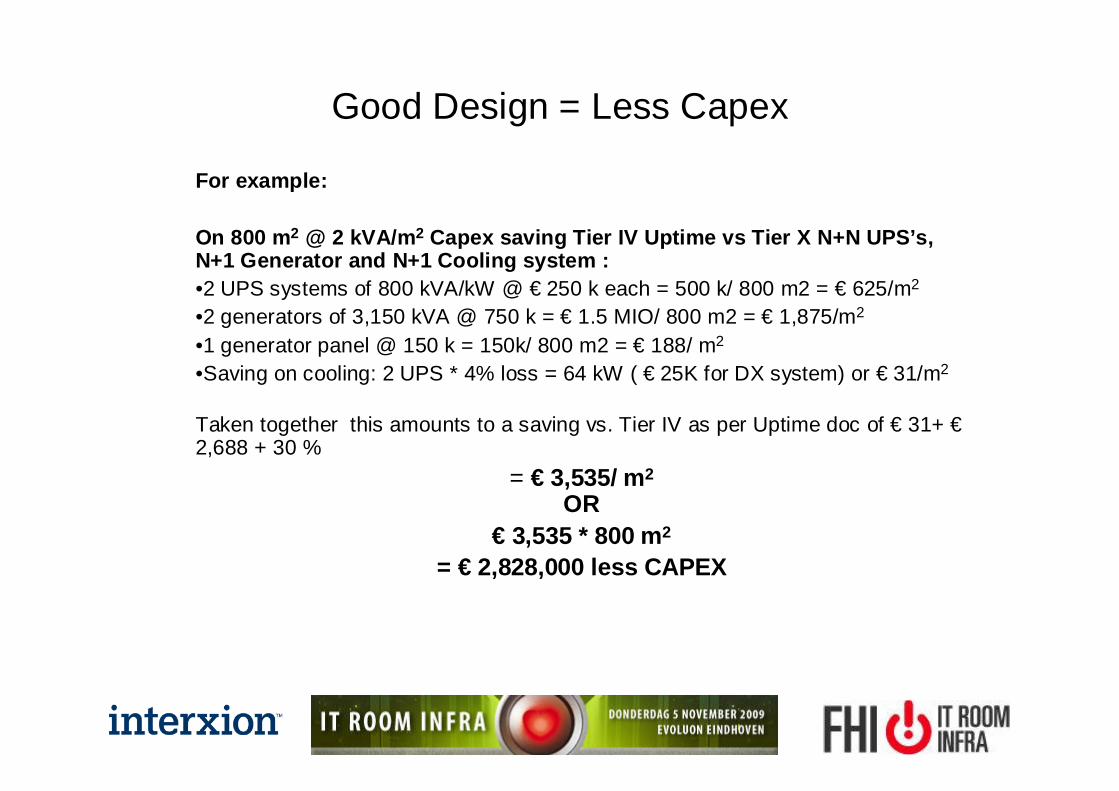
For example:
On 800 m2 @ 2 kVA/m 2 Capex saving Tier IV Uptime vs Tier X N+N UPS’s, N+1 Generator and N+1 Cooling system : •2 UPS systems of 800 kVA/kW @ € 250 k each = 500 k/ 800 m2 = € 625/m2
•2 generators of 3,150 kVA @ 750 k = € 1.5 MIO/ 800 m2 = € 1,875/m2
•1 generator panel @ 150 k = 150k/ 800 m2 = € 188/ m2
•Saving on cooling: 2 UPS * 4% loss = 64 kW ( € 25K for DX system) or € 31/m2
Taken together this amounts to a saving vs. Tier IV as per Uptime doc of € 31+ €2,688 + 30 %
= € 3,535/ m2
OR € 3,535 * 800 m2
= € 2,828,000 less CAPEX
Good Design = Less Capex

Day 1 load : 0.7 kVA/m2 * 800 m2 = 560 kVA UPS load * 1.8 power ratio
= 1,008 kVA transformer load.
In this case we could:
a) Use for the final design 4 smaller generators (3 + 1 redundant) from 1,000 kVA but we would start with 2, thus saving: 2 * € 750 k (3,150 kVA generators) – 2 * €150 k (1,000 kVA generators) = € 1,200,000 savingb) Use the APC-MGE Symmetra MW 1,600 kVA/kW system (instead of the smaller 800 kVA/kW system) starting with the final 2 frames with only 3 power modules of 200 kW per UPS system installed, thus saving: 4 * € 250 k - 2 * € 350 k including 600 kVA/kW of UPS modules = € 300,000 savingc) Start with 2 chillers of 750 kW instead of 8 chillers of 750 kWSaving at Day 1 of: 8 * € 125 k – 2 * 125 k = € 750,000 savingd) Assuming 100 kW/ CRAC, start with 8 CRAC units instead of 16 CRAC unitsSaving here at day 1 will be 16 * € 20 k - 8 * € 20 K = € 160,000 saving
Total CAPEX savings day 1: € 2,460,000/ 800 m 2 = € 3,075/ m2
With substantial OPEX savings for year 1
Cash Flow Management:Modular Tier X Design

You have to know the Power Ratio (DCi-PO) to improve the Energy ratio (PUE)
The Key to Efficient Operations

Internal Focus: Operational Measures
15
Interxion 6 year PUE Gains
Industry Norm
Acceptable
Exceptional

4. Industry Focus: Measure it to Manage it

Industry Standards for Tomorrow
Getting around the table to agree efficiency metrics and a workable rating system
Industry Focus: The Role of Vendors•The Vendor industry should provide standard meters on all equipment to measure Energy Usage v Productivity.•Transformers: Energy in v Energy out•UPS: Energy in v Energy out (this will allow us to measure efficiencies as a % of load)
• Switchgear and cables: Getting a better understanding of properties of materials and impact of impurities on efficiency•CRAC units energy in v kW and kWh cold out (CRAC unit capacity should be shown at chilled water supply 9˚C, 12˚C, 15˚C)•Chillers: Energy in Energy out (Capacity shown at above temps)
So finally…an open invitation to Vendors: – don’t drive the data centre industry, let the data centre industry drive you. Let’s work together to improve the available systems.

Conclusions
• Green Data Centres are real; just ask us!
• But emissions (and power costs) are rising fast, so we need to do more now
• We must work together, particularly in measurement
• Data Centre providers should give leadership. In three areas:
• Industry standards and ratings that work• Data Centre design and operational efficiency steps• Support for all customer IT efficiency improvements
Top Related