


Languages
Pages
Legal


Towards endTowards end--toto--end modeling for investigating the effects of end modeling for investigating the effects of climate and fishing in the Strait of Georgia ecosystem, climate and fishing in the Strait of Georgia ecosystem,
CanadaCanada
Caihong FuCaihong Fu11, Yunne Shin, Yunne Shin22, , MorganeMorgane
TreversTrevers22
Ian PerryIan Perry11, Angelica , Angelica PePeññaa11
1 Fisheries and Oceans Canada1 Fisheries and Oceans Canada2 Institute de recherch2 Institute de recherchéé
pour le dpour le dééveloppement, Franceveloppement, France
Work in progress
Funded by Fisheries and Oceans Canada under Ecosystem Research Initiative for the Pacific Region
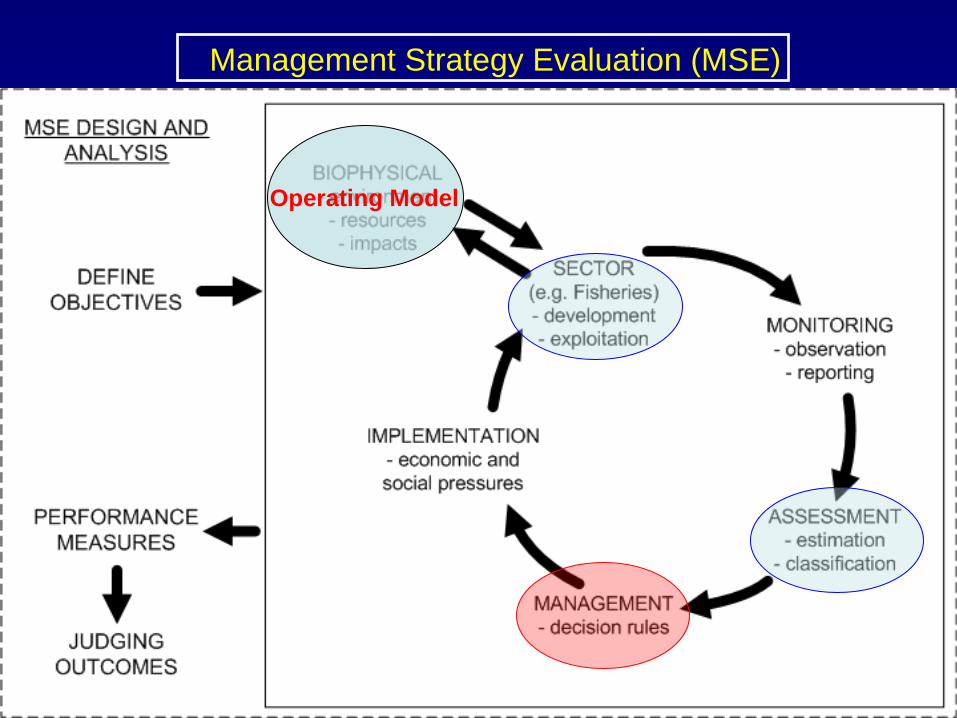
Management Strategy Evaluation (MSE)
Operating Model

Higher Trophic
level
Management
Climate and Oceanography
Lower Trophic Level
Habitat
Atlantis
Fulton, E.A., Smith, A.D.M and Johnson, C.R., 2004. Ecological Modelling, 174: 267-307.
Wave-tide-circulation coupled modelQiao, F, Z. Song, C. Xia, Y. Yuan. 2008. PICES Keynote Lecture.
Osmose+
Travers, M., Shin, Y.-J., Jennings, S., Cury, P. 2007.
Progress in Oceanography, 75: 751-770.
NPZD
+ ROMS(Foreman & Masson)
End-to-end modelling

Class
COHORT
-
species-
abund., biomass
-
n schools Class
SCHOOL
-
species, age-
abundance, biomass-
spatial coordinates-
length, weight-
predation
efficiency
Class
SYSTEM
-
abundance, biomass-
species
richness
S-
carrying
capacity-
size spectrum
-
S species
Class
SPECIES
-
abundance, biomass-
growth
parameters-
reproduction parameters-
distribution area/age-
fishing
mortality/age
-
(longevity+1) cohorts
OSMOSE
(Object-oriented
Simulator of Marine ecOSystems
Exploitation)-----Individual-based model (IBM), multi-species, structured by size.
(Shin & Cury
2001, Aquat. Living Resour. 14: 65-80.)

Spatial distribution
Natural mortality
Predation
Piscivores
Reproduction
Fishing
mortality
Growth
Starvation
OSMOSE
Species
Benthos Fish Salmon
Habitat dependency
Migration
Mammal
Climate
Predation mortality
Food availability
Flagellates Diatoms
Copepods
Nitrates
Large detritus
Ciliates
Small detritus
Ammonium
20 µm
200 µm20 µm20 µm2 µm
2 mm200 µm200 µm
ROMS-NPZD
2D3D

log Size
log abd
1 µm 1 mm 1 m log Size
log abd
1 µm 1 mm 1 m
Size‐based predation
Ratio max
Ratio min
predator
size
Prey size
1-
Thresholds
for predator/prey
size ratio2-
Maximum ingestion rate3-
Spatial-temporal co-occurance
Modelled
food
webs
are variable in structure
Opportunistic
predation
Predation efficiency
ξ

Fish life cycle
Spatial distribution
Natural mortality
Growth
ξ
Predation
Piscivores
Starvationξ
ration for maintenance
maximal rationξcrit =
ξ= Predation efficiency
10
Mξ max
ξcritξ
Μξ Starvation mortality
Growth

Strait of Georgia

Water temperature changes in the Strait of Georgia
6
7
8
9
10
11
12
13
14
15
16
17
18
19
Sea
sur
face
tem
pera
ture
( o C
)
1948-19771978-2007
Jan Feb Mar Apr May Jun Jul Aug Sep Oct Nov Dec

Changes in fish community in the Strait of Georgia
Pacific hake dominates the resident fish biomass.
Pacific herring are at high abundance.
Harbour seal biomass has tripled.
Groundfish species such as Pacific cod are nearly absent
Research questions
What has driven these changes in the strait, climate change? fishing?...
What will the strait be like in the future?
How can we manage marine resources under changing environment?
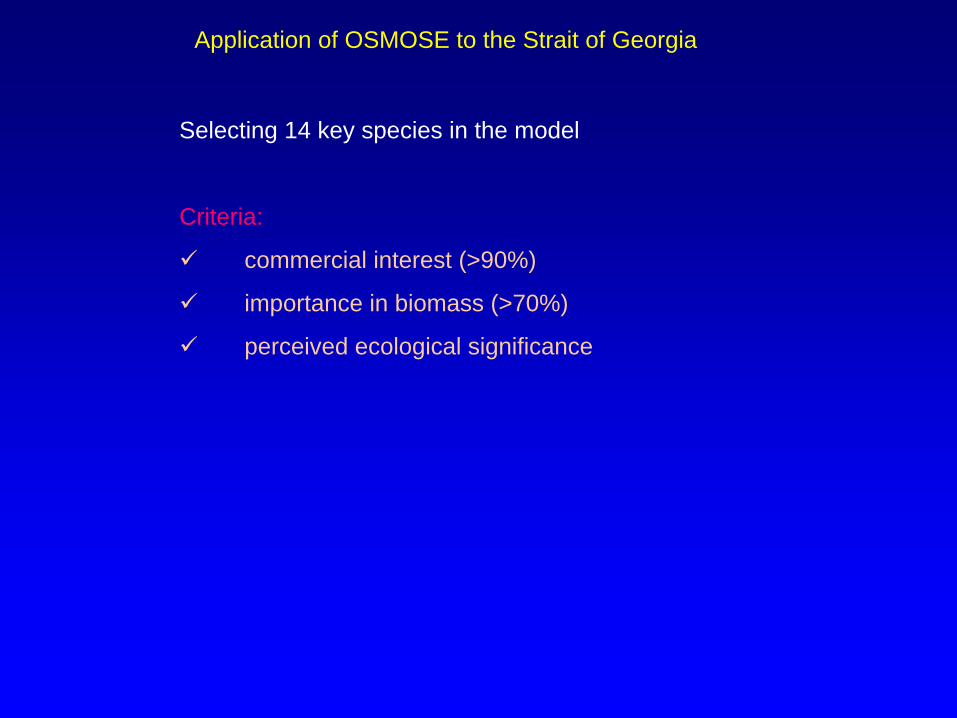
Selecting 14 key species in the model
Criteria:
commercial interest (>90%)
importance in biomass (>70%)
perceived ecological significance
Application of OSMOSE to the Strait of Georgia

Key species from the Strait of Georgia
Euphausiid Pacific herring
Spotted ratfish
Walleye pollock Pacific hake
Chinook salmon
Spiny dogfish
Pacific cod
Lingcod
Yelloweye rockfishEnglish sole
Dover sole
Pandalid shrimp
Harbour seal
020406080
100120140160180
Bio
mas
s (1
000
t)
1978-882000-07
Pac
ific
herri
ng
Pan
dalid
shr
imp
Pac
ific
hake
Wal
leye
pol
lock
Pac
ific
cod
Eng
lishR
ock
sole
Dov
er s
ole
Ling
cod
Yel
low
Qui
ll ro
ckfis
h
Spo
tted
ratfi
sh
Spi
ny d
ogfis
h
Har
bour
sea
l
Chi
nook
sal
mon
Changes due to fishing? Climate changes?

Commercial catches from the Strait of Georgia
0
10
20
30
40
50
60
70
80
90
1954
1956
1958
1960
1962
1964
1966
1968
1970
1972
1974
1976
1978
1980
1982
1984
1986
1988
1990
1992
1994
1996
1998
2000
2002
2004
2006
Cat
ches
(100
0 t)
Pacific herring Pacific hakeWalleye pollockSpiny dogfishPacific codDover soleEnglishRock SoleLingcodYellowQuill rockfishShrimps Spotted ratfish
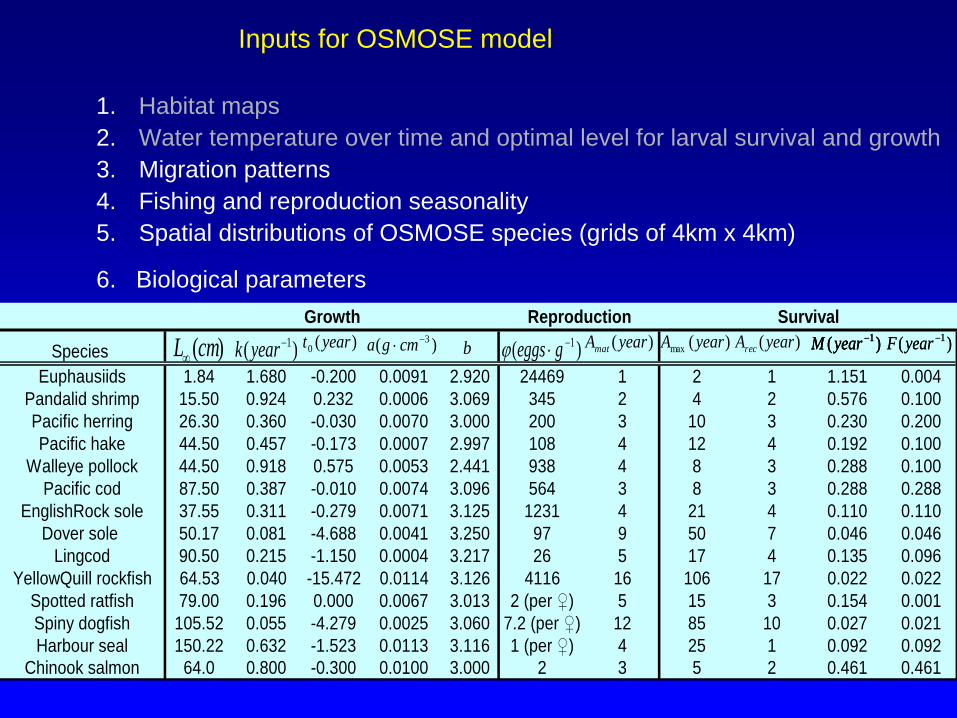
Inputs for OSMOSE model
1.
Habitat maps2.
Water temperature over time and optimal level for larval survival and growth3.
Migration patterns 4.
Fishing and reproduction seasonality5.
Spatial distributions of OSMOSE species (grids of 4km x 4km)
6. Biological parameters
Species Euphausiids 1.84 1.680 -0.200 0.0091 2.920 24469 1 2 1 1.151 0.004
Pandalid shrimp 15.50 0.924 0.232 0.0006 3.069 345 2 4 2 0.576 0.100Pacific herring 26.30 0.360 -0.030 0.0070 3.000 200 3 10 3 0.230 0.200Pacific hake 44.50 0.457 -0.173 0.0007 2.997 108 4 12 4 0.192 0.100
Walleye pollock 44.50 0.918 0.575 0.0053 2.441 938 4 8 3 0.288 0.100Pacific cod 87.50 0.387 -0.010 0.0074 3.096 564 3 8 3 0.288 0.288
EnglishRock sole 37.55 0.311 -0.279 0.0071 3.125 1231 4 21 4 0.110 0.110Dover sole 50.17 0.081 -4.688 0.0041 3.250 97 9 50 7 0.046 0.046
Lingcod 90.50 0.215 -1.150 0.0004 3.217 26 5 17 4 0.135 0.096YellowQuill rockfish 64.53 0.040 -15.472 0.0114 3.126 4116 16 106 17 0.022 0.022
Spotted ratfish 79.00 0.196 0.000 0.0067 3.013 2 (per ♀) 5 15 3 0.154 0.001Spiny dogfish 105.52 0.055 -4.279 0.0025 3.060 7.2 (per ♀) 12 85 10 0.027 0.021Harbour seal 150.22 0.632 -1.523 0.0113 3.116 1 (per ♀) 4 25 1 0.092 0.092
Chinook salmon 64.0 0.800 -0.300 0.0100 3.000 2 3 5 2 0.461 0.461
Growth Reproduction Survival
)(cmL∞ )( 1−yeark b )( 1−⋅ geggsϕ )(max yearA )( 1−yearF)(0 yeart )( 3−⋅ cmga )(yearArec)(yearAmat )( 1−yearM )( 1−yearF)( 1−yearM )( 1−yearM

Tuning parameters include larval mortality for each species and accessibility coefficient for each plankton compartment.
(1978 –
1988)
Species Biomass (tonnes) Biomass (tonnes)Euphausiids 227874.04 227874.04
Pandalid shrimp 21451.76 22803.11Pacific herring 116232.27 168386.36Pacific hake 64478.10 153034.49
Walleye pollock 17011.65 32280.82Pacific cod 7471.33 74.70
EnglishRock sole 1094.27 4285.48Dover sole 1935.35 1161.45
Lingcod 881.92 133.78YellowQuill rockfish 403.17 1397.84
Spotted ratfish 16581.09 7620.18Spiny dogfish 75075.71 17188.48Harbour seal 637.25 2040.00
Chinook salmon 16425.17 653.26
(2000 –
2007)Calibration targets
Questions to be addressed through OSMOSE simulations
•
What if water temperature increased by another degree •
What if herring were removed from the system•
What if harbour seals were removed•
What if Pacific cod were not fished but climate was not favorable•
What if Pacific cod were not fished but climate was favorable
Calibration is done by using a genetic algorithm specifically developed for OSMOSE (Shin et al. in review)

Population biomass
Examples of Output
0
200000
400000
600000
800000
1000000
1200000
1400000
1600000
Time Step

Biomass loss due to each cause
0%
20%
40%
60%
80%
100%
Panda
lid sh
rimp
Pacific
herrin
gPac
ific ha
ke
Wall
eye p
olloc
kPac
ific co
d
Englis
hRoc
k sole
Dover
sole
Lingc
od
Yellow
Quill ro
ckfis
hSpo
tted r
atfish
Spiny d
ogfis
hHarb
our s
eal
PredationFishingNatual
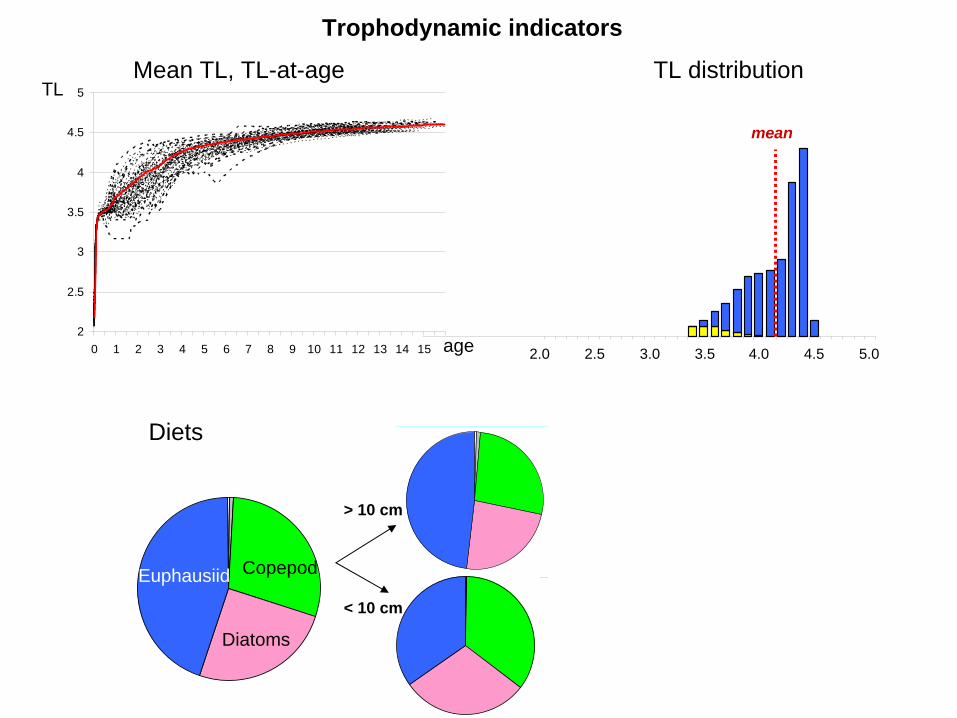
Diets
Copepod
Diatoms
Euphausiid
> 10 cm
< 10 cm
2
2.5
3
3.5
4
4.5
5
0 1 2 3 4 5 6 7 8 9 10 11 12 13 14 15
TL distributionMean TL, TL-at-ageTL
age
mean
2.0 2.5 3.0 3.5 4.0 4.5 5.0
Trophodynamic
indicators

1.
Tuning model using Genetic Algorithm and doing model sensitivity
analyses
Future Research
2. Coupling with ROMS-NPZD
3. Comparing OSMOSE and other models’
output, such as Atlantis.
4. Conducting management strategy evaluation
THANKS FOR YOUR ATTENTION
Top Related