


Languages
Pages
Legal

How reliability simulators can deliver a massive increase in profitability
In tough economic times, businesses often take short-cuts with asset
management in a bid to remain profitable. Yet as this whitepaper clearly
demonstrates, a long-term, reliability-driven approach delivers much
greater gains for the business.
Towards besT pracTice asseT managemenT:
www.armsreliability.com
As economic conditions toughen, managers face the challenge of improving the bottom line performance of their business, fast. Yet in doing so, they risk bypassing the fundamental practices needed to sustain a reliability-driven approach to asset management.
Too often, asset managers take a short-term view of asset management, whereby they take shortcuts or easy options to cut costs or postpone shutdowns, to boost asset utilisation rates and keep their plant up and running. In some of these instances, they achieve increased profitability or efficiency – and so they think, “job well done”.
But is it “job done best”?
These asset managers think that getting back to basics, or making prudent cuts to maintenance spending, will be enough to boost the bottom line. Yet these practices are not sustainable, and generally don’t support continuous improvement.
So how do you boost business profitability over the long-term, without compromising the effectiveness of your assets? How do you make the switch from reactive to proactive maintenance?
This whitepaper demonstrates how asset management requires a long-term view – incorporating planned maintenance and the effective (not just the efficient) management of assets – to deliver quantifiable results.
InTroducTIon
PAGE 1
Towards best-practice asset management
AcMEMAnufAcTurInGThis whitepaper uses a fictional
manufacturing plant, AcME, to demonstrate the effectiveness (or lack of) for the various practices that asset managers can use to boost profitability.
AcME operates 24/7, and produces 400,000 units of widgets per year. right now, it has a very disorganised and ad-hoc approach to asset management; and has a maintenance practice of keeping machines running at all costs – in other words, there is no planned downtime for scheduled maintenance.
With this approach, AcME gets a return on capital employed (rocE) of just 2.5%. They’d be better off putting their money in a high-interest bank account.
WHAT IS rocE?return on capital employed is a figure indicating the efficiency and profitability of the company’s capital investments. The higher rocE is, the better off your business will be.
Basically, rocE is calculated by dividing your profit by the cost of assets or capital.
But to make this calculation, you need to take a few steps back. To work out your profit, you need to know how much revenue you’ve brought in compared to how much you would if your plant worked at full capacity.
Let’s look at the AcME example to see how we get to rocE of 2.5%.
www.armsreliability.com
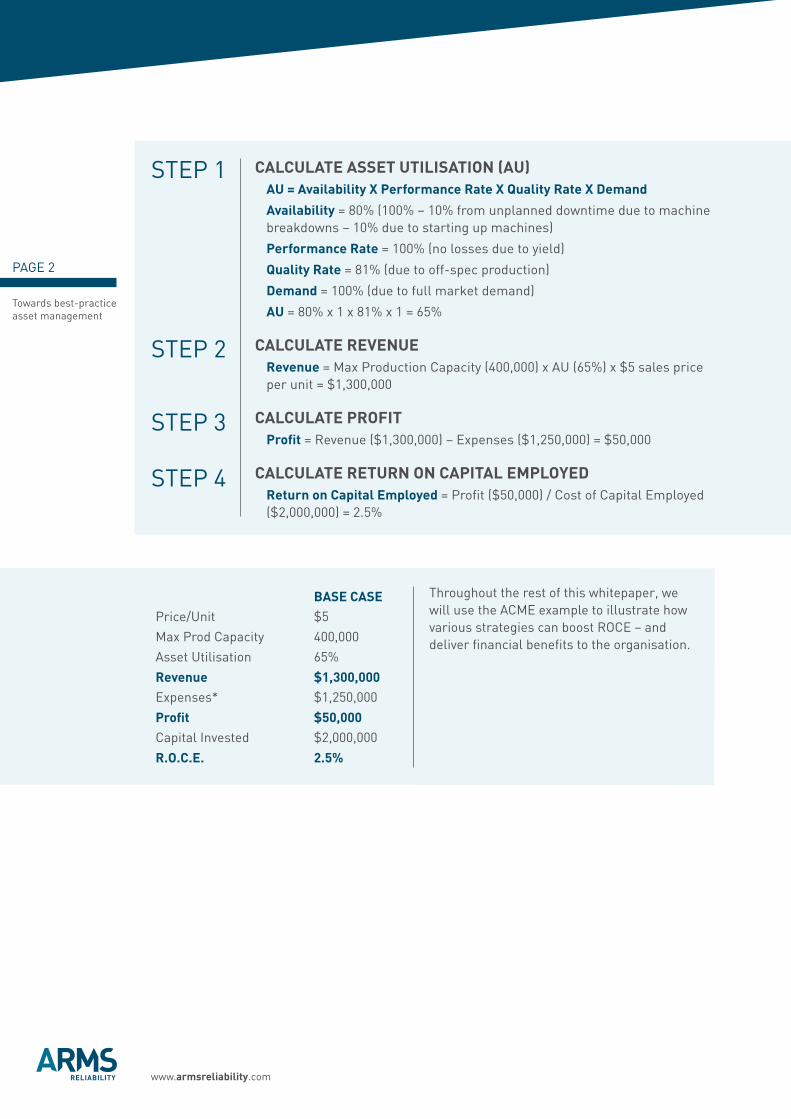
calculaTe asseT uTilisaTion (au)au = availability X performance rate X Quality rate X demand
availability = 80% (100% – 10% from unplanned downtime due to machine breakdowns – 10% due to starting up machines)
performance rate = 100% (no losses due to yield)
Quality rate = 81% (due to off-spec production)
demand = 100% (due to full market demand)
au = 80% x 1 x 81% x 1 = 65%
calculaTe revenuerevenue = Max Production capacity (400,000) x Au (65%) x $5 sales price per unit = $1,300,000
calculaTe profiTprofit = revenue ($1,300,000) – Expenses ($1,250,000) = $50,000
calculaTe reTurn on capiTal employedreturn on capital employed = Profit ($50,000) / cost of capital Employed ($2,000,000) = 2.5%
STEP 1
STEP 2
STEP 3
STEP 4
PAGE 2
Towards best-practice asset management
Throughout the rest of this whitepaper, we will use the AcME example to illustrate how various strategies can boost rocE – and deliver financial benefits to the organisation.
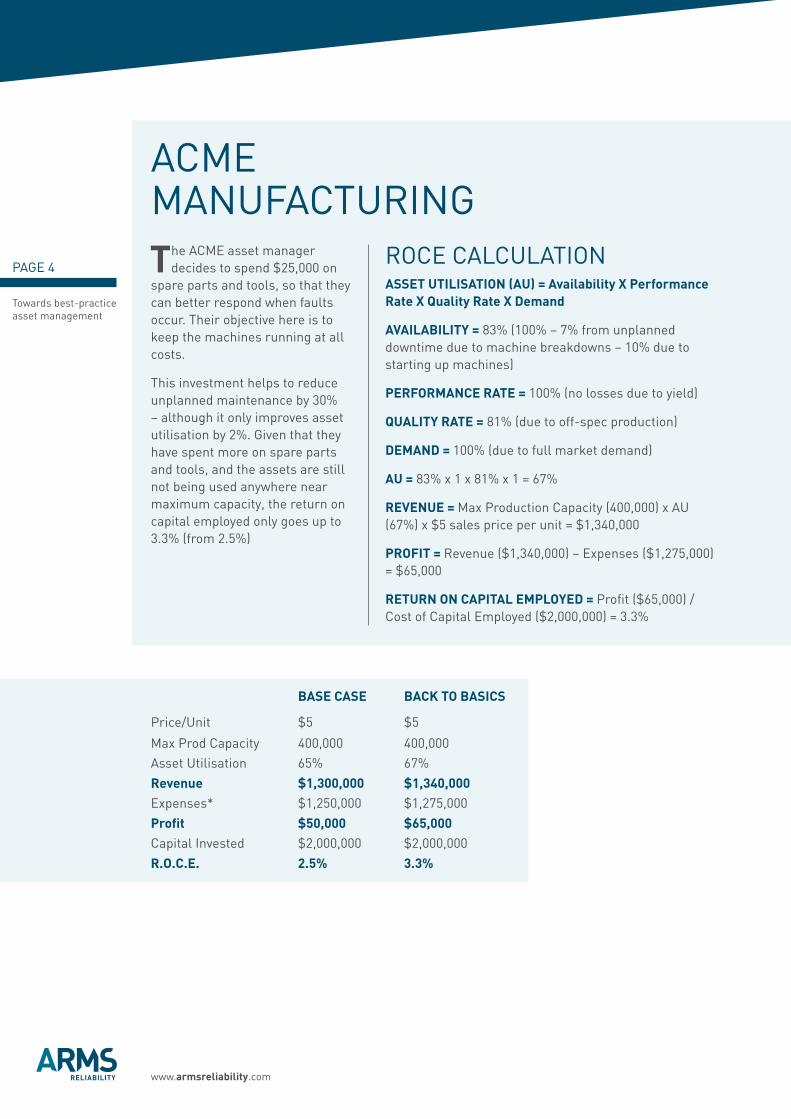
base casePrice/unit $5
Max Prod capacity 400,000
Asset utilisation 65%
revenue $1,300,000Expenses* $1,250,000
profit $50,000capital Invested $2,000,000
r.o.c.e. 2.5%
www.armsreliability.com
There are two common shortcuts taken in asset management, which many managers wrongly assume will deliver strong results for their business. The truth is that, while shortcuts may deliver an immediate result, they are not the optimal solution.
firstly, why does the need for these shortcuts arise? Essentially, they stem from the competing goals of the management team – to boost production and profits, while keeping the plant up and running via improved asset utilisation rates.
These competing goals create vicious circles, whereby the production team is under so much pressure to produce goods that they don’t factor in the time to run planned maintenance. The plant only allows downtime when there is no choice – when the machine is broken. This puts more stress and pressure on plant equipment, which in turn places more pressure on maintenance crews.
In a bid to overcome these issues, many managers implement one of two solutions – getting back to basics or reducing maintenance spend.
This section examines these shortcuts, using the AcME example to demonstrate why they are not always the best option.
SHorTcuT 1getting back to basics
A “back to basics” approach is about following good work practices and fixing broken machines in the shortest possible time. It often involves spending more on spare parts and various tools now, in a bid to reduce the time spent on unplanned maintenance and repairs down the track.
You would think that a reduction in unplanned maintenance equates to an increase in production capacity and profits. Yet, as the AcME calculations demonstrate, the boost in profits is offset by the increased spending on spare parts and tools – and only delivers a minimal increase in overall returns.
This is because the focus here is on fixing faults, rather than eliminating faults. Getting back to basics is a reactive approach to maintenance; whereas best-practice plants operate using a proactive approach.
SHorTcuTS In ASSET MAnAGEMEnT
PAGE 3
Towards best-practice asset management
www.armsreliability.com
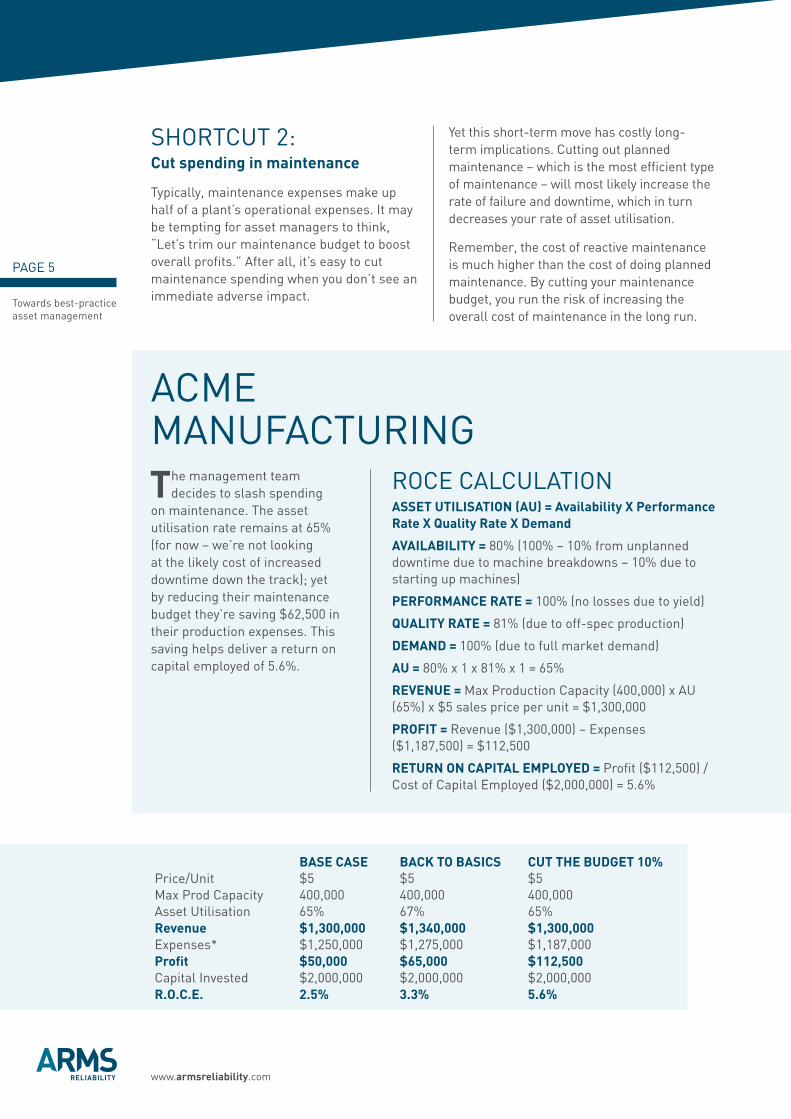
base case back To basics
Price/unit $5 $5
Max Prod capacity 400,000 400,000Asset utilisation 65% 67%
revenue $1,300,000 $1,340,000Expenses* $1,250,000 $1,275,000
profit $50,000 $65,000capital Invested $2,000,000 $2,000,000
r.o.c.e. 2.5% 3.3%
AcMEMAnufAcTurInGThe AcME asset manager
decides to spend $25,000 on spare parts and tools, so that they can better respond when faults occur. Their objective here is to keep the machines running at all costs.
This investment helps to reduce unplanned maintenance by 30% – although it only improves asset utilisation by 2%. Given that they have spent more on spare parts and tools, and the assets are still not being used anywhere near maximum capacity, the return on capital employed only goes up to 3.3% (from 2.5%)
rocE cALcuLATIonasseT uTilisaTion (au) = availability X performance rate X Quality rate X demand
availabiliTy = 83% (100% – 7% from unplanned downtime due to machine breakdowns – 10% due to starting up machines)
performance raTe = 100% (no losses due to yield)
QualiTy raTe = 81% (due to off-spec production)
demand = 100% (due to full market demand)
au = 83% x 1 x 81% x 1 = 67%
revenue = Max Production capacity (400,000) x Au (67%) x $5 sales price per unit = $1,340,000
profiT = revenue ($1,340,000) – Expenses ($1,275,000) = $65,000
reTurn on capiTal employed = Profit ($65,000) / cost of capital Employed ($2,000,000) = 3.3%
PAGE 4
Towards best-practice asset management
www.armsreliability.com
base case back To basics cuT The budgeT 10%Price/unit $5 $5 $5Max Prod capacity 400,000 400,000 400,000Asset utilisation 65% 67% 65%revenue $1,300,000 $1,340,000 $1,300,000Expenses* $1,250,000 $1,275,000 $1,187,000profit $50,000 $65,000 $112,500capital Invested $2,000,000 $2,000,000 $2,000,000r.o.c.e. 2.5% 3.3% 5.6%
SHorTcuT 2:cut spending in maintenance
Typically, maintenance expenses make up half of a plant’s operational expenses. It may be tempting for asset managers to think, “Let’s trim our maintenance budget to boost overall profits.” After all, it’s easy to cut maintenance spending when you don’t see an immediate adverse impact.
Yet this short-term move has costly long-term implications. cutting out planned maintenance – which is the most efficient type of maintenance – will most likely increase the rate of failure and downtime, which in turn decreases your rate of asset utilisation.
remember, the cost of reactive maintenance is much higher than the cost of doing planned maintenance. By cutting your maintenance budget, you run the risk of increasing the overall cost of maintenance in the long run.
AcMEMAnufAcTurInGThe management team
decides to slash spending on maintenance. The asset utilisation rate remains at 65% (for now – we’re not looking at the likely cost of increased downtime down the track); yet by reducing their maintenance budget they’re saving $62,500 in their production expenses. This saving helps deliver a return on capital employed of 5.6%.
rocE cALcuLATIonasseT uTilisaTion (au) = availability X performance rate X Quality rate X demand
availabiliTy = 80% (100% – 10% from unplanned downtime due to machine breakdowns – 10% due to starting up machines)
performance raTe = 100% (no losses due to yield)
QualiTy raTe = 81% (due to off-spec production)
demand = 100% (due to full market demand)
au = 80% x 1 x 81% x 1 = 65%
revenue = Max Production capacity (400,000) x Au (65%) x $5 sales price per unit = $1,300,000
profiT = revenue ($1,300,000) – Expenses ($1,187,500) = $112,500
reTurn on capiTal employed = Profit ($112,500) / cost of capital Employed ($2,000,000) = 5.6%
PAGE 5
Towards best-practice asset management
www.armsreliability.com
When asset managers start taking a long-term approach to maintenance and find ways to do things more efficiently and effectively, then they start reaping significant rewards.
A planned approach to asset management is all about decreasing the number of unplanned outages – so that production levels remain high and overall profits soar.
There are three steps in the path towards best practice asset management:
1. create a work order system to improve maintenance efficiency
2. develop an effective maintenance strategy to improve maintenance effectiveness
3. Adopt world-class operations with efficient and effective practices
We look at each of these steps, using the AcME example to demonstrate just how lucrative a best-practice approach to asset management can be. Get it right, and it pays remarkable dividends to your business.
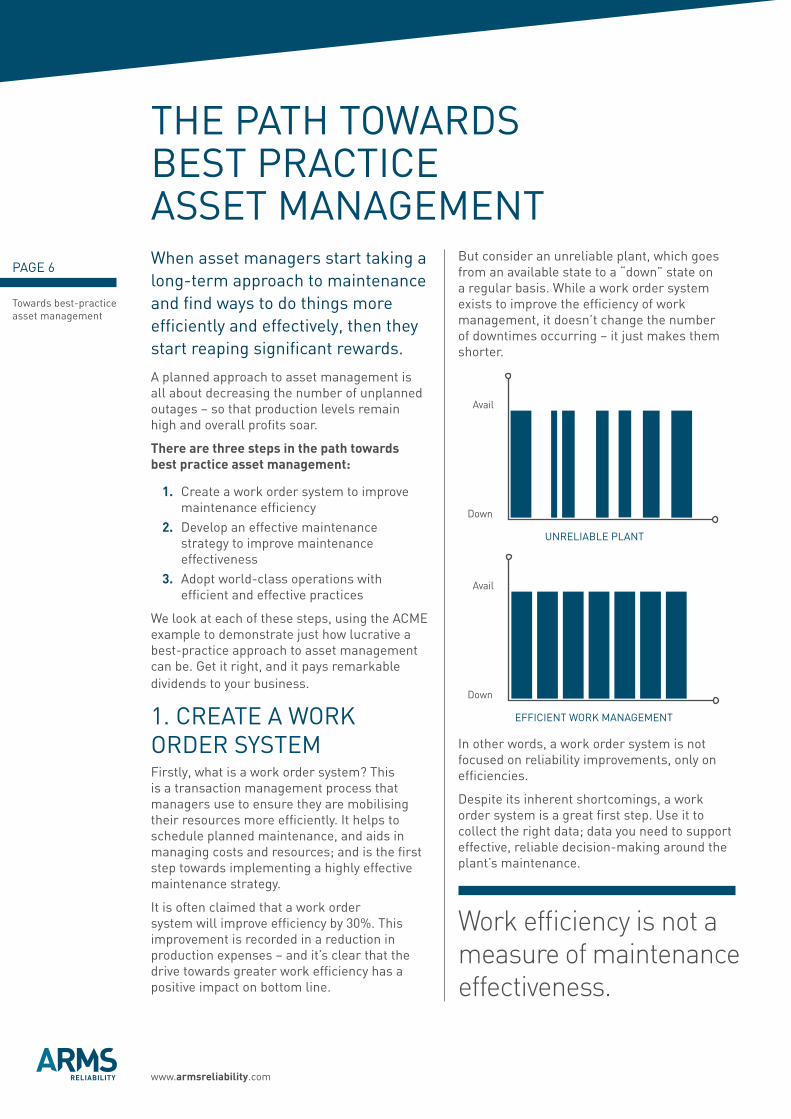
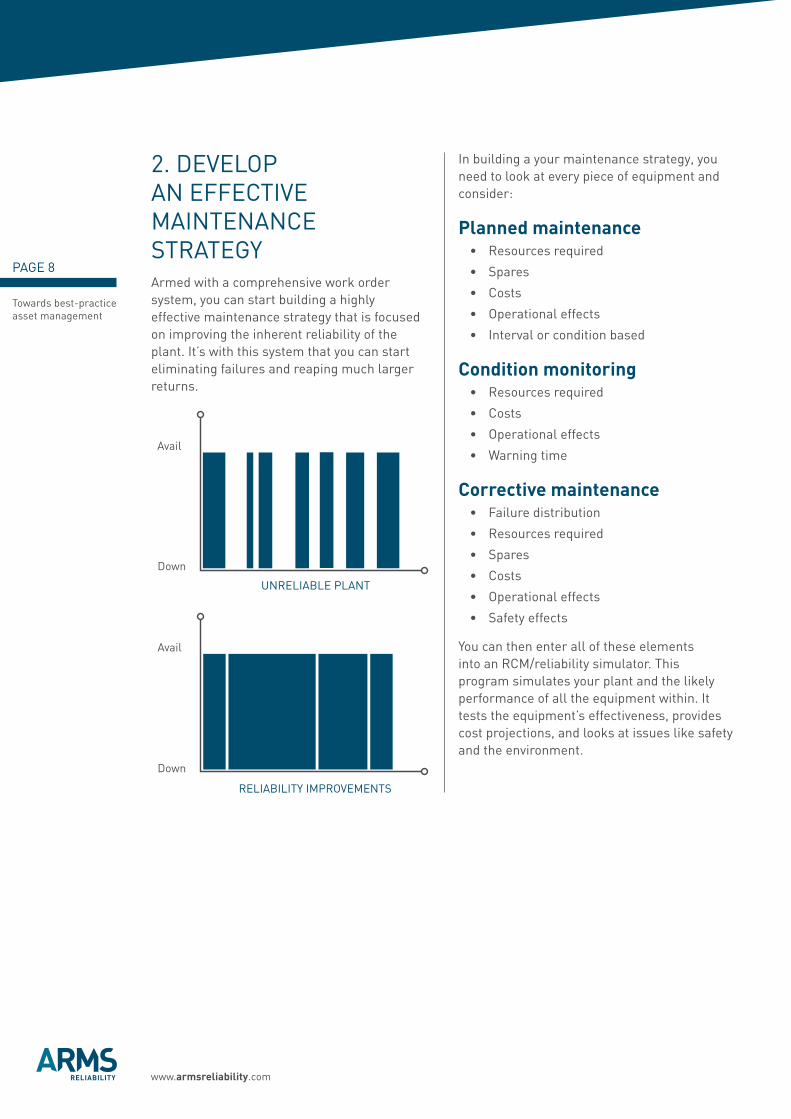
1. crEATE A Work ordEr SYSTEMfirstly, what is a work order system? This is a transaction management process that managers use to ensure they are mobilising their resources more efficiently. It helps to schedule planned maintenance, and aids in managing costs and resources; and is the first step towards implementing a highly effective maintenance strategy.
It is often claimed that a work order system will improve efficiency by 30%. This improvement is recorded in a reduction in production expenses – and it’s clear that the drive towards greater work efficiency has a positive impact on bottom line.
But consider an unreliable plant, which goes from an available state to a “down” state on a regular basis. While a work order system exists to improve the efficiency of work management, it doesn’t change the number of downtimes occurring – it just makes them shorter.
In other words, a work order system is not focused on reliability improvements, only on efficiencies.
despite its inherent shortcomings, a work order system is a great first step. use it to collect the right data; data you need to support effective, reliable decision-making around the plant’s maintenance.
Work efficiency is not a measure of maintenance effectiveness.
THE PATH ToWArdS BEST PrAcTIcE ASSET MAnAGEMEnT
PAGE 6
Towards best-practice asset management
EffIcIEnT Work MAnAGEMEnT
down
Avail
unrELIABLE PLAnT
down
Avail
www.armsreliability.com
base case
back To basics
cuT The budgeT 10%
new work order sysTem
Price/unit $5 $5 $5 $5Max Prod capacity 400,000 400,000 400,000 400,000Asset utilisation 65% 67% 65% 67%revenue $1,300,000 $1,340,000 $1,300,000 $1,340,000Expenses* $1,250,000 $1,275,000 $1,187,000 $1,062,000profit $50,000 $65,000 $112,500 $277,500capital Invested $2,000,000 $2,000,000 $2,000,000 $2,000,000
r.o.c.e. 2.5% 3.3% 5.6% 13.9%
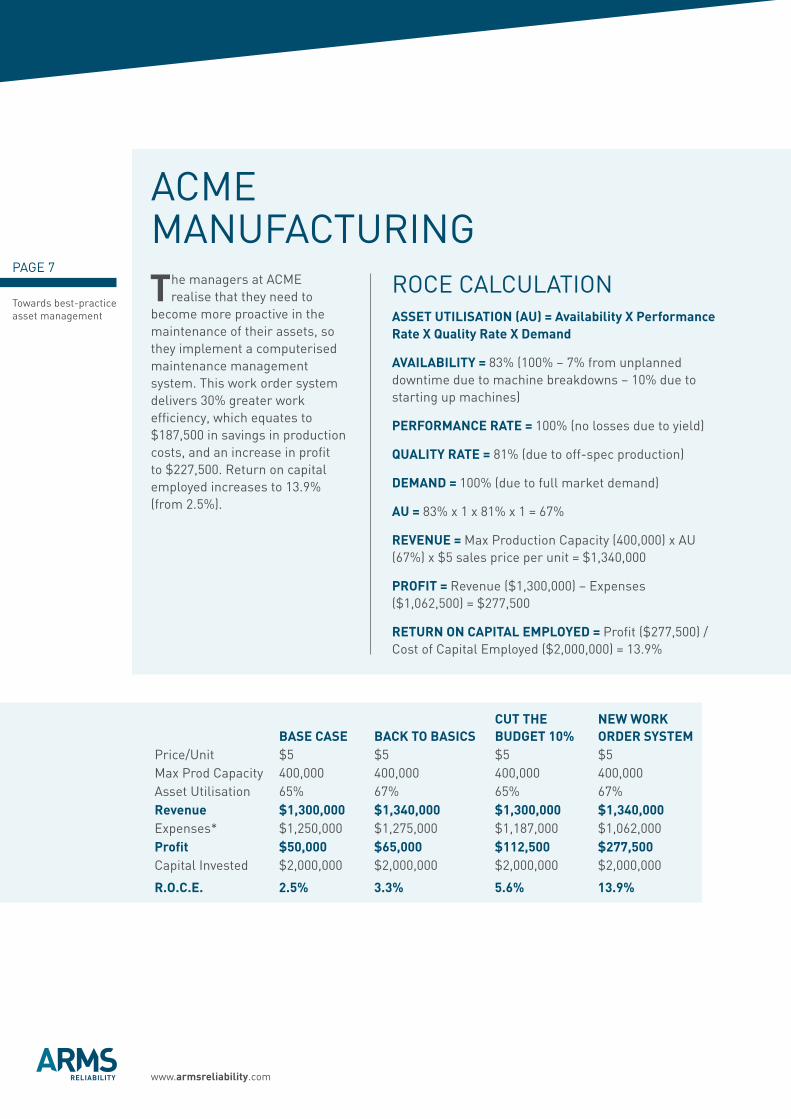
AcMEMAnufAcTurInGThe managers at AcME
realise that they need to become more proactive in the maintenance of their assets, so they implement a computerised maintenance management system. This work order system delivers 30% greater work efficiency, which equates to $187,500 in savings in production costs, and an increase in profit to $227,500. return on capital employed increases to 13.9% (from 2.5%).
rocE cALcuLATIonasseT uTilisaTion (au) = availability X performance rate X Quality rate X demand
availabiliTy = 83% (100% – 7% from unplanned downtime due to machine breakdowns – 10% due to starting up machines)
performance raTe = 100% (no losses due to yield)
QualiTy raTe = 81% (due to off-spec production)
demand = 100% (due to full market demand)
au = 83% x 1 x 81% x 1 = 67%
revenue = Max Production capacity (400,000) x Au (67%) x $5 sales price per unit = $1,340,000
profiT = revenue ($1,300,000) – Expenses ($1,062,500) = $277,500
reTurn on capiTal employed = Profit ($277,500) / cost of capital Employed ($2,000,000) = 13.9%
PAGE 7
Towards best-practice asset management
www.armsreliability.com
unrELIABLE PLAnT
down
Avail
rELIABILITY IMProVEMEnTS
down
Avail
2. dEVELoP An EffEcTIVE MAInTEnAncE STrATEGYArmed with a comprehensive work order system, you can start building a highly effective maintenance strategy that is focused on improving the inherent reliability of the plant. It’s with this system that you can start eliminating failures and reaping much larger returns.
In building a your maintenance strategy, you need to look at every piece of equipment and consider:
planned maintenance• resources required
• Spares
• costs
• operational effects
• Interval or condition based
condition monitoring• resources required
• costs
• operational effects
• Warning time
corrective maintenance • failure distribution
• resources required
• Spares
• costs
• operational effects
• Safety effects
You can then enter all of these elements into an rcM/reliability simulator. This program simulates your plant and the likely performance of all the equipment within. It tests the equipment’s effectiveness, provides cost projections, and looks at issues like safety and the environment.
PAGE 8
Towards best-practice asset management
www.armsreliability.com
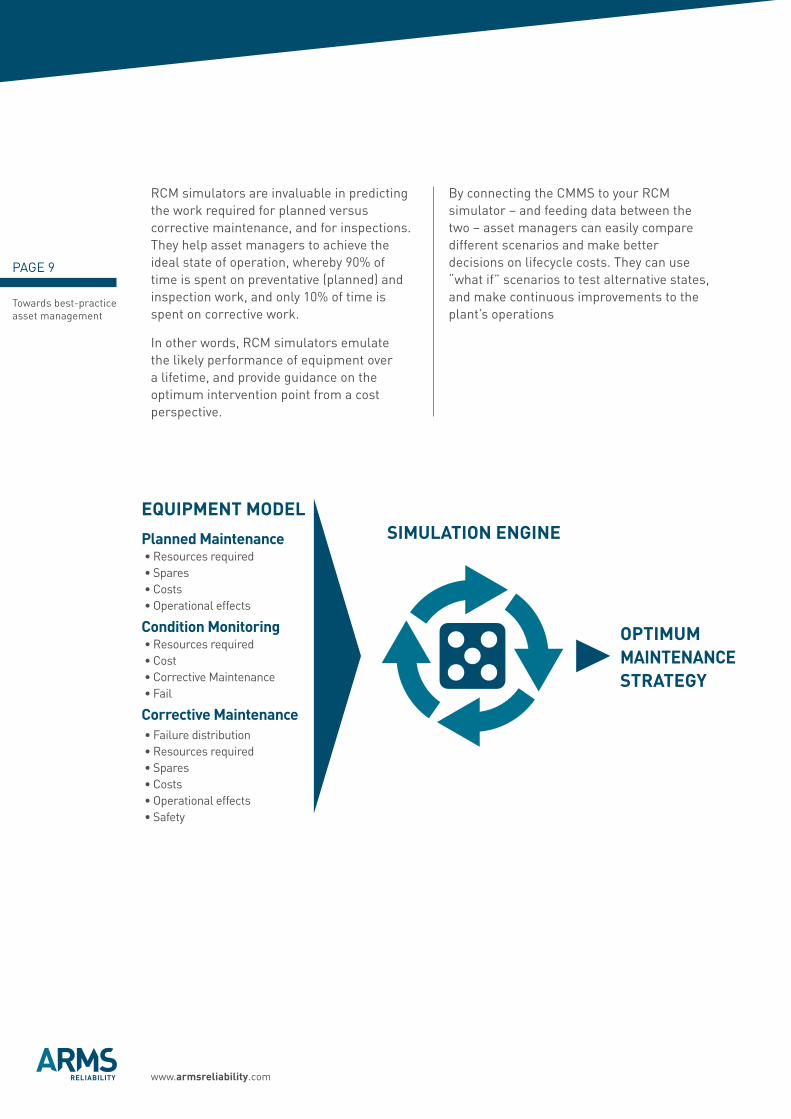
rcM simulators are invaluable in predicting the work required for planned versus corrective maintenance, and for inspections. They help asset managers to achieve the ideal state of operation, whereby 90% of time is spent on preventative (planned) and inspection work, and only 10% of time is spent on corrective work.
In other words, rcM simulators emulate the likely performance of equipment over a lifetime, and provide guidance on the optimum intervention point from a cost perspective.
By connecting the cMMS to your rcM simulator – and feeding data between the two – asset managers can easily compare different scenarios and make better decisions on lifecycle costs. They can use “what if” scenarios to test alternative states, and make continuous improvements to the plant’s operations
eQuipmenT model
PAGE 9
Towards best-practice asset management
planned maintenance• resources required • Spares• costs• operational effects
condition monitoring• resources required• cost• corrective Maintenance• fail
corrective maintenance• failure distribution• resources required• Spares• costs• operational effects• Safety
simulaTion engine
opTimum mainTenance sTraTegy
www.armsreliability.com
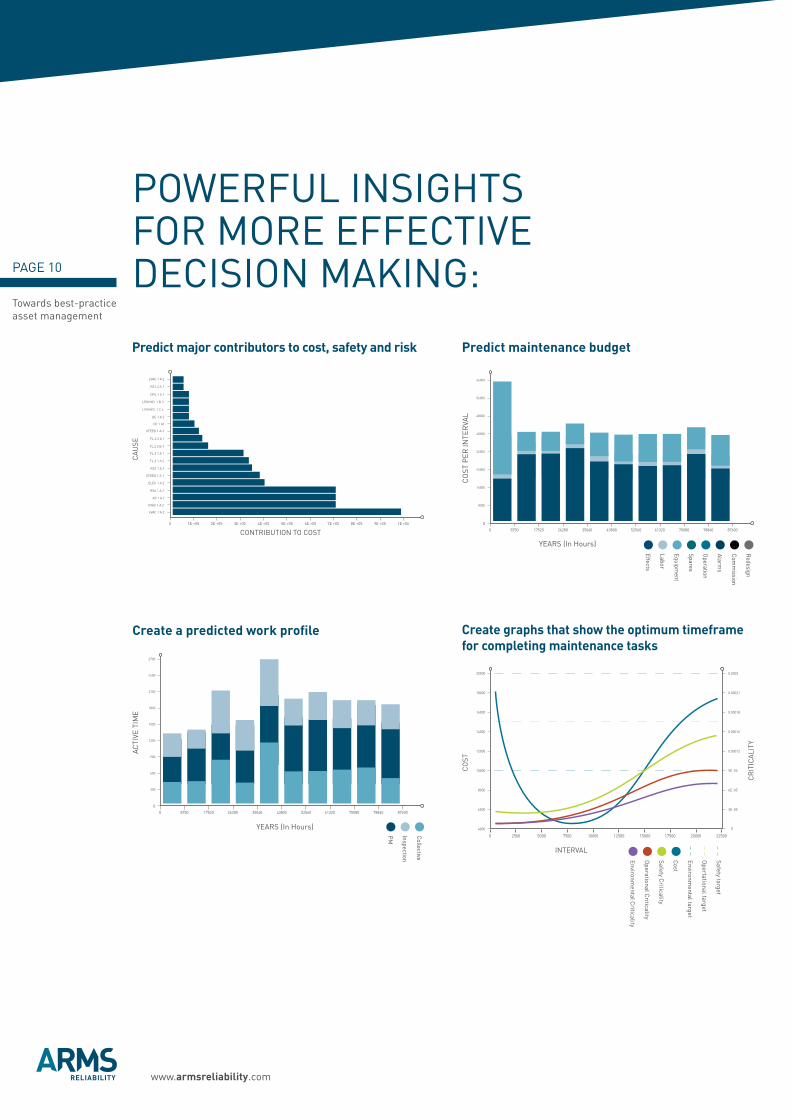
predict major contributors to cost, safety and risk
0 1E +05
LVAc.1 A 2
rS1.2 A 1
cPu.1 A 1
LPGHYd. 1 B 3
LPGHYd. 1 c 4
dE 1 A 2
dE 1 A1
SfEEd 1 A 3
SfEEd 1 A 1
ELEc 1 A 2
rSA 1 A 2
AS 1 A 2
uVAc 1 A 2
LVAc 1 A 2
fL.2 2 A 1
fL.2 2 B 1
fL.3 1 A 1
fL.2 1 A 2
rS2 1 A 2
2E +05 3E +05 4E +05 5E +05 6E +05 7E +05 8E +05 9E +05 1E +06
conTrIBuTIon To coST
cA
uSE
create a predicted work profile
0 8750 17520 26280 35040 43800 52560 61320 70080 78840 87600
0
1800
1500
1200
900
600
300
2400
2700
2100
AcTI
VE T
IME
predict maintenance budget
0
0
8750
48000
40000
32000
24000
16000
8000
64000
56000
17520 26280 35040 43800 52560 61320 70080 78840 87600
co
ST P
Er In
TEr
VAL
YEArS (In Hours)
YEArS (In Hours)
PM
Inspection
collective
Effects
Spares
comm
ission
Labor
operation
redesign
Equipment
Alarms
create graphs that show the optimum timeframe for completing maintenance tasks
PAGE 10
Towards best-practice asset management
PoWErfuL InSIGHTS for MorE EffEcTIVE dEcISIon MAkInG:
0 2500
16000 0.00018
14000 0.00015
12000 0.00012
10000 9E-05
8000 6E-05
6000 3E-05
4000 0
20000 0.0003
18000 0.00021
5000 7500 10000 12500 15000 17500 20000 22500
cr
ITIc
ALI
TY
co
ST
InTErVAL
Environmental c
riticality
cost
Safety target
operational c
riticality
Environmental target
Safety criticality
opertational target
www.armsreliability.com
base case
new work order sysTem
effecTive sTraTegy
Price/unit $5 $5 $5
Max Prod capacity 400,000 400,000 400,000
Asset utilisation 65% 67% 77%
revenue $1,300,000 $1,340,000 $1,530,000Expenses* $1,250,000 $1,062,000 $811,875
profit $50,000 $277,500 $718,125capital Invested $2,000,000 $2,000,000 $2,000,000
r.o.c.e. 2.5% 13.9% 35.9%
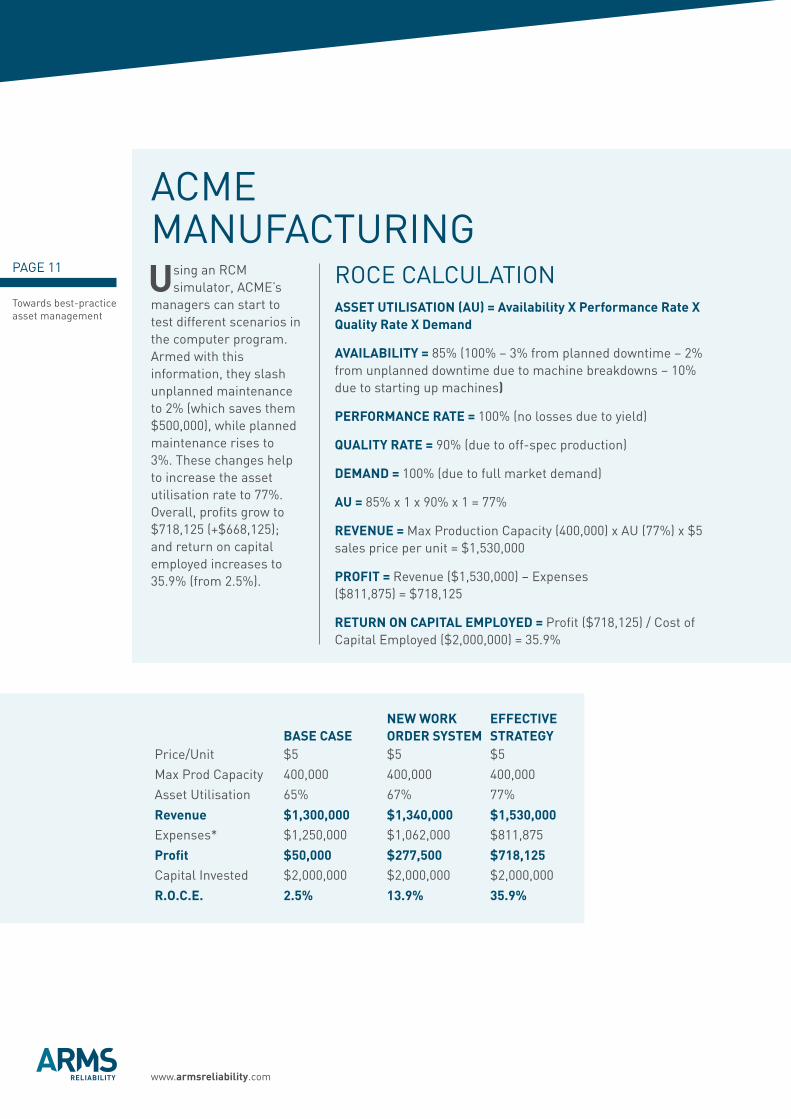
AcMEMAnufAcTurInGusing an rcM
simulator, AcME’s managers can start to test different scenarios in the computer program. Armed with this information, they slash unplanned maintenance to 2% (which saves them $500,000), while planned maintenance rises to 3%. These changes help to increase the asset utilisation rate to 77%. overall, profits grow to $718,125 (+$668,125); and return on capital employed increases to 35.9% (from 2.5%).
rocE cALcuLATIonasseT uTilisaTion (au) = availability X performance rate X Quality rate X demand
availabiliTy = 85% (100% – 3% from planned downtime – 2% from unplanned downtime due to machine breakdowns – 10% due to starting up machines)
performance raTe = 100% (no losses due to yield)
QualiTy raTe = 90% (due to off-spec production)
demand = 100% (due to full market demand)
au = 85% x 1 x 90% x 1 = 77%
revenue = Max Production capacity (400,000) x Au (77%) x $5 sales price per unit = $1,530,000
profiT = revenue ($1,530,000) – Expenses ($811,875) = $718,125
reTurn on capiTal employed = Profit ($718,125) / cost of capital Employed ($2,000,000) = 35.9%
PAGE 11
Towards best-practice asset management
www.armsreliability.com
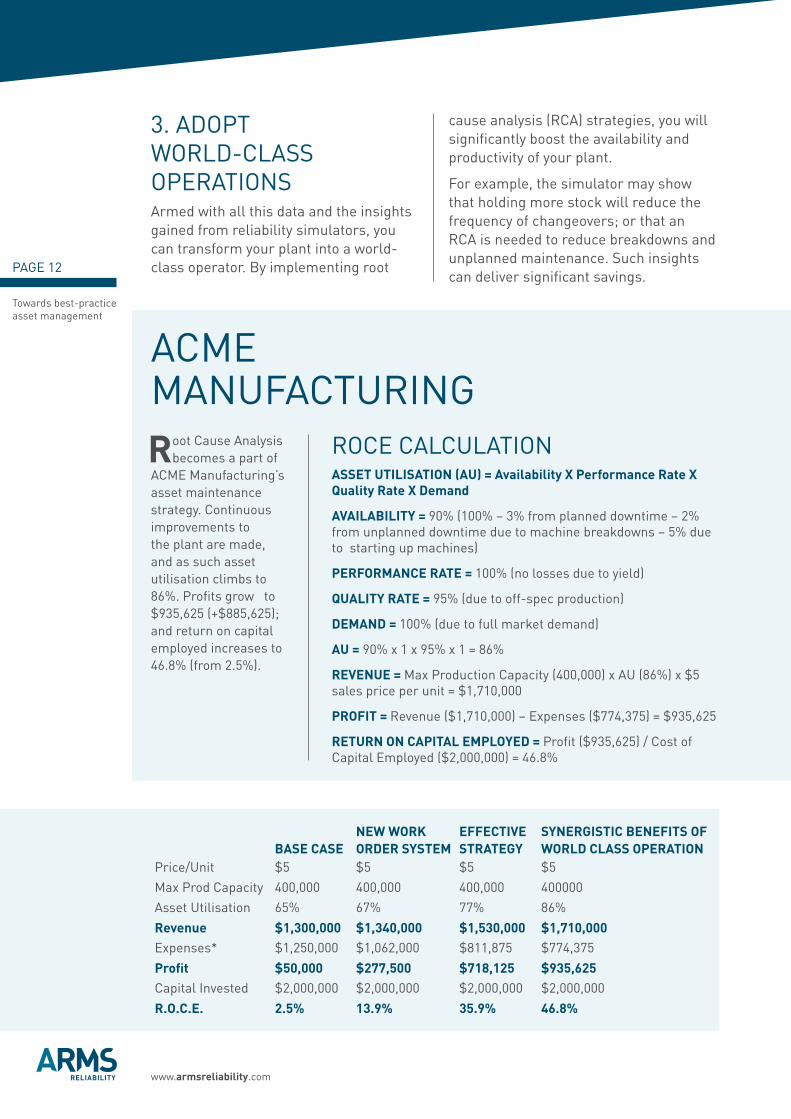
3. AdoPT WorLd-cLASS oPErATIonSArmed with all this data and the insights gained from reliability simulators, you can transform your plant into a world-class operator. By implementing root
cause analysis (rcA) strategies, you will significantly boost the availability and productivity of your plant.
for example, the simulator may show that holding more stock will reduce the frequency of changeovers; or that an rcA is needed to reduce breakdowns and unplanned maintenance. Such insights can deliver significant savings.
AcMEMAnufAcTurInGroot cause Analysis
becomes a part of AcME Manufacturing’s asset maintenance strategy. continuous improvements to the plant are made, and as such asset utilisation climbs to 86%. Profits grow to $935,625 (+$885,625); and return on capital employed increases to 46.8% (from 2.5%).
rocE cALcuLATIonasseT uTilisaTion (au) = availability X performance rate X Quality rate X demand
availabiliTy = 90% (100% – 3% from planned downtime – 2% from unplanned downtime due to machine breakdowns – 5% due to starting up machines)
performance raTe = 100% (no losses due to yield)
QualiTy raTe = 95% (due to off-spec production)
demand = 100% (due to full market demand)
au = 90% x 1 x 95% x 1 = 86%
revenue = Max Production capacity (400,000) x Au (86%) x $5 sales price per unit = $1,710,000
profiT = revenue ($1,710,000) – Expenses ($774,375) = $935,625
reTurn on capiTal employed = Profit ($935,625) / cost of capital Employed ($2,000,000) = 46.8%
PAGE 12
Towards best-practice asset management
base case
new work order sysTem
effecTive sTraTegy
synergisTic benefiTs of world class operaTion
Price/unit $5 $5 $5 $5
Max Prod capacity 400,000 400,000 400,000 400000
Asset utilisation 65% 67% 77% 86%
revenue $1,300,000 $1,340,000 $1,530,000 $1,710,000Expenses* $1,250,000 $1,062,000 $811,875 $774,375
profit $50,000 $277,500 $718,125 $935,625capital Invested $2,000,000 $2,000,000 $2,000,000 $2,000,000
r.o.c.e. 2.5% 13.9% 35.9% 46.8%
www.armsreliability.comnorth America | Latin America | Europe | Asia | Africa | Australia
www.armsreliability.com [email protected]
norTh / cenTral / souTh americaP: +1 512 795 5291
ausTralia / asia / new ZealandP: +61 3 5255 5357
europeP: +44 122 445 9362
souTh africaP: +27 10 500 8232
Asset managers need to think “big picture” when it comes to extracting the most profit and performance from their equipment. Instead of second-guessing and taking shortcuts, they need to implement planned and proactive strategies to get real profits.
As the AcME simulations show, short term solutions like getting back to basics and cutting maintenance budgets will limit your potential to increase profitability. Yes, returns improve – but not by as much as they could.
Instead, planned, proactive maintenance can have dramatic, positive impacts on both downtime and costs; and will have a much greater impact on profitability. remember, it’s a continuous process, not a one-off activity. But by putting the wheels in motion today, your business will reap significant rewards for a long time to come.
about arms reliability
Since 1995, ArMS reliability has been at the forefront of proactive asset management strategies for a range of blue chip companies throughout the world. These companies have entrusted us with delivering business goals through effective asset management and improvements in operational productivity.
ArMS reliability is a service, software, and training organisation providing a “one stop shop” for reliability Engineering, rAMS, and Maintenance optimisation for both new and existing projects.
If you would like to discuss your situation and what are the essential elements to achieving best practice Asset Management, then give ArMS reliability
a call or
PAGE 13
Towards best-practice asset management
SuMMArY
Enquire now
share this!
Top Related