


Languages
Pages
Legal

Toward a comprehensive understanding of solid-state core-level XPS linewidths: Experimentaland theoretical studies on the Si 2p and O 1s linewidths in silicates
G. M. Bancroft,1,* H. W. Nesbitt,2 R. Ho,2 D. M. Shaw,3 J. S. Tse,3 and M. C. Biesinger4
1Department of Chemistry, University of Western Ontario, London, Ontario, Canada N6A 5B72Department of Earth Sciences, University of Western Ontario, London, Ontario, Canada N6A 5B73Department of Physics, University of Saskatchewan, Saskatoon, Saskatchewan, Canada S7N 5E2
4Surface Science Western, University of Western Ontario, London, Ontario, Canada N6A 5B7�Received 28 April 2009; published 4 August 2009�
High resolution X-ray Photoelectron Spectroscopy �XPS� core-level Si 2p and O 1s spectra of the noncon-ductors �-SiO2 �quartz� at 120 and 300 K and vitreous SiO2 at 300 K were obtained with a Kratos Axis UltraXPS instrument �instrumental resolution of �0.4 eV� which incorporates a unique charge compensation sys-tem that minimizes differential charge broadening on nonconductors. The Si 2p and O 1s linewidths at 300 K��1.1 and �1.2 eV, respectively� are similar for all silicates �and similar to previous thin film SiO2 spectraobtained previously�, showing that differential charging does not contribute significantly to our spectra. At 120K, there is a small decrease �0.04 eV� in the Si 2p linewidth of �-SiO2, but no measurable decrease in O 1slinewidth. The O 1s lines are generally and distinctly asymmetric. We consider all possible sources of linebroadening and show that final state vibrational broadening �FSVB� and phonon broadening are the majorcauses of the broad and asymmetric lines. Previous high resolution gas phase XPS studies have identified largeFSVB contributions to the Si 2p spectra of SiCl4, SiF4, and Si�OCH3�4 molecules, and this vibrational structureleads total Si 2p3/2 linewidths of up to �0.5 eV, even with individual peak linewidths of �0.1 eV. The Siatom of Si�OCH3�4 is an excellent analog for Si in crystalline SiO2 because the Si-O bond lengths andsymmetric stretch frequencies are similar in both compounds. Similar vibrational contributions to the Si 2p andO 1s spectra of solid silicates are anticipated if the Si 2p and O 1s core-hole states produce similar changes tothe Si-O bond length in both phases. To investigate the possibility, Car-Parrinello molecular dynamics calcu-lations were performed and show that changes to Si-O bond lengths between ion and ground states ��r� forboth Si 2p and O 1s hole states are similar for both crystalline SiO2 and gaseous Si�OCH3�4. �r are −0.04 Åfor Si 2p and �+0.05 Å for O 1s in both compounds. Indeed, the vibrational envelope from the Si 2pspectrum of Si�OCH3�4, broadened to our instrumental linewidth of 0.4 eV, accounts for the majority��0.8 eV� of the Si 2p3/2 linewidth for crystalline SiO2 ��1.1 eV� with phonon broadening accounting forthe remainder. The results provide excellent support for the tenet that final state vibrational splitting, as seen inthe gas phase molecules, similarly affects the solid-state spectra. The calculations also indicate that the O 1slinewidths should be larger than the Si 2p linewidths, as observed in our spectra. FSVB should also lead tosmall peak asymmetries, as seen in the O 1s spectra. The contribution of phonon broadening to the linewidthis also evaluated and shown to be comparable to the FSVB contribution at 120 and 300 K but considerablysmaller at very low temperatures.
DOI: 10.1103/PhysRevB.80.075405 PACS number�s�: 79.60.Bm, 71.15.Mb
I. INTRODUCTION
O 1s X-ray Photoelectron Spectroscopy �XPS� spectraand core-level spectra of many other elements in oxides arewidely used to obtain chemical state information of oxygenand metal species in and on solids and surfaces before andafter chemical reactions. With the advent of high resolutionsynchrotron x-ray sources, high resolution electron analyz-ers, and effective charge neutralization systems �e.g., KratosAxis Ultra instrument� which dramatically decrease chargebroadening for “rough” nonconductor surfaces, experimentalcore-level spectra are now highly reproducible for nearly alltypes of solid surfaces. Core-level XPS spectra and particu-larly O 1s spectra consequently have been used ever morewidely to characterize bulk and thin film simple oxides �e.g.,see very recent references to pristine, thin films, modifiedthin films, or reacted surfaces such as TiO2,1–7 SiO2 andsilicates,8–13 RuO2,14,15 MgO,16–18 CaO,19 ZnO,20 Fe3O4,21
Cu2O,22 and other transition metal oxides;23–25 also see arecent review of ambient pressure XPS on oxides26�.
Recent XPS studies on nonconductor glasses,27–30 com-plex superconductor oxides,31–33 ceramics,34,35 and surfacereactions of many oxygen-containing molecules on a widevariety of substances36–39 have also reported narrower O 1sand other core-level linewidths than previously collected.Because the majority of these substrates are nonconductors,many recent studies have been conducted using the Kratosinstrument with its novel magnetic confinement charge com-pensation system. The instrument has yielded reproducibleO 1s and other core-level spectral line shapes and linewidthson both atomically smooth and rough nonconductor surfaces:the O 1s linewidths, for example, are often muchnarrower8–11,27–29 than previously obtained with other instru-ments for bulk nonconductors. Moreover, nonconductor line-widths have been shown to be just as narrow as obtained forsemiconductors8 or metals.40 For example,40 VO2 exhibits aninsulator-metal transition above 300 K and the O 1s line-width at 270 K of the insulator phase of VO2 �measured fromFig. 3 of Ref. 40 as 1.0 eV� is as narrow as �or slightlynarrower than� the linewidth of the metallic phase at 320 K
PHYSICAL REVIEW B 80, 075405 �2009�
1098-0121/2009/80�7�/075405�13� ©2009 The American Physical Society075405-1
�measured as at least 1.1 eV�. O 1s linewidths for the metal-lic phase are difficult for us to simply measure off a pub-lished figure because of the Doniach-Sunjic asymmetry,which was not quantified in Ref. 40.
Although surface charging has been largely overcomewith technical advances, core-level linewidths of oxides re-main surprisingly large. In most of the above studies, theO 1s and other core-level spectra were fitted with symmetricGaussian/Lorentzian or Voigt line shapes and fits yieldedO 1s linewidths commonly greater than 1.0 eV �e.g., about1.2 eV for silicates8–11,27–29 and about 1.4 eV for MgO �Refs.16–18��. The O 1s linewidths on the semiconductor TiO2and other transition metal oxides and superconductors arenarrower, but still usually �1.0 eV, except for Cu2O,22
RuO2,14,15 and the superconductors Sr2CuO2Cl2 andCa2CuO2Cl2.33 The O 1s linewidths on the bulk semiconduc-tor Cu2O �Ref. 22� at room temperature appear to be thenarrowest O 1s linewidth yet published at 0.7 eV; while formetallic RuO2 films14,15 the O 1s linewidths at 100 K were�0.75 eV �both results obtained with high resolution syn-chrotron radiation sources with a total experimental reso-lution of less than 0.2 eV�. It is also apparent from Si 2p3/2spectra of silicates, Ti 2p3/2 spectra for TiO2, and Ru 3d5/2spectra of RuO2 that the metal linewidths are usually nar-rower than the O 1s linewidths for a given compound. In-deed, the Ru 3d3/2 linewidth of the conducting RuO2 films onRu metal is �0.5 eV, whereas the O 1s linewidth is�0.75 eV.
In addition to broad lines, some O 1s spectra �e.g., MgO,CaO, and silicates� display a small but distinct asymmetrymaking it necessary to fit an additional peak �10–20 % of theintensity of the main peak� usually on the high binding en-ergy side of the peak.13,28 The high energy peak has some-times been assigned to an “additional” chemicalspecies.13,28,35,39
Questions arise from the above results: �1� why are theseO 1s linewidths so broad and variable �0.7 to �1.3 eV� rela-tive to observed individual linewidths of 50–150 meV forSi 2p, C 1s, P 2p, and B 1s spectra of polyatomic moleculesin the gas phase;41–45 �2� why are they much broader thantotal linewidths observed for semiconductor solids such asSi,46–48 PbS �Ref. 49� ��0.3 eV�, FeAsS and FeS2 �Ref. 50���0.5 eV�, and for other nonconductors such as As2S3 �Ref.8� ��0.5 eV�; �3� should the O 1s line shapes be symmetricwhen there is only one structural O species in an oxide; and�4� why are the metal linewidths generally narrower than theO 1s linewidths for a given oxide?
Traditionally, large solid-state linewidths have been attrib-uted to phonon broadening �PB�. In 1974, Citrin et al.51 pub-lished temperature dependent monochromatic XPS spectra ofthe potassium and halide core levels on thin film potassiumhalides. The measured linewidths of about 1 eV were cor-rected for the instrumental effects �photon and electron line-widths�. The temperature dependence of the nonconductorlinewidths �better seen in the core-level metal spectra51� wasshown to be consistent51–53 with phonon broadening fromexcitation of a large number of phonons produced in re-sponse to hole production. Phonon broadening should lead tosymmetric Gaussian51–53 line shapes, and there was no evi-dence for asymmetry in the experimental spectra of the alkali
halides. The phonon contribution explained the temperaturedependence of the linewidths, but the corrected experimentallinewidths were, at all temperatures, larger than calculated,51
with no explanation provided. Furthermore, separate calcula-tions yielded large differences ��0.2 eV� in the calculatedlinewidths.51–53 Finally, the linewidths extrapolated to 0 K�here referred to as �PH�0�� have large uncertainties becauseextrapolations of experimental data extended over an�300 °C range.
The extrapolations, nevertheless, indicate �PH�0� valuesmuch greater than inherent linewidths expected from finalstate lifetime contributions.
Another possible major contribution to solid-state linebroadening is “final state” vibrational splitting and broaden-ing which arise from the difference in bond lengths betweenthe ground state and ion state. Siegbahn et al.54 first showedthat final state vibrational broadening �FSVB� contributed tothe C 1s spectrum of CH4 gas. Bancroft and co-workers41,55
later demonstrated the importance of this vibrational splittingon polyatomic gas phase Si compounds. Unlike PB, FSVB istemperature independent and can lead to asymmetric lineprofiles. In the last 10 years Thomas et al.42 obtained opti-mized spectra on the C 1s spectra of a host of gas phase Ccompounds as well as the Si 2p, P 2p, and B 1s spectra onSi, P, and B compounds.43–45 The vibrationally resolved O 1sspectrum of gas phase H2O has also been reported, yieldingan inherent O 1s linewidth of 160 meV.56 These results dem-onstrated the following: �1� lifetime contributions to theoverall band profile are small �e.g., in SiF4, the inherent in-dividual peak width is 79 meV compared to the overallSi 2p3/2 profile width of �0.5 eV�; �2� FSVB is the control-ling factor on the overall linewidth; �3� the symmetric M-Xstretching frequency dominates most spectra, although forthe O 1s spectrum of H2O the bending mode is dominant;56
�4� the total linewidth for a vibrational profile increases lin-early with the symmetric stretch frequency �see Si 2p spectraof SiCl4 and SiF4 �Ref. 43��; and �5� vibrational profiles areinvariably asymmetric to higher binding energies.
For adsorbed molecules on surfaces, Martennson andNilson57 suggested that FSVB contributes to the overallwidths of core-level spectra of adsorbed species �e.g., C 1sand O 1s of CO�. Andersen et al.58 and Folisch et al.,59 usinghigh resolution synchrotron radiation, then resolved andcharacterized the C-H and C-O final state vibrational split-tings �from the symmetric stretch� on the C 1s peaks of ad-sorbed ethylenes and CO, respectively. The resolved C 1speaks were broadened somewhat relative to the gas phasespectra of C2H4 and CO because of low-energy “coopera-tive” vibrational modes, analogous to the phonon broadeningin bulk solids. A large number of papers have reported bothtypes of splitting and broadening to the core-level spectra ofadsorbed species �for a recent paper see Ref. 60�. Also, re-cently, Bergersen et al.61 observed both types of vibrationalsplitting and broadening in the C 1s spectra of CH4 clustersof up to 1000 molecules.
To our knowledge, there has been only one mention in theliterature of the importance of FSVB on the core-level XPSspectra of bulk solids. It was suggested8 that this final statevibrational splitting dominates the Si 2p linewidth in solid-state silicates such as Mg2SiO4, just as it dominates the over-
BANCROFT et al. PHYSICAL REVIEW B 80, 075405 �2009�
075405-2
all Si 2p linewidth in the gas phase analog Si�OCH3�4.55
However, Andersen et al.62 reported resolved asymmetric vi-brational structure �vibrational splitting of 58 meV� on thehigh resolution Be 1s XPS spectrum of Be metal. They at-tributed this structure to a resolved phonon effect. Because ofthe large calculated difference in Be-Be bond length betweenground and ion state,63 it appears to us that the resolvedvibrational profile in the Be 1s XPS of Be metal is morelikely due to final state vibrational splitting. Coincidentally,the calculated Be 1s profile in molecular Be2 is very similarto that of Be metal.64
It is important to show that both phonon broadening andfinal state vibrational contributions are the important con-tributors to the broad core-level spectra of solids �as for theabove adsorbates and clusters� for at least two very practicalreasons. First, it may be possible to obtain much narrowerO 1s �and other core-level� linewidths on nonconductors inthe future by cooling samples to low T and using synchrotronradiation to obtain the highest experimental resolution andsecond, many O 1s and other core-level spectra may be in-herently asymmetric as expected when final state vibrationalsplitting is a dominant contribution to these core-level spec-tra. Recognition of asymmetry is especially important, oth-erwise small deviations from symmetric O 1s peaks may beinterpreted as small additional peaks from moieties withunique chemical shifts.
In this paper, we present experimental and theoretical evi-dence for the importance of FSVB on the Si 2p and O 1sXPS spectra of silicates. High-level MD calculations arecritical to show that the final state vibrational effects in asilicate should be very similar to those already observed ongas phase silicon analogs and that the broadening �and asym-metry� of the O 1s spectra should, if anything, be larger thanfor the Si 2p spectra. After addressing possible causes of linebroadening �e.g., inherent linewidth differences, differentialcharging, inhomogeneous work functions, and surfacechemical shifts�, we show that the observed Si 2p and O 1slinewidths in silicates can be understood using the combina-tion of FSVB and PB.
II. EXPERIMENTAL METHODS
A gem-quality �-quartz �SiO2� specimen �the same asused previously8� was obtained from the UWO Dana collec-tion, and pure vitreous SiO2 was obtained commercially.Their purity was characterized by broad scan XPS spectrathat showed no impurities other than the usual small C 1speak from ubiquitous carbon. Both samples were fractured insitu in the vacuum of the transfer chamber �low 10−8 Torrrange� and immediately transferred to the analytical chamberwhere pressures were in the low 10−9 Torr range. Quartz hasno cleavage so that its fracture exposes an irregular surface.Fracture of vitreous silica produces a conchiodal fracture sur-faces. For the most general use of the XPS technique, it isimportant to be able to get the “minimal” linewidths onrough surfaces of nonconductors.
A Kratos Axis Ultra x-ray photoelectron spectrometer�with magnetic confinement charge compensation system�65
at Surface Science Western was used to collect the XPS
spectra using Al K� radiation at 1486.71 eV and a 300�700 �m2 spot size for all analyses. A sea of nondirectionallow-energy electrons above the sample are trapped by a mag-netic field and are available to compensate for differentchargings on a sample surface. The take-off angle was 90°.Spectra were run at room temperature �295 K�, but thesample surfaces heated up to about 300 K in the x-ray beam.The SiO2 was run at 120 K as well �100 K backing platetemperature� to observe the change in Si 2p and O 1s line-widths with temperature. A 10 eV pass energy was used tocollect all core levels �Si 2p, S 2p, C 1s, Ti 2p, and O 1s�.The instrumental resolution at 10 eV pass energy is�0.4 eV.8–11 The very small C 1s signal on all spectra indi-cated minimal C contamination. The charge compensationsystem was tested for effectiveness over a large range ofsettings with only very small changes ��0.03 eV� in line-widths. These widths were highly reproducible for all min-erals over months of testing on different fractured samples.However, our experience with this instrument over severalyears has resulted in a slight improvement in linewidths—forexample, we reported overall Si 2p linewidths of 1.36 eV forforsteritic olivine �Mg2SiO4� in 2004 �Ref. 8� and 1.26 eV in2008.9 However, the Si 2p and O 1s linewidths for SiO2 at300 K are identical to those reported 3 years ago9 �Table I�.The linewidth can be slightly sensitive �less than 0.03 eVincrease� if the surface carbon contamination is large or if thecharge neutralizer plates become highly contaminated.
Core-level spectra were fitted with a 70% Gaussian–30%Lorentzian function as in previous papers.8–11 Slightly differ-ent functions �e.g., 50% Gaussian� sometimes gave slightlybetter fits with very small changes ��0.05 eV� in linewidth.Spin-orbit components were constrained to have the samelinewidths. The Si 2p spin-orbit splitting was fixed to atomicvalues �0.617 eV �Ref. 56��, and the p1/2 peak was con-strained to half the intensity of the p3/2 peak. Because of theconstraints on the p1/2 position, linewidth, and intensity, justthe p3/2 position and linewidth were iterated to minimize theroot mean square deviations for a given spectrum. All spectrawere corrected for the background using the Shirleyapproach.66 CASAXPS software67 was used to fit all thespectra.
Thomas et al.43 kindly provided the raw data for theiroptimized high resolution gas phase spectra of SiF4 andSiCl4, for which the instrumental resolution was 30 meV andthe inherent lifetime Si 2p widths were 79 and 54 meV re-spectively. The total observed individual linewidths of about87 and 57 meV, respectively, made it possible to resolvecompletely a rich vibrational structure involving nine vibra-tional peaks separated by the symmetric stretching frequencyin the ion state �about 10% larger than the measured groundstate vibrational frequency�. Our previous medium resolutionSi 2p spectrum �instrumental resolution of 0.15 eV� ofSi�OCH3�4 �a better analog to SiO2� showed a very similarvibrational envelope �ten peaks� to the above optimal spectrafor SiF4 and SiCl4.55 To simulate the lower resolution Si 2psolid-state spectra �e.g., at our resolution of 0.4 eV� we usedthe raw spectra of SiF4, SiCl4, and Si�OCH3�4 and broadenedthe individual peak linewidths to a maximum value of 0.8eV. The resulting broadened Si 2p spectra were then fit to aSi 2p doublet and the Si 2p3/2 linewidth obtained.
TOWARD A COMPREHENSIVE UNDERSTANDING OF… PHYSICAL REVIEW B 80, 075405 �2009�
075405-3
III. COMPUTATIONAL METHODS
A. Structural models
Car-Parrinello molecular dynamics �CPMD�68 within thedensity functional theory formalism was used to obtainchanges in Si-O bond lengths in solid-state SiO2 �� quartz�and gas phase Si�OCH3�4 resulting from core ionization of Si�removal of a Si 2p or Si 1s electron� and O �removal of anO 1s electron�. The Perdew-Burke-Enzerhof �PBE� exchangecorrelation functional69 was employed in the calculations.The core electrons were treated using a Troullier-Martinsnorm-conserving pseudopotential approach.70 Pseudopoten-tials for the ground state and partially screened O 1s andSi 1s and 2p cores were employed to investigate the effect ofpartial screening on the structure and dynamics of � quartz.The ground state Si and O pseudopotentials were taken fromthe CPMD pseudopotential library. Previous work on silicateminerals has shown that these pseudopotentials yield satis-factory results for silicate compounds.71,72 Pseudopotentialsfor the �partially screened� half-core-hole �HCH� calculationswere generated by removing half an electron from the rel-evant core levels. This half-core approximation, which origi-nates from Slater’s transition state theory,73 is normally usedto calculate core-level spectra such as the x-ray absorptionnear edge structure in SiO2 polymorphs,74 and in principlethe relaxation energy is correct to second order via perturba-tion theory. A calculation was also performed after removinga full-core electron for comparison. Valence electrons weremodeled using a plane wave basis with an energy cutoff of90 Ry. Energy sampling was done for the � point only. As atest of the pseudopotentials for the ground state, the geom-etry of the initial quartz structure was optimized using thepreconditioned conjugate gradient approach where conver-gence was achieved when the largest forces on the nucleidropped below 0.0001 hartree/bohr.
The initial structure for � quartz was generated fromknown crystal coordinates obtained from the American Min-eralogist crystal structure database.75 The unit cell had fourSiO2 units in a hexagonal cell with cell parameters a=4.914 Å and c=5.406 Å in the P3121 space group.76 Thiscell was then transformed to the orthorhombic space group,yielding cell parameters of a=4.914 Å, b=8.511 Å, and c=5.406 Å. A �2�1�2� supercell with 24 SiO2 units wasthen generated. Previous work on hydrous olivine71 andforsterite72 has shown that the k-point sampling and supercellsize on silicate compounds are expected to yield satisfactoryresults. Indeed, the bond lengths reported here for the groundstate structure are in very good agreement with the recentcrystallographic data.
As a test of the quartz calculations, a similar set of runswas done for an isolated tetramethoxysilane molecule,Si�OCH3�4. This molecule gives a reasonable approximationto the SiO4 unit in � quartz, and experimental data on thestructure and vibrational dynamics77 are available. TheSi�OCH3�4 input geometry was generated with Molden,78
and the geometry was optimized using the PBE functionaland a 6-311++g�� Pople basis set within the rational func-tion optimization approach in GAUSSIAN03.79 The conver-gence was reached when the largest force on the atoms wasless than 0.000 45 hartree /bohr. An analysis of the harmonicfrequencies indicated that a minimum had been reached. Acheck of the structure with the experimental geometry re-ported in Ref. 74 indicated the structure was a good startinggeometry to the CPMD calculations.
B. Molecular dynamics
The electronic ground states, and partially screened states,for SiO2 and Si�OCH3�4 were first quenched to the Born-Oppenheimer surface. Molecular dynamics simulations were
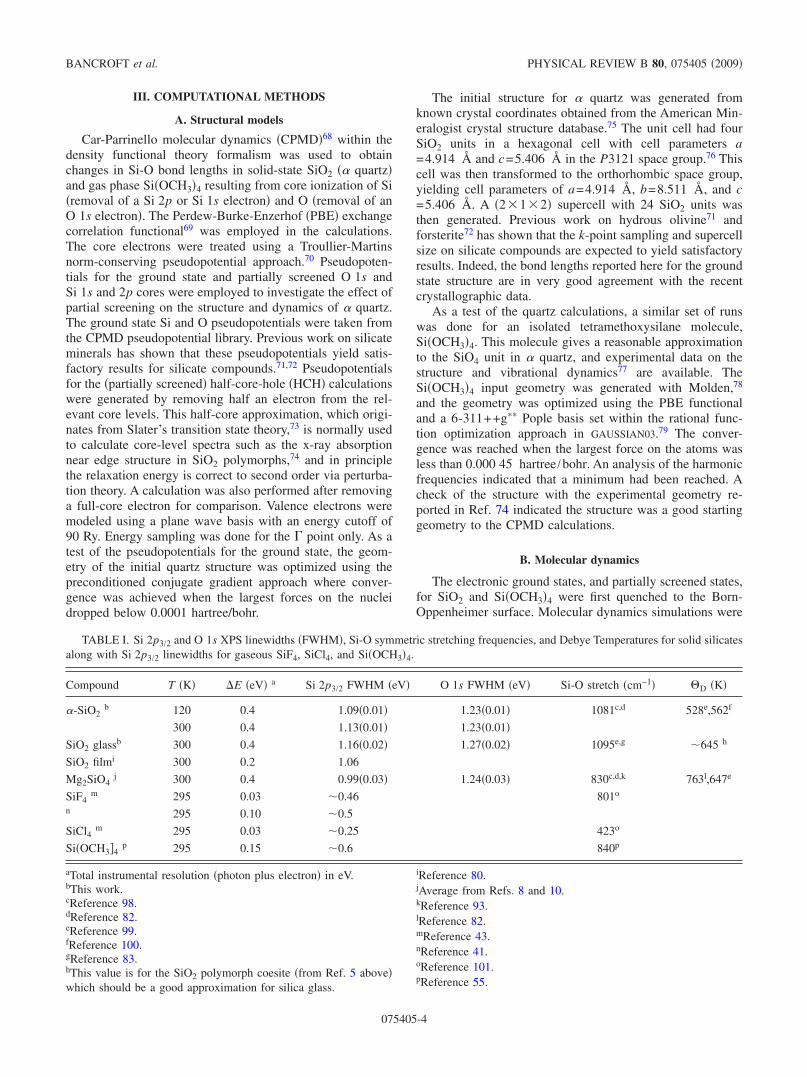
TABLE I. Si 2p3/2 and O 1s XPS linewidths �FWHM�, Si-O symmetric stretching frequencies, and Debye Temperatures for solid silicatesalong with Si 2p3/2 linewidths for gaseous SiF4, SiCl4, and Si�OCH3�4.
Compound T �K� �E �eV� a Si 2p3/2 FWHM �eV� O 1s FWHM �eV� Si-O stretch �cm−1� D �K�
�-SiO2b 120 0.4 1.09�0.01� 1.23�0.01� 1081c,d 528e,562f
300 0.4 1.13�0.01� 1.23�0.01�SiO2 glassb 300 0.4 1.16�0.02� 1.27�0.02� 1095e,g �645 h
SiO2 filmi 300 0.2 1.06
Mg2SiO4j 300 0.4 0.99�0.03� 1.24�0.03� 830c,d,k 763l,647e
SiF4m 295 0.03 �0.46 801o
n 295 0.10 �0.5
SiCl4m 295 0.03 �0.25 423o
Si�OCH3�4p 295 0.15 �0.6 840p
aTotal instrumental resolution �photon plus electron� in eV.bThis work.cReference 98.dReference 82.eReference 99.fReference 100.gReference 83.hThis value is for the SiO2 polymorph coesite �from Ref. 5 above�which should be a good approximation for silica glass.
iReference 80.jAverage from Refs. 8 and 10.kReference 93.lReference 82.mReference 43.nReference 41.oReference 101.pReference 55.
BANCROFT et al. PHYSICAL REVIEW B 80, 075405 �2009�
075405-4
performed at 80 and 300 K using the Car-Parrinello approachfor the electron dynamics and a classical approach for thenuclei. The molecular dynamics runs were performed in themicrocanonical �NVE� ensemble. Identical pseudopotentials,functional, and energy sampling were employed for molecu-lar dynamics runs as described above. The electron massemployed was 800 a.u. and a time step of 0.12 fs was used.Thermodynamic equilibrium was achieved in 1.8 ps and es-sential quantities �coordinates, velocities� were computedover an additional 1.2 ps. The temperature of the system forthe equilibration runs was maintained by employing a simplevelocity rescaling scheme. For the data collection runs, thetemperature scaling was removed, though the temperaturewas monitored to ensure that it did not deviate from theequilibrium value. Molecular dynamics runs were generatedfor the ground state, O 1s, Si 1s, and Si 2p partially screenedsystems.
IV. RESULTS
A. Si 2p and O 1s XPSs of quartz and vitreous SiO2
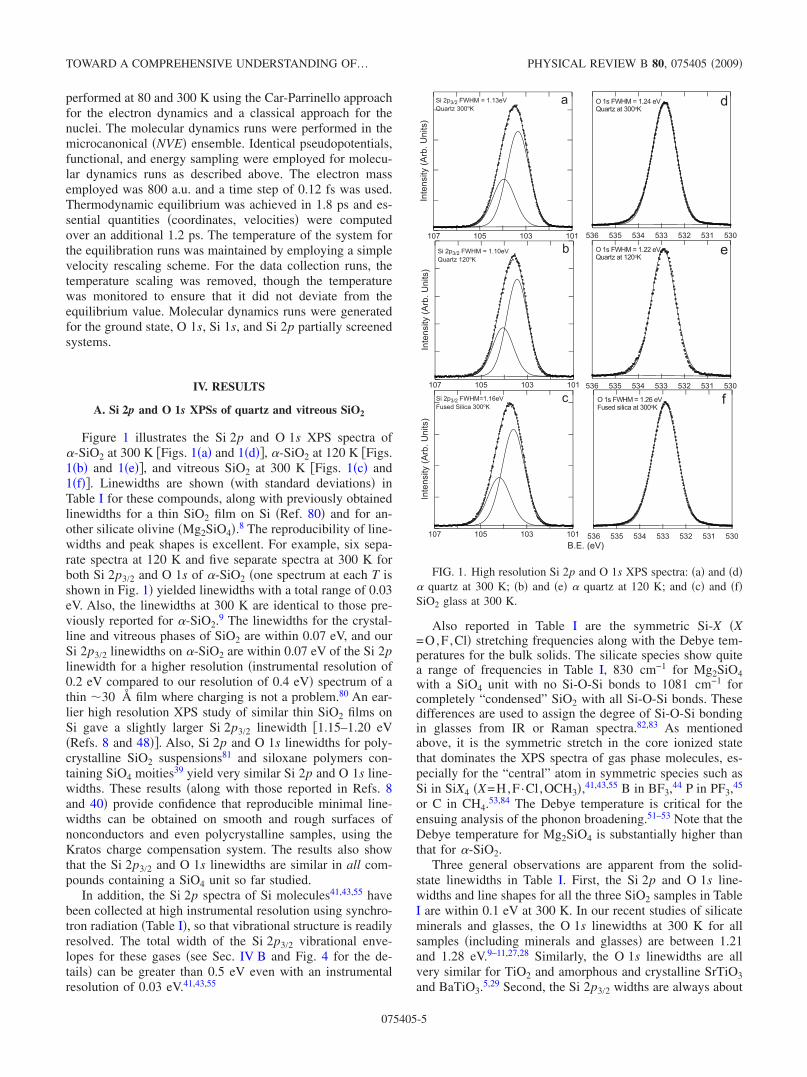
Figure 1 illustrates the Si 2p and O 1s XPS spectra of�-SiO2 at 300 K �Figs. 1�a� and 1�d��, �-SiO2 at 120 K �Figs.1�b� and 1�e��, and vitreous SiO2 at 300 K �Figs. 1�c� and1�f��. Linewidths are shown �with standard deviations� inTable I for these compounds, along with previously obtainedlinewidths for a thin SiO2 film on Si �Ref. 80� and for an-other silicate olivine �Mg2SiO4�.8 The reproducibility of line-widths and peak shapes is excellent. For example, six sepa-rate spectra at 120 K and five separate spectra at 300 K forboth Si 2p3/2 and O 1s of �-SiO2 �one spectrum at each T isshown in Fig. 1� yielded linewidths with a total range of 0.03eV. Also, the linewidths at 300 K are identical to those pre-viously reported for �-SiO2.9 The linewidths for the crystal-line and vitreous phases of SiO2 are within 0.07 eV, and ourSi 2p3/2 linewidths on �-SiO2 are within 0.07 eV of the Si 2plinewidth for a higher resolution �instrumental resolution of0.2 eV compared to our resolution of 0.4 eV� spectrum of athin �30 Å film where charging is not a problem.80 An ear-lier high resolution XPS study of similar thin SiO2 films onSi gave a slightly larger Si 2p3/2 linewidth �1.15–1.20 eV�Refs. 8 and 48��. Also, Si 2p and O 1s linewidths for poly-crystalline SiO2 suspensions81 and siloxane polymers con-taining SiO4 moities39 yield very similar Si 2p and O 1s line-widths. These results �along with those reported in Refs. 8and 40� provide confidence that reproducible minimal line-widths can be obtained on smooth and rough surfaces ofnonconductors and even polycrystalline samples, using theKratos charge compensation system. The results also showthat the Si 2p3/2 and O 1s linewidths are similar in all com-pounds containing a SiO4 unit so far studied.
In addition, the Si 2p spectra of Si molecules41,43,55 havebeen collected at high instrumental resolution using synchro-tron radiation �Table I�, so that vibrational structure is readilyresolved. The total width of the Si 2p3/2 vibrational enve-lopes for these gases �see Sec. IV B and Fig. 4 for the de-tails� can be greater than 0.5 eV even with an instrumentalresolution of 0.03 eV.41,43,55
Also reported in Table I are the symmetric Si-X �X=O,F,Cl� stretching frequencies along with the Debye tem-peratures for the bulk solids. The silicate species show quitea range of frequencies in Table I, 830 cm−1 for Mg2SiO4with a SiO4 unit with no Si-O-Si bonds to 1081 cm−1 forcompletely “condensed” SiO2 with all Si-O-Si bonds. Thesedifferences are used to assign the degree of Si-O-Si bondingin glasses from IR or Raman spectra.82,83 As mentionedabove, it is the symmetric stretch in the core ionized statethat dominates the XPS spectra of gas phase molecules, es-pecially for the “central” atom in symmetric species such asSi in SiX4 �X=H,F·Cl,OCH3�,41,43,55 B in BF3,44 P in PF3,45
or C in CH4.53,84 The Debye temperature is critical for theensuing analysis of the phonon broadening.51–53 Note that theDebye temperature for Mg2SiO4 is substantially higher thanthat for �-SiO2.
Three general observations are apparent from the solid-state linewidths in Table I. First, the Si 2p and O 1s line-widths and line shapes for all the three SiO2 samples in TableI are within 0.1 eV at 300 K. In our recent studies of silicateminerals and glasses, the O 1s linewidths at 300 K for allsamples �including minerals and glasses� are between 1.21and 1.28 eV.9–11,27,28 Similarly, the O 1s linewidths are allvery similar for TiO2 and amorphous and crystalline SrTiO3and BaTiO3.5,29 Second, the Si 2p3/2 widths are always about
��� ��� ��� ���
�������
�����
����
��� ����� ���� � ������ ���! ���"#
��� ��� ��� ���
�������
�����
����
��� ����� ���� � ������ ���! ���"#
��� ��� ��� ���
�������
�����
����
$�� ����� ��������%�� & ��'�$� ���"#
��% ��� ��( ��� ��� ��� ���
&)� ����� ���( �� ���! �� ���"#
��% ��� ��( ��� ��� ��� ���
)� ����� ���� �� ���! �� ���"#
��% ��� ��( ��� ��� ��� ���
*) � ����� ���% �� & �'�$� �� ���"#
+�,� ��
FIG. 1. High resolution Si 2p and O 1s XPS spectra: �a� and �d�� quartz at 300 K; �b� and �e� � quartz at 120 K; and �c� and �f�SiO2 glass at 300 K.
TOWARD A COMPREHENSIVE UNDERSTANDING OF… PHYSICAL REVIEW B 80, 075405 �2009�
075405-5
0.2 eV narrower than the O 1s linewidths. Third, there is asmall increase in the Si 2p linewidth of SiO2 with increase inT from 120 to 300 K, but the O 1s linewidth does not changenoticeably over this temperature range.
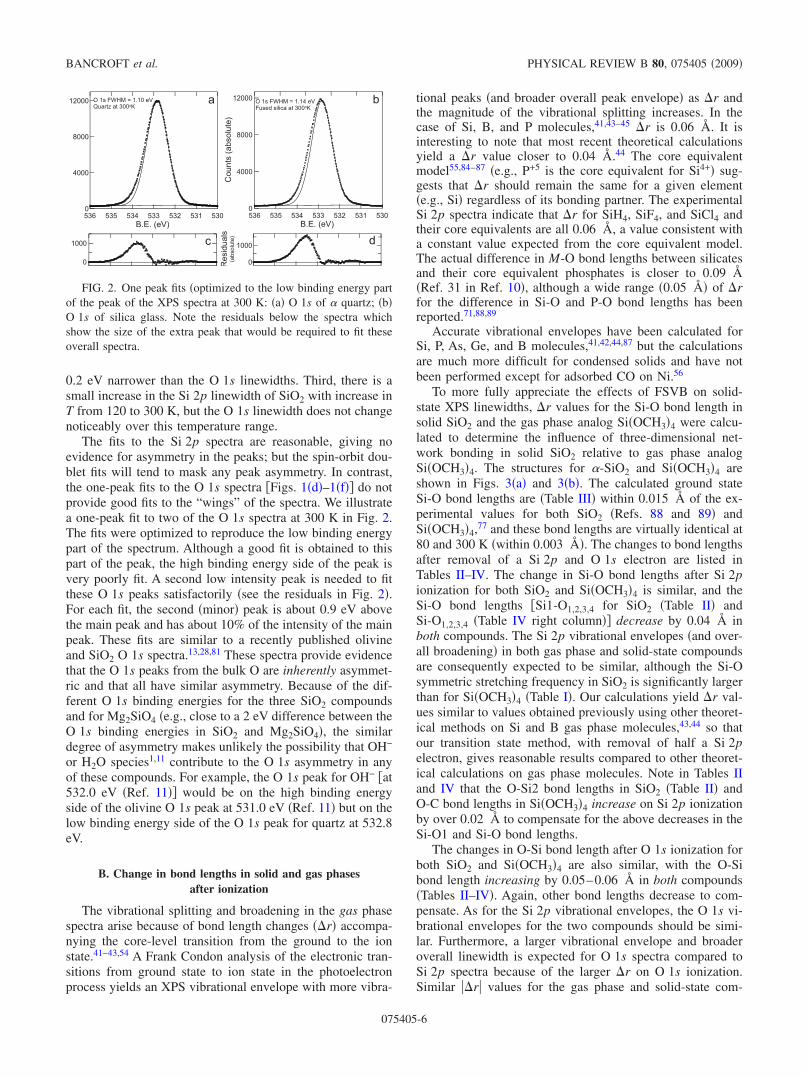
The fits to the Si 2p spectra are reasonable, giving noevidence for asymmetry in the peaks; but the spin-orbit dou-blet fits will tend to mask any peak asymmetry. In contrast,the one-peak fits to the O 1s spectra �Figs. 1�d�–1�f�� do notprovide good fits to the “wings” of the spectra. We illustratea one-peak fit to two of the O 1s spectra at 300 K in Fig. 2.The fits were optimized to reproduce the low binding energypart of the spectrum. Although a good fit is obtained to thispart of the peak, the high binding energy side of the peak isvery poorly fit. A second low intensity peak is needed to fitthese O 1s peaks satisfactorily �see the residuals in Fig. 2�.For each fit, the second �minor� peak is about 0.9 eV abovethe main peak and has about 10% of the intensity of the mainpeak. These fits are similar to a recently published olivineand SiO2 O 1s spectra.13,28,81 These spectra provide evidencethat the O 1s peaks from the bulk O are inherently asymmet-ric and that all have similar asymmetry. Because of the dif-ferent O 1s binding energies for the three SiO2 compoundsand for Mg2SiO4 �e.g., close to a 2 eV difference between theO 1s binding energies in SiO2 and Mg2SiO4�, the similardegree of asymmetry makes unlikely the possibility that OH−
or H2O species1,11 contribute to the O 1s asymmetry in anyof these compounds. For example, the O 1s peak for OH− �at532.0 eV �Ref. 11�� would be on the high binding energyside of the olivine O 1s peak at 531.0 eV �Ref. 11� but on thelow binding energy side of the O 1s peak for quartz at 532.8eV.
B. Change in bond lengths in solid and gas phasesafter ionization
The vibrational splitting and broadening in the gas phasespectra arise because of bond length changes ��r� accompa-nying the core-level transition from the ground to the ionstate.41–43,54 A Frank Condon analysis of the electronic tran-sitions from ground state to ion state in the photoelectronprocess yields an XPS vibrational envelope with more vibra-
tional peaks �and broader overall peak envelope� as �r andthe magnitude of the vibrational splitting increases. In thecase of Si, B, and P molecules,41,43–45 �r is 0.06 Å. It isinteresting to note that most recent theoretical calculationsyield a �r value closer to 0.04 Å.44 The core equivalentmodel55,84–87 �e.g., P+5 is the core equivalent for Si4+� sug-gests that �r should remain the same for a given element�e.g., Si� regardless of its bonding partner. The experimentalSi 2p spectra indicate that �r for SiH4, SiF4, and SiCl4 andtheir core equivalents are all 0.06 Å, a value consistent witha constant value expected from the core equivalent model.The actual difference in M-O bond lengths between silicatesand their core equivalent phosphates is closer to 0.09 Å�Ref. 31 in Ref. 10�, although a wide range �0.05 Å� of �rfor the difference in Si-O and P-O bond lengths has beenreported.71,88,89
Accurate vibrational envelopes have been calculated forSi, P, As, Ge, and B molecules,41,42,44,87 but the calculationsare much more difficult for condensed solids and have notbeen performed except for adsorbed CO on Ni.56
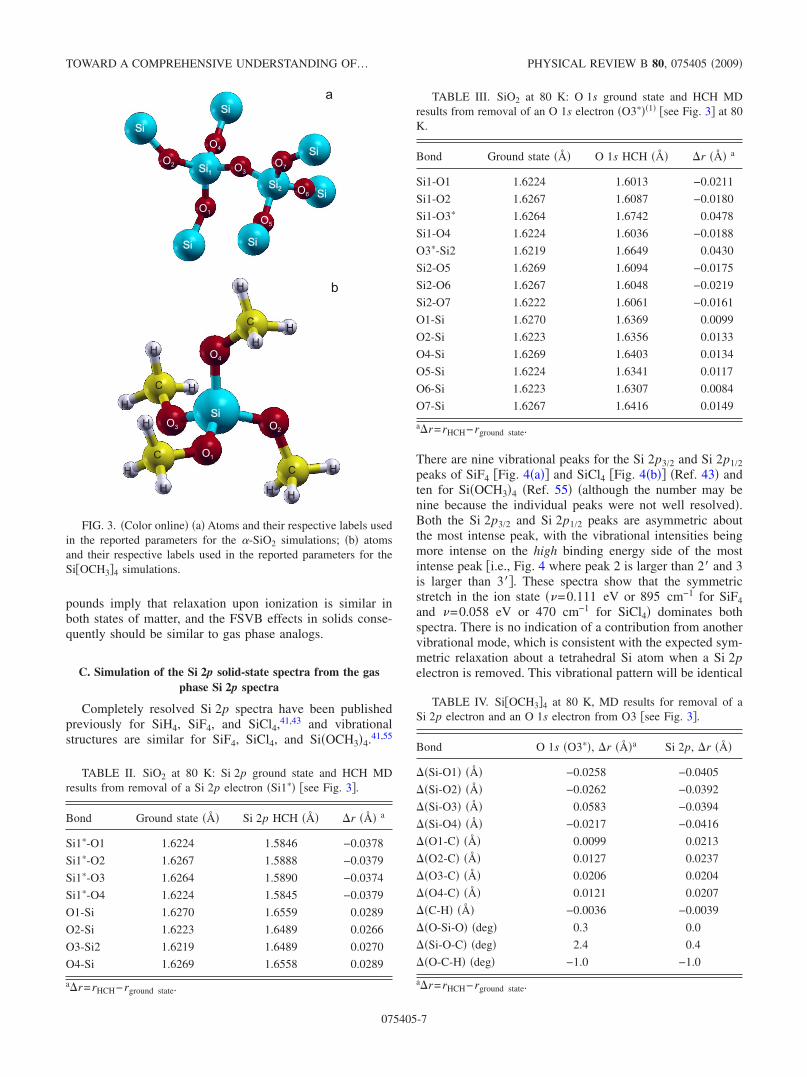
To more fully appreciate the effects of FSVB on solid-state XPS linewidths, �r values for the Si-O bond length insolid SiO2 and the gas phase analog Si�OCH3�4 were calcu-lated to determine the influence of three-dimensional net-work bonding in solid SiO2 relative to gas phase analogSi�OCH3�4. The structures for �-SiO2 and Si�OCH3�4 areshown in Figs. 3�a� and 3�b�. The calculated ground stateSi-O bond lengths are �Table III� within 0.015 Å of the ex-perimental values for both SiO2 �Refs. 88 and 89� andSi�OCH3�4,77 and these bond lengths are virtually identical at80 and 300 K �within 0.003 Å�. The changes to bond lengthsafter removal of a Si 2p and O 1s electron are listed inTables II–IV. The change in Si-O bond lengths after Si 2pionization for both SiO2 and Si�OCH3�4 is similar, and theSi-O bond lengths �Si1-O1,2,3,4 for SiO2 �Table II� andSi-O1,2,3,4 �Table IV right column�� decrease by 0.04 Å inboth compounds. The Si 2p vibrational envelopes �and over-all broadening� in both gas phase and solid-state compoundsare consequently expected to be similar, although the Si-Osymmetric stretching frequency in SiO2 is significantly largerthan for Si�OCH3�4 �Table I�. Our calculations yield �r val-ues similar to values obtained previously using other theoret-ical methods on Si and B gas phase molecules,43,44 so thatour transition state method, with removal of half a Si 2pelectron, gives reasonable results compared to other theoret-ical calculations on gas phase molecules. Note in Tables IIand IV that the O-Si2 bond lengths in SiO2 �Table II� andO-C bond lengths in Si�OCH3�4 increase on Si 2p ionizationby over 0.02 Å to compensate for the above decreases in theSi-O1 and Si-O bond lengths.
The changes in O-Si bond length after O 1s ionization forboth SiO2 and Si�OCH3�4 are also similar, with the O-Sibond length increasing by 0.05–0.06 Å in both compounds�Tables II–IV�. Again, other bond lengths decrease to com-pensate. As for the Si 2p vibrational envelopes, the O 1s vi-brational envelopes for the two compounds should be simi-lar. Furthermore, a larger vibrational envelope and broaderoverall linewidth is expected for O 1s spectra compared toSi 2p spectra because of the larger �r on O 1s ionization.Similar ��r� values for the gas phase and solid-state com-
��� ��� ��� ��� ��� ��� ���� �� �
�
����
����
����� �� �� ���� � ��� � ������ �� �����
�
����
��� ��� ��� ��� ��� ��� ���� �� �
�
����
����
�����
��� ����!��"����
!� �� ���� � ��� � ����# �$"$%� �� �����
�
����
&��$#��"�
��!��"����% #
FIG. 2. One peak fits �optimized to the low binding energy partof the peak of the XPS spectra at 300 K: �a� O 1s of � quartz; �b�O 1s of silica glass. Note the residuals below the spectra whichshow the size of the extra peak that would be required to fit theseoverall spectra.
BANCROFT et al. PHYSICAL REVIEW B 80, 075405 �2009�
075405-6
pounds imply that relaxation upon ionization is similar inboth states of matter, and the FSVB effects in solids conse-quently should be similar to gas phase analogs.
C. Simulation of the Si 2p solid-state spectra from the gasphase Si 2p spectra
Completely resolved Si 2p spectra have been publishedpreviously for SiH4, SiF4, and SiCl4,41,43 and vibrationalstructures are similar for SiF4, SiCl4, and Si�OCH3�4.41,55
There are nine vibrational peaks for the Si 2p3/2 and Si 2p1/2peaks of SiF4 �Fig. 4�a�� and SiCl4 �Fig. 4�b�� �Ref. 43� andten for Si�OCH3�4 �Ref. 55� �although the number may benine because the individual peaks were not well resolved�.Both the Si 2p3/2 and Si 2p1/2 peaks are asymmetric aboutthe most intense peak, with the vibrational intensities beingmore intense on the high binding energy side of the mostintense peak �i.e., Fig. 4 where peak 2 is larger than 2� and 3is larger than 3��. These spectra show that the symmetricstretch in the ion state �=0.111 eV or 895 cm−1 for SiF4and =0.058 eV or 470 cm−1 for SiCl4� dominates bothspectra. There is no indication of a contribution from anothervibrational mode, which is consistent with the expected sym-metric relaxation about a tetrahedral Si atom when a Si 2pelectron is removed. This vibrational pattern will be identical
TABLE IV. Si�OCH3�4 at 80 K, MD results for removal of aSi 2p electron and an O 1s electron from O3 �see Fig. 3�.
Bond O 1s �O3��, �r ��a Si 2p, �r ��
��Si-O1� �Å� −0.0258 −0.0405
��Si-O2� �Å� −0.0262 −0.0392
��Si-O3� �Å� 0.0583 −0.0394
��Si-O4� �Å� −0.0217 −0.0416
��O1-C� �� 0.0099 0.0213
��O2-C� �� 0.0127 0.0237
��O3-C� �� 0.0206 0.0204
��O4-C� �� 0.0121 0.0207
��C-H� �Å� −0.0036 −0.0039
��O-Si-O� �deg� 0.3 0.0
��Si-O-C� �deg� 2.4 0.4
��O-C-H� �deg� −1.0 −1.0
a�r=rHCH−rground state.
�
��
�
����
�
��
�
����
������
���� ����
����
����
������
����
����
�
��
�
��
��
�� �
�
��
�
��
��
��
��
�
�
FIG. 3. �Color online� �a� Atoms and their respective labels usedin the reported parameters for the �-SiO2 simulations; �b� atomsand their respective labels used in the reported parameters for theSi�OCH3�4 simulations.
TABLE II. SiO2 at 80 K: Si 2p ground state and HCH MDresults from removal of a Si 2p electron �Si1�� �see Fig. 3�.
Bond Ground state �� Si 2p HCH �� �r �� a
Si1�-O1 1.6224 1.5846 −0.0378
Si1�-O2 1.6267 1.5888 −0.0379
Si1�-O3 1.6264 1.5890 −0.0374
Si1�-O4 1.6224 1.5845 −0.0379
O1-Si 1.6270 1.6559 0.0289
O2-Si 1.6223 1.6489 0.0266
O3-Si2 1.6219 1.6489 0.0270
O4-Si 1.6269 1.6558 0.0289
a�r=rHCH−rground state.
TABLE III. SiO2 at 80 K: O 1s ground state and HCH MDresults from removal of an O 1s electron �O3���1� �see Fig. 3� at 80K.
Bond Ground state �� O 1s HCH �� �r �� a
Si1-O1 1.6224 1.6013 −0.0211
Si1-O2 1.6267 1.6087 −0.0180
Si1-O3� 1.6264 1.6742 0.0478
Si1-O4 1.6224 1.6036 −0.0188
O3�-Si2 1.6219 1.6649 0.0430
Si2-O5 1.6269 1.6094 −0.0175
Si2-O6 1.6267 1.6048 −0.0219
Si2-O7 1.6222 1.6061 −0.0161
O1-Si 1.6270 1.6369 0.0099
O2-Si 1.6223 1.6356 0.0133
O4-Si 1.6269 1.6403 0.0134
O5-Si 1.6224 1.6341 0.0117
O6-Si 1.6223 1.6307 0.0084
O7-Si 1.6267 1.6416 0.0149
a�r=rHCH−rground state.
TOWARD A COMPREHENSIVE UNDERSTANDING OF… PHYSICAL REVIEW B 80, 075405 �2009�
075405-7

at 80 and 300 K, as indicated by the virtually identical cal-culated changes in bond length at the two temperatures. Also,the vibrational splittings in the ion state are consistentlyabout 10% larger than in the ground state �e.g., 895 cm−1 inthe ion state versus 801 cm−1 in the ground state of SiF4�Table I��. The SiF4 and Si�OCH3�4 spectra55 are similar, asexpected by the similar Si-X �X=F,O� bond lengths and vi-brational frequencies �Table I�. We use these gas phase Si 2pspectra to simulate the Si 2p spectrum of solid-state SiO2.
The spectra for SiF4 �=895 cm−1� and Si�OCH3�4 �=992 cm−1� have been simulated using our experimental�lower� resolution of 0.4 eV and are shown in Figs. 4�c� and4�d�, respectively, accompanied by a fit to a Si 2p doublet.Changing the individual peak shapes from 85% Lorentzian�in the original spectrum� to 50% Lorentzian �because of thelarge expected Gaussian component from the 0.4 eVelectron/photon contributions� at the lower resolution hadlittle effect on the total Si 2p3/2 linewidths. For example, the
110.5111.0111.5112.0112.5113.0
110.5111.0111.5112.0112.5113.0 109.0109.5110.0110.5111.0111.5
a bVib. Splitting = 0.058eVExptl. Width = 0.030eVFitted Width = 0.061eV
Vib. Splitting = 0.111eVExptl. Width = 0.030eVFitted Width = 0.087eV
Vib. Splitting = 0.111eVExptl. Width = 0.400eVFitted Width = 0.680eV
c
106.5107.0107.5108.0108.5109.0109.5110.0
dVib. Splitting = 0.123eVExptl. Width = 0.400eVFitted Width = 0.800eV
Ionization Energy (eV)
Ionization Energy (eV)Ionization Energy (eV)
Ionization Energy (eV)
Inte
nsity
Inte
nsity
Inte
nsity
Inte
nsity
FIG. 4. The experimental high resolution Si 2p spectra �instrumental resolution of 30 meV� of �a� SiF4 and �b� SiCl4 �Ref. 43� fit to ninevibrational peaks for both the Si 2p spin-orbit components. Simulated spectra of SiF4 and Si�OCH3�4 at our instrumental resolution of 0.4eV are shown in �c� and �d�, respectively.
BANCROFT et al. PHYSICAL REVIEW B 80, 075405 �2009�
075405-8
linewidths in Fig. 4�c� decreased by less than 0.02 eV fromthe 85% case to the 50% Lorentzian case. The asymmetry inthe high resolution spectrum �Fig. 4�a�� is not readily ob-served in the two doublet fits in Figs. 4�c� and 4�d� dueprimarily to the Si 2p1/2 peak accommodating much of theasymmetry.
As expected, the vibrational splittings are no longer re-solved in Figs. 4�c� and 4�d�, and even the spin-orbit splittingis indistinct. These two spectra are qualitatively similar to thesolid-state Si 2p spectra in Figs. 1�a�–1�c�. The linewidths inthe simulated spectra of 0.68 eV �Fig. 4�c�� and 0.80 eV �Fig.4�d�� with individual peak widths of 0.4 eV �instrumentalresolution� already approach the observed Si 2p3/2 total line-widths observed for the solid-state SiO2 spectra �1.1 eV�Table I��.
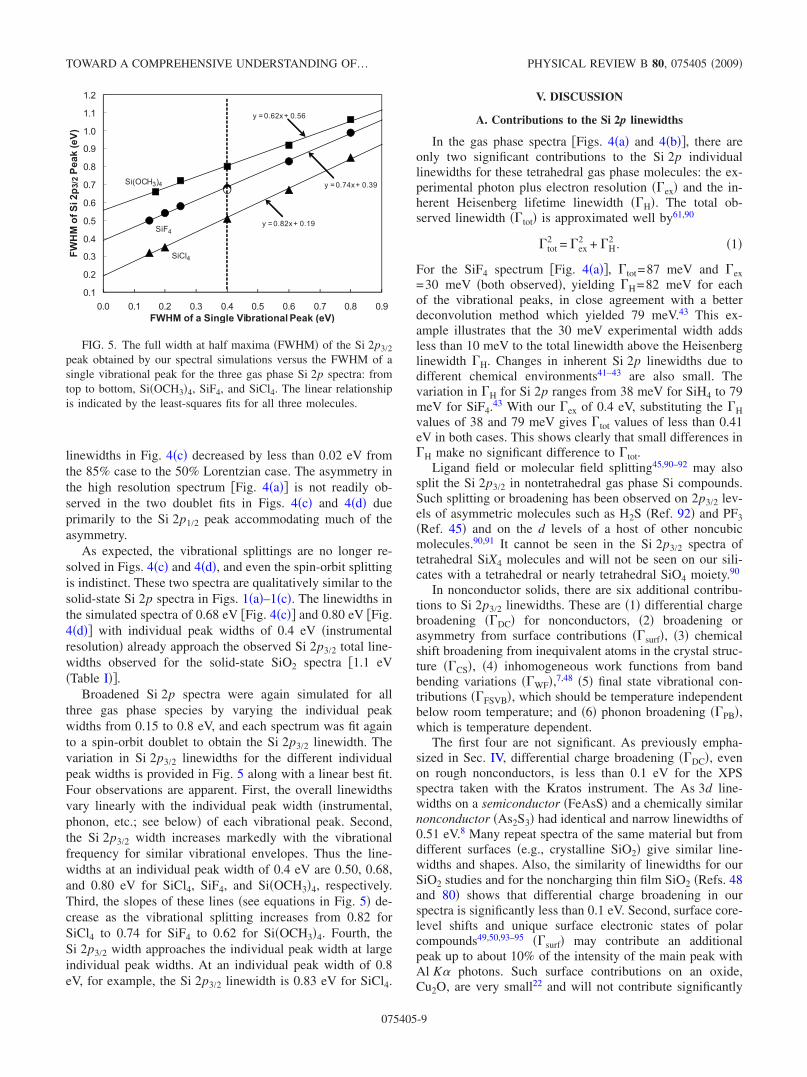
Broadened Si 2p spectra were again simulated for allthree gas phase species by varying the individual peakwidths from 0.15 to 0.8 eV, and each spectrum was fit againto a spin-orbit doublet to obtain the Si 2p3/2 linewidth. Thevariation in Si 2p3/2 linewidths for the different individualpeak widths is provided in Fig. 5 along with a linear best fit.Four observations are apparent. First, the overall linewidthsvary linearly with the individual peak width �instrumental,phonon, etc.; see below� of each vibrational peak. Second,the Si 2p3/2 width increases markedly with the vibrationalfrequency for similar vibrational envelopes. Thus the line-widths at an individual peak width of 0.4 eV are 0.50, 0.68,and 0.80 eV for SiCl4, SiF4, and Si�OCH3�4, respectively.Third, the slopes of these lines �see equations in Fig. 5� de-crease as the vibrational splitting increases from 0.82 forSiCl4 to 0.74 for SiF4 to 0.62 for Si�OCH3�4. Fourth, theSi 2p3/2 width approaches the individual peak width at largeindividual peak widths. At an individual peak width of 0.8eV, for example, the Si 2p3/2 linewidth is 0.83 eV for SiCl4.
V. DISCUSSION
A. Contributions to the Si 2p linewidths
In the gas phase spectra �Figs. 4�a� and 4�b��, there areonly two significant contributions to the Si 2p individuallinewidths for these tetrahedral gas phase molecules: the ex-perimental photon plus electron resolution ��ex� and the in-herent Heisenberg lifetime linewidth ��H�. The total ob-served linewidth ��tot� is approximated well by61,90
�tot2 = �ex
2 + �H2 . �1�
For the SiF4 spectrum �Fig. 4�a��, �tot=87 meV and �ex=30 meV �both observed�, yielding �H=82 meV for eachof the vibrational peaks, in close agreement with a betterdeconvolution method which yielded 79 meV.43 This ex-ample illustrates that the 30 meV experimental width addsless than 10 meV to the total linewidth above the Heisenberglinewidth �H. Changes in inherent Si 2p linewidths due todifferent chemical environments41–43 are also small. Thevariation in �H for Si 2p ranges from 38 meV for SiH4 to 79meV for SiF4.43 With our �ex of 0.4 eV, substituting the �Hvalues of 38 and 79 meV gives �tot values of less than 0.41eV in both cases. This shows clearly that small differences in�H make no significant difference to �tot.
Ligand field or molecular field splitting45,90–92 may alsosplit the Si 2p3/2 in nontetrahedral gas phase Si compounds.Such splitting or broadening has been observed on 2p3/2 lev-els of asymmetric molecules such as H2S �Ref. 92� and PF3�Ref. 45� and on the d levels of a host of other noncubicmolecules.90,91 It cannot be seen in the Si 2p3/2 spectra oftetrahedral SiX4 molecules and will not be seen on our sili-cates with a tetrahedral or nearly tetrahedral SiO4 moiety.90
In nonconductor solids, there are six additional contribu-tions to Si 2p3/2 linewidths. These are �1� differential chargebroadening ��DC� for nonconductors, �2� broadening orasymmetry from surface contributions ��surf�, �3� chemicalshift broadening from inequivalent atoms in the crystal struc-ture ��CS�, �4� inhomogeneous work functions from bandbending variations ��WF�,7,48 �5� final state vibrational con-tributions ��FSVB�, which should be temperature independentbelow room temperature; and �6� phonon broadening ��PB�,which is temperature dependent.
The first four are not significant. As previously empha-sized in Sec. IV, differential charge broadening ��DC�, evenon rough nonconductors, is less than 0.1 eV for the XPSspectra taken with the Kratos instrument. The As 3d line-widths on a semiconductor �FeAsS� and a chemically similarnonconductor �As2S3� had identical and narrow linewidths of0.51 eV.8 Many repeat spectra of the same material but fromdifferent surfaces �e.g., crystalline SiO2� give similar line-widths and shapes. Also, the similarity of linewidths for ourSiO2 studies and for the noncharging thin film SiO2 �Refs. 48and 80� shows that differential charge broadening in ourspectra is significantly less than 0.1 eV. Second, surface core-level shifts and unique surface electronic states of polarcompounds49,50,93–95 ��surf� may contribute an additionalpeak up to about 10% of the intensity of the main peak withAl K� photons. Such surface contributions on an oxide,Cu2O, are very small22 and will not contribute significantly
y = 0.82x+ 0.19
y =0.74x+ 0.39
y = 0.62x+ 0.56
0.1
0.2
0.3
0.4
0.5
0.6
0.7
0.8
0.9
1.0
1.1
1.2
0.0 0.1 0.2 0.3 0.4 0.5 0.6 0.7 0.8 0.9
FWHM of a Single Vibrational Peak (eV)
FW
HM
of
Si2
p3/2
Pe
ak
(eV
)
SiF4
Si(OCH3)4
SiCl4
FIG. 5. The full width at half maxima �FWHM� of the Si 2p3/2peak obtained by our spectral simulations versus the FWHM of asingle vibrational peak for the three gas phase Si 2p spectra: fromtop to bottom, Si�OCH3�4, SiF4, and SiCl4. The linear relationshipis indicated by the least-squares fits for all three molecules.
TOWARD A COMPREHENSIVE UNDERSTANDING OF… PHYSICAL REVIEW B 80, 075405 �2009�
075405-9
��0.1 eV� to a one-peak width. A third contribution frominequivalent structural sites in crystals ��CS� does not applyto Si atoms in this study. In all samples studied here, the Siand other “central” atoms are in a unique position,67,87,88,96
even though M-O bond lengths are not always equivalent.There are, for example, two pairs of Si-O bond lengths of1.607 and 1.611 Š�Refs. 89 and 96� in �-SiO2 �about0.015 Šsmaller than our calculations �Table II��. ForMg2SiO4, the Si-O bond lengths vary more than in quartzand lead to three chemically different oxygen atoms in eachstructure,88,97 but the central Si atoms are nevertheless re-stricted to one structural site. Thus, there can be no Si 2pchemical shift broadening for Si atoms in this study. Thefourth contribution, inhomogeneous work functions, hasbeen shown to shift peaks in thin film spectra up to �0.1 eV�Ref. 48� and give measured linewidth differences of up to0.09 eV on the Ti 2p level in semiconductor thin film TiO2samples.7 However, the similarity of our Si 2p3/2 linewidthsfor �-SiO2 and with nonconducting thin film SiO2samples48,80 shows that this effect should give linewidthbroadening of less than 0.1 eV.
There remain only two sources of the large linewidthbroadening in the materials here studied �in addition to theexperimental broadening of �0.4 eV for the Kratos instru-ment�. These are final state vibrational broadening ��FSVB�and phonon broadening contributions ��PB�—the contribu-tions that have been important for the adsorbed moleculesand cluster species.63,64
The previously discussed theoretical calculations indicatethat Si 2p vibrational profiles should be similar in solid sili-cates and in gaseous Si�OCH3�4, so that their Si 2p vibra-tional envelopes should also be similar. Figure 5 shows thatthe ion state vibrational splittings greatly increase theSi 2p3/2 “total” linewidth of Si�OCH3�4 to approximately 0.8eV at our experimental resolution of 0.4 eV, accounting formuch of the observed total Si 2p3/2 linewidth of 1.1 eV for�-SiO2. Because the ground state vibrational frequencies areeven larger for SiO2 than for Si�OCH3�4 or for Mg2SiO4, this0.8 eV should represent a minimum Si 2p3/2 linewidth forSiO2 at our experimental resolution of 0.4 eV. These argu-ments and observations demonstrate that �FSVB makes a sig-nificant contribution to the Si 2p linewidths of about 0.8 eVin all Si 2p solid-state spectra.
There remains the problem to determine the individual�vibrational� peak widths for the spectra here collected.These widths have to be appreciably greater than 0.4 eVbecause of the phonon broadening contribution �PH.
Figure 5 �and y=0.62x+0.56� indicates that individualpeak widths ��IP, x axis� are less than 0.92 and 0.84 eV fortotal observed Si 2p3/2 linewidths �y axis� of 1.13 eV �T=300 K� and 1.09 eV �T=120 K�, respectively, because thevibrational splitting for SiO2 is larger than that forSi�OCH3�4. To calculate the approximate phonon contribu-tion to these �0.8–0.9 eV individual linewidths, we removethe experimental width of 0.4 eV from �IP using the qua-dratic formula in Eq. �1�,
�IP2 = �ex
2 + �PB2 . �2�
Substituting the above widths �ex and �IP, �PB’s of 0.83 and0.74 eV are obtained at 300 and 120 K, respectively. We can
then estimate the phonon linewidth �PB�0� �T=0 K� usingthe approximate formula,49,52
�PB2 �T1� − �PB
2 �T2� = �8/3��PB2 �0��T1 − T2�/D. �3�
Taking the D=528 K �Table I� for �-SiO2 and substitutingthe above values into Eq. �3� yield
�PB2 �0� = 1.10��PB
2 �T1� − �PB2 �T2�� . �4�
Substituting the two linewidths, �PB, calculated at T1 and T2�with the above two �PB values of 0.83 and 0.74 eV� yields�PB�0�=0.39 eV. This is an approximate value �probablygood to no better than 30–40 %� and is probably an upperlimit because the expected �FSVB for SiO2 should be largerthan for Si�OCH3�4 as mentioned above. However, thesevery approximate calculations indicate that the final state vi-brational contributions at 300 and 120 K are similar to thephonon contributions, and the estimated �FSVB of 0.58 eV�intercept in Fig. 5 for Si�OCH3�4� is larger than the esti-mated phonon width �PH �0� of 0.39 eV.
The Si 2p3/2 linewidth for Mg2SiO4 �0.99 eV� is substan-tially narrower than for SiO2 �1.09 eV�, as expected by thelower Si-O vibrational frequency in Mg2SiO4 compared toSiO2. Using the Si�OCH3�4 line �Fig. 5�, one obtains �IP=0.69 eV and a �PB of 0.56 eV at 300 K. Because the Si-Ovibrational splittings are similar for Si�OCH3�4 andMg2SiO4, �PB is probably closer to the real value than the�0.7–0.8 eV values for SiO2 calculated above. The tem-perature dependence of this linewidth would now have to beobtained to yield �PB�0�, but it is likely to be greater thanthat for SiO2 because D for Mg2SiO4 is substantially largerthan for SiO2 �Table I�. Additional low temperature studiesof the linewidths for Mg2SiO4 are obviously required in thefuture.
B. Contributions to the O 1s linewidths
As previously emphasized, O 1s linewidths are apprecia-bly larger than Si 2p linewidths for �-SiO2 and other sili-cates. They are also asymmetric �Figs. 2 and 3�. The inherentlinewidth ��H� for O 1s �0.16 eV �Ref. 56�� is larger thanSi 2p inherent linewidths ��0.1 eV�, but �H is still toosmall to make an appreciable contribution to the increasedO 1s width. All O atoms are equivalent in �-SiO2,88,97 sothere is no contribution from �CS. The O 1s linewidths insilicates and in siloxane polymers39 are consistently largerthan the corresponding Si 2p3/2 widths indicating that theO 1s widths are also controlled by a large vibrational enve-lope. The O 1s vibrational envelope probably contains morethan the nine peaks �as found in the Si 2p envelope�. Thereare no high resolution gas phase O 1s data on a model com-pound such as Si�OCH3�4, so that it is not possible to esti-mate the number of peaks contributing to the O 1s envelope,the vibrational modes and splittings, or the relative intensi-ties. For example, it is expected that the Si-O-Si bond angleof 144° in quartz96 will yield vibrational splitting from bothsymmetric Si-O modes and from asymmetric modes �as seenon the O 1s level in H2O �Ref. 56��.
The theoretical calculations strongly support the conclu-sion that the O 1s line in quartz should be broader than the
BANCROFT et al. PHYSICAL REVIEW B 80, 075405 �2009�
075405-10
Si 2p3/2 line from the FSVB mechanism. There are two dif-ferences between the Si�-O and O�-Si bond length changeson ionization. First, the O�-Si bond length increases on ion-ization, whereas the Si�-O bond length decreases on ioniza-tion. Second, the O�-Si bond length changes are larger thanthe Si�-O bond lengths for both gas and solid compounds,indicating that there should be more vibrational peaks forO 1s spectra compared to the Si 2p spectra. Also, an increasein bond length for the O 1s ionization should lead to a largervibrational envelope than a decrease in bond length �for thesame �r magnitude� because the slope of the low R part ofthe ion state potential curve is greater than the slope of thehigh R part of the potential curve.86
The lack of a measurable temperature dependence on theO 1s linewidths in SiO2 is perhaps surprising. However, Fig.5 shows that the slope of the FWHM line decreases with anincrease in vibrational frequency �e.g., from SiCl4 toSi�OCH3�4�, and the slope should also decrease with an in-crease in the number of vibrational peaks from the Si 2pspectra to the O 1s spectra. Unfortunately, without measur-able temperature dependence or a better knowledge of theO 1s vibrational structure, it is not possible to estimate thephonon broadening. There is no reason to suggest, however,that �PH�0� is any larger for O 1s than for the Si 2p3/2 line�0.36 eV�. For example, for the potassium halides,51 the an-ion and cation core levels have similar �PH�0� values.
VI. CONCLUSIONS
Our high resolution �0.4 eV instrumental resolution� Si 2pand O 1s XPS spectra of the nonconductor quartz ��-SiO2�and vitreous SiO2 still yield relatively broad linewidths �1 eVor greater� compared to linewidths of most semiconductors.The Si 2p linewidths are similar to that obtained on a higherresolution spectrum of a thin conducting SiO2 film, showingthat differences in inherent linewidths, chemical shift broad-ening, differential charging, and nonuniform work functionsare not a significant cause of the large linewidths. As sug-gested by the core equivalent model, high quality theoreticalcalculations on the ground state and Si 2p and O 1s ionstates of quartz ��-SiO2� and the gas phase analogSi�OCH3�4 show that the bond length changes on ionization��r� are similar in both compounds. This suggests stronglythat the Si 2p and O 1s vibrational splittings in both solidstate and gas phase should be very similar. The high reso-lution gas phase Si 2p spectra of Si molecules, such as theanalog Si�OCH3�4, show extensive vibrational structure andsome asymmetry. Combined with the theoretical calcula-tions, a large vibrational envelope should contribute to theSi 2p and O 1s linewidths of SiO2. This conclusion is sup-ported by the asymmetric linewidths of the observed O 1speaks. Phonon broadening �PB� is shown to produce signifi-cant Si 2p line broadening, which leads to the temperaturedependence of the Si 2p linewidths.
This study requires further research to confirm some ofour assumptions and results. First, high resolution gas phaseO 1s and metal 2p �and other central atom levels� spectra ofoxygen-containing analogs such as the metal alkoxides�M�OR3�4 �M =Si, Ti, etc.� need to be collected to confirm
that the O 1s vibrational envelopes yield the predicted broad�and asymmetric� O 1s lines for these compounds. Vibra-tional structure will not be readily resolved in the O 1s spec-tra because the inherent O 1s linewidth of 0.16 eV is largerthan the expected vibrational splittings. However, such spec-tra will confirm the overall large linewidth and asymmetry ofthe O 1s profile and probably the nature �the importance ofsymmetric and asymmetric O-Si contributions� of the vibra-tional splitting. Second, greater effort is required to collecthigh resolution spectra of solids using synchrotron radiationat a range of temperatures, particularly very low tempera-tures. These studies need to be performed on solids withlarge vibrational frequencies in an attempt to resolve vibra-tional effects in oxides and other solids such as polymers andto determine the phonon broadening effects in these samplesover a wide temperature range. Third, there needs to be adetailed study, with the same high resolution, of a number ofmetal oxides �mostly nonconductors� with very differentM-O stretching frequencies. Our analysis predicts that themetal and O 1s linewidths �and asymmetry� should increaseas the M-O frequencies increase. Already, the literature indi-cates that the light metal oxides such as MgO �Ref. 18� havemuch larger linewidths than the heavier metal oxides such asTiO2 �Refs. 1–7� and RuO2.14,15 Also, the O 1s spectra forTiO2 show no significant asymmetry.5
Numerous theoretical aspects need to be addressed. Mo-lecular dynamics calculations are required on other solids todetermine the �r values after ionization. Complete vibra-tional calculations on the Si 2p and O 1s vibrational profilesfor solids such as SiO2 are required. A re-examination of thephonon broadening calculations is warranted with particularemphasis on values of �PH�0� and the contribution of ionstate profiles to these values. The �PH�0� values obtained byextrapolation of results in the literature typically yield ratherlarge values for nonconductors. The large values are unex-plained but may well result from final state vibrational split-ting. Apart from the probable example of the Be 1s XPS ofBe metal mentioned earlier,62 this contribution has not beenincluded in previous theoretical treatments of core-level XPSspectra of solids.
Predictions from this study should extend the scope ofnonconductor XPS studies. If there is a small M-X stretchingfrequency �such as in metal halides�, linewidths for manycompounds may approach 0.5 eV at room temperature �asobserved previously for As2S3 �Ref. 8��. Such linewidths�and well-behaved line shapes� are much narrower than ob-tained in earlier studies and should make an appreciable dif-ference to the chemical sensitivity of XPS studies of manynonconductors. Already, McIntyre and co-workers23,24 haveused the increased chemical sensitivity of the Kratos instru-ment to study multiplet effects in transition-metal oxide com-pounds at much better resolution than previously obtained,and we have used the increased chemical sensitivity to studyleaching and the structure of silicate glasses.11,27,28 Second,the inherent asymmetry of the O 1s �and other peaks� mustbe taken into account for analysis of broad XPS spectra. Aunique asymmetric O 1s peak shape needs to be agreed on tofit all the spectra of silicates and other oxides with largevibrational frequencies.
TOWARD A COMPREHENSIVE UNDERSTANDING OF… PHYSICAL REVIEW B 80, 075405 �2009�
075405-11
ACKNOWLEDGMENTS
We are grateful to NSERC for funding, to Surface ScienceWestern for technical help, to T. K. Sham for a critical read-ing of the paper, to T. D. Thomas for very generously send-
ing us his raw Si 2p data for the Si 2p spectra of SiF4 andSiCl4, to A. N. Buckley and S. L. Harmer for providing ustheir high resolution XPS results on Cu2O in advance ofpublication and also for their very helpful discussions, and toK. N. Dalby and A. R. Pratt for helpful discussions.
*Corresponding author; [email protected] H. Perron, J. Vandenborre, C. Domain, R. Drot, J. Roques, E.
Simoni, J.-J. Errhardt, and H. Catalette, Surf. Sci. 601, 518�2007�.
2 P. Karmakar, G. F. Liu, and J. A. Yarmoff, Phys. Rev. B 76,193410 �2007�, and references therein.
3 G. Ketteler, S. Yamamoto, H. Bluhm, K. Andersson, D. E. Starr,D. F. Ogletree, H. Ogasawara, A. Nilson, and M. Salmeron, J.Phys. Chem. C 111, 8278 �2007�.
4 G. J. Fleming, K. Adib, J. A. Rodriguez, M. A. Barteau, and H.Idriss, Surf. Sci. 601, 5726 �2007�; 602, 2029 �2008�.
5 S. H. Cheung, P. Nachimuthu, A. G. Joly, M. H. Engelhard, M.K. Bowman, and S. A. Chambers, Surf. Sci. 601, 1754 �2007�.
6 S. H. Cheung, P. Nachimuthu, M. H. Engelhard, C. M. Wang,and S. A. Chambers, Surf. Sci. 602, 133 �2008�.
7 S. A. Chambers, T. Ohsawa, C. M. Wang, I. Lyubinetsky, and J.E. Jaffe, Surf. Sci. 603, 771 �2009�.
8 H. W. Nesbitt, G. M. Bancroft, R. Davidson, N. S. McIntyre, andA. R. Pratt, Am. Mineral. 89, 878 �2004�.
9 V. P. Zakaznova-Herzog, H. W. Nesbitt, G. M. Bancroft, J. S.Tse, X. Gao, and W. Skinner, Phys. Rev. B 72, 205113 �2005�.
10 V. P. Zakaznova-Herzog, H. W. Nesbitt, G. M. Bancroft, and J. S.Tse, Surf. Sci. 600, 3175 �2006�.
11 V. P. Zakaznova-Herzog, H. W. Nesbitt, G. M. Bancroft, and J. S.Tse, Geochim. Cosmochim. Acta 72, 69 �2008�.
12 H. J. Song, H. J. Shin, Y. Chung, J. C. Lee, and M. K. Lee, J.Appl. Phys. 97, 113711 �2005�, and references therein.
13 Y. K. Kim, J. R. Ahn, W. H. Choi, H. S. Lee, and H. W. Yeom,Phys. Rev. B 68, 075323 �2003�.
14 M. Knapp, D. Crihan, A. P. Seitsonen, E. Lundgren, A. Resta, J.N. Andersen, and H. Over, J. Phys. Chem. C 111, 5363 �2007�.
15 H. Over, A. P. Seitsonen, E. Lundgren, M. Wiklund, and J. N.Andersen, Chem. Phys. Lett. 342, 467 �2001�.
16 S. Altieri, S. F. Contri, and S. Valeri, Phys. Rev. B 76, 205413�2007�, and references therein.
17 V. K. Lazarov, R. Plass, H.-C. Poon, D. K. Saldin, M. Weinert,S. A. Chambers, and M. Gajdardziska-Josifovska, Phys. Rev. B71, 115434 �2005�.
18 P. Liu, T. Kendelewicz, G. E. Brown, and G. A. Parks, Surf. Sci.412-413, 287 �1998�; P. Liu, T. Kendelewicz, and G. E. Brown,ibid. 412-413, 315 �1998�.
19 P. Liu, T. Kendelewicz, G. E. Brown, G. A. Parks, and P. Pi-anetta, Surf. Sci. 416, 326 �1998�.
20 H.-B. Fan, S.-Y. Yang, P.-F. Zhang, H.-Y. Wei, X.-L. Liu, C.-M.Jiao, Q.-S. Zhu, Y.-H. Chen, and Z.-G. Wang, Chin. Phys. Lett.24, 2108 �2007�.
21 T. Kendelewicz, P. Liu, C. S. Doyle, G. E. Brown, Jr., E. L.Nelson, and S. A. Chambers, Surf. Sci. 453, 32 �2000�, andreferences therein.
22 S. L. Harmer, W. M. Skinner, A. N. Buckley, and L.-J. Fan, Surf.Sci. 603, 537 �2009�.
23 B. P. Payne, A. P. Grosvenor, M. C. Biesinger, B. A. Kobe, andN. S. McIntyre, Surf. Interface Anal. 39, 582 �2007�.
24 M. C. Biesinger, C. Brown, J. R. Mycroft, R. D. Davidson, andN. S. McIntyre, Surf. Interface Anal. 36, 1550 �2004�.
25 D. E. Starr, F. M. T. Mendes, J. Middeke, R.-P. Blum, H. Niehus,D. Lahav, S. Guimond, A. Uhl, T. Kluener, M. Schmal, H. Ku-hlenbeck, S. Shaikhutdinov, and H.-J. Freund, Surf. Sci. 599, 14�2005�.
26 M. Salmeron and R. Schlogl, Surf. Sci. Rep. 63, 169 �2008�.27 K. N. Dalby, H. W. Nesbitt, V. P. Zakaznova-Herzog, and P. A.
King, Geochim. Cosmochim. Acta 71, 4297 �2007�, and refer-ences therein.
28 H. W. Nesbitt and K. N. Dalby, Can. J. Chem. 85, 782 �2007�.29 D. Ehre, H. Cohen, V. Lyahovitskaya, and I. Lubomirsky, Phys.
Rev. B 77, 184106 �2008�.30 M. T. Rinke, L. Zhang, and H. Eckert, ChemPhysChem 8, 1988
�2007�.31 M. Gazda and A. Winiarski, Physica C 432, 35 �2005�.32 M. Qvarford, S. Soderholm, G. Chiaia, R. Nyholm, J. N. Ander-
sen, I. Lindau, U. O. Karlsson, L. Leonyuk, A. Nilsson, and N.Martensson, Phys. Rev. B 53, R14753 �1996�.
33 A. Koitzsch, J. Fink, M. S. Golden, K. Karlsson, O. Jepsen, O.Gunnarsson, L. L. Miller, H. Eisaki, S. Uchida, G. Yang, and S.Abell, Phys. Rev. B 66, 024519 �2002�.
34 V. R. Mastelaro, P. N. Lisboa-Filho, P. P. Neves, W. H. Schreiner,P. A. P. Nascente, and J. A. Eiras, J. Electron Spectrosc. Relat.Phenom. 156-158, 476 �2007�.
35 L. Lv, F. Y. Lee, J. Zhou, F. Su, and X. S. Zhao, MicroporousMesoporous Mater. 96, 270 �2006�.
36 R. Heuberger, A. Rossi, and N. D. Spencer, Tribol. Lett. 28, 209�2007�.
37 J. B. Gustafsson, H. M. Zhang, E. Moons, and L. S. O. Johans-son, Phys. Rev. B 75, 155413 �2007�.
38 D. L. Legrand, G. M. Bancroft, and H. W. Nesbitt, Am. Mineral.90, 1042 �2005�.
39 L.-A. O’Hare, A. Hynes, and M. R. Alexander, Surf. InterfaceAnal. 39, 926 �2007�.
40 R. Eguchi, M. Taguchi, M. Matsunami, K. Horiba, K. Yama-moto, Y. Ishida, A. Chainani, Y. Takata, M. Yabashi, D. Miwa,Y. Nishino, K. Tamasaku, T. Ishikawa, Y. Senba, H. Ohashi, Y.Muraoka, Z. Hiroi, and S. Shin, Phys. Rev. B 78, 075115�2008�.
41 J. D. Bozek, G. M. Bancroft, J. N. Cutler, and K. H. Tan, Phys.Rev. Lett. 65, 2757 �1990�.
42 T. D. Thomas, L. J. Saethre, K. J. Borve, J. D. Bozek, M. Hut-tula, and E. Kukk, J. Phys. Chem. A 108, 4983 �2004�, andreferences therein.
43 T. D. Thomas, C. Miron, K. Wiesner, P. Morin, T. X. Carroll, andL. J. Saethre, Phys. Rev. Lett. 89, 223001 �2002�.
44 T. D. Thomas, R. Puttner, H. Fukuzawa, G. Prumper, K. Ueda,E. Kukk, R. Sankari, J. Harries, Y. Tamenori, T. Tanaka, M.
BANCROFT et al. PHYSICAL REVIEW B 80, 075405 �2009�
075405-12
Hoshino, and H. Tanaka, J. Chem. Phys. 127, 244309 �2007�.45 K. J. Borve, L. F. Saethre, J. D. Bozek, J. True, and T. D. Tho-
mas, J. Chem. Phys. 111, 4472 �1999�.46 C. J. Karlsson, F. Owman, E. Landemark, Y.-C. Chao, P. Mar-
tensson, and R. I. G. Uhrberg, Phys. Rev. Lett. 72, 4145 �1994�.47 S. M. Scholz and K. Jacobi, Phys. Rev. B 52, 5795 �1995�.48 F. J. Himpsel, F. R. McFeely, A. Taleb-Ibrahimi, J. A. Yarmoff,
and G. Hollinger, Phys. Rev. B 38, 6084 �1988�; F. J. Himpsel,B. S. Meyerson, F. R. McFeely, J. F. Morar, A. Taleb-Ibrahimi,and J. A. Yarmoff, in Proceedings of the Enrico Fermi School onPhotoemission and Absorption Spectroscopy of Solids and Inter-faces using Synchrotron Radiation, edited by M. Campagna andR. Rosei �North-Holland, Amsterdam, 1990�, Vol. 203.
49 J. A. Leiro, K. Laajalehto, I. Kartio, and M. Heinonen, Surf. Sci.412-413, L918 �1998�.
50 A. G. Schaufuss, H. W. Nesbitt, M. J. Scaini, H. Hoechst, G. M.Bancroft, and R. Szargan, Am. Mineral. 85, 1754 �2000�.
51 P. R. Citrin, P. Eisenberger, and D. R. Hamann, Phys. Rev. Lett.33, 965 �1974�.
52 G. D. Mahan, Phys. Rev. B 21, 4791 �1980�.53 G. K. Wertheim, D. M. Riffe, and P. H. Citrin, Phys. Rev. B 49,
2277 �1994�.54 K. Siegbahn, J. Electron Spectrosc. Relat. Phenom. 5, 3 �1974�;
U. Gelius, ibid. 5, 985 �1974�.55 D. G. J. Sutherland, G. M. Bancroft, and K. H. Tan, J. Chem.
Phys. 97, 7918 �1992�, and references therein.56 R. Sankari, M. Ehra, H. Nakatsuji, Y. Senba, K. Hosokawa, H.
Yoshida, A. De Fanis, Y. Tamenori, S. Aksela, and K. Ueda,Chem. Phys. Lett. 380, 647 �2003�.
57 N. Martennson and A. Nilson, J. Electron Spectrosc. Relat. Phe-nom. 52, 1 �1990�, and references therein.
58 J. N. Andersen, A. Beutler, S. L. Sorenson, R. Nyholm, B. Setlik,and D. Heskett, Chem. Phys. Lett. 269, 371 �1997�.
59 A. Fohlisch, N. Wassdahl, J. Hasselstrom, O. Karis, D. Menzel,N. Martensson, and A. Nilsson, Phys. Rev. Lett. 81, 1730�1998�.
60 H.-P. Steinruck, T. Fuhrmann, C. Papp, B. Trankenschuh, and R.Denecke, J. Chem. Phys. 125, 204706 �2006�.
61 H. Bergersen, M. Abu-samha, A. Lindblad, R. R. T. Marinho, D.Ceolin, G. Ohrwall, L. J. Saethre, M. Tchaplyguine, K. J. Borve,S. Svensson, and O. Bjorneholm, Chem. Phys. Lett. 429, 109�2006�.
62 J. N. Andersen, T. Balasubramanian, C.-O. Almbladh, L. I. Jo-hansson, and R. Nyholm, Phys. Rev. Lett. 86, 4398 �2001�.
63 P. J. Feibelman, Phys. Rev. B 49, 13809 �1994�.64 N. V. Dobrodey, A. I. Streltsov, and L. S. Cederbaum, Phys. Rev.
A 65, 022501 �2002�.65 Kratos web page: http://www.kratos.com66 D. A. Shirley, Phys. Rev. B 5, 4709 �1972�.67 Neal Fairley, CASAXPS, Version 2.1.26, 1999, http://
www.casaxps.com68 CPMD �1990–2004�, Copyright IBM Corp., MPI für Festkörper-
forschung Stuttgart, 1997.69 J. P. Perdew, K. Burke, and M. Ernzerhof, Phys. Rev. Lett. 77,
3865 �1996�.70 N. Troullier and J. L. Martins, Phys. Rev. B 43, 1993 �1991�.71 S. V. Churakov, N. R. Kishina, V. S. Urusov, and R. Wirth, Phys.
Chem. Miner. 30, 1 �2003�.72 D. M. Shaw and J. S. Tse, Am. Mineral. 92, 1593 �2007�.73 J. C. Slater, The Self-Consistent Field for Molecules and Solids,
Quantum Theory of Molecules and Solids �McGraw-Hill, NewYork, 1974�, Vol. 4.
74 S.-D. Mo and W. Y. Ching, Appl. Phys. Lett. 78, 3809 �2001�.75 R. T. Downs and M. Hall-Wallace, Am. Mineral. 88, 247 �2003�.76 R. M. Hazen, L. W. Finger, R. J. Hemley, and H. K. Mao, Solid
State Commun. 72, 507 �1989�.77 L. H. Boonstra, F. C. Mijlhoff, G. Renes, A. Spelbos, and I.
Hargittai, J. Mol. Struct. 28, 129 �1975�.78 G. Schaftenaar and J. H. Noordik, J. Comput.-Aided Mol. Des.
14, 123 �2000�.79 M. J. Frisch et al., GAUSSIAN 03, Revision C.02, Gaussian, Inc.,
Wallingford CT, 2004.80 M. D. Ulrich, J. G. Hong, J. E. Rowe, G. Lucovsky, A. S.-Y.
Chan, and T. E. Madey, J. Vac. Sci. Technol. B 21, 1777 �2003�.81 A. Shchukarev, J. Rosenqvist, and S. Sjoberg, J. Electron Spec-
trosc. Relat. Phenom. 137-140, 171 �2004�.82 V. C. Farmer, The Infrared Spectra of Minerals �Mineralogical
Society, London, England, 1974�.83 K. N. Dalby and P. L. King, Am. Mineral. 91, 1783 �2006�.84 T. X. Carroll, N. Berrah, J. D. Bozek, J. Hahne, E. Kukk, L. J.
Saethre, and T. D. Thomas, Phys. Rev. A 59, 3386 �1999�.85 R. W. Shaw and T. D. Thomas, Chem. Phys. Lett. 22, 127
�1973�.86 D. J. Bristow and G. M. Bancroft, J. Am. Chem. Soc. 105, 5634
�1983�.87 Z. F. Liu, G. M. Bancroft, J. N. Cutler, D. G. J. Sutherland, K. H.
Tan, J. S. Tse, and R. G. Cavell, Phys. Rev. A 46, 1688 �1992�.88 W. A. Deer, R. A. Howie, and J. Zussman, Rock-Forming
Minerals—Orthosilicates, 2nd ed. �Longmans, London, 1982�,Vol. 1A.
89 W. A. Deer, R. A. Howie, W. S. Wise, and J. Zussman, Rock-Forming Minerals—Framework Silicates, 2nd ed. �GeologicalSociety, London, 2004�, Vol. 4B.
90 G. M. Bancroft and Y. F. Hu, in Inorganic Electronic Structureand Spectroscopy, edited by A. B. P. Lever and E. I. Solomon�Wiley, New York, 1999�, Vol. 1, p. 443.
91 J. N. Cutler, G. M. Bancroft, D. G. Sutherland, and K. H. Tan,Phys. Rev. Lett. 67, 1531 �1991�.
92 S. Svensson, A. Ausmees, S. J. Osborne, G. Bray, F.Gel’mukhanov, H. Agren, A. Naves de Brito, O.-P. Sairanen, A.Kivimaki, E. Nommiste, H. Aksela, and S. Aksela, Phys. Rev.Lett. 72, 3021 �1994�.
93 S. Hufner, Photoelectron Spectroscopy: Principles and Applica-tions, Springer Series in Solid State Physics �Springer Verlag,Berlin, 1995�, Chap. 8.
94 H. W. Nesbitt and I. J. Muir, Geochim. Cosmochim. Acta 58,4667 �1994�.
95 M. F. Hochella and A. H. Carim, Surf. Sci. 197, L260 �1988�.96 Y. Lepage and G. Donnay, Acta Crystallogr., Sect. B: Struct.
Crystallogr. Cryst. Chem. 32, 2456 �1976�.97 K. Ishii, Am. Mineral. 63, 1198 �1978�, and references therein.98 J. A. Gadsen, Infrared Spectra of Minerals and Related Com-
pounds �Butterworths, London, England, 1975�.99 W. Kieffer, Ph.D. thesis, California Institute of Technology,
1971.100 R. A. Robie and J. L. Edwards, J. Appl. Phys. 37, 2659 �1966�.101 K. Nakamoto, Infrared Spectra of Inorganic and Coordination
Compounds, 4th ed. �Wiley-Interscience, New York, 1986�; In-frared Spectra of Inorganic and Coordination Compounds, 2nded. �Wiley-Interscience, New York, 1970�.
TOWARD A COMPREHENSIVE UNDERSTANDING OF… PHYSICAL REVIEW B 80, 075405 �2009�
075405-13
Top Related