


Languages
Pages
Legal


Contents
FOREWORD 2SOE PORTFOLIO: SNAPSHOT 4OBJECTIVES AND STRUCTURE 5OVERVIEW OF SOE REFORM IN UKRAINE 6EFFECTIVE REGULATORY FRAMEWORK OF SOEs IN UKRAINE 17UKRAINIAN ECONOMY 31OVERVIEW OF PORTFOLIO RESULTS 36ELECTRICITY 44OIL & GAS 59TRANSPORTATION 69 RAILWAYS 71 ROADS 76 AIRPORTS 80 SEA PORTS 86 POSTAL SERVICES 92MACHINE BUILDING 96FOOD & AGRICULTURE 111CHEMICALS 127COAL MINING 135BANKING 141COMPANY PROFILES 151 Agrarian Fund 152 Antonov 153 Centrenergo 154 Coal of Ukraine 155 Electrovazhmash 156 Energoatom 157 Illichivsk Sea Commercial Port 158 Kharkiv State Aviation Enterprise 159 Kharkivoblenergo 160 Khmelnytskoblenergo 161 Kyiv Boryspil 162 Lviv Danylo Halytskyi International Airport 163 Mariupol Sea Commercial Port 164 Mykolayivoblenergo 165 Naftogaz of Ukraine 166 Odesa Commercial Sea Port 167 Odesa Portside Plant 168 Roads of Ukraine 169 State Food and Grain Corporation of Ukraine 170 Sumykhimprom 171 Turboatom 172 Ukrainian Sea Ports Administration 173 Ukrainian State Air Traffic Enterprise 174 Ukrenergo 175 Ukrhydroenergo 176 Ukrposhta 177 Ukrspyrt 178 Ukrzaliznytsia 179 Yuzhny Sea Trade Port 180 Zaporizhyaoblenergo 181METHODOLOGY NOTE 182SOE PORTFOLIO 184ABBREVIATIONS AND DEFINITIONS 188

U K R A I N E ’ S T O P -1 0 0 S TAT E - O W N E D E N T E R P R I S E S › 2 0 1 3 & 9 M O N T H S 2 0 1 4002
Foreword
When Ukraine gained its independence in 1991 it inherited a highly inefficient state-run economy. Even after the mass privatization of the 1990’s and sporadic privatization of selected assets in the 2000’s, the State remains the owner of a large portfolio of assets, including industrial enterprises, banks and real estate, which account for a significant share of the Ukrainian economy and make it the largest employer in the country.
Until recently, reform of state-owned enterprises (SOEs) has been slow and incomplete; they remain under the control of ministries with insufficient commercial management ca-pabilities resulting in weak corporate governance, unmotivated management, and a lack of transparency. Currently, only 29 out of the TOP-100 SOEs have a Board of Directors in place composed solely of public servants, while less than 40% of the TOP-100 SOEs are audited and only a handful by internationally recognized audit firms.
It is therefore unsurprising that SOEs have historically posted poor operating and finan-cial results and find themselves in weak financial condition today. As of the end of Sep-tember 2014, the State owned 1,833 operational enterprises in a wide variety of industries.
This review focuses on the TOP-100 SOEs, which comprise c. 80% of all the SOE sector revenues and c. 90% of assets. During the first 9 months of 2014 these TOP-100 SOEs re-ported a combined net loss of UAH 74.7bn. While UAH 62.5bn of these losses came from Naftogaz of Ukraine alone and a portion of the losses can be attributed to weak economic conditions and currency devaluation, it is unquestionable that the operating efficiency of the SOEs is unacceptably low.
When I was appointed Minister of Economic Development and Trade of Ukraine, I made SOE reform one of my top priorities and assembled a strong team to lead those efforts. We began by passing transparency guidelines mandating all SOEs to publish their finan-cial accounts. We involved representatives of the World Bank, IFC, EBRD, Kiev School of Economics and others in the nomination committee tasked with identifying high quality CEO candidates for the largest SOEs. We also launched an audit initiative in order to audit the largest SOEs by reputable, internationally recognized audit firms. SOE reform includes many other important initiatives that are explained further in this report. By enhancing the governance, upgrading the management, and increasing the transparency of its SOEs, Ukraine can substantially improve their performance, boost investment and ultimately increase budgetary inflows.
Ukraine does not have to start from scratch. We are able to use well-established OECD guidelines on corporate governance of SOEs and the vast experience of well-developed European economies, which have successfully reformed their own SOEs in the past. Ef-fective management of SOEs depends on three fundamental principles: transparency; a clear commercial objective; and political insulation of all management decisions.
Transparent public access to key performance indicators of SOEs is necessary to provide the basis for government accountability and raises barriers against possible political in-tervention into the operations of SOEs. Although many SOEs may not be listed on stock exchanges, they are public companies in the purest sense and should, therefore, be no

003
less and even more transparent than companies listed on the most demanding exchanges.
Clearly established goals for SOEs and their management, along with periodic assessments as to the realization of those objectives, are also fundamental to good corporate governance and are a necessary ingredient to achieving sustained operational and financial results.
Finally, political insulation requires a clear chain-of-com-mand with the real delegation of key management func-tions to properly formed Boards with seasoned indepen-dent directors and professional managers selected via a transparent nomination process.
Still, the reform of SOEs, while necessary, is not an end in and unto itself. Ultimately, the State’s role in a market economy is not to own and operate a significant portfolio of enterprises but rather to establish and regulate an en-vironment in which commercial activity can flourish to the benefit of society. Commercial activity, however, should be the province of the private sector wherever possible, with the role of SOEs limited to exceptions such as natural monopolies and endeavours related to the State’s strate-gic interests or security. As such, SOE reform should go hand-in-hand with an improved privatization program based on a fair and transparent process that maximizes social value.
This Annual Review is the first, but not the last, publica-tion of its kind in Ukraine and as a result has its limita-tions. For example, most of the financials that have been provided are not audited, thus accuracy of the data may be questionable. We expect to improve the quality and accuracy of information provided in each future report. Still, this first report is an important step in creating a transparent framework for the improved management of Ukraine’s SOEs, which will improve the competitiveness of Ukraine’s economy and ultimately bring dividends to their real owners — the Ukrainian citizens.
Aivaras Abromavičius Minister of Economic Development and Trade of Ukraine

U K R A I N E ’ S T O P -1 0 0 S TAT E - O W N E D E N T E R P R I S E S › 2 0 1 3 & 9 M O N T H S 2 0 1 4004
SOE Portfolio: Snapshot

005
Objectives and Structure
The report is the first publication of this kind. The document presents a summary of financial information and analysis concerning the operations of selected top SOEs in Ukraine in 2013 and the first 9 months of 2014.
This first review is based on information derived from various sources, such as financial statements of SOEs, information provided by the Ministries and State Agencies, and other public sources. At this stage most SOEs do not have a track record of quality audits of their financial information; therefore, accuracy and completeness of their financial state-ments cannot be assured. No independent verification of information presented in this report has been performed; therefore, users should not rely on this information to make decisions of any nature. The authors of this report, the Government of Ukraine and any other institution of the state or any other entity under the control of the state is not and in any circumstance shall not be liable for any decisions of third parties based on the information, conclusions and opinions presented in this report.
The report consists of five main sections. The first section covers different facets of SOE reform, such as the reasoning behind its launch, its main objectives and its approach to the implementation. This section also outlines the experience of other countries in this area. The second section provides an overview of the existing SOE regulatory environ-ment in Ukraine. The third section presents the aggregated financial information on the portfolio of SOEs as well as some other key indicators of the performance of SOEs. The fourth section covers several sectors in which SOEs operate. Finally, in the fifth section, the financial results for Ukraine’s 30 largest SOEs are presented. The concluding pages of this publication include a list of the SOEs covered by this report and outline the main principles of the methodology employed during the preparation of this document.

U K R A I N E ’ S T O P -1 0 0 S TAT E - O W N E D E N T E R P R I S E S › 2 0 1 3 & 9 M O N T H S 2 0 1 4006
Overview of SOE Reform in Ukraine
Objectives of the Reform
For a long time after Ukraine regained its independence, successive governments in Ukraine have shown a lack of attention to SOEs. As a result, this sector of the Ukrainian economy has barely undergone any changes. Therefore, the low efficiency of SOEs is a glaring consequence of ignoring the problem for the past twenty-four years and the key reason for the need of reform.
As shown by experience of other countries and various studies, the main cause of poor operational efficiency of SOEs is a weak corporate governance system, which does not encourage profitability of SOEs, sets conflicting objectives and thus, leads to inadequate management of such enterprises. As in many other countries, the relationships between SOEs and the Government are very close in Ukraine, and the subordination of SOEs to in-dividual Ministries shields many of them from outside competition. Although the primary function of Ministries should be regulation of the respective sectors, Ministries frequently take an active part in management of SOEs. This results in an unavoidable conflict of interest.
For a long time, privatization of SOEs was believed to be the only way for governments to deal with the above situation. Transparent and trustful privatization is required in Ukraine as well. However, not all SOEs can be privatised or privatised soon. Thus the state will be having a considerable number of SOEs going forward. The Organization for Economic Cooperation and Development («OECD») analysed the successful cases of SOE reform in different countries and summarized their best practices in the guidelines on corporate governance of SOEs. When guided by the governance principles approved by OECD countries, SOEs are in a position to be sufficiently competitive even on the interna-tional market and to achieve results at least equal to those of private enterprises.
The Ministry of Economic Development and Trade of Ukraine (MoEDT) has made the reform of SOEs its top priority and is committed to building a healthy and transparent system that will aim to make Ukraine adherent to OECD Guidelines on Corporate Gover-nance of SOEs (OECD Guidelines, www.oecd.org/corporate).

O v E R v I E W O f S O E R E f O R M I N U K R A I N E 007
Strengthening Supervision and Improving Transparency
The Government is planning to introduce more viable supervision and management mechanisms for SOEs to ensure transparency of their operations and to require the establishment of strategic business targets. Companies shall use their resources eco-nomically and follow principles of effective risk management. Efficient supervision helps eliminate a potential conflict of interest. Putting it simply, economically viable supervision promotes a better management system inside companies.
The Transparency Guidelines adopted by the Government in February 2015 (Resolution of MoEDT No. 116 dated 11 February 2015) and the Framework Document on Improvement of the Efficiency of SOEs (the Framework Document), which is currently being drafted, will form the foundation for the transformation of SOE supervision. The above mentioned documents will encourage SOEs to disclose publicly their financial data and other key information. This requirement is in line with international practices and allows objective comparison of financial and operating results of SOEs versus their peers in private sector. In addition, the MoEDT has launched initiative to prepare and publish quarterly and an-nual reviews covering the portfolio of top SOEs.
When a company has one or several major shareholder or is controlled by several major shareholders, they are ultimately responsible for business efficiency. The shareholders are accountable for the appointment of vigorous board members and top managers. The shareholders monitor the company’s financial performance and work together with the board to set ambitious targets. In the event of a business failure, it is the board and top managers who are responsible first. If the results are unsatisfactory, shareholders can change board members or top managers.
The picture is largely different if the ownership of a company is dispersed. As a rule, su-pervision of such companies is usually weak. Boards feel almost unaccountable, which usually leads to deteriorating financial results. To strengthen control, shareholders may appoint supervisory boards, which act in the shareholders’ interest. According to this model, a supervisory board appoints board members and takes on other supervisory duties, acting much like majority shareholders in companies without a supervisory board.
State enterprises are majority owned, though indirectly, by all the citizens in a given coun-try. However, citizens possess no effective instruments to ensure proper supervision of the activities of SOEs. This is why SOEs need to have supervisory boards. On the other hand, it is only natural for shareholders to require regular information from the company to be able to assess the efficiency of its operations and management.
This is precisely why the Government has adopted the Transparency Guidelines and is now working on the Framework Document. The idea is to seek better representation of the interests of citizens, who will subsequently have a greater ability to involve them-selves in the supervision of SOEs.

U K R A I N E ’ S T O P -1 0 0 S TAT E - O W N E D E N T E R P R I S E S › 2 0 1 3 & 9 M O N T H S 2 0 1 4008
Enhancing Management
Pursuant to the adoption of the Framework Document will be the restructuring of the corporate governance of SOEs, to ensure that SOEs are capable of operating under mar-ket conditions like private companies without distortion of the competitive environment. As a result of increased competition, SOEs will have to ensure that they utilise their as-sets more responsibly and rationally. The new model of corporate governance of SOEs is expected not only to bring financial gains for the state budget, but also to improve the quality of services rendered to the Ukrainian citizens. Moreover, adequate corporate governance of SOEs will bring a positive influence on the national economy and to the business environment, making Ukraine more attractive to foreign investors.
This new model of corporate governance of SOEs includes strategic planning, appoint-ment of supervisory board members, and development of incentive schemes for board members and top managers. SOEs own significant assets which, indirectly, belong to all citizens of the country. Naturally, the value of these assets depends on the quality of their management.
A competent and well-motivated supervisory board is one of the key factors in attaining a profitable and efficient operation of a company. This has been proven by a number of state-run enterprises abroad. The board takes on a scope of important functions, which include defining the directions of strategic development, supervising and evaluating the work of top managers and providing information to shareholders.
It is important to stress that Ukraine wants to develop a new incentive system for SOEs aimed both at board members and top managers. The compensation should be com-parable to the levels in the private sector, but should not exceed it. Moreover, financial rewards must be linked to the results of a company. This model would encourage com-petent professionals to apply for jobs in SOEs and consequently, help boost the quality of management.
Action plan
Fig.001. SOE reform: aspects
The Government has emphasized four major aspects of reform which should govern the improvement of the operating efficiency of SOEs. The four aspects are shown below:

O v E R v I E W O f S O E R E f O R M I N U K R A I N E 009
Clear Objectives
At present, the majority of SOEs pursue diverse and often conflicting objectives, which results in uncertainty over responsibilities. Public authorities when exercising their own-ership rights have to ensure that all commercial and non-commercial (political and social) objectives of SOEs are fully transparent and clearly declared. This will help SOEs imple-ment their strategic tasks, while delivering products and services to citizens meeting the principles of maximum efficiency and the highest standard.
It is also important to properly leverage the equity of SOEs and to establish a clear policy on dividends. This should stimulate SOEs to increase their operation efficiency as well as the equity value. The operations and structure of unprofitable SOEs should be changed to ensure positive results of their performance. Loss-making and unnecessary commer-cial functions should be discontinued.
The efforts and pace to corporatize state enterprises with commercial activities should be increased. State enterprises should have the same corporate governance structure as private enterprises. This will allow improving governance of SOEs, while maintaining critical assets in the state ownership.
Separation of Commercial and Non-Commercial Functions
OECD Guidelines urge SOEs to define their non-commercial (or social) functions and state them clearly in their statutes. In addition, enterprises must separate commercial and non-commercial operations in their accounting documents to ensure greater transpar-ency and simplify financial analysis.
Ukraine’s largest SOEs will have to evaluate the scope of their non-commercial functions and related costs, as well as their impact on the financial performance. It is important to establish a clear and transparent model how non-commercial operations are financed in order to avoid cross-subsidising. This type of financing should not distort the market, which means that a company must operate according to the principles of fair competition, when executing its commercial activities.
Ownership and Regulatory Policy
SOEs compete with private businesses, hence the Government must adhere strictly to the principle of the separation of ownership and regulatory functions in setting up their corporate management structures. With this in mind, the Government is set to develop in the second quarter of 2015 the Ownership Policy. The document will define the principles of how public authorities should exercise the ownership rights entrusted to them. The Ownership Policy will deal with separation of the regulatory and ownership functions; it will also outline the methods of determining the remuneration of members of supervi-sory boards and the principles according to which members of supervisory boards are appointed. Audit committees shall become mandatory in all large SOEs. Following the common practice in the European Union and other countries, audit committees will be required to carry out several important functions:
‣ Supervise the process of the preparation of financial statements;
‣ Ensure the efficiency of the internal audit, internal control and risk management;
‣ Oversee the audit of annual financial statements;

U K R A I N E ’ S T O P -1 0 0 S TAT E - O W N E D E N T E R P R I S E S › 2 0 1 3 & 9 M O N T H S 2 0 1 4010
‣ Evaluate independence of a person or a company performing an audit;
‣ Ensure prevention of fraud.
Supervisory boards shall include independent members. SOEs must appoint professional, dynamic and motivated boards possessing a wish and competence to work. Eventually, boards will be able to ensure the effective operations of a company and successful imple-mentation of its business strategy. The current system of wages and financial incentives does not correspond to the level of responsibility, which top managers of SOEs face. Once clear indicators for the evaluation of SOEs are set, the wages of their board members can be made dependent on how successful a company is in attaining its financial and other targets. A system of bonuses, linked to results, would make SOEs an attractive job option for specialists from private businesses.
Striving for Transparency
When there is little accurate data publicly available, it is difficult to evaluate the work of SOEs and their management bodies as well as require from them efficient employment of capital and achievement of the set targets. Publicly available information on the activi-ties of SOEs stimulates responsibility and reduces the risk of corruption. Although shares of the majority of SOEs are not publicly traded, operations of these enterprises are in principle public, and thus should be even more transparent than those of the companies traded on the stock exchange.
Clear objectives and regular assessment of the performance constitute the foundation of proper corporate governance of SOEs. Thus, financial statements of SOEs must be prepared and audited in accordance with international standards, within the timeframe stipulated in the legislation.
Ukraine’s transparency and disclosure standards require improvement and should be properly established by the respective legislation. Poor application of Ukrainian account-ing standards (incomplete consolidation, non-disclosure of related party arrangements) makes it difficult for users to make a proper assessment of the financial position and per-formance of SOEs. There is no requirement for SOEs to conduct an audit of financial state-ments (unless such SOEs are public joint stock companies or their debt is publicly traded).
In aligning with international best practices, it is envisaged that all large SOEs (whose operations are commercially oriented) perform an audit of their financial statements in accordance with International Standards on Auditing. The audit will provide assurance on the financial data of SOEs, so they can be trusted and relied on.
Enhancing a Healthy Business Environment
Transparent activities of SOEs contribute to the creation of a business-friendly environ-ment which is needed for more foreign investors to come to Ukraine. Analysis carried out by the World Bank has confirmed that direct foreign investments spur the development of national economies. Foreign companies often become business catalysers fostering progress of entities with which they compete directly, as well as related sectors of the economy. The split of commercial and non-commercial functions, improved transpar-ency of operations and profitability will lead to the optimisation of the capital structure of SOEs. In turn, this will offer broader opportunities to draw additional funds from capital markets. If more SOEs were listed on stock exchanges, the market capitalisation would
O v E R v I E W O f S O E R E f O R M I N U K R A I N E 011
be much higher and the market would become more liquid and attractive for both local and foreign investors.
Experience of Other Countries
Large-scale projects aimed at reforming SOEs are not new worldwide. They have been carried out in a number of countries in Western Europe for many years. Below, we pro-vide an outline of key facts and concepts as to why SOEs exist and what are the basic principles of making their operations more effective.
Why Countries Own Enterprises
Advocates of the liberal market maintain that a state must stay away from any commer-cial activity. However, there are several reasons to justify the existence of SOEs in market-driven economies. For example natural monopoly, the sole business entity in a certain segment of the market, is one of them. In particular, natural monopolies are formed in the railway and energy sectors. In addition, some SOEs are assigned with an obligation to provide products and services, which are vital for the society, but are not delivered by the private sector. Moreover, the state, by far the largest owner and manager of public assets, is capable of assuming the risks of investing in large-scale projects, such as construction of new infrastructure and introduction of new technologies, which are not always com-mercially viable and which private companies would not undertake on their own.
The Principles of Reform
Some SOEs are of strategic importance to the economy of any country. SOEs can operate efficiently, generate profits and successfully compete in the market while generating re-sults comparable to or even exceeding those of private businesses. There are numerous examples of commercially viable state-run companies in different countries of the world. The experience of many countries which have been already implemented or have com-menced in the reform of the SOE sector has been assessed in the documents of the OECD. The OECD distinguishes six key principles which the states should follow:
‣ The legal framework and regulatory environment of SOEs should ensure uniform market conditions for both SOEs and private equity enterprises (level playing field);
‣ The state should adhere to a clear and consistent ownership policy so that the governance of SOEs is performed in a transparent, responsible, professional and effective manner;
‣ The state and SOEs should equally acknowledge the rights of all shareholders and ensure their equality and access to information about the enterprise in compliance with OECD Guidelines;
‣ The ownership policy of the state should not violate the rights of other parties related to SOEs which are ensured by legal acts or contractual commitments;
‣ SOEs should follow stringent transparency standards and adhere to OECD Guidelines;
‣ The Boards of SOEs should possess all required authorisations and competences in order to carry out the functions of strategic planning and company governance supervision. They should act in good faith and assume responsibility for their actions.

U K R A I N E ’ S T O P -1 0 0 S TAT E - O W N E D E N T E R P R I S E S › 2 0 1 3 & 9 M O N T H S 2 0 1 4012
The main expected outcome of SOE reform is higher efficiency of SOEs. More efficient operations offer a number of advantages to enterprises themselves, to the state and its citizens. Higher efficiency of SOEs helps:
‣ Improve the quality of services and products offered by enterprises;
‣ Reduce the price of products and services;
‣ Improve the profitability of enterprises and increase their contribution to the budget;
‣ Improve the business and investment climate by ensuring a level playing field be-tween private companies and SOEs as well as setting an example of good corpo-rate governance.
Fig.002. SOE reform: outcomes
Functions of Ownership
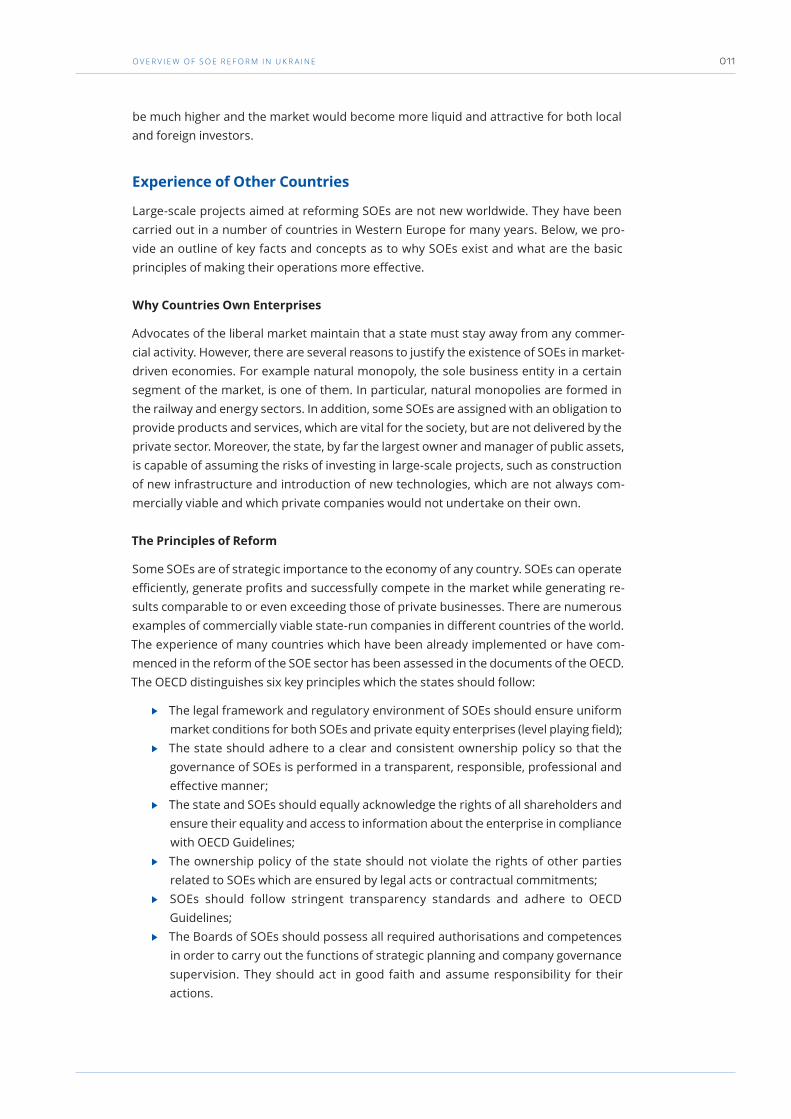
Establishing viable state ownership means that a state acts as an active owner of public assets. The state, through its institutions, sets operational and financial goals for com-panies demanding effective operations and sound results. The state, however, does not intervene directly in corporate activities. The procedure for exercising the rights of the state as a shareholder or owner varies in different countries due to different public man-agement and administration systems, inconsistent significance of SOE sectors for the economy and recent reforms carried out in several countries. However, three dominating corporate governance models may be distinguished: decentralised, dual and centralised.
In a decentralised (or sector) model, enterprises are managed by ministries which set policy of relevant sectors. This model has prevailed in many countries where SOEs con-stituted a significant part of the economy until privatization «waves» which took place from 1970 to 1990. The advantage of the model is an opportunity to implement a sec-tor policy more efficiently, for instance, when specific industrial branches are developed or strategic projects are implemented through enterprises. However, the most essential drawback of the system is the insufficient unbundling of the functions of the ministry as a sector regulator, policy maker and shareholders’ representative, which may result in a conflict of interest. Moreover, the application of the decentralised model is challenging in terms of determining the limits of responsibility of the ministry and board, due to the
O v E R v I E W O f S O E R E f O R M I N U K R A I N E 013
dominating attitude that the ministry is in charge of implementation of strategic objec-tives and daily activity of the enterprise, rather than the board of the enterprise. Due to the aforementioned drawbacks and shrunken efficiency of this governance model, many countries have chosen more centralised systems during the last thirty years. In the coun-tries where enterprises are still managed in a decentralised manner, the coordination of the state as a shareholder has commenced by establishing special supervisory institu-tions or assigning a coordinating role to one of the ministries. Such system is operated, for example, in Germany.
Most of the OECD countries use the dual model, when the rights of the state as a share-holder are exercised by two ministries: the line ministry and the ministry that coordinates corporate governance. This model helps ensure the implementation of a uniform policy of corporate governance and reduces the risk of failure to unbundle the functions, which is characteristic to the first model. Such model is operated in Italy, Greece, Turkey, and New Zealand. In some countries (e.g. France and Australia) the dual model has been cho-sen as an intermediate step for switching from a sector governance of the enterprises to a centralised one.
The centralised model is considered to be the most advanced model: SOEs are managed by one institution, for instance, a specialised agency or one of the ministries which has association with the sector policy (e.g. the Ministry of Economy). This model ensures a greater efficiency of the corporate governance and a clear unbundling of governance
functions from the implementation of the sector policy. In Denmark, Norway, Sweden, the Netherlands, and Poland, SOEs are managed in a centralized manner; the United Kingdom, Finland and France are also switching to this model.
Fig.003. Organisation and evolution of the ownership function Source: Corporate Governance of State-
Owned Enterprises, a Survey of OECD Countries, OECD 2005

U K R A I N E ’ S T O P -1 0 0 S TAT E - O W N E D E N T E R P R I S E S › 2 0 1 3 & 9 M O N T H S 2 0 1 4014
Transparency Policy
Transparency of operations is more important for SOEs than for private businesses. It has been a common practice in many countries around the world for SOEs to demonstrate their accountability before citizens by publicly publishing information concerning their operations.
Three phases of corporate accountability are distinguished in OECD countries. Firstly, SOEs must clearly declare the objectives of their activity. Usually, such objectives are set in legal acts governing the state’s ownership policy, and SOEs must provide the Govern-ment or ministry in charge with strategic plans which envisage the way for achieving their objectives.
The second phase is the submission of reports by SOEs. Usually, in other countries SOEs must submit their reports following the same requirements as public companies listed on the securities exchange. In most OECD countries SOEs publish reports with financial and operating data every six months, while in Sweden, Turkey and New Zealand such reports are published on a quarterly basis.
The third phase of corporate accountability is the drafting of summary reports on SOEs. Summary reports are prepared in Denmark, Canada, Finland, Italy, Poland, the Nether-lands, the United Kingdom and other countries. The reports are submitted to the Parlia-ment or Government of the country; the reports or shortened versions thereof are made publicly available. Sweden has followed this practice since 1999, France since 2002 and the United Kingdom since 2005. The aim of these reports is to assess the results of SOEs, monitor SOE activity on a continuous basis and make relevant decisions regarding corpo-rate governance or changes in strategy. The reports outline basic management principles applied to SOEs, the implementation of ownership functions by the state and reveal the dynamics of the state-run sector. In addition to that, they include financial data, with the largest companies reviewed individually.
Board Appointment and Incentives
Generally, SOEs are subject to the same governance system as enterprises operating in the private sector. Depending on the legislation effective in a specific country, the two-level governance system (when a supervisory board is comprised of the shareholders’ representatives, and the board consists of the enterprise’s managers) or the one-level governance system (when only the shareholders’ representatives sit on the board) may be formed. The number of members on the board greatly differs among various coun-tries and ranges from at least two (e.g. in New Zealand and Switzerland) to as many as 15 (in Mexico). The essential difference between the boards of SOEs and the private sector is the participation of public servants on the boards. In most OECD countries (for example, Finland, Sweden, Germany, Great Britain, and Italy) the number of representatives of the institution exercising the shareholders’ rights stands at two members at most. In some countries the number of public servants on the board is determined proportionally to the number of state-owned shares (for example, in Austria, the Czech Republic, and Slo-vakia), or a specific proportion is chosen (for example, one third in France, and in Mexico at least 50 % of the board members must be representatives of the authorities). In some countries, for example, Denmark, Norway and the Netherlands, the representatives of institutions do not sit on the boards; the boards are only formed from professional and independent members.

O v E R v I E W O f S O E R E f O R M I N U K R A I N E 015
The OECD Guidelines state that the most important factor which determines the efficien-cy of work of the boards is their autonomy in terms of decision-making and independence from political influence. More and more countries acknowledge that corporate boards should include as many independent members as possible, rather than the representa-tives of authorities (ministries). In some countries specific requirements are applied as to how many board members should be independent: for example, in France the number of independent members should comprise one third, in Greece at least two independent members should sit on the board, and in Slovakia the majority of the board should be represented by independent members. In Austria, Germany, Australia and New Zealand, independent members who are paid for the work performed constitute the majority of the board.
SOE oversight bodies are typically responsible for nomination of the members to the board, and this is determined by the model of exercising the ownership rights. In the decentralised system, the members of the board are generally appointed by the line min-istry; in the centralised system it is the institution or body that oversees the enterprises and appoints the members of the board, and when the dual system is chosen, a greater influence of appointing members to the board is frequently handed over to the coordinat-ing (non-sector) ministry or institution.
Still, only a few countries have a comprehensive, transparent and competence-oriented system for nomination of the members to the board. Such countries are Sweden, New Zealand, Australia and Finland. In some countries, for instance, the United Kingdom, Den-mark and Norway, special Nomination Committees or special agencies have been estab-lished that are consulted by the institutions when selecting members of the board.
In general, the same corporate governance practice tends to prevail in more and more OECD countries. The centralised corporate governance model is chosen more frequently. The process of the board formation is improved and made more transparent by setting explicit selection criteria and attracting independent members. Transparency is ensured by publishing SOE activity objectives and implementation results. Despite economic, political, social or cultural differences between various states, more countries tend to acknowledge the benefit of the recommendations of the OECD. On the basis of their ac-cumulated experience, it is possible to summarize that the consistent state policy vis-à-vis SOEs based on OECD recommendations, assurance of competitive market conditions, professional corporate governance and supervision help achieve a more effective use of resources both at the enterprise’s level and at the national level, which produces better SOE results and a greater benefit for the entire national economy.

U K R A I N E ’ S T O P -1 0 0 S TAT E - O W N E D E N T E R P R I S E S › 2 0 1 3 & 9 M O N T H S 2 0 1 4016
What Has Been Done?
The reform of SOEs has already been launched in Ukraine. A dedicated task force was established in the Ministry of Economic Development and Trade. The reform concept was developed and presented to the OECD and IMF, and its general approval has been received.
The Transparency Guidelines were approved in February 2015 and envisage that SOEs from now on publish their quarterly and annual financial and operational data. The Min-istry of Economic Development and Trade is now monitoring the implementation of the Transparency Guidelines.
The first consolidated report on the SOE sector is now presented. Such an overview of the entire state-run sector will now be prepared by the Ministry of Economic Development and Trade of Ukraine on a regular basis in order to enhance public accountability of SOEs. This document is evidence of the transparency initiatives of the Government and going forward it will inform the citizens of Ukraine about the developments of the sector and the progress of SOE reform.
The Government is currently developing a resolution to facilitate that the largest SOEs have their financial accounts audited by internationally recognized audit firms. This ini-tiative will increase reliability of the financial information of the companies and enhance their investment attractiveness.
The new nomination procedure for CEOs of key SOEs was approved by the Government in February 2015. New CEOs for key SOEs will now be selected using a rigorous 2-stage procedure with the pre-selection by the Line Ministries followed by the Nomination Com-mittee final interviews. The composition of the Nomination Committee is approved and consists of 5 Line Ministers and 5 independent reputable experts from IFC, World Bank, EBRD, Kiev School of Economics and Business Ombudsman Office. The pilot nomination of CEO for Ukrgasbank was successfully completed in April 2015. SOE reform should go hand-in-hand with the transparent privatization program. First step has already been made: list of companies to be privatized in 2015 has been approved by the Cabinet of Min-isters. Currently, the work on detailed case-by-case privatization program is ongoing with the participation of both local and international experts. Another initiative — part of the Government Program — is to cancel obligatory sale of 5-10 % stakes at stock exchanges prior to tender sale of the majority stake in SOEs. This legislation change is expected to be voted in the parliament.

E f f E c T I v E R E g U l AT O R y f R A M E W O R K O f S O E S I N U K R A I N E 017
Effective regulatory framework of SOEs in Ukraine
Legal Forms of SOEs
Under the Commercial Code of Ukraine, entities of the public sector comprise state-owned enterprises in which the state holds an interest of over fifty percent or can exer-cise the ultimate influence over the enterprise’s operations.
SOEs may be established or exist in a variety of legal forms, including the following
‣ State-owned unitary enterprise, operating as a state-owned commercial entity or as a budget-supported entity;
‣ Joint-stock company — may exist in the following legal forms: state-owned man-agement holding company and state-owned holding company, national or state-owned joint-stock company;
‣ Subsidiary with the state ownership;
‣ State-owned business association (a group or other types);
‣ Other types of entities, mainly limited liability companies (established in the pro-cess of privatization of smaller state-owned commercial entities or by incorpora-tion together with other entities, at present only a limited number exists).
Key Issues:
Ukraine lacks coherent legislation regulating the incorporation and operations of public sector entities, and as a result:
‣ Such entities exist in various legal forms with different regulatory frameworks that impedes implementation of consistent adequate governance practices;
‣ The majority of such entities exist in the form of a state-owned commercial en-terprise that is not always appropriate to their operating models (limited rights to the enterprise’s assets adversely affect the enterprise’s ability to raise capital; no board of directors and supervisory board representing the owner; regula-tory gaps regarding the composition of their statutory capital; no right to form strategic alliances by establishing joint ventures etc.)
Ukrainian legislation provides no clear guidance on the criteria and scope of pub-lic sector operations, and as a result, SOEs are sometimes established and used where it is not practical or feasible.
U K R A I N E ’ S T O P -1 0 0 S TAT E - O W N E D E N T E R P R I S E S › 2 0 1 3 & 9 M O N T H S 2 0 1 4018
Governance System for State-Owned Assets
Under the current Ukrainian legislation, the following bodies are responsible for supervi-sion of state-owned assets:
Cabinet of Ministers of Ukraine
‣ Assigns responsibility for supervision of state-owned assets to executive authori-ties and collective public bodies;
‣ Regulates the procedure for assignment of state-owned assets to supervisory authorities;
‣ Has decision-making authority in respect of establishment, reorganisation and liq-uidation of entities and assigns responsibility for control over their operations to relevant supervisory bodies;
‣ Sets performance criteria for management of state-owned assets and the process for application of these criteria;
‣ Approves the list of state-owned assets that are strategically important for the national economy and security.
Central executive authority responsible for formulation and implementation of the State economic policy
‣ Is responsible for formulation of the state policy and definition of general prin-ciples and strategic priorities for the management of state-owned assets, including corporate rights held by the State;
‣ Sets performance criteria for management of corporate rights held by the State;
‣ Together with the Ministry of Finance is responsible for formulation and imple-mentation of the state dividend policy;
‣ Is responsible for control over the performance of management bodies in their management role by consistently monitoring the performance management of the state-owned assets;
‣ Identifies the state-owned assets that are not subject to privatization (at the sug-gestion of supervisory bodies).
Ministries, other executive authorities, and national collective bodies
‣ Have decision-making authority in respect of establishment, reorganisation and liqui dation of SOEs;
‣ Initiate the establishment of business entities, develop draft statutory docu-ments, approve statutes (articles of association) for SOEs within the scope of their authority;
‣ Appoint and dismiss executives of SOEs;
‣ Approve annual financial and investment plans;
‣ Organise annual audits;
‣ Implement controls over leased state-owned properties.
The State Property Fund of Ukraine
‣ Acts as a lessor of integral property complexes of SOEs;
‣ On behalf of the State, acts as a founding participant of business entities and con-tributes state-owned property to their share capitals;

E f f E c T I v E R E g U l AT O R y f R A M E W O R K O f S O E S I N U K R A I N E 019
‣ Within the scope defined by legislation, is responsible for establishment and main-tenance of the Unified Register of State-Owned Property;
‣ When required by law, manages disposal of real estate owned by unitary SOEs.
Other governance bodies:
‣ Authorities that support the President of Ukraine, the Ukrainian Parliament and the Cabinet of Ministers of Ukraine;
‣ Bodies managing the state-owned property within the authority determined in individual laws;
‣ State-owned business associations, state-owned holding companies, and other state-owned business organisations;
‣ The National Academy of Sciences of Ukraine, and industry-specific academies of sciences.
Key Issues:
Ukraine currently has no single specialised body or a system of interlinked man-agement bodies (such as holding companies) responsible for continuous profes-sional management of state-owned assets. As a result, there are multiple autono-mous management centres unable to implement consistent coherent policy.
The situation where state executive authorities manage state-owned assets as authorised management bodies is not the most appropriate option considering the following:
‣ These authorities combine multiple roles, such as representing the owner, formulating state policy and advocating the interests of the communities that consume the products/services of SOEs, resulting in a conflict of interest that impairs management, performance, control and accountability, given that man-agement of SOEs does not represent a core role for these authorities;
‣ In managing these assets, state authorities generally pursue short-term objec-tives, in particular, maximising fiscal revenues.
The steering role of the Cabinet of Ministers of Ukraine in managing SOEs is not sufficient to ensure an effective system of managing state-owned assets.

U K R A I N E ’ S T O P -1 0 0 S TAT E - O W N E D E N T E R P R I S E S › 2 0 1 3 & 9 M O N T H S 2 0 1 4020
General Regulatory Framework Applicable to SOEs
Due to the multidimensional nature of SOE operations, Ukraine has no single regulatory act that would consistently govern all or most issues relating to the establishment, opera-tion and management of SOEs on a comprehensive basis.
The general legal status and operations of SOEs which are applicable across all industries are governed by a set of laws and regulations, such as:
The Civil Code of Ukraine
‣ Defines the status of all legal entities as participants of civil transactions.
The Economic Code of Ukraine
‣ Defines legal forms of SOEs and key rules applicable to their operations.
The Law of Ukraine «On Management of State-Owned Assets»
‣ Defines the legal foundation for managing state-owned property, management bodies and state-owned assets subject to management, and the scope of author-ity of management bodies in managing the state-owned assets.
The Law of Ukraine «On Entrepreneurship»
‣ The only article of this Law that is currently effective in respect of SOEs is the ar-ticle that defines the types of services where the service providers are restricted to SOEs and state-owned organisations, such as security services for extremely important state-owned assets (these properties are identified following the pro-cedure approved by the Cabinet of Ministers of Ukraine), and criminal, medical and psychiatric examination services, as well as the development, trial, production and operation of launch vehicles, including space launch for any purpose.
The Law of Ukraine «On Privatization of State-Owned Property»
‣ Regulates privatization of assets owned by SOEs and privatization of the State’s shares in SOEs.
The Law of Ukraine «On Joint-Stock Companies»
‣ Defines the procedure for establishment, operation, winding, and spin-off of joint-stock companies, as well as their legal status, rights and obligations of shareholders.
The Law of Ukraine «On Holding Companies in Ukraine»
‣ Defines the framework for establishment and operations of state-owned holding companies.
Laws and regulations applicable to all economic sectors:
‣ The Decree of the Cabinet of Ministers of Ukraine «On accountability of business entities in which SOEs hold interests»;
‣ The Resolution of the Parliament of Ukraine «On management of assets of enter-prises, entities and organisations in public ownership».
E f f E c T I v E R E g U l AT O R y f R A M E W O R K O f S O E S I N U K R A I N E 021
Sector-Specific Regulations Applicable to Individual SOEs
The effective legislation does not provide for industry regulations specific to public enti-ties. However, relevant sector/industry regulations contain certain provisions specific to the special role of SOEs operating in the respective sector. These provisions generally relate to the special role of these SOEs acting on behalf of the State, in particular:
‣ The Law of Ukraine «On Fundamentals of the Natural Gas Market Operation» and the Law of Ukraine «On Oil and Gas» define the operational framework for the operator of the Unified Gas Transportation System of Ukraine. PJSC «Ukrtransgas» operates in this role.
‣ The Law of Ukraine «On Electric Power Sector» and the Law of Ukraine «On Elec-tricity Market of Ukraine» define the rights and responsibilities of the electricity system operator. The respective SOE is responsible for centralised dispatching (op-erational and technologic) management of the unified power system of Ukraine. SE NJSC Ukrenergo operates in this role. The abovementioned laws also define the role of the electricity wholesaler (SE Energorynok).
‣ The Law of Ukraine «On Use of Nuclear Power and Radiation Security» defines the specific requirements for nuclear facility operators, uranium mining and process-ing entities and entities contracting the construction of nuclear facilities or radio-active waste disposal facilities of national significance.
‣ The Air Code of Ukraine defines the restrictions on use of state-owned airfields and airfield facilities (such as runways, taxiways, platforms, other airfield facilities) that represent critical flight security infrastructure.
‣ The operations of rail SOEs are regulated by the Law of Ukraine «On Railway Trans-port» and the Railway Statute of Ukraine. Certain specific details of establishment and operations of a 100 % state-owned rail company are governed by the Law of Ukraine «On Establishing a General-Purpose Public Joint-Stock Rail Company».
‣ The Law of Ukraine «On the Postal Service» defines the special role of a national postal service operator in the postal services market. Ukrainian State-Owned Postal Service Enterprise Ukrposhta operates in this role. Operations of this SOE are governed by Postal Service Regulations approved by the Resolution of the Cabinet of Ministers of Ukraine dated 5 March 2009.
‣ The Law of Ukraine «On Sea Ports of Ukraine» defines the role of the SOE Ukrai-nian Sea Port Office as an entity responsible for facilitating operations of seaports, holding and using strategic state-owned port infrastructure facilities, and dis-charging other relevant responsibilities, both directly and through the network of branches established in each seaport.
‣ The Law of Ukraine «On Management of State-Owned Defence Industry Complex» defines the process and legal framework for management of SOEs in the defence industry. In particular, the Law regulates operations of the state-owned Ukrobo-ronprom Group as an authorised manager of SOEs in the defence industry. The Group comprises defence industry SOEs and ensures R&D and production devel-opment, as well as facilitating investing, financing, exporting/importing and other activities.

U K R A I N E ’ S T O P -1 0 0 S TAT E - O W N E D E N T E R P R I S E S › 2 0 1 3 & 9 M O N T H S 2 0 1 4022
Accounting for State-Owned Assets
State-owned assets are accounted for by inclusion into the Unified Register of State-Owned Assets. Maintenance of this register is regulated by the Law of Ukraine «On Man-agement of State-Owned Assets». Additional regulatory framework applicable to main-tenance of this register comprises the Regulation on the Unified Register of State-Owned Assets and the Order of the State Property Fund and the Ministry of Economic Develop-ment and Trade of Ukraine «On Approval of the Structure of the Unified Register of State-Owned Assets».
Under the Law of Ukraine «On Management of State-Owned Assets», the Unified Register of State-Owned Assets (the «Register») represents an automated system for gathering, accounting, accumulating, processing, protecting and producing information on real es-tate, including properties held under operating or financial leases, concession, properties pledged as collateral, and owned by SOEs as well as the corporate rights held by the state and any state property that has not been contributed to the share capital of enterprises.
The Register is maintained by the State Property Fund of Ukraine supported by the cen-tral executive authorities responsible for implementation of national land and statistics policy, the central executive authority responsible for formulation and implementation of the national tax and customs policy, the Anti-Monopoly Committee of Ukraine, other authorised government agencies and the National Commission for Securities and the Stock Market of Ukraine, using consistent methodology and following the procedure pre-scribed by the Cabinet of Ministers of Ukraine. Costs of preparation and maintenance of the Register are covered from the state budget.
Users of the Register represent central and local state authorities, enterprises, organisa-tions and individuals. Access to the Register is regulated by the Law of Ukraine «On Access to Public Information».
Key Issues:
It is not possible to conclude on completeness of the Register, as no free access is provided to all data in the Register. Data from the Register can only be obtained for an individual asset by submitting a request to the State Property Fund of Ukraine.
A clear weakness is that not all data contained in the Register is publicly available on the Internet (for example, information that can be accessed on the Internet includes SOEs by region of Ukraine and corporate rights held by the State). At the same time, data on the list of SOEs in the Register is incomplete, as entities that are not «recognised» (i.e. validated based on inventory surveys) by responsible authorities are excluded from the Register.
As such, the existing situation does not meet the information needs of the public regarding administration of state property; therefore, the development and main-tenance of the Register requires further improvement.

E f f E c T I v E R E g U l AT O R y f R A M E W O R K O f S O E S I N U K R A I N E 023
Key Issues:
A breach of profit allocation responsibility should result in disciplinary, adminis-trative or criminal action against officials of the SOE. In addition, this requirement significantly limits the ability of SOEs to freely reinvest a portion of their profits into upgrades of their production facilities.
Special Procedure for Certain Financial and Business Transactions
Ukrainian legislation sets a number of limitations for SOEs on certain types of financial and business transactions and/or mandatory compliance procedures for specific types of financial and business transactions entered into by SOEs, such as disposal of assets, leases, concessions, administration agreements, joint ventures, loans, pledges of prop-erty as collateral, and procurement of goods, works and services.
On the one hand, these special requirements impose significant limitations on SOEs (e.g. raising debt, entering into strategic alliances etc.). However, on the other hand, they put SOEs in a privileged position compared to private sector businesses (for example, SOEs enjoy a guaranteed protection from hostile takeovers as they may only be acquired as part of the privatization process; and disposal of their assets in the case of bankruptcy is complicated).
In addition, under the current legislation, executives of SOEs have minimal decision-mak-ing autonomy (as most financial and business transactions require pre-authorisation by a supervisory authority or another state authority), which is a significant demotivating factor, adversely affecting the competitiveness of SOEs.

U K R A I N E ’ S T O P -1 0 0 S TAT E - O W N E D E N T E R P R I S E S › 2 0 1 3 & 9 M O N T H S 2 0 1 4024
Key Issues:
It should be noted that the existing executive remuneration system of SOEs is not sufficiently adequate and requires improvement. It is outdated as it is actually based on the standards of incentives applicable to civil servants. It offers a narrow range of incentive tools and does not contain effective incentives capable of pro-moting good governance of SOEs. It does not encompass the modern employee motivation models applied to executive remuneration in private companies..
Percentage of Profits and Dividends Paid to the State Budget
The percentage of profit/income paid by SOEs to the state budget is regulated by the Law of Ukraine «On Management of State-Owned Assets». Under this Law, unitary SOEs and their associations are required to allocate a percentage of their net profit/income to the State Budget of Ukraine:
‣ 30 % for unitary SOEs that represent natural monopolies and unitary SOEs with budge ted estimated net profits over UAH 50m;
‣ 15 % for other unitary SOEs.
In calculating the share of the net profit to be paid to the state budget by energy sector SOEs, the net profit used as the basis for calculation is reduced by the amount of special funds (the «investment component») received as part of the power tariff and to be allo-cated to investment projects (subject to the Cabinet of Ministers authorisation), as well as by the amount of repayment of loans (from the tariff), attracted for the purpose of financing CAPEX related to construction/reconstruction/upgrade of facilities subject to the Cabinet of Ministers authorisation.
For the electricity sector SOEs funded within the budget adopted by the national energy regulator, the portion of net profit/income paid to the state budget is determined as the excess of the actual budgeted income over the actual budgeted expenses for the report-ing period.

E f f E c T I v E R E g U l AT O R y f R A M E W O R K O f S O E S I N U K R A I N E 025
Board Appointments and Incentives (Board Remuneration Requirements)
Under the Law of Ukraine «On Management of State-Owned Assets», the Cabinet of Minis-ters approves the procedure for competitive recruitment of executives for SOEs. This proce-dure has been approved by the Cabinet of Ministers of Ukraine Resolution No. 777 dated 3 September 2008. The announcement of competitive selection of an executive is made based on a resolution/order issued by a ministry, the State Property Fund or another authority responsible for supervision of the SOE and includes a deadline for applications and timing of the final decision. This resolution/order should be issued within 10 days after the execu-tive vacancy is opened (for entities supervised by the Cabinet of Ministers this should be a resolution issued by the Cabinet of Ministers of Ukraine).
In addition, the above Procedure and related Nominations Committee Policy for strategically important enterprises (approved by the order of the Ministry of Economic Development and Trade of Ukraine No. 157 dated 23 February 2015) define a specific procedure for the competitive selection of executives for enterprises of strategic importance (defined as those enterprises whose assets reported in the latest set of financial statements exceed UAH 2bn, revenue for the year exceeds UAH 1.5bn, or banks with state-held interest of over 75 %). In this case, in order to nominate candidates for the position from applications received, the Ministry of Economic Development and Trade establishes a nominations committee. The nominations committee includes the Minister of Economic Development and Trade, the Minister of Finance, the Minister of Infrastructure, the Minister of Energy and Coal Industry, the Minister of Agrarian Policy and Food or their respective deputies, plus five independent external experts authorised by the Cabinet of Ministers of Ukraine. Representatives of a respective supervisory authority and the State Property Fund are invited to attend meetings of the nominations committee.
Contracts with executives of SOEs are signed by the appropriate supervisory authority sub-ject to the procedure defined in the resolutions of the Cabinet of Ministers of Ukraine «On Employment Contracts with Executives of SOEs» and «On Template of the Contract with Ex-ecutives of SOEs» and in the statute of the respective authority. Remuneration of executives of SOEs is regulated by the Resolution of the Cabinet of Ministers of Ukraine No. 859 dated 19 May 1999. In addition, under the Law of Ukraine «On Management of State-Owned Assets», the supervisory authority responsible for management of state-owned assets may decide to implement a performance-based remuneration system, where executives are paid re-muneration from SOE’s net profit based on performance of their entity. The remuneration procedure, terms and conditions and size are determined by the Cabinet of Ministers of Ukraine and form an integral part of the employment contract with the executive of a SOE. No remuneration is paid to the executive of a SOE in the case of non-compliance with the required procedure for approval/authorisation of the entity’s annual financial plan.

U K R A I N E ’ S T O P -1 0 0 S TAT E - O W N E D E N T E R P R I S E S › 2 0 1 3 & 9 M O N T H S 2 0 1 4026
Performance Monitoring and Disclosure (Reporting System, Audit Requirements)
Pursuant to the effective legislation of Ukraine, the authorities responsible for supervi-sion of the state-owned assets are required to report to the central executive authority responsible for development and implementation of the state economic policy and to submit:
‣ A summary the financial plans of the entities falling under their supervision and whether such plans have been fulfilled;
‣ Performance results of each individual SOEs falling under their supervision;
‣ The status of SOEs falling under their supervision including corporate rights held by the state;
‣ Whether strategic plans of SOEs, public joint stock companies and business enti-ties whose corporate rights or operations they manage or supervise have been implemented.
As required by the Cabinet of Ministers of Ukraine, the state supervisory authorities con-duct state financial audits of SOEs to prevent fraud and to ensure that public funds and state-owned assets are used appropriately.The requirement for mandatory audits of annual financial statements is applicable only to SOEs operating as public joint stock companies. In such cases, the annual financial state-ments and the annual consolidated financial statements together with an audit opinion are made publicly available on the corporate websites and are published in periodicals.In addition, the Order of the Ministry of Economic Development and Trade of Ukraine No. 116 as of 11 February 2015 approved the Transparency Guidelines for the state-owned enterprises. The Transparency Guidelines envisage that the financial statements of all SOEs shall be published on their corporate websites or on the websites of the relevant ministries.
Key Issues:
The existing disclosure system of SOEs does not properly address the public need for relevant information because state financial audits are conducted randomly, whereby the reliability of control is undermined, and the audit findings are not available to the public.
The Law of Ukraine «On Transparent Use of Public Funds» No. 183-VIII as of 11 Feb-ruary 2015 aims at improving the existing situation significantly (the Law will come into force six months after its publication). The Law envisages that SOEs should publicly disclose agreements signed, and related payment made, on the Unified web portal on public funds.
The latest amendments to the effective legislation of Ukraine are therefore expect-ed to contribute to the improvement of transparency and accountability of SOEs. However, it is necessary to further drive improvements in this area by enforcing the disclosure of relevant information on the corporate websites, providing public access to such information and introducing mandatory independent audits of the financial statements of all SOEs.
E f f E c T I v E R E g U l AT O R y f R A M E W O R K O f S O E S I N U K R A I N E 027
State Aid System for SOEs
General Requirements to the State Aid System for SOEs
There is no single comprehensive act of law within the effective legislative framework in Ukraine applicable to regulation of the state support to business entities including SOEs. Individual provisions applicable to the state support to SOEs are contained in a wide range of legislative acts including, in particular, the Economic Code of Ukraine, the Tax Code of Ukraine, the Customs Code of Ukraine and the Budget Code of Ukraine.
In addition, state aid may be allocated to SOEs if they perform special functions imposed on them by the State. If this is the case, the state ownership of entities is the basis for making a decision whether state aid should be given. In other cases, entities that operate in the public sector of the economy enjoy general privileges granted to a specific industry on equal terms with entities that operate in the private sector.
In 2014, the Ukrainian Parliament adopted the Law of Ukraine «On State Aid to Business Entities» No. 1555-VII. The Law will come into force on 2 August 2017. The objective of the Law is to systemise the allocation of the state aid to business entities, in particular, to improve management of the state funds allocated and to minimise a negative impact of the state aid on the competitiveness of Ukraine’s economy.
The Law aims to resolve a number of issues pertinent to state aid by requiring:
‣ Implementation of state aid monitoring tools;
‣ Preparation and maintenance of the register of state aid providers, recipients, cat-egories and amounts;
‣ Powers of the Antimonopoly Committee of Ukraine as a relevant supervising authority;
‣ Enforcement of control over state aid effects on competition.
The Law primarily focuses on state aid in the context of its effects on competitiveness of Ukraine’s economy. The Law does not properly address the existing problem of unsys-tematic allocation of state aid because:
‣ The Law does not set out specific criteria for categorising state regulation mea-sures as state aid to business entities (in particular, the Law prescribes that state aid involves allocation of state or local government funds to business entities and lost budget incomes, but it does not define whether the state support includes measures, which do not directly involve the budget flows but which do ensure that a business entity is able to raise financing from other sources);
‣ The Law does not define a comprehensive state support procedure (the Law is not explicit on the unified procedure for various categories of state aid; it appears that such unified procedure should be introduced by amending other laws);
‣ The Law does not address the unpredictable allocation of state aid (the effective legislation contains a wide range of provisions governing the state support to busi-ness entities; however, given related expenditures are not budgeted or are limited, the state aid is not granted or is restricted to a limited number of business entities that meet the state support criteria);

U K R A I N E ’ S T O P -1 0 0 S TAT E - O W N E D E N T E R P R I S E S › 2 0 1 3 & 9 M O N T H S 2 0 1 4028
‣ The Law is in conflict with other laws and the correlation between the Law adopted and other laws is not clear (for instance, state aid provided to business entities is also governed by Article 16 of the Economic Code of Ukraine, which sets out criteria different from those prescribed by the Law);
‣ The Law grants wide powers to the Antimonopoly Committee of Ukraine to block provision of state support (on the one hand, the Antimonopoly Commit-tee of Ukraine should become an additional barrier to the inefficient allocation of state funds, but on the other hand, its wide powers may lead to corrupt practices within the Antimonopoly Committee due to its excessive control of the matters concerned).
State Aid Categories for SOEs
The effective legislation does not define a comprehensive list of the state aid catego-ries (forms) to be granted to the SOEs. As required by the Law of Ukraine «On State Aid to Business Entities», state aid represents allocation of the state or local government funds to commercial entities and lost budget incomes. State aid may have the following categories:
‣ Subsidies and grants;
‣ Subventions;
‣ Tax reliefs/benefits, deferred payment or payment in instalments of taxes, levies and other compulsory payments;
‣ Write-off of debts including amounts due for state services rendered, write-off of fines and penalties and compensation of losses to business entities;
‣ Guarantees and loans issued on favourable terms and loans serviced at reduced rates;
‣ Reduced financial liabilities of business entities to state social security funds;
‣ Direct or indirect offering of goods or services to entities at prices below market or purchasing of goods or services from entities at prices above market;
‣ Disposal of state-owned assets at prices below market;
‣ An increase in the state’s interest in business entities or appreciation of the state’s interest on terms unavailable for private investors.
The Law has not come into force yet, however, the non-exhaustive list of state aid catego-ries specified in it is also relevant for the current regulatory environment. Traditionally, state aid may be categorised as direct state aid and indirect state aid. Direct state aid in-volves a direct transfer of economic benefits (normally, monetary assets) to the recipients. This includes subsidies, subventions and grants. Indirect state aid involves the granting of privileges that result in lost budget incomes and/or competitive advantages available to business entities. This includes tax reliefs/benefits, deferred settlement of liabilities, write-off of debts, guarantees for loans issued etc.

E f f E c T I v E R E g U l AT O R y f R A M E W O R K O f S O E S I N U K R A I N E 029
Summary of Key Issues:
The governance system for state-owned assets in Ukraine requires a comprehensive revi-sion and improvement by:
‣ Systemising the list of the legal forms (unifying it and eliminating state-owned commercial entities (transforming/reorganising them into business entities) etc.) to ensure, as much as possible, that SOEs operate as corporate entities (business entities), which are more flexible, efficient and understandable for investors (as an exceptional case, budget-supported entities may be preserved to ensure the State’s interests);
‣ Avoiding discrimination in the legal regulation of public and private entities, in par-ticular, cancelling the special legal regimes for SOEs (including that applicable to taxation, bankruptcy and the protection of competition);
‣ Systemising the legislative framework governing operations of SOEs;
‣ Specifying, by law, a clear distinction between public and private assets as a bal-anced proportion of public and private sectors as part of the national economy;
‣ Improving the institutional governance system for state-owned assets by:
• Assigning the responsibility for developing state policy rather than for manag-ing state-owned assets to the Cabinet of Ministers of Ukraine;
• Unifying the system of the authorised supervisory bodies (establishing a single state authority or a state managing holding company that combines sectorial sub-holding entities or combining both of the above structures);
‣ Articulating a uniform governance strategy for state-owned assets (as a legislative act or a regulatory act of the Cabinet of Ministers of Ukraine);
‣ Improving the governance system of SOEs by implementing corporate governance best practices, including a development strategy, HR management policy, invest-ment policy, financial asset management and operational management and con-trol models;
‣ Enhancing the role of the supervisory board as an owner’s representative within the corporate governance system by assigning substantially all supervision (ap-proval) responsibilities to it from the authorised governance body and raising a level of independence for executive bodies (management boards) in daily business operations;
‣ Implementing incentive schemes in the remuneration system for the boards and executives of SOEs, aligned with the best practices in the private sector to ensure a long-term buy-in, recruitment and motivation of talent;
‣ Enhancing transparency of, and public access to, the register of state-owned as-sets and activities of SOEs;
‣ Harmonising and improving the system of allocation of state aid (support) to entities.

U K R A I N E ’ S T O P -1 0 0 S TAT E - O W N E D E N T E R P R I S E S › 2 0 1 3 & 9 M O N T H S 2 0 1 4030

031
Ukrainian EconomyGeneral Overview
Ukraine is the largest country in Europe by area (603,000 km2, including Russia-annexed Crimea) and the sixth largest by population (over 45 million people at the beginning of 2014), making it one of the largest consumer markets in the region. A favourable geo-graphic location establishes the country as a key transportation route between Europe, Russia and Central Asia.
Ukraine is rich in natural resources. It ranks first in the world in crude iron ore reserves (20% of world total), whose iron content is the third largest globally. The country also car-ries the seventh-largest proven coal reserves (4% of world total) and is richly endowed with chernozem (or «black earth»), one of the most fertile soils. With 43 Mha of agricul-tural land (72% of the country’s total land mass), Ukraine accounts for about 25% of the global chernozem area. According to the U.S. Energy Information Administration, Ukraine possesses the fourth largest technically extractable shale gas resources in Europe (1,200 bcm) after Norway, France and Poland.
An abundance of natural resources and forced industrialization during the Soviet era made industry a leading sector of the Ukrainian economy. Although Ukraine has been transforming into a post-industrial economy, with industry’s share declining to 27% of GDP in 2013 from 37% in 2007, industry still has major impact on GDP dynamics due its impact on other economic sectors, particularly transportation and wholesale trade. At the same time, agriculture has been developing actively in recent years, increasing its share of GDP to 10.4% in 2013 from 7.5% in 2007, and is viewed as one of the most promising economic sec-tors in the medium term.
Fig.004. Share of Industry in GDP: Ukraine vs. Regional Peers (%; 2013 or latest available data) Source: World Bank
Latv
ia
Ukr
aine
Turk
ey
Croa
tia
Lith
uani
a
Bulg
aria
Esto
nia
Hun
gary
Slov
enia
Slov
ak R
ep.
Pola
nd
Russ
ia
Czec
h Re
p.
Kaza
khst
an
Bela
rus
Rom
ania
45%
40%
35%
30%
25%
20%
15%
Fig.005. Share of Agriculture in GDP: Ukraine vs. Regional Peers (%; 2013 or latest available data) Source: World Bank
Slov
enia
Czec
h Re
p.
Pola
nd
Lith
uani
a
Esto
nia
Russ
ia
Slov
ak R
ep.
Latv
ia
Croa
tia
Hun
gary
Kaza
khst
an
Bulg
aria
Rom
ania
Turk
ey
Bela
rus
Ukr
aine
12%
10%
8%
6%
4%
2%
0%
Fig.006. Composition of Ukraine’s GDP (2014E) Source: State Statistics Service of Ukraine, Dragon Capital estimatess
Agriculture (11.0%)
Industry (23.4%)
Construction (2.4%)
Trade (16.7%)
Transport & Communications (8.6%)
Education (5.9%)
Healthcare (4.1%)
Other economic activity (27.8%)

U K R A I N E ’ S T O P -1 0 0 S TAT E - O W N E D E N T E R P R I S E S › 2 0 1 3 & 9 M O N T H S 2 0 1 4032
In structural terms, Ukraine is a relatively small, open and commodity-based economy. In 2014, the country ranked 58th globally in nominal GDP (USD 132bn) and was 47th based on purchasing power parity (PPP) GDP. Ukraine’s per capita GDP stood at USD 3,089 (USD 8,240 based on PPP) — 126th worldwide (106th based on PPP). Ukraine’s external trade turnover is equivalent to 108% of GDP
Commodities account for two-thirds of the country’s merchandise exports, one of the highest ratios in the region, trailing only Russia and Kazakhstan. In contrast to its oil and gas-rich neighbours, Ukraine is strongly dependent on exports of non-energy hard and soft commodities. The share of soft commodities, primarily grain, oilseeds and vegetable oil, has been on an upward trend since 2010, increasing to 30% in 2014, the largest share in the region and stressing Ukraine’s status as one of the world’s largest producers and exporters of agricultural commodities. The metal and mining sector accounted for 27% of total exports in 2014 compared to 33% in 2010. Machinery and manufactured consumer goods prevail in non-commodity exports. Accordingly, the export-oriented metallurgical,
machine-building and chemical sectors together represent 31% of Ukraine’s industry.
The composition of its exports makes Ukraine highly dependent on the global commodity cycle and the state of the world economy. Strong reliance on foreign demand and close interconnection among export-oriented industries and other economic sectors make the country’s growth trajectory extremely volatile, causing sharp slumps during global eco-nomic downturns but contributing to fast rebounds in times of global growth.
On the import side, energy resources dominate, accounting for a quarter of total mer-chandise imports and consisting primarily of natural gas, oil and oil products. Imported gas covers about half of domestic gas consumption (2014 imports stood at 19 billion cubic meters (bcm) and consumption at 42 bcm). Russia was effectively the only gas supplier to Ukraine prior to 2014, but last year’s change of power in the country and subsequent conflict with Russia led Ukraine’s new authorities to ramp up gas imports from the EU and target achieving full independence from Russia in the gas sphere in the medium term. Ukraine also imports various intermediate goods such as chemicals (17% of total imports).
Fig.007. Ukraine’s Merchandise Trade Structure (2014; USD bn) Source: NBU
Chemicals
Fuels and Minerals
Other
Machinery
Metallurgy
Imports Exports
7.7%17.4%
9.9%25.7%
11.3%21.9%
13.3%19.6%
27.6%5.4%
30.2%9.9%

U K R A I N I A N E cO N O M y 033
Consumer and investment goods accounted for 26% and 14% of total imports, respectively, in 2014.
Ukraine’s high dependence on energy imports mirrors its low energy efficiency. Although the country has almost halved energy consumption since becoming independent in 1991, its energy needs remain considerable due to the preva-lence of highly energy-intensive and still unre-formed industrial and utilities enterprises.
At the same time, Ukraine’s gas transit network, another legacy of the Soviet era, was for a long time an important transit route for Russian gas. Until recently, two-thirds of Russian gas exports to Europe were pumped via Ukraine, ensuring a permanently positive service trade balance which partially offset the merchan-dise trade deficit the country had consistently run since 2005. However, declining demand for Russian gas in the EU and Russia’s strategy to diversify its gas transit routes are now endangering Ukraine’s status as a major gas transit player. Gas transit via Ukraine fell to 62 bcm in 2014 from 104 bcm in 2011 and is likely to continue declining.
The EU and Russia remain Ukraine’s largest trade partners, but trade ties with the EU have strengthened significantly over the past several years, especially in 2014. Russia’s share of Ukrainian exports has been on a downward trend since 2011 due to the neigh-bouring country’s various protectionist measures and political tension. Russia thus ac-counted for 18% of total Ukrainian exports in 2014, down from 30% in 2011. At the same time, the EU’s share of Ukrainian exports rose to 30% in 2014 after hovering around 25% in 2009–2012, with agricultural products and metals the key export items. On the import side, Russia’s share has been narrowing since 2010 and reached 23% in 2014, mostly on account of lower gas imports, while the EU’s import share rose to almost 40%.
Ukraine’s trade ties with the EU are set to strengthen further following the signing of the Association Agreement, including provisions on a Deep and Comprehensive Free Trade Area, in June 2014. The deal carries far-reaching implications for Ukraine, serving as a comprehensive roadmap to enhance its institutional and legal frameworks. Ukraine undertakes to align its trade-related legislation with that of the EU and carry out re-forms in many areas including public procurement, competition policy and protection
Fig.008. Energy Efficiency: Ukraine vs. Regional Peers (international dollars of GDP produced from 1 kg of oil equivalent; latest data available) Source: World Bank
Ukr
aine
Kaza
khst
an
Russ
ia
Bela
rus
Esto
nia
Bulg
aria
Czec
h Re
p
Slov
enia
Slov
ak R
ep
Pola
nd
Latv
ia
Lith
uani
a
Hun
gary
Rom
ania
Croa
tia
Turk
ey
12
10
8
6
4
2
0
Fig.009. EU and Russia’s Shares of Ukrainian Exports (%) Source: State Statistics Service of Ukraine
Fig.010. EU and Russia’s Shares of Ukrainian Imports (%) Source: State Statistics Service of Ukraine
10%
15%
20%
25%
30%
35%
40%
45%
2004 2005 2006 2007 2008 2009 2010 2011 2012 2013 2014
RussiaEU
10%
15%
20%
25%
30%
35%
2004 2005 2006 2007 2008 2009 2010 2011 2012 2013 2014
RussiaEU

U K R A I N E ’ S T O P -1 0 0 S TAT E - O W N E D E N T E R P R I S E S › 2 0 1 3 & 9 M O N T H S 2 0 1 4034
of intellectual property rights. These reforms are expected to benefit Ukraine in the me-dium to long term, but the ultimate economic impact will depend on how rapidly and how diligently Ukraine delivers on its commitments.
Recent Developments
Ukraine is living through one of the most turbulent periods in its history, its economic challenges being amplified by Russia’s annexation of Crimea and the ongoing military conflict in the east of Ukraine.
Russia’s annexation of Crimea in March 2014 had limited impact on the Ukrainian econo-my as the 26,000 km2 peninsula (4.3% of Ukraine’s total area) had a relatively low share of GDP (3.7% in 2012) and weak economic links with the mainland. However, the subsequent separatist unrest in the two easternmost regions of Donetsk and Luhansk (53,500 km2 combined, or 8.8% of Ukrainian territory), which began in April 2014 and has since grown into a full-blown military conflict, carries far more significant economic implications.
The separatist-held area accounts for less than 3% of the Ukrainian territory but includes numerous large enterprises accounting for an est. 15% of total industrial output and an est. 8% of GDP. There are strong production links among companies based in the Donetsk and Luhansk regions, yet their interconnection with the rest of Ukraine is limited largely to supplies of iron ore (from the Dnipropetrovsk region to Donetsk steel mills) and thermal coal deliveries (from the Luhansk region to the rest of Ukraine). This area also accounts for a significant share of the Ukrainian exports, mainly machinery and metals, which are mostly supplied to Russia.
The Ukrainian economy contracted an est. 6.8% year-on-year (y-o-y) in 2014 after two years of zero growth, driven primarily by an 11% y-o-y slump in industrial production, though most of other economic sectors also demonstrated a decline. Cargo transporta-tion and wholesale trade shrank by 11% and 15% y-o-y, respectively. Construction output plunged by 22% y-o-y, reflecting weak investment demand. Retail trade dropped by 8.6% and passenger transportation declined 12% y-o-y, reflecting contraction of household consumption in the military conflict zone and across the rest of Ukraine. Agriculture was the only bright spot, recording a 2.8% y-o-y increase in output thanks to a record grain harvest of 64 million tonnes (Mt) in 2014.
Ukraine’s financial markets were hit even harder, with Ukraine’s hryvnia depreciating by almost 50% y-o-y to UAH 15.77:USD last year (based on the National Bank’s official rate) and remaining on a steep downward trend in early 2015. The continuous instability fu-elled sizable bank deposit outflows. The domestic banking system lost 13% of hryvnia deposits and 37% of foreign currency deposits in 2014. The National Bank tried to support the currency but its reserves were not sufficient to meet increased foreign currency de-mand and were also undermined by settlement of gas payables to Russia. NBU reserves thus slumped by 63% y-o-y to USD 7.5bn in 2014, an 11-year low and equivalent to a merely 1.2 months of goods and services imports. Currency devaluation also fuelled consumer inflation, which hit 25% y-o-y in 2014 after hovering around zero for two years.
Ukraine managed to avoid a financial meltdown thanks to solid financial assistance from international financial institutions and governments of other countries. The initial two-year support package of USD 27bn announced in April 2014 included a USD 17bn Stand-by loan from the IMF as well as financing from the World Bank, the EU, the United States,
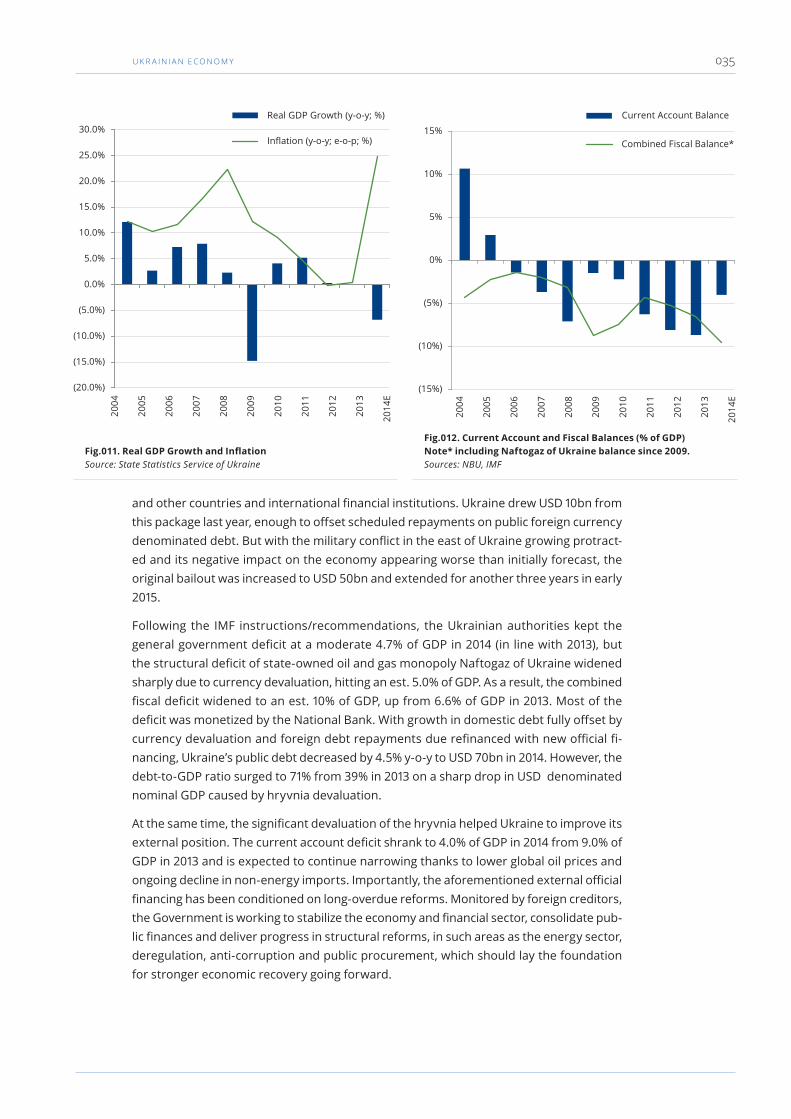
U K R A I N I A N E cO N O M y 035
and other countries and international financial institutions. Ukraine drew USD 10bn from this package last year, enough to offset scheduled repayments on public foreign currency denominated debt. But with the military conflict in the east of Ukraine growing protract-ed and its negative impact on the economy appearing worse than initially forecast, the original bailout was increased to USD 50bn and extended for another three years in early 2015.
Following the IMF instructions/recommendations, the Ukrainian authorities kept the general government deficit at a moderate 4.7% of GDP in 2014 (in line with 2013), but the structural deficit of state-owned oil and gas monopoly Naftogaz of Ukraine widened sharply due to currency devaluation, hitting an est. 5.0% of GDP. As a result, the combined fiscal deficit widened to an est. 10% of GDP, up from 6.6% of GDP in 2013. Most of the deficit was monetized by the National Bank. With growth in domestic debt fully offset by currency devaluation and foreign debt repayments due refinanced with new official fi-nancing, Ukraine’s public debt decreased by 4.5% y-o-y to USD 70bn in 2014. However, the debt-to-GDP ratio surged to 71% from 39% in 2013 on a sharp drop in USD denominated nominal GDP caused by hryvnia devaluation.
At the same time, the significant devaluation of the hryvnia helped Ukraine to improve its external position. The current account deficit shrank to 4.0% of GDP in 2014 from 9.0% of GDP in 2013 and is expected to continue narrowing thanks to lower global oil prices and ongoing decline in non-energy imports. Importantly, the aforementioned external official financing has been conditioned on long-overdue reforms. Monitored by foreign creditors, the Government is working to stabilize the economy and financial sector, consolidate pub-lic finances and deliver progress in structural reforms, in such areas as the energy sector, deregulation, anti-corruption and public procurement, which should lay the foundation for stronger economic recovery going forward.
Fig.011. Real GDP Growth and Inflation Source: State Statistics Service of Ukraine
(20.0%)
(15.0%)
(10.0%)
(5.0%)
0.0%
5.0%
10.0%
15.0%
20.0%
25.0%
30.0%
2004
2005
2006
2007
2008
2009
2010
2011
2012
2013
2014
E
Fig.012. Current Account and Fiscal Balances (% of GDP) Note* including Naftogaz of Ukraine balance since 2009. Sources: NBU, IMF
(15%)
(10%)
(5%)
0%
5%
10%
15%
Current Account Balance
Combined Fiscal Balance*
2004
2005
2006
2007
2008
2009
2010
2011
2012
2013
2014
E

U K R A I N E ’ S T O P -1 0 0 S TAT E - O W N E D E N T E R P R I S E S › 2 0 1 3 & 9 M O N T H S 2 0 1 4036
Overview of Portfolio ResultsUkrainian SOEs represent a substantial part of the national economy, and are also large employers. State-owned assets (enterprises, real estate, forests etc.) are ultimately the property of all Ukrainian citizens. The state has a responsibility to be an active and profes-sional owner, in order to create value for its citizens.
The number of SOEs in Ukraine is extremely large, if compared to developed world econo-mies. According to the analysis of the MoEDT, the number of enterprises owned by the state as of 30 September 2014 constituted 3,350 1 However, given that there is no consoli-dated up-to-date register of SOEs, the above number may be incomplete.
This report is the first attempt to summarise and evaluate the financial performance of SOEs. This is a challenging exercise considering the following:
‣ How to bring data from financial statements to a uniform standard and aggregate them into a single portfolio;
‣ Which indicators to calculate to reasonably assess the performance of SOEs and compare them against their peers;
‣ How to present the most relevant and useful information.
The above challenges are further complicated by the fact that the quality of the financial information from the SOEs is not high. Most SOEs have never been audited in accordance with international standards, thus analysis based on data of questionable quality could be of limited use. However, with the progress of SOE reform, the quality of the financial information and analysis based thereon will improve.
The analysis presented in this report covers the TOP-100 entities owned by the state in-cluding the 94 largest 2 state-owned enterprises (the «Portfolio») which cumulatively accounted for c. 82% of the total assets and c. 80% of the total revenue of all SOEs as of 30 September 2014 and for the nine month period then ended, as well as six banks owned by the State. Due to the specific nature of the banking sector as well as the significant volume of operations between the state-owned banks and SOEs, the financial results of the state-owned banks are not ag-gregated into the Portfolio, but are presented separately.
All SOEs included into the Portfolio are divided into the following eight sectors: electricity, oil & gas, transportation, machine building, food
1 Does not include 190 SOEs based in Crimea.
2 For the purposes of this report, SOEs of the defense sector as well as SOEs operating in the conflict affected regions of Ukraine under the anti-terrorist operation (ATO) were excluded from the analysis (refer to the methodology note at the end of this report).
Fig.013. Employees (thousand) Source: SOEs information, Ministry of Economic Development and Trade of Ukraine
.5
16.9
10.6
15.8
41.6
49.7
87.7
177.5
503.9
18.5
10.9
16.1
41.5
51.8
89.4
178.2
517
Other
Chemicals
Food & Agriculture
Coal Mining
Machine Building
Electricity
Oil & Gas
Transportation
2013 9M14
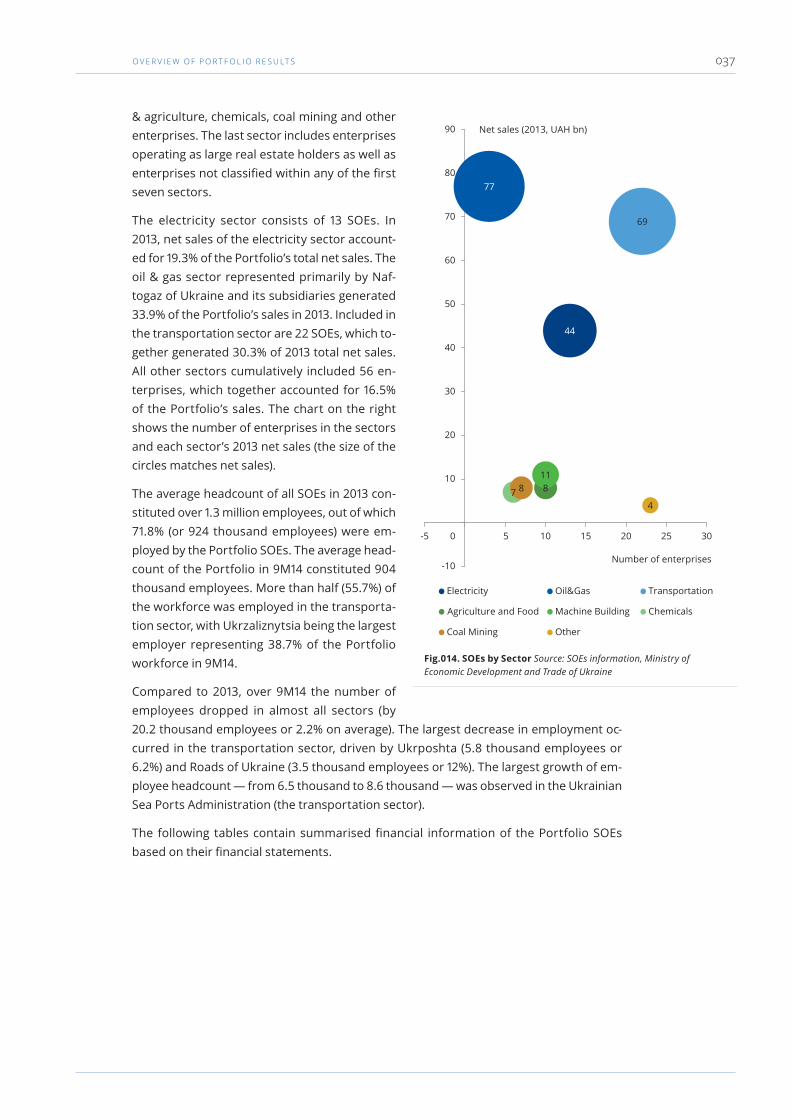
O v E R v I E W O f P O R T f O l I O R E S U lT S 037
& agriculture, chemicals, coal mining and other enterprises. The last sector includes enterprises operating as large real estate holders as well as enterprises not classified within any of the first seven sectors.
The electricity sector consists of 13 SOEs. In 2013, net sales of the electricity sector account-ed for 19.3% of the Portfolio’s total net sales. The oil & gas sector represented primarily by Naf-togaz of Ukraine and its subsidiaries generated 33.9% of the Portfolio’s sales in 2013. Included in the transportation sector are 22 SOEs, which to-gether generated 30.3% of 2013 total net sales. All other sectors cumulatively included 56 en-terprises, which together accounted for 16.5% of the Portfolio’s sales. The chart on the right shows the number of enterprises in the sectors and each sector’s 2013 net sales (the size of the circles matches net sales).
The average headcount of all SOEs in 2013 con-stituted over 1.3 million employees, out of which 71.8% (or 924 thousand employees) were em-ployed by the Portfolio SOEs. The average head-count of the Portfolio in 9M14 constituted 904 thousand employees. More than half (55.7%) of the workforce was employed in the transporta-tion sector, with Ukrzaliznytsia being the largest employer representing 38.7% of the Portfolio workforce in 9M14.
Compared to 2013, over 9M14 the number of employees dropped in almost all sectors (by 20.2 thousand employees or 2.2% on average). The largest decrease in employment oc-curred in the transportation sector, driven by Ukrposhta (5.8 thousand employees or 6.2%) and Roads of Ukraine (3.5 thousand employees or 12%). The largest growth of em-ployee headcount — from 6.5 thousand to 8.6 thousand — was observed in the Ukrainian Sea Ports Administration (the transportation sector).
The following tables contain summarised financial information of the Portfolio SOEs based on their financial statements.
Fig.014. SOEs by Sector Source: SOEs information, Ministry of Economic Development and Trade of Ukraine
44
77
69
811
7 8
4
-10
10
20
30
40
50
60
70
80
90
-5 10 15 20 25 30
Net sales (2013, UAH bn)
Number of enterprises
Electricity Oil&Gas Transportation
Machine Building Chemicals
Coal Mining Other
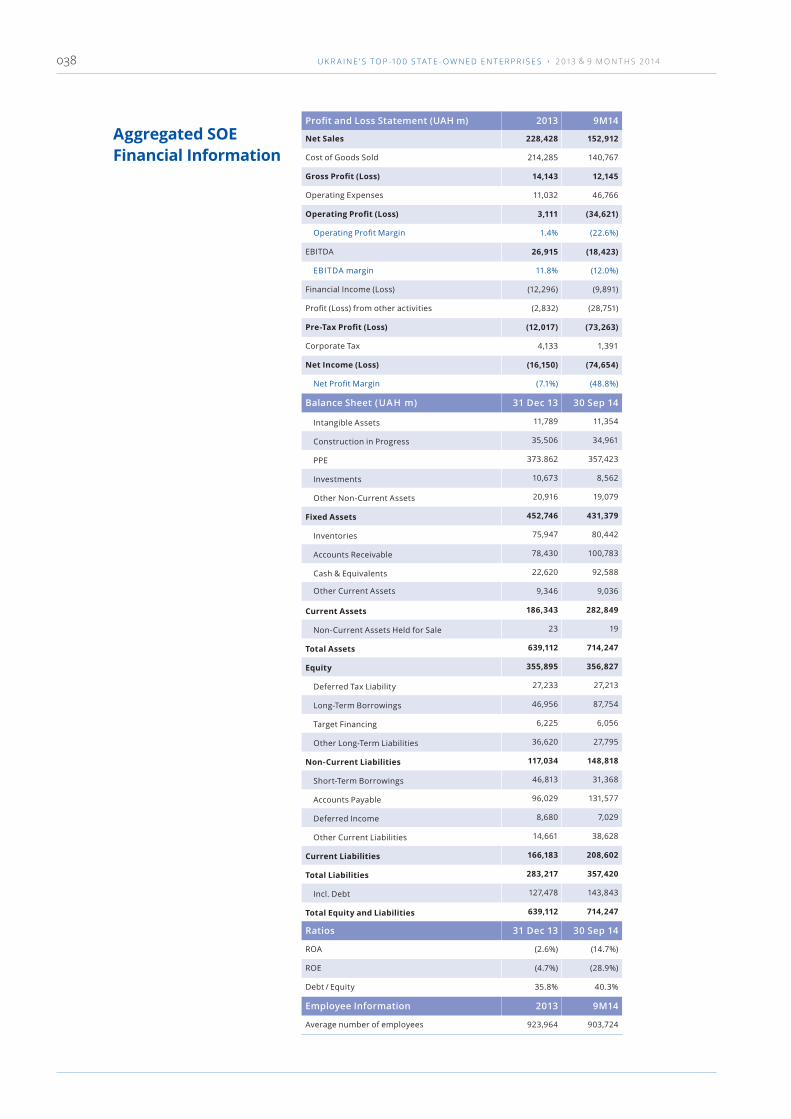
U K R A I N E ’ S T O P -1 0 0 S TAT E - O W N E D E N T E R P R I S E S › 2 0 1 3 & 9 M O N T H S 2 0 1 4038
Profit and Loss Statement (UAH m) 2013 9M14
Net Sales 228,428 152,912
Cost of Goods Sold 214,285 140,767
Gross Profit (Loss) 14,143 12,145
Operating Expenses 11,032 46,766
Operating Profit (Loss) 3,111 (34,621)
Operating Profit Margin 1.4% (22.6%)
EBITDA 26,915 (18,423)
EBITDA margin 11.8% (12.0%)
Financial Income (Loss) (12,296) (9,891)
Profit (Loss) from other activities (2,832) (28,751)
Pre-Tax Profit (Loss) (12,017) (73,263)
Corporate Tax 4,133 1,391
Net Income (Loss) (16,150) (74,654)
Net Profit Margin (7.1%) (48.8%)
Balance Sheet (UAH m) 31 Dec 13 30 Sep 14
Intangible Assets 11,789 11,354
Construction in Progress 35,506 34,961
PPE 373.862 357,423
Investments 10,673 8,562
Other Non-Current Assets 20,916 19,079
Fixed Assets 452,746 431,379
Inventories 75,947 80,442
Accounts Receivable 78,430 100,783
Cash & Equivalents 22,620 92,588
Other Current Assets 9,346 9,036
Current Assets 186,343 282,849
Non-Current Assets Held for Sale 23 19
Total Assets 639,112 714,247
Equity 355,895 356,827
Deferred Tax Liability 27,233 27,213
Long-Term Borrowings 46,956 87,754
Target Financing 6,225 6,056
Other Long-Term Liabilities 36,620 27,795
Non-Current Liabilities 117,034 148,818
Short-Term Borrowings 46,813 31,368
Accounts Payable 96,029 131,577
Deferred Income 8,680 7,029
Other Current Liabilities 14,661 38,628
Current Liabilities 166,183 208,602
Total Liabilities 283,217 357,420
Incl. Debt 127,478 143,843
Total Equity and Liabilities 639,112 714,247
Ratios 31 Dec 13 30 Sep 14
ROA (2.6%) (14.7%)
ROE (4.7%) (28.9%)
Debt / Equity 35.8% 40.3%
Employee Information 2013 9M14
Average number of employees 923,964 903,724
Aggregated SOE Financial Information

O v E R v I E W O f P O R T f O l I O R E S U lT S 039
Book Value of AssetsAs of 30 September 2014, the total book value of the Portfolio assets amounted to UAH 714.2bn — an increase of 11.8% compared to end-2013. The increase was pri-marily driven by the growth of the reported book value of assets in the oil & gas sec-tor (UAH 64.5bn or 37.9%), whereas for other sectors there were no major changes. In 9M14, in the oil & gas sector, Naftogaz of Ukraine reported UAH 60bn of net losses, which was offset by a share capital increase for approximately the same amount. The state usually covers losses of Naftogaz of Ukraine with regular share capital increases, issuing domestic bonds which the company sells and uses the proceeds to buy gas.
An increase of the book value of assets was also reported in the food & agriculture and chemi-cals sectors. In the former, the increase consti-tuted UAH 9.3bn (34.6%), whereas the latter re-ported an increase of UAH 1.2bn (12.5%). In the food & agriculture sector, the negative effect of UAH 7.4bn from the revaluation of a 1.5bn USD denominated loan of the State Food and Grain Corporation of Ukraine (SFGCU) was almost fully offset by the positive effect from the revaluation of foreign currency denominated cash balances, as well as by an increase in the company’s ac-counts receivable and inventory balances, thus, resulting in an overall increase of the reported book value of assets of SFGCU by UAH 6.9bn. Another contributor was the Agrarian Fund, which increased assets by UAH 2.5bn.
An increase of the book value of assets in the chemicals sector was due to working capi-tal movements (i.e. accounts receivable and accounts payable), with the Odesa Portside Plant being the main contributor.
Equity and DebtApart from the oil & gas sector, all other sectors reported a decrease in the book value of equity during 9M14 due to loss-making performances during that period. An increase in the equity of Naftogaz of Ukraine in the oil & gas sector (due to a share capital increase) offset the cumulative negative change in other sectors keeping the aggregate equity of the Portfolio as of 30 September 2014 almost at the same level as it was on 30 December 2013.
The largest decrease in the equity value (by 10% or UAH 8.1bn) was recorded in the trans-portation sector, mainly due to losses reported by Ukrzaliznytsia (UAH 8.2bn in 1H14), Ukrkosmos (UAH 1.4bn in 9M14), Roads of Ukraine (UAH 150 m) and Kyiv Boryspil Airport (UAH 44 m).
In the electricity sector, the reported value of equity decreased by UAH 4.3bn (or by 2.2%). Although the performance of the electricity sector was positively influenced by higher tariffs approved for Energoatom and Ukrhidroenergo, the effect was not sufficient to cover the relatively high depreciation charge and F/X losses on the revaluation of USD denominated loans, leading to reported losses of UAH 3.6bn in 9M14.
Fig.015. Assets (UAH bn) Source: SOEs information, Ministry of Economic Development and Trade of Ukraine
252
253
169
233
131
130
31 Dec 2013
30 Sep 2014
Electricity Oil & Gas
Transportation Food & Agriculture
Machine Building Chemicals
Coal Mining Other
714
639

U K R A I N E ’ S T O P -1 0 0 S TAT E - O W N E D E N T E R P R I S E S › 2 0 1 3 & 9 M O N T H S 2 0 1 4040
During 9M14 the total debt of the Portfolio grew by 12.8% from UAH 127.5bn as of 31 De-cember 2013 to UAH 143.8bn as of 30 September 2014. The aggregate debt-to-equity ratio of the Portfolio increased from 35.8% to 40.3%. The largest debt was held by enterprises in the oil & gas sector, in particular Naftogaz of Ukraine, with an average sector debt-to-equity ratio of 72.5% as of 30 September 2014.
The debt of Ukrzaliznytsia, in the transportation sector, constituted UAH 28.9bn 3 (a 42.8% increase compared to end-2013) which comprised 20.1% of the aggregate Portfolio debt as of 30 September 2014.
The debt in the food & agriculture sector rose by 61.5% to UAH 19.7bn. This increase was mostly attributable to the revaluation of the USD denominated loan of SFGCU. Leverage in the machine building sector also increased with the aggregated debt going from UAH 7.8bn as of end-2013 to UAH 9.9bn as of 30 September 2014. The increase was associated with long-term financing attracted by Pivdenmash and Pivdenne Design Bureau to replen-ish their working capital.
3 Includes 1H14 IFRS data for Ukrzaliznytsia as no consolidated information was available for 9M14
Fig.017. Debt (UAH bn) Source: SOEs information, Ministry of Economic Development and Trade of Ukraine
59
50
27
38
12
20
12
14
8
10
5
6
31 December 2013
30 September 2014
Oil & Gas Transportation Food & Agriculture Electricity Machine Building Coal Mining Chemicals Other
143.8
127.5
Fig.016. Change in Equty of the SOE Portfolio by Sector (UAH m) Source: SOEs information, MoEDT
31 D
ec 2
013
Elec
tric
ity
Oil
& G
as
Tran
spor
tatio
n
Food
& A
gric
ultu
re
Mac
hine
Bui
ldin
g
Chem
ical
s
Coal
Min
ing
Oth
er
30 S
ep 2
014

O v E R v I E W O f P O R T f O l I O R E S U lT S 041
Net SalesIn 9M14, the total sales revenue of the SOE Port-folio amounted to UAH 152.9bn and increased by c. 7.2% compared to the same period of the prior year. Sales growth was posted in all sectors except for oil & gas, which contracted by 4.6% (UAH 2.1bn) in 9M14 vs. 9M13 due to a decreased volume of gas sales to domestic customers as well as decreased volumes of gas transported through Ukraine to the EU and the CIS.
In the transportation sector, Roads of Ukraine de-creased sales by UAH 1.1bn to UAH 1.3bn in 9M14. This drop was fully offset by contribution of the Ukrainian Sea Ports Administration, which dem-onstrated the most rapid sales growth within the sector (by UAH 1.8bn in 9M14 vs. 9M13).
In the food & agriculture sector, the State Food and Grain Corporation of Ukraine reported 9M14 sales of UAH 4.1bn (2.5 times higher compared to 9M13), benefiting from higher grain export volumes and UAH devaluation. The Agrarian Fund launched its operations in 4Q13 and reported 9M14 net sales of almost UAH 2.3bn.
In the electricity sector, Energoatom increased sales by 32% year over year to UAH 16.5bn in 9M14 due to higher output and an increase in tariffs.
In 9M14, the transportation, electricity, food & agriculture and machine building sectors were profitable at the EBITDA level. The chemicals sector improved its EBITDA perfor-mance during the period, but still reported negative aggregate EBITDA of UAH 35.2bn for 9M14. The overall Portfolio performance in terms of EBITDA was adversely affected by the negative results of Naftogaz of Ukraine in the oil & gas sector, which dropped the Port-folio aggregated EBITDA from a positive 2.7bn in 9M13 to a negative 18.4bn in 9M14.
Fig.018. Net Sales (UAH m) Source: SOEs information, Ministry of Economic Development and Trade of Ukraine
2,960
6,577
8,446
7,482
7,518
36,674
45,984
37,270
2,857
5,872
3,835
5,230
6,994
32,624
48,179
37,040
Other
Chemicals
Food & Agriculture
Coal Mining
Machine Building
Electricity
Oil & Gas
Transportation
9M13
9M14
Fig.019. Change in Net Sales of the SOE Portfolio by Enterprise (UAH m) Source: SOEs information, Ministry of Economic Development and Trade of Ukraine

U K R A I N E ’ S T O P -1 0 0 S TAT E - O W N E D E N T E R P R I S E S › 2 0 1 3 & 9 M O N T H S 2 0 1 4042
Despite the positive performance of certain sec-tors in terms of EBITDA, in 9M14 all sectors were loss-making at the net income level. In machine building, six out of ten enterprises included into the Portfolio reported profits or were breakeven in 9M14. Antonov, Turboatom, Electrovazhmash, Hartron, Elektrovozobuduvannya and Kommu-nar reported an aggregate profit of UAH 980m. However, this positive result was more than off-set by Pivdenmash and Pivdenne Design Bureau’s losses (almost UAH 2.5bn combined) resulting in the sector’s cumulative loss for the period of UAH 1.7bn.
In the food & agriculture sector, only four com-panies (out of the ten included in the Portfolio) recorded a net profit in 9M14: the Agrarian Fund — UAH 466m, Ukrspyrt — UAH 96m, Artemsil — UAH 138m and the State Reserve Seed Fund of Ukraine — UAH 1m. The largest loss came from the State Food and Grain Corporation of Ukraine from the revaluation of the USD denominated loan attracted from the Export-Import Bank of China in 2012. The sector reported a net loss for the period of UAH 254m.
Although the electricity sector reported the sec-ond largest (after transportation) EBITDA of UAH 8.1bn for 9M14, its net income performance dete-riorated by UAH 1.3bn during 9M14; the aggregate
sector reported loss for the period constituted UAH 3.6bn. On the EBITDA level, the sector is dominated by three companies: nuclear power producer Energoatom, hydroelectric power producer Ukrhidroenergo and high-voltage transmission operator Ukrenergo. Their EBITDA performance was driven by higher tariffs approved for Energoatom and Ukrhidroenergo, while the bottom line was depressed by Energoatom’s UAH 3.8bn net loss caused by a relatively high depreciation charge (UAH 6.3bn in 9M14) and losses on the revaluation of USD denominated loans.
The transportation sector, which had the largest positive EBITDA in 9M14 (UAH 9.7bn), ended up with a net loss of UAH 7.1bn. The financial performance of Ukrzaliznytsia, by far the largest company in the sector, turned negative in 1H14 (demonstrating UAH 8.2bn of losses, compared to a net income of UAH 517m in 1H13). The company reported a heavy net loss after booking a non-cash loss of UAH 7.2bn from the revaluation of foreign cur-rency denominated debt. Another contributor to the sector’s deteriorated performance was Ukrkosmos which reported a net loss of UAH 1.4bn in 9M14 (vs. UAH 10m net loss in 9M13).
Fig.020. EBITDA (UAH m) Source: SOEs information, Ministry of Economic Development and Trade of Ukraine
145
(35)
1,629
(681)
1,065
8,055
(38,372)
9,772
216
(490)
594
(65)
1,014
6,006
(13,305)
8,768
Other
Chemicals
Food & Agriculture
Coal Mining
Machine Building
Electricity
Oil & Gas
Transportation
9M13 9M14

O v E R v I E W O f P O R T f O l I O R E S U lT S 043
Operating EfficiencyBeing negative in many instances, the Return on Equity (ROE) of SOEs appears to be a signal, indicating that in the current economic environment, citizens of Ukraine, who are indirect owners of all state assets, are losing, rather than gaining, value. The inferior per-formance of SOEs if judged based on the ROE requires analysis of its underlying factors. Those are likely to be poor management and/or an ineffective governance model of SOEs. The fact that for some of the reviewed sectors, the ROE was positive in 2013 but became negative in 9M14 (mainly due to significant F/X losses on the revaluation of foreign cur-rency denominated loans) can be an indicator of a suboptimal asset financing structure of SOEs. In any case, further steps to address the problems of the SOE sector performance are not possible without a comprehensive analysis of individual companies, which is part of the anticipated reform of SOEs.
Period Earnings per employee*,
UAH ‘000
Assets per employee,
UAH ‘000
EBITDA, UAH million
Operating expenses,
UAH million
D/E ROE* Net debt/ EBITDA*
All SOEs 9M14 243 790 (18,423) 46,766 40.3 % (30.8 %) (2.3)
2013 247 692 26,915 11,032 35.8 % (4.7 %) 3.9
Electricity 9M14 557 2,884 8,055 2,553 7.5 % (2.5 %) 1.2
2013 494 2,818 8,828 1,501 5.9 % (0.8 %) 1.2
Oil & Gas 9M14 345 1,315 (38,372) 42,713 72.5 % (161.7 %) 0.3
2013 434 947 100 6,821 115.8 % (29.4 %) 568.2
Transportation 9M14 130 258 9,772 (62) 50.2 % (19.6 %) 2.1
2013 134 254 16,746 1,244 31.9 % 3.0 % 1.2
Food & Agriculture 9M14 711 2,221 1,628 143 196.7 % (3.3 %) 1.3
2013 492 1,610 518 1,122 114.5 % 1.8 % 3.3
Machine Building 9M14 202 494 1,064 844 212.1 % (43.5 %) 5.3
2013 203 464 1,411 1,068 116.1 % 3.3 % 3.8
Chemicals 9M14 831 845 (35) 591 2,416.7 % (119.0 %) (83.8)
2013 687 706 (1,018) 695 764.7 % (122.4 %) (2.7)
Coal Mining 9M14 240 262 (681) (489) (162.3 %) 53.0 % (6.1)
2013 185 260 (138) (1,869) (224.7 %) 46.9 % (36.0)
Real Estate 9M14 158 6,125 56 36 27.3 % (1.0 %) 16.5
2013 190 5,032 83 53 28.4 % (1.3 %) 15.4
Other 9M14 243 431 89 436 21.3 % (7.4 %) 2.1
2013 226 407 386 397 19.6 % (11.4 %) 1.1
* 9M14 data annualised
Sector
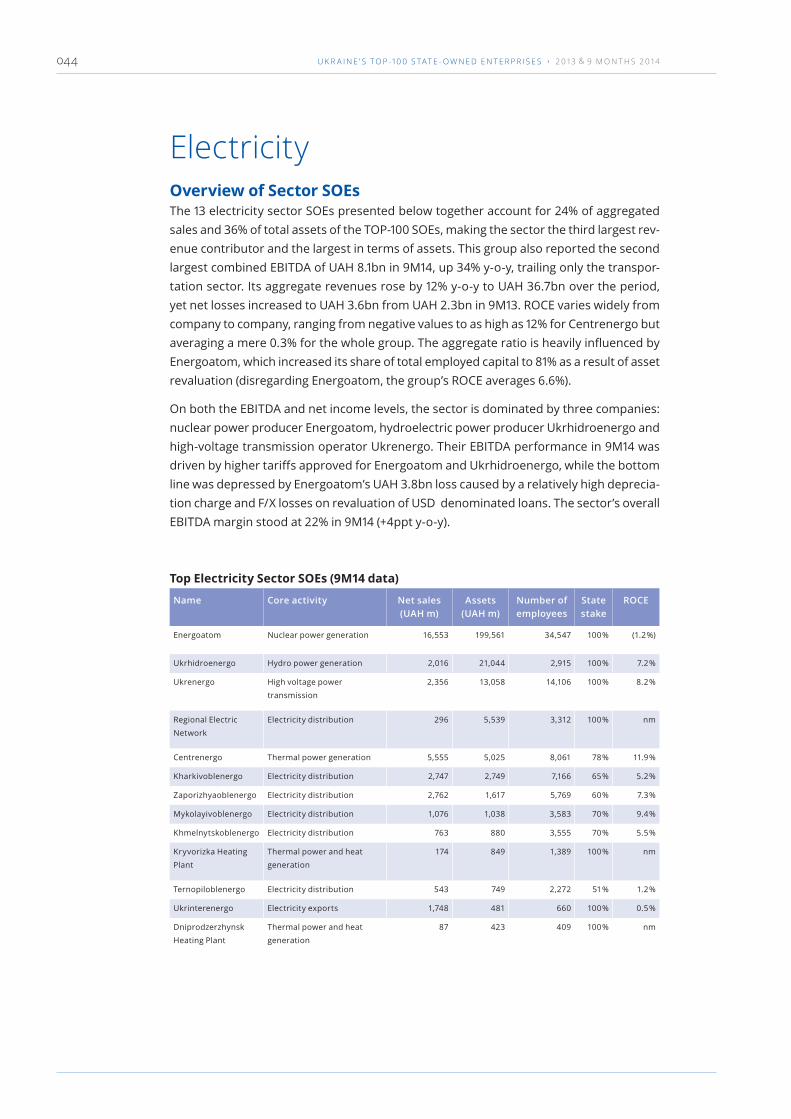
U K R A I N E ’ S T O P -1 0 0 S TAT E - O W N E D E N T E R P R I S E S › 2 0 1 3 & 9 M O N T H S 2 0 1 4044
ElectricityOverview of Sector SOEsThe 13 electricity sector SOEs presented below together account for 24% of aggregated sales and 36% of total assets of the TOP-100 SOEs, making the sector the third largest rev-enue contributor and the largest in terms of assets. This group also reported the second largest combined EBITDA of UAH 8.1bn in 9M14, up 34% y-o-y, trailing only the transpor-tation sector. Its aggregate revenues rose by 12% y-o-y to UAH 36.7bn over the period, yet net losses increased to UAH 3.6bn from UAH 2.3bn in 9M13. ROCE varies widely from company to company, ranging from negative values to as high as 12% for Centrenergo but averaging a mere 0.3% for the whole group. The aggregate ratio is heavily influenced by Energoatom, which increased its share of total employed capital to 81% as a result of asset revaluation (disregarding Energoatom, the group’s ROCE averages 6.6%).
On both the EBITDA and net income levels, the sector is dominated by three companies: nuclear power producer Energoatom, hydroelectric power producer Ukrhidroenergo and high-voltage transmission operator Ukrenergo. Their EBITDA performance in 9M14 was driven by higher tariffs approved for Energoatom and Ukrhidroenergo, while the bottom line was depressed by Energoatom’s UAH 3.8bn loss caused by a relatively high deprecia-tion charge and F/X losses on revaluation of USD denominated loans. The sector’s overall EBITDA margin stood at 22% in 9M14 (+4ppt y-o-y).
Top Electricity Sector SOEs (9M14 data)
Name Core activity Net sales (UAH m)
Assets (UAH m)
Number of employees
State stake
ROCE
Energoatom Nuclear power generation 16,553 199,561 34,547 100 % (1.2 %)
Ukrhidroenergo Hydro power generation 2,016 21,044 2,915 100 % 7.2 %
Ukrenergo High voltage power
transmission
2,356 13,058 14,106 100 % 8.2 %
Regional Electric
Network
Electricity distribution 296 5,539 3,312 100 % nm
Centrenergo Thermal power generation 5,555 5,025 8,061 78 % 11.9 %
Kharkivoblenergo Electricity distribution 2,747 2,749 7,166 65 % 5.2 %
Zaporizhyaoblenergo Electricity distribution 2,762 1,617 5,769 60 % 7.3 %
Mykolayivoblenergo Electricity distribution 1,076 1,038 3,583 70 % 9.4 %
Khmelnytskoblenergo Electricity distribution 763 880 3,555 70 % 5.5 %
Kryvorizka Heating
Plant
Thermal power and heat
generation
174 849 1,389 100 % nm
Ternopiloblenergo Electricity distribution 543 749 2,272 51 % 1.2 %
Ukrinterenergo Electricity exports 1,748 481 660 100 % 0.5 %
Dniprodzerzhynsk
Heating Plant
Thermal power and heat
generation
87 423 409 100 % nm

E l E c T R I c I T y 045
Electricity Sector SOEs’ Aggregated FinancialsP&L (UAH m) 2013 9M14 Balance Sheet (UAH m) 2013 9M14
Net Sales 44,206 36,674 Total Assets 252,048 253,013
Cost of Goods Sold 43,931 33,689 Fixed Assets 221,306 218,394
Gross Profit (Loss) 275 2,985 PPE 204,508 199,147
EBITDA 8,828 8,055 Current Assets 30,740 34,617
Depreciation 10,054 7,623 Accounts Receivable 16,530 19,662
Operating Profit (Loss) (1,226) 432 Cash & Equivalents 929 2,012
Financial Income (Loss) (812) (687) Total Liabilities & Equity 252,048 253,013
Pre-Tax Profit (Loss) (1,972) (3,543) Total Liabilities 54,937 60,190
Corporate Tax (445) 74 Accounts Payable 12,656 14,809
Net income (Loss) (1,527) (3,617) Debt 11,589 14,438
Dividends paid na na Equity 197,111 192,822
Ratios 2013 9M14
Sales Growth ( %, y-o-y) (5.4 %) 12.4 %
EBITDA Margin ( %) 20.0 % 22.0 %
Net income Margin ( %) (3.5 %) (9.9 %)
Debt/Equity ( %) 5.9 % 7.5 %
Net Debt/EBITDA (x) 1.2 1.2
ROE ( %) (0.8 %) (2.5 %)
ROA ( %) (0.6 %) (1.9 %)
ROCE ( %) (0.6 %) 0.3 %
Structure and RegulationWith generating capacity of 54 gigawatts (GW) (excluding Crimea), the Ukrainian power sector ranks 17th globally and 2nd in the CIS/CEE region after Russia. The sector gained its modern form in 1995 after the state broke up vertically integrated energy companies into separate entities responsible for power generation, transmission and distribution, mod-elling this structure on Great Britain’s Power Pool created in the early 1990s. The reform was aimed at encouraging competition in the industry by separating natural-monopoly electricity distributors from generators.
As part of this reform, the Government created nuclear power operator Energoatom, hydropower plant operator Ukrhidroenergo, four thermal power generating companies, 28 regional electricity distribution companies (also called oblenergos) and a high-voltage grid operator. These companies were coordinated by state-owned wholesale market op-erator Energorynok and regulated by government agencies. In practice, the new system only helped to foster price competition between thermal power generating companies (GenCos) and large combined heat and power (CHP) plants, encouraging them to compete for load volumes awarded by the dispatch centre. Energoatom’s power plants, given their much lower production costs, began to operate as base-load producers. Finally, hydro-power plants, whose electricity is even cheaper, were mostly used for load regulation and peak shaving.
Virtually all electricity produced in Ukraine is sold via Energorynok. This state-owned in-termediary pools electricity from producers, averages its price and sells it to regional distributors and independent suppliers.

U K R A I N E ’ S T O P -1 0 0 S TAT E - O W N E D E N T E R P R I S E S › 2 0 1 3 & 9 M O N T H S 2 0 1 4046
Meanwhile, the state continues to exercise heavy control of the electricity sector through the following bodies:
‣ The Ministry of Energy and Coal Industry of Ukraine is the main executive au-thority overseeing and regulating the power sector. The ministry is a policy-setting body responsible for strategic development and production, consumption, CAPEX and capacity planning for energy and fuels, as well as drafting and implementation of sector reforms.
‣ The National Commission for Energy and Public Utilities Regulation (NERC) is the main licensing and tariff setting body for producers and suppliers of electricity and heat as well as for companies engaged in oil and gas transportation, storage and supply. In the electricity sector, the NERC used to set retail tariffs for all con-sumers except households based on projected electricity prices for the oblenergos and independent electricity suppliers. Starting from 1 April 2015, the NERC also sets prices for households. Household prices remain heavily subsidized and are not correlated with actual production and delivery costs, but their gradual upward revision is planned during 2015-2017 (the first increase already implemented on 1 April 2015).
‣ Energorynok, the state-owned wholesale electricity market operator, handles over 98% of domestic electricity sales. All electricity produced by power plants with installed capacity of 20 megawatt (MW) and higher (except oblenergo-owned CHP plants) is sold via Energorynok. Energorynok essentially acts as a clearing cen-ter that buys electricity from generators, calculates the average market price, sells electricity to distributing companies and independent suppliers, collects payments and distributes them among power producers.
Fig.021. Ukrainian Power Market Structure Source: Dragon Capital

E l E c T R I c I T y 047
‣ Ukrenergo operates the domestic high voltage transmission system and cross-border transmission lines. It controls real-time electricity output and monitors power generators’ operational generating units, fuel stocks and production effi-ciency, balancing electricity consumption with production.
Consumption
Electricity consumption declined at an accelerated pace last year, falling 4.7% y-o-y to 134 terawatt hours (TWh), a level last seen in 2009. Industrial demand shrank 6.7% y-o-y to 61 TWh (45% of total consumption), with the machine-building (–13% to 7.3 TWh), fuel (–16% to 4.3 TWh) and chemical (–16% to 3.8 TWh) sectors responsible for the bulk of the decline, given their output was suffering from Russian trade restrictions and military hostilities in the east. The metallurgical industry cut consumption by a modest 2.7% y-o-y thanks to an almost 25% increase in production of ferroalloys, which requires plenty of electricity to operate electric arc furnaces. At the same time, households increased demand by 1.1% y-o-y to 39 TWh (29% of total consumption).
The pace of decline in consumption accelerated in the second half of 2014 (2H14) as the military conflict in the east of Ukraine escalated. In the fourth quarter of 2014 (4Q14), it was compounded by rolling blackouts caused by growing coal shortages at thermal pow-er plants relying on coal mined in the conflict affected area. Total electricity consumption thus fell 6% y-o-y to 35 TWh in 4Q14, with industrial demand down 8.5%, transportation demand sliding 15% but household consumption strengthening 2% y-o-y.
GenerationGenCos account for the largest share of electricity generating capacity in Ukraine (27.6 GW or 52% of total), followed by nuclear power producers (26%) and hydropower plants (10%). Ukraine also operates several renewable energy sources, including 371 MW of wind power capacity and 563 MW of solar power capacity.
Fig.022. Net Electricity Consumption in Ukraine (1994–2014) Source: Ministry of Energy and Coal Industry of Ukraine, Dragon Capital estimates
Consumption per Capita (lhs) Consumption (rhs) GDP (rhs)
1994
1995
1996
1997
1998
1999
2000
2001
2002
2003
2004
2005
2006
2007
2008
2009
2010
2011
2012
2013
2014
4.000
3.500
3.000
2.500
2.000
1.500
1.000
500
0
160
140
120
100
80
60
40
20
0
Consumption, real GDP (’93 base 100)Consumption per capita (kWh)

U K R A I N E ’ S T O P -1 0 0 S TAT E - O W N E D E N T E R P R I S E S › 2 0 1 3 & 9 M O N T H S 2 0 1 4048
In 2014, thermal power plants (coal-fired GenCos and CHP plants, which are mostly gas-fired) accounted for 45.6% of total electricity output (vs. 49.9% in 2013). Prior to the mili-tary conflict in the east of the country, thermal GenCos reported solid production figures due to the industry regulator loading them on a priority basis in order to stimulate de-mand for domestically produced coal and thereby support coal miners. However, this was
Fig.023. Electricity Consumption (2014) Source: Ministry of Energy and Coal Industry of Ukraine
Industry (45.3%)
Households (29.0%)
Utilities (12.2%)
Transport (5.4%)
Agriculture (2.6%)
Others (5.4%)
Fig.024. Generating Capacity Source: Ukrenergo
GenCos, 27,6 GW (51.0%)
Other thermal, 6,5 GW (12.0%)
Nuclear, 13,8 GW (25.5%)
Hydro, 5,5 GW (10.1%)
Renewable, 0,8 GW (1.5%)
Fig.025. Electricity Production (2014) Source: Ministry of Energy and Coal Industry of Ukraine
GenCos, 68 TWh (37.5%)
Other Thermal, 15 TWh (8.1%)
Nuclear, 88 TWh (48.5%)
Hydro, 9 TWh (5.0%)
Renewables, 2 TWh (1.0%)
Fig.026. Capacity Utilization (2014) Source: Dragon Capital estimates
27%25%
73%
19%
0%
10%
20%
30%
40%
50%
60%
70%
80%

E l E c T R I c I T y 049
no longer the case in 2H14 (especially in 4Q14) as military hostilities in the coal-rich east territories led to severe fuel shortages at thermal GenCos.
Ukraine’s four nuclear power plants operate 15 reactors with total installed capacity of 13,835 MW. Producing relatively cheap electricity, these plants operate as base-load pro-ducers and are not actively regulated on a daily basis. In 2014, their combined capacity utilization increased 4ppt to 73% as they substituted for production losses at coal-fired GenCos. Domestic hydropower generating capacity consists of 101 power units with total capacity of 4,610 MW, built along the Dnipro and Dniester rivers, and pumped storage plants with installed capacity of 862 MW. Their 2014 output slid by 36% y-o-y due to low river water levels.
The thermal power segment is dominated by five large companies, the Big Five: Dnipro-energo, Zakhidenergo and Vostokenergo, all owned by DTEK; Donbasenergo, privatized in 2013; and Centrenergo, the only remaining state-owned GenCo. The Big Five operate 17 coal and gas-fired power plants and account for 81% of total thermal power generating capacity and 79% of thermal power output.
Thermal GenCos and a number of large CHP plants compete for load volumes on a fuel-cost basis, with the industry regulator progressively loading cheaper to more expensive generating units until all current demand is met. Still, the final tariff awarded to GenCos depends largely on their so called «maneuverability» (or flexibility to decrease production on demand) and capacity reserve (ability to increase production during peak hours), with underlying fees set by the NERC.
In addition to the Big Five group, the thermal power segment includes numerous CHP plants as well as Kyivenergo, Ukraine’s largest fully integrated utility which operates two CHP plants with installed capacity of 1,200 MW and electricity distribution network in the city of Kyiv. The company’s CHP units are mostly gas-fired and operate according to a
Fig.027. Ukraine’s Electricity Production (1994–2014; TWh) Source: Ministry of Energy and Coal Industry of Ukraine
0
50
100
150
200
250Nuclear Thermal Hydro
1994
1995
1996
1997
1998
1999
2000
2001
2002
2003
2004
2005
2006
2007
2008
2009
2010
2011
2012
2013
2014
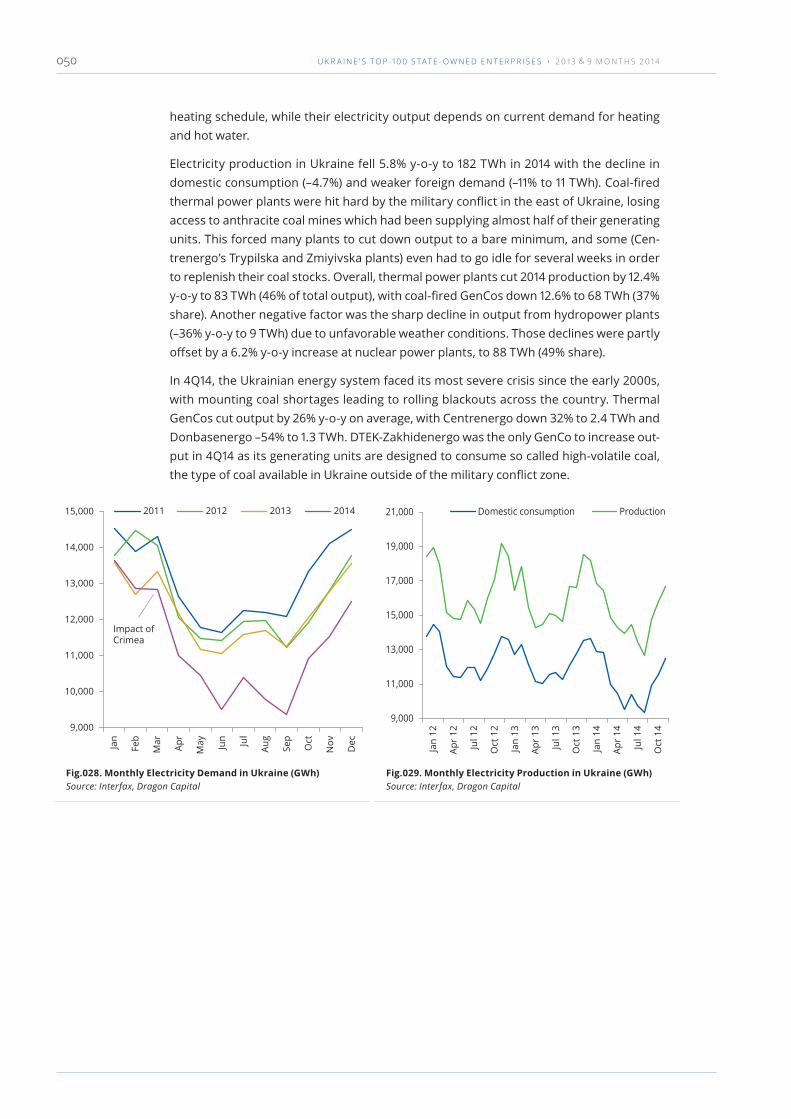
U K R A I N E ’ S T O P -1 0 0 S TAT E - O W N E D E N T E R P R I S E S › 2 0 1 3 & 9 M O N T H S 2 0 1 4050
heating schedule, while their electricity output depends on current demand for heating and hot water.
Electricity production in Ukraine fell 5.8% y-o-y to 182 TWh in 2014 with the decline in domestic consumption (–4.7%) and weaker foreign demand (–11% to 11 TWh). Coal-fired thermal power plants were hit hard by the military conflict in the east of Ukraine, losing access to anthracite coal mines which had been supplying almost half of their generating units. This forced many plants to cut down output to a bare minimum, and some (Cen-trenergo’s Trypilska and Zmiyivska plants) even had to go idle for several weeks in order to replenish their coal stocks. Overall, thermal power plants cut 2014 production by 12.4% y-o-y to 83 TWh (46% of total output), with coal-fired GenCos down 12.6% to 68 TWh (37% share). Another negative factor was the sharp decline in output from hydropower plants (–36% y-o-y to 9 TWh) due to unfavorable weather conditions. Those declines were partly offset by a 6.2% y-o-y increase at nuclear power plants, to 88 TWh (49% share).
In 4Q14, the Ukrainian energy system faced its most severe crisis since the early 2000s, with mounting coal shortages leading to rolling blackouts across the country. Thermal GenCos cut output by 26% y-o-y on average, with Centrenergo down 32% to 2.4 TWh and Donbasenergo –54% to 1.3 TWh. DTEK-Zakhidenergo was the only GenCo to increase out-put in 4Q14 as its generating units are designed to consume so called high-volatile coal, the type of coal available in Ukraine outside of the military conflict zone.
Fig.028. Monthly Electricity Demand in Ukraine (GWh) Source: Interfax, Dragon Capital
9,000
10,000
11,000
12,000
13,000
14,000
15,000 2011 2012 2013 2014
Impact of Crimea
Jan
Feb
Mar
Apr
May Jun Jul
Aug
Sep
Oct
Nov
Dec
Fig.029. Monthly Electricity Production in Ukraine (GWh) Source: Interfax, Dragon Capital
9,000
11,000
13,000
15,000
17,000
19,000
21,000 Domestic consumption Production
Jan
12
Apr
12
Jul 1
2
Oct
12
Jan
13
Apr
13
Jul 1
3
Oct
13
Jan
14
Apr
14
Jul 1
4
Oct
14
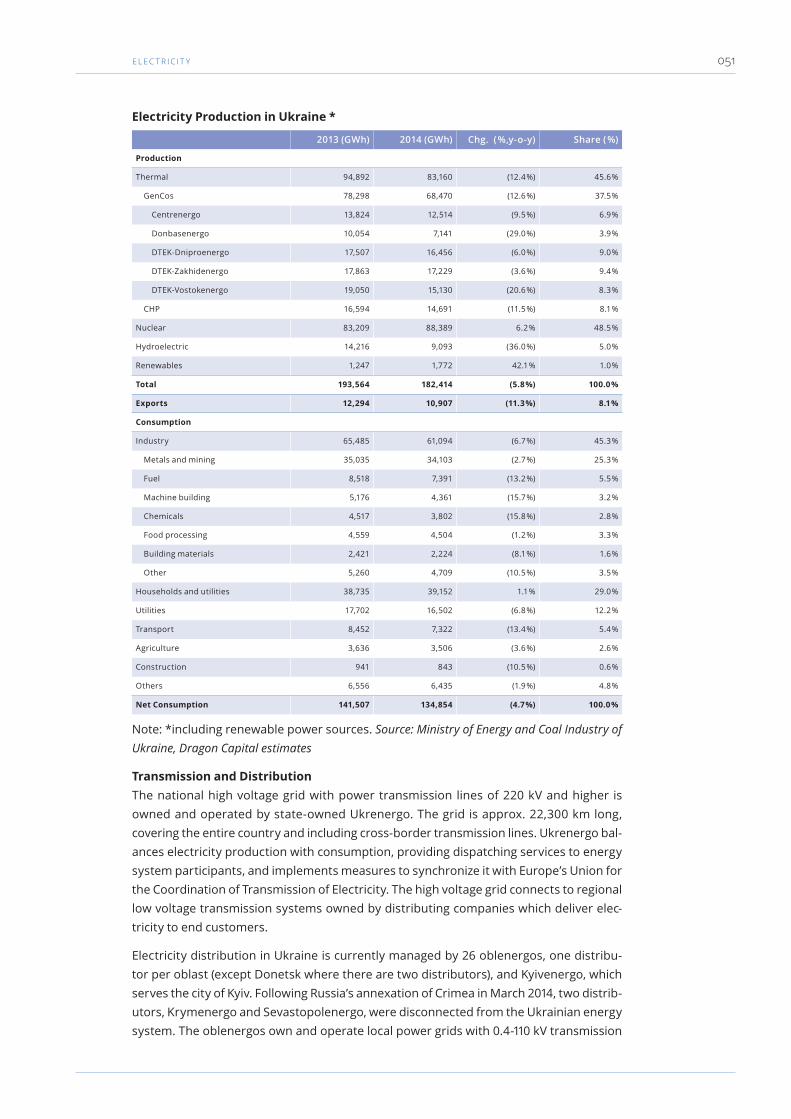
E l E c T R I c I T y 051
Electricity Production in Ukraine *
2013 (GWh) 2014 (GWh) Chg. ( %,y-o-y) Share ( %)
Production
Thermal 94,892 83,160 (12.4 %) 45.6 %
GenCos 78,298 68,470 (12.6 %) 37.5 %
Centrenergo 13,824 12,514 (9.5 %) 6.9 %
Donbasenergo 10,054 7,141 (29.0 %) 3.9 %
DTEK-Dniproenergo 17,507 16,456 (6.0 %) 9.0 %
DTEK-Zakhidenergo 17,863 17,229 (3.6 %) 9.4 %
DTEK-Vostokenergo 19,050 15,130 (20.6 %) 8.3 %
CHP 16,594 14,691 (11.5 %) 8.1 %
Nuclear 83,209 88,389 6.2 % 48.5 %
Hydroelectric 14,216 9,093 (36.0 %) 5.0 %
Renewables 1,247 1,772 42.1 % 1.0 %
Total 193,564 182,414 (5.8 %) 100.0 %
Exports 12,294 10,907 (11.3 %) 8.1 %
Consumption
Industry 65,485 61,094 (6.7 %) 45.3 %
Metals and mining 35,035 34,103 (2.7 %) 25.3 %
Fuel 8,518 7,391 (13.2 %) 5.5 %
Machine building 5,176 4,361 (15.7 %) 3.2 %
Chemicals 4,517 3,802 (15.8 %) 2.8 %
Food processing 4,559 4,504 (1.2 %) 3.3 %
Building materials 2,421 2,224 (8.1 %) 1.6 %
Other 5,260 4,709 (10.5 %) 3.5 %
Households and utilities 38,735 39,152 1.1 % 29.0 %
Utilities 17,702 16,502 (6.8 %) 12.2 %
Transport 8,452 7,322 (13.4 %) 5.4 %
Agriculture 3,636 3,506 (3.6 %) 2.6 %
Construction 941 843 (10.5 %) 0.6 %
Others 6,556 6,435 (1.9 %) 4.8 %
Net Consumption 141,507 134,854 (4.7 %) 100.0 %
Note: *including renewable power sources. Source: Ministry of Energy and Coal Industry of Ukraine, Dragon Capital estimates
Transmission and DistributionThe national high voltage grid with power transmission lines of 220 kV and higher is owned and operated by state-owned Ukrenergo. The grid is approx. 22,300 km long, covering the entire country and including cross-border transmission lines. Ukrenergo bal-ances electricity production with consumption, providing dispatching services to energy system participants, and implements measures to synchronize it with Europe’s Union for the Coordination of Transmission of Electricity. The high voltage grid connects to regional low voltage transmission systems owned by distributing companies which deliver elec-tricity to end customers.
Electricity distribution in Ukraine is currently managed by 26 oblenergos, one distribu-tor per oblast (except Donetsk where there are two distributors), and Kyivenergo, which serves the city of Kyiv. Following Russia’s annexation of Crimea in March 2014, two distrib-utors, Krymenergo and Sevastopolenergo, were disconnected from the Ukrainian energy system. The oblenergos own and operate local power grids with 0.4-110 kV transmission

U K R A I N E ’ S T O P -1 0 0 S TAT E - O W N E D E N T E R P R I S E S › 2 0 1 3 & 9 M O N T H S 2 0 1 4052
lines, transformer substations and switching and metering equipment. They buy elec-tricity from Energorynok for sale to end consumers as well as provide transmission ser-vices to independent power suppliers. Effectively operating as natural monopolies, the oblenergos are strictly regulated by the NERC and operate on a «cost plus» basis (i.e. the regulator sets retail tariffs for most oblenergos based on their expected costs, grid losses and CAPEX needs).
The largest regional distributors are Dniprooblenergo, Zaporizhyaoblenergo, Luhansk En-ergy Alliance, Service-Invest and Donetskoblenergo, all based in the heavily industrialized regions. Other oblenergos have a more diversified customer base with a higher share of households, non-industrial companies and agricultural consumers.
In 2014, the oblenergos bought 125.8 TWh of electricity from Energorynok (–4% y-o-y; 73% of Energorynok’s total sales) at an average tariff of UAH 546/MWh (+4% y-o-y). Their debt to Energorynok jumped by 42% to UAH 22bn, mostly due to heavy under-collection
Oblenergos: Key Statistics (2013)
Company
Stat
e st
ake
( %)
Cust
omer
s (‘0
00)
Are
a (‘0
00 k
m²)
Low
-vol
tage
Gri
d (k
m)
Tran
sfor
mer
C
apac
ity
(MW
)
Gri
d Lo
sses
( %
of
sale
s)
El. P
urch
ases
(G
Wh)
Mar
ket
Shar
e ( %
)
Sale
s (U
AH
m)
EBIT
DA
(UA
H m
)
NI (
UA
H m
)
1 Cherkasyoblenergo 46 % 625 20.9 37,915 3,796 11.9 % 2,501 2.01 % 1,309.7 57.9 4.1
2 Chernihivoblenergo - 564 31.9 37,768 3,063 14.8 % 1,939 1.56 % 1,024.9 106.9 83.2
3 Chernivtsioblenergo 25 % 342 8.1 16,876 1,463 18.0 % 1,523 1.22 % 6,634.9 62.0 18.8
4 Dniprooblenergo 25 % 1,507 31.9 58,700 10,843 4.4 % 23,068 18.55 % 15,833.7 580.2 89.8
5 Donetskoblenergo 25 % 1,841 15.8 71,555 11,619 14.7 % 9,926 7.98 % 5,490.0 799.7 199.1
6 Kharkivoblenergo 65 % 1,224 31.4 46,578 7,660 13.0 % 6,549 5.27 % 3,611.6 290.5 28.6
7 Khersonoblenergo - 465 28.5 29,632 3,731 15.3 % 2,787 2.24 % 1,442.7 98.7 0.8
8 Khmelnytskoblenergo 70 % 566 20.6 35,123 3,127 15.9 % 2,127 1.71 % 989.0 127.3 48.1
9 Kirovohradoblenergo - 464 24.6 31,320 3,608 13.9 % 2,022 1.63 % 1,042.0 184.4 15.5
10 Kyivenergo 25 % 1,041 0.8 11,380 5,886 7.9 % 9,641 7.75 % 13,350.6 1,530.0 992.3
11 Kyivoblenergo - 889 28.1 45,814 5,296 16.0 % 6,215 5.00 % 3,293.4 208.9 0.8
12 Luhansk Energy Alliance - 1,083 26.7 46,718 8,830 12.9 % 4,934 3.97 % 0.0 0.0 0.0
13 Lvivoblenergo - 925 21.8 40,141 4,801 14.8 % 4,219 3.39 % 2,194.2 244.8 (134.6)
14 Mykolayivoblenergo 70 % 492 24.6 29,344 3,361 12.3 % 2,628 2.11 % 1,361.9 48.1 17.1
15 Odesaoblenergo 25 % 981 33.6 41,504 5,508 14.0 % 6,591 5.30 % 3,275.4 511.6 0.8
16 Poltavaoblenergo - 736 28.8 44,444 3,994 8.3 % 2,996 2.41 % 3,356.2 197.5 93.0
17 Prykarpattyaoblenergo - 526 13.9 22,369 2,759 12.4 % 2,030 1.63 % 1,015.1 180.3 78.3
18 Rivneenergo - 414 20.1 26,721 2,378 13.7 % 1,800 1.45 % 861.7 116.7 4.9
19 Service Invest - 0.1 26.7 2,571 2,278 1.1 % 10,895 8.76 % 0.0 0.0 0.0
20 Sumyoblenergo 25 % 536 23.8 34,205 3,352 11.9 % 2,034 1.64 % 1,157.9 87.3 85.7
21 Ternopiloblenergo 51 % 410 13.8 23,937 2,099 17.8 % 1,507 1.21 % 712.4 80.0 13.1
22 Vinnytsiaoblenergo 25 % 774 26.5 46,366 3,722 14.9 % 2,716 2.18 % 1,220.7 110.2 61.2
23 Volynoblenergo 25 % 369 20.1 25,400 2,134 13.6 % 1,555 1.25 % 749.9 52.2 1.6
24 Zakarpattyaoblenergo 25 % 432 12.8 17,743 2,454 18.4 % 2,141 1.72 % 922.1 131.4 80.8
25 Zaporizhyaoblenergo 60 % 783 27 40,237 9,388 9.0 % 7,426 5.97 % 4,689.6 156.7 24.5
26 Zhytomyroblenergo - 590 29.8 37,176 3,420 14.6 % 2,603 2.09 % 1,371.7 201.6 53.0
Total/Average 18,579 593 901,537 120,570 12.9 % 124,373 100.00 % 76,911 6,165 1,860
Source: Companies, Energobusiness, Dragon Capital
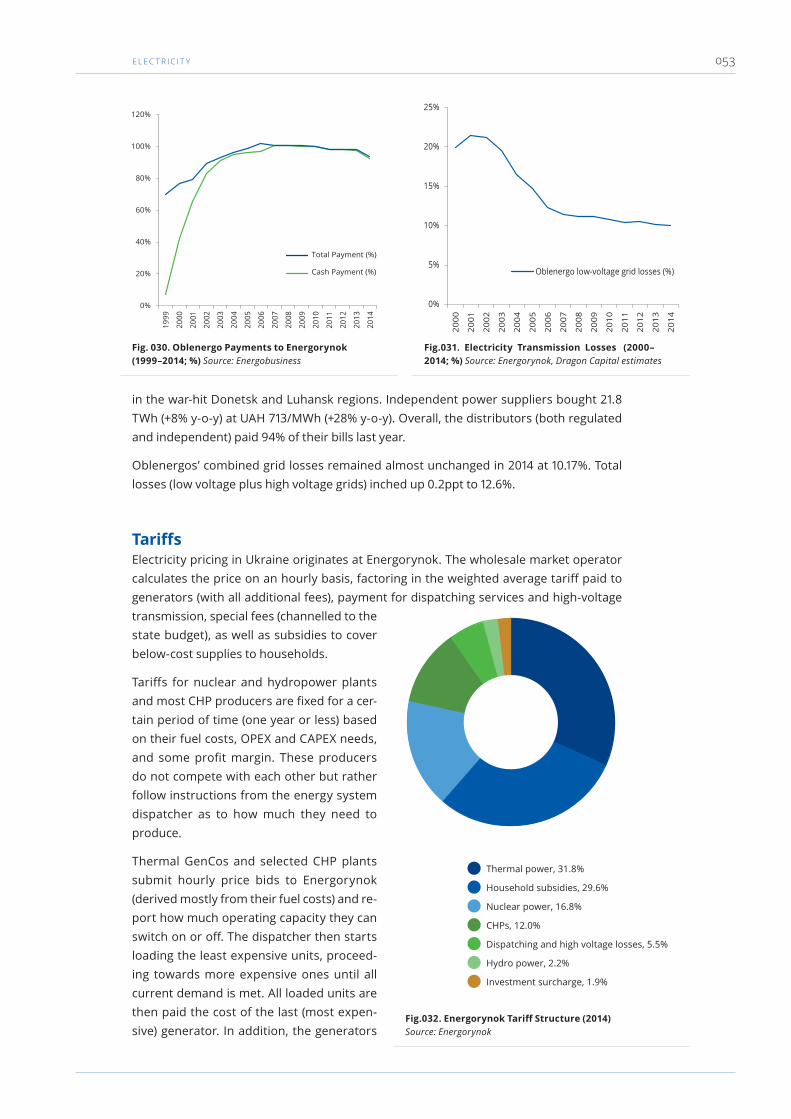
E l E c T R I c I T y 053
in the war-hit Donetsk and Luhansk regions. Independent power suppliers bought 21.8 TWh (+8% y-o-y) at UAH 713/MWh (+28% y-o-y). Overall, the distributors (both regulated and independent) paid 94% of their bills last year.
Oblenergos’ combined grid losses remained almost unchanged in 2014 at 10.17%. Total losses (low voltage plus high voltage grids) inched up 0.2ppt to 12.6%.
TariffsElectricity pricing in Ukraine originates at Energorynok. The wholesale market operator calculates the price on an hourly basis, factoring in the weighted average tariff paid to generators (with all additional fees), payment for dispatching services and high-voltage transmission, special fees (channelled to the state budget), as well as subsidies to cover below-cost supplies to households.
Tariffs for nuclear and hydropower plants and most CHP producers are fixed for a cer-tain period of time (one year or less) based on their fuel costs, OPEX and CAPEX needs, and some profit margin. These producers do not compete with each other but rather follow instructions from the energy system dispatcher as to how much they need to produce.
Thermal GenCos and selected CHP plants submit hourly price bids to Energorynok (derived mostly from their fuel costs) and re-port how much operating capacity they can switch on or off. The dispatcher then starts loading the least expensive units, proceed-ing towards more expensive ones until all current demand is met. All loaded units are then paid the cost of the last (most expen-sive) generator. In addition, the generators
Fig. 030. Oblenergo Payments to Energorynok (1999–2014; %) Source: Energobusiness
0%
20%
40%
60%
80%
100%
120%
1999
2000
2001
2002
2003
2004
2005
2006
2007
2008
2009
2010
2011
2012
2013
2014
Fig.031. Electricity Transmission Losses (2000–2014; %) Source: Energorynok, Dragon Capital estimates
0%
5%
10%
15%
20%
25%
Oblenergo low-voltage grid losses (%)
2000
2001
2002
2003
2004
2005
2006
2007
2008
2009
2010
2011
2012
2013
2014
Fig.032. Energorynok Tariff Structure (2014) Source: Energorynok
Thermal power, 31.8%
Household subsidies, 29.6%
Nuclear power, 16.8%
CHPs, 12.0%
Dispatching and high voltage losses, 5.5%
Hydro power, 2.2%
Investment surcharge, 1.9%

U K R A I N E ’ S T O P -1 0 0 S TAT E - O W N E D E N T E R P R I S E S › 2 0 1 3 & 9 M O N T H S 2 0 1 4054
are paid the aforementioned «capacity» and «flexibility» fees based on their ability to increase or decrease output. Whereas GenCos’ price bids mostly cover their fuel costs, the two fees are supposed to cover all other costs.
In reality, the NERC regularly uses these fees to manipulate GenCo tariffs so as to ob-tain the desired average Energorynok price and thereby indirectly control inflation. This closely resembles the cost-plus method; moreover, there were precedents of the regula-tor going as far as to approve below-cost tariffs for power producers.
Energorynok Sales and Tariffs (2013 –2014)
Electricity Sales (2013;
GWh)
Electricity Sales (2014;
GWh)
Change ( %; y-o-y)
Tariff (2013; UAH/MWh)
Tariff (2014; UAH/MWh)
Change ( %; y-o-y)
Centrenergo 12,585 11,356 (9.8 %) 588.82 661.94 12.4 %
Dniproenergo 16,027 15,029 (6.2 %) 601.02 641.14 6.7 %
Donbasenergo 9,006 6,355 (29.4 %) 628.98 766.67 21.9 %
Zakhidenergo 16,238 15,646 (3.6 %) 690.11 774.08 12.2 %
Vostokenergo 17,256 13,645 (20.9 %) 647.72 712.81 10.0 %
Thermal GenCos Total/Average
71,112 62,032 (12.8 %) 634.08 707.11 11.5 %
Kyivenergo 2,813 2,451 (12.9 %) 862.22 998.67 15.8 %
Other Thermal 8,880 7,356 (17.2 %) 1131.08 1168.23 3.3 %
CHPs Total/Average 11,693 9,807 (16.1 %) 1066.40 1125.85 5.6 %
Thermal Total/Average 82,805 71,839 (13.2 %) 695.13 764.27 9.9 %
Energoatom 78,236 83,220 6.4 % 219.34 278.27 26.9 %
Hydropower plants 13,700 8,639 (36.9 %) 199.66 300.24 50.4 %
Renewables 1,552 2,033 31.0 % 2590.98 2835.90 9.5 %
Source: Energorynok
The oblenergos, due to their status as natural monopolies, are subject to strict NERC supervision. They buy electricity from Energorynok for sale to end customers and only receive payment for their distribution and supply services, thus earning no additional margin on the electricity volume sold. The oblenergos also provide distribution services to independent power suppliers, which likewise buy electricity from Energorynok and pay oblenergos for transmitting it to their customers. The oblenergos are also responsible for payment collection and settlements with Energorynok, offsetting any under-collection with their own earnings or booking it as debt to Energorynok.
The market regulator divides oblenergo customers into two distribution classes and two supply groups. Customers connected to transmission lines of 35 kV or higher comprise distribution class 1 and those connected to below-35 kV lines are designated as class 2. In terms of supply groups, households, including rural residents, are considered group 2 and all other customers comprise group 1.
The NERC uses this classification to set individual transmission and supply tariffs for each oblenergo based on its operating costs, electricity losses and CAPEX needs (the latter is also subject to NERC approval) plus a certain profit margin. The tariffs are usually ap-proved for a year but may be revised in the interim.
Retail tariffs for each class of customers are revised monthly based on the expected En-ergorynok price, natural grid losses and the oblenergos’ distribution and supply tariffs.

E l E c T R I c I T y 055
Pricing electricity for sale to the oblenergos, Energorynok factors in the average tariff paid to generators, all infrastructure and dispatch payments, subsidies for households as well as individual discounts/premiums to the Energorynok price intended to equalize tariffs across Ukraine.
Household electricity prices in Ukraine remain cross-subsidized by industrial custom-ers. With households consuming 40 TWh of electricity p.a., subsidies to keep prices for them low totalled some UAH 41bn in 2014. In February 2015, the energy sector regulator approved five semi-annual increases in household electricity tariffs starting April 2015
Fig.033. Electricity Tariffs for Commercial Customers (¢/kWh) Source: Eurostat, Dragon Capital estimates
0
2
4
6
8
10
12
14
Russ
ia
Arm
enia
Fran
ce
Bulg
aria
Kaza
khst
an
Slov
enia
Pola
nd
Esto
nia
Net
herl
ands
Ger
man
y
Aust
ria
Den
mar
k
Turk
ey
Rom
ania
Croa
tia
Hun
gary
Belg
ium EU
Ukr
aine
(201
4E)
Czec
h Re
publ
ic
Port
ugal
Gre
ece
Bela
rus
Italy
Latv
ia
Spai
n
Slov
akia
Ukr
aine
(201
3)
Irel
and
Fig.034. Electricity Tariffs for Household Customers (¢/kWh) Source: Eurostat, Dragon Capital estimates
0
5
10
15
20
25
30
Ukr
aine
(201
5E)
Ukr
aine
(201
4)
Russ
ia
Kaza
khst
an
Bela
rus
Arm
enia
Bulg
aria
Rom
ania
Esto
nia
Croa
tia
Hun
gary
Fran
ce
Pola
nd
Latv
ia
Gre
ece
Slov
enia
Turk
ey
Port
ugal
Czec
h Re
publ
ic
Den
mar
k
Aust
ria
Slov
akia EU
Net
herl
ands
Ger
man
y
Italy
Belg
ium UK
Spai
n
Irel
and

U K R A I N E ’ S T O P -1 0 0 S TAT E - O W N E D E N T E R P R I S E S › 2 0 1 3 & 9 M O N T H S 2 0 1 4056
and ending April 2017, dividing retail tariffs into three categories depending on monthly consumption: under 100 kWh, 100-600 kWh and over 600 kWh per month. For the first group, the price taking effect in April 2015 was set at UAH 0.366/kWh (1.22 ¢/kWh at end-February 2015 exchange rate), to be followed by 25% semi-annual hikes to reach UAH 0.9/kWh (3 ¢/kWh) by April 2017. The 100-600 kWh and 600-plus kWh tariffs were set at a starting level of UAH 0.66/kWh (2.1 ¢/kWh) and UAH 1.41/kWh (4.7 ¢/kWh), respectively, with subsequent convergence at UAH 1.68/kWh (5.6 ¢/kWh). The average household tar-iff was thus expected to increase from UAH 0.35/kWh in early 2015 to UAH 1.22/kWh by April 2017. However, with hryvnia devaluation boosting electricity producers’ fuel costs (imported natural gas, nuclear fuel and coal), the announced tariff hikes may be too small to bring any significant relief to the sector. Even the projected April 2017 average tariff is lower than current household electricity prices in both the EU and the CIS (e.g. 4.5 ¢/kWh in Russia, 6.7 ¢/kWh in Belarus and 7.7 ¢/kWh in Armenia).
PrivatizationUkraine’s most recent energy sector privatizations date back to 2013 when the Govern-ment sold a 60.77% stake in thermal GenCo Donbasenergo to a local investor for UAH 719m (USD 87m), or 12% above the starting price of UAH 641m (USD 78m). The winning bid valued Donbasenergo at a 2013E P/E of just 2.1. In late 2013, the Government also sold a 75% stake in Volynoblenergo, a small regional power distributor in western Ukraine, to a local investor for UAH 462m (USD 56m). The privatization valued Volynoblenergo at USD 75m, almost triple its market cap at the time of the auction, implying 2012 EV/Sales of 0.85x and EV/EBITDA of 16.9x. On EV/EBITDA, the auction became the most expensive compared to earlier oblenergo privatizations, whose EV/EBITDA ranged from 3-8.5x. Also, on an EV/Customer basis, the company was auctioned off at USD 206/customer vs. previ-ous privatizations at USD 59-101/customer.
The state currently holds a 78% stake in Centrenergo, 25% stakes in Donbasenergo, Dni-proenergo and Zakhidenergo as well as controlling stakes in six regional power distribu-tors (Cherkasyoblenergo, Kharkivoblenergo, Khmelnytskoblenergo, Mykolayivoblenergo, Ternopiloblenergo, and Zaporizhyaoblenergo) along with 25% stakes in most other oble-nergos. The new Government, appointed in December 2014, briefly put privatizations of state-controlled companies on hold in order to review and audit their operations. Also affecting individual companies’ privatization prospects is the military conflict in east-ern Ukraine (e.g. one of Centrenergo’s power plants is located close to the front line of fighting and remains at risk of suffering damage from shelling and having its logistics disrupted).
Sector ReformsThe electricity sector in Ukraine remains under a heavy regulatory burden, particularly with respect to tariff setting for thermal power producers. While the existing tariff system was developed with the aim of fostering competition among GenCos, it was based solely on the cost of fuel as the principal factor for the regulator to determine which generating units to load first. To overcome this and other deficiencies, a new reform was drafted in order to liberalize tariff rules and gradually remove Energorynok’s monopoly control of the wholesale electricity market.

E l E c T R I c I T y 057
The new law on the energy market envisages gradual transition to a fully liberalized market with bilateral contracts, an energy exchange for day-ahead electricity purchases and a balancing market to regulate demand-supply mismatches. During the transition stage, subsidies to households as well as other financial imbalances in the system will be transferred from industrial consumers to two state companies, nuclear power operator Energoatom and hydro power producer Ukrhydroenergo, which will be awarded market-based tariffs (as opposed to their current below-market tariffs totalling merely a third of thermal GenCos’ tariffs).
Impact of Military Conflict in Eastern UkraineMilitary unrest in the eastern Donetsk and Luhansk regions, which began in mid-April 2014 and has since escalated into a full-on military conflict, has inflicted serious damage on regional infrastructure.
Donbasenergo shut down its Slovyanska power plant in June 2014 after artillery fire dam-aged its coal pulverization unit, two transformers and a fuel oil tank and disconnected the plant from high voltage lines. In February 2015, state-owned Centrenergo’s Vuhlehir-ska power plant, located on the border of the military conflict zone, suffered new dam-age from shelling, with several rockets hitting the plant’s main building and deactivating transformers at two of its four power generating units. With total installed capacity of 3.6 GW (four 300 MW coal-fired units and three 800 MW gas-fired blocks), Vuhlehirska ac-counted for 29% (3.6 TWh) of Centrenergo’s 2014 production and was the GenCo’s most fuel-efficient power plant with fuel consumption of 380 g/kWh compared to 391 g/kWh and 425 g/kWh reported by Centrenergo’s two other plants.
Fighting in the region also disrupted electricity supplies to coal mines, increasing the risk of deadly underground accidents in shafts with high methane content. As a result, several state and private coal mines had to shut down, though their combined output in absolute terms was insignificant (several percent of total production).
More severe problems arose after the separatists started to blow up rail infrastructure, cutting or halting coal supplies to Donbasenergo’s Slovyanska power plant (before it was shut down by shelling) and later to DTEK’s Luhansk power plant. The latter is responsible for 9% of DTEK’s total electricity production and meets 92% of Luhansk region’s electric-ity demand. DTEK temporarily solved the problem by switching the plant to coal supplies from its Russian mines.
Several large high-voltage substations were damaged during the military operation, risk-ing a halt in power supplies to the city of Luhansk, towns and villages around the military zone, and several industrial plants.
.

U K R A I N E ’ S T O P -1 0 0 S TAT E - O W N E D E N T E R P R I S E S › 2 0 1 3 & 9 M O N T H S 2 0 1 4058
SWOT Analysis
Strengths
‣ Well developed energy infrastructur
‣ Connections with neighboring EU and CIS countries allow for cross-border electricity flows (both exports and imports) and help to ensure stability of electricity supplies
Opportunities
‣ Energy market reform and gradual transition to market-based mechanisms
‣ Privatization of the remaining state-owned assets by major European players would bring in international expertise and new investments
‣ Closer integration with the European energy system
Weaknesses
‣ Household subsidies cost the sector UAH 40bn p.a.
‣ Lack of peak capacity results in excessive utilization of coal-fired power plants
‣ Outdated and inefficient equipment
‣ Power transmission imbalances limit output from nuclear power plants
Threats
‣ Dependence of half of domestic coal-fired power plants on coal mined in the region currently controlled by separatists, leading to fuel shortages and insufficient electricity supply
‣ Dependence on Russia for supplies of nuclear fuel, natural gas and coal

O I l & G A S 059
Oil & GasOverview of Sector SOEsState-owned assets in the Ukrainian oil and gas sector are essentially controlled by one company, Naftogaz of Ukraine, which accounts for almost 100% of the sector SOEs’ revenues and is also the largest company in Ukraine (please see the section on SOE pro-files for a separate overview of Naftogaz of Ukraine).
Top Oil & Gas Sector SOEs (9M14 data)Name Core activity Net sales
(UAH m)Assets
(UAH m)Number of employees
State stake
ROCE ( %)
Naftogaz of Ukraine Oil & gas 45,789 231,294 170,000 100 % (47.0 %)
Nadra Ukrainy Oil & gas 100 1,696 1,198 100 % (1.3 %)
Ukrgeofizyka Oil & gas 95 405 1,328 100 % 5.6 %
Oil & Gas Sector SOEs’ Aggregated FinancialsP&L (UAH m) 2013 9M14 Balance Sheet (UAH m) 2013 9M14
Net Sales 77,385 45,984 Total Assets 168,855 233,395
Cost of Goods Sold 73,661 44,593 Fixed Assets 76,475 60,876
Gross Profit (Loss) 3,724 1,391 PPE 51,442 40,677
EBITDA 100 (38,372) Current Assets 92,379 172,518
Depreciation 3,197 2,950 Accounts Receivable 39,820 53,948
Operating Profit (Loss) (3,097) (41,322) Cash & Equivalents 2,233 64,762
Financial Income (Loss) (6,702) (6,198) Total Liabilities & Equity 168,855 233,395
Pre-Tax Profit (Loss) (12,514) (59,911) Total Liabilities 116,330 164,909
Corporate Tax 2,199 287 Accounts Payable 71,383 87,484
Net income (Loss) (14,713) (60,198) Debt 40,206 49,626
Dividends paid na na Equity 50,846 68,486
Ratios 2013 9M14
Sales Growth ( %, y-o-y) (24.7 %) (4.6 %)
EBITDA Margin ( %) 0.1 % (83.4 %)
Net income Margin ( %) (19.0 %) (130.9 %)
Debt/Equity ( %) 115.8 % 72.5 %
Net Debt/EBITDA (x) 568.2 nm
ROE ( %) (29.4 %) (161.7 %)
ROA ( %) (8.8 %) (39.9 %)
ROCE ( %) (2.8 %) (46.6 %)
General OverviewUkraine’s gas transportation system (GTS) consists of high pressure pipelines with a com-bined length of 39,800 km and nominal capacity to import 290 bcm and export 178.5 bcm of gas annually, including up to 140 bcm to the EU. Ukraine also owns 13 underground gas storage facilities with a total capacity of 32 bcm. Both the pipeline network and stor-age reservoirs are 100% state-owned and operated by oil and gas monopoly Naftogaz of

U K R A I N E ’ S T O P -1 0 0 S TAT E - O W N E D E N T E R P R I S E S › 2 0 1 3 & 9 M O N T H S 2 0 1 4060
Ukrainethrough its fully owned subsidiary Ukrtransgaz. The domestic gas supply network comprises 349,200 km of low pressure pipes, most of which are operated by regional gas distributors.
Naftogaz’s of Ukraine gas storage capacity, one of the largest in Europe as well as globally, is used to balance production (relatively flat throughout the year) and consumer demand (which has a significant seasonal component). Gas is pumped into storage from April to September, when consumption is seasonally lower, and reserves are used extensively during the heating season (October-March). Ukraine took advantage of its gas reservoirs during several «gas wars» with Russia over the past decade, including the latest price dispute when Russia halted gas supplies to Ukraine in June 2014.
In 2013, Baker Tilly valued the Ukrainian GTS at USD 26-29bn based on several valuation approaches. The study was commissioned by the Ukrainian Government as part of its talks with Gazprom at the time to create a JV to manage the GTS. Yet no deal was eventu-ally agreed.
Ukraine’s annual gas extraction (around 20 bcm) is sufficient to meet household demand only, making imports indispensable. Domestic oil production, likewise, satisfies only about 15% of total consumption.
Naftogaz of Ukraine, established in 1998 to manage state-owned oil and gas assets, con-trols most of the domestic oil and gas extraction and entire transportation and storage infrastructure. Naftogaz’s of Ukraine key assets include Ukrnafta (near-monopoly oil pro-ducer majority owned by Naftogaz of Ukraine); Ukrgazvydo-buvannya (largest producer of gas and gas products); Ukrtransnafta (oil pipeline operator); and Ukrtransgaz (gas pipe-line operator).
The Ukrainian oil and gas industry remains heavily regulated, as the Government exer-cises direct and indirect control over hydrocarbon exploration and production and con-trols access to the pipeline infrastructure. State-controlled gas producers are required to sell their output to Naftogaz of Ukraine at below-market (and often below-cost) prices for further supply to households. Oil refining and retailing are the sector’s most liberalized segments.
With Russia’s annexation of Crimea in March 2014, Ukraine lost control of Chornomor¬naftogaz, the Naftogaz of Ukraine subsidiary developing offshore fields in the Black Sea, and 1 bcm of underground storage capacity. It also had to put on hold promising offshore projects, including a 2012 deal with ExxonMobil, Shell and OMV to develop the 16,700 km2 Skifska field whose prospective output was estimated at 3-4 bcm p.a.
Ukraine has extracted oil for more than 150 years, with record high output of 106 million barrels (MMbl) registered in 1972. Annual production has since slid to approx. 20 MMbbl. Ukraine’s oil reserves are estimated at 1.2 billion barrels of oil equivalent (boe) under local standards, implying a reserve life of 40 years. Oil in Ukraine is extracted from the Eastern (largest) and Western (oldest) oil fields.
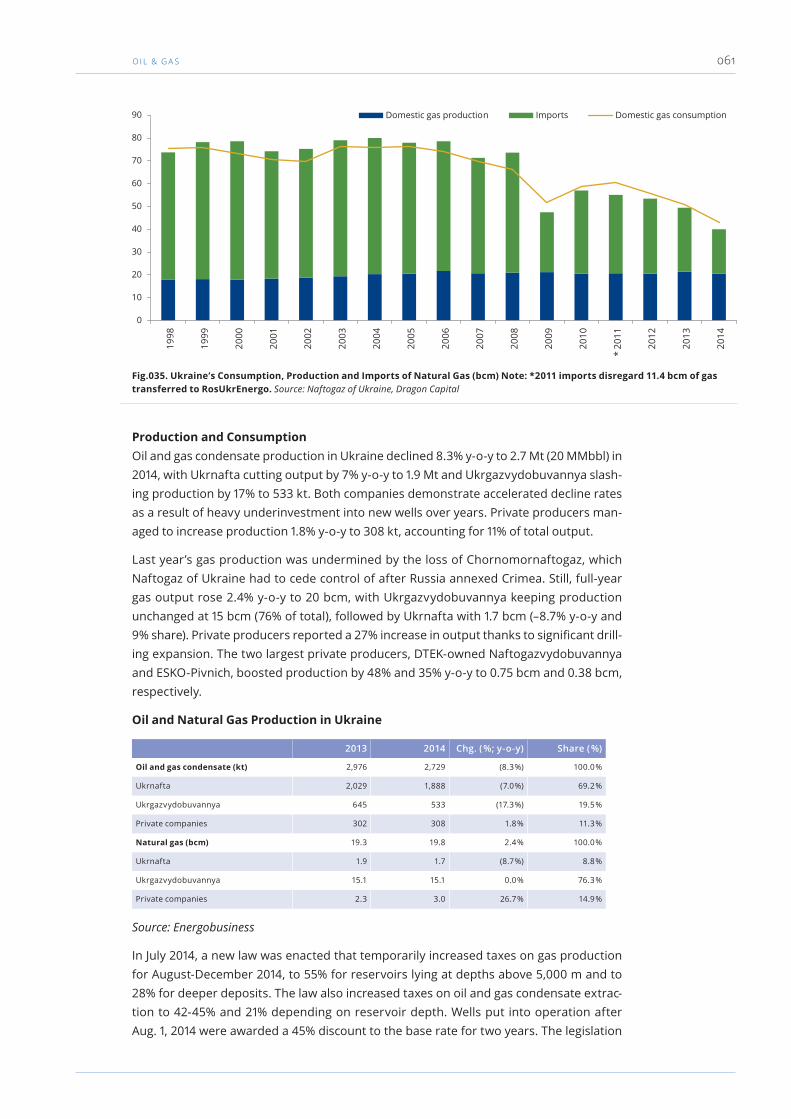
O I l & G A S 061
Production and ConsumptionOil and gas condensate production in Ukraine declined 8.3% y-o-y to 2.7 Mt (20 MMbbl) in 2014, with Ukrnafta cutting output by 7% y-o-y to 1.9 Mt and Ukrgazvydobuvannya slash-ing production by 17% to 533 kt. Both companies demonstrate accelerated decline rates as a result of heavy underinvestment into new wells over years. Private producers man-aged to increase production 1.8% y-o-y to 308 kt, accounting for 11% of total output.
Last year’s gas production was undermined by the loss of Chornomornaftogaz, which Naftogaz of Ukraine had to cede control of after Russia annexed Crimea. Still, full-year gas output rose 2.4% y-o-y to 20 bcm, with Ukrgazvydobuvannya keeping production unchanged at 15 bcm (76% of total), followed by Ukrnafta with 1.7 bcm (–8.7% y-o-y and 9% share). Private producers reported a 27% increase in output thanks to significant drill-ing expansion. The two largest private producers, DTEK-owned Naftogazvydobuvannya and ESKO-Pivnich, boosted production by 48% and 35% y-o-y to 0.75 bcm and 0.38 bcm, respectively.
Oil and Natural Gas Production in Ukraine
2013 2014 Chg. ( %; y-o-y) Share ( %)
Oil and gas condensate (kt) 2,976 2,729 (8.3 %) 100.0 %
Ukrnafta 2,029 1,888 (7.0 %) 69.2 %
Ukrgazvydobuvannya 645 533 (17.3 %) 19.5 %
Private companies 302 308 1.8 % 11.3 %
Natural gas (bcm) 19.3 19.8 2.4 % 100.0 %
Ukrnafta 1.9 1.7 (8.7 %) 8.8 %
Ukrgazvydobuvannya 15.1 15.1 0.0 % 76.3 %
Private companies 2.3 3.0 26.7 % 14.9 %
Source: Energobusiness
In July 2014, a new law was enacted that temporarily increased taxes on gas production for August-December 2014, to 55% for reservoirs lying at depths above 5,000 m and to 28% for deeper deposits. The law also increased taxes on oil and gas condensate extrac-tion to 42-45% and 21% depending on reservoir depth. Wells put into operation after Aug. 1, 2014 were awarded a 45% discount to the base rate for two years. The legislation
Fig.035. Ukraine’s Consumption, Production and Imports of Natural Gas (bcm) Note: *2011 imports disregard 11.4 bcm of gas transferred to RosUkrEnergo. Source: Naftogaz of Ukraine, Dragon Capital
0
10
20
30
40
50
60
70
80
90 Domestic gas production Imports Domestic gas consumption
1998
1999
2000
2001
2002
2003
2004
2005
2006
2007
2008
2009
2010
* 20
11
2012
2013
2014
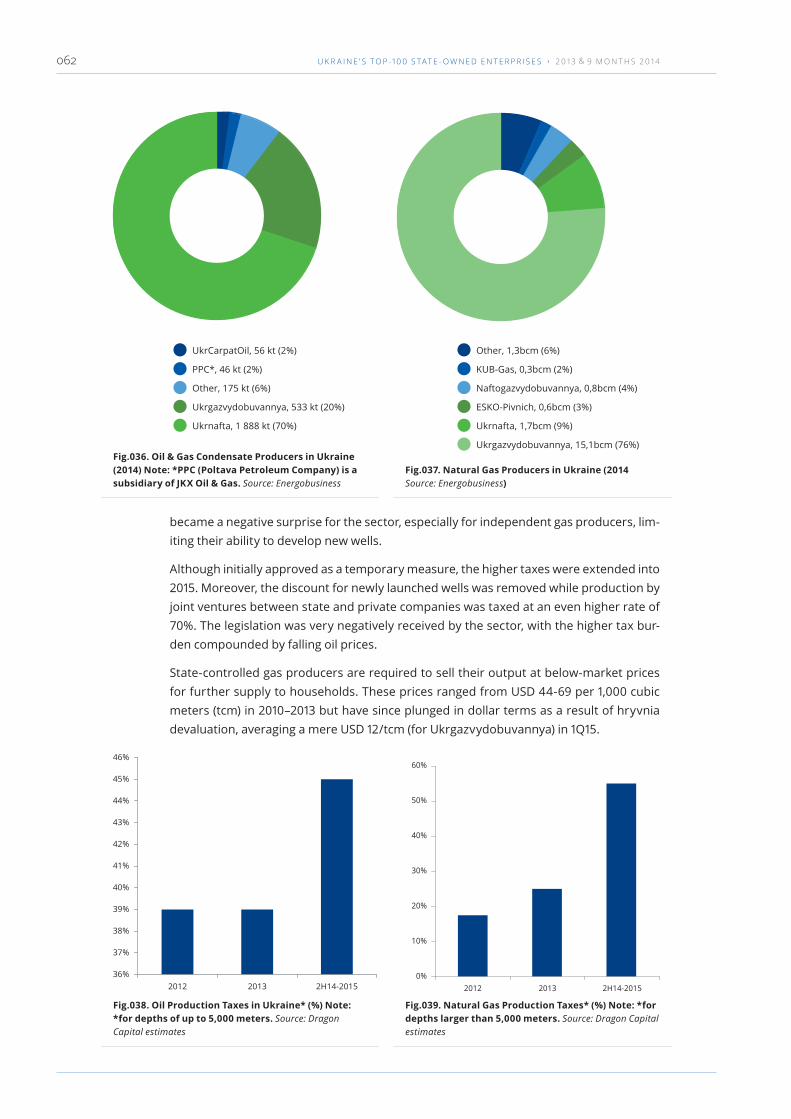
U K R A I N E ’ S T O P -1 0 0 S TAT E - O W N E D E N T E R P R I S E S › 2 0 1 3 & 9 M O N T H S 2 0 1 4062
became a negative surprise for the sector, especially for independent gas producers, lim-iting their ability to develop new wells.
Although initially approved as a temporary measure, the higher taxes were extended into 2015. Moreover, the discount for newly launched wells was removed while production by joint ventures between state and private companies was taxed at an even higher rate of 70%. The legislation was very negatively received by the sector, with the higher tax bur-den compounded by falling oil prices.
State-controlled gas producers are required to sell their output at below-market prices for further supply to households. These prices ranged from USD 44-69 per 1,000 cubic meters (tcm) in 2010–2013 but have since plunged in dollar terms as a result of hryvnia devaluation, averaging a mere USD 12/tcm (for Ukrgazvydobuvannya) in 1Q15.
Fig.036. Oil & Gas Condensate Producers in Ukraine (2014) Note: *PPC (Poltava Petroleum Company) is a subsidiary of JKX Oil & Gas. Source: Energobusiness
Fig.037. Natural Gas Producers in Ukraine (2014 Source: Energobusiness)
UkrCarpatOil, 56 kt (2%)
PPC*, 46 kt (2%)
Other, 175 kt (6%)
Ukrgazvydobuvannya, 533 kt (20%)
Ukrnafta, 1 888 kt (70%)
Other, 1,3bcm (6%)
KUB-Gas, 0,3bcm (2%)
Naftogazvydobuvannya, 0,8bcm (4%)
ESKO-Pivnich, 0,6bcm (3%)
Ukrnafta, 1,7bcm (9%)
Ukrgazvydobuvannya, 15,1bcm (76%)
Fig.038. Oil Production Taxes in Ukraine* (%) Note: *for depths of up to 5,000 meters. Source: Dragon Capital estimates
Fig.039. Natural Gas Production Taxes* (%) Note: *for depths larger than 5,000 meters. Source: Dragon Capital estimates
36%
37%
38%
39%
40%
41%
42%
43%
44%
45%
46%
2012 2013 2H14-2015 2012 2013 2H14-2015
60%
50%
40%
30%
20%
10%
0%
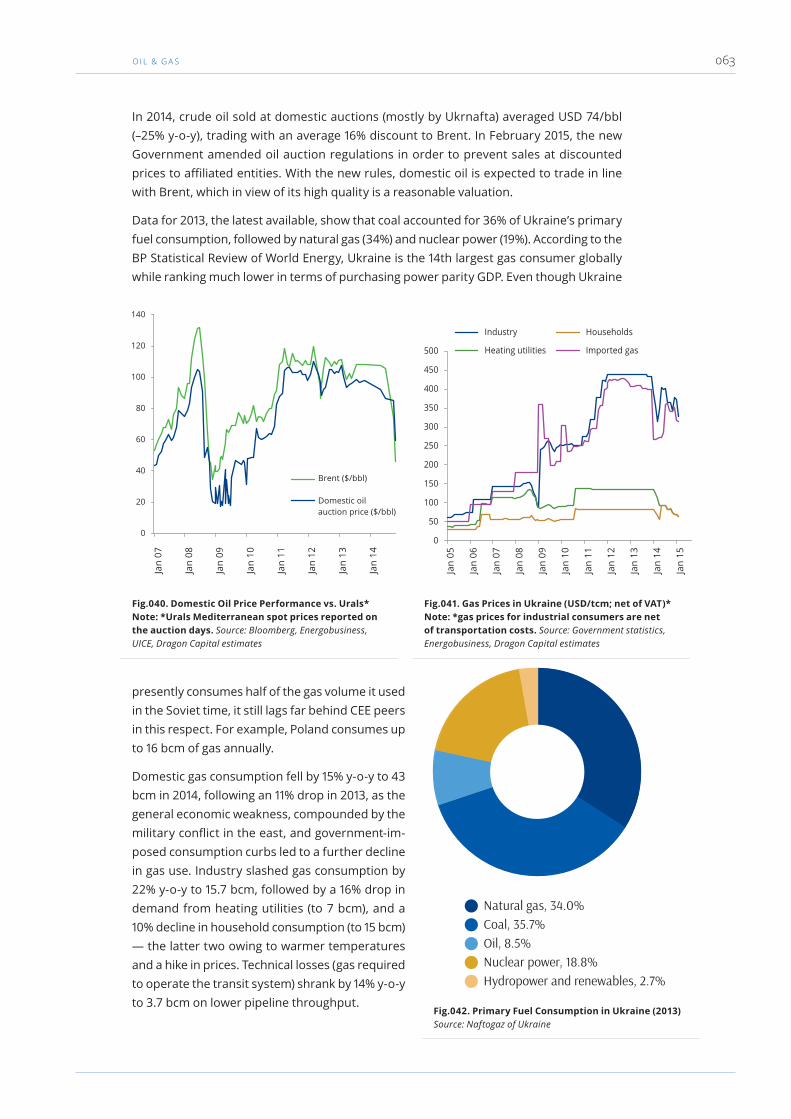
O I l & G A S 063
In 2014, crude oil sold at domestic auctions (mostly by Ukrnafta) averaged USD 74/bbl (–25% y-o-y), trading with an average 16% discount to Brent. In February 2015, the new Government amended oil auction regulations in order to prevent sales at discounted prices to affiliated entities. With the new rules, domestic oil is expected to trade in line with Brent, which in view of its high quality is a reasonable valuation.
Data for 2013, the latest available, show that coal accounted for 36% of Ukraine’s primary fuel consumption, followed by natural gas (34%) and nuclear power (19%). According to the BP Statistical Review of World Energy, Ukraine is the 14th largest gas consumer globally while ranking much lower in terms of purchasing power parity GDP. Even though Ukraine
presently consumes half of the gas volume it used in the Soviet time, it still lags far behind CEE peers in this respect. For example, Poland consumes up to 16 bcm of gas annually.
Domestic gas consumption fell by 15% y-o-y to 43 bcm in 2014, following an 11% drop in 2013, as the general economic weakness, compounded by the military conflict in the east, and government-im-posed consumption curbs led to a further decline in gas use. Industry slashed gas consumption by 22% y-o-y to 15.7 bcm, followed by a 16% drop in demand from heating utilities (to 7 bcm), and a 10% decline in household consumption (to 15 bcm) — the latter two owing to warmer temperatures and a hike in prices. Technical losses (gas required to operate the transit system) shrank by 14% y-o-y to 3.7 bcm on lower pipeline throughput.
Fig.040. Domestic Oil Price Performance vs. Urals* Note: *Urals Mediterranean spot prices reported on the auction days. Source: Bloomberg, Energobusiness, UICE, Dragon Capital estimates
Fig.041. Gas Prices in Ukraine (USD/tcm; net of VAT)* Note: *gas prices for industrial consumers are net of transportation costs. Source: Government statistics, Energobusiness, Dragon Capital estimates
0
20
40
60
80
100
120
140
Jan
07
Jan
08
Jan
09
Jan
10
Jan
11
Jan
12
Jan
13
Jan
14
0
50
100
150
200
250
300
350
400
450
500
Jan
05
Jan
06
Jan
07
Jan
08
Jan
09
Jan
10
Jan
11
Jan
12
Jan
13
Jan
14
Jan
15
Fig.042. Primary Fuel Consumption in Ukraine (2013) Source: Naftogaz of Ukraine
Natural gas, 34.0%Coal, 35.7%Oil, 8.5%Nuclear power, 18.8%Hydropower and renewables, 2.7%
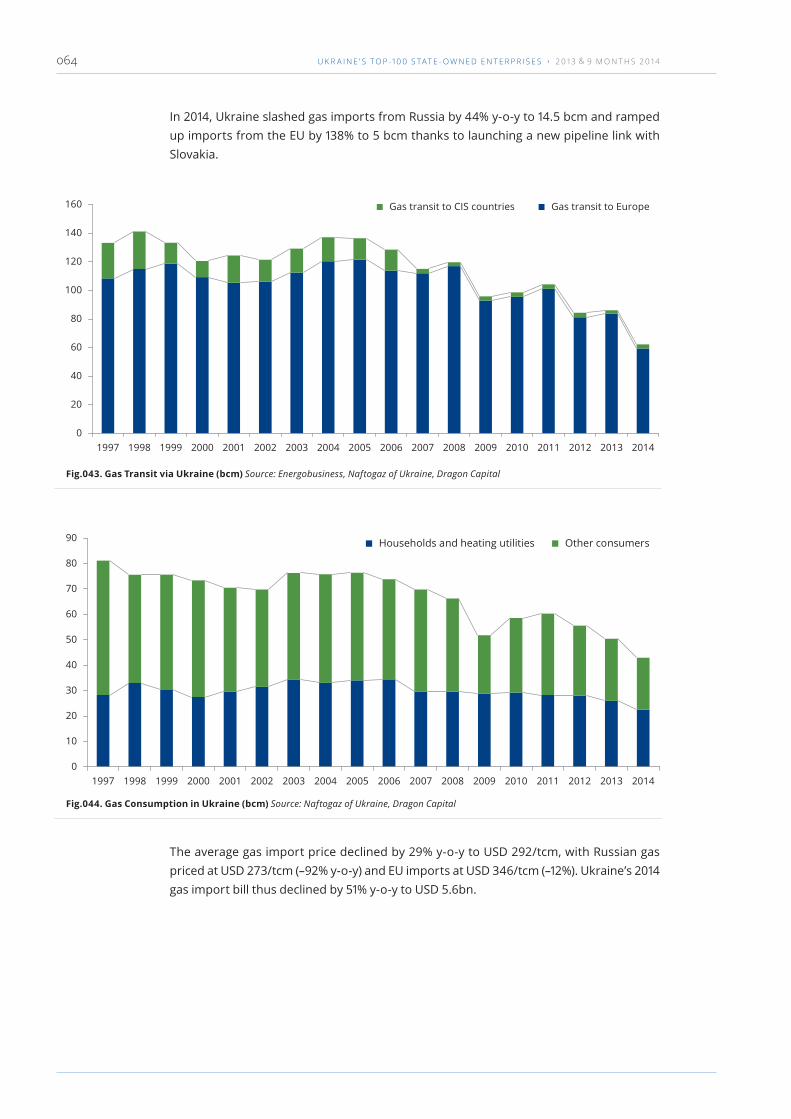
U K R A I N E ’ S T O P -1 0 0 S TAT E - O W N E D E N T E R P R I S E S › 2 0 1 3 & 9 M O N T H S 2 0 1 4064
In 2014, Ukraine slashed gas imports from Russia by 44% y-o-y to 14.5 bcm and ramped up imports from the EU by 138% to 5 bcm thanks to launching a new pipeline link with Slovakia.
The average gas import price declined by 29% y-o-y to USD 292/tcm, with Russian gas priced at USD 273/tcm (–92% y-o-y) and EU imports at USD 346/tcm (–12%). Ukraine’s 2014 gas import bill thus declined by 51% y-o-y to USD 5.6bn.
Fig.043. Gas Transit via Ukraine (bcm) Source: Energobusiness, Naftogaz of Ukraine, Dragon Capital
0
20
40
60
80
100
120
140
160
1997 1998 1999 2000 2001 2002 2003 2004 2005 2006 2007 2008 2009 2010 2011 2012 2013 2014
Fig.044. Gas Consumption in Ukraine (bcm) Source: Naftogaz of Ukraine, Dragon Capital
0
10
20
30
40
50
60
70
80
90
1997 1998 1999 2000 2001 2002 2003 2004 2005 2006 2007 2008 2009 2010 2011 2012 2013 2014
Households and heating utilities Other consumers

O I l & G A S 065
Natural Gas Demand and Supply Balances in Ukraine
2009 2010 2011 2012 2013 2014
Supply 159.0 170.1 174.7 153.1 148.5 114.8
Domestic extraction 21.3 20.5 20.6 20.5 21.4 20.51
Gas imports, incl.: 122.6 134.4 137.7 117.2 114.1 81.7
for transit 95.8 97.9 92.9 84.3 86.1 62.2
for domestic consumption 26.8 36.5 44.8 32.9 28.0 19.5
Offtake from storage 14.9 14.8 16.2 15.0 12.9 12.6
Demand 159.0 170.1 174.7 153.1 148.5 114.8
Domestic consumption 51.8 58.6 60.3 56.5 50.4 43.0
Households and public sector0 17.8 18.7 18.4 18.4 17.7 15.6
Heating utilities 10.1 10.5 9.9 9.7 8.3 7.0
Industry, incl.: 18.5 24.4 26.8 23.8 20.0 16.1
Metallurgy 5.2 6.4 6.4 4.8 4.1 3.5
Energy 5.0 7.2 7.1 6.7 6.2 5.1
Technical losses 5.4 5.0 5.2 4.6 4.4 4.4
Gas transit to: 95.8 98.6 104.2 84.3 86.1 62.2
Europe 92.8 95.4 101.1 81.2 83.7 59.4
CIS 3.0 3.2 3.1 3.1 2.4 2.8
Replenishment of storage 11.3 13.4 10.9 13.7 12.0 10.1
Source: Energobusiness
Gas Prices and Sector ReformsUkraine’s gas tariff setting system has until recently remained very inefficient. While gas prices for industrial and public sector consumers were indirectly linked to the price of im-ported gas (with Naftogaz of Ukraine adding a c. USD 20/tcm mark-up to the import price), prices for households and municipal heating companies, set by the NERC, remained heav-ily subsidized as Ukraine’s successive governments lacked the political will to act on this socially sensitive issue.
Moreover, expensive imported gas was supplied to heating utilities at below-cost prices, creating a gaping hole in Naftogaz’s of Ukraine books (USD 1.8bn in 2014 based on the difference between the price charged by Gazprom and that paid by heating producers). Growing payables of heating producers added to Naftogaz’s of Ukraine problems. In 2014 alone, heating companies paid only 61% of their gas bills, increasing their debt to Naftogaz of Ukraine to UAH 16.2bn. Naftogaz of Ukraine continued to rely on the state for covering its deficit, being regularly recapitalized via share capital increases.
Low retail prices served as an incentive for local gas distributors to sell gas intended for households to industrial consumers at a much higher price. This was possible due to the unaccounted gas volumes arising from the lack of proper metering equipment.
Naftogaz of Ukraine Gas Sales (2014; bcm)
Consumption (bcm)
Change ( %,y-o-y)
Price (UAH/tcm)
Change ( %, y-o-y)
Collection rate ( %)
Debt (UAH m)
Households 15.1 (10.3 %) 478 38.8 % 86 % 2,036
Public sector 0.7 (19.6 %) 3,605 3.4 % 99 % 81
Heating utilities 8.6 (15.5 %) 1,643 (12.0 %) 61 % 16,237
Industry 4.5 52.8 % 4,564 20.0 % 95 % 8,566
Total 28.8 (6.2 %) 1,537 21.6 % 83 % 26,921
Source: Energobusiness, Naftogaz of Ukraine, Dragon Capital
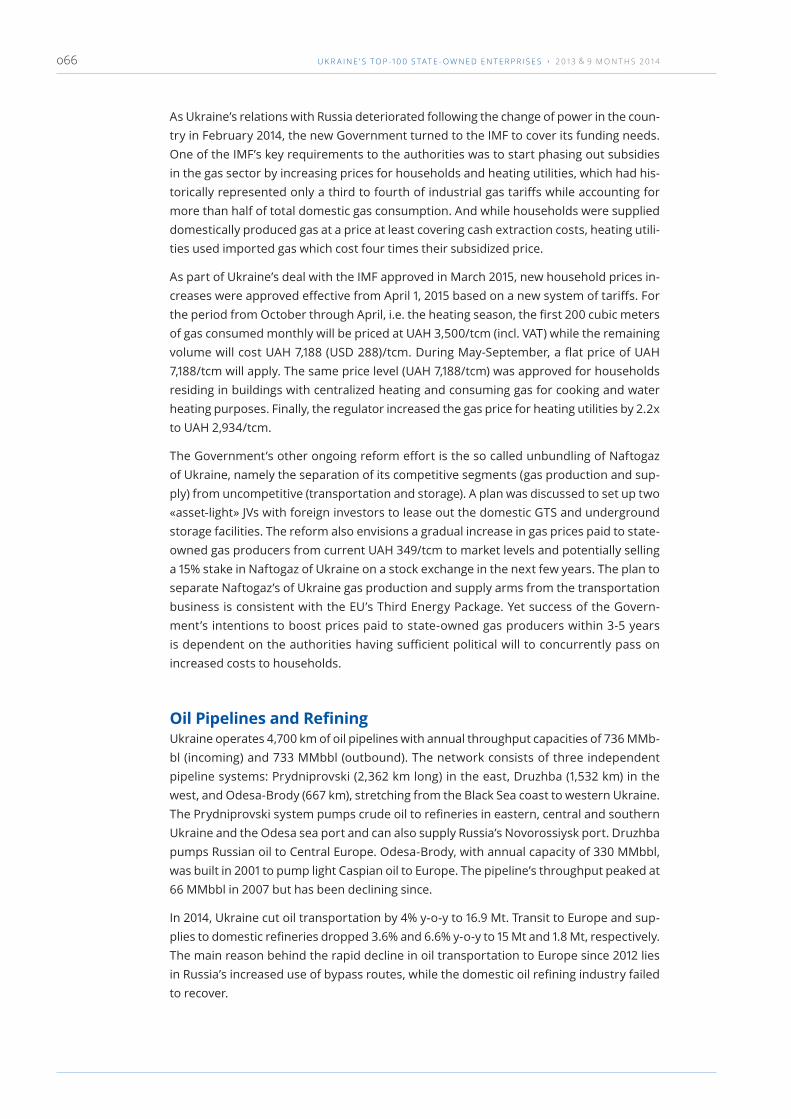
U K R A I N E ’ S T O P -1 0 0 S TAT E - O W N E D E N T E R P R I S E S › 2 0 1 3 & 9 M O N T H S 2 0 1 4066
As Ukraine’s relations with Russia deteriorated following the change of power in the coun-try in February 2014, the new Government turned to the IMF to cover its funding needs. One of the IMF’s key requirements to the authorities was to start phasing out subsidies in the gas sector by increasing prices for households and heating utilities, which had his-torically represented only a third to fourth of industrial gas tariffs while accounting for more than half of total domestic gas consumption. And while households were supplied domestically produced gas at a price at least covering cash extraction costs, heating utili-ties used imported gas which cost four times their subsidized price.
As part of Ukraine’s deal with the IMF approved in March 2015, new household prices in-creases were approved effective from April 1, 2015 based on a new system of tariffs. For the period from October through April, i.e. the heating season, the first 200 cubic meters of gas consumed monthly will be priced at UAH 3,500/tcm (incl. VAT) while the remaining volume will cost UAH 7,188 (USD 288)/tcm. During May-September, a flat price of UAH 7,188/tcm will apply. The same price level (UAH 7,188/tcm) was approved for households residing in buildings with centralized heating and consuming gas for cooking and water heating purposes. Finally, the regulator increased the gas price for heating utilities by 2.2x to UAH 2,934/tcm.
The Government’s other ongoing reform effort is the so called unbundling of Naftogaz of Ukraine, namely the separation of its competitive segments (gas production and sup-ply) from uncompetitive (transportation and storage). A plan was discussed to set up two «asset-light» JVs with foreign investors to lease out the domestic GTS and underground storage facilities. The reform also envisions a gradual increase in gas prices paid to state-owned gas producers from current UAH 349/tcm to market levels and potentially selling a 15% stake in Naftogaz of Ukraine on a stock exchange in the next few years. The plan to separate Naftogaz’s of Ukraine gas production and supply arms from the transportation business is consistent with the EU’s Third Energy Package. Yet success of the Govern-ment’s intentions to boost prices paid to state-owned gas producers within 3-5 years is dependent on the authorities having sufficient political will to concurrently pass on increased costs to households.
Oil Pipelines and RefiningUkraine operates 4,700 km of oil pipelines with annual throughput capacities of 736 MMb-bl (incoming) and 733 MMbbl (outbound). The network consists of three independent pipeline systems: Prydniprovski (2,362 km long) in the east, Druzhba (1,532 km) in the west, and Odesa-Brody (667 km), stretching from the Black Sea coast to western Ukraine. The Prydniprovski system pumps crude oil to refineries in eastern, central and southern Ukraine and the Odesa sea port and can also supply Russia’s Novorossiysk port. Druzhba pumps Russian oil to Central Europe. Odesa-Brody, with annual capacity of 330 MMbbl, was built in 2001 to pump light Caspian oil to Europe. The pipeline’s throughput peaked at 66 MMbbl in 2007 but has been declining since.
In 2014, Ukraine cut oil transportation by 4% y-o-y to 16.9 Mt. Transit to Europe and sup-plies to domestic refineries dropped 3.6% and 6.6% y-o-y to 15 Mt and 1.8 Mt, respectively. The main reason behind the rapid decline in oil transportation to Europe since 2012 lies in Russia’s increased use of bypass routes, while the domestic oil refining industry failed to recover.
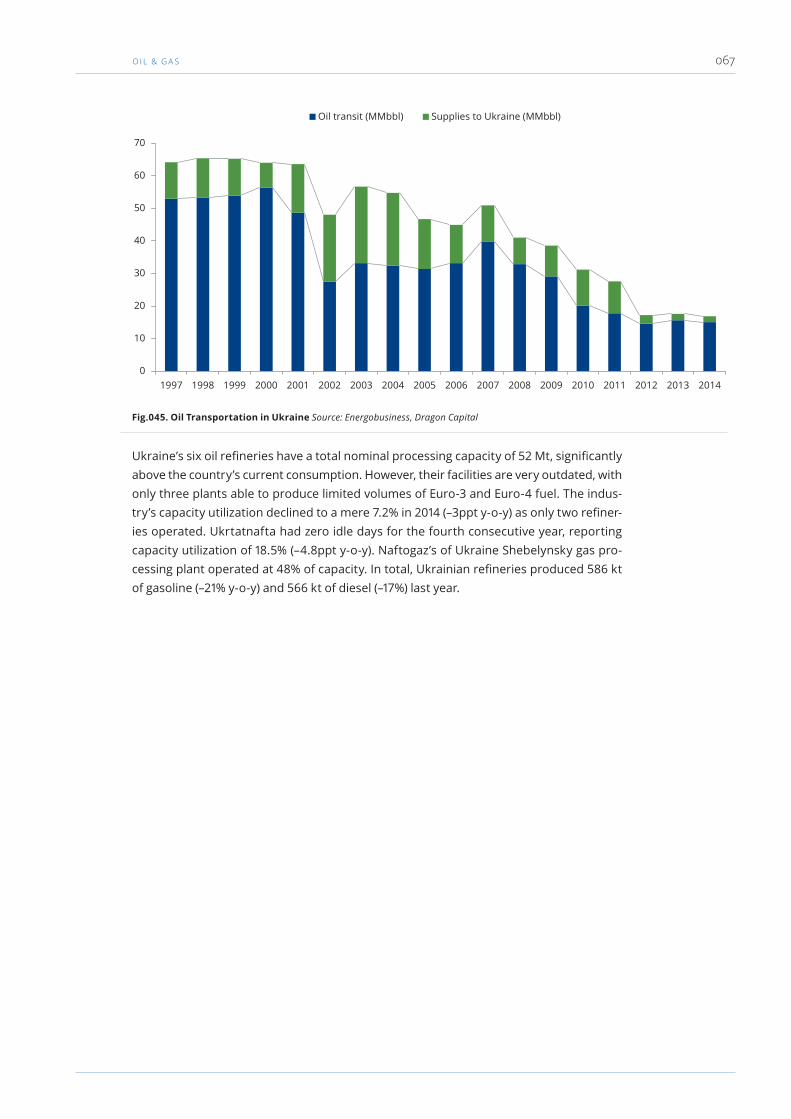
O I l & G A S 067
Ukraine’s six oil refineries have a total nominal processing capacity of 52 Mt, significantly above the country’s current consumption. However, their facilities are very outdated, with only three plants able to produce limited volumes of Euro-3 and Euro-4 fuel. The indus-try’s capacity utilization declined to a mere 7.2% in 2014 (–3ppt y-o-y) as only two refiner-ies operated. Ukrtatnafta had zero idle days for the fourth consecutive year, reporting capacity utilization of 18.5% (–4.8ppt y-o-y). Naftogaz’s of Ukraine Shebelynsky gas pro-cessing plant operated at 48% of capacity. In total, Ukrainian refineries produced 586 kt of gasoline (–21% y-o-y) and 566 kt of diesel (–17%) last year.
Fig.045. Oil Transportation in Ukraine Source: Energobusiness, Dragon Capital
0
10
20
30
40
50
60
70
1997 1998 1999 2000 2001 2002 2003 2004 2005 2006 2007 2008 2009 2010 2011 2012 2013 2014
Oil transit (MMbbl) Supplies to Ukraine (MMbbl)

U K R A I N E ’ S T O P -1 0 0 S TAT E - O W N E D E N T E R P R I S E S › 2 0 1 3 & 9 M O N T H S 2 0 1 4068
SWOT Analysis
Strengths
‣ An extensive gas transit system with 140 bcm of cross-border throughput capacity with the EU
‣ Large underground gas reservoirs allowing to promptly respond to demand spikes
‣ Close to 1,000 bcm of proven gas reserves which modern technologies could help to unlock
Opportunities
‣ Modernization of the domestic gas transit system to allow for unrestricted gas flows to and from the EU
‣ Further diversification of gas supplies
‣ Spurring foreign investment by allocating new exploration and production licenses on a transparent basis and easing the regulatory burden
‣ Phasing out subsidies to households and heating utilities to reduce wasteful energy consumption
‣ Completing installation of gas meters to eradicate corruption schemes
Weaknesses
‣ Low energy efficiency, especially in the residential sector, and lack of monetary incentives to improve it
‣ Subsidized tariffs for households and heating utilities deter investment into drilling
‣ Unstable regulatory environment discouraging foreign investors
‣ Oppressive taxation introduced in 2H14 jeopardizes future production growth
‣ Outdated exploration and production technologies
‣ Government influence over the sector regulator, manifested by below-market gas prices
‣ The still pending reform of Naftogaz of Ukraine to split its production, transportation and storage businesses
‣ Cross-subsidizing among Naftogaz of Ukraine subsidiaries
Threats
‣ Further dependence on Russian energy supplies
‣ A potential abrupt drop in output due to heavy underinvestment into drilling over years and oppressive taxation
‣ Further loss of gas transit revenues as Russia continues to switch to bypass routes
‣ Vested interests in the hydrocarbon transportation sector, harming other private market players

T R a n s P O R TaT i O n 069
TransportationOverview of Sector SOEsThe state controls 21 transportation sector companies among the TOP-100 SOEs, includ-ing the national rail monopoly, airports, sea ports, the road company, the postal operator, and others. Based on 9M14 data, they accounted for 18% of the TOP-100 SOE’s assets and 24% of their total revenue over the period. Transportation sector SOEs employed 450,000 people as of end-9M14, accounting for 49% of state-owned companies’ workforce. The table below lists the top 10 transportation sector SOEs.
Top Transportation Sector SOEs (9M14 data)Name Core activity Net sales
(UAH m)
Assets
(UAH m)
Number of
employees
State
stake
ROCE
( %)
Ukrzaliznytsia* Rail transportation 23,439 73,375 296,905 100 2.5 %
Ukrainian Sea Ports Administration Sea port management 2,749 17,522 8,586 100 12.5 %
Ukrposhta Postal and financial
services
2,719 3,151 87,225 100 0.9 %
Ukrainian State Air Traffic Enterprise
«Ukraerorukh»
Air navigation services 2,057 4,718 5,653 100 17.4 %
Roads of Ukraine Road and related
infrastructure
maintenance
1,319 3,062 25,853 100 (15.1 %)
Kyiv Boryspil International Airport Airports (passenger and
freight services)
1,212 9,429 4,412 100 8.0 %
Yuzhny Sea Port Sea ports (freight handling) 879 2,303 2,748 100 21.5 %
Mariupol Commercial Sea Port Sea ports (freight handling) 728 2,585 3,704 100 20.4 %
Illichivsk Commercial Sea Port Sea ports (freight handling) 503 1,909 4,126 100 3.9 %
Ukrainian Danube Shipping
Company
Sea ports (freight handling) 282 279 2,072 100 17.7 %
Note: *Data for Ukrzaliznytsia are shown for 1H14 based on unaudited combined IFRS financial statements
Ukrzaliznytsia (UZ) is by far the largest company in the group, its 1H14 sales of UAH 23.4bn accounted for 63% of the group’s combined revenue in 9M14 (UZ did not prepare com-bined accounts for 9M14). The Ukrainian Sea Ports Administration (USPA) followed with UAH 2.7bn of revenue (7% of total), demonstrated the highest growth (+UAH 1.8bn). At the same time, Roads of Ukraine’s›sales decreased by UAH 1.1bn to UAH 1.3bn.
The transportation sector SOEs’ cost of goods sold (COGS) remained almost unchanged in the period (+0.3% or UAH 100m) as increases reported by UZ (+3.5% or UAH 744m) and USPA (+147% or UAH 600m) were offset by a 43% or UAH 1bn decline at Roads of Ukraine. Their combined other operating income increased by UAH 2.1bn or 151% y-o-y in 9M14, the main contributors being Ukrkosmos (state-owned operator of satellite communications and broadcasting; +UAH 592m), Ukraerorukh (UAH 390m), and USPA (UAH 318m). At the same time, other operating expenses rose by UAH 1.2bn or 93%. Again, the key contribu-tors were Ukraerorukh (UAH 264m) and USPA (UAH 234m). As a result, total operating profit increased by 22% to UAH 5.5bn in 9M14, thanks to growth in other operating in-come surpassing growth in operating expenses by UAH 956m.

U K R A I N E ’ S T O P -1 0 0 S TAT E - O W N E D E N T E R P R I S E S › 2 0 1 3 & 9 M O N T H S 2 0 1 4070
Combined financial expenses increased by UAH 508m (+25%) to UAH 2.5bn in 9M14, driv-en by a UAH 487m (+695%) increase at Ukrkosmos. Other expenses peaked by UAH 9.7bn (up 34x), with Ukrzaliznytsia (UAH 7.1bn), Ukrkosmos (UAH 1.6bn) and Kyiv Boryspil Airport (UAH 305m) being the main contributors. Income tax charges rose by 42% or UAH 212m y-o-y to UAH 714m, with a UAH 192m increase in income tax reported by Ukrzaliznytsia. As a result, the sector’s bottom line turned negative in 9M14, slipping into UAH 7.2bn losses compared to net income of UAH 2.3bn in 2013.
The largest losses were reported by Ukrzaliznytsia (UAH 8.2bn in 1H14), Ukrkosmos (UAH 1.4bn in 9M14), Roads of Ukraine (UAH 150m) and Kyiv Boryspil Airport (UAH 44m). In con-trast, USPA boosted net income by UAH 754m to UAH 1.2bn over the period. As a result, the sector’s book value of equity decreased by 10% to UAH 76bn and ROE fell from 3% in 2013 to –12% as of end-9M14.
The transportation sector SOEs’ total assets decreased by 0.9% to UAH 130bn in 9M14. While Ukrzaliznytsia and Ukrposhta reported declines of UAH 1.3bn (–2%) to UAH 73.4bn and UAH 2.5bn (–44%) to UAH 3.1bn, respectively, Ukrkosmos and Ukraerorukh in-creased assets by UAH 625m (+28%) to UAH 2.8bn and UAH 457m (+11%) to UAH 4.7bn, respectively.
With end-9M14 total liabilities at UAH 53.5bn, the share of long-term liabilities increased to 59% from 50% at end-2013. Despite the fact that short-term liabilities went up by 44% to UAH 10bn by end-9M14, their share of total liabilities increased only 3.8ppt to 18.7%. The negative impact on the sector’s Net Debt/EBITDA ratio stemmed mostly from Ukrza-liznytsia, partly offset by Ukrkosmos (down from 32.6x in 2013 to 3.8x in 3Q14). State En-terprise «Directorate of Construction and Management of National Project Air Express» sharply worsened its debt position: net debt rose by 62% to UAH 675m in 9M14 while EBITDA remained little-changed at negative UAH 1.6m.
Transportation Sector SOEs’ Aggregated FinancialsP&L (UAH m) 2013 9M14 Balance Sheet (UAH m) 2013 9M14
Net Sales 69,057 37,190 Total Assets 131,136 129,899
Cost of Goods Sold 60,002 31,791 Fixed Assets 113,560 112,944
Gross Profit (Loss) 9,055 5,399 PPE 97,779 97,990
EBITDA 16,735 9,764 Current Assets 17,557 16,939
Depreciation 8,874 4,291 Accounts Receivable 5,466 6,389
Operating Profit (Loss) 7,860 5,473 Cash & Equivalents 6,102 5,868
Financial Income (Loss) (3,568) (2,470) Total Liabilities & Equity 131,136 129,899
Pre-Tax Profit (Loss) 4,346 (6,472) Total Liabilities 46,720 53,521
Corporate Tax 2,016 714 Accounts Payable 12,360 9,849
Net income (Loss) 2,329 (7,186) Debt 24,471 34,876
Dividends paid na na Equity 84,415 76,377

T R a n s P O R TaT i O n 071
Ratios 2013 9M14
Sales Growth ( %, y-o-y) (1.7 %) 184.9 %
EBITDA Margin ( %) 24.2 % 26.3 %
Net Margin ( %) 3.4 % (19.3 %)
Debt/Equity ( %) 29.0 % 45.7 %
Net Debt/EBITDA (x) 1.1 2.2
ROE ( %) 3.0 % (12.1 %)
ROA ( %) 1.9 % (7.3 %)
ROCE ( %) 7.0 % 6.3 %
RailwaysWith the breakup of the Soviet Union in 1991, Ukraine inherited one of the largest rail networks and railcar fleets among former Soviet republics, making it one of the largest railway markets in Europe. With 21,600 km of rail tracks, Ukraine ranks 2nd in the CIS and 6th in Europe (excl. Russia), though its rail density is 2-3 times smaller than in the EU. With 4 of 10 pan-European transport corridors crossing Ukraine, the domestic rail network forms a key link between the EU and Russia and Central Asia. Ukraine is the largest mar-ket in Europe (excl. Russia) and second largest in the CIS in terms of rail freight turnover. The country ranks 2nd in the CIS and 4th in Europe in terms of passenger transportation. Some 47% of Ukraine’s rail tracks are electrified, compared to 51% in Russia, 47% in China, 29% in India and 16% in Belarus.
Ukraine operates a large railcar fleet totalling almost 175,000 freight and 5,300 passenger cars (3,160 passenger cars are currently operating), powered by over 4,000 locomotives (50% diesel and 50% electric).
Fig.046. Pan-European Transport Corridors Source: Ukzaliznytsia

U K R A I N E ’ S T O P -1 0 0 S TAT E - O W N E D E N T E R P R I S E S › 2 0 1 3 & 9 M O N T H S 2 0 1 4072
According to government data, the domestic rolling stock (locomotives and railcars) has a wear rate of up to 90%. Unless a large-scale renovation program is launched soon, Ukraine risks seeing its operating passenger car fleet shrink to about 1,250 cars, as 60% of its passenger cars are already beyond their estimated service life of 28 years. Likewise, the electric and diesel locomotive fleets, averaging 26 years of service, have wear rates
of 90% and 96%, respectively. The replace-ment ratio has been lower than 1 thus far, though the government estimates a modern electric locomotive can substitute for two old vehicles.
Ukraine’s state-owned rail monopoly, Ukrzal-iznytsia (UZ), was established in 1991 and to-day manages six regional railway divisions (see details below) and over 100 core and non-core subsidiaries. There are almost 100 hospitals on the UZ balance sheet, with approximately 80 of them being divested and transferred to the Ministry of Health of Ukraine; all in all, ap-proximately 50 subsidiaries are expected to be incorporated into a new single entity as a result of UZ’s reorganization. UZ owns the infrastructure network, a locomotive fleet and passenger railcars. The company reports to the Ministry of Infrastructure of Ukraine, which appoints its management, approves annual financial plans and sets tariffs. UZ op-erates in all market segments (freight and pas-senger transportation, transit services, main-tenance and repairs).
Fig.047. Rail Track Length in Different Countries (‘000 km) Source: Ukzaliznytsia
85
51
4238
31
24 22 20 1915 15
6
0
10
20
30
40
50
60
70
80
90
Russ
ia
Fran
ce
Ger
man
y
Pola
nd UK
Italy
Ukr
aine
Rom
ania
Spai
n
Swed
en
Kaza
khst
an
Bela
rus
Fig.048. Freight Car Fleet in Different Countries (‘000; 2013) Note: *Turkmenistan, Tajikistan, Kyrgyzstan, Estonia, Lithuania, Latvia, Azerbaijan, Georgia and Armenia. Source: PG-Online
193.8119.8
42.8 29.595.1
Russ
ia
Ukr
aine
Kaza
khst
an
Bela
rus
Uzb
ekis
tan
Oth
er*
1,400
1,200
1,000
800
600
400
200
0
Fig.049. Ukraine Railcar Fleet Breakdown (2014) Source: Ministry of Infrastructure of Ukraine
Open Cars, 55.0%Tanks, 10.0%Hoppers (grain), 9.0%Boxes, 4.0%Platforms, 3.0%Other, 19.0%

T R a n s P O R TaT i O n 073
Ukrzaliznytsia Regional Divisions
Donetsk
Railway
Lviv Railway Prydniprovska
Railway
Odesa
Railway
Southwestern
Railway
Southern
Railway
Total
Rail track length 2,800 km 4,500 km 3,200 km 4,000 km 4,300 km 2,800 km 21,600 km
Share of total 13 % 21 % 15 % 15 % 22 % 14 % 100 %
Freight
transportation
(2012)
38 bn t-km 19 bn t-km 48 bn t-km 64 bn t-km 48 bn t-km 21 bn
t-km
238 bn t-km
Share of total 16 % 8 % 20 % 27 % 20 % 9 % 100 %
Passenger
transportation
(2012)
3 bn pass.-
km
5 bn pass.-
km
10 bn pass.-km 7 bn pass.-
km
16 bn pass.-km 6 bn
pass.-km
49 bn pass.-
km
Share of total 7 % 11 % 21 % 15 % 33 % 13 % 100 %
Source: Company
UZ, having inherited massive rolling stock and infrastructure from the Soviet era, is by far the largest market player. However, private operators have been gradually increasing their market share in different railcar segments, building up fleets that are less outdated than UZ’s. The largest private operator is Lemtrans, with a fleet of more than 18,000 open cars. Smaller players, each owning 1,000-2,000 cars in Ukraine (some of them also operate in Russia and other CIS countries) include Poltavskiy GOK (iron ore producer), Investment
Railcar Company, InterLeaseInvest, VTB Leasing Ukraine, Azot, Metinvest Shipping, and Transgarant Ukraine. Overall, private companies account for up to 40% of the total freight car fleet, holding a commanding share of 70% in the tank car segment, under 50% in open cars, and a mere 5-10% in hopper, platform and box cars.
Freight transportation remains UZ’s principal revenue and profit generator, accounting for about 80% of its total sales. Based on current tariffs, the most profitable for trans-portation are metals, machinery, light oil products, alcohol, acids and oxides (for each, a 1.529x coefficient is applied to the base formula), followed by oil and heavy oil products,
Fig.050. Coverage Map of Ukrzaliznytsia Regional Divisions Source: Company

U K R A I N E ’ S T O P -1 0 0 S TAT E - O W N E D E N T E R P R I S E S › 2 0 1 3 & 9 M O N T H S 2 0 1 4074
construction materials, grain, coke, timber and food (0.994x). The least profitable are coal, fertilizers, cement, ores, salt, limestone and sugar beet (0.696x).
Last year, total freight turnover declined by 12% y-o-y to 390 Mt, mostly on account of lower domestic transportation (–20%; 47% of total) and transit (–13% due to Russia; 8% of total). Freight volumes carried for export declined only by 3% (36% share), while imports increased six-fold (9%). Economic weakness, exacerbated by the military conflict in the east, led to significant declines in transportation of a variety of goods. Transportation of metals (including scrap) declined by 15% y-o-y to 31 Mt, coke dropped by 28% to 8 Mt, oil and oil products slid by 56% to 3 Mt, and construction materials fell by 8% to 49 Mt; yet grain transportation rose by 13% to 25 Mt on a bumper harvest. At the same time, the largest declines among exported cargoes (coal –23% y-o-y, chemicals –38%, and metals –9%) were largely offset by stronger grain and ore exports (+12% and +9%). Import flows rose sharply in y-o-y terms due to a low comparison base and disrupted supplies from eastern Ukraine. Thus, imported coke cargoes surged by 120% y-o-y, coal rose by 7%, and oil and oil products increased by 20%. Overall, the conflict in the east and Russia’s annexa-tion of Crimea brought significant changes to the domestic rail transportation landscape last year both geographically and in terms of freights carried.
In terms of passenger transportation, rail accounts for about 40% of total passenger turnover in Ukraine, on par with au-tomotive transport, and plays a much more important role compared to the EU countries (under 10%), the United States (almost zero) or even Russia (30%). Rail’s share of passenger transportation in Ukraine has been increasing and is expected to grow further as the recent spike in gasoline prices caused by hryvnia devaluation makes motor vehicles more expensive to use. This does not bring good prospects to UZ from a commer-cial standpoint, as its passenger transportation segment re-mains loss-making (cross-subsidies between its cargo and pas-senger segments totalled USD 500 per million passenger-km in 2012–13). In 1H14, UZ’s passenger segment had sales of UAH 2.3bn and an operating loss of UAH 2.8bn (the latter hit UAH 7.9bn for the full year, according to company management).
Reform of UZ, including its incorporation and financial and management centralization, is high on the Government’s agenda. Currently, the global experience of railway reforms is being analysed. For example, in the EU vertically integrated railway operators were split based on their core activities such as transportation services (freight vs. passenger) or infrastruc-ture, allowing private access to infrastructure to stimulate competition. Passenger transportation is loss-making in most
countries, with subsidies normally covered by the state rather than being cross-subsi-dized by rail operators’ other business segments (as freight transportation does in the case of UZ). In terms of privatization, the UK’s experience is often cited as an argument against giving away too much to private investors in this sector, though privately owned rolling stock is a common practice in other countries.
Fig.051. Freight Turnover Breakdown (2014) Source: State Statistics Service of Ukraine
Coal and coke, 25.7%Ore, 23.0%Construction materials, 15.1%Metals, 9.4%Grain, 7.8%Other, 19.1%
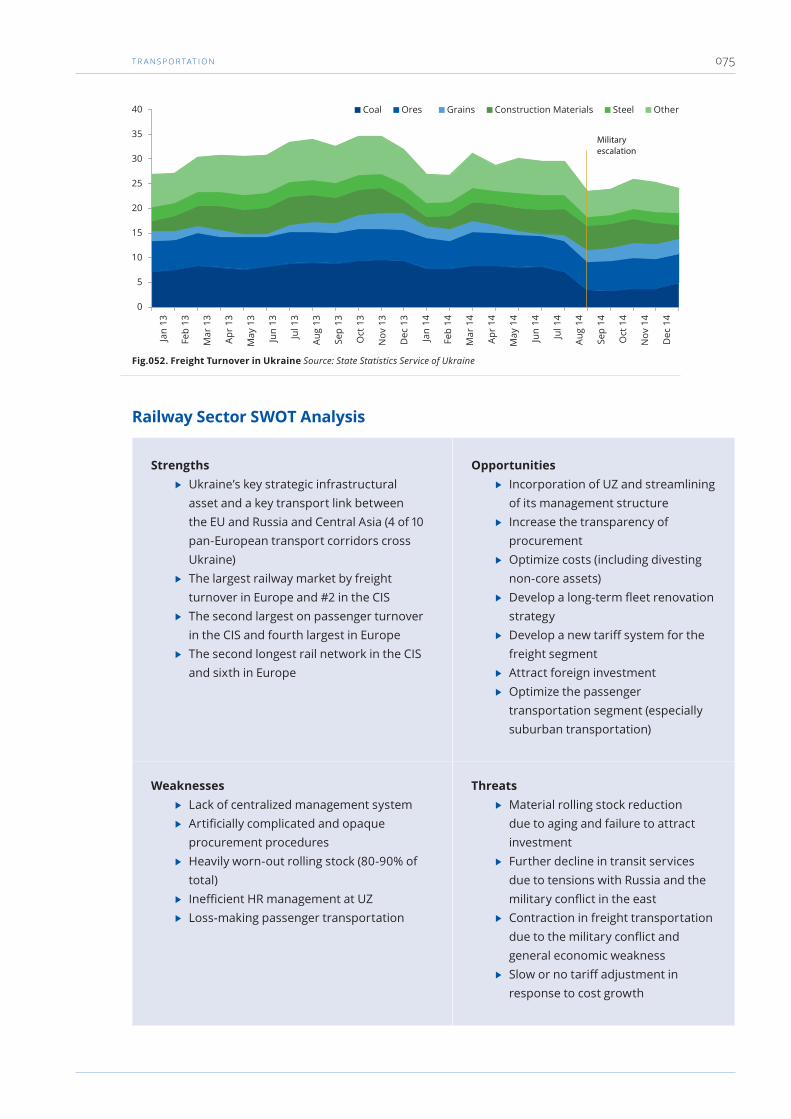
T R a n s P O R TaT i O n 075
Railway Sector SWOT Analysis
Strengths
‣ Ukraine’s key strategic infrastructural asset and a key transport link between the EU and Russia and Central Asia (4 of 10 pan-European transport corridors cross Ukraine)
‣ The largest railway market by freight turnover in Europe and #2 in the CIS
‣ The second largest on passenger turnover in the CIS and fourth largest in Europe
‣ The second longest rail network in the CIS and sixth in Europe
Opportunities
‣ Incorporation of UZ and streamlining of its management structure
‣ Increase the transparency of procurement
‣ Optimize costs (including divesting non-core assets)
‣ Develop a long-term fleet renovation strategy
‣ Develop a new tariff system for the freight segment
‣ Attract foreign investment
‣ Optimize the passenger transportation segment (especially suburban transportation)
Weaknesses
‣ Lack of centralized management system
‣ Artificially complicated and opaque procurement procedures
‣ Heavily worn-out rolling stock (80-90% of total)
‣ Inefficient HR management at UZ
‣ Loss-making passenger transportation
Threats
‣ Material rolling stock reduction due to aging and failure to attract investment
‣ Further decline in transit services due to tensions with Russia and the military conflict in the east
‣ Contraction in freight transportation due to the military conflict and general economic weakness
‣ Slow or no tariff adjustment in response to cost growth
Fig.052. Freight Turnover in Ukraine Source: State Statistics Service of Ukraine
0
5
10
15
20
25
30
35
40 Coal Ores Grains Construction Materials Steel Other
Military escalation
Jan
13
Feb
13
Mar
13
Apr
13
May
13
Jun
13
Jul 1
3
Aug
13
Sep
13
Oct
13
Nov
13
Dec
13
Jan
14
Feb
14
Mar
14
Apr
14
May
14
Jun
14
Jul 1
4
Aug
14
Sep
14
Oct
14
Nov
14
Dec
14

U K R A I N E ’ S T O P -1 0 0 S TAT E - O W N E D E N T E R P R I S E S › 2 0 1 3 & 9 M O N T H S 2 0 1 4076
RoadsUkraine has significant potential for motorway development due to its location on the intersection of multiple transport corridors, namely Berlin (Dresden)-Wroclaw-Lviv-Kyiv; Trieste-Ljubljana-Budapest (Bratislava)-Lviv; and Helsinki-St. Petersburg (Moscow)-Kyiv-Chisinau (Odesa)-Bucharest-Dimitrovgrad-Alexandropoulos.
The existing road network in Ukraine requires substantial modernization. The total length of domestic roads remained unchanged over the last 15 years at 169,600 km, with 30% classified as roads of state importance. Such roads have a higher standard rate of expen-diture for road maintenance of UAH 59,000/km vs. UAH 27,000/km for regional roads.
Ukraine’s road network is considered not dense compared to EU countries: in Ukraine, the road sufficiency ratio (kilometres of roads per 1,000 population) is just 3.7, versus 11.3 on average in the EU. When measured by road network length per 100 km2 of land area,
Ukraine’s ratio is 28 vs. 132 for the EU.
The technical condition of Ukraine’s road network requires significant improvement. Some 98% (166,100 km) of domestic roads have a paved surface, but they mostly do not meet evenness and durability standards. The most important intercity traffic arteries are in relatively good condition, while many sec-ondary roads are of rather poor quality. Traf-fic throughput capacity is also insufficient, as 80% of all roads in Ukraine were built based on standards applied in the 1960–70s. Only 2% of Ukraine’s roads have four or more lanes. There are 16,200 bridges and highway overcrossings, with 60% of them not meeting applicable technical standards and requiring repair.
In 2013, road transportation had a 74% share of total freight transportation in Ukraine in tonnage terms. On average, a tonne of freight was transported to a distance of 47 km in 2013, versus 21 km in 2000.
Fig.053. Ukraine Road Network (‘000 km; 2014) Source: Ukravtodor
0
20
40
60
80
100
120
140 International National Regional
State importance Regional importance
Fig.054. Road Density (km per 100 km2 of land area; 2011) Note: including both urban and rural roads. Source: World Bank
0
100
200
300
400
500
600
Belg
ium
Net
herl
ands
Hun
gary
Slov
enia
Ger
man
y
UK
Czec
h
Repu
blic
EU a
vera
ge
Pola
nd
Esto
nia
Lith
uani
a
Latv
ia
Rom
ania
Bela
rus
Mol
dova
Wor
ld
aver
age
Ukr
aine
Geo
rgia
Arm
enia
Azer
baija
n
Bulg
aria
Russ
ia
Kaza
khst
an

T R a n s P O R TaT i O n 077
As of 2011 (latest available data), Ukraine had 1.3 m trucks (40% state-owned and 60% privately owned), 250,000 buses (52% state-owned), and 6.9 m passenger cars (6% state-owned). Car ownership is relatively widespread in Ukraine, and this also drives the demand for better roads — the World Bank’s 2011 data put car penetration in Ukraine at 186 per 1,000 population, ahead of Moldova (166), Georgia (166) and Turkey (164).
In Ukraine, road construction and repairs are managed by Ukravtodor, a state agency sub-ordinate to the Cabinet of Ministers through the Ministry of Infrastructure. The head of Ukravtodor is appointed by the Cabinet of Ministers of Ukraine based on submission of the Prime Minister and proposal of the Min-ister of Infrastructure. Ukravtodor’s structure comprises 24 regional subsidiaries which hold roads on their balance sheets; State JSC Automobile Roads of Ukraine, in charge of road construction and repairs; and several state-owned companies engaged in R&D, engineering, design and other road-related services. Ukravtodor subsidiaries own 12,700 vehicles for road cleaning and maintenance, with the bulk of this equipment already at the end of its useful life.
In previous years, road construction and repairs were financed from a special fund of the state budget. There are no toll roads in Ukraine, thus revenue sources for this special budget fund were not related to road use and consisted of import taxes and excise duties on goods. Starting from 2015, road construction and maintenance is to be financed from the General Fund of the state budget, with funding to Ukravtodor to be allocated only after other (higher-priority) budget items have been financed. This means Ukravtodor may from time to time experience brief liquidity gaps. Also, the General Fund of the state budget stipulates no fixed sources of revenue to finance spending on roads (as opposed to the aforementioned special fund of the budget), thus actual expenditures may fluctu-ate widely from year to year.
The 2015 state budget law approved on Dec. 28, 2014 allocated UAH 20.8bn for Ukravtodor, of which UAH 17.4bn is supposed to go towards repaying the company’s debts and UAH
Fig.055. Ukraine Car Fleet Breakdown (millions; 2011) Source: State Statistics Service of Ukraine
State-owned Privately owned
Cars
Truc
ks
Mot
orcy
cles
Buse
s
Oth
er
8,000
7,000
6,000
5,000
4,000
3,000
2,000
1,000
0
Fig.056. Motor Vehicles per 1,000 Population (2011) Source: World Bank
0
100
200
300
400
500
600
700
800
900
Liec
hten
stei
n
Luxe
mbo
urg
Italy
Lith
uani
a
Germ
any
Fran
ce
Belg
ium
Pola
nd
EU a
vera
ge
Net
herla
nds
Swed
en UK
Czec
h Re
publ
ic
Esto
nia
Bulg
aria
Hung
ary
Bela
rus
Latv
ia
Kaza
khst
an
Rom
ania
Ukra
ine
Mol
dova
Geor
gia
Turk
ey
Azer
baija
n
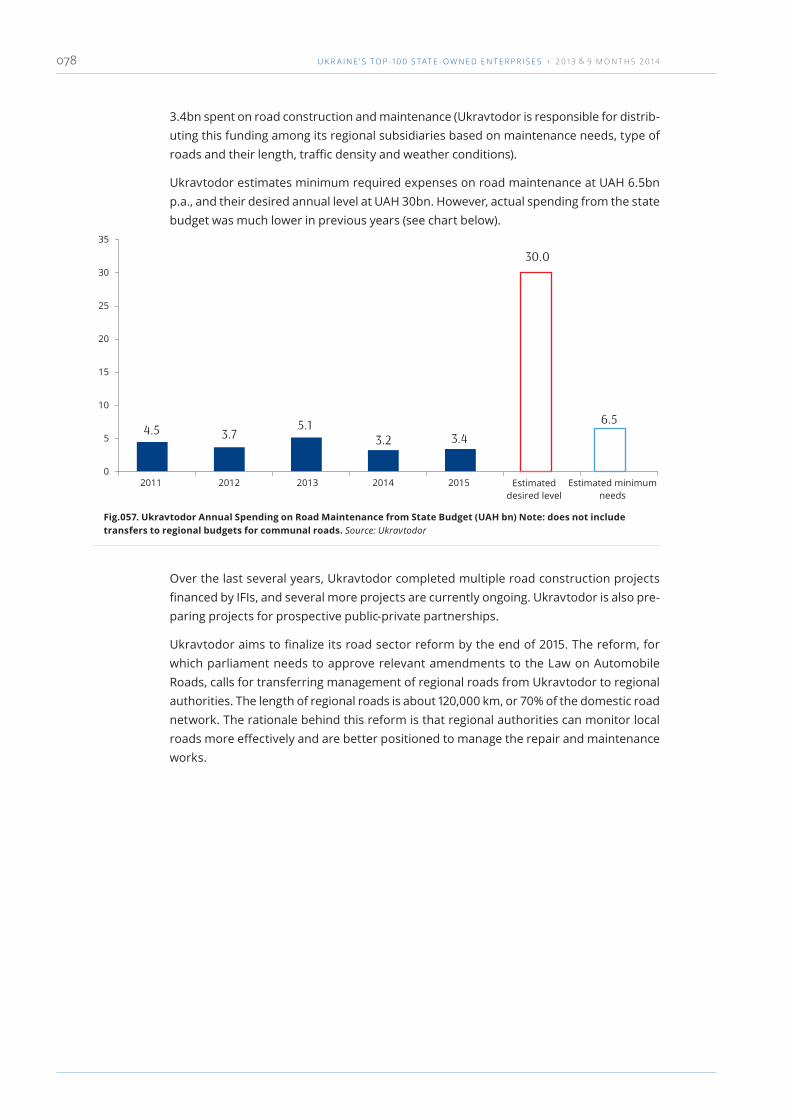
U K R A I N E ’ S T O P -1 0 0 S TAT E - O W N E D E N T E R P R I S E S › 2 0 1 3 & 9 M O N T H S 2 0 1 4078
3.4bn spent on road construction and maintenance (Ukravtodor is responsible for distrib-uting this funding among its regional subsidiaries based on maintenance needs, type of roads and their length, traffic density and weather conditions).
Ukravtodor estimates minimum required expenses on road maintenance at UAH 6.5bn p.a., and their desired annual level at UAH 30bn. However, actual spending from the state budget was much lower in previous years (see chart below).
Over the last several years, Ukravtodor completed multiple road construction projects financed by IFIs, and several more projects are currently ongoing. Ukravtodor is also pre-paring projects for prospective public-private partnerships.
Ukravtodor aims to finalize its road sector reform by the end of 2015. The reform, for which parliament needs to approve relevant amendments to the Law on Automobile Roads, calls for transferring management of regional roads from Ukravtodor to regional authorities. The length of regional roads is about 120,000 km, or 70% of the domestic road network. The rationale behind this reform is that regional authorities can monitor local roads more effectively and are better positioned to manage the repair and maintenance works.
Fig.057. Ukravtodor Annual Spending on Road Maintenance from State Budget (UAH bn) Note: does not include transfers to regional budgets for communal roads. Source: Ukravtodor
0
5
10
15
20
25
30
35
2011 2012 2013 2014 2015 Estimated desired level
Estimated minimum needs
30.0
6.53.43.2
5.13.74.5

T R a n s P O R TaT i O n 079
Road Sector SWOT Analysis
Strengths
‣ Ukraine’s favorable location on the intersection of multiple transportation routes including three international transport corridors
‣ Relatively large population, comparatively widespread car ownership and potential for larger freight flows support the demand for better roads
Opportunities
‣ Develop transparent investment projects and raise financing, including through public-private partnership and concessions
‣ Streamline Ukravtodor’s corporate structure to ensure higher efficiency and transparency, including improvements to cash flow management, procurements, IT systems and HR
‣ Develop a long-term strategy to cut Ukravtodor’s debt burden
Weaknesses
‣ Poor technical condition of roads and bridges, high wear ratio of Ukravtodor’s road maintenance equipment
‣ Damage to roads and bridges caused by the military operation in the east of Ukraine, loss of infrastructure in Crimea
‣ Large funding needs for road construction and maintenance, limited financing from the state budget
‣ Opaque internal policy at Ukravtodor for distributing funding for road maintenance among regional subsidiaries
‣ Ukravtodor’s significant liabilities entailing sizable interest payments from the state budget
‣ Lack of toll roads in Ukraine
Threats
‣ Protracted economic weakness
‣ Limited financing from the state budget
‣ Damage to road infrastructure from the military conflict in the east
‣ Further deterioration of road quality jeopardizing transport flows

U K R A I N E ’ S T O P -1 0 0 S TAT E - O W N E D E N T E R P R I S E S › 2 0 1 3 & 9 M O N T H S 2 0 1 4080
AirportsUkraine’s air transportation policy is developed by the Ministry of Infrastructure and implemented by the State Aviation Service. Air traffic management, arrangement and provision of CNS, provision of airspace users with aeronautical information and other air navigation services are provided by the Ukrainian State Air Traffic Services Enterprise (Uk-SATSE). Flights are organized by privately owned Ukrainian and international airlines via state-owned, municipal and private airports around the country. Ukraine is a full-fledged member of such major international aviation bodies as ICAO, ECAC, Eurocontrol and a number of other air traffic control organizations.
The number of flights in Ukrainian airspace dropped 35% y-o-y in 2014 due to the military conflict in eastern Ukraine, Russia’s annexation of Crimea, and the challenging economic situation in the country.
Following the tragedy on July 17, 2014, in which a Malaysian Airlines plane with almost 300 people on board was shot down in the Donetsk region, most international airlines made a decision to avoid Ukrainian airspace, which caused a 40% decline in transit traffic (216,000 flights in 2014 vs. 352,000 2013).
The maps below show Ukrainian air traffic flow distribution before and after the start of the conflict in the east of Ukraine. While the number of flights in Ukrainian airspace in November 2013 was around 35,000, it decreased to 32,000 in May 2014 following Crimea’s secession and shrank further to 15,000 in November 2014. Losses from the Crimea an-nexation and the military conflict in the east of the country are currently estimated at UAH 2.8bn, including UAH 1.7bn of lost revenue from air navigation services and the loss of infrastructure assets in Crimea (UAH 0.5bn) and the eastern regions (UAH 0.6bn).
Total passenger traffic fell by 28% in 2014 (to 11 million people from 15 million in 2013). The number of passengers travelling with domestic airlines plummeted by 45% y-o-y follow-ing the suspension of air connections with Crimea (Simferopol) and the eastern Ukrainian
Fig.058. Ukrainian Airspace and Airport Facilities Source: airports’ public reports, Boryspil airport
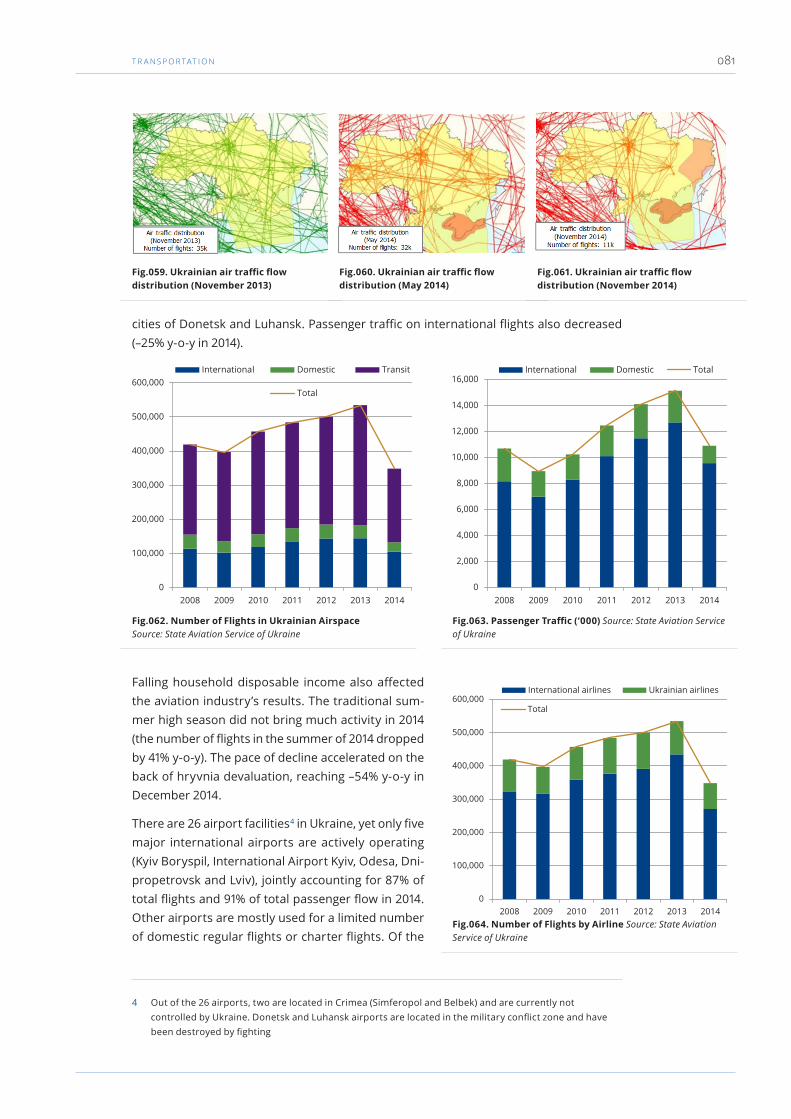
T R a n s P O R TaT i O n 081
cities of Donetsk and Luhansk. Passenger traffic on international flights also decreased (–25% y-o-y in 2014).
Falling household disposable income also affected the aviation industry’s results. The traditional sum-mer high season did not bring much activity in 2014 (the number of flights in the summer of 2014 dropped by 41% y-o-y). The pace of decline accelerated on the back of hryvnia devaluation, reaching –54% y-o-y in December 2014.
There are 26 airport facilities 4 in Ukraine, yet only five major international airports are actively operating (Kyiv Boryspil, International Airport Kyiv, Odesa, Dni-propetrovsk and Lviv), jointly accounting for 87% of total flights and 91% of total passenger flow in 2014. Other airports are mostly used for a limited number of domestic regular flights or charter flights. Of the
4 Out of the 26 airports, two are located in Crimea (Simferopol and Belbek) and are currently not controlled by Ukraine. Donetsk and Luhansk airports are located in the military conflict zone and have been destroyed by fighting
Fig.059. Ukrainian air traffic flow distribution (November 2013)
Fig.060. Ukrainian air traffic flow distribution (May 2014)
Fig.061. Ukrainian air traffic flow distribution (November 2014)
Fig.062. Number of Flights in Ukrainian Airspace Source: State Aviation Service of Ukraine
Fig.063. Passenger Traffic (‘000) Source: State Aviation Service of Ukraine
0
100,000
200,000
300,000
400,000
500,000
600,000
2008 2009 2010 2011 2012 2013 2014
International Domestic Transit
Total
0
2,000
4,000
6,000
8,000
10,000
12,000
14,000
16,000
2008 2009 2010 2011 2012 2013 2014
International Domestic Total
Fig.064. Number of Flights by Airline Source: State Aviation Service of Ukraine
0
100,000
200,000
300,000
400,000
500,000
600,000
2008 2009 2010 2011 2012 2013 2014
International airlines Ukrainian airlines
Total

U K R A I N E ’ S T O P -1 0 0 S TAT E - O W N E D E N T E R P R I S E S › 2 0 1 3 & 9 M O N T H S 2 0 1 4082
top-5 airports, two are state-owned (Kyiv Bo-ryspil and Lviv), two air-ports are managed as private-public partner-ship (Kyiv International Airport and Odesa) and one is privately owned (Dnipropetrovsk).
Kyiv Boryspil is by far the largest airport in Ukraine, responsible for organizing air trans-portation for 63% of total passengers or 6.9 million people last year
(–13% y-o-y). The airport serves over 50 Ukrainian and international airlines, which oper-ate flights to over 100 destinations worldwide, and is the only Ukrainian airport capable of serving transcontinental flights. Boryspil also accounts for almost 80% of total air freight and postal traffic in Ukraine (30 kt in 2014, down from 33 kt in 2013).
The second largest airport in Ukraine, International Airport Kyiv, primarily serves low-cost airlines (incl. Wizz Air, UTair, FlyDubai and others). The airport handled 1 million passen-gers in 2014 (–41% y-o-y) and served 23,000 flights (vs. 40,000 flights in 2013).
Fig.065. Monthly Number of Flights Source: State Aviation Service of Ukraine
0
10,000
20,000
30,000
40,000
50,000
60,000
70,000
2013 2014
Jan
Feb
Mar
Apr
May Jun Jul
Aug
Sep
Oct
Nov
Dec
Fig.066. Key Airports by Number of Flights (2014) Source: State Aviation Service of Ukraine
Fig.067. Key Airports by Passenger Flow (2014) Source: State Aviation Service of Ukraine
Kyiv Boryspil, 50.5%Intl. Airport Kyiv, 16.1%Odesa, 8.2%Dnipropetrovsk, 6.3%Lviv, 5.4%Other, 13.4%
Kyiv Boryspil, 63.0%Intl. Airport Kyiv, 10.0%Odesa, 8.0%Lviv, 6.0%Dnipropetrovsk, 4.0%Other, 9.0%

T R a n s P O R TaT i O n 083
Odesa International Airport is a joint stock company created in 2011 by the City of Odesa and a private investor, Odesa Airport Development, which invested USD 45m into a new terminal. In 2014, the airport served 865,000 passengers (–19% y-o-y) travelling with 11,745 flights.
Dnipropetrovsk International Airport became the main air hub in eastern Ukraine follow-ing the destruction of Donetsk International Airport in the course of the military conflict. The number of flights served by Dnipropetrovsk remained stable in 2014 at 8,900, which made it the only Ukrainian airport resilient to the crisis.
Lviv Danylo Halytskyi International Airport is the largest airport in western Ukraine, serv-ing 7,700 flights (–19% y-o-y) and 585,000 passengers (–16% y-o-y) in 2014. The airport cur-rently provides services to 18 airlines operating flights to 32 destinations (30 international and 2 domestic).
Passenger traffic in Kyiv Boryspil, the largest Ukrainian airport, is at least 30% below the average for the similar airports in the region but the share of the population it can serve is at least double the respective average. The second impediment to sustainable growth is the lower than average revenue per passenger (USD 19.0 in Boryspil vs. USD 23.7 in Warsaw, USD 36.1 in Budapest and USD 36.8 in Vienna).
Boryspil’s low revenue per passenger is primarily attributable to weak non-aviation rev-enue (USD 4.1/passenger compared to the peer group average of USD 11.7). While leading airports’ non-aviation fees account for 40-50% of their total revenue, Boryspil’s non-avi-ation fees generated only 20% of its total revenue in 2014.
Retail space in Kyiv Boryspil is currently underutilized, generating only USD 2,630 per square meter annually as opposed to USD 10,000-11,000 per square meter at leading global airports. At the same time, retail space per passenger at Kyiv Boryspil is one of the highest around the world, making room for further improvement in management of the airport.
Ukraine started negotiations with the EU on joining the European Common Aviation Area (ECAA) in November 2013. The signing of the ECAA was scheduled for June 2014 but was
Fig.068. Passenger Turnover by Airport (2013) Source: airport data
0
10,000
20,000
30,000
40,000
50,000
60,000
70,000
80,000
90,000
Bra
tisla
va
Bor
yspi
l (20
14)
Buc
hare
st
Bor
yspi
l (20
13)
Bud
apes
t
Bir
min
gham
War
saw
Edin
burg
h
Vnuk
ovo
Mos
cow
Athe
ns
Lond
on S
tans
ted
Vien
na
Cope
nhag
en
Zuri
ch
Sher
emet
yevo
M
osco
wD
omod
edov
o M
osco
w
Mun
ich
Lond
on G
atw
ick
Am
ster
dam
Sing
apor
e
Fran
kfur
t
Hon
g Ko
ng
Pari
s
Dub
ai
Lond
on H
eath
row
Bei
jing
Population, m
43 20 10 39 8

U K R A I N E ’ S T O P -1 0 0 S TAT E - O W N E D E N T E R P R I S E S › 2 0 1 3 & 9 M O N T H S 2 0 1 4084
postponed by the European party due to objections voiced by Spain and the United King-dom over formulation of the article on territorial application with respect to Gibraltar. At the same time, the Agreement remains an important issue on the agenda for EU-Ukraine relations in the transport sector following signing of the Association Agreement, including provisions on a Deep and Comprehensive Free Trade Agreement, in June 2014.
Fig.069. Revenue per Passenger (USD; 2013) Source: airport data
0.0
10.0
20.0
30.0
40.0
50.0
60.0
Fig.070. Non-Aviation Revenue per Passenger (USD; 2013) Source: airport data
0.0
5.0
10.0
15.0
20.0
25.0
avg.= $11.7
Fig.071. Retail Space per Passenger and Retail Revenue per Square Meter (2013) Source: media reports, Boryspil Airport
0
2,000
4,000
6,000
8,000
10,000
12,000
14,000
16,000
18,000
20,000
0
200
400
600
800
1,000
1,200
1,400
FrankfurtA msterdam Athens Zurich LondonGatwick
Aeroportsde Paris
LondonHeathrow
Budapest Boryspil(2014)
Vienna Singapore
Retail space / passenger Retail revenue per sq. m, $/sq.m

T R a n s P O R TaT i O n 085
According to the latest available information, the ECAA is expected to be signed in 2015. The key objectives of the Agreement are gradual liberalization of the aviation market in Ukraine, introduction of common rules in Ukraine and the EU in the field of civil aviation, and promotion of industrial and operational cooperation between the sides. Implementa-tion of the Agreement will allow any airline from an ECAA member state to operate flights in Ukraine, thus increasing competition and providing for higher utilization of Ukrainian airports.
Airports SWOT Analysis
Strengths
‣ Large local market with over 40 million population
‣ Diverse landscape makes aviation a structurally necessary mode of transportation
‣ Favorable location in Eastern Europe
‣ Sufficient network of airfields ready for further development
‣ Qualified human resources engaged in aviation-related services
Opportunities
‣ Signing the European Common Aviation Area to facilitate aviation market liberalization
‣ More efficient management of Kyiv Boryspil to make it an important transportation hub in Eastern Europe
‣ Improving operational efficiency of Ukrainian airports
‣ Creating conditions to attract more low-cost companies to the Ukrainian market
‣ Prospects for a visa-free regime with the EU that would boost travel volumes
Weaknesses
‣ Investments required to restore destroyed infrastructure in eastern Ukraine (incl. Donetsk and Luhansk airports)
‣ Low capacity utilization of the existing airport facilities
‣ Low income level of population makes air travel costly
‣ Lack of low-cost airlines
Threats
‣ Further drop in transit via Ukrainian airspace due to military conflict
‣ Loss of considerable share of passenger transportation with the start of the military conflict
‣ Economic turmoil and sharp decrease in travel expenses
‣ Threats to financial stability of Ukraine’s key airports: unsustainable debt, large share of doubtful accounts receivable

U K R A I N E ’ S T O P -1 0 0 S TAT E - O W N E D E N T E R P R I S E S › 2 0 1 3 & 9 M O N T H S 2 0 1 4086
Sea PortsUkraine has 13 sea ports with the total handling capacity of 149 Mt of mixed and bulk car-goes, 42 Mt of liquid cargoes, 40 Mt of container cargoes (3.5 million twenty-foot equiva-lent units), and 1 million passengers.
‣ The largest ports are Odesa, Illichivsk and Yuzhny, all located in the north-western part of the Black Sea. In 2014, they accounted for 63% of Ukraine’s total seaport cargo turnover.
‣ Three other ports (Mykolayiv, Kherson and smaller Oktyabrsk) are located at the estuaries of the Dnieper and Pivdenniy Buh rivers.
‣ In the Azov Sea region, Ukraine has two ports, Mariupol and Berdyansk. In previ-ous years, these ports benefited from their proximity to the industrialized Donbas region, shipping coal, iron ore and steel. However, in 2014 cargo turnover at Mari-upol declined by 16% y-o-y due to the ongoing military conflict in Donbas.
Another five sea ports are located in Crimea, which Russia annexed in March 2014. These ports are much smaller compared to those in mainland Ukraine. In 2013, they accounted for a mere 5% of total freight turnover at Ukrainian sea ports.
Fig.072. Map of Ukrainian Sea Ports Source: Ukrainian Sea Ports Administration
Fig.073. Ukraine Port Freight Turnover (Mt) Note: *2013 data includes Crimea, 2014 data is ex-Crimea. Source: Ukrainian Sea Ports Administration
0
20
40
60
80
100
120
140
160
2013 2014
Crimea
Berdyansk
Bilgorod-Dnistrovskiy
Izmayil
Illichivsk
Mariupol
Mykolayiv
Odesa
Reni
Skadovsk
Oktyabrsk
Ust'-Dunaysk

T R a n s P O R TaT i O n 087
In 2014, Ukrainian ports handled 143 Mt of cargoes, up from 137 Mt in 2013 (both figures exclude Crimean ports). The share of exports increased from 68% in 2013 to 72% in 2014 (primarily due to higher exports of grain and iron ore), while the share of transit contin-ued to decline due to oil and oil product flows shifting to Russian ports.
Yuzhny was the largest Ukrainian port by cargo turnover in 2014 with 47 Mt handled (33% of Ukraine’s total). Yuzhny is the deepest port in Ukraine (draft up to 18.5 meters) and the only one capable of accommodating Capesize vessels. Other relatively deep-water ports are Odesa, Illichivsk and Mykolayiv — they can accommodate Panamax vessels. Odesa and Illichivsk are also home to the main container termi-nals in Ukraine.
The domestic port management system was transformed in 2013, following the en-actment of a law that separated the admin-istrative and commer-cial functions of sea ports:
‣ Ukraine established a new governing body for its sea ports, the Ukrainian Sea Ports Administration (USPA). USPA took control of the ports’ strategic infrastruc-ture, namely the water zone, coast-protecting structures, berths, and general-use infrastructure such as access roads and utility connections. USPA is a management authority and is not engaged in stevedoring operations, thus it does not compete with state-owned and private stevedoring companies for revenue.
‣ State-owned ports (now called «state stevedoring companies») own the infrastruc-ture required for stevedoring operations, namely buildings, vessels, equipment for handling and other operations, as well as social and non-core assets. The state ste-vedoring companies no longer have administrative influence on port operations, which helps to foster competition between state-owned and private stevedoring companies. As of 2013, state stevedoring companies employed about 20,000 peo-ple. The depreciation rate of their fixed assets was estimated at 75-80% in 2013.
Legally, USPA is structured as a state-owned enterprise. It has a subsidiary in each of the 13 sea ports in mainland Ukraine (these subsidiaries serve as port administrations), and two other subsidiaries engaged in support operations, Delta Lotsman (harbour pilot services) and marine rescue service. USPA’s main office is located in Kyiv, yet the bulk of operations are conducted by the Odesa office. USPA is managed by the Cabinet of Min-isters through the Ministry of Infrastructure and the State Inspection for Sea and River Transport Safety. As of 2014, USPA employed about 8,000 people. USPA revenues consist of harbour fees (tonnage, wharfage, anchor, sanitary), ice passing dues, pilotage fees and other charges. USPA collects revenues through its subsidiaries and distributes part of this money back to the subsidiaries to finance their expenses. About 80% of USPA revenue is
Fig.074. Ukraine Port Turnover Structure (Mt) Note: *2013 data includes Crimea, 2014 data is ex-Crimea. Source: Ukrainian Sea Ports Administration
0
20
40
60
80
100
120
140
160
2012 2013 2014
Domestic
Transit
Imports
Export

U K R A I N E ’ S T O P -1 0 0 S TAT E - O W N E D E N T E R P R I S E S › 2 0 1 3 & 9 M O N T H S 2 0 1 4088
USD denominated, while expenses are primarily UAH denominated.
At each of the ports, in addition to the USPA subsid-iary (which acts as the port administrator), there is a state-owned stevedoring company. At the Odesa and Mykolayiv ports, the state-owned stevedoring compa-nies are engaged primarily in storage operations and some additional services (they are not active in tran-shipment), while state-owned stevedoring companies at other ports perform transhipment operations and thus compete with private stevedores.
State-owned stevedoring companies use USPA berths for their operations. Private stevedoring companies can either rent berths from USPA or build their own berths. Private stevedoring companies operate in all ports except Bilhorod-Dnistrovskiy, Ust-Dunaysk, and Mariupol.
The share of state-owned stevedoring companies in to-tal freight transhipment went down from 100% in 1991 to 34% in 2014, as more private companies became engaged in stevedoring operations. For example, the
state-owned stevedoring company at Yuzhny port accounted for 32% of the total turn-over in 2014, while 60% of the turnover was attributable to privately owned transhipment terminals (such as TIS, Borivage and others), and the remaining 8% was contributed by nitrogen fertilizer producer Odesa Portside Plant.
State-owned stevedoring companies primarily transhipped ore (36% of total volume in 2014), metals (20%) and coal (14%), while grain accounted for only 9%. Grain is mostly handled by private stevedores (see chart below). Dry cargo transhipment facilities at most ports can be used for both packaged and bulk cargoes.
Below we provide a brief overview of the six largest state-owned stevedoring companies.
Mariupol
‣ The largest port by turnover in the Azov Sea region
‣ Handling: 13 Mt (2014), incl. 12 Mt by the state stevedoring company
‣ 18 berths; port area: 77.7 ha
‣ Main products: ferrous metals, coal, ore, construction materials, grain
‣ Outdoor storage: 240,900 m²; indoor storage: 11,800 m²
Yuzhny
‣ The largest and deepest port in Ukraine
‣ Handling: 47 Mt (2014), incl. 15 Mt by the state stevedoring company
‣ Anchorage: 24 vessels at outer port water area
‣ Main cargoes: ore, grain, coal, chemicals, vegetable oil
‣ Outdoor storage: 185,500 m²; indoor storage: 2,000 m²
Illichivsk
‣ Handling: 17 Mt (2014), incl. 11 Mt by the state stevedoring company
‣ Main products: grain, ore, ferrous metals, oil products, containers
Fig.075. Port Freight Turnover by Berth Ownership (Mt) Source: Ukrainian Sea Ports Administration
State-owned stevedoring companiesoperating USPA berths, 48,6 (34%)
Private stevedoring companies renting USPA berths, 49,1 (34%)
Private stevedoring companies operating own berths, 45,0 (32%)

T R a n s P O R TaT i O n 089
‣ Outdoor storage: 575,000 m²; indoor storage: 27,000 m²
Odesa
‣ Handling: 25 Mt (2014), all by private stevedores (the state-owned stevedoring company provides storage services)
‣ Main cargoes: grain, containers, ferrous metals, oil products, ore, chemicals
‣ The container terminal is designed to handle 900,000 TEU p.a.
‣ Berthing line: over 8 km
‣ Outdoor storage: 425,000 m²; indoor storage: 60,000 m²
‣ In 2000, the Ukrainian parliament passed a law designating part of the Odesa Port as a special (free) economic zone, named Porto-Franco. It occupies an area of 32.5 ha, and was established for the period of 25 years. This territory enjoys a special customs and tax regime, including certain benefits for investors committing at least USD 1m and approved by the Odesa Region Administration.
Izmayil
‣ Handling: 3 Mt (2014), mainly by the state stevedoring company
‣ 24 berths, total berth length: 2.6 km
‣ Main products: coal, ore, ferrous metals
‣ Outdoor storage: 201,000 m²; indoor storage: 19,700 m²
Oktyabrsk
‣ Handling: 7 Mt (2014), incl. 2.4 Mt by the state stevedoring company
‣ 7 berths, total length: 1.9 km
Fig.076. State-owned stevedores (USPA berths)
Fig.077. Private stevedores renting USPA berths
Fig.078. Private stevedores operating own berths
Breakdown of Freight Turnover at Ukrainian Ports by Berth Ownership and Product Type Source: Ukrainian Sea Ports Administration
Ore, 36%
Metals, 20%
Coal, 14%
Grain, 9%
Construction materials, 7%
Other bulk, 5%
Ro-ro, 3%
Other, 6%
Grain, 26%Containers, 17%Metals, 16%Chemicals, 8%Oil products, 8%Veg. oil, 6%Other bulk, 5%Coal, 4%Fertilizers, 4%Ore, 4%Other, 2%
Grain, 36%Ore, 35%Coal, 8%Other bulk, 6%Metals, 3%Veg. oil, 3%Other, 9%

U K R A I N E ’ S T O P -1 0 0 S TAT E - O W N E D E N T E R P R I S E S › 2 0 1 3 & 9 M O N T H S 2 0 1 4090
‣ Main cargoes: grain, ferrous metals, chemicals, coal
‣ Outdoor storage: 264,800 m²; indoor storage: 40,000 m²
Sea Ports SWOT Analysis
Strengths
‣ Ukraine has significant potential for port development, given it has access to two seas and has inherited large port infrastructure from the Soviet Union
‣ Private agricultural, industrial and logistics companies have built port terminals for their own use. Other private companies rent berths from the Ukrainian Sea Ports Administration (USPA)
Opportunities
‣ Attract more private capital
‣ Invest in new facilities and equipment to increase cargo handling speed
‣ Streamline tariff policy
‣ Improve and streamline operational processes at USPA, create integrated financial reporting and IT systems covering all ports
‣ Cut costs, especially those related to non-core (social) infrastructure
‣ • Improve marketing and customer service
Weaknesses
‣ Limited water depths at many ports
‣ Aging buildings and equipment, poor customer service
‣ State-owned stevedoring companies are gradually losing market share to private companies
‣ USPA is the only state authority in charge of maintaining port depths and conducting necessary dredging works — but there is no clear system in place to manage the quality and timing of such works
‣ USPA tariff policy needs to be adjusted towards greater transparency and flexibilityy
Threats
‣ Decline in cargo transhipment on the back of general economic weakness
‣ The military conflict increases risks to Mariupol portt

T R a n s P O R TaT i O n 091
Ove
rvie
w o
f Ukr
aini
an S
ea P
orts
Port
s M
ain
good
s tr
anss
hipp
ed (2
014)
Turn
over
(201
3; M
t)Tu
rnov
er (2
014;
Mt)
Dra
ft
(met
ers)
Vess
els
(typ
e)M
ax.
dead
wei
ght
(kt)
Tota
lSt
ate-
own
ed
term
inal
sSh
are
of s
tate
-ow
ned
ter
min
als
Tota
lSt
ate-
own
ed
term
inal
sSh
are
of
stat
e-ow
ned
te
rmin
als
Ode
sa r
egio
n
83.7
25.9
31 %
90.2
25.9
29 %
4.5-
15.5
Pana
max
60-8
0
Ode
saG
rain
, con
tain
ers,
ferr
ous
met
als,
oil
prod
ucts
, ore
, che
mic
als
23.2
No
tran
sshi
pmen
t-
24.6
--
13.5
Pana
max
60-8
0
Illic
hivs
kG
rain
, ore
, bul
k ca
rgo,
ferr
ous
met
als,
oil
prod
ucts
, con
tain
ers
16.5
10.1
61 %
17.6
10.5
60 %
13.5
Pana
max
60-8
0
Yuzh
nyO
re, g
rain
, coa
l, ch
emic
als,
veg
etab
le o
il, b
ulk
carg
o43
.415
.235
%47
.414
.831
%13
.5-1
8.5
Cap
esiz
e80
-160
Bilh
orod
-Dni
stro
vski
yW
ood
0.7
0.7
100
%0.
60.
610
0 %
4.5
Han
dysi
ze/ H
andy
max
<60
Myk
olay
iv a
nd
Kh
erso
n re
gion
s
30.3
4.5
15 %
31.7
3.9
12 %
9-12
.5Pa
nam
ax/ H
andy
max
Myk
olay
ivG
rain
, ore
, fer
rous
met
als,
coa
l, ve
geta
ble
oil
20.3
No
tran
sshi
pmen
t-
20.8
--
9.0-
12.5
Pana
max
60-8
0
Okt
yabr
sk
Gra
in, f
erro
us m
etal
s, c
hem
ical
s, c
oal,
bulk
car
go5.
61.
833
%7.
02.
40.
3511
Han
dysi
ze<6
0
Kher
son
Gra
in, b
ulk
carg
o, fe
rrou
s m
etal
s, c
onst
ruct
ion
mat
eria
ls,
chem
ical
s
4.1
2.3
57 %
3.9
1.4
37 %
6.0-
7.6
Han
dysi
ze/ H
andy
max
<60
Skad
ovsk
Cons
truc
tion
mat
eria
ls0.
30.
398
%0.
10.
193
%4
Han
dysi
ze/ H
andy
max
<60
Dan
ube
port
s
5.6
3.3
60 %
4.6
3.7
81 %
4.0-
5.0
Reni
Gra
in, c
hem
ical
s, b
ulk
carg
o, o
il pr
oduc
ts2.
80.
621
%1.
50.
644
%5
Han
dysi
ze/ H
andy
max
<60
Ust
-Dun
aysk
Gra
in0.
040.
0410
0 %
0.1
0.1
100
%5
Han
dysi
ze/ H
andy
max
<60
Izm
ayil
Coal
, ore
, fer
rous
met
als
2.8
2.7
99 %
3.1
3.0
98 %
4H
andy
size
/ Han
dym
ax<6
0
Azo
v Se
a po
rts
17
.716
.694
%16
.215
.193
%4.
0-5.
0
Ber
dyan
skG
rain
, ore
, con
stru
ctio
n m
ater
ials
, coa
l, co
ke2.
22.
090
%3.
23.
093
%5.
0-8.
0H
andy
size
/ Han
dym
ax<6
0
Mar
iupo
lFe
rrou
s m
etal
s, c
oal,
ore,
con
stru
ctio
n m
ater
ials
, gra
in15
.514
.695
%13
.012
.193
%8.
5-9.
8H
andy
size
/ Han
dym
ax<6
0
Tota
l for
mai
nlan
d U
krai
ne
137.
350
.337
%14
2.8
48.6
34 %
4.0-
15.5
Pana
max
60-8
0
Crim
ea p
orts
11
.3-
--
--
7.2-
14Pa
nam
ax/ H
andy
max
Seva
stop
olFe
rrou
s m
etal
s, g
rain
4.8
--
--
-14
Pana
max
60-8
0
Kerc
hO
il pr
oduc
ts, c
oal
2.8
--
--
-7.
2H
andy
size
/ Han
dym
ax<6
0
Feod
osiy
aO
il pr
oduc
ts, c
onst
ruct
ion
mat
eria
ls2.
6-
--
--
7.3
Han
dysi
ze/ H
andy
max
<60
Yalt
a Pr
imar
ily fo
r pa
ssen
gers
; car
go: c
onst
ruct
ion
mat
eria
ls0.
2-
--
--
3.5-
9.75
Han
dysi
ze/ H
andy
max
<60
Yevp
ator
iya
Prim
arily
for
pass
enge
rs; c
argo
: con
stru
ctio
n m
ater
ials
1.0
--
--
-5-
8.25
Han
dysi
ze/ H
andy
max
<60
Tota
l (w
ith
Crim
ea)
14
8.6
--
142.
8-
-
Not
e: d
ata
as o
f 201
4 un
less
oth
erw
ise
note
d. S
ourc
e: U
SPA,
por
t web
site
s, m
edia
repo
rts

U K R A I N E ’ S T O P -1 0 0 S TAT E - O W N E D E N T E R P R I S E S › 2 0 1 3 & 9 M O N T H S 2 0 1 4092
Postal ServicesThe mix of items within Ukraine’s notional mailbag of parcels, periodicals and letters has changed over time. The number of letters sent within Ukraine decreased at a CAGR of 5% in 2008–2013 as electronic documents started to prevail. The periodicals segment also demonstrated a steep decline (CAGR –6% in 2008–2013) as customers switched to Internet-based media and social networks.
In 2008–2013, the number of parcel deliveries in Ukraine went up at a CAGR of 2%, driv-en by e-commerce development. However, this segment remains underdeveloped in Ukraine, comprising only up to 1% of the total mailbag, as opposed to developed markets (for instance, the share of parcels in the UK mailbag is around 12% ), which leaves a lot of potential for future growth.
The number of money transfers and pension payments conducted via postal braches also decreased over the last six years (CAGR –6%), suffering from competition with rapidly developing bank branches and the growing penetration of bank cards.
Postal connections between mainland Ukraine and Crimea were disrupted following Rus-sia’s annexation of the peninsula in March 20014, which (as well as the Donbas military conflict later) caused a significant across-the-board contraction in the postal services market last year. Letter deliveries dropped by 17% y-o-y to 256 million units , periodicals went down to 678 million units (–26% y-o-y), the number of parcels sent declined by 13% y-o-y to 16.9 million and the number of money transfers and pension payments fell by 13% to 100 million.
The market for postal services is currently dominated by the state-owned operator Ukrposhta, which holds a 42% market share (2013 data). At the same time, Ukrposh-ta’s share saw a steady decline in 2010–2013 (CAGR –5%), overtaken by smaller private companies.
Ukrposhta’s loss of market share can primarily be attributed to inefficient management of key processes inside the company and consequently low quality of services provided. Outdated IT systems and low level of automation compared to private operators also contributed to delays in service and declining customer demand.
Fig.079. Number of Postal Deliveries (millions) Note: 2014 data exclude Crimea. Source: State Statistics Service of Ukraine
0
200
400
600
800
1,000
1,200
1,400
1,600
1,800
2,000
2008 2009 2010 2011 2012 2013 2014
Periodicals Letters Money tranfers/pensions Parcels

T R a n s P O R TaT i O n 093
Ukrposhta has operated as a separate state-owned enterprise since 1994. Its core business today is the collection, sorting, transpor-tation and delivery of parcels and letters across Ukraine. The com-pany has all required infrastruc-tural assets to provide a full range
of postal services, including 109 sorting centres, 32,000 post-boxes, a fleet of over 3,500 cars, and 32 management units (incl. two in Crimea). Ukrposhta employs 85,000 people and offers over 50 types of different services to customers.
Ukrposhta operates over 12,600 branches across Ukraine, by far the largest network of postal offices in the country. Current legislation in the field of postal services mandates Ukrposhta to perform the social
Fig.080. Key Players in Postal Services Market (2013) Source: Ukrainian Direct Marketing Association
Fig.081. Ukrposhta Share of Postal Services Source: Ukrainian Direct Marketing Association
Ukrposhta, 42.3%Nova Poshta, 19.5%Meest Express, 6.5%Nichniy Express, 2.8%Postman, 2.6%Other, 26.3%
50%
48%
45%
42%
38%
40%
42%
44%
46%
48%
50%
52%
2010 2011 2012 2013
Fig.083. Ukrposhta Revenue Structure (2014) Source: Ukrposhta
Fig.082. Number of Retirees Served (millions) Source: Ukrposhta
7.47.1
6.7
6.16.36.7 6.9
7.4
0
1
2
3
4
5
6
7
8
2011 2012 2013 2014
Ukrposhta Commercial banks
Pensions, 35%Letters, 19%Parcels, 9%Utility payments, 8%Periodicals, 7%Other services, 22%

U K R A I N E ’ S T O P -1 0 0 S TAT E - O W N E D E N T E R P R I S E S › 2 0 1 3 & 9 M O N T H S 2 0 1 4094
function of operating a certain amount of branches in all regions, incl. small towns and villages, which is a loss-making activity.
Another social function performed by Ukrposhta is the processing and delivery of pen-sion payments. Ukrposhta served 6.1 million retirees in 2014 (down from 7.4 million in 2011). Its market share in this segment also declined as a result of banking system development.
Proceeds from pension services comprise the largest share of Ukrposhta revenue (35% in 2014). Other important revenue sources include delivery of letters and parcels (19% and 10%, respectively), processing of utility bills (8%), and distribution of periodicals (7%).
Ukrposhta’s financial results deteriorated in 2014 (revenue fell by 10% as a result of lost connections with Crimea and eastern Ukraine). At the same time, the net margin re-mained close to zero, in line with previous years.
Ukrposhta spent almost UAH 900m on CAPEX in 2010–2014 (incl. UAH 400m for computer hardware and software). While further analysis is required, these expenses seem to be higher than market levels for similar products.
The action plan to improve Ukrposhta’s efficiency should include introduction of quality control systems; optimization of technical and logistical processes to speed up custom-er service; new front-office systems in the post offices, and integration with a central-ized database; improvement in transparency and accountability of the management, especially with respect to CAPEX decisions.
Fig.085. Ukrposhta CAPEX (2010–14) Source: UkrposhtaFig.084. Ukrposhta Key Financial Indicators Source: Ukrposhta
0%
1%
2%
3%
4%
5%
3.4
3.5
3.6
3.7
3.8
3.9
4.0
2012 2013 2014E
Revenue, UAH m Net income margin, %
Computer hardware and licenses, 45%Premises maintenance, 25%Postal equipment, 15%Transport fleet, 9%Other assets, 6%
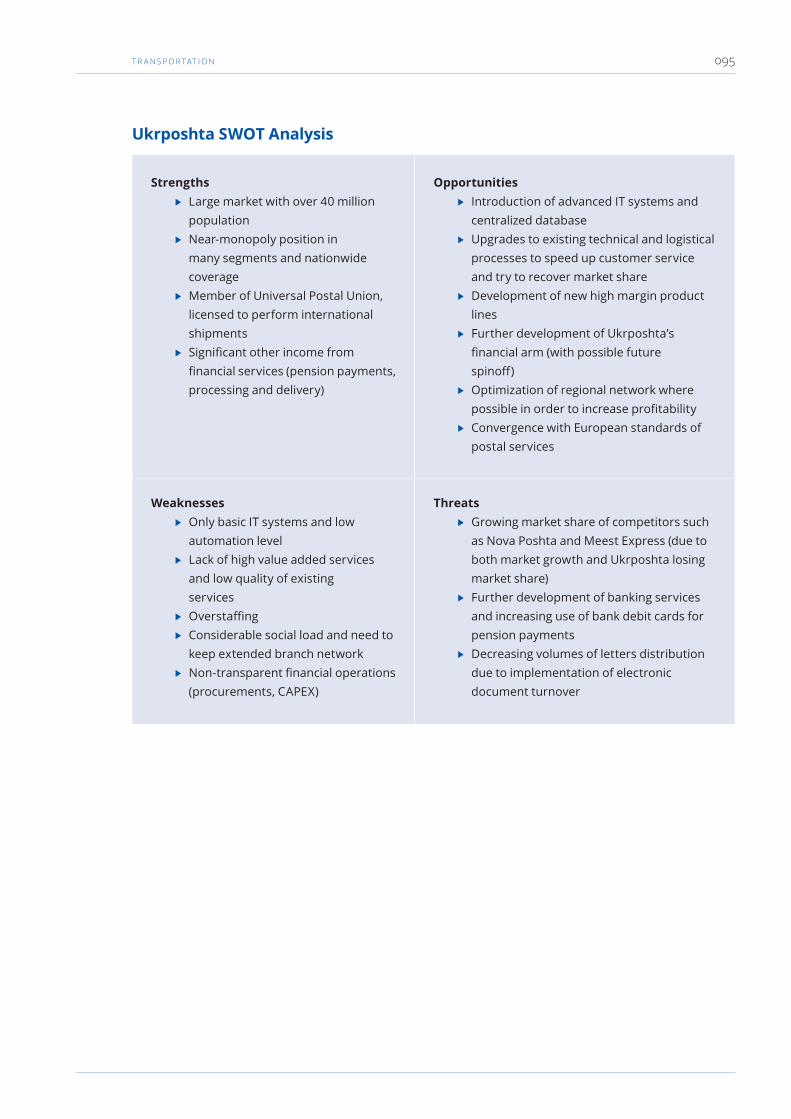
T R a n s P O R TaT i O n 095
Ukrposhta SWOT Analysis
Strengths
‣ Large market with over 40 million population
‣ Near-monopoly position in many segments and nationwide coverage
‣ Member of Universal Postal Union, licensed to perform international shipments
‣ Significant other income from financial services (pension payments, processing and delivery)
Opportunities
‣ Introduction of advanced IT systems and centralized database
‣ Upgrades to existing technical and logistical processes to speed up customer service and try to recover market share
‣ Development of new high margin product lines
‣ Further development of Ukrposhta’s financial arm (with possible future spinoff)
‣ Optimization of regional network where possible in order to increase profitability
‣ Convergence with European standards of postal services
Weaknesses
‣ Only basic IT systems and low automation level
‣ Lack of high value added services and low quality of existing services
‣ Overstaffing
‣ Considerable social load and need to keep extended branch network
‣ Non-transparent financial operations (procurements, CAPEX)
Threats
‣ Growing market share of competitors such as Nova Poshta and Meest Express (due to both market growth and Ukrposhta losing market share)
‣ Further development of banking services and increasing use of bank debit cards for pension payments
‣ Decreasing volumes of letters distribution due to implementation of electronic document turnover

U K R A I N E ’ S T O P -1 0 0 S TAT E - O W N E D E N T E R P R I S E S › 2 0 1 3 & 9 M O N T H S 2 0 1 4096
Machine BuildingOverview of Sector SOEsMachine-building is one of Ukraine’s largest industrial sectors with a 7.9% share of 2014 industrial production. Its share declined from 9.8% in 2013 due to the military conflict in the east of the country, Russian restrictions on Ukrainian imports (particularly machinery products) and overall economic recession. Although many sub-industries, including pro-duction of railcars, automobiles, aircraft engines and partly power machinery, are mostly privatized, the state’s role is still significant. Ten companies out of the TOP-100 SOEs rep-resent the machine-building sector, accounting for almost 5% of the TOP-100’s 9M14 net sales, and are leaders in their respective business segments. Antonov is Ukraine’s major producer of airplanes, Pivdenmash is a world-known company capable of manufactur-ing rockets and space launch vehicles. Hartron develops and produces control systems for rockets and missiles. Turboatom is a unique manufacturer of turbine equipment for power plants, while Electrovazhmash producers electric generators and hauling equip-ment competitive on a global scale.
Machine Building Sector SOEs (9M14 data)Name Core activity Net sales
(UAH m)
Assets
(UAH m)
Number of
employees
State stake ROCE
Antonov Aerospace 2.4 6.0 12,614 100 % 3.2 %
Civilian Aviation Plant #410 Aerospace 0.3 0.4 1,230 100 % (58.0 %)
Hartron Aerospace 0.2 0.6 1,540 50 % +1 share 6.2 %
Kharkiv State Aviation Enterprise Aerospace 0.3 2.3 3,906 100 % (9.9 %)
Kommunar Aerospace 0.3 0.4 2,914 100 % 15.6 %
Pivdenmash Aerospace 0.5 4.2 8,890 100 % (70.7 %)
Pivdenne Design Bureau Aerospace 0.4 5.1 4,817 100 % 15.6 %
Elektrovazhmash Power 1.5 1.4 6,586 100 % 20.2 %
Turboatom Power 1.5 4.0 5,846 75.2 % 37.7 %
Elektrovozobuduvannya Railway 0.1 0.3 1,318 100 % 1.3 %
The aforementioned 10 companies reported combined sales of UAH 7.5bn in 9M14 (+8% y-o-y), with growth led by Antonov (+UAH 125m), Pivdenmash (+UAH 297m) and Turboatom (+UAH 257m). These three companies accounted for 57% of the group’s total revenue. At the same time, Aviation Plant #410 experienced a decline in sales by UAH 172m to UAH 252m.
The group’s combined EBITDA slid by 25% y-o-y to UAH 1.1bn in 9M14. But with smaller operating expenses, the EBITDA margin picked up to 14.2% from 13.4% in 2013. Antonov’s EBITDA was mostly stable at UAH 316m, Pivdenne Design Bureau boosted its EBITDA five-fold to UAH 421m, while Pivdenmash recorded negative EBITDA of UAH 664m. Turboatom almost doubled EBITDA to UAH 815m.
Only three enterprises showed positive dynamics on the bottom line. Electrovazhmash, Kommunar and Turboatom increased net profit by UAH 29m, UAH 33m and UAH 424m to UAH 84m, UAH 36m and UAH 823m, respectively, in 9M14. However, these were more

M A c H I N E B U I l D I N G 097
than offset by Pivdenmash and Pivdenne Design Bureau’s losses (almost UAH 2.5bn combined).
Other 9M14 financial indicators were little-changed from 2013 except total debt, which rose by more than UAH 2bn over the period as Pivdenmash and Pivdenne Design Bu-reau attracted long-term debt to replenish their working capital. Thus, even accounting for available cash, the 10 companies saw their combined Net Debt/EBITDA ratio rise to 5.3x in 9M14 from 3.8x in 2013, facing some of them with the prospect of urgent liability management.
Despite economic recession and other negative factors on the sector and company levels, the machine-building sector SOEs’ aggregate ROCE remained positive. Power machinery companies, Turboatom and Elektrovazhmash, demonstrated the strongest performance (38% and 20% in 9M14, respectively), while aerospace enterprises lagged (Pivdenmash with –71%, Civilian Aviation Plant #410 with –58%).
Machine Building Sector SOEs’ Aggregated FinancialsP&L (UAH m) 2013 9M14 Balance Sheet (UAH m) 2013 9M14
Net Sales 10,509 7,518 Total Assets 24,027 24,547
Cost of Goods Sold 8,515 5,998 Fixed Assets 6,737 6,635
Gross Profit (Loss) 1,993 1,520 PPE 3,296 3,164
EBITDA 1,411 1,064 Current Assets 17,290 17,912
Depreciation 485 389 Accounts Receivable 6,036 6,392
Operating Profit (Loss) 925 676 Cash & Equivalents 2,362 2,352
Financial Income (Loss) (459) (312) Total Liabilities & Equity 24,027 24,547
Pre-Tax Profit (Loss) 466 (1,574) Total Liabilities 17,317 19,866
Corporate Tax 246 188 Accounts Payable 8,179 8,380
Net income (Loss) 220 (1,762) Debt 7,788 9,925
Dividends paid na na Equity 6,710 4,680
Ratios 2013 9M14
Sales Growth ( %, y-o-y) 3.3 % 7.5 %
EBITDA Margin ( %) 13.4 % 14.2 %
Net Margin ( %) 2.1 % (23.4 %)
Debt/Equity ( %) 116 % 212 %
Net Debt/EBITDA (x) 3.85 5.34
ROE ( %) 3.3 % (43.5 %)
ROA ( %) 0.9 % (9.8 %)
ROCE ( %) 6.4 % 6.2 %
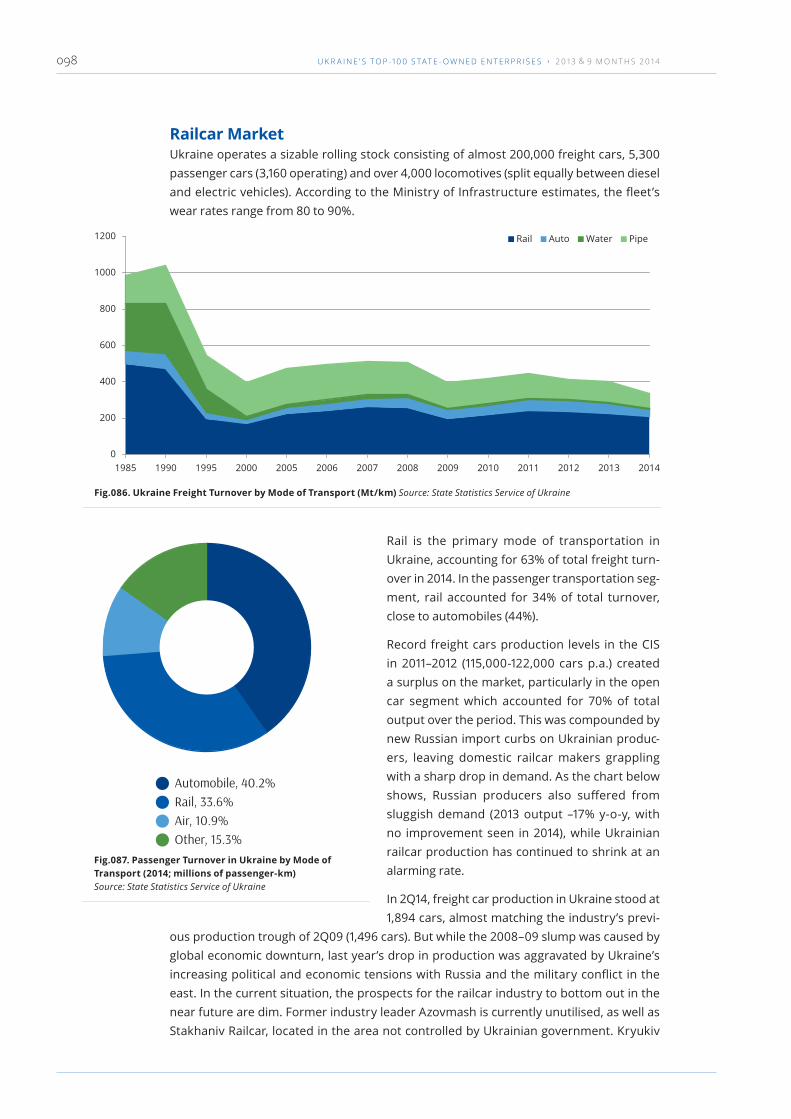
U K R A I N E ’ S T O P -1 0 0 S TAT E - O W N E D E N T E R P R I S E S › 2 0 1 3 & 9 M O N T H S 2 0 1 4098
Railcar MarketUkraine operates a sizable rolling stock consisting of almost 200,000 freight cars, 5,300 passenger cars (3,160 operating) and over 4,000 locomotives (split equally between diesel and electric vehicles). According to the Ministry of Infrastructure estimates, the fleet’s wear rates range from 80 to 90%.
Rail is the primary mode of transportation in Ukraine, accounting for 63% of total freight turn-over in 2014. In the passenger transportation seg-ment, rail accounted for 34% of total turnover, close to automobiles (44%).
Record freight cars production levels in the CIS in 2011–2012 (115,000-122,000 cars p.a.) created a surplus on the market, particularly in the open car segment which accounted for 70% of total output over the period. This was compounded by new Russian import curbs on Ukrainian produc-ers, leaving domestic railcar makers grappling with a sharp drop in demand. As the chart below shows, Russian producers also suffered from sluggish demand (2013 output –17% y-o-y, with no improvement seen in 2014), while Ukrainian railcar production has continued to shrink at an alarming rate.
In 2Q14, freight car production in Ukraine stood at 1,894 cars, almost matching the industry’s previ-
ous production trough of 2Q09 (1,496 cars). But while the 2008–09 slump was caused by global economic downturn, last year’s drop in production was aggravated by Ukraine’s increasing political and economic tensions with Russia and the military conflict in the east. In the current situation, the prospects for the railcar industry to bottom out in the near future are dim. Former industry leader Azovmash is currently unutilised, as well as Stakhaniv Railcar, located in the area not controlled by Ukrainian government. Kryukiv
Fig.086. Ukraine Freight Turnover by Mode of Transport (Mt/km) Source: State Statistics Service of Ukraine
0
200
400
600
800
1000
1200
1985 1990 1995 2000 2005 2006 2007 2008 2009 2010 2011 2012 2013 2014
Rail Auto Water Pipe
Fig.087. Passenger Turnover in Ukraine by Mode of Transport (2014; millions of passenger-km) Source: State Statistics Service of Ukraine
Automobile, 40.2%Rail, 33.6%Air, 10.9%Other, 15.3%

M A c H I N E B U I l D I N G 099
Railcar was able to preserve production of freight cars at minimum levels and additionally benefited from a side project to modernize metro cars and selling a speed train to state rail monopoly Ukrzaliznytsia.
Solid production of multi-purpose open (gondola) cars in Ukraine in 2009–2012 (72% of total freight car output in 2011) was followed by an abrupt drop in demand. Lower lease rates also contributed to depressing open car production. As a result, open cars account-ed for only 18% of total freight car output in 2013, while hoppers increased their share to 32% (from 10% in 2012 and 2% in 2011). This production shift, which was peculiar to Ukraine only, demonstrated how urgently local producers had to reorient themselves to find new demand after Russia closed its open car market to exports from Ukraine. The share of gondola cars in total output CIS-wide was still the largest at 43% (vs. 25% for hoppers) in 2013.
Ukraine’s leading locomotive producer Luhanskteplovoz, one of the largest companies of its kind in the CIS, boosted production several years ago after it was privatized by a Rus-sian investor. Given it is now located on the territory not controlled by Ukrainian govern-ment, its economic prospects are very difficult to forecast.
Fig.088. Average Monthly Railcar Output: Ukraine vs. Russia (2004–2014; ‘000) Source: State Statistics Service of Ukraine, PG-online
2
4
6
8
10
2004 2005 2006 2007 2008 2009 2010 2011 2012 2013 2014
Russia Ukraine
Fig.089. Quarterly Railcar Output in Ukraine (2007–1H14; ‘000) Note: *mostly Diesel Plant and Ukrzaliznytsia subsidiaries. Source: State Statistics Service of Ukraine, PG-online, Companies
0
2
4
6
8
10
12
14
16Azovmash Kryukiv Car Stakhaniv Car Dniprovahonmash Others*
1Q07
2Q07
3Q07
4Q07
1Q08
2Q08
3Q08
4Q08
1Q09
2Q09
3Q09
4Q09
1Q10
2Q10
3Q10
4Q10
1Q11
2Q11
3Q11
4Q11
1Q12
2Q12
3Q12
4Q12
1Q13
2Q13
3Q13
4Q13
1Q14
2Q14

U K R A I N E ’ S T O P -1 0 0 S TAT E - O W N E D E N T E R P R I S E S › 2 0 1 3 & 9 M O N T H S 2 0 1 4100
Although many Ukrainian railcar and locomotive producers are already privatized, the industry remains of significant importance for the state. Rail monopoly Ukrzaliznytsia is exposed to the industry as a key customer of railcar and locomotive manufacturers and direct owner of repair plants. In addition, a number of enterprises in the sector remain state-owned. Ranking among the TOP-100 SOEs is Elektrovozobuduvannya, a unique pro-ducer of electric locomotives for mining and mainline applications designed for using both direct and alternating current. Other SOEs include close to ten Ukrzaliznytsia sub-sidiaries involved in the production and repair of railcars and locomotives (e.g. Darnyt-sya, Stryy and Ukrspetsvagon railcar repair plants and locomotive repair plants based in Poltava, Kyiv and Lviv).
Fig.090. Ukrainian Railcar Output Structure (2011) Source: PG-online, Companies
Fig.091. Ukrainian Railcar Output Structure (2013) Source: PG-online, Companies
Open (gondola), 71.5%Tank, 24.9%Hopper, 1.9%Platform, 0.9%
Platform, 1.1%Box, 8.5%Open, 17.7%Hopper, 31.8%Tank, 40.4%

M A c H I N E B U I l D I N G 101
Railcar and Locomotive Market SWOT Analysis
Strengths
‣ Large capacities to produce all types of railcar and selected locomotive models; most component parts (bogies, wheels, metals) can be sourced locally
‣ Extensive domestic rail network, strengthening demand potential
Opportunities
‣ Potential sizable local orders to renovate aging rolling stock
‣ Diversification into the defense sector and expansion into other segments (metro railcars, passenger trains)
‣ Joint projects with foreign partners
‣ Reform of rail monopoly Ukrzaliznytsia to foster modernization of its asset base
Weaknesses
‣ Production has virtually stopped due to Russian import bans and slow diversification into other markets
‣ Some capacities located on occupied territory in the east are idling or damaged
Threats
‣ Unless domestic and foreign demand recovers, domestic manufacture of railcars, locomotives and trains may find themselves at risk of continuing as a going concern in a few years
‣ Failure to diversify supplies and meet modern technical/quality requirements

U K R A I N E ’ S T O P -1 0 0 S TAT E - O W N E D E N T E R P R I S E S › 2 0 1 3 & 9 M O N T H S 2 0 1 4102
Aircraft MarketUkraine succeeded in preserving its aerospace industry after the Soviet Union collapse, with all major producers remaining in state ownership to date. Top enterprises in this industry include aircraft manufacturers Antonov, Civilian Aviation Plant #410, and Kharkiv State Aviation Enterprise, and producers of launch vehicles, spacecraft and high-tech con-trol systems for the aerospace, defense and other sectors Pivdenmash, and Pivdenne Design Bureau, Hartron and Komunar. Aerospace is one of the few industries in Ukraine remaining competitive regionally and even globally despite its very complex and capital intensive production processes.
Ukraine’s Soviet-era-built production capacities were originally intended to serve the entire Soviet Union and its allies, meaning the Ukrainian market alone is too small to provide sufficient demand to keep the industry afloat nowadays. The sector’s global diversification efforts have had limited success so far, with Russia remaining its major counterparty to date — a legacy of close Soviet-era production links, on the one hand, and a reflection of tight competition in this high-tech segment globally, on the other. How-ever, with Ukraine’s trade relations with Russia continuing to deteriorate in the view of Russia’s annexation of Crimea and the military conflict in the east, sales to the Russian market are unstable. Local projects (especially demand from the defense sector) could potentially generate sizable revenue but Ukraine’s current financial difficulties and lack of information about potential defense sector orders make the outlook for domestic de-mand uncertain. The above increases importance of global expansion for local aircraft manufacturers.
Mirroring world economic trends, global air passenger traffic grew by 5.6% y-o-y in 2013, to 5.9 trillion revenue passenger kilometres (RPK; a measure of passenger traffic calcu-lated by multiplying the number of fare-paying passengers by the number of kilometres they fly). World traffic surged by over 70% in the last decade and is up almost six-fold since 1980 despite multiple recessions, financial crises, oil price shocks, military conflicts, and risks of global pandemics. In the long term, major aircraft producers estimate air traffic may double in the next 15 years, with 20-year CAGR forecasts averaging 5% and significantly outpacing the long-term world economic growth forecast of c. 3% p.a.
Fig.092. Average Annual Passenger Air Traffic Growth (2014–2033F) Source: Airbus, Boeing
Fig.093. Average Freight Growth Rate (2014–2033F) Source: Airbus, Boeing
6.9%
6.3%
6.4%
6.2%
5.9%
4.4%
5.0%
3.9%
2.9%
China
Middle East
Latin America
Africa
CIS
World
Europe
North America
6.7%
6.1%
5.9%
5.5%
5.3%
4.0%
4.7%
3.5%
3.4%
China
Africa
Middle East
Latin America
CIS
World
Europe
North America
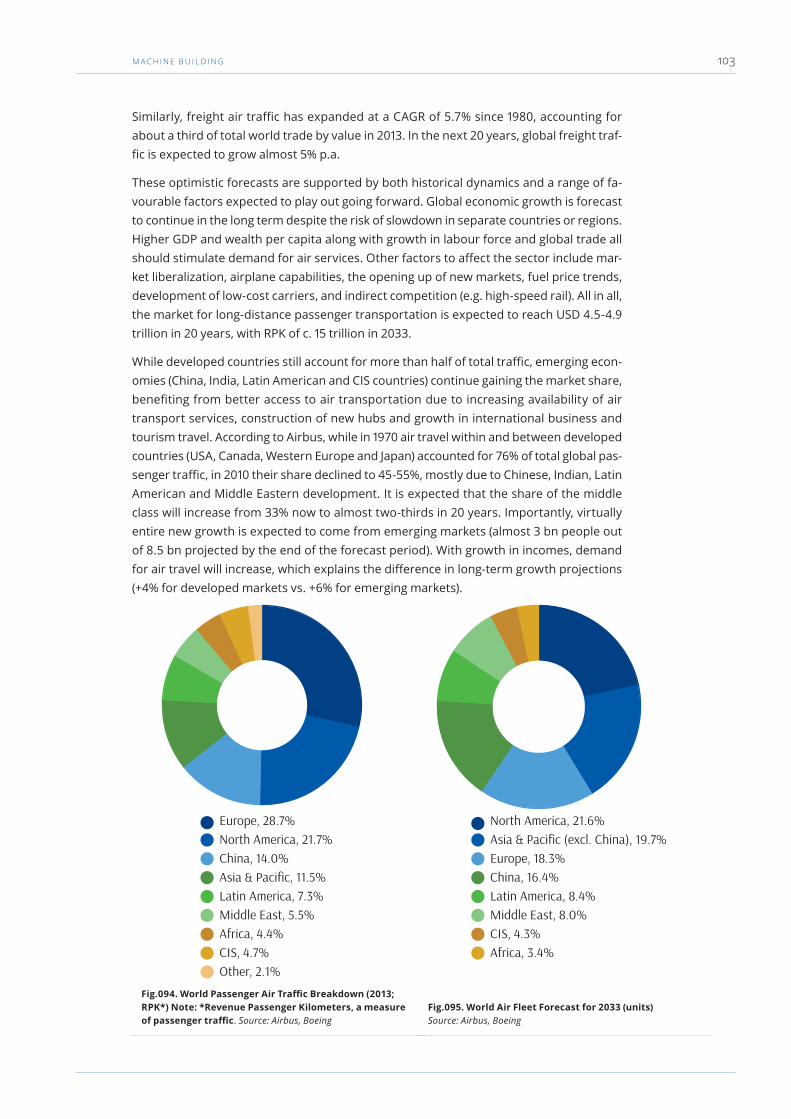
M A c H I N E B U I l D I N G 103
Similarly, freight air traffic has expanded at a CAGR of 5.7% since 1980, accounting for about a third of total world trade by value in 2013. In the next 20 years, global freight traf-fic is expected to grow almost 5% p.a.
These optimistic forecasts are supported by both historical dynamics and a range of fa-vourable factors expected to play out going forward. Global economic growth is forecast to continue in the long term despite the risk of slowdown in separate countries or regions. Higher GDP and wealth per capita along with growth in labour force and global trade all should stimulate demand for air services. Other factors to affect the sector include mar-ket liberalization, airplane capabilities, the opening up of new markets, fuel price trends, development of low-cost carriers, and indirect competition (e.g. high-speed rail). All in all, the market for long-distance passenger transportation is expected to reach USD 4.5-4.9 trillion in 20 years, with RPK of c. 15 trillion in 2033.
While developed countries still account for more than half of total traffic, emerging econ-omies (China, India, Latin American and CIS countries) continue gaining the market share, benefiting from better access to air transportation due to increasing availability of air transport services, construction of new hubs and growth in international business and tourism travel. According to Airbus, while in 1970 air travel within and between developed countries (USA, Canada, Western Europe and Japan) accounted for 76% of total global pas-senger traffic, in 2010 their share declined to 45-55%, mostly due to Chinese, Indian, Latin American and Middle Eastern development. It is expected that the share of the middle class will increase from 33% now to almost two-thirds in 20 years. Importantly, virtually entire new growth is expected to come from emerging markets (almost 3 bn people out of 8.5 bn projected by the end of the forecast period). With growth in incomes, demand for air travel will increase, which explains the difference in long-term growth projections (+4% for developed markets vs. +6% for emerging markets).
Fig.094. World Passenger Air Traffic Breakdown (2013; RPK*) Note: *Revenue Passenger Kilometers, a measure of passenger traffic. Source: Airbus, Boeing
Fig.095. World Air Fleet Forecast for 2033 (units) Source: Airbus, Boeing
Europe, 28.7%North America, 21.7%China, 14.0%Asia & Pacific, 11.5%Latin America, 7.3%Middle East, 5.5%Africa, 4.4%CIS, 4.7%Other, 2.1%
North America, 21.6%Asia & Pacific (excl. China), 19.7%Europe, 18.3%China, 16.4%Latin America, 8.4%Middle East, 8.0%CIS, 4.3%Africa, 3.4%

U K R A I N E ’ S T O P -1 0 0 S TAT E - O W N E D E N T E R P R I S E S › 2 0 1 3 & 9 M O N T H S 2 0 1 4104
Due to continued growth in transportation volumes, the number of new airplane de-liveries in the past few years tended to be larger than the number of replacements, amid increased aircraft utilization and growing average aircraft size. The consen-sus forecast among major aerospace in-dustry producers is that the existing global aircraft fleet will double by 2033, with 30,500-35,900 regional, single-aisle and twin-aisle aircraft and freighters (worth over USD 5 trillion at current prices) to be produced over 2014–2033 to meet new demand and provide better passenger comfort. The passenger segment will obvi-ously account for the bulk of new demand (about USD 5 trillion vs. c. USD 200bn for
the freight segment).
The CIS market accounted for 5% of to-tal passenger air traffic in 2013 but its share is expected to decline in the next 10-20 years due to more robust growth in other regions. Moreover, these pro-jections were made before the recent onset of economic recession in Russia and Ukraine and elevated risks for other economies in the region, implying more modest growth prospects and little up-side for domestic producers (even if one discounted further Russian trade curbs against Ukraine). Still, Ukraine cannot afford to fully discard the CIS market for the time being, and it is likely to remain a key export destination for local compa-nies at least in the next several years.
Meanwhile, the more promising new markets for Ukraine to compete for lie outside the CIS, with much stronger growth in both the passenger and trans-port segments forecast for Asia (par-ticularly China in view of its huge intra-country travel potential), Africa and the Middle East.
In terms of individual market segments, single-aisle aircraft are forecasted to account for the dominant share of new orders (estimates range widely from 22,000-30,000 planes), followed by small
Fig.096. Passenger Fleet Development Forecast (units) Source: Boeing
0
5,000
10,000
15,000
20,000
25,000
30,000
35,000
40,000
2013 Retired New deliveries 2033
39,45035,930
(15,700)19,220
Fig.098. CIS Regional Aircraft Fleet Development Forecast (2013–2033) Source: Boeing
Fig.097. Freighter Fleet Development Forecast (units) Source: Boeing
0
500
1,000
1,500
2,000
2,500
3,000
(1,130)1,6901,130
840 2,730
2013 Retired New deliveries
2033Conversions
1,180
1,330 1,820
0
200
400
600
800
1,000
1,200
1,400
1,600
1,800
2,000
(490)
2013 Retired/Converted
New deliveries
2033

M A c H I N E B U I l D I N G 105
wide body planes (c. 4,000-5,000), medium (3,000), regional (2,000-2,500) and large wide body planes (below 1,000). In the cargo segment, the strongest demand is forecast for large (over 80 t) and medium (40-80 t) planes, though the share of standard car-riers (<45 t) is projected to remain high and even increase (to c. 40%) due to conversion of passenger planes.
Antonov aircraft remain in active use globally, with estimated 4,100 planes currently in operation (more than 50% of them in Russia and other CIS countries). However, the An-2 light utility transport plane accounts for about half of the operating fleet (almost 15,000 An-2s have been manufactured since 1950). The second largest group (est. 1,200 planes) is composed of cargo ramp airplanes, Antonov’s principal market niche in which its famous heavy lifters An-124 Ruslan and An-225 Mriya operate. Before the Soviet collapse, An models accounted for up to 30% of operating freighters globally. Historically, Antonov’s production was almost equally split between the civilian and defence sectors.
Analyzing Ukraine’s current aircraft model range and capacity through the prism of the aforementioned long-term projections for the global aircraft market suggests Antonov
Fig.099. Regional Jets Fleet Global Forecast (2013–2033) Source: Boeing
Fig.100. Global Distribution of Operating Antonov Aircraft Source: Ministry of Economic Development and Trade
0
500
1,000
1,500
2,000
2,500
3,0002,6402,490(2,470)2,620
2013 Retired/Converted
New deliveries
2033Russia, 37.0%CIS (excl. Russia), 14.0%Africa, 18.0%Latin America, 10.0%South-East Asia, 10.0%Middle East, 5.0%India, 4.0%Europe, 2.0%
Fig.101. Production of Antonov Aircraft (1992–2013) Source: Ministry of Economic Development and Trade
66
16
15 13
6
14
1 1 1 1 2
3 5 5
1 1 2 1 4
5 4 4
0
10
20
30
40
50
60
70
80
1992 1993 1994 1995 1996 1997 1998 1999 2000 2001 2002 2003 2004 2005 2006 2007 2008 2009 2010 2011 2012 2013
Other countries Ukraine

U K R A I N E ’ S T O P -1 0 0 S TAT E - O W N E D E N T E R P R I S E S › 2 0 1 3 & 9 M O N T H S 2 0 1 4106
could successfully compete in a number of market segments. Its most promising models include regional passenger jets An-148/An-158; regional freighter An-178; military trans-port plane An-70 (for which Ukraine needs to find a sales niche globally, as joint assembly and sales plans with Russia are no longer feasible); An-140 regional mixed-use turboprop jet; An-124 Ruslan, one of the largest cargo planes; and regional transport jet An-74.
Prior to last year’s worsening of relations with Russia, local aircraft production estimates included Russia and other Customs Union countries. Still, even disregarding Russia/CIS for the time being, estimated potential demand for some of Antonov planes is high enough. For example, non-CIS demand for the An-140 and An-158 passenger jets was previously estimated at about 300 planes for each model (or USD 5-7bn and USD 8bn, respectively, in value terms). Factoring in the An-148 (and assuming it can also be equipped with foreign-made engines in addition to motors currently supplied by local producer Motor Sich), total demand may theoretically reach 500 aircraft. Total demand for the An-70 transport plane was initially estimated at 100 units (with total value in excess of USD 6bn), including Russia and India.
In order to meet this global demand, Antonov needs to address a number of obstacles that have hampered its international sales to date, including poor marketing strategy that has so far resulted in very limited sales of the An-148 to a few markets with low potential such as North Korea or Cuba. Another potential issue in the passenger transportation segment for Antonov is the diversification of engine purchases (its current sole supplier is Motor Sich). Besides, sector research shows the average aircraft size is converging to-wards approx. 160 seats, while the An-148/158 can carry 70-100 passengers. Also the An-148/158 face strong competition from Russia’s SSJ-100 as well as the Embraer ERJ-170-190 and Bombardier CRJ-700/900/1000, not to mention the global leaders Boeing and Airbus. In the air freight market, demand is currently oriented towards large sizes (>45 t), which is more fitting for the An-70 rather than Antonov’s newly designed An-178 (est. 15-20 t).

M A c H I N E B U I l D I N G 107
Aircraft Market SWOT Analysis
Strengths
‣ Globally competitive production and R&D base for passenger and transport aircraft, helicopters, and space launchers
‣ Large presence (over 4,000 An aircraft globally) in different market segments
‣ Still solid market position in cargo aircraft transportation (especially ramp cargo)
‣ Valuable know-how in one of the most advanced and technologically complex segments of the manufacturing industry
Opportunities
‣ Local orders, particularly from the defense sector
‣ Divestment of non-core assets
‣ Diversification of input supplies along with streamlining certification
‣ Focus on core and most demanded products in crisis years
‣ Cost optimization (but careful approach is needed to personnel costs given the sector’s critical dependence on skilled labor)
‣ Joint projects with foreign partners to attract investment and facilitate entry into new promising markets in Asia, MENA, Africa
‣ Harmonization of relevant standards with those of the EU to gain access to new markets and potentially cooperate on EU projects
‣ Corporatization of Antonov to create one major aircraft company involved in production, maintenance, lease, freight transportation and provision of other services
Weaknesses
‣ Inability to produce aircraft on a large scale due to input supply bottlenecks, including imports from Russia
‣ Generally weak marketing capabilities in terms of promoting aircraft independently from Russia
‣ Cooperation with Russia is now mostly frozen
‣ Lack of working and investment capital compounds short and long-term risks for many enterprises
‣ Persistently low R&D spending to develop new aircraft
‣ Weaker activity in historically strong market segments (e.g. ramp cargo aircraft)
‣ High debts and losses at several companies
‣ Complicated and inefficient organizational structure of selected companies (in terms of subsidiaries))
Threats
‣ Lack of financing may further constrain production and increase bankruptcy risk in the medium term
‣ Failure to diversify input supplies
‣ Failure to diversify sales and gain access to new markets
‣ Attempts to allocate limited financial, human and other resources for too many aircraft upgrade or construction projects without thorough analysis of their potential to generate sustainable cash flows
‣ Concentration on projects facing severe regional or global competition (e.g. An-148/158)
‣ Corporate governance issues at selected companies

U K R A I N E ’ S T O P -1 0 0 S TAT E - O W N E D E N T E R P R I S E S › 2 0 1 3 & 9 M O N T H S 2 0 1 4108
Power Machinery MarketPower machinery is one the industrial sub-sectors that have succeeded in preserving its production capacity post-Soviet Union collapse, both in terms of fixed assets and qualified labour, and retaining its status as a regional and global player. In view of limited demand in Ukraine (partly due to the industry’s sizable capacities surpassing domestic demand and partly due to the impact of domestic economic crises), most power machinery pro-ducers remain export-oriented, with Russia being until recently the major contractor.
The largest power machinery producers among top state-owned companies are Turboat-om and Electrovazhmash.
Turboatom produces turbine equipment for thermal, nuclear and hydroelectric power generating plants, supplying over 10% of the world’s nuclear power generating capacity, which makes it the world’s fourth-largest turbine producer. In Ukraine, the company’s turbines operate at 40% of thermal power plants, 85% of nuclear power plants and 95% of hydro power plants. Turboatom’s current capacity allows for annual production of steam and hydro turbines with total generating capacity of 8 GW and 2 GW, respectively. The
Fig.102. Production of Selected Heavy Machinery Items Note: *millions of units; **’000 units. Source: State Statistics Service of Ukraine
0
1
2
3
4
5
6
7
8
Electric engines,generators*
Electrictransformers*
Pumps* Cargo lifters,conveyors**
Machinery formetals
production**
Drilling, tunnellingmachinery**
Undergroundconveyors,elevators**
2011 2012 2013 2014
Fig.103. Production of Electric Engines and Generators (‘000 units) Source: State Statistics Service of Ukraine
16.6 17.418.5
15.8
19.4
22.6 22.7
17.7
25.6
2826.5
21.7
14.713.4
11.5
18.520.3
21.2
18.917.4
22.921.4
17.9 17.5
11.7
0
5
10
15
20
25
30
Jan
13
Feb
13
Mar
13
Apr
13
May
13
Jun
13
Jul 1
3
Aug
13
Sep
13
Oct
13
Nov
13
Dec
13
Jan
14
Feb
14
Mar
14
Apr
14
May
14
Jun
14
Jul 1
4
Aug
14
Sep
14
Oct
14
Nov
14
Dec
14
Jan
15

M A c H I N E B U I l D I N G 109
company has supplied its produce to 45 countries globally. Since its founding in 1935, Turboatom has delivered over 165 turbines with total capacity of 65 GW to 110 nuclear plants; 400 turbines for thermal power plants (63 GW); and 530 turbines for 115 hydro power plants (39 GW). Its major competitors are Russian Power Machines, Siemens, Al-stom, ABB, Shanghai Electric.
Electrovazhmash was spun off from Turboatom due to its core business being electric machinery. The plant produces hauling equipment for mines and railways (c 60-70% of revenues) as well as turbo and hydro generators (up to 30%). The company has limitations in terms of producing large-capacity generators.
Domestic power machinery producers face largely identical challenges. Historically close ties with Russia and other CIS countries, which helped the companies survive post-Soviet Union collapse, have now become a major obstacle. Considering that producing turbines or other heavy machinery product takes several years, contracts signed in previous years still support production at a reasonable level. But an associated issue is that highly capi-tal-intensive production of this type of equipment usually requires prepayment. However, with the start of the military conflict in eastern Ukraine, many buyers (especially from Russia) have grown reluctant to make prepayments. Companies have also been working to increase local sales, but their potential is still quite limited. Moreover, the weak hryvnia does not make domestic sales an attractive option, as power machinery manufacturers partly rely on imported inputs.
In terms of diversifying and expanding into new markets, the most realistic are those where the companies are already present (CIS ex-Russia, India or Mexico). This would re-quire additional investments into sales and marketing force to bid for new contracts and find partners outside of Russia. Exports to the EU are also potentially feasible but will take more time to establish due to certification issues. The EU, however, is itself a net exporter of machinery, thus local demand could be limited and competition could be tight.
While these revenue-generating measures are yet to bring positive results, cost cutting has become a priority. Some companies have reduced the number of working shifts or workdays but stopped from laying off qualified personnel. They are also exploring op-portunities to source local inputs (e.g. from Novokramatorsk Machinery Plant, Energo-mashspetsstal and others).

U K R A I N E ’ S T O P -1 0 0 S TAT E - O W N E D E N T E R P R I S E S › 2 0 1 3 & 9 M O N T H S 2 0 1 4110
Power Machinery Sector SWOT Analysis
Strengths
‣ Competitiveness on a global scale
‣ Global customer base
‣ Broad product range
‣ Price competitiveness vs. emerging market peers
‣ Long production cycle provides a partial hedge against short-term economic or political volatility
‣ Export focus mitigates F/X risk
Opportunities
‣ Broad client base and global awareness allow for exploring new business opportunities despite pressure from Russia and the risk of losing access to this market in the future. As many contracts last for years, local producers have additional time to adjust
‣ Joint projects with foreign partners (potentially including privatizations)
‣ Further benefits from UAH devaluation
Weaknesses
‣ Significant exposure to Russia resulted in a plunge in revenues after Russia’s restrictions on imports of Ukrainian goods and services
‣ Limited sales capabilities globally
Threats
‣ Slow diversification away from Russia may imply negative consequences including difficulties with financing even maintenance CAPEX and layoffs of qualified personnel
‣ Further curbs on imports of inputs from Russia
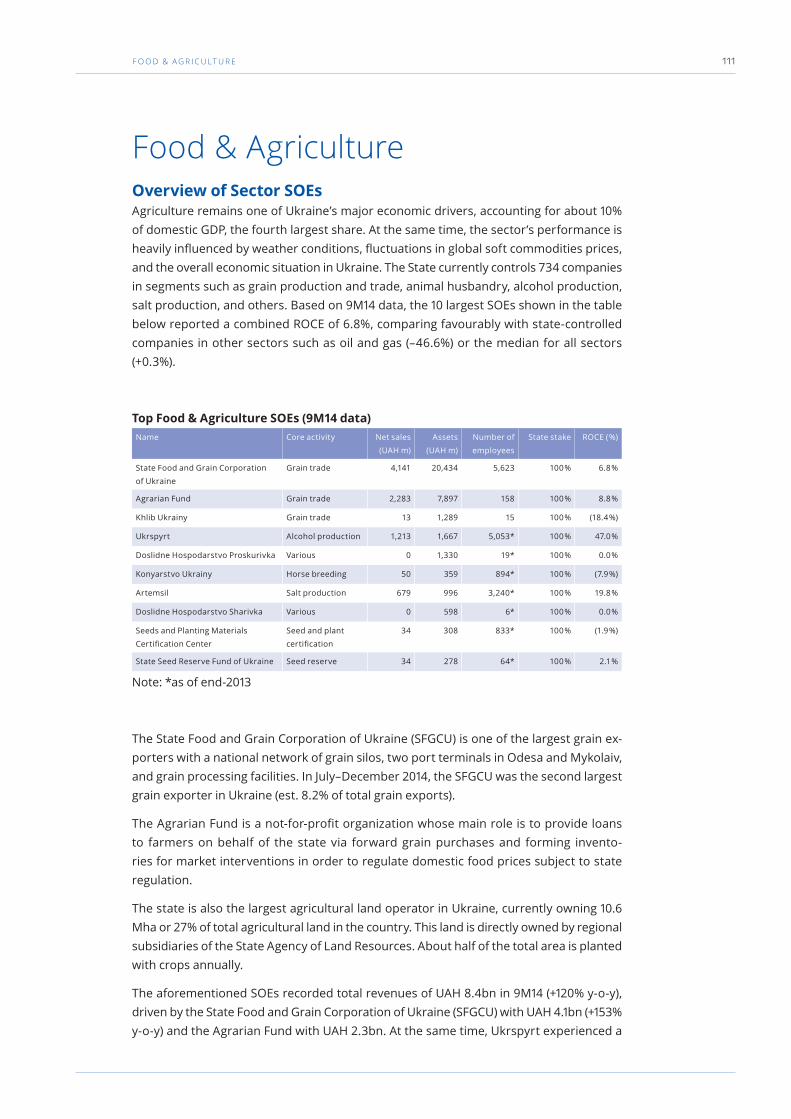
f O O D & A G R I c U lT U R E 111
food & AgricultureOverview of Sector SOEsAgriculture remains one of Ukraine’s major economic drivers, accounting for about 10% of domestic GDP, the fourth largest share. At the same time, the sector’s performance is heavily influenced by weather conditions, fluctuations in global soft commodities prices, and the overall economic situation in Ukraine. The State currently controls 734 companies in segments such as grain production and trade, animal husbandry, alcohol production, salt production, and others. Based on 9M14 data, the 10 largest SOEs shown in the table below reported a combined ROCE of 6.8%, comparing favourably with state-controlled companies in other sectors such as oil and gas (–46.6%) or the median for all sectors (+0.3%).
Top Food & Agriculture SOEs (9M14 data)Name Core activity Net sales
(UAH m)
Assets
(UAH m)
Number of
employees
State stake ROCE ( %)
State Food and Grain Corporation
of Ukraine
Grain trade 4,141 20,434 5,623 100 % 6.8 %
Agrarian Fund Grain trade 2,283 7,897 158 100 % 8.8 %
Khlib Ukrainy Grain trade 13 1,289 15 100 % (18.4 %)
Ukrspyrt Alcohol production 1,213 1,667 5,053* 100 % 47.0 %
Doslidne Hospodarstvo Proskurivka Various 0 1,330 19* 100 % 0.0 %
Konyarstvo Ukrainy Horse breeding 50 359 894* 100 % (7.9 %)
Artemsil Salt production 679 996 3,240* 100 % 19.8 %
Doslidne Hospodarstvo Sharivka Various 0 598 6* 100 % 0.0 %
Seeds and Planting Materials
Certification Center
Seed and plant
certification
34 308 833* 100 % (1.9 %)
State Seed Reserve Fund of Ukraine Seed reserve 34 278 64* 100 % 2.1 %
Note: *as of end-2013
The State Food and Grain Corporation of Ukraine (SFGCU) is one of the largest grain ex-porters with a national network of grain silos, two port terminals in Odesa and Mykolaiv, and grain processing facilities. In July–December 2014, the SFGCU was the second largest grain exporter in Ukraine (est. 8.2% of total grain exports).
The Agrarian Fund is a not-for-profit organization whose main role is to provide loans to farmers on behalf of the state via forward grain purchases and forming invento-ries for market interventions in order to regulate domestic food prices subject to state regulation.
The state is also the largest agricultural land operator in Ukraine, currently owning 10.6 Mha or 27% of total agricultural land in the country. This land is directly owned by regional subsidiaries of the State Agency of Land Resources. About half of the total area is planted with crops annually.
The aforementioned SOEs recorded total revenues of UAH 8.4bn in 9M14 (+120% y-o-y), driven by the State Food and Grain Corporation of Ukraine (SFGCU) with UAH 4.1bn (+153% y-o-y) and the Agrarian Fund with UAH 2.3bn. At the same time, Ukrspyrt experienced a

U K R A I N E ’ S T O P -1 0 0 S TAT E - O W N E D E N T E R P R I S E S › 2 0 1 3 & 9 M O N T H S 2 0 1 4112
decline in sales of UAH 157m to UAH 1.2bn due to lower domestic consumption of alco-holic beverages and weak exports.
The companies’ cost of goods sold (COGS) increased by 123% or UAH 3.7bn. The main con-tributors were the SFGCU (COGS +129%) and the Agrarian Fund (UAH 1.9bn; the company began operations in 4Q13, thus no comparison with 9M13 can be made). Total operating costs increased by modest 1.6% (UAH 10m), with a 159% y-o-y increase at the SFGCU (UAH 158m) and a UAH 18m contribution from the Agrarian Fund offset by declines of 32% at Ukrspyrt (UAH 105m) and 35% at Artemsil (UAH 50m). Other operating activities resulted in a gain of UAH 497m, or 90% (UAH 236m) up y-o-y. The key contributor was the SFGCU (+UAH 298m y-o-y), more than offsetting a UAH 82m increase in losses at Khlib Ukrainy. That said, the combined operating profit increased by 260% to UAH 1.5bn in 9M14 as growth in revenues and other operating results outpaced cost growth. 9M14 EBITDA thus stood at UAH 1.6bn, up by 174% y-o-y.
Only four companies recorded net profit in 9M14: the Agrarian Fund with UAH 466m, Ukrspyrt with UAH 96m, Artemsil with UAH 138m and the State Seed Reserve Fund with UAH 1m. The bulk of losses came from the SFGCU (UAH 840m on a UAH 1.8bn non-cash F/X loss from revaluation of a USD 1.5bn loan attracted from the Export-Import bank of China in 2012), which resulted in an aggregate loss of UAH 254m in 9M14. At the same time, combined income tax expenses grew by 12x y-o-y in 9M14 to UAH 104m, with UAH 103m paid by the Agrarian Fund.
The companies’ aggregate book value of equity decreased by 5.7% (UAH 605m) YTD to UAH 10.0bn in 9M14, mainly due to reported net losses and other comprehensive loss-es caused by currency devaluation. The biggest declines were experienced by the SF-GCU (equity –81% or UAH 780m) and horse breeder Konyarstvo Ukrainy (–80% or UAH 358m), partially offset by a UAH 424m gain booked by the Agrarian Fund, UAH 143m from Ukrspyrt and UAH 93m from Artemsil. The combined ROCE thus totalled 6.8% vs. +1.5% in 2013.
The combined asset book value rose by 36% (UAH 9.2bn) YTD to UAH 35.2bn in 9M14 on revaluation of the USD 1.0bn held in cash by SFGCU as an unutilized portion of USD 1.5bn loan. As a result of hryvnia devaluation, the cash balance in hryvnia terms increased by UAH 3.4bn, bringing the SFGCU’s book value to UAH 20.4bn (+52% YTD). Another con-tributor was the Agrarian Fund, which boosted assets by UAH 2.5bn (+47%).
While the companies’ short-term liabilities went up by 58% in 9M14, their share of total liabilities remained unchanged as long-term liabilities increased by 62% to UAH 19.4bn (77% of total liabilities), mainly due to revaluation of USD 1.5bn SFGCU loan. Total net debt stood at UAH 2.8bn (+63%), as about USD 1.0bn of the USD 1.5bn SFGCU loan was held in cash as of end-9M14. Thanks to the material EBITDA improvement, the Net Debt/EBITDA ratio decreased to 1.3x from 3.3x at end-2013, with the SFGCU cutting its ratio from 9.3x to 4.0x over the period. The Net Debt/Equity ratio slightly deteriorated (0.3x vs. 0.2x at end-2013), also on account of the SFGCU (Net Debt/Equity up to 30.2x from 2.1x at end-2013 on a hit to equity value from accumulated losses).
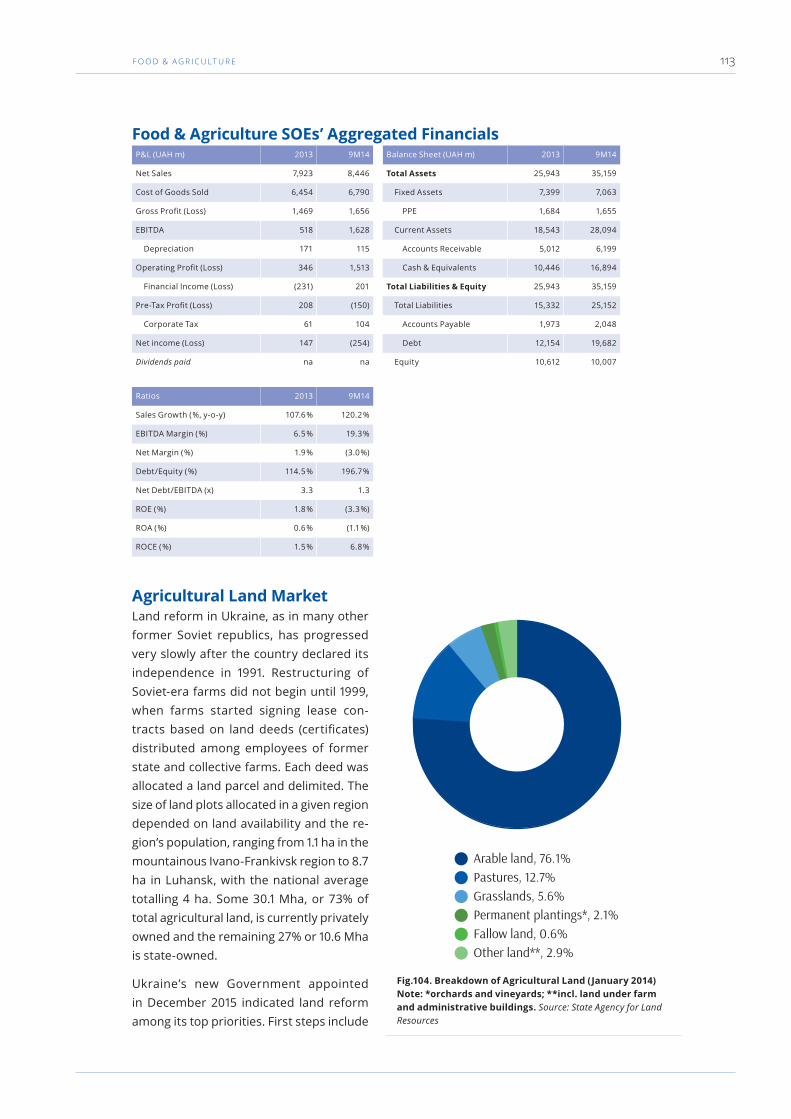
f O O D & A G R I c U lT U R E 113
Food & Agriculture SOEs’ Aggregated FinancialsP&L (UAH m) 2013 9M14 Balance Sheet (UAH m) 2013 9M14
Net Sales 7,923 8,446 Total Assets 25,943 35,159
Cost of Goods Sold 6,454 6,790 Fixed Assets 7,399 7,063
Gross Profit (Loss) 1,469 1,656 PPE 1,684 1,655
EBITDA 518 1,628 Current Assets 18,543 28,094
Depreciation 171 115 Accounts Receivable 5,012 6,199
Operating Profit (Loss) 346 1,513 Cash & Equivalents 10,446 16,894
Financial Income (Loss) (231) 201 Total Liabilities & Equity 25,943 35,159
Pre-Tax Profit (Loss) 208 (150) Total Liabilities 15,332 25,152
Corporate Tax 61 104 Accounts Payable 1,973 2,048
Net income (Loss) 147 (254) Debt 12,154 19,682
Dividends paid na na Equity 10,612 10,007
Ratios 2013 9M14
Sales Growth ( %, y-o-y) 107.6 % 120.2 %
EBITDA Margin ( %) 6.5 % 19.3 %
Net Margin ( %) 1.9 % (3.0 %)
Debt/Equity ( %) 114.5 % 196.7 %
Net Debt/EBITDA (x) 3.3 1.3
ROE ( %) 1.8 % (3.3 %)
ROA ( %) 0.6 % (1.1 %)
ROCE ( %) 1.5 % 6.8 %
Agricultural Land MarketLand reform in Ukraine, as in many other former Soviet republics, has progressed very slowly after the country declared its independence in 1991. Restructuring of Soviet-era farms did not begin until 1999, when farms started signing lease con-tracts based on land deeds (certificates) distributed among employees of former state and collective farms. Each deed was allocated a land parcel and delimited. The size of land plots allocated in a given region depended on land availability and the re-gion’s population, ranging from 1.1 ha in the mountainous Ivano-Frankivsk region to 8.7 ha in Luhansk, with the national average totalling 4 ha. Some 30.1 Mha, or 73% of total agricultural land, is currently privately owned and the remaining 27% or 10.6 Mha is state-owned.
Ukraine’s new Government appointed in December 2015 indicated land reform among its top priorities. First steps include
Fig.104. Breakdown of Agricultural Land (January 2014) Note: *orchards and vineyards; **incl. land under farm and administrative buildings. Source: State Agency for Land Resources
Arable land, 76.1%Pastures, 12.7%Grasslands, 5.6%Permanent plantings*, 2.1%Fallow land, 0.6%Other land**, 2.9%

U K R A I N E ’ S T O P -1 0 0 S TAT E - O W N E D E N T E R P R I S E S › 2 0 1 3 & 9 M O N T H S 2 0 1 4114
drafting and approving new laws on the land market and long-term land leases (from 7 years) and finalising the state land cadastre. The Government also plans to focus on sup-porting small and medium-sized farming busi-nesses, considering large farming companies to be competitive enough.
Some 4.7 million lease contracts for 17.2 Mha of farmland were registered in Ukraine as of April 2014 (–1.7% y-o-y; 40% of national total and 53% of total arable land). Most of these contracts (82%) had a term of 4 to 10 years, though the maximum allowed term is 50 years. The share of 10-year-plus contracts rose 0.9ppt y-o-y to 14.8% in 2014. With the aforementioned frame-work legislation for land reform yet to be ap-proved, local farmers are expected to continue expanding through lease in the short to me-dium term.
Based on December 2014 data, farmers leased about 2.0 Mha of state-owned farmland,
or 19% of the total area (excluding land allocated to the state reserve).
More than half of farmland lease payments in Ukraine are made in kind. The share of in-kind payments decreased from 77% in 2001 to 55% in 2014 and is likely to continue shrink-ing in the long run. The new Minister of Agrarian Policy and Food has voiced his support for gradually phasing out in-kind leases (a related problem is that farmers seek to make in-kind settlements based on inflated grain prices).
Ukrainian legislation uses three approaches to valuing agricultural land including: (i) bo-nitation, which is part of the state land cadastre and mostly reflects soil’s fertility; (ii) economic evaluation of land as a basis for comparing it with other natural resources; and
Fig.105. Agricultural Land Ownership Structure (January 2014) Source: State Agency for Land Resources
Other private, 61.4%Private (large leaseholders), 11.7%State and municipal, 26.9%
Fig.106. Arable Land Under Lease in Ukraine (Mha; 2001–14) Source: State Agency for Land Resources
22.421.6 22.1
21.120.0
18.817.7 17.4 17.7 17.5 17.4 17.4 17.5 17.2
0.0
5.0
10.0
15.0
20.0
25.0
2001 2002 2003 2004 2005 2006 2007 2008 2009 2010 2011 2012 2013 2014

f O O D & A G R I c U lT U R E 115
(iii) monetary appraisal, consisting of so called «expert» and «norma-
tive» appraisals. The minimum lease payment is set based on the land’s adjusted norma-tive appraisal. The latter is calculated by multiplying the appraisal value as of Jul. 1, 1995 by an inflation-linked coefficient. As plans were to allow transactions with farmland starting from 2013, the authorities sharply increased the normative land valuation to UAH 20,983 (USD 2,610)/ha in 2012 from UAH 11,949 (USD 1,496)/ha in 2011 (1.756x coefficient). In 2013 and 2014, the appraisal level remained unchanged y-o-y.
For 2015 the normative land valuation increased by almost 25% in hryvnia terms to UAH 25,773/ha (yet down 16% y-o-y to USD 1,121 in dollar terms based on the end-2015 official exchange rate forecast of UAH 23:USD , as lease payments are mostly made at year-end). The official appraisal value is unlikely to be treated as the minimum price benchmark for future market transactions with land, as local market players currently value arable land at below USD 1,000/ha.
Agricultural Land Appraisal in Ukraine
Period 1996 2005 2006 2007 2008 2009 2010 2011 2012 2013 2014 2015
Evaluation index 1.703 1.035 1.000 1.028 1.152 1.059 1.000 1.000 1.756 1.000 1.000 1.249
Agricultural land ($/ha) 3,674 9,053 9,053 9,369 9,632 11,096 11,751 11,751 20,635 20,635 20,635 25,773
Agricultural land ($/ha) 3,219 1,722 1,747 1,796 2,015 1,393 1,426 1,419 2,489 2,445 1,331 1,121
Arable land ($/ha) 3,388 1,812 1,839 1,891 2,124 1,468 1,503 1,496 2,610 2,575 1,331 1,121
Permanent plantings
($/ha)
10,465 5,598 5,681 5,840 4,328 4,497 4,520 4,475 4,475 4,475 2,435 2,085
Grassland ($/ha) 1,409 754 765 787 583 606 609 602 602 602 328 281
Pasture ($/ha) 1,072 574 582 599 444 461 464 459 459 459 250 214
Source: State Agency for Land Resources, Dragon Capital calculations
A 2008 Presidential Decree set the minimum annual lease payment at 3% of the nor-mative appraisal valuation. The normative land appraisal is also used to calculate land tax, lease payments for state-owned land as well duties on swapped, inherited or gifted
Fig.107. Types of Land Lease Payments (as of Apr. 1, 2014) Note: *agricultural produce grown on leased land. Source: State Agency for Land Resources
Fig.108. Breakdown of Land Lease Contracts by Term (April 2014) Source: State Agency for Land Resources
In kind*, 54.7%Cash, 41.9%Services, 3.4%
45.70%
4.50% 3.40%
41.30%
39.30% 36.80%
11.30%
42.30% 45.00%
1.80%13.90% 14.80%
0%
10%
20%
30%
40%
50%
60%
70%
80%
90%
100%
2001 2013 2014
1-3 years 4-5 years 6-10 years >10 years
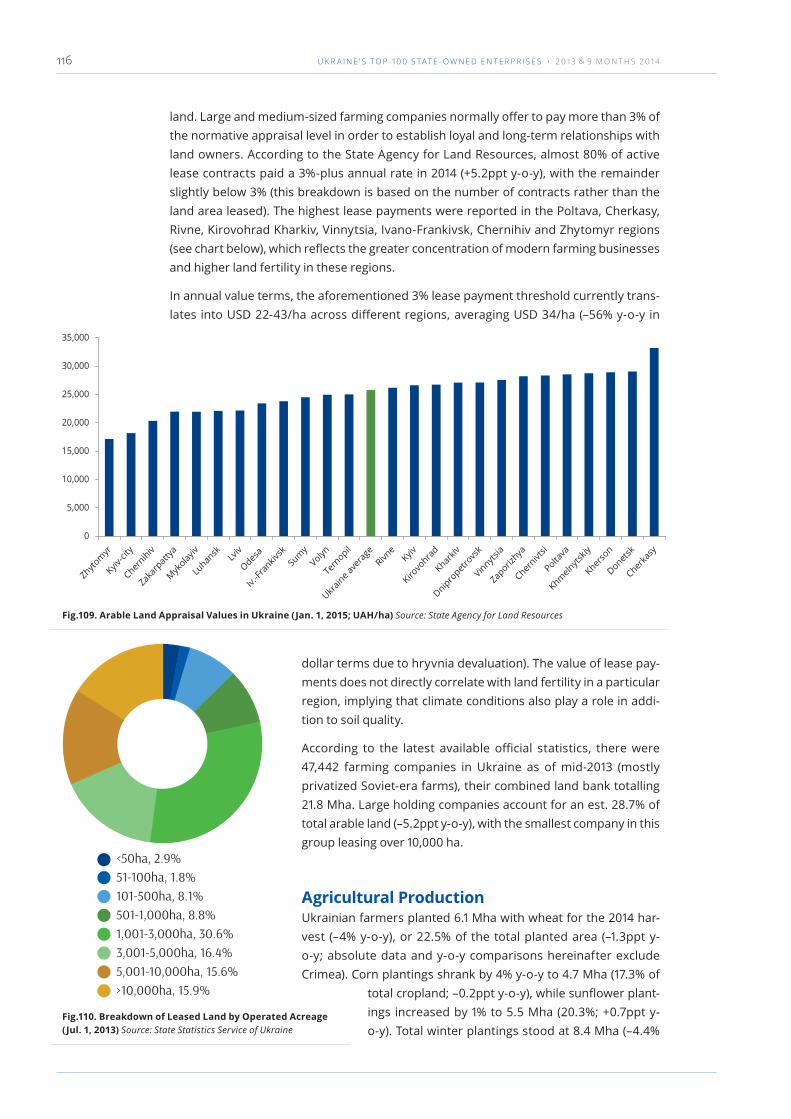
U K R A I N E ’ S T O P -1 0 0 S TAT E - O W N E D E N T E R P R I S E S › 2 0 1 3 & 9 M O N T H S 2 0 1 4116
land. Large and medium-sized farming companies normally offer to pay more than 3% of the normative appraisal level in order to establish loyal and long-term relationships with land owners. According to the State Agency for Land Resources, almost 80% of active lease contracts paid a 3%-plus annual rate in 2014 (+5.2ppt y-o-y), with the remainder slightly below 3% (this breakdown is based on the number of contracts rather than the land area leased). The highest lease payments were reported in the Poltava, Cherkasy, Rivne, Kirovohrad Kharkiv, Vinnytsia, Ivano-Frankivsk, Chernihiv and Zhytomyr regions (see chart below), which reflects the greater concentration of modern farming businesses and higher land fertility in these regions.
In annual value terms, the aforementioned 3% lease payment threshold currently trans-lates into USD 22-43/ha across different regions, averaging USD 34/ha (–56% y-o-y in
dollar terms due to hryvnia devaluation). The value of lease pay-ments does not directly correlate with land fertility in a particular region, implying that climate conditions also play a role in addi-tion to soil quality.
According to the latest available official statistics, there were 47,442 farming companies in Ukraine as of mid-2013 (mostly privatized Soviet-era farms), their combined land bank totalling 21.8 Mha. Large holding companies account for an est. 28.7% of total arable land (–5.2ppt y-o-y), with the smallest company in this group leasing over 10,000 ha.
Agricultural ProductionUkrainian farmers planted 6.1 Mha with wheat for the 2014 har-vest (–4% y-o-y), or 22.5% of the total planted area (–1.3ppt y-o-y; absolute data and y-o-y comparisons hereinafter exclude Crimea). Corn plantings shrank by 4% y-o-y to 4.7 Mha (17.3% of
total cropland; –0.2ppt y-o-y), while sunflower plant-ings increased by 1% to 5.5 Mha (20.3%; +0.7ppt y-o-y). Total winter plantings stood at 8.4 Mha (–4.4%
Fig.109. Arable Land Appraisal Values in Ukraine (Jan. 1, 2015; UAH/ha) Source: State Agency for Land Resources
0
5,000
10,000
15,000
20,000
25,000
30,000
35,000
Fig.110. Breakdown of Leased Land by Operated Acreage (Jul. 1, 2013) Source: State Statistics Service of Ukraine
<50ha, 2.9%51-100ha, 1.8%101-500ha, 8.1%501-1,000ha, 8.8%1,001-3,000ha, 30.6%3,001-5,000ha, 16.4%5,001-10,000ha, 15.6%>10,000ha, 15.9%

f O O D & A G R I c U lT U R E 117
y-o-y), including 6.3 Mha under wheat (–5% y-o-y), 1.25 Mha under barley (+13%) and 0.9 Mha under rapeseed (–14%). For the 2015 harvest, winter plantings increased by 7% y-o-y to 9.0 Mha, with 6.8 Mha (76%) planted with winter wheat (+12% y-o-y), 1.1 Mha with barley (–3%), and 0.9 Mha with rapeseed (–5% y-o-y).
Wheat yields in Ukraine are heavily dependent on weather conditions and as such are volatile, with low fertilizer application and scarcity of modern equipment and farming techniques continuing to constrain yield growth. Still, Ukraine enjoyed record harvests in 2013 and 2014 thanks to exceptionally favourable weather. Last year, wheat yielded 3.9 t/ha on average (winter wheat (95% of total acreage) at 4.0 t/ha and spring wheat at 3.1 t/ha). This was close to the 1990 (late Soviet era) level of 4.0 t/ha when fertilizer consump-tion was some 30% higher.
Ukraine harvested a record 63.0 Mt of grain in clean weight terms in 2013, up 36% y-o-y, report-ing an average yield of 4.0 t/ha, according to the Ministry of Agrarian Policy and Food data (62.3 Mt without Crimea). In 2014, the harvest hit a new record high of 63.8 Mt (+2.4% y-o-y), including 24.1 Mt of wheat (+10% y-o-y), 28.5 Mt of corn (–8%) and 9.0 Mt of barley (+23%).
Analysts forecast Ukraine’s 2015 grain harvest at 57.8 Mt (–9.5% y-o-y), including 22.1 Mt of wheat (–8% y-o-y due to the weaker condition of winter plantings as reported in January) and 35.7 Mt of coarse grains (–10% y-o-y), mainly corn (26.5 Mt, –7%) and barley (7.0 Mt, –23%). These estimates should be treated as preliminary given the as yet uncertain weather factor and cyclicality (historical observations suggest poor harvests usually occur once every four years).
Fig.111. Arable Land Distribution in Ukraine (2014 harvest) Source: State Statistics Service of Ukraine
Wheat, 22.5%Sunflower, 20.3%Corn, 17.3%Barley, 11.3%Soybean, 6.6%Rapeseed, 3.2%Sugar beet, 1.2%Other, 17.5%
Fig.112. Breakdown of Major Crops by Area (Mha) Note: *sugar beet, sunflower, potatoes and vegetables. Source: State Statistics Service of Ukraine
7.65.5 5.2 6.6 6.8 6.3 5.8 6.4 6.1
78.5 7.4
8 8.7 8.3 9.8 9.3 8.8
17.917
14.6 11.411.6 12.4 11.9 11.9 12.3
0
5
10
15
20
25
30
35 Wheat (Mha) Coarse grain (Mha) Other crops* (Mha)
‘90 ‘95 ‘00 ‘05 ‘10 ‘11 ‘12 ‘13 ‘14

U K R A I N E ’ S T O P -1 0 0 S TAT E - O W N E D E N T E R P R I S E S › 2 0 1 3 & 9 M O N T H S 2 0 1 4118
Grain Storage CapacityUkraine’s certified grain storage capacity totalled 32.6 Mt as of mid-2014 (vs. 29.0 Mt a year before; both figures exclude Crimea). Considering that Ukraine’s grain and oilseed harvests have ranged from 40-60 Mt and 10-12 Mt, respectively, over the past five years, the existing certified storage capacity can provide for immediate storage of 45-65% of annual production. This implies Ukraine needs an additional 15-40 Mt of capacity to secure immediate storage of its entire grain and oilseed harvest. At the same time, local experts put Ukraine’s actual storage capaci-ty at 40-50 Mt, including the aforementioned 33.5 Mt of certified silos (both modern silos
Fig.113. Grain Production, Exports and Consumption in Ukraine (Mt) Source: State Statistics Service of Ukraine, UkrAgroConsult, Dragon Capital estimates
25.920.9 16.8
22.315.8
22.3 24.1
27.4
25.1 22.4
34.430.4
40.0 39.7
0.0
10.0
20.0
30.0
40.0
50.0
60.0
70.0
Wheat production (Mt; lhs) Coarse grain production (Mt; lhs)
Exports (Mt; rhs) Consumption (Mt; rhs)
‘08/09 ‘09/10 ‘10/11 ‘11/12 ‘12/13E ‘13/14 ‘14/15E
Fig.114. Wheat Yields in Ukraine (t/ha) Source: State Statistics Service of Ukraine
0
0.5
1
1.5
2
2.5
3
3.5
4
4.5
1990 1995 2000 2005 2010 2011 2012 2013 2014
Winter wheat yield (t/ha) Spring wheat yield (t/ha)
Fig.115. Grain Production and Yields in Ukraine* Note: *in clean weight terms (after cleaning and drying). Source: State Statistics Service of Ukraine
0
0.5
1
1.5
2
2.5
3
3.5
4
4.5
5
0
10
20
30
40
50
60
70
2000 2001 2002 2003 2004 2005 2006 2007 2008 2009 2010 2011 2012 2013 2014 2015E
Grain production (Mt; lhs) Average yield (t/ha; rhs)

f O O D & A G R I c U lT U R E 119
made of hot rolled steel coils and Soviet-era concrete silos and floor-type granaries) and 10-20 Mt of uncertified (and mostly outdated) capacity.
Grain and Oilseed ExportsUkraine exported 33.0 Mt of grain in 2013/14 MY (July 2013–June 2014), up 40% y-o-y, after harvesting a record 63.0 Mt in 2013. In the first six months of 2014/15 MY (July-December 2014), Ukraine exported 19.3 Mt of grain (+3% y-o-y) as lower corn exports (7.0 Mt; –26%
y-o-y) were offset by strong sales of wheat (7.9 Mt; +17%) and barley (3.7 Mt; +82%). Corn accounted for 61% of 2013/14 MY grain exports (+3ppt y-o-y), wheat for 28% (–1ppt y-o-y), and barley for 8% (–1ppt y-o-y).
Fig.116. Certified Grain Storage Facilities in Ukraine (March 2014) Source: Agriculture Ministry
Fig.117. Monthly Grain Exports from Ukraine (kt; 2013/14 MY and 1H14/15 MY) Source: UkrAgroConsult, State Statistics Service of Ukraine
0
1,000
2,000
3,000
4,000
5,000
6,000 Wheat (kt) Barley (kt) Corn (kt) Other (kt)
Jul 1
3
Aug
13
Sep
13
Oct
13
Nov
13
Dec
13
Jan
14
Feb
14
Mar
14
Apr
14
May
14
Jun
14
Jul 1
4
Aug
14
Sep
14
Oct
14
Nov
14
Dec
14

U K R A I N E ’ S T O P -1 0 0 S TAT E - O W N E D E N T E R P R I S E S › 2 0 1 3 & 9 M O N T H S 2 0 1 4120
Sunflower oil exports from Ukraine rose by 28% y-o-y to 4.2 Mt in 2013/14 MY (September 2013–August 2014), while sunflower seed exports fell sharply for the third year in a row (–45% y-o-y to 70 kt after a 55% y-o-y decline in 2012/13 MY). In 4M14/15 MY (September-December 2014), Ukraine exported 1.4 Mt of sunflower oil (+13% y-o-y), while sunseed exports reached 19 kt (+28% y-o-y).
Rapeseed exports totalled 2.24 Mt (+77% y-o-y) in 2013/14 MY (July-June), while soybean exports amounted to 1.26 Mt (–5% y-o-y; MY: September-August). In July-December 2014,
Fig.118. Ukraine Oilseed and Vegetable Oil Exports (kt; Sep. 2013–Dec. 2014) Source: UkrAgroConsult, State Statistics Service of Ukraine
Sunseed (kt) Soybean (kt) Rapeseed (kt)Se
p 13
Oct
13
Nov
13
Dec
13
Jan
14
Feb
14
Mar
14
Apr
14
May
14
Jun
14
Jul 1
4
Aug
14
Sep
14
Oct
14
Nov
14
Dec
14
1,200
1,000
800
600
400
200
0
Fig.119. Ukraine Wheat Exports (volume; 2013/14 MY*) Note: *July-June. Source: State Statistics Service of Ukraine
Fig.120. Ukraine Corn Exports (volume; 2013/14 MY*) Note: *October-September. Source: State Statistics Service of Ukraine
Egypt, 29.5%Kenya, 5.6%South Africa, 5.4%Jordan, 4.6%Israel, 4.3%Thailand, 4.1%Libya, 4.1%Indonesia, 4.0%Bangladesh, 3.7%Tunisia, 3.6%Other, 31.2%
Spain, 15.0%Egypt, 12.3%South Korea, 8.8%Netherlands, 8.8%Iran, 7.9%Italy, 7.6%Japan, 6.1%Portugal, 4.2%Israel, 3.4%Great Britain, 3.1%Other, 22.7%

f O O D & A G R I c U lT U R E 121
rapeseed exports totalled 1.9 Mt (–10% y-o-y). Soybean exports reached 1.1 Mt in 4M14/15 MY (September-December 2014), up 59% y-o-y.
Total grain exports are forecast to reach 35.0 Mt in 2014/15 MY (+6% y-o-y), including 20.0 Mt of corn (–1% y-o-y), 11.0 Mt of wheat (+17%) and 3.0 Mt of barley (+22%). 2014/15 MY sun-flower oil exports are forecasted at 4.1 Mt (–3% y-o-y), reflecting a lower sunflower seed harvest last year of 10.1 Mt (–13% y-o-y).
Egypt remained the largest importer of Ukrainian wheat in 2013/14 MY, accounting for 30% of total exports, while Spain was the largest corn importer with a 15% share in 2013/14 MY (October-September).
The United States Department of Agriculture (USD A) forecasts Ukraine will export 11.0 Mt of wheat in 2014/15 MY, accounting for 6.9% of projected global wheat exports over the period (+1.2ppt y-o-y). The EU is forecast to be the largest global wheat exporter (30 Mt; 19% of total exports) and Egypt and Indonesia to be the largest importers (10.0 Mt or 6.3% of total imports each).
According to the USD A, global coarse grain exports will hit 149.0 Mt in 2014/15 MY, with Ukraine projected to account for 13.0% of the total (19.4 Mt; –20% y-o-y on a lower corn harvest), becoming the third largest exporter (up from 4th place in 2013/14 MY). Japan is forecast to be the largest importer of coarse grains (12% of total imports).
Fig.121. Global Wheat Producers (volume; 2014/15E MY) Source: FAS, USDA
Fig.122. Global Wheat Exporters (volume; 2014/15E MY) Source: FAS, USDA
EU, 21.5%China, 17.4%India, 13.3%Russia, 8.2%USA, 7.6%Canada, 4.1%Pakistan, 3.5%Ukraine, 3.4%Australia, 3.3%Turkey, 2.1%Other, 15.8%
EU, 18.8%USA, 16.0%Canada, 14.7%Russia, 12.5%Australia, 11.3%Ukraine, 6.9%Kazakhstan, 3.8%Argentina, 3.8%Other, 12.2%
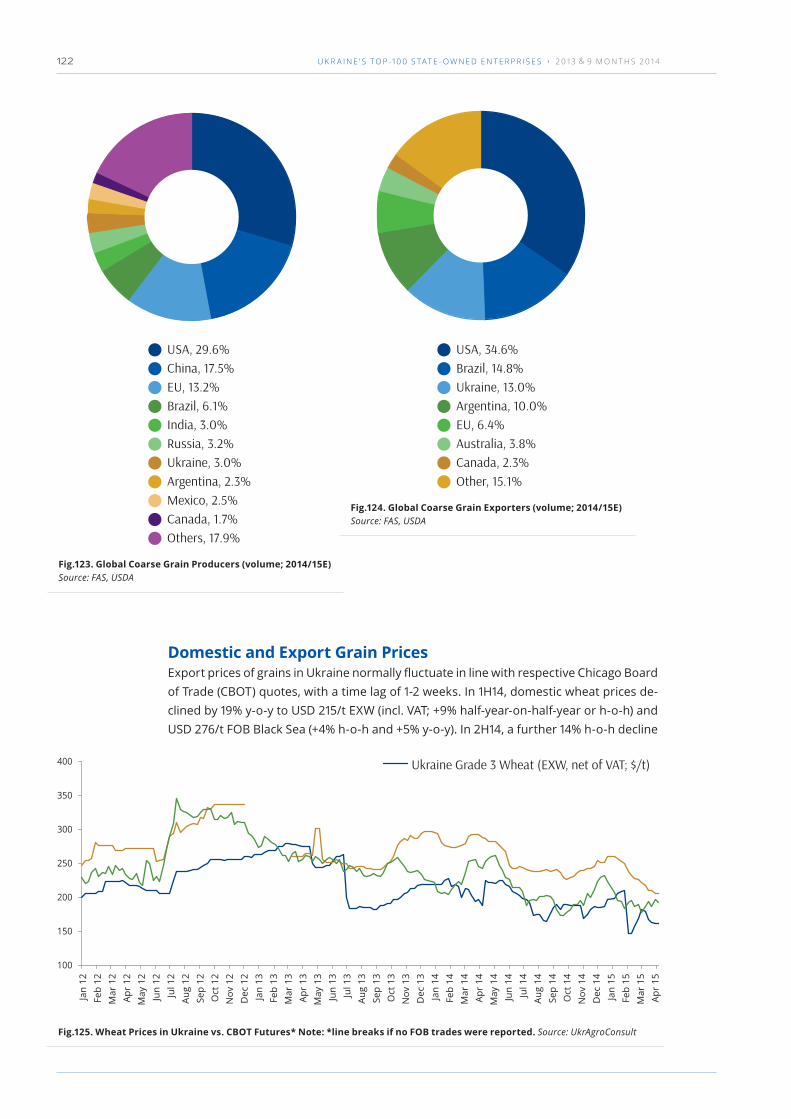
U K R A I N E ’ S T O P -1 0 0 S TAT E - O W N E D E N T E R P R I S E S › 2 0 1 3 & 9 M O N T H S 2 0 1 4122
Domestic and Export Grain PricesExport prices of grains in Ukraine normally fluctuate in line with respective Chicago Board of Trade (CBOT) quotes, with a time lag of 1-2 weeks. In 1H14, domestic wheat prices de-clined by 19% y-o-y to USD 215/t EXW (incl. VAT; +9% half-year-on-half-year or h-o-h) and USD 276/t FOB Black Sea (+4% h-o-h and +5% y-o-y). In 2H14, a further 14% h-o-h decline
Fig.123. Global Coarse Grain Producers (volume; 2014/15E) Source: FAS, USDA
Fig.124. Global Coarse Grain Exporters (volume; 2014/15E) Source: FAS, USDA
USA, 29.6%China, 17.5%EU, 13.2%Brazil, 6.1%India, 3.0%Russia, 3.2%Ukraine, 3.0%Argentina, 2.3%Mexico, 2.5%Canada, 1.7%Others, 17.9%
USA, 34.6%Brazil, 14.8%Ukraine, 13.0%Argentina, 10.0%EU, 6.4%Australia, 3.8%Canada, 2.3%Other, 15.1%
Fig.125. Wheat Prices in Ukraine vs. CBOT Futures* Note: *line breaks if no FOB trades were reported. Source: UkrAgroConsult
100
150
200
250
300
350
400
Jan
12Fe
b 12
Mar
12
Apr
12M
ay 1
2Ju
n 12
Jul 1
2Au
g 12
Sep
12O
ct 1
2N
ov 1
2D
ec 1
2Ja
n 13
Feb
13M
ar 1
3Ap
r 13
May
13
Jun
13Ju
l 13
Aug
13Se
p 13
Oct
13
Nov
13
Dec
13
Jan
14Fe
b 14
Mar
14
Apr
14M
ay 1
4Ju
n 14
Jul 1
4Au
g 14
Sep
14O
ct 1
4N
ov 1
4D
ec 1
4Ja
n 15
Feb
15M
ar 1
5Ap
r 15
Ukraine Grade 3 Wheat (EXW, net of VAT; $/t)
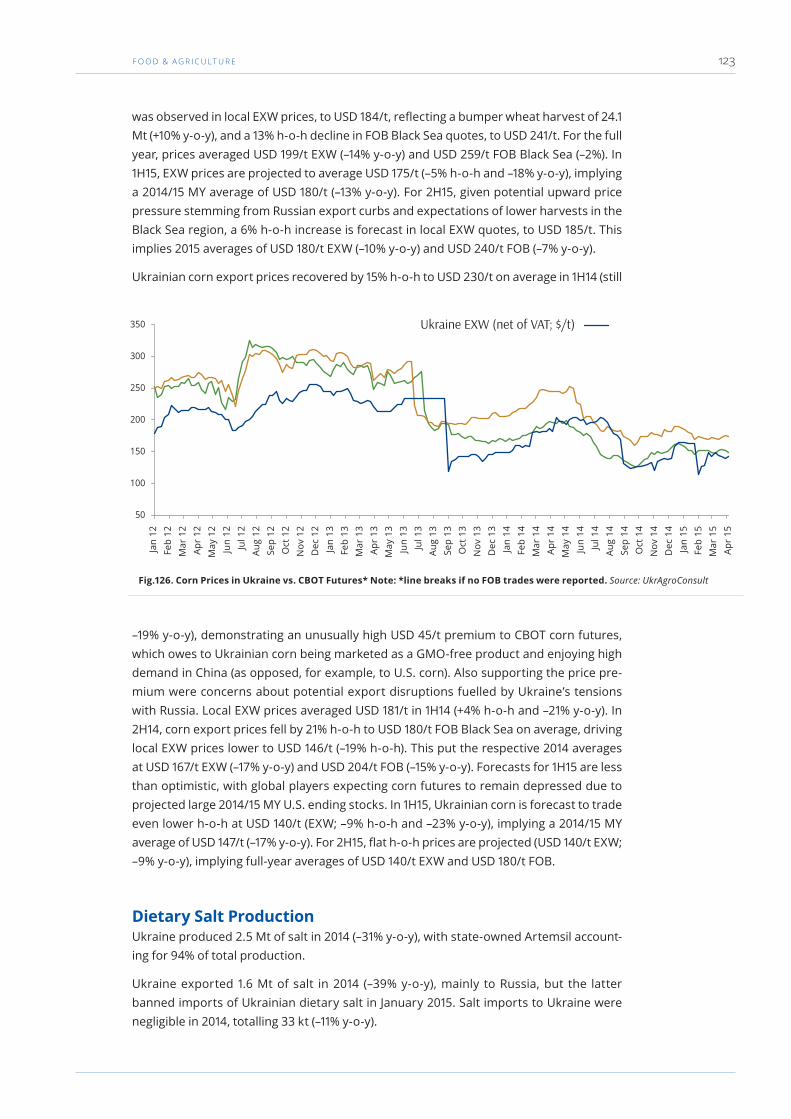
f O O D & A G R I c U lT U R E 123
was observed in local EXW prices, to USD 184/t, reflecting a bumper wheat harvest of 24.1 Mt (+10% y-o-y), and a 13% h-o-h decline in FOB Black Sea quotes, to USD 241/t. For the full year, prices averaged USD 199/t EXW (–14% y-o-y) and USD 259/t FOB Black Sea (–2%). In 1H15, EXW prices are projected to average USD 175/t (–5% h-o-h and –18% y-o-y), implying a 2014/15 MY average of USD 180/t (–13% y-o-y). For 2H15, given potential upward price pressure stemming from Russian export curbs and expectations of lower harvests in the Black Sea region, a 6% h-o-h increase is forecast in local EXW quotes, to USD 185/t. This implies 2015 averages of USD 180/t EXW (–10% y-o-y) and USD 240/t FOB (–7% y-o-y).
Ukrainian corn export prices recovered by 15% h-o-h to USD 230/t on average in 1H14 (still
–19% y-o-y), demonstrating an unusually high USD 45/t premium to CBOT corn futures, which owes to Ukrainian corn being marketed as a GMO-free product and enjoying high demand in China (as opposed, for example, to U.S. corn). Also supporting the price pre-mium were concerns about potential export disruptions fuelled by Ukraine’s tensions with Russia. Local EXW prices averaged USD 181/t in 1H14 (+4% h-o-h and –21% y-o-y). In 2H14, corn export prices fell by 21% h-o-h to USD 180/t FOB Black Sea on average, driving local EXW prices lower to USD 146/t (–19% h-o-h). This put the respective 2014 averages at USD 167/t EXW (–17% y-o-y) and USD 204/t FOB (–15% y-o-y). Forecasts for 1H15 are less than optimistic, with global players expecting corn futures to remain depressed due to projected large 2014/15 MY U.S. ending stocks. In 1H15, Ukrainian corn is forecast to trade even lower h-o-h at USD 140/t (EXW; –9% h-o-h and –23% y-o-y), implying a 2014/15 MY average of USD 147/t (–17% y-o-y). For 2H15, flat h-o-h prices are projected (USD 140/t EXW; –9% y-o-y), implying full-year averages of USD 140/t EXW and USD 180/t FOB.
Dietary Salt ProductionUkraine produced 2.5 Mt of salt in 2014 (–31% y-o-y), with state-owned Artemsil account-ing for 94% of total production.
Ukraine exported 1.6 Mt of salt in 2014 (–39% y-o-y), mainly to Russia, but the latter banned imports of Ukrainian dietary salt in January 2015. Salt imports to Ukraine were negligible in 2014, totalling 33 kt (–11% y-o-y).
Fig.126. Corn Prices in Ukraine vs. CBOT Futures* Note: *line breaks if no FOB trades were reported. Source: UkrAgroConsult
50
100
150
200
250
300
350
Jan
12Fe
b 12
Mar
12
Apr
12M
ay 1
2Ju
n 12
Jul 1
2Au
g 12
Sep
12O
ct 1
2N
ov 1
2D
ec 1
2Ja
n 13
Feb
13M
ar 1
3Ap
r 13
May
13
Jun
13Ju
l 13
Aug
13Se
p 13
Oct
13
Nov
13
Dec
13
Jan
14Fe
b 14
Mar
14
Apr
14M
ay 1
4Ju
n 14
Jul 1
4Au
g 14
Sep
14O
ct 1
4N
ov 1
4D
ec 1
4Ja
n 15
Feb
15M
ar 1
5Ap
r 15
Ukraine EXW (net of VAT; $/t)
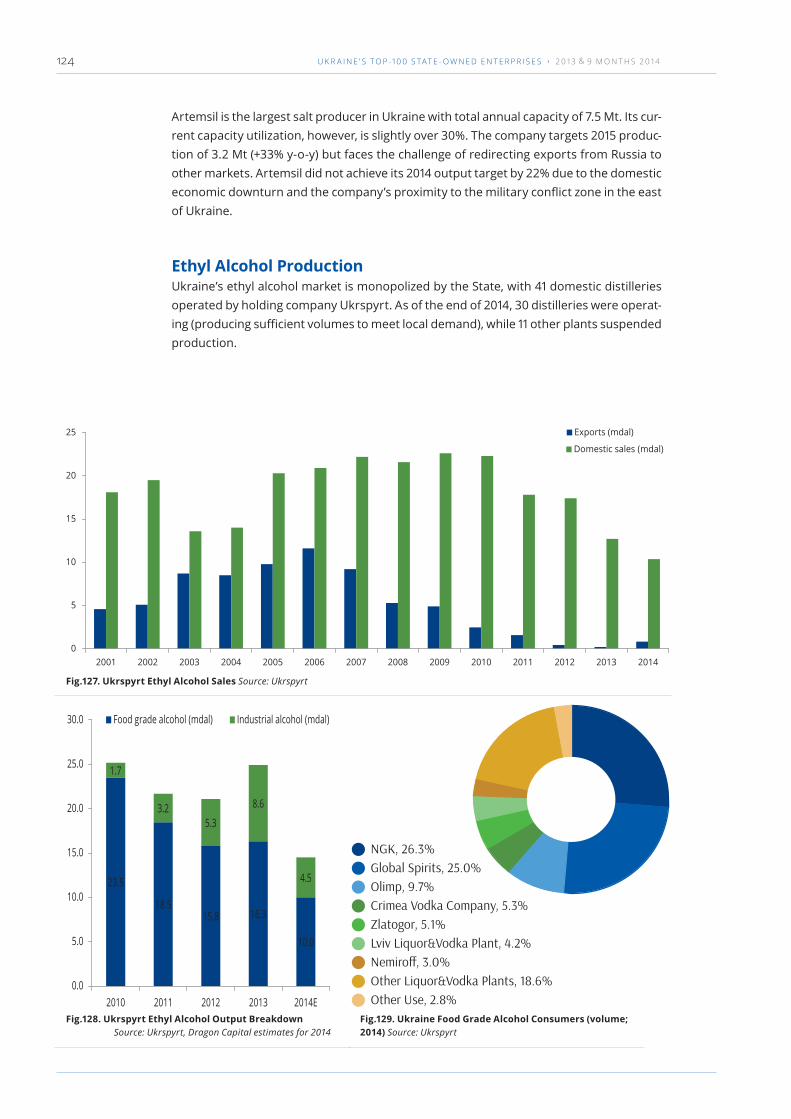
U K R A I N E ’ S T O P -1 0 0 S TAT E - O W N E D E N T E R P R I S E S › 2 0 1 3 & 9 M O N T H S 2 0 1 4124
Artemsil is the largest salt producer in Ukraine with total annual capacity of 7.5 Mt. Its cur-rent capacity utilization, however, is slightly over 30%. The company targets 2015 produc-tion of 3.2 Mt (+33% y-o-y) but faces the challenge of redirecting exports from Russia to other markets. Artemsil did not achieve its 2014 output target by 22% due to the domestic economic downturn and the company’s proximity to the military conflict zone in the east of Ukraine.
Ethyl Alcohol ProductionUkraine’s ethyl alcohol market is monopolized by the State, with 41 domestic distilleries operated by holding company Ukrspyrt. As of the end of 2014, 30 distilleries were operat-ing (producing sufficient volumes to meet local demand), while 11 other plants suspended production.
Fig.127. Ukrspyrt Ethyl Alcohol Sales Source: Ukrspyrt
0
5
10
15
20
25
2001 2002 2003 2004 2005 2006 2007 2008 2009 2010 2011 2012 2013 2014
Exports (mdal)
Domestic sales (mdal)
Fig.128. Ukrspyrt Ethyl Alcohol Output Breakdown Source: Ukrspyrt, Dragon Capital estimates for 2014
Fig.129. Ukraine Food Grade Alcohol Consumers (volume; 2014) Source: Ukrspyrt
23.5
18.515.8 16.3
10.0
1.7
3.25.3
8.6
4.5
0.0
5.0
10.0
15.0
20.0
25.0
30.0
2010 2011 2012 2013 2014E
Food grade alcohol (mdal) Industrial alcohol (mdal)
NGK, 26.3%Global Spirits, 25.0%Olimp, 9.7%Crimea Vodka Company, 5.3%Zlatogor, 5.1%Lviv Liquor&Vodka Plant, 4.2%Nemiroff, 3.0%Other Liquor&Vodka Plants, 18.6%Other Use, 2.8%

f O O D & A G R I c U lT U R E 125
In 2014, Ukrspyrt distilleries produced 11.9 million decalitres (mdal) of ethyl alcohol (–25% y-o-y), exporting 0.9 mdal (+309% y-o-y). Food grade alcohol accounted for 70% of Urk-spyrt’s total production, the remainder being industrial spirits.
Ukraine produced 32.1 mdal of alcoholic beverages (excluding wine) in 2014, down 4% y-o-y, with vodka distillers being Ukrspyrt’s major customers. The National Vodka Company (NGK) was the largest ethyl alcohol consumer last year, accounting for 26% of Ukrspyrt’s total sales.
Horse BreedingUkraine’s horse breeding industry has been in decline since the Soviet collapse. In 2014, the domestic horse population totalled 354,200 heads (–6% y-o-y), with 92% of the total kept by households and the remaining 8% by farming enterprises. Some 65% of the total headcount was located in the rural areas of western Ukraine where farming households are widespread. About 90% of the domestic horse herd is represented by draft breeds.
State-owned company Konyarstvo Ukrainy operates 14 subsidiaries collectively raising 1,657 horses or 5.7% of Ukraine’s industrial horse headcount (March 2015 data).
Fig.130. Horse Population in Ukraine (‘000) Source: State Statistics Service of Ukraine
37.5
451.4 456.7372.6 358.8 344.1 325.1
700.9
249.8
98.1
41.6 36.9 32.5 29.1
0
100
200
300
400
500
600
700
800
1991 2001 2006 2011 2012 2013 2014
Households Farming companies

U K R A I N E ’ S T O P -1 0 0 S TAT E - O W N E D E N T E R P R I S E S › 2 0 1 3 & 9 M O N T H S 2 0 1 4126
SWOT Analysis
Strengths
‣ High land fertility (black soil accounts for 54% of total farmland)
‣ Top sunflower oil exporter and leading grain exporter globally
‣ Self-sufficiency in nitrogen fertilizer production for farming
‣ Developed transportation and storage infrastructure
‣ Own sea ports and proximity to key export markets (EU, MENA)
‣ Low production costs
Opportunities
‣ Ongoing consolidation in the grain growing business, with large farming companies already operating 30% of total farmland
‣ Land reform focused on encouraging long-term lease and prospectively allowing transactions with farmland and its use as collateral
‣ Implementation of new farming techniques to boost yields, with potential to increase annual harvests to 80 Mt
‣ Relatively low domestic per capita consumption of various food products
‣ Further streamlining of the regulatory environment to encourage exports
Weaknesses
‣ Low exports of value added products
‣ Low state support for the sector — no direct subsidies
‣ High dependence on weather in grain growing due to underinvestment and low inputs of fertilizers and crop protection..
Threats
‣ Financial difficulties faced by farmers in the wake of hryvnia depreciation
‣ Lack of cheap bank financing
‣ Potential elimination of tax preferences currently enjoyed by farmers
‣ Further negative impact of tensions with Russia and the military conflict in the east
‣ Volatility in global soft commodities prices

c H E M I c A l S 127
chemicalsOverview of Sector SOEsChemical enterprises account for 4% of Ukraine’s total industrial production. Below we analyse the six largest state-owned companies in the sector, which together account for 1% of state-owned enterprises’ total assets and 3% of total revenues based on 2013 data (13% of assets and 19% of revenues of state-owned manufacturing sector companies). Three enterprises are involved in production and transportation of fertilizers and ac-counted for 65% of the group’s total assets and 97% of revenues in 9M14. The sector is highly dependent on gas supplies to Ukraine (gas being the key input in nitrogen fertilizer production) and global and domestic demand for fertilizers. Based on 9M14 data, the group’s return on equity remained negative at –119.0% (vs. the median for all sectors of –12.1%).
Top Chemical Sector SOEs (9M14 data)Name Core activity Net sales
(UAH m)
Assets
(UAH m)
Number of
employees
State
stake
ROCE
( %)
Odesa Portside Plant Production of nitrogen fertilizers 4,179 3,345 3,962 99.6 % (9.9 %)
Sumykhimprom Production of complex fertilizers
and titanium dioxide
1,408 1,468 4,492 100 % nm
Oriana Property lessor (produced potash
fertilizers before 2001)
0 1,251 58 100 % nm
Pavlohrad Chemical Plant Production of explosives 195 1,000 1,377* 100 % 4.9 %
Ukrkhimtransamiak Ammonia transportation 792 1,011 792* 100 % 18.4 %
Ukrmedpostach Supplies to medical institutions 2 847 37* 100 % 0.0 %
Note: *as of end-2013
The Odesa Portside Plant (OPP) is one of the largest nitrogen fertilizer producers in Ukraine focusing on production of ammonia, urea and certain chemical by-products. It accounts for 17% of Ukraine’s ammonia production capacity and 19% of urea capacity. Based in the Yuzhny sea port, the OPP operates a transhipment terminal that handles ammonia, urea, methanol, and urea ammonium nitrate produced by the OPP and sup-plied from other fertilizer plants in Ukraine and Russia, including via the Togliatti-Horliv-ka-Odesa ammonia pipeline. The OPP exports about 85% of its output to more than 30 countries.
Sumykhimprom is the largest Ukrainian producer of complex fertilizers (a wide range of granulated NPK and NP fertilizers), titanium dioxide, and other inorganic chemicals. Sumykhimprom’s complex fertilizer production capacity totals 500 kt p.a., accounting for 40% of Ukraine’s total.
OPP’s sales increased by 7% y-o-y in 9M14 to UAH 4.2bn, Sumykhimprom reported a 19% increase to UAH 1.4bn, and Ukrkhimtransamiak increased revenues by 48% to UAH 792m — these three companies accounting for 97% of total sales of the group analyzed. In 9M14 Pavlohrad Chemical Plant and Ukrmedpostach experienced a decline in sales by 23% and 56% y-o-y to UAH 195m and UAH 2m, respectively.

U K R A I N E ’ S T O P -1 0 0 S TAT E - O W N E D E N T E R P R I S E S › 2 0 1 3 & 9 M O N T H S 2 0 1 4128
The companies’ combined cost of goods sold (COGS) increased by 3% y-o-y (UAH 182m) over the period, driven by Sumykhimprom (+16% or UAH 181m) and Ukrkhimtransamiak (+13% or UAH 54m) and partly offset by Pavlohrad Chemical Plant (–UAH 63m). Total op-erating costs were unchanged y-o-y at UAH 275m. Other operating activities resulted in a loss of UAH 316m (vs. UAH 238m loss in 9M13), with Ukrkhimtransamiak increasing other operating losses by UAH 183m (up 16x y-o-y) and OPP and Sumykhimprom reducing their losses by UAH 69m and UAH 38m, respectively. Overall, the companies’ aggregate operat-ing loss decreased from UAH 646m in 9M13 to UAH 201m in 9M14, as revenue growth out-paced costs. Combined EBITDA remained negative at UAH 35m (vs. negative UAH 489m in 9M13) as OPP and Sumykhimprom reduced their EBITDA losses by UAH 340m and UAH 82m, respectively.
Only two companies recorded a positive bottom line in 9M14, Ukrkhimtransamiak (UAH 74m, +24% y-o-y) and Pavlohrad Chemical Plant (UAH 33m, +6% y-o-y). The state-owned companies’ combined net loss totalled UAH 228m in 9M14, falling from UAH 693m in 9M13 thanks to lower operating losses and a UAH 27m increase in other financial income reported by Pavlohrad Chemical Plant (UAH 14m) and OPP (UAH 13m).
The companies’ book value of equity decreased by 57% (UAH 232m) YTD to UAH 177m as a result of losses. The main contributors were OPP (UAH 243m net loss in 9M14) and Sumykhimprom (UAH 59m loss). End-9M14 ROE thus remained negative at 119% (vs. –122% in 2013).
The combined book value of assets rose by 16.2% (UAH 1.2bn) YTD to UAH 8.9bn, with a UAH 1.2bn increase in accounts receivable, to UAH 4.3bn, almost balanced out by a UAH 1.1bn increase in accounts payable, to UAH 4.7bn. The main contributor was OPP, which accumulated additional UAH 740m of accounts receivable and UAH 873m of accounts payable in 9M14.
The companies’ end-9M14 total debt stood at UAH 4.3bn, up by 36.7% YTD, and was mostly UAH denominated (including OPP’s debt for natural gas supplies of UAH 2.9bn). Long-term debt stood at UAH 1.2bn (28% of total vs. 33% in 2013) and short-term loans accounted for the remaining 72% or UAH 165m (vs. 67% in 2013). OPP was the largest con-tributor to debt growth over the period (+43% to UAH 2.9bn), followed by Ukrmedpostach (+22% to UAH 840m). At the same time, combined net debt came up to UAH 3.9bn (+43%), with Net Debt/EBITDA slipping into negative value due to negative EBITDA. The Net Debt/Equity ratio deteriorated to 22.2x from 6.7x at end-2013 on growing debt and a hit to eq-uity value from accumulated losses.
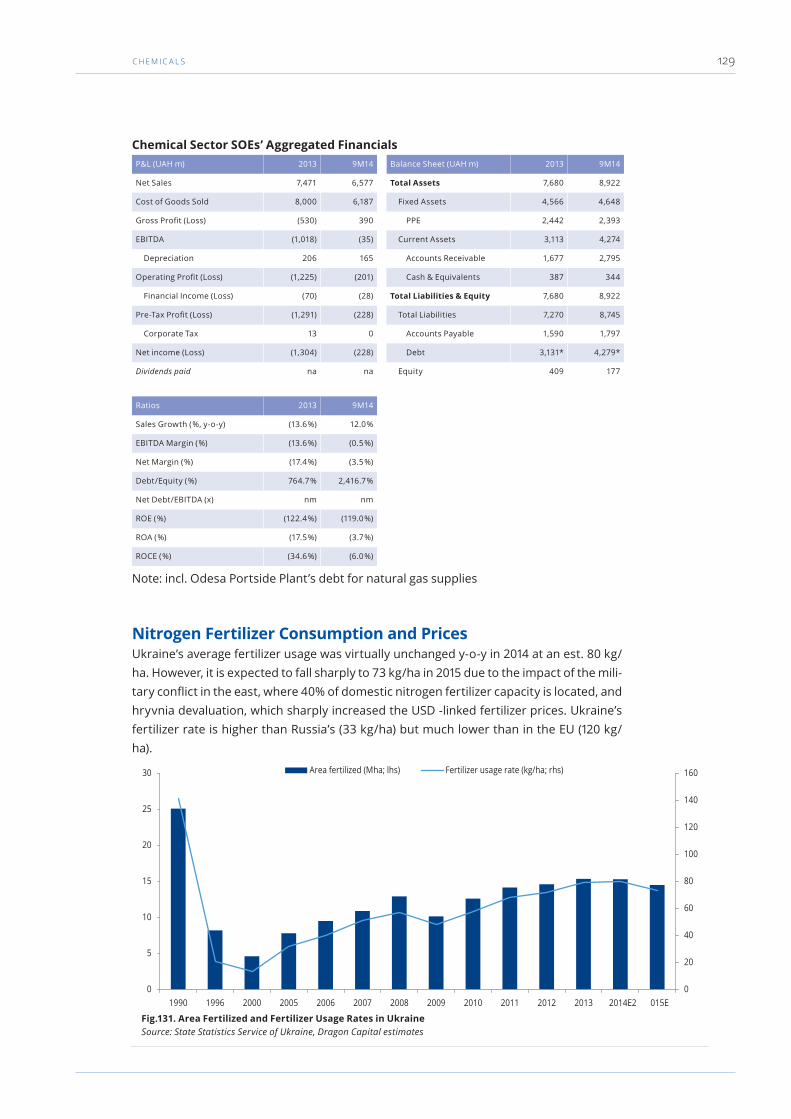
c H E M I c A l S 129
Chemical Sector SOEs’ Aggregated FinancialsP&L (UAH m) 2013 9M14 Balance Sheet (UAH m) 2013 9M14
Net Sales 7,471 6,577 Total Assets 7,680 8,922
Cost of Goods Sold 8,000 6,187 Fixed Assets 4,566 4,648
Gross Profit (Loss) (530) 390 PPE 2,442 2,393
EBITDA (1,018) (35) Current Assets 3,113 4,274
Depreciation 206 165 Accounts Receivable 1,677 2,795
Operating Profit (Loss) (1,225) (201) Cash & Equivalents 387 344
Financial Income (Loss) (70) (28) Total Liabilities & Equity 7,680 8,922
Pre-Tax Profit (Loss) (1,291) (228) Total Liabilities 7,270 8,745
Corporate Tax 13 0 Accounts Payable 1,590 1,797
Net income (Loss) (1,304) (228) Debt 3,131* 4,279*
Dividends paid na na Equity 409 177
Ratios 2013 9M14
Sales Growth ( %, y-o-y) (13.6 %) 12.0 %
EBITDA Margin ( %) (13.6 %) (0.5 %)
Net Margin ( %) (17.4 %) (3.5 %)
Debt/Equity ( %) 764.7 % 2,416.7 %
Net Debt/EBITDA (x) nm nm
ROE ( %) (122.4 %) (119.0 %)
ROA ( %) (17.5 %) (3.7 %)
ROCE ( %) (34.6 %) (6.0 %)
Note: incl. Odesa Portside Plant’s debt for natural gas supplies
Nitrogen Fertilizer Consumption and PricesUkraine’s average fertilizer usage was virtually unchanged y-o-y in 2014 at an est. 80 kg/ha. However, it is expected to fall sharply to 73 kg/ha in 2015 due to the impact of the mili-tary conflict in the east, where 40% of domestic nitrogen fertilizer capacity is located, and hryvnia devaluation, which sharply increased the USD -linked fertilizer prices. Ukraine’s fertilizer rate is higher than Russia’s (33 kg/ha) but much lower than in the EU (120 kg/ha).
Fig.131. Area Fertilized and Fertilizer Usage Rates in Ukraine Source: State Statistics Service of Ukraine, Dragon Capital estimates
0
20
40
60
80
100
120
140
160
0
5
10
15
20
25
30
1990 1996 2000 2005 2006 2007 2008 2009 2010 2011 2012 2013 2014E2 015E
Area fertilized (Mha; lhs) Fertilizer usage rate (kg/ha; rhs)

U K R A I N E ’ S T O P -1 0 0 S TAT E - O W N E D E N T E R P R I S E S › 2 0 1 3 & 9 M O N T H S 2 0 1 4130
Ammonium nitrate (AN), historically the most popular fertilizer in Ukraine, accounted for 39% of total fertilizer consumption in 2014, or 1.4 Mt in volume terms (–15% y-o-y), with 164 kt (–25% y-o-y) or 12% of this volume imported, mostly from Russia. AN imports have declined since 2010 (from 25-30% of total consumption) after Ukraine imposed and subsequently increased import duties (to 20.5-36.0% from July 2014). In 2014, AN prices in Ukraine averaged USD 330/t (–6% y-o-y). The product traded at USD 340/t in mid-Janu-ary, up by 24% since November, reflecting expectations of shortages ahead of the spring planting season amid uncertainty about the viability of imports from Russia due to both the military conflict in the east and high import duties.
Compound (NPK) fertilizers, which are mainly imported, accounted for 25% of total do-mestic fertilizer consumption in 2014, or 844 kt in volume terms (–28% y-o-y). Last year’s imports fell by 29% y-o-y to 760 kt (90% of total consumption) and were delivered mainly from Russia (85% of total or 644 kt) and Belarus (13% of total or 102 kt). Domestic NPK prices averaged USD 420/t last year (–18% y-o-y) and were quoted at USD 375/t in mid-January (–25% y-o-y).
In 2014, domestic fertilizer plants produced 3.0 Mt of am-monia (–30% y-o-y), 2.2 Mt of urea (–26%; 997 kt in nutrient equivalent) and 1.6 Mt of am-monium nitrate (–27%; 566 kt in nutrient equivalent). As a result, the industry’s capacity utiliza-tion dropped to an est. 45% in 2014 from 56% in 2013 as the military conflict in the east left two plants, Stirol and Severodo-netsk Azot, accounting for 40% of the industry’s total capacity, shut down for much of the year (Severodonetsk Azot resumed
Fig.132. Fertilizer Usage Across Ukraine (2014) Source: State Statistics Service of Ukraine
Fig.133. Ukraine Fertilizer Consumption (volume terms; 2014) Note: NPK — complex fertilizers of nitrogen, phosphorus, and potassium; UAN — urea ammonium nitrate. Source: State Statistics Service of Ukraine, Ostchem, Dragon Capital estimates
Ammonium Nitrate, 39.5%NPK, 24.6%Urea, 18.0%UAN, 11.0%Ammonium Sulphate, 4.6%NP, 2.2%

c H E M I c A l S 131
production in late December when the city it is based in returned under the control of the Ukrainian Government, while Stirol is still idle). In addition, Ukraine’s four other fertilizer plants were constrained by a shortage of natural gas, the key input in nitrogen fertilizer production.
Ukraine consumed an est. 3.9 Mt of organic and non-organic fertilizers in 2014, or 1.5 Mt in nutrient equivalent, down 7% y-o-y. Nitrogen fertilizers accounted for 64% of total consumption, in line with the global consumption breakdown. Last fall, domestic farmers bought 1.7 Mt of fertilizers or 0.7 Mt in nutrient equivalent, down 22% y-o-y but almost fully satisfying their immediate needs. For the spring planting season, farmers are ex-pected to require 2.1 Mt of fertilizers (0.8 Mt in nutrient equivalent, –25% y-o-y).
Fig.134. Ammonium Nitrate Price Dynamics (EXW, USD/t; Jan’11–Jan’15) Source: Cherkasy Fertilizer Research Institute
200
220
240
260
280
300
320
340
360
380
400
Jan
11
Mar
11
May
11
Jul 1
1
Sep
11
Nov
11
Jan
12
Mar
12
May
12
Jul 1
2
Sep
12
Nov
12
Jan
13
Mar
13
May
13
Jul 1
3
Sep
13
Nov
13
Jan
14
Mar
14
May
14
Jul 1
4
Sep
14
Nov
14
Jan
15
Fig.136. World Fertilizer Consumption (volume terms; 2013) Source: Business World Agency
Fig.135. Ukraine Fertilizer Consumption (volume terms; 2014) Source: State Statistics Service of Ukraine, Cherkasy Fertilizer Research Institute
Nitrogen, 63.9%Phosphate, 20.2%Potash, 15.9%
Nitrogen, 61.0%Phosphate, 23.0%Potash, 16.0%

U K R A I N E ’ S T O P -1 0 0 S TAT E - O W N E D E N T E R P R I S E S › 2 0 1 3 & 9 M O N T H S 2 0 1 4132
A shortage of ammonium nitrate of about 350-370 kt is expected in 1H15, as one of the four AN producing plants (Stirol with 24% of total AN capacity) remains idle and the other three face gas shortages. Its un-dersupply, however, is likely to be offset by urea or UAN.
Urea’s share of domestic fertilizer con-sumption surged in the past two years, from 7% in 2012 to an est. 18% in 2014. Its 2014 consumption totaled an est. 618 kt (+95% y-o-y), with production of 2.0 Mt (–28%) and exports of 1.5 Mt (–37%). In 2015, given the forecast AN shortage, urea consumption may rise by 70% y-o-y to 1 Mt.
NPK accounted for the bulk of fertilizer im-ports to Ukraine in 11M14 (40%), followed by ammonium nitrate with 10%. Both prod-ucts were imported mainly from Russia.
In 2014, domestic fertilizer prices fell by 6-22% in dollar terms, in line with global price dynamics, but surged by 30-50% in hryvnia terms as the local currency depre-ciated. Since domestic farmers sell their
produce at dollar-linked prices, the spike in fertilizer prices in hryvnia terms should not be critical for them.
2011 2012 2013 2014 Chg. ‘14/’13, %
Ammonium Nitrate* 373 –389 375 –390 340 –360 330 (6 %)
NPK 450 550 515 420 (18 %)
Urea 486 520 460 360 (22 %)
Urea Ammonium Nitrate 314 362 344 315 (8 %)
Average Fertilizer Prices for Farmers in Ukraine (incl. VAT; $/t; 2011 –14)
Fig.137. Ukraine Fertilizer Imports (volume terms; 11M14) Note: KCl — potassium chloride, CAN — calcium ammonium nitrate, UAN — urea ammonium nitrate. Source: State Statistics Service of Ukraine, Cherkasy Fertilizer Research Institute
NPK, 40.0%AN, 10.0%KCl, 10.0%Ammonium Sulphate, 9.0%Urea, 8.0%CAN, 7.0%UAN, 6.0%Ammonia, 5.0%NP, 5.0%
Fig.138. Ukraine Fertilizer Exports (value terms; 2014) Source: State Statistics Service of Ukraine, Cherkasy Fertilizer Research Institute
Turkey, 30.8%Italy, 12.2%Djibouti, 7.3%Other, 49.7%

c H E M I c A l S 133
Note:*wholesale and retail prices shown for AN. Source: Cherkasy Fertilizer Research Insti-tute, Dragon Capital estimates
In 2014, Ukraine’s fertilizer exports fell by 43% in dollar terms to USD 648m. The major importers were Turkey (31% of total exports in volume terms), Italy (12%) and the African state of Djibouti (7%). Fertilizer imports in value terms fell by 17% y-o-y to USD 176m last year due to lower AN imports from Russia. Russia accounted for 91% of Ukraine’s 2014 fertilizer imports (–6ppt y-o-y).
Nitrogen Fertilizer Production Asset BaseUkraine’s six fertilizer plants can produce 5.3 Mt of ammonia, 3.4 Mt of urea and 2.8 Mt of ammonium nitrate p.a. The largest ammonia and urea producer by capacity is Stirol (see charts below). OPP, the only state-owned producer in this sector, accounts for 17% of the ammonia capacity and 19% of the urea capacity.
Ukraine’s major ammonia export route is a 2,417 km pipeline stretching from Russian ni-
trogen fertilizer producer TogliattiAzot to OPP facilities at the Black Sea port of Pivdenniy (Yuzhny) and connecting to Stirol on its way. Transhipment facilities at Pivdenniy are oper-ated by OPP. The pipeline was built in the 1970s by an American investor, who held con-cession rights to it until 1997. Currently the pipeline is state-owned. Its annual throughput capacity is 2.5 Mt and the length of its Ukrainian section totals 807 km.
The Ukrainian Government held a privatization auction to sell its 99.6% stake in OPP in 2009 but canceled its results shortly afterwards, with the company remaining state-owned since. At the time, the company was offered for privatization without the ammonia transhipment unit.
Fig.140. Ukraine Urea Capacity Breakdown (%; 2014) Source: Companies, Cherkasy Research Institute for Fertilizers
Fig.139. Ukraine Ammonia Capacity Breakdown (%; 2014) Source: Companies, Cherkasy Research Institute for Fertilizers
Stirol, 27.9%Severodonetsk Azot, 19.0%Cherkasy Azot, 18.3%Odesa Portside Plant, 17.1%Dneproazot, 9.9%Rivneazot, 8.0%
Stirol, 27.6%Cherkasy Azot, 22.3%Odesa Portside Plant, 19.4%Dneproazot, 19.4%Severodonetsk Azot, 11.4%

U K R A I N E ’ S T O P -1 0 0 S TAT E - O W N E D E N T E R P R I S E S › 2 0 1 3 & 9 M O N T H S 2 0 1 4134
Fig.141. Ammonia Pipeline and Major Ukrainian Fertilizer Producers Source: Dragon Capital
SWOT Analysis
Strengths
‣ Solid global position (5-7% of global ammonia exports)
‣ Sizable and partly modernized nitrogen fertilizer production capacitiesIndustry consolidation — four of six plants are controlled by one business group
Opportunities
‣ Diversification of natural gas supplies
‣ Further modernization to reduce gas usage
‣ Construction of complex-fertilizer production facilities
Weaknesses
‣ Growing prices of imported complex fertilizers such as NPK due to hryvnia depreciation
‣ Reduced demand for nitrogen fertilizers due to their dollar-linked prices growing in response to hryvnia depreciation
Threats
‣ Uncertainty over natural gas supply due to tensions with Russia
‣ Reduction in ammonia supplies through the pipeline from Russia
‣ Volatile soft commodities prices affecting farmer demand for fertilizers
‣ Liquidity shortages experienced by Ukrainian farmers, depressing their demand for fertilizers
‣ Adverse gas price dynamics making production loss-making

cO A l M I N I N G 135
coal MiningOverview of Sector SOEsCoal mining is a key sector of the Ukrainian economy, both as a supplier to other indus-tries (power and heat generation, metallurgical coke production) and a major employer (300,000 jobs). Coal mining accounted for 3.2% of Ukraine’s industrial production in 2014, down from 4.3% in 2013 due to the impact of military conflict in the coal-rich eastern re-gion of Ukraine. In volume terms, production by state-owned mines accounted for 36% of last year’s total coal output.
Seven companies out of the TOP-100 SOEs represent the coal mining sector, accounting for 5% of the group’s total revenues and a mere 2% of total assets. State-owned coal mining assets have a long history of inefficient operations, reporting combined negative EBITDA of UAH 681m and net losses of UAH 1.2bn in 9M14. Their total equity was negative at UAH 3.4bn. Combined ROCE was likewise negative at 63% in 9M14.
Top Coal Mining Sector SOEs (9M14 data)Name Core activity Net sales
(UAH m)
Assets (UAH m) Number of
employees
State stake ROCE( %)
Coal of Ukraine Coal trade 5,664 4,217 141 100 % 4.3 %
Selidovvuhillya Coal mining 341 1,571 9,888 100 % nm
Lysychanskvuhillya Coal mining 109 1,390 5,509 100 % nm
Krasnoarmiyskvuhillya Coal mining 261 1,102 9,581 100 % nm
Krasnolymanska Coal mining 340 1,119 6,218 100 % 14.8 %
Lvivvuhillya Coal mining 638 853 11,162 100 % nm
Dzerzhynskvuhillya Coal mining 129 627 6,182 100 % nm
Coal Mining Sector SOEs’ Aggregated FinancialsP&L (UAH m) 2013 9M14 Balance Sheet (UAH m) 2013 9M14
Net Sales 7,684 7,482 Total Assets 10,784 10,878
Cost of Goods Sold 10,091 8,991 Fixed Assets 7,394 5,591
Gross Profit (Loss) (2,407) (1,509) PPE 4,070 3,856
EBITDA (138) (681) Current Assets 3,390 5,288
Depreciation 399 340 Accounts Receivable 2,412 4,306
Operating Profit (Loss) (537) (1,021) Cash & Equivalents 30 75
Financial Income (Loss) (399) (349) Total Liabilities & Equity 10,784 10,878
Pre-Tax Profit (Loss) (878) (1,203) Total Liabilities 13,008 14,327
Corporate Tax (16) 5 Accounts Payable 5,222 5,769
Net income (Loss) (861) (1,208) Debt 4,999 5,598
Dividends paid na na Equity (2,224) (3,449)
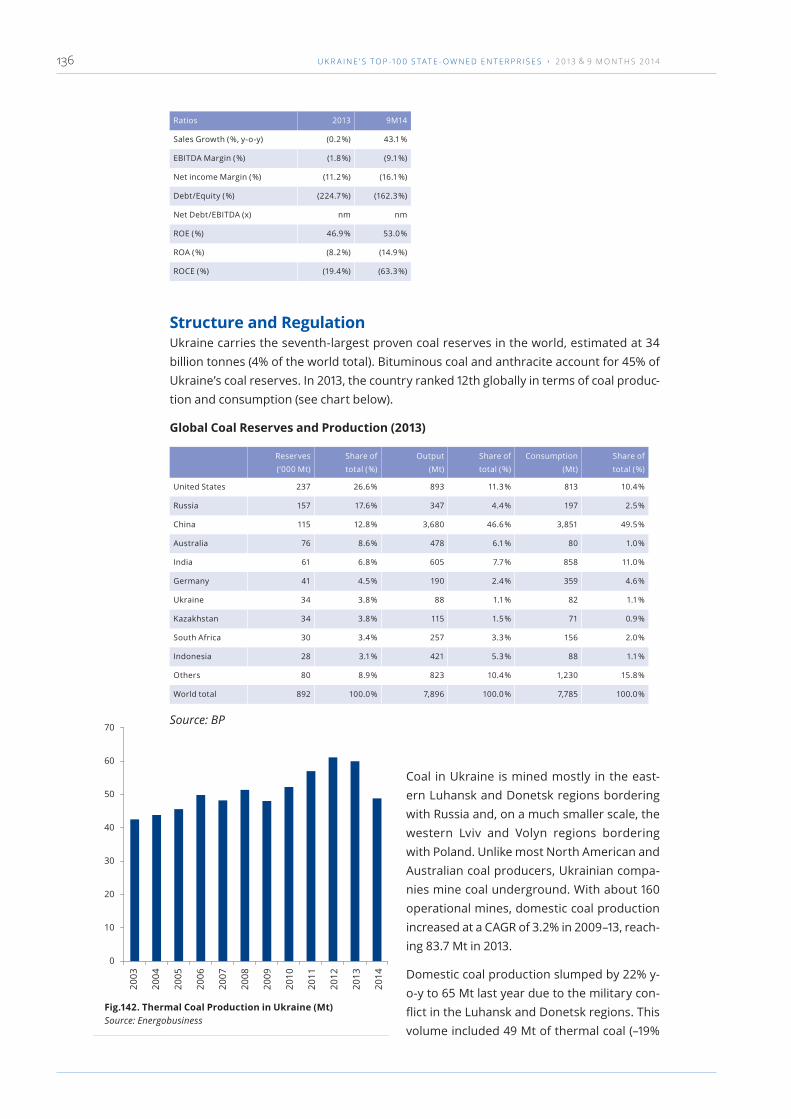
U K R A I N E ’ S T O P -1 0 0 S TAT E - O W N E D E N T E R P R I S E S › 2 0 1 3 & 9 M O N T H S 2 0 1 4136
Ratios 2013 9M14
Sales Growth ( %, y-o-y) (0.2 %) 43.1 %
EBITDA Margin ( %) (1.8 %) (9.1 %)
Net income Margin ( %) (11.2 %) (16.1 %)
Debt/Equity ( %) (224.7 %) (162.3 %)
Net Debt/EBITDA (x) nm nm
ROE ( %) 46.9 % 53.0 %
ROA ( %) (8.2 %) (14.9 %)
ROCE ( %) (19.4 %) (63.3 %)
Structure and RegulationUkraine carries the seventh-largest proven coal reserves in the world, estimated at 34 billion tonnes (4% of the world total). Bituminous coal and anthracite account for 45% of Ukraine’s coal reserves. In 2013, the country ranked 12th globally in terms of coal produc-tion and consumption (see chart below).
Global Coal Reserves and Production (2013)
Reserves
(‘000 Mt)
Share of
total ( %)
Output
(Mt)
Share of
total ( %)
Consumption
(Mt)
Share of
total ( %)
United States 237 26.6 % 893 11.3 % 813 10.4 %
Russia 157 17.6 % 347 4.4 % 197 2.5 %
China 115 12.8 % 3,680 46.6 % 3,851 49.5 %
Australia 76 8.6 % 478 6.1 % 80 1.0 %
India 61 6.8 % 605 7.7 % 858 11.0 %
Germany 41 4.5 % 190 2.4 % 359 4.6 %
Ukraine 34 3.8 % 88 1.1 % 82 1.1 %
Kazakhstan 34 3.8 % 115 1.5 % 71 0.9 %
South Africa 30 3.4 % 257 3.3 % 156 2.0 %
Indonesia 28 3.1 % 421 5.3 % 88 1.1 %
Others 80 8.9 % 823 10.4 % 1,230 15.8 %
World total 892 100.0 % 7,896 100.0 % 7,785 100.0 %
Source: BP
Coal in Ukraine is mined mostly in the east-ern Luhansk and Donetsk regions bordering with Russia and, on a much smaller scale, the western Lviv and Volyn regions bordering with Poland. Unlike most North American and Australian coal producers, Ukrainian compa-nies mine coal underground. With about 160 operational mines, domestic coal production increased at a CAGR of 3.2% in 2009–13, reach-ing 83.7 Mt in 2013.
Domestic coal production slumped by 22% y-o-y to 65 Mt last year due to the military con-flict in the Luhansk and Donetsk regions. This volume included 49 Mt of thermal coal (–19%
Fig.142. Thermal Coal Production in Ukraine (Mt) Source: Energobusiness
0
10
20
30
40
50
60
70
2003
2004
2005
2006
2007
2008
2009
2010
2011
2012
2013
2014

cO A l M I N I N G 137
y-o-y) and 16 Mt of coking coal (–32%). Output from state-owned coal mines fell by 27% y-o-y to 18 Mt (36% share, –4ppt y-o-y).
The military conflict in the east disrupted produc-tion and logistics at numerous mines. A number of mines had to shut down for security reasons while others halted work due to destroyed power sup-ply lines, facing the risk of being flooded by under-ground waters. Those still operating had to stock-pile mined coal on their premises as destroyed or blockaded railways prevented delivery to consum-ers. Some 48 state-owned mines operated at a fraction of their capacity.
Fig.143. Coking Coal Production in Ukraine (Mt) Source: Energobusiness
0
5
10
15
20
25
30
35
40
2003
2004
2005
2006
2007
2008
2009
2010
2011
2012
2013
2014
Fig.144. Breakdown of Thermal Coal Production (Mt) Source: Energobusiness
Fig.145. Breakdown of Coking Coal Production (Mt) Source: Energobusiness
0
10
20
30
40
50
60
70 Private mines State-owned mines
2004
2005
2006
2007
2008
2009
2010
2011
2012
2013
2014
0
5
10
15
20
25
30
35
40 Private mines State-owned mines
2004
2005
2006
2007
2008
2009
2010
2011
2012
2013
2014
Fig.146. Breakdown of Thermal Coal Output by Region(2013) Source: Energobusiness
Fig.147. Breakdown of Thermal Coal Output by Region(2014) Source: Energobusiness
Donetsk, 19.5 Mt (33%)Luhansk, 20.5 Mt (34%)Other, 20.0 Mt (33%)
Donetsk, 13.5 Mt (28%)Luhansk, 14.7 Mt (30%)Other, 20.7 Mt (42%)
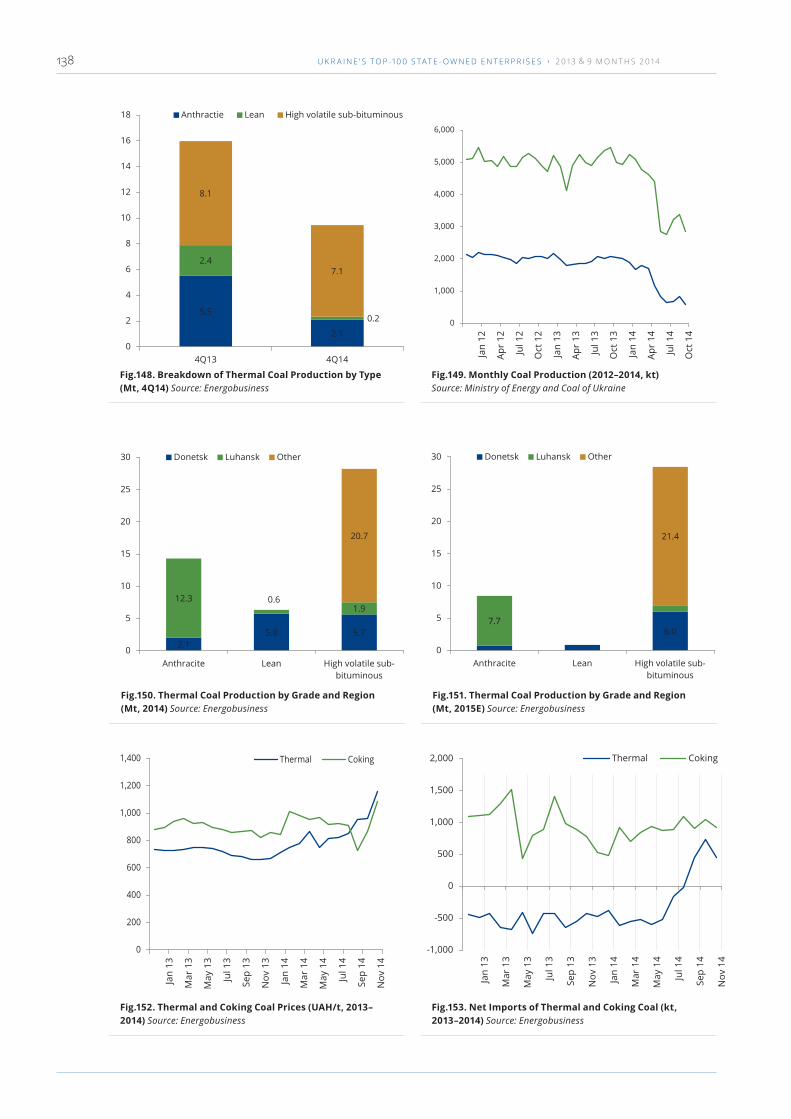
U K R A I N E ’ S T O P -1 0 0 S TAT E - O W N E D E N T E R P R I S E S › 2 0 1 3 & 9 M O N T H S 2 0 1 4138
Fig.148. Breakdown of Thermal Coal Production by Type (Mt, 4Q14) Source: Energobusiness
Fig.149. Monthly Coal Production (2012–2014, kt) Source: Ministry of Energy and Coal of Ukraine
Fig.150. Thermal Coal Production by Grade and Region (Mt, 2014) Source: Energobusiness
Fig.151. Thermal Coal Production by Grade and Region (Mt, 2015E) Source: Energobusiness
5.5
2.1
2.4
0.2
8.1
7.1
0
2
4
6
8
10
12
14
16
18
4Q13 4Q14
Anthractie Lean High volatile sub-bituminous
0
1,000
2,000
3,000
4,000
5,000
6,000
Jan
12
Apr
12
Jul 1
2
Oct
12
Jan
13
Apr
13
Jul 1
3
Oct
13
Jan
14
Apr
14
Jul 1
4
Oct
14
2.15.8 5.7
12.3 0.61.9
20.7
0
5
10
15
20
25
30
Anthracite Lean High volatile sub-bituminous
Donetsk Luhansk Other
6.07.7
21.4
0
5
10
15
20
25
30
Anthracite Lean High volatile sub-bituminous
Donetsk Luhansk Other
Fig.152. Thermal and Coking Coal Prices (UAH/t, 2013–2014) Source: Energobusiness
Fig.153. Net Imports of Thermal and Coking Coal (kt, 2013–2014) Source: Energobusiness
0
200
400
600
800
1,000
1,200
1,400 Thermal Coking
Jan
13
Mar
13
May
13
Jul 1
3
Sep
13
Nov
13
Jan
14
Mar
14
May
14
Jul 1
4
Sep
14
Nov
14
-1,000
-500
0
500
1,000
1,500
2,000 Thermal Coking
Jan
13
Mar
13
May
13
Jul 1
3
Sep
13
Nov
13
Jan
14
Mar
14
May
14
Jul 1
4
Sep
14
Nov
14

cO A l M I N I N G 139
As a result, coal production in Ukraine halved y-o-y in August 2014 and continued to de-cline for the rest of the year. In 4Q14, thermal coal output slumped by 41% y-o-y to 16 Mt, with anthracite production down by 62% to 2.1 Mt and lean coal output plunging by 91% to 212 kt. Production of high-volatile coals declined by a moderate 12% as relevant produc-tion assets (DTEK’s Pavlohrad Coal and mines in the western Lviv and Volyn regions) were not affected by the military hostilities.
Production of coking coal, which is mined solely in the Donetsk and Luhansk regions, was hit even harder, falling from 2 Mt in January 2014 to a mere 600 kt in December.
As a result, in September 2014 Ukraine turned from a net exporter into a net importer of thermal coal and increased imports of coking coal (it had been a net importer historically). For the full year, net exports of thermal coal were still positive at 2.2 Mt, down from 6.3 Mt in 2013, with net imports in 2H14 totaling 923 kt (vs. net exports of 3.2 Mt in 2H13). Coking coal imports totaled 10.1 Mt in 2014, down by 18% y-o-y and in line with the decline in pig iron production.
Coal Production Costs (UAH/t, 2014)
Total
(UAH/t)
Change
( %, y-o-y)
Materials
(UAH/t)
Personnel
(UAH/t)
Depreciation
(UAH/t)
Other
(UAH/t)
SG&A
(UAH/t)
Sales and
Distribution
(UAH/t)
Donetsk region
Donetskvuhillya 1,716.8 12.2 % 520.3 843.5 115.3 157.1 72.0 8.8
Donbas 730.9 3.8 % 231.6 374.5 42.0 53.8 21.4 7.6
Pivdenno-Donbaske #1 1,258.9 41.6 % 314.5 697.0 115.6 76.7 45.3 9.8
Mospinska 764.9 na 534.9 116.5 (92.5) 195.1 10.9 0.0
Makiyivvuhillya 1,583.0 13.5 % 481.5 767.7 85.0 123.9 116.1 8.9
Krasnoarmiyskvuhillya 2,053.7 (25.7 %) 582.1 1004.5 157.5 185.2 108.7 15.8
Krasnolimanskaya 708.7 (5.9 %) 197.0 333.6 98.1 50.3 24.5 5.3
Selidovvuhillya 1,837.3 118.6 % 388.4 1097.5 142.8 109.0 93.9 5.6
Artemvuhillya 2,242.1 40.7 % 830.8 1040.3 64.5 171.2 127.4 8.0
Dzerzhinskvuhillya 2,843.2 70.6 % 1248.2 1152.9 102.2 161.2 173.0 5.7
Ordzhonikidzevuhillya 2,867.5 21.2 % 998.7 1343.9 47.6 280.7 172.9 23.7
Shahtarskantratsyt 1,332.3 33.9 % 396.9 676.1 79.2 96.8 79.1 4.3
Torezantratsit 893.5 60.4 % 262.2 422.2 85.9 62.7 55.5 5.1
Snezhnoeantratsyt 1,480.0 0.0 % 441.3 742.8 79.1 122.1 89.8 4.9
Donetsk region average 1,098.4 29.9 % 345.7 508.5 107.0 78.8 53.4 5.0
Luhansk region
Luhanskvuhillya 1,406.4 7.2 % 386.8 761.2 93.4 83.6 68.4 12.9
Bilorechenska 1,171.8 12.7 % 233.8 638.9 129.5 81.7 52.1 35.9
Pervomayskvuhillya 4,359.4 24.3 % 1050.3 2452.6 214.4 293.8 327.4 21.0
Lysychanskvuhillya 2,979.9 (21.7 %) 606.1 1688.7 358.6 198.1 101.8 26.6
Donbasantratsyt 1,719.5 2.1 % 404.3 944.3 79.8 153.6 123.9 13.5
Antratsyt 968.7 1.5 % 350.9 401.1 101.8 51.1 49.2 14.6
Luhansk region average 1,624.1 5.4 % 426.2 853.8 128.5 108.9 89.6 17.1
Lvivvuhillya 1,610.5 (21.4 %) 375.8 928.7 52.1 144.5 97.6 11.8
Nadiya 803.1 (22.6 %) 199.0 478.5 15.3 41.9 52.7 15.7
Volynvuhillya 3,362.0 66.0 % 670.1 1952.7 133.6 298.3 276.7 30.7
State owned mines 1,513.3 17.3 % 430.0 778.2 96.5 114.1 83.6 10.8
Ukraine average 1,219.5 22.8 % 360.4 594.1 106.5 88.1 62.9 7.5
Source: Energobusiness

U K R A I N E ’ S T O P -1 0 0 S TAT E - O W N E D E N T E R P R I S E S › 2 0 1 3 & 9 M O N T H S 2 0 1 4140
State-owned coal mines remain highly inefficient and heavily reliant on state subsidies. In 2014, their average production costs increased by 17% to UAH 1,513 per tonne of mined coal, almost double the government-set average sale price of UAH 850/t. The difference was financed by the state, with subsidies amounting to UAH 7.7bn for the full year, down from UAH 13bn in 2013 as the Government stopped supporting mines on uncontrolled territory.
Reforms in the coal mining industry have been very slow to date, partly due to the po-litical and social sensitivity of closing down loss-making mines and partly due to vested interests trying to preserve intransparent subsidy distribution schemes. The military con-flict in the east left 35 state-owned mines under central Ukrainian Government control, of which five have been considered for closure, seven for conservation, and the remainder for privatization.
SWOT Analysis
Strengths
‣ Sizable coal reserves sufficient for many years of active production
Opportunities
‣ Privatization would ease the burden of subsidies carried by the state budget
‣ Higher utilization of lignite coal, which is available in regions not affected by the military conflict
‣ With coal imports priced at USD 80/t and higher, domestic production becomes more attractive
Weaknesses
‣ High production costs due to outdated mining equipment and widespread manual labor
‣ Low coal quality hinders exports
‣ Large shaft depths increase extraction costs
Threats
‣ Potential social tensions due to underfinancing of state-owned mines and reforms leading to mass lay-offs
‣ Damaged transport infrastructure in the coal-rich east hampers deliveries from mines
‣ Potential loss of control over mines located in the area not controlled by the Ukrainian Government

B A N K I N G 141
BankingOverviewUkraine has a two-tier banking system composed of a central bank and commercial banks, including subsidiaries of foreign banks. The central bank is the National Bank of Ukraine (the NBU), vested in accordance with the Constitution of Ukraine with the prima-ry function to support the stability of the national currency. The NBU is also authorized to regulate and supervise activities of the banking system participants.
The main assets of the state-owned banks are loans provided to customers and securities (primarily, state bonds, corporate bonds and bonds issued by SOEs).
The gross loan book of the state banks increased by 43% as of 31 December 2014 as compared to the prior year at the account of new loans to customers and also as a result of the UAH depreciation inflat-ing foreign currency denominated loans.
In 2014, the quality of the loan portfolio of the state-owned banks, as well as privately owned banks, was significantly hit by the annexation of Crimea, military conflict in eastern Ukraine and political and social instability resulting in a substantial increase of the share of non-performing loans (categories 4 and 5, according to the NBU classification).
Balance Sheet (UAH m) 2013 2014
Cash & Equivalents 16,555 30,974
Balances with NBU 1,400 2
Due from other banks 7,703 4,890
Loans to customers, net 105,134 131,774
››Gross amount 136,558 156,406
››LLP 31,824 64,632
Securities 77,177 95,176
PPE& intangible assets 7,288 7,610
Otherassets 17,528 14,827
Total assets 232,786 285,254
Funds of banks 50,651 48,952
Funds of customers 98,631 128,408
Other borrowed funds 27,068 53,953
Other liabilities 4,943 4,731
Subordinated debt 3,937 7,778
Total liabilities 185,231 243,832
Share capital 60,124 77,789
Accumulated loss (17,257) (41,205)
Other reserves 4,699 4,839
Total equity 47,555 41,422
Source: NBU data
Fig.154. Structure of Loans to Customers as of 31 Dec 2014 (gross), %
Loans to legal entites, 93.1%Loans to private individuals, 6.9%
Fig.155. Share of NPLs in the gross loan portfolio of state-owned banks Source: quarterly reports of the state-owned banks
15.3%
15.9%
18.2%
28.3%31 Dec 11
31 Dec 12
31 Dec 13
31 Dec 14
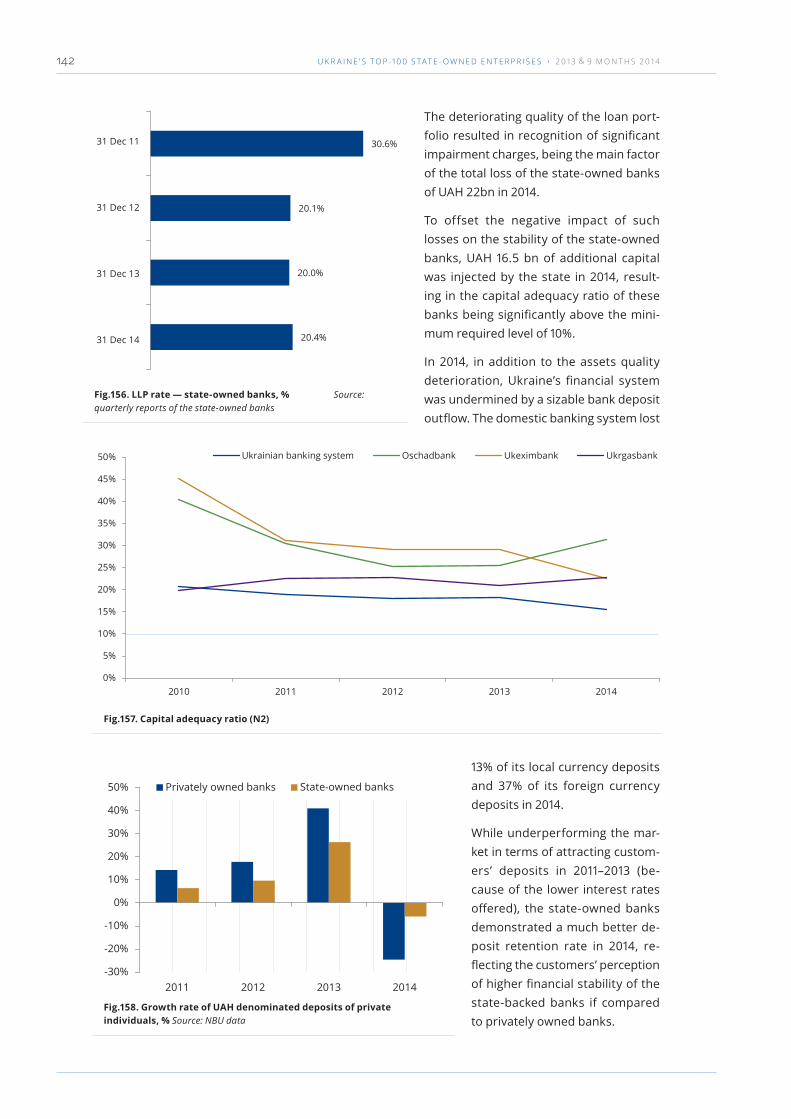
U K R A I N E ’ S T O P -1 0 0 S TAT E - O W N E D E N T E R P R I S E S › 2 0 1 3 & 9 M O N T H S 2 0 1 4142
The deteriorating quality of the loan port-folio resulted in recognition of significant impairment charges, being the main factor of the total loss of the state-owned banks of UAH 22bn in 2014.
To offset the negative impact of such losses on the stability of the state-owned banks, UAH 16.5 bn of additional capital was injected by the state in 2014, result-ing in the capital adequacy ratio of these banks being significantly above the mini-mum required level of 10%.
In 2014, in addition to the assets quality deterioration, Ukraine’s financial system was undermined by a sizable bank deposit outflow. The domestic banking system lost
13% of its local currency deposits and 37% of its foreign currency deposits in 2014.
While underperforming the mar-ket in terms of attracting custom-ers’ deposits in 2011–2013 (be-cause of the lower interest rates offered), the state-owned banks demonstrated a much better de-posit retention rate in 2014, re-flecting the customers’ perception of higher financial stability of the state-backed banks if compared to privately owned banks.
Fig.156. LLP rate — state-owned banks, % Source: quarterly reports of the state-owned banks
20.4%
20.0%
20.1%
30.6%31 Dec 11
31 Dec 12
31 Dec 13
31 Dec 14
Fig.157. Capital adequacy ratio (N2)
0%
5%
10%
15%
20%
25%
30%
35%
40%
45%
50%
2010 2011 2012 2013 2014
Ukrainian banking system Oschadbank Ukeximbank Ukrgasbank
Fig.158. Growth rate of UAH denominated deposits of private individuals, % Source: NBU data
Privately owned banks State-owned banks
-30%
-20%
-10%
0%
10%
20%
30%
40%
50%
2011 2012 2013 2014

B A N K I N G 143
As of 31 December 2014, funds of private individuals placed with state-owned banks amounted to UAH 65bn (or 16% of the total banking system), while funds of legal entities were UAH 62bn (or 21% of the total banking system).
As shown in the table to the right, losses reported by the state-owned banks in 2014 were driven by significant impairment charges.
P&L (UAH m) 2013 2014
Interest income 23,235 29,805
Interest expenses (12,902) (17,859)
Net interest income 10,333 11,946
Commission income 2,353 2,600
Commission expenses (435) (550)
Trading with securities (1) 3,731
FOREX gain/(losses) 220 3,338
Revaluation of investment property (35) (1,718)
Other operating income/expenses 479 308
Provision for impairment (5,038) (35,738)
Administrative expenses (5,707) (6,908)
Pre-Tax Profit (Loss) 2,173 (22,989)
Tax expenses (360) 793
Net profit (loss) 1,813 (22,196)
During the period of 2011–2014, net in-terest margin of the major state-owned banks, Oschadbank and Ukreximbank, (calculated as a ratio of net interest income to the average annual balance of interest-bearing assets) was steadily declining due to an increasing cost of funding (primarily, the cost of the customers’ deposits).
At the same time, a relatively low cost to income ratio of Oschadbank and Ukrex-imbank allows these banks to maintain quite solid levels of pre-provision operat-ing profit.
For the purposes of this report, the cost to income ratio was calculated as a ratio of administrative expenses to the sum of net interest income and net fee and commis-sion income.
Bank ProfilesAs of 31 December 2014, 163 commercial banks had licenses from the NBU to per-form banking activity. The total assets of commercial banks amounted to UAH 1.3bn million.
Fig.159. Growth rate of UAH denominated deposits of legal entities, % Source: NBU data
Fig.160. Growth rate of foreign currency denominated deposits of private individuals, % Source: NBU data
Privately owned banks State-owned banks
-10%
0%
10%
20%
30%
40%
2011 2012 2013 2014
Privately owned banks State-owned banks
-45%
-30%
-15%
0%
15%
30%
45%
2011 2012 2013 2014
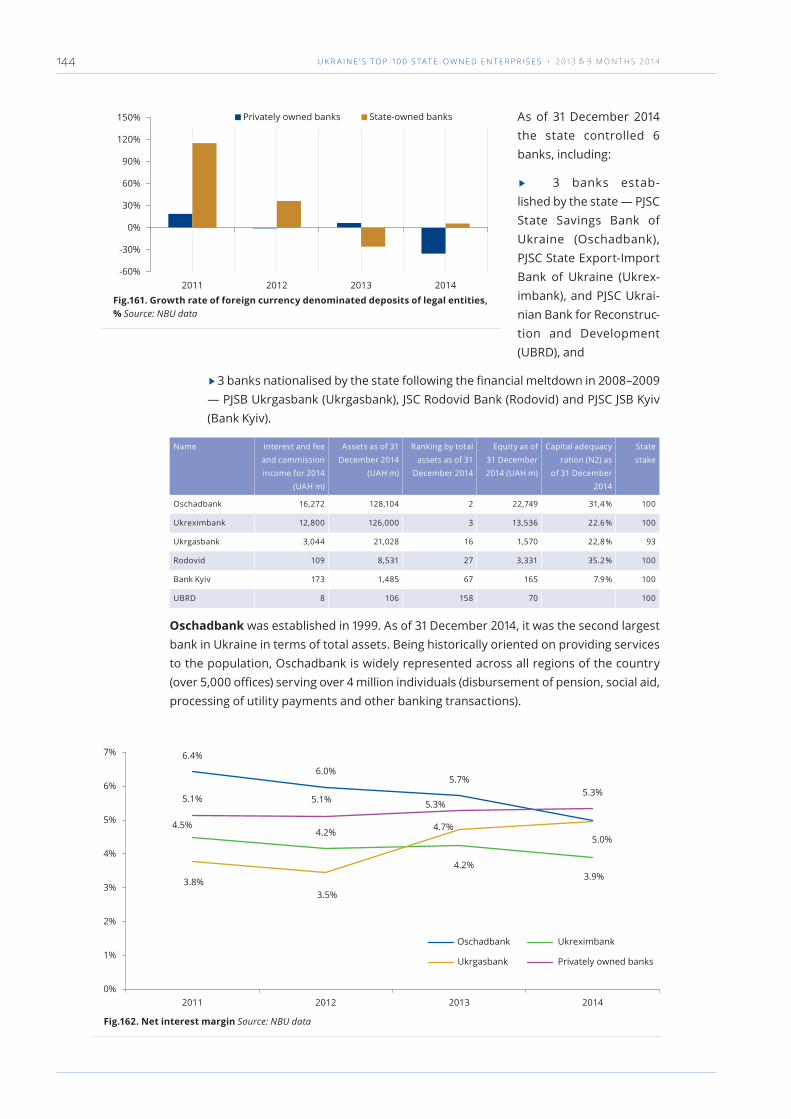
U K R A I N E ’ S T O P -1 0 0 S TAT E - O W N E D E N T E R P R I S E S › 2 0 1 3 & 9 M O N T H S 2 0 1 4144
As of 31 December 2014 the state controlled 6 banks, including:
‣ 3 banks estab-lished by the state — PJSC State Savings Bank of Ukraine (Oschadbank), PJSC State Export-Import Bank of Ukraine (Ukrex-imbank), and PJSC Ukrai-nian Bank for Reconstruc-tion and Development (UBRD), and
‣3 banks nationalised by the state following the financial meltdown in 2008–2009 — PJSB Ukrgasbank (Ukrgasbank), JSC Rodovid Bank (Rodovid) and PJSC JSB Kyiv (Bank Kyiv).
Name Interest and fee
and commission
income for 2014
(UAH m)
Assets as of 31
December 2014
(UAH m)
Ranking by total
assets as of 31
December 2014
Equity as of
31 December
2014 (UAH m)
Capital adequacy
ration (N2) as
of 31 December
2014
State
stake
Oschadbank 16,272 128,104 2 22,749 31,4 % 100
Ukreximbank 12,800 126,000 3 13,536 22.6 % 100
Ukrgasbank 3,044 21,028 16 1,570 22,8 % 93
Rodovid 109 8,531 27 3,331 35.2 % 100
Bank Kyiv 173 1,485 67 165 7.9 % 100
UBRD 8 106 158 70 100
Oschadbank was established in 1999. As of 31 December 2014, it was the second largest bank in Ukraine in terms of total assets. Being historically oriented on providing services to the population, Oschadbank is widely represented across all regions of the country (over 5,000 offices) serving over 4 million individuals (disbursement of pension, social aid, processing of utility payments and other banking transactions).
Fig.161. Growth rate of foreign currency denominated deposits of legal entities, % Source: NBU data
Privately owned banks State-owned banks
-60%
-30%
0%
30%
60%
90%
120%
150%
2011 2012 2013 2014
Fig.162. Net interest margin Source: NBU data
6.4%
6.0%5.7%
4.5%4.2%
4.2%3.9%3.8%
3.5%
4.7%5.0%
5.1% 5.1% 5.3%5.3%
0%
1%
2%
3%
4%
5%
6%
7%
2011 2012 2013 2014
Oschadbank Ukreximbank
Ukrgasbank Privately owned banks

B A N K I N G 145
Fig.163. Cost to income ratio Source: NBU data
47%54% 51% 51%
26%31% 29%
35%
79% 79%
68%
84%
73% 74% 74% 73%
0%
10%
20%
30%
40%
50%
60%
70%
80%
90%
2011 2012 2013 2014
Oschadbank Ukreximbank Ukrgasbank Privately owned banks
Fig.164. Pre-provision operating profit*, UAH m * — net profit less loan impairment charges Source: NBU data
Fig.165. % of state-owned banks in the total assets of the Ukrainian banking system
3,448
3,591
2,946
7,178
506
1,129
1,000 2,000 3,000 4,000 5,000 6,000 7,000 8,000
2013
2014
Ukrgazbank
Ukreximbank
Oschadbank
16.9%
17.0%
18.3%
18.2%
21.7%
2010
2011
2012
2013
2014
Fig.166. Portfolio of loans provided to customers as of 30 June 2014 — Oschadbank Source: the bank’s IFRS financial statement as of 30 June 2014
Energy, 22.1%Construction and real estate, 21.5%Oil, gas and chemical production, 21.0%Trade, 7.7%Food and beverage manyfacturing and processing, 7.7%
Loans to individuals, 6.0%Other, 13.9%

U K R A I N E ’ S T O P -1 0 0 S TAT E - O W N E D E N T E R P R I S E S › 2 0 1 3 & 9 M O N T H S 2 0 1 4146
Oschadbank is the only Ukrainian bank where all deposits and other valuables of custom-ers are fully guaranteed by the State.
The bank is actively working in almost all sectors of the Ukrainian financial market; it pro-vides banking services to large corporate clients, such as offices of the Pension Fund of Ukraine, Ukrposhta, members of the wholesale electrical energy market, etc.
Oschadbank intends to expand the products and services offered to its clients in the food and agricultural business, energy, retail, production of natural resources such as mineral sands and clays, and other export-oriented sectors with growth potential, as well as to small and medium enterprises (SME)
Ukreximbank was established in 1992, and as of 31 December 2014, it was the third larg-est bank in Ukraine in terms of assets. Ukreximbank operates 27 branches and 93 outlets in all regions of Ukraine.
The bank services a considerable share of export and import activities of Ukrainian en-terprises, providing specialised services in various areas of export-import banking.
Ukreximbank acts as the sole financial agent of the Government of Ukraine with respect to loans from foreign financial institutions, which are originated, borrowed or guaranteed by Ukraine. The bank is a partner of the World Bank under the largest Export Develop-ment Project in Ukraine, a partner of the European Bank for Reconstruction and Devel-opment (the EBRD) under the EBRD Trade Facilitation Programme and the EBRD Energy Efficiency Programme, a partner of Kreditanstalt fur Wiederaufbau (the KfW) under the SME Program.
Ukreximbank is favoured with over 100 clear credit lines from global financial institutions for short-term uncovered documentary and trade finance transactions and is the only Ukrainian bank recognised by over 30 primary Export Credit Agencies as a direct bor-rower/guarantor on medium and long term financing.
Fig.167. Portfolio of loans provided to customers as of 31 December 2013 — Ukreximbank Source: the bank’s IFRS financial statement as of 31 December 2013
Agriculture and food industry, 16.8%Trade, 14.8%Construction and real estate, 13.7%Extractive industry, 8.1%Chemical industry, 7.5%Loans to individuals, 1.5%Other, 37.7%

B A N K I N G 147
Such credit resources are primarily used to finance imports of industrial and agricultural equipment, chemicals for crop protection and other related supplies from numerous in-ternational providers, as well as to continue to promote export activities of leading Ukrai-nian companies.
Ukrgasbank was established in 1993 as a privately owned bank under the name of Hadji-bei bank and since its inception was focused, mainly, on corporate lending. In 2008–2009,
the bank suffered from liquidity and asset quality constraints leading to nationalisation of the bank in 2009.
During the period of 2009–2011, UAH 7.4b were injected by the state into the bank’s capital.
Following the nationalization, Ukrgasbank underwent a transformation from a corporate lending institution focused on financing and servicing the oil & gas sector to a bank with a diversified business model. Being a universal bank, it provides a full range of services for both retail and corporate customers. The bank’s branch network includes c. 270 outlets covering all regions of the country.
Rodovid was established in 2004 as the successor of the commercial bank «Personal computer». In 2009, the bank was nationalised by the State, following the financial crises of 2008–2009.
In 2011, the Cabinet of Ministers of Ukraine decided to focus Rodovid’s activities on the collection of its own loans and work out the problematic assets of other state-owned banks, nationalised by the State. As of 31 December 2014, out of UAH 8.5 bn of total as-sets of the bank, UAH 7.7 bn were represented by investment property, fixed assets and other financial assets, while the net amount of loans to customers constituted only UAH 40m.
Bank Kyiv was established in 1993. In 2009 the bank was nationalised by the State, follow-ing the financial crises of 2008–2009.
Fig.168. Portfolio of loans provided to customers as of 31 December 2013 — Ukrgasbank Source: the bank’s IFRS financial statement as of 31 December 2013
Gas transportation, 24.9%Loans to individuals, 24.3%Manufacturing, 15.5%Trade, 11.2%Transport, 5.4%Other, 18.7%

U K R A I N E ’ S T O P -1 0 0 S TAT E - O W N E D E N T E R P R I S E S › 2 0 1 3 & 9 M O N T H S 2 0 1 4148
According to the decision of the Cabinet of Ministers of Ukraine on 11 February 2015, Bank Kyiv was declared insolvent. The Deposit Guarantee Fund introduced a provisional ad-ministration at the bank to prepare a register of the bank’s assets and liabilities for their further transfer to Ukrgasbank.
UBRD was established in 2004. The strategy of the bank is to support corporate busi-nesses, and SMEs through financing innovation projects. It is the smallest state-owned bank with a gross loan book as of 31 December 2014 amounting to UAH 34 m (including interbank loans provided).
Reform PerspectiveOne of the key priorities of the Government of Ukraine is to address the financial chal-lenges and ensure the stability in the banking sector. In 2014, Ukraine complied with its obligations under the IMF Stand-By Program to monitor liquidity levels and ensure finan-cial resilience in the banking sector by upgrading the regulatory and supervisory frame-work, as well as taking steps to facilitate the restructuring of non-performing loans.
In its Letter of Intent to the IMF dated 27 February 2015, Ukraine confirmed its commit-ment to drive financial reform under the new IMF Extended Fund Facility Program (EFF) and launched a number of initiatives, including strengthening the system of banking regulation and supervision with a particular focus on loans to related parties, upgrading the banks’ capitalization strategy, enhancing the quality asset recovery and official inves-tigations of bank failures, bankruptcy procedure, and improving the capacity of banks to deal with problematic loans.
The reform of the financial sector is built into the Strategy of Sustainable Development «Ukraine-2020», published by Presidential Decree No. 5 on 12 January 2015. The Govern-ment of Ukraine intends to take steps to strengthen consolidated prudential regulation and supervision by transferring control over all credit history bureaus from the State Commission for Regulation of Financial Services Markets of Ukraine to the NBU. In this re-gard, the respective legislation has to be developed in accordance with international stan-dards to protect the creditor’s rights, liberalize the foreign currency market, address taxa-tion issues, and account for infrastructure and trans-boundary movement of capital.
To meet the IMF requirements, as well as the 20th Principle (Transactions with related parties) of the Core Principles for Effective Banking Supervision of the Basel Commit-tee, the Parliament of Ukraine passed the Law of Ukraine «On Amendments to Certain Legal Acts of Ukraine over Responsibility of Bank Related Parties» in March 2015. The purpose of this Law is to strengthen the liability of bank-related persons (primarily man-agers and beneficial owners of the banks) who make decisions that affect the financial positions of banks, improve banking supervision and protect the interests of depositors and creditors.

B A N K I N G 149
SWOT Analysis
Strengths
‣ Ukraine is a country with one of the highest branch coverage ratios (number of banking branches per 100,000 people) — 47 in Ukraine; 39 in France; 38 in Russia; 35 in the US; and 34 in Poland. As of January 2014, the total number of branches in Ukraine was 19,500.
‣ Relatively accessible funding is available for top banks — 11 out of the 16 largest Ukrainian banks, representing 69.5% of the total assets of the Ukrainian banking system as of 31 December 2014, are either state-owned or members of large international banking groups.
‣ The market is not consolidated (a large number of small players) providing potential for rapid growth through mergers and acquisitions.
Opportunities
‣ The launch of the new IMF EFF Program for Ukraine shall help stabilize the situation in the financial market.
‣ Legislative initiatives planned for 2015 are expected to bring improvements in creditors’ rights protection, enhancing investment attractiveness of banks and resolving tax issues related to non-performing loans.
‣ The ratio of banking assets to GDP is still relatively low (approximately 90%) if compared to developed countries, which indicates opportunities for further growth of lending volumes.
Weaknesses
‣ The risk-profile of current borrowers remains quite high.
‣ The Ukrainian banking system is undercapitalized.
‣ The customers’ deposit base is highly vulnerable and volatile.
‣ Underlying financial information may not always reflect a reliable financial position and performance of the banks.
‣ High level of borrowing costs poses a barrier to attract new customers and expansion of lending.
Threats
‣ Continuing economic and political destabilisation, in particular the decline of GDP, accelerating inflation and the military conflict in eastern Ukraine remain major risks for the banking sector.
‣ Lack of confidence in the national currency and a high level of dollarization of the economy threaten the stability of the country’s financial system.

U K R A I N E ’ S T O P -1 0 0 S TAT E - O W N E D E N T E R P R I S E S › 2 0 1 3 & 9 M O N T H S 2 0 1 4150

151
Company Profiles

152
The Agrarian Fund
General InformationThe PJSC Agrarian Fund was established in mid-2013 to take over the functions of the state-financed Agrarian Fund and circumvent the limitations of a not-for-profit organization. The original Agrarian Fund was tasked, in particular, with providing loans to farmers on behalf of the state via forward grain purchases and forming inventories for market interventions in order to regulate domestic food prices subject to state regulation (i.e. bread, flour, sugar, dry milk and butter). Yet both Funds currently exist in parallel as Ukrainian legislation bans transferring some of the aforementioned functions to a corporation. The PJSC Agrarian Fund (the Agrarian Fund) operates via two subsidiaries, Agrofond-Zerno (storage of state-owned grain, market interventions, and production of flour) and Agrofinfond (funding of investment projects).
Operating ResultsIn 2014, the Agrarian Fund bought forward 850 kt of grains, providing local farmers with UAH 1.2bn (USD99m) of upfront money during the planting season and UAH 0.6bn (USD50m) of cash settlement at the time of harvest, as well as purchased 24 kt of crops worth UAH 55m (USD5m) on the spot market. In September-December 2014, the company prepaid 780 kt of crops from the 2015 harvest ( +155 %) for a total of UAH 1.3bn (USD96m). Last year, the Agrar-ian Fund processed 440 kt of grains into flour ( +57 %) and delivered 314 kt of flour to bakeries ( +45 %) at fixed prices in order to limit price inflation.
Financial ResultsThe Agrarian Fund reported 9M14 sales of UAH 2.3bn (the company began operations in 4Q13, thus no y-o-y comparison can be made). EBITDA and net income totaled UAH 362m and UAH 466m, respectively, inflated by UAH 207m of other financial income, yielding EBITDA and net margins of 16 % and 20 %. Part of the company’s statutory capital, or UAH 2.7bn out of UAH 5.0bn (initially contributed in the form of government bonds) was depos-ited in the Fund’s bank accounts as of the end of 9M14. The Agrarian Fund lost over UAH 2bn last year due to the bankruptcy of Brokbusinessbank (this amount was reported as other financial investments). The company has no debt on its balance sheet. The Agrarian Fund’s management estimated 2014 net sales at UAH 2.8bn and net income at UAH 0.5bn (part of it would be allocated for a dividend payout).
Reform Targets
� Relevant legislation needs to be amended to remove the overlap with the state-financed Agrarian Fund and transfer all its functions to the PJSC Agrarian Fund.
� Based on current regulations, the Agrarian Fund can buy or sell agricultural produce only on an organized market (i.e. state-owned Agrarian Exchange). This platform remains very illiquid, leading to non-market price quotes and inefficient spot pur-chases. A more reliable price benchmarking system needs to be developed, possibly utilizing OTC prices provided by industry consultancies or CBOT quotes.
� Forward crop purchases constitute one of the Agrarian Fund’s core activities, mean-ing the company is exposed to weather risk, namely the risk of harvest losses and farmers’ failure to supply contracted crops. This necessitates proper insurance of the harvest being purchased and selection of reputable insurance companies ca-pable of handling the risk.
� Hryvnia devaluation poses a major obstacle in signing new forward contracts be-tween the Agrarian Fund and local farmers. To mitigate F/X risk, fixing crop prices in USD or developing F/X hedging mechanisms should be considered.
� Transparency of operations and oversight from a professional supervisory board need to be ensured in order to improve the company’s corporate governance profile and prevent new cases of fraud similar to those currently being investigated.
Þ www.agrofond.gov.ua
P&L (UAH m) 2013 9M14
Net Sales 3 2,283
Cost of Goods Sold 3 1,932
Gross Profit /(Loss) – 351
EBITDA (1) 362
Depreciation – –
Operating Profit/(Loss) (1) 362
Net Financial Income/(Loss) – 207
Profit/(Loss) Before Taxes 94 569
Corporate Income Tax 10 103
Net Income/(Loss) 84 466
Dividends Paid – 42
Balance Sheet (UAH m) 2013 9M14
Total Assets 5,370 7,897
Fixed Assets 2,210 2,210
PPEz – –
Current Assets 3,160 5,687
Accounts Receivable 1,754 1,077
Cash & Cash Equivalents 233 2,712
Total Liabilities & Equity 5,370 7,897
Total Liabilities 285 2,389
Accounts Payable 17 223
Debt – –
Equity 5,084 5,508
Ratios 2013 9M14
Sales Growth (%, y-o-y) na nm
EBITDA Margin (%) (46.1 %) 15.9 %
Net Margin (%) 3,068.6 % 20.4 %
Debt/Equity 0.0 % 0.0 %
Net Debt/EBITDA nm (5.6)
ROE (%) 3.3 % 11.6 %
ROA (%) 3.1 % 9.4 %
ROCE (%) (0.0 %) 8.8 %
Operating Summary 2013 2014
Forward Crop Purchases (kt) – 850
Growth (%, y-o-y) – nm
Spot Crop Purchases (kt) – 24
Growth (%, y-o-y) – nm
Grain Volume Processed (kt) 280 440
Growth (%, y-o-y) – 57 .1%
Company Snapshot 2013 9M14
Number of Employees 31 158
Average Monthly Salary (UAH)* 2,894 4,732
State Stake (%) 100 .0% 100.0 %
Note: *salary costs (excluding social payments)
divided by the average number of employees
CO M PA N Y P R O F I L E S › T H E A G R A R I A N F U N D

153CO M PA N Y P R O F I L E S › A N T O N O V
Antonov
General InformationAntonov is a leading airplane producer in Ukraine, established almost 70 years ago. It has developed over 100 airplane models, including the world’s largest transport aircraft, the An-124 (Ruslan) and the An-225 (Mriya). In 2009, Antonov was merged with Kyiv-based Aviation Plant Aviant, adding serial production capacities to its design bureau. Antonov’s current principal customers are Cuban, North Korean and Russian airlines. Its portfolio includes passenger planes (the An-38, An-74, An-140, and the An-148) and transport aircraft (the An-3, An-70, An-124-100 Ruslan, and the newly designed An-178).
Operating ResultsAntonov produced seven airplanes in 2013 (five An-158s for Cubana De Aviacion and two An-148s for Air Koryo) but only two airplanes in 2014 (out of five planned). The Ukrainian-Russian conflict took a toll on the company, and was compounded by liquidity shortages and problems with third-party suppliers (Antonov blamed the local producer Pivdenmash for delaying supplies of chassis), which even forced Antonov to sign a contract with a Rus-sian producer in 2H14. Five airplane kits were produced and delivered under an agree-ment with the Russian aircraft manufacturer VASO. Antonov also repaired 21 aircraft for the Ukrainian army last year. Currently, joint projects with Russia are mostly on hold. The company completed tests on its new transport aircraft, the An-178, this year, with total demand estimated at 200 planes until 2032.
Financial ResultsIn 9M14, sales increased 6 % y-o-y to UAH 2.4bn while EBITDA and net income shrank 24 % and 68 % to UAH 316m and UAH 30m, respectively. The top line was inflated by the hryvnia devaluation, as aircraft are normally priced in hard currency. Antonov has UAH 580m of outstanding local bonds maturing in May 2015 and paying 10.5-11.0 % p.a. Antonov issued the bonds in 2009 to refinance its bank debt and replenish its working capital. Its ongoing contracts with the Cuban and North Korean airlines are financed via the Russian leasing company Ilyushin Finance, which Antonov continues to rely on due to the lack of its own leasing capabilities. In 2014, Antonov lost over UAH 200m due to the bankruptcy of the lo-cal bank Brokbusinessbank (this amount remains included in accounts receivable).
Reform Targets
� An enhanced marketing strategy is needed to improve Antonov’s sales capabilities and promote Ukrainian-made aircraft worldwide, which should include exploring new opportunities for leasing and expanding its global service network. A steady flow of new orders would drive economies of scale and improve the financial posi-tion and liquidity (e.g. in 2013 Boeing produced up to 200 planes, Embraer – 80 planes, and Russian OAK – 111 planes). Antonov estimates its working capital re-quirements at USD100m, for which it needs to secure orders for at least 6-7 aircraft p.a. with a 50 % down payment.
� Investment is badly needed and could be provided by the state via a share capital increase or a preferential long-term loan. Alternatively, the state could consider selling a minority stake to a reputable foreign strategic investor to aid Antonov’s expansion in the highly competitive global markets.
� Additional support to Antonov could come from domestic orders, both civilian and, especially, defense, given Ukraine’s current security challenges.
� Production bottlenecks (both one-off and those caused by severed ties with Russia) could be tackled by setting up or expanding local production capacities (in-house or via investment in other state-owned companies such as Pivdenmash) or securing foreign (non-Russian) suppliers.
� Antonov should optimize costs through divesting non-core assets and reviewing the portfolio of aircraft in order to focus on promising models including the An-158 and, potentially, the An-178 and An-70.
� The company should optimize the management structure and address corporate governance risks that arose in 2014 (including criminal cases launched against for-mer managers).
Þ www.antonov.com
P&L (UAH m) 2013 9M14
Net Sales 3,269 2,408
Cost Of Goods Sold 2,840 2,077
Gross Profit/(Loss) 429 331
EBITDA 419 316
Depreciation 268 217
Operating Profit/(Loss) 151 99
Net Financial Income/(Loss) (65) (18)
Profit/(Loss) Before Taxes 89 102
Corporate Income Tax 50 72
Net Income/(Loss) 39 30
Dividends Paid na na
Balance Sheet (UAH m) 2013 9M14
Total Assets 6,381 6,031
Fixed Assets 2,658 2,491
PPE 1,602 1,485
Current Assets 3,723 3,540
Accounts Receivable 646 888
Cash & Cash Equivalents 577 389
Total Liabilities & Equity 6,381 6,031
Total Liabilities 2,504 2,150
Accounts Payable 1,010 1,380
Debt 997 959
Equity 3,877 3,881
Ratios 2013 9M14
Sales Growth (%, y-o-y) 1.5 % 5.5 %
EBITDA Margin (%) 12.8 % 13.1 %
Net Margin (%) 1.2 % 1.2 %
Debt/Equity (%) 25.7 % 7.2 %
Net Debt/EBITDA (x) 1.0x 1.4x
ROE (%) 1.0 % 1.0 %
ROA (%) 0.6 % 0.6 %
ROCE (%) 3.1 % 3.2 %
Operating Summary 2013 2014
Production of Airplanes (units) 7 2
Growth (%, y-o-y) na (71.4 %)
Services and Repairs (units) na na
Growth (%, y-o-y) na na
Company Snapshot 2013 9M14
Number of Employees 13,182 12,690
Average Monthly Salary (UAH)* 5,304 5,095
State Stake (%) 100 .0% 100.0 %
Note: *salary costs (excluding social payments)
divided by the average number of employees

154
Centrenergo
General InformationCentrenergo is Ukraine’s second-largest thermal generator by capacity (7,660 MW), operat-ing three power plants in the industrialized regions of Kyiv, Kharkiv and Donetsk. Centren-ergo has three 800 MW gas-fired units at its Vuhlehirska plant and two 300 MW gas-fired units at its Trypilska plant, implying a total gas-fired capacity of 3,000 MW. The remaining 17 power units with total capacity of 4,660 MW are coal-fired. However, only four of them (1,200 MW combined) operate on so called high volatile coal while the remaining units require anthracite, which became in short supply in Ukraine in 2014 as a result of the ongo-ing military conflict in the coal-rich eastern regions. The company’s generating capacities were built in the 1960’s-70’s. In 2014, it accounted for 7 % of the total electricity production in Ukraine (18 % of the total production by thermal power generation).
Operating ResultsCentrenergo cut electricity production by 9.5 % y-o-y to 12.5 TWh in 2014 as supplies of anthra-cite coal, on which most of the company’s power generating units rely, dwindled in the second half of the year after the military conflict in the Donetsk and Luhansk regions left many coal mines languishing on separatist-controlled territory. The company tried to make up for the shortage by importing coal from South Africa and Russia, yet imports of South African coal by sea proved limited in volume and more expensive while deliveries from Russia were unstable, reflecting broader Ukrainian-Russian tensions. Centrenergo’s average tariff increased 12.4 % y-o-y to UAH 662/MWh in hryvnia terms last year.
Financial ResultsCentrenergo reported 9M14 net sales of UAH 5.6bn (almost flat y-o-y) as higher tariffs compensated for lower electricity output. Yet as coal prices increased more rapidly than tariffs, EBITDA slumped by 46 % to UAH 372m and net income shrank to UAH 219m ( –58 % y-o-y), for EBITDA and net margins of 6.7 % ( –5.6ppt y-o-y) and 3.9 % ( –5.5pp), respectively. Debt/Equity and Net Debt/EBITDA were quite low at 14.8 x and –0.4 x, respectively. The near-term outlook for the company is weak.
Reform Targets
� Centrenergo’s current tariffs are far below the cost recovery level, threatening rapid financial deterioration. Unless the power sector regulator interferes promptly, the company may find itself even lacking funds to make current coal purchases.
� The company’s generating equipment, while still relatively durable, is outdated and requires extensive modernization, which the company is not capable of financing on its own.
� Centrenergo tops the government’s near-term privatization list. Attracting a private investor would help the company solve its most urgent funding needs (i.e. coal pur-chases for the 2015/16 heating season) and, going forward, upgrade its production assets, increase efficiency, and improve corporate governance.
Þ www.centrenergo.com
CO M PA N Y P R O F I L E S › C E N T R E N E R G O
P&L (UAH m) 2013 9M14
Net Sales 7,454 5,555
Cost of Goods Sold 6,674 5,192
Gross Profit /(Loss) 780 363
EBITDA 770 372
Depreciation 127 108
Operating Profit/(Loss) 643 264
Net Financial Income/(Loss) (32) (33)
Profit/(Loss) Before Taxes 564 223
Corporate Income Tax 77 4
Net Income/(Loss) 487 219
Dividends Paid 70 146
Balance Sheet (UAH m) 2013 9M14
Total Assets 5,027 5,025
Fixed Assets 2,940 3,218
PPE 2,026 2,117
Current Assets 2,086 1,807
Accounts Receivable 823 662
Cash & Cash Equivalents 27 597
Total Liabilities & Equity 5,027 5,025
Total Liabilities 2,523 2,449
Accounts Payable 1,505 1,619
Debt 564 382
Equity 2,503 2,576
Ratios 2013 9M14
Sales Growth (%, y-o-y) (17.8 %) (0.6 %)
EBITDA Margin (%) 10.3 % 6.7 %
Net Income Margin (%) 6.5 % 3.9 %
Debt/Equity (%) 22.5 % 14.8 %
Net Debt/EBITDA (x) 0.7 (0.4)
ROE (%) 21.2 % 11.3 %
ROA (%) 10.2 % 5.8 %
ROCE (%) 21.0 % 11.9 %
Operating Summary 2013 2014
Output (GWh) 12,585 11,356
Growth (y-o-y) (24.5 %) (9.8 %)
Tariff (UAH/MWh) 589 662
Growth (y-o-y) 8.7 % 12.4 %
Company Snapshot 2013 9M14
Number of Employees 8,226 8,061
Average Monthly Salary (UAH)* 6,065 6,775
State Stake (%) 78.3 % 78.3 %
Note: *salary costs (excluding social payments)
divided by the average number of employees

155CO M PA N Y P R O F I L E S › CO A L O F U K R A I N E
Coal of Ukraine
General InformationCoal of Ukraine is a 100 % state-owned company established in 2003 and operates as a trading intermediary between state-owned coal producers and their final customers — heat and power stations. It has a key role in regulating coal retail prices in the model of centralised coal purchases from state mines, and coal distribution to five Ukrainian en-ergy generating companies (i.e. Zapadenergo, Dneproenergo and Vostokenergo owned by DTEK; Donbassenergo owned by Energoinvest Holding B.V.; and Centrenergo owned by the State) at the average selling price. By regulating prices, it determines the level of state subsidies required by state-owned coal mines to cover their costs. State-owned coal mines have a high cost of production (due to low efficiency) and a low quality of coal produced, thus, are loss-making and heavily reliant on state subsidies.
Operating and Financial ResultsIn 2014, coal production by state-owned coal mines (c. 36 % of Ukraine’s total coal output in 2014) dropped by 27 % y-o-y to 18 Mt (with forecasted further decrease to 9 Mt in 2015) due to the armed conflict in the Luhansk and Donetsk regions.In 9M14, Coal of Ukraine’s sales increased by 61 % y-o-y to UAH 5.7bn while gross profit in-creased by 37 % y-o-y to UAH 0.5bn, leading to gross profit margin deterioration by 1.5ppt y-o-y to 8.4 %. In 9M14, the company aggravated its losses by 6.2 times (net loss margin further decreased by 3.1ppt) y-o-y to UAH 235m and its EBITDA decreased by 67 % (EBITDA margin fell by 5.6ppt) y-o-y to UAH 82m mainly due to lower other operating income. Other operating income decreased by UAH 384m y-o-y in 9M14, while other operating expenses decreased only by UAH 127m, respectively.Fixed assets decreased by 69 % to UAH 0.7bn, while current assets increased by 89 % to UAH 3.5bn as long-term receivables from energy generating companies in the amount of UAH 1.5bn were reclassified from fixed assets to other current receivables. As of 30 Sep-tember 2014, the total amount of short-term bank loans increased by 9.4 % to UAH 2.6bn (out of which about UAH 1.3bn was borrowed from state-owned banks PJSC Ukreximbank and PJSC Oshchadbank and about UAH 1.1bn was lent by commercial banks SB Sberbank JSC, PJSC Prominvestbank and PJSC Alfa-Bank). Deteriorating performance at the EBITDA level caused Net Debt/EBITDA ratio to increase to 23.5x as of 30 September 2014 (com-pared to 6.4x as of 31 December 2013).
Reform Targets
� The company’s current role in setting selling prices of state coal should be anal-ysed, including its role in ensuring economic and social stability at state owned coal mines, taking into account the political and social sensitivity of closing down loss-making mines.
� The control system over the quality of the coal produced should be enhanced. � State-owned mines require modernization in order to improve production
efficiency.
Þ www.dpvu.com.ua
P&L (UAH m) 2013 9M14
Net Sales 5,376 5,664
Cost of Goods Sold 4,859 5,187
Gross Profit /(Loss) 517 477
EBITDA 375 82
Depreciation 0.4 0.3
Operating Profit/(Loss) 375 81
Net Financial Income/(Loss) (384) (314)
Profit/(Loss) Before Taxes (9) (235)
Corporate Income Tax – –
Net Income/(Loss) (9) (235)
Balance Sheet (UAH m) 2013 9M14
Total Assets 4,103 4,217
Fixed Assets 2,246 701
PPE 0.4 0.4
Current Assets 1,856 3,516
Accounts Receivable 1,832 3,421
Cash & Cash Equivalents 5 68
Total Liabilities & Equity 4,103 4,217
Total Liabilities 3,974 4,322
Accounts Payable 1,082 990
Debt 2,405 2,630
Equity 129 (106)
Ratios 2013 9M14
Sales Growth (%, y-o-y) 2.7 % 61.1 %
EBITDA Margin (%) 7.0 % 1.4 %
Net Income Margin (%) (0.2 %) (4.1 %)
Debt/Equity (%) 1864.9 % (2491.0 %)
Net Debt/EBITDA (x) 6.4 23.5
ROE (%) (6.8 %) 1141.3 %
ROA (%) (0.2 %) (7.5 %)
ROCE (%) 14.8 % 4.3 %
Operating Summary 2013 2014
Coal Production (Mt) 24.2 17.6
Growth (%, y-o-y) (2.6 %) (27.3 %)
Company Snapshot 2013 9M14
Average Number of Employees 141 141
Average Monthly Salary (UAH)* 13,657 14,297
State Stake (%) 100.0 % 100.0 %
Note: *salary costs (excluding social payments)
divided by the average number of employees

156
Electrovazhmash
General InformationElectrovazhmash (EVM) was established almost 70 years ago. Part of a joint manufacturing unit with power turbine producer Turboatom during Soviet times, Electrovazhmash was subsequently spun off due to its core business being electric machinery. The company produces hauling equipment for mines and railways (c. 60-70 % of revenues) as well as turbo and hydro generators (though there are limitations on production of large-capacity generators) and direct-current electric machinery (up to 30 %). EVM’s equipment is used in over 40 countries globally. The company has recovered strongly since the 2008 crisis, with sales surging to UAH 2.2bn (2013) from a meager UAH 0.1bn (2008).
Operating ResultsExports accounted for over 50 % of EVM’s 2013 sales. Russia was the company’s largest cus-tomer historically (EVM’s market share in Russia used to be as high as 70 %), but exports to Russia fell in 2014 as Ukraine’s relationship with Russia broke down. This was compounded by the military conflict in eastern Ukraine, which forced the company to sever cooperation with the domestic locomotive producer Luhanskteplovoz in 2H14.For 2015, the company estimated its order book at UAH 1.5bn or higher (the hryvnia devalu-ation in early 2015 will facilitate meeting this target, inflating the hryvnia value of exported equipment). Power machinery companies usually have a long production cycle (up to 3 to5 years), which implies EVM should be able to maintain its presence in the Russian/Customs Union markets in the medium term. The company sees potential to expand in Central Asia, particularly Kazakhstan, as well as find deals in India, China and Latin America. The EU, in contrast, is not viewed as a major opportunity. Domestically, EVM plans to continue supplying power plants, in particular, the nuclear power plant operator Energoatom, in the framework of its import substitution program, and thermal power plants in the east damaged by military hostilities.
Financial ResultsEVM reported 2014 sales of UAH 1.9bn, down 16 % y-o-y. However, as the company has a significant share of export sales, the result in UAH terms is not fully representative. In USD terms, sales plunged 43 % y-o-y to USD156m last year due to lower deliveries to Russia and the military conflict in the east. Starting September 2014, the company reduced its working week from 5 to 4 days (though even the shorter week included three shifts per day). Provisional net income for 2014 was reported at UAH 22.4m, down from UAH 79m in 2013 ( –72 % y-o-y) and UAH 84m in 9M14, implying a net loss of UAH 61m in 4Q14. Based on 9M14 results, EVM’s ROCE lagged behind Turboatom’s (20 % vs. 38 %) but significantly outperformed other industry SOEs (the average for the machine building sector SOEs in this report is 6.2 %).As of the end of 9M14, the company had UAH 341m of debt (up UAH 101m YTD on revalu-ation of foreign currency denominated debt) and UAH 187m of cash (down UAH12m YTD). CAPEX totaled UAH 42m in 9M14 (vs. UAH 100m in 2013).
Reform Targets
� In view of the newly arisen risks of sustainable cooperation with customers in Rus-sia/the Customs Union, EVM needs to target further sales diversification globally, for which more focused marketing efforts may be required (the latter should be feasible for the company, considering it overhauled its marketing team in recent years). Also pertinent in this respect is the issue of diversifying away from Russian input supplies, including through greater production localization.
� The company should enter new niches such as diagnostics, services, supervision in installation and maintenance of equipment, etc.
� A long-term development program should be developed to ensure that EVM main-tains its competitive edge technologically on regional/global levels regardless of its relationship with Russia, potentially including harmonization of technical standards with those of the EU in the framework of the Ukraine-EU Deep and Comprehensive Free Trade Area.
Þ www.spetm.com.ua
CO M PA N Y P R O F I L E S › E L E C T R O VA Z H M A S H
P&L (UAH m) 2013 9M14
Net Sales 2,205 1,527
Cost of Goods Sold 1,827 1,232
Gross Profit /(Loss) 378 295
EBITDA 163 165
Depreciation 40 37
Operating Profit/(Loss) 123 127
Net Financial Income/(Loss) (23) (23)
Profit/(Loss) Before Taxes 100 104
Corporate Income Tax 21 21
Net Income/(Loss) 79 84
Dividends Paid na na
Balance Sheet (UAH m) 2013 9M14
Total Assets 1,517 1,355
Fixed Assets 319 362
PPE 265 271
Current Assets 1,198 993
Accounts Receivable 352 326
Cash & Cash Equivalents 198 187
Total Liabilities & Equity 1,517 1,355
Total Liabilities 1,089 857
Accounts Payable 799 490
Debt 240 341
Equity 428 498
Ratios 2013 9M14
Sales Growth (%, y-o-y) 51.9 % 1.5 %
EBITDA Margin (%) 7.4 % 10.8 %
Net Margin (%) 3.6 % 5.5 %
Debt/Equity (%) 56.1 % 68.4 %
Net Debt/EBITDA (x) 0.3 0.7
ROE (%) 19.7 % 23.4 %
ROA (%) 5.5 % 7.8 %
ROCE (%) 18.4 % 20.2 %
Company Snapshot 2013 9M14
Number of Employees 6,467 6,586
Average Monthly Salary (UAH)* 4,587 4,422
State Stake (%) 100.0 % 100.0 %
Note: *salary costs (excluding social payments)
divided by the average number of employees;
9M13 data provided for 2013

157CO M PA N Y P R O F I L E S › E N E R G O AT O M
Energoatom
General InformationEnergoatom is a fully state-owned company operating Ukraine’s four nuclear power plants with total installed capacity of 13.8 GW (25 % of Ukraine’s total electricity generating ca-pacity) and supplying almost half of domestic electricity production. 13 of Energoatom’s 15 nuclear power generating units are Russian-made VVER-1,000 and two are VVER-440. The company also operates the Tashlyk pumped storage hydroelectric power plant with installed capacity of 302 MW (with planned expansion to 900 MW). Energoatom supplies the cheapest electricity in Ukraine, yet its current tariffs do not factor in the cost of repro-cessing and disposing of its nuclear fuel waste and decommissioning of its nuclear reactors.
Operating ResultsEnergoatom increased 2014 electricity sales by 6 % y-o-y to 83 TWh as domestic thermal power plants, facing severe coal shortages caused by the military hostilities in eastern Ukraine, cut production. In January 2015, the company accounted for 54 % of domestic electricity output (vs. 46 % in January 2014). Its 2014 tariffs averaged UAH 278/MWh (up 26 % y-o-y). Energoatom has UAH 63bn worth of CAPEX programs in progress.
Financial ResultsSales increased 32 % y-o-y to UAH 16.5bn in 9M14 on higher output and tariffs. EBITDA surged 123 % to UAH 4.8bn as the cost base remained virtually unchanged while tariffs rose 30 %, yielding an EBITDA margin of 29 % ( +12ppt y-o-y). The company reported a net loss of UAH 3.8bn (vs. UAH 4.1bn loss in 9M13), stemming from a high depreciation charge of UAH 6.3bn, which the company had regularly booked since revaluing its assets in 2011. The Debt/Equity and Net Debt/EBITDA ratios, at 4.0 x and 1.0x in 9M14, remained comfort-ably low.
Reform Targets
� The current tariffs are not economically viable and need to be adjusted to factor in the full costs associated with the life cycle of nuclear fuel as well as include costs related to decommissioning or extending the service life of nuclear reactors.
� The company is dependent on Russia for supplies of nuclear fuel and equipment, meaning it is vulnerable to political risk. Energoatom has been working to increase supplies of Westinghouse fuel rods, but their share is still negligible.
� The Zaporizhya, Rivne and Khmelnytskiy power plants are constrained by power transmission bottlenecks, leaving them underutilized. Construction of new trans-mission lines could add some 1.8 GW of new capacity.
� Construction of a dry cask storage site for spent nuclear fuel at the Chernobyl nu-clear power plant would allow for the storage of fuel waste from three power plants.
� Similar to Ukrhydroenergo, Energoatom buys electricity from Energorynok to pow-er its pumped storage plant at UAH 408/MWh but sells the electricity the plant pro-duces at UAH 278/MWh, thus overpaying UAH 132m for its own electricity.
Þ www.energoatom.kiev.ua
P&L (UAH m) 2013 9M14
Net Sales 17,236 16,553
Cost of Goods Sold 21,120 16,284
Gross Profit/(Loss) (3,884) 269
EBITDA 4,256 4,830
Depreciation 8,453 6,299
Operating Profit/(Loss) (4,197) (1,469)
Net Financial Income/(Loss) (696) (597)
Profit/(Loss) Before Taxes (4,791) (3,806)
Corporate Income Tax (715) –
Net Income/(Loss) (4,076) (3,806)
Dividends Paid na na
Balance Sheet (UAH m) 2013 9M14
Total Assets 203,277 199,561
Fixed Assets 184,225 178,646
PPE 177,925 172,651
Current Assets 19,051 20,915
Accounts Receivable 7,300 8,980
Cash & Cash Equivalents 356 251
Total Liabilities & Equity 203,277 199,561
Total Liabilities 36,686 37,156
Accounts Payable 3,160 3,308
Debt 6,373 6,450
Equity 166,591 162,405
Ratios 2013 9M14
Sales Growth (%, y-o-y) (6.2 %) 31.6 %
EBITDA Margin (%) 24.7 % 29.2 %
Net Margin (%) (23.6 %) (23.0 %)
Debt/Equity (%) 3.8 % 4.0 %
Net Debt/EBITDA (x) 1.4 1.0
ROE (%) (2.4 %) (3.1 %)
ROA (%) (2.0 %) (2.5 %)
ROCE (%) (2.4 %) (1.2 %)
Operating Summary 2013 9M14
Electricity Output (GWh) 78,242 83,220
Growth (% y-o-y) (7.9 %) 6.4 %
Tariff (UAH/MWh) 219 278
Growth (% y-o-y) 1.8 % 25.7 %
Company Snapshot 2013 9M14
Number of Employees 34,821 34,613
Average Monthly Salary (UAH)* 8,803 9,116
State Stake (%) 100.0 % 100.0 %
Note: *salary costs (excluding social payments)
divided by the average number of employees

158
General InformationThe Illichivsk Commercial Sea Port is one of the largest ports in Ukraine. It is located on the north-western shore of the Black Sea at the Sukhy estuary, 19 km to the south-west from Odesa. The berthing line totals about 6 km. The length of the port’s approach channel is 1.4 km, width — 160 meters and depth — 17 meters. The port is capable to accommodate vessels with the draft of up to 13 meters and having a length of up to 275 meters (in some cases up to 300 meters). Open storage yards cover 575,000 square meters, sheltered ware-houses — 27,000 square meters. The port has facilities enabling it to handle more than 32 Mt of cargo a year. The port specializes in handling of ore, sulfur, grain, containers, and storage and handling of liquid vegetable oil. The port’s grain terminal storage capacity is 4 Mt, its ore bulk cargo storage capacity is 3 Mt, and its sulfur bulk cargo — 2 Mt. The port also has a fuel terminal for transshipment and storage of petroleum products (diesel fuel, petrol, heating oil, and crude oil) and a complex for handling liquefied gases.
Operating ResultsGiven that the Sevastopol, Yevpatoria, and Kerch ports in Crimea are no longer part of Ukraine’s transport system, a part of their cargo flows was redirected to the Illichivsk Com-mercial Sea Port. As a result, the port eventually obtained a monopolist position in handling cargos which arrive on Ro-Ro vessels not only in the region, but on the country level as well (the Ro-Ro cargo handling complex of the port of Illichivsk is one of the largest in the Black Sea region). In 2013 and 2014 the Illichivsk port handled 10.1 Mt and 10.5 Mt of cargo respectively. Transhipment of grains and vegetable oil accounted for about 25 % of the port’s total cargo turnover in 2013 and 2014. The share of cargo turnover attributable to handling of contain-ers and ferry/vehicles constituted c. 20 % in both periods; ore and sulfur — 42 % in 2013 and 33 % in 2014.
Financial ResultsIn 9M14, the port generated UAH 503m in revenues and reported net income of UAH 50m (compared to 2013’s reported loss of UAH 76m). The EBITDA margin increased from 13.3 % in 2013 to 28.0 % in 9M14. Net income margin improved from a negative 11.5 % in 2013 to a positive 9.9 % in 9M14. Given the fact that cargo turnover did not change significantly in 2014 vs. 2013, the improvement in financial performance was mainly due to the apprecia-tion of USD against UAH. About 80 % of the company’s sales are USD denominated (e.g. transhipment fees) whereas major costs are incurred in hryvnia (e.g. payroll costs account-ing for 40 % to 48 % of cost of goods sold and 61 % to 69 % of administrative expenses). Optimisation of operating expenses also contributed to improvement of the company’s performance at the bottom line level. The company optimized the headcount of its com-mercial department which allowed saving UAH 3.3m in selling expenses in 2014. In 9M14 the Illichivsk port recognized UAH 11m of income (vs. 3.9m in 2013) being attributable to assets received free of charge (tug boats). With improved financial results, the company managed to repay USD 2.9m of debt during 9M14.
Reform Targets
� Attract additional cargo flows and expand the range of cargoes handled. � Optimise staff headcount to increase operating efficiency and bring costs down to
an economically justified level. � Attract private investors for concession projects. � Use dredging to increase port capacity to serve large (e.g. Capesize) vessels. The
main reason is that cargo owners are trying to optimize their costs and prefer large-capacity vessels for cargo transportation.
� Invest in new facilities and equipment, utilize energy-efficient technologies. � Improve marketing and customer service.
Þ www.ilport.com.uaIllichivsk Sea Commercial Port
CO M PA N Y P R O F I L E S › I L L I C H I V S K S E A CO M M E R C I A L P O R T
P&L (UAH m) 2013 9M14
Net Sales 659 503
Cost of Goods Sold 728 466
Gross Profit /(Loss) (69) 38
EBITDA 88 141
Depreciation 147 88
Operating Profit/(Loss) (60) 53
Net Financial Income/(Loss) (0.2) (0.3)
Profit/(Loss) Before Taxes (68) 50
Corporate Income Tax 8 –
Net Income/(Loss) (76) 50
Balance Sheet (UAH m) 2013 9M14
Total Assets 1,879 1,909
Fixed Assets 1,549 1,450
PPE 1,487 1,405
Current Assets 330 459
Accounts Receivable 216 214
Cash & Cash Equivalents 44 144
Total Liabilities & Equity 1,879 1,909
Total Liabilities 171 179
Accounts Payable 78 102
Debt 71 55
Equity 1,709 1,730
Ratios 2013 9M14
Sales Growth (%, y-o-y) (24.6 %) (2.8 %)
EBITDA Margin (%) 13.3 % 28.0 %
Net Income Margin (%) (11.5 %) 9.9 %
Debt/Equity (%) 4.2 % 3.2 %
Net Debt/EBITDA (x) 0.3 (0.5)
ROE (%) (4.4 %) 3.8 %
ROA (%) (3.9 %) 3.5 %
ROCE (%) (3.4 %) 4.0 %
Operating Summary 2013 2014
Cargo Turnover (Mt) 10.1 10.5
Grains and Vegetable Oil 2.4 2.7
Ores (nickel and iron) 2.8 2.4
Sulfur 1.5 1.1
Other (containers, coal, etc.) 3.4 4.3
Company Snapshot 2013 9M14
Number of Employees 5,195 4,126
Average Monthly Salary (UAH)* 4,709 5,089
State Stake (%) 100.0 % 100.0 %
Note: *salary costs (excluding social payments)
divided by the average number of employees

159CO M PA N Y P R O F I L E S › K H A R K I V S TAT E AV I AT I O N E N T E R P R I S E
General InformationThe Kharkiv State Aviation Enterprise (KSAE) is part of the Antonov’s aviation concern and one of the oldest aircraft manufacturers in Ukraine with an almost 90-year production track record. KSAE manages four subsidiaries located in the city of Kharkiv and nearby towns, which are capable of setting up full-cycle aircraft production and maintenance. Most recently the company was involved in the manufacture of the regional passenger plane, the An-140-100, and the multipurpose aircraft, the An-74, as well as production of components and spare parts for the An-140, An-148 and L-410 planes.
Operating ResultsKSAE has manufactured only seven aircraft since 2009, including three in 2009, one each in 2010 –2013, and none in 2014, falling far short of its targeted production capacity of 24 planes p.a. amid mounting liquidity shortages that in turn reflected the lack of government support. With Antonov recently announcing completion of its tests on its new An-178 cargo aircraft (with potential demand estimated at up to 200 units by 2032), the production out-look for KSAE may improve somewhat.
Financial ResultsIn 9M14, total revenue increased by 7.7% y-o-y to UAH 309m while cost of goods sold declined by 8.3% in UAH terms. As a result, gross profit grew to UAH 55m from UAH 10m in 9M13. Growth of gross profit was more than offset by the sharp increase in expenses, especially in selling and other expenses, which increased by 126% to UAH 49m from UAH 22 in 9M13 and by 719% to UAH 49m from UAH 6m, respectively. Net operating expenses and administrative expenses also demonstrated growth of 69% and 38%, respectively. As a result, net losses widened to UAH 260m from UAH 206m in 9M13. The overall debt level remained high but relatively stable at UAH 1.9bn as at the end of 2013 and as at the end of 9M14. At the same time, total liabilities rose by 6.6% YTD (or UAH 183m) to UAH 3.0bn as other current liabilities increased by 23.6% YTD (or UAH 117m) to UAH 614m.
Reform Targets
� KSAE, as a key production facility of Antonov, clearly requires a new strategic de-velopment program.
� Debt restructuring should be another priority, as the company has UAH 1.2bn of government-guaranteed bonds maturing in 2015 along with outstanding tax ar-rears and accounts payables.
� The management structure needs to be streamlined and remuneration for execu-tives tied to performance.
� Capital investments are needed to improve efficiency, increase capacity utilization and enhance quality standards.
Þ www.ksamc.comKharkiv State Aviation Enterprise
P&L (UAH m) 2013 9M14
Net Sales 311 309
Cost of Goods Sold 309 254
Gross Profit /(Loss) 3 55
EBITDA (111) (56)
Depreciation 40 30
Operating Profit/(Loss) (152) (87)
Net Financial Income/(Loss) (176) (134)
Profit/(Loss) Before Taxes (330) (260)
Corporate Income Tax – –
Net Income/(Loss) (330) (260)
Dividends Paid na na
Balance Sheet (UAH m) 2013 9M14
Total Assets 2,336 2,255
Fixed Assets 1,092 1,062
PPE 254 230
Current Assets 1,244 1,193
Accounts Receivable 187 171
Cash & Cash Equivalents 11 5
Total Liabilities & Equity 2,336 2,255
Total Liabilities 2,783 2,966
Accounts Payable 408 448
Debt 1,859 1,884
Equity (447) (710)
Ratios 2013 9M14
Sales Growth (%, y-o-y) (12.9 %) 7.7 %
EBITDA Margin (%) (35.8 %) (18.2 %)
Net Income Margin (%) (106.0 %) (84.0 %)
Debt/Equity (%) nm nm
Net Debt/EBITDA (x) nm nm
ROE (%) nm nm
ROA (%) (14.1 %) (15.1 %)
ROCE (%) (10.7 %) (9.9 %)
Operating Summary 2013 9M14
Airplane Production (units) 1 na
Growth (%, y-o-y) 0.0 % na
Company Snapshot 2013 9M14
Number of Employees 4,229 3,906
Average Monthly Salary (UAH)* 2,509 2,640
State Stake (%) 100.0 % 100.0 %
Note: *salary costs (excluding social payments)
divided by the average number of employees

160
Kharkivoblenergo
General InformationKharkivoblenergo, one of the largest power distributors in Ukraine, serves the highly in-dustrialized Kharkiv region (area: 31,400 km²; population: 2.8 million). It owns a 47,273 km grid with 8,162 MVA of transformer capacity. The oblenergo has a well-diversified customer base including 1.2 million households and 3,000 industrial customers (mostly machine-building plants). Those two groups account for 40 % and 23 % of oblenergo’s energy sales, followed by commercial consumers (18 %), and municipal users (3 %). The company’s larg-est consumers are water and heating utilities, the Kharkiv metro operator, and the power machinery plants Turboatom and Elektrovazhmash. The state holds a 65 % stake in the company.
Operating ResultsKharkivoblenergo reported 9M14 electricity sales to its own customers of 4 TWh ( –1.3 % y-o-y), accounting for 5.5 % of total electricity supplies by regional power distributors in Ukraine. Grid losses decreased by 0.9ppt y-o-y to 11.5 %, or 2.3ppt below the permitted minimum set for the oblenergo by the sector regulator. Kharkivoblenergo has close to UAH 63m of restructured arrears to the state wholesale electricity market operator Energorynok, while its customers owed it UAH 530m in unpaid electricity bills as of the end of9M14 (the company’s collection rate was close to 98 % in 9M14). Its largest debtors are public companies such as the Kharkiv water utility.
Financial ResultsKharkivoblenergo increased 9M14 net sales by 5 % y-o-y to UAH 2.7bn, benefiting from higher electricity tariffs for end customers. EBITDA surged by 21 % y-o-y to UAH 264m and the bottom line recovered to UAH 97m from a net loss of UAH 71m in 9M13, yielding EBITDA and net margins of 9.6 % ( +1.3ppt y-o-y) and 3.5 % ( +6.3ppt). ROE thus increased 16ppt y-o-y to 5.9 %. The company has virtually no bank debt.
Reform Targets
� In terms of tariff setting, a gradual shift should be implemented from the currently employed «cost plus» method to performance-based tariffs dependent on the qual-ity of electricity supply and invested capital.
� Transmission tariffs for the company also need to include a fair investment compo-nent in order to finance, in addition to current operations, modernization of outdat-ed substations, transformers and transmission lines (their wear rate averages 60 %).
� The company should unbundle its electricity transmission and supply business seg-ments in order to prevent a conflict of interest between the distribution company and its independent suppliers.
� Further investment into cutting grid losses should be made in order to bring them closer to the EU average of 7 %.
Þ www.oblenergo.kharkov.ua
CO M PA N Y P R O F I L E S › K H A R K I V O B L E N E R G O
P&L (UAH m) 2013 9M14
Net Sales 3,656 2,747
Cost of Goods Sold 3,528 2,639
Gross Profit /(Loss) 128 108
EBITDA 294 264
Depreciation 185 171
Operating Profit/(Loss) 109 93
Net Financial Income/(Loss) (87) (1)
Profit/(Loss) Before Taxes 32 97
Corporate Income Tax 3 –
Net Income/(Loss) 29 97
Dividends Paid 8.6 na
Balance Sheet (UAH m) 2013 9M14
Total Assets 2,376 2,749
Fixed Assets 1,924 2,061
PPE 1,852 1,996
Current Assets 452 688
Accounts Receivable 306 530
Cash & Cash Equivalents 70 94
Total Liabilities & Equity 2,376 2,749
Total Liabilities 369 387
Accounts Payable 325 346
Debt 3 3
Equity 2,007 2,362
Ratios 2013 9M14
Sales Growth (%, y-o-y) 7.6 % 5.0 %
EBITDA Margin (%) 8.1 % 9.6 %
Net Income Margin (%) 0.8 % 3.5 %
Debt/Equity (%) 0.1 % 0.1 %
Net Debt/EBITDA (x) (0.2) (0.3)
ROE (%) 1.4 % 5.9 %
ROA (%) 1.2 % 5.1 %
ROCE (%) 5.4 % 5.2 %
Operating Summary 2013 9M14
Electricity Sales (GWh) 5,670 4,050
Growth (y-o-y) 1.6 % (1.3 %)
Grid Losses (%) 13.0 % 11.5 %
Change (y-o-y) (0.80ppt) (0.89ppt)
Company Snapshot 2013 9M14
Number of Employees 7,475 7,208
Average Monthly Salary (UAH)* 4,031 4,188
State Stake (%) 65.0 % 65.0 %
Note: *salary costs (excluding social payments)
divided by the average number of employees

161CO M PA N Y P R O F I L E S › K H M E L N Y T S K O B L E N E R G O
Khmelnytskoblenergo
General InformationKhmelnytskoblenergo is a mid-sized electricity distributor in the Khmelnytskiy region (area: 21,000 km²; population: 1.4 million). It owns a 35,123 km low-voltage transmission grid with 3,127 MVA of transformer capacity. The oblenergo has a diversified customer base includ-ing 550,000 residential consumers and 19,500 commercial and industrial customers, mostly farming enterprises. Households account for 42 % of Khmelnytskoblenergo’s electricity sales, followed by industrial (14 %) and commercial (11 %) customers. Independent electric-ity suppliers account for 18 % of total electricity sales in Khmelnytskoblenergo’s service area, the largest of them being a subsidiary of the state rail monopoly Ukrzaliznytsia. The state holds a 70 % stake in the company.
Operating ResultsKhmelnytskoblenergo’s electricity sales only changed slightly y-o-y at 1.3 TWh in 9M14, as it was less affected by the domestic economic downturn due to its relatively low share of large industrial customers in its region. Grid losses declined 1.2ppt y-o-y to 14.5 %, or 2.5ppt below the permitted minimum set for the oblenergo by the sector regulator (and factored into its tariff). The company owes UAH 18m in unpaid bills to the state wholesale electricity market operator Energorynok, or a mere 2 % of its annual electricity purchases.
Financial ResultsKhmelnytskoblenergo increased 9M14 net sales by 7 % y-o-y to UAH 763m, benefiting from higher retail customer tariffs. However, EBITDA fell 13 % y-o-y to UAH 85m and net income was cut in half y-o-y to UAH 24m, implying EBITDA and net margins of 11.2 % ( –2.6ppt y-o-y) and 3.2 % ( –4.2ppt), respectively. ROE and ROCE stood at 4.5 % and 5.5 %, respectively, in 9M14, outperforming the respective sector averages.
Reform Targets
� In terms of tariff setting, a gradual shift should be implemented from the currently employed «cost plus» method to performance-based tariffs dependent on the qual-ity of electricity supply and invested capital.
� Transmission tariffs for the company also need to include a fair investment compo-nent in order to finance, in addition to current operations, modernization of outdat-ed substations, transformers and transmission lines (their wear rate averages 60 %).
� The company should unbundle its electricity transmission and supply business seg-ments in order to prevent a conflict of interest between the distribution company and its independent suppliers.
� Further investment into cutting grid losses should be made in order to bring them closer to the EU average of 7 %.
� The company should facilitate the connection to the electricity network for new customers.
Þ www.hoe.com.ua
P&L (UAH m) 2013 9M14
Net Sales 1,001 763
Cost of Goods Sold 891 709
Gross Profit /(Loss) 110 53
EBITDA 129 85
Depreciation 48 56
Operating Profit/(Loss) 81 30
Net Financial Income/(Loss) (5) (2)
Profit/(Loss) Before Taxes 59 30
Corporate Income Tax 10 6
Net Income/(Loss) 49 24
Dividends Paid 9.2 na
Balance Sheet (UAH m) 2013 9M14
Total Assets 899 880
Fixed Assets 796 776
PPE 795 775
Current Assets 102 103
Accounts Receivable 56 56
Cash & Cash Equivalents 19 25
Total Liabilities & Equity 899 880
Total Liabilities 191 158
Accounts Payable 111 88
Debt 9 2
Equity 709 722
Ratios 2013 9M14
Sales Growth (%, y-o-y) 7.3 % 6.7 %
EBITDA Margin (%) 12.9 % 11.2 %
Net Margin (%) 4.9 % 3.2 %
Debt/Equity (%) 1.3 % 0.3 %
Net Debt/EBITDA (x) (0.1) (0.2)
ROE (%) 8.7 % 4.5 %
ROA (%) 6.8 % 3.6 %
ROCE (%) 11.2 % 5.5 %
Operating Summary 2013 9M14
Electricity Sales (GWh) 1,749 1,252
Growth (y-o-y) 2.0 % (0.4 %)
Grid Losses (%) 15.9 % 14.5 %
Change (y-o-y) (0.58ppt) (1.19ppt)
Company Snapshot 2013 9M14
Number of Employees 3,517 3,555
Average Monthly Salary (UAH)* 3,950 4,110
State Stake (%) 70.0 % 70.0 %
Note: *salary costs (excluding social payments)
divided by the average number of employees

162
Kyiv Boryspil
General InformationKyiv Boryspil is Ukraine’s key airport, servicing 51 % of all flights in Ukraine in 2014. The airport is equipped with two runways, which fully comply with international standards and can accept all types of aircraft. There are five terminals (incl. three passenger terminals), but only one (Terminal D) is currently in use, with average capacity utilization of 27 %. The company has approx. 4.3 thousand employees, equivalent to 1.6 thousand passengers per employee (vs. 15.5 thousand passengers per employee at other international airports).Over the last six years, close to USD600m was invested into the airport’s development, incl. USD429m into Terminal D, USD96m into reconstruction of Terminals B and F and associ-ated infrastructure, USD33m into construction of a parking facility (not completed), and USD38m into other projects. Most projects did not deliver in terms of revenue growth as they were either not completed or not fully utilized upon completion.
Operating ResultsThe airport served 6.9 million people in 2014 (63 % of air passenger turnover in Ukraine), in-cluding 6.3 million international travelers (66 % of the total in Ukraine) and 0.6 million domes-tic passengers (41 % of the total in Ukraine). Boryspil’s total passenger turnover dropped by 13 % y-o-y in 2014 as a result of the ongoing military conflict in eastern Ukraine and Russia’s annexation of Crimea as well as broader economic turmoil and dwindling household dispos-able income.
Financial ResultsBoryspil increased 9M14 sales by 20 % y-o-y in UAH terms ( –13 % in USD terms), EBITDA profitability remained high (64.5 % vs. ~40 % on average among international peers), while high financial expenses and losses from debt revaluation resulted in a negative bottom line.Boryspil has the lowest non-aviation revenue among its international peers (USD4/passen-ger vs. USD12/passenger on average among peers). At the same time, this type of revenue is the key driver of international airports’ income (50-70 % of EBITDA).Due to quick debt accumulation, the main source of funding for its investment program over the last six years, Boryspil’s Debt/EBITDA increased from 1.5x in 2009 to 3.9x in 2014, and scheduled debt repayments in 2015 –2018 could pose a significant liquidity threat. Moreover, the most recent financial statements do not reflect F/X losses on a JPY loan stemming from hryvnia devaluation. The end of 2014 financial ratios are therefore ex-pected to deteriorate further.
Reform Targets
� Kyiv Boryspil has the potential to develop into an important transport hub in Eastern Europe by capitalizing on its favorable location. This can be achieved via more ef-ficient management of the airport itself as well as expansion of air travel in Ukraine.
� Key issues to address in the short run include: a rigorous procedure for appointing a new CEO (via the nomination committee); improving management of the airport in order to increase passenger flow and non-aviation and aviation revenue per pas-senger; more efficient leasing of the commercial area, plus additional proceeds from advertising, parking and other ancillary services; as well as personnel optimization.
� In the long run, signing the European Common Aviation Area Agreement between Ukraine and the EU should become a top priority. Attracting low-cost carriers will also help to increase the number of flights and tackle the airport’s low utilization.
Þ www.kbp.aero
CO M PA N Y P R O F I L E S › K Y I V B O R Y S P I L
P&L (UAH m) 2013 9M14
Net Sales 1,385 1,212
Cost of Goods Sold 909 680
Gross Profit /(Loss) 476 532
EBITDA 758 782
Depreciation 315 273
Operating Profit/(Loss) 443 510
Net Financial Income/(Loss) (295) (579)*
Profit/(Loss) Before Taxes 173 (44)
Corporate Income Tax 46 –
Net Income/(Loss) 127 (44)
Note: *incl. UAH 357m loss on USD denominated
debt revaluation
Balance Sheet (UAH m) 2013 9M14
Total Assets 9,606 9,429
Fixed Assets 8,128 8,015
PPE 5,855 5,635
Current Assets 1,478 1,414
Accounts Receivable 587 709
Cash & Cash Equivalents 826 632
Total Liabilities & Equity 9,606 9,429
Total Liabilities 4,233 4,117
Accounts Payable 500 403
Debt 2,904 3,216
Equity 5,373 5,312
Ratios 2013 9M14
Sales Growth (%, y-o-y) (8.3 %) 19.7 %*
EBITDA Margin (%) 54.7 % 64.5 %
Net Income Margin (%) 9.1 % (3.7 %)
Debt/Equity 59.0 % 60.5 %
Net Debt/EBITDA 2.7 2.5
ROE (%) 2.4 % (1.1 %)
ROA (%) 1.3 % (0.6 %)
ROCE (%) 5.2 % 8.0 %
Note: *vs. 9M13
Operating Summary 2013 2014
International Flights 70,175 64,128
Domestic Flights 10,695 7,849
Passenger Turnover (‘000) 7,916 6,888
incl. international 7,174 6,341
Freight Turnover (kt) 33.0 30.2
incl. international 32.7 30.0
Company Snapshot 2013 9M14
Number of Employees 4,882 4,422
Average Monthly Salary (UAH)* 5,369 5,846
State Stake (%) 100.0 % 100.0 %
Note: *salary costs (excluding social payments)
divided by the average number of employees

163CO M PA N Y P R O F I L E S › LV I V D A N Y LO H A LY T S K Y I I N T E R N AT I O N A L A I R P O R T
Lviv Danylo Halytskyi International Airport
General InformationThe Lviv Danylo Halytskyi International Airport is the largest airport in western Ukraine, serving 7,700 flights in 2014 ( –19 % y-o-y), including 5,638 international flights. The airport currently provides services to 18 airlines operating flights to 32 destinations (30 interna-tional and 2 domestic). In 2014, the airport was the only airport in Ukraine to attract new airlines to operate flights to and from Lviv.As part of Ukraine’s preparations for the Euro 2012 football tournament, a new terminal was built at the Lviv International Airport, with investments totaling UAH 2.4bn.
Operating ResultsThe Lviv International Airport served 585,000 people in 2014 (5 % of air passenger turnover in Ukraine), including 480,000 international travelers (5 % of total in Ukraine) and 105,000 domestic passengers (8 % of total). The airport’s total passenger turnover dropped 16 % y-o-y in 2014 due to fewer people travelling both domestically and within the CIS (e.g. the number of regular flights from Lviv to Moscow decreased from 7 to 3 per week). In April 2015, the airport became the first Ukrainian airport to join the European Common Aviation Area, which should enhance the airport’s ability to attract more airlines, including low-cost airlines, thereby increasing the number of flights and passenger traffic.
Financial ResultsThe Lviv International Airport increased 9M14 sales by 9 % y-o-y in UAH terms (but –21 % in USD terms). Revenue per passenger remained well below the average for its international peers (USD16 vs. USD27 per passenger). The share of non-aviation revenue also remained low compared to its international peers (35 % vs. 50 % on average). The company has low leverage as the bulk of construction works on the new terminal were funded by a govern-ment SPV, SE Financing of Infrastructure Projects.
Reform Targets
� The Lviv International Airport is the only major regional airport in Ukraine owned by the state, implying the potential to cooperate with private investors in the future.
� The airport should seek to attract a base carrier to operate flights to 10 to 15 new destinations from Lviv in order to provide logistical support for foreign tourists trav-elling to western Ukraine and cater to the needs of migrant workers.
� In order to unlock the growth potential of the Lviv International Airport, a number of issues should be addressed: a new CEO should be appointed (using the nomi-nation committee procedure) to work on improving the company’s operating and financial performance; the share on non-aviation revenue needs to be increased via ensuring more efficient use of the airports commercial area and securing additional proceeds from ancillary services.
Þ www.lwo.aero
P&L (UAH m) 2013 9M14
Net Sales 105 90
Cost of Goods Sold 80 135
Gross Profit /(Loss) 25 (45)
EBITDA 22 29
Depreciation 7 80
Operating Profit/(Loss) 16 (51)
Net Financial Income/(Loss) (0) –
Profit/(Loss) Before Taxes 20 27
Corporate Income Tax 4 –
Net Income/(Loss) 16 27
Balance Sheet (UAH m) 2013 9M14
Total Assets 2,209 2,154
Fixed Assets 2,177 2,101
PPE 2,064 2,005
Current Assets 32 53
Accounts Receivable 22 25
Cash & Cash Equivalents 5 22
Total Liabilities & Equity 2,209 2,154
Total Liabilities 8 13
Accounts Payable 4 10
Debt – –
Equity 2,201 2,142
Ratios 2013 9M14
Sales Growth (%, y-o-y) 13.4 % 9.0 %
EBITDA Margin (%) 21.4 % 32.0 %
Net Income Margin (%) 15.2 % 30.0 %
Debt/Equity 0.0 % 0.0 %
Net Debt/EBITDA (0.2) (0.6)
ROE (%) 1.4 % 1.7 %
ROA (%) 1.4 % 1.7 %
ROCE (%) 0.7 % (3.2 %)
Operating Summary 2013 2014
International Flights 6,788 5,638
Domestic Flights 2,763 2,070
Passenger Turnover (‘000) 701 585
incl. international 577 480
Freight Turnover (kt) 0.4 0.2
incl. international 0.3 0.2
Company Snapshot 2013 9M14
Number of Employees 820 815
Average Monthly Salary (UAH)* 3,696 4,092
State Stake (%) 100.0 % 100.0 %
Note: *salary costs (excluding social payments)
divided by the average number of employees
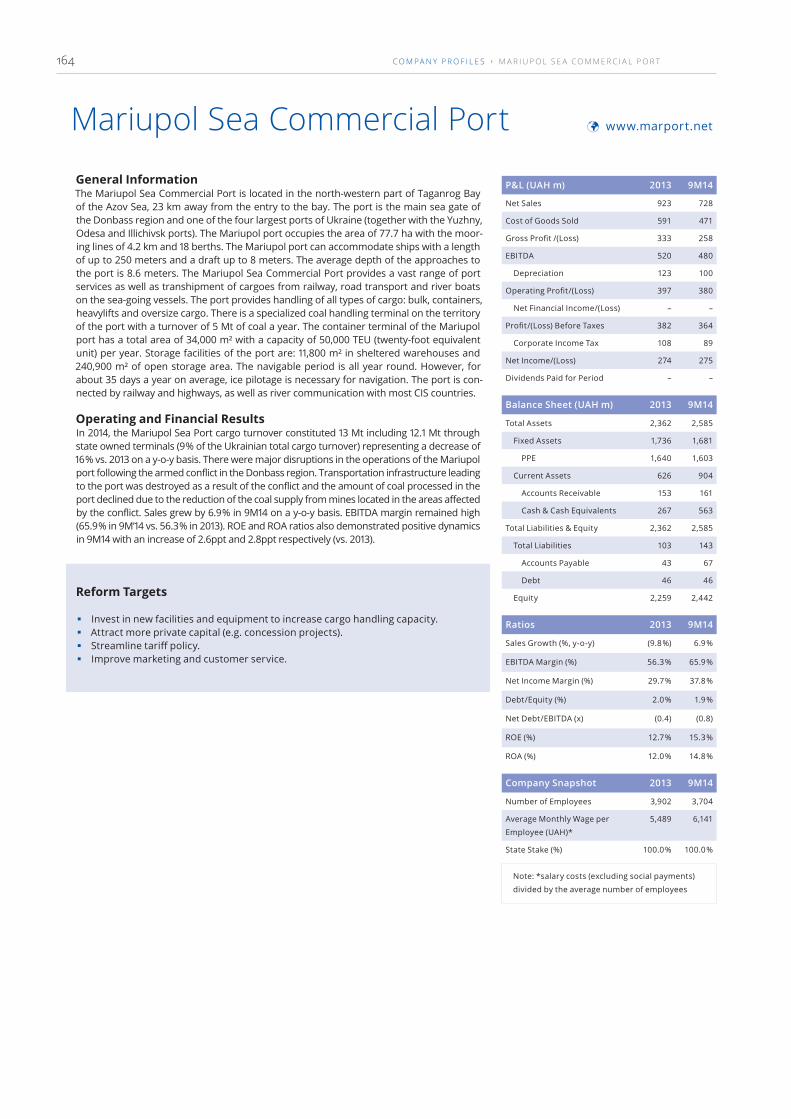
164
General InformationThe Mariupol Sea Commercial Port is located in the north-western part of Taganrog Bay of the Azov Sea, 23 km away from the entry to the bay. The port is the main sea gate of the Donbass region and one of the four largest ports of Ukraine (together with the Yuzhny, Odesa and Illichivsk ports). The Mariupol port occupies the area of 77.7 ha with the moor-ing lines of 4.2 km and 18 berths. The Mariupol port can accommodate ships with a length of up to 250 meters and a draft up to 8 meters. The average depth of the approaches to the port is 8.6 meters. The Mariupol Sea Commercial Port provides a vast range of port services as well as transhipment of cargoes from railway, road transport and river boats on the sea-going vessels. The port provides handling of all types of cargo: bulk, containers, heavylifts and oversize cargo. There is a specialized coal handling terminal on the territory of the port with a turnover of 5 Mt of coal a year. The container terminal of the Mariupol port has a total area of 34,000 m² with a capacity of 50,000 TEU (twenty-foot equivalent unit) per year. Storage facilities of the port are: 11,800 m² in sheltered warehouses and 240,900 m² of open storage area. The navigable period is all year round. However, for about 35 days a year on average, ice pilotage is necessary for navigation. The port is con-nected by railway and highways, as well as river communication with most CIS countries.
Operating and Financial ResultsIn 2014, the Mariupol Sea Port cargo turnover constituted 13 Mt including 12.1 Mt through state owned terminals (9 % of the Ukrainian total cargo turnover) representing a decrease of 16 % vs. 2013 on a y-o-y basis. There were major disruptions in the operations of the Mariupol port following the armed conflict in the Donbass region. Transportation infrastructure leading to the port was destroyed as a result of the conflict and the amount of coal processed in the port declined due to the reduction of the coal supply from mines located in the areas affected by the conflict. Sales grew by 6.9 % in 9M14 on a y-o-y basis. EBITDA margin remained high (65.9 % in 9M’14 vs. 56.3 % in 2013). ROE and ROA ratios also demonstrated positive dynamics in 9M14 with an increase of 2.6ppt and 2.8ppt respectively (vs. 2013).
Reform Targets
� Invest in new facilities and equipment to increase cargo handling capacity. � Attract more private capital (e.g. concession projects). � Streamline tariff policy. � Improve marketing and customer service.
Þ www.marport.net
CO M PA N Y P R O F I L E S › M A R I U P O L S E A CO M M E R C I A L P O R T
Mariupol Sea Commercial Port
P&L (UAH m) 2013 9M14
Net Sales 923 728
Cost of Goods Sold 591 471
Gross Profit /(Loss) 333 258
EBITDA 520 480
Depreciation 123 100
Operating Profit/(Loss) 397 380
Net Financial Income/(Loss) – –
Profit/(Loss) Before Taxes 382 364
Corporate Income Tax 108 89
Net Income/(Loss) 274 275
Dividends Paid for Period – –
Balance Sheet (UAH m) 2013 9M14
Total Assets 2,362 2,585
Fixed Assets 1,736 1,681
PPE 1,640 1,603
Current Assets 626 904
Accounts Receivable 153 161
Cash & Cash Equivalents 267 563
Total Liabilities & Equity 2,362 2,585
Total Liabilities 103 143
Accounts Payable 43 67
Debt 46 46
Equity 2,259 2,442
Ratios 2013 9M14
Sales Growth (%, y-o-y) (9.8 %) 6.9 %
EBITDA Margin (%) 56.3 % 65.9 %
Net Income Margin (%) 29.7 % 37.8 %
Debt/Equity (%) 2.0 % 1.9 %
Net Debt/EBITDA (x) (0.4) (0.8)
ROE (%) 12.7 % 15.3 %
ROA (%) 12.0 % 14.8 %
Company Snapshot 2013 9M14
Number of Employees 3,902 3,704
Average Monthly Wage per
Employee (UAH)*
5,489 6,141
State Stake (%) 100.0 % 100.0 %
Note: *salary costs (excluding social payments)
divided by the average number of employees

165CO M PA N Y P R O F I L E S › M Y K O L AY I V O B L E N E R G O
Mykolayivoblenergo
General InformationMykolayivoblenergo is a mid-sized energy distributor operating in the Mykolaiv region (area: 24,598 km²; population: 1.16 million) in southern Ukraine. It owns 25,000 km of over-head transmission lines and 1,463 km of underground power cables along with 6,000 sub-stations with 3,361 MVA of transformer capacity. The oblenergo serves 476,000 residential customers and 16,000 commercial and industrial customers. The state holds a 70 % stake in the company.
Operating ResultsMykolayivoblenergo reported 9M14 electricity sales of 1.9 TWh ( –1.2 % y-o-y). Grid losses were virtually flat at 11.6 % ( –0.25ppt y-o-y), which is still 3.26ppt below the permitted mini-mum set for the oblenergo by the sector regulator (and factored into its tariff). The com-pany owes UAH 330m in unpaid bills to the state wholesale electricity market operator Energorynok, though in 2014 it paid for almost 100 % of its purchased electricity. The state regulator cut CAPEX outlays for Mykolayivoblenergo by 28 % to UAH 80m in 2014 and a further 7.5 % to UAH 74m in 2015.
Financial ResultsMykolayivoblenergo reported 9M14 net sales of UAH 1.1bn ( +7.0 % y-o-y). EBITDA surged by 155 % y-o-y to UAH 106m but net income was virtually flat y-o-y at UAH 43m as the com-pany reported UAH 151m of other financial income (below EBITDA), which offset the differ-ence. The EBITDA margin thus increased by 6ppt y-o-y to 9.8 % and net margin remained unchanged y-o-y at 4.0 %. The company reported relatively low bank debt of UAH 25m and UAH 330m of restructured debt to Energorynok, resulting in a rather high Net Debt/EBITDA ratio of 2.5x in 9M14. ROE totaled 15 % and ROCE 9.4 % in 9M14.
Reform Targets
� In terms of tariff setting, a gradual shift should be implemented from the currently employed «cost plus» method to performance-based tariffs dependent on the qual-ity of electricity supply and invested capital.
� Transmission tariffs for the company also need to include a fair investment compo-nent in order to finance, in addition to current operations, modernization of outdat-ed substations, transformers and transmission lines (their wear rate averages 60 %).
� The company should unbundle its electricity transmission and supply business seg-ments in order to prevent a conflict of interest between the distribution company and its independent suppliers.
� Further investment into cutting grid losses should be made in order to bring them closer to the EU average of 7 %.
� The company should facilitate the connection to the electricity network for new customers.
Þ www.hoe.com.ua
P&L (UAH m) 2013 9M14
Net Sales 1,379 1,076
Cost of Goods Sold 1,274 986
Gross Profit /(Loss) 105 90
EBITDA 49 106
Depreciation 75 53
Operating Profit/(Loss) (27) 52
Net Financial Income/(Loss) 53 (0)
Profit/(Loss) Before Taxes 27 53
Corporate Income Tax 9 11
Net Income/(Loss) 17 43
Dividends Paid 9.7 na
Balance Sheet (UAH m) 2013 9M14
Total Assets 998 1,038
Fixed Assets 871 870
PPE 861 869
Current Assets 127 167
Accounts Receivable 57 98
Cash & Cash Equivalents 5 4
Total Liabilities & Equity 998 1,038
Total Liabilities 653 653
Accounts Payable 205 177
Debt 336 355
Equity 345 385
Ratios 2013 9M14
Sales Growth (%, y-o-y) 4.0 % 7.0 %
EBITDA Margin (%) 3.5 % 9.8 %
Net Margin (%) 1.3 % 4.0 %
Debt/Equity (%) 97.3 % 92.1 %
Net Debt/EBITDA (x) 6.8 2.5
ROE (%) 5.1 % 15.3 %
ROA (%) 1.8 % 5.6 %
ROCE (%) (3.9 %) 9.4 %
Operating Summary 2013 9M14
Electricity Sales (GWh) 2,615 1,894
Growth (y-o-y) (1.2 %) (1.2 %)
Grid Losses (%) 12.30 11.55
Change (y-o-y) (1.07ppt) (0.25ppt)
Company Snapshot 2013 9M14
Number of Employees 3,556 4,060
Average Monthly Salary (UAH)* 4,561 4,870
State Stake (%) 70.0 % 70.0 %
Note: *salary costs (excluding social payments)
divided by the average number of employees

166
Naftogaz of Ukraine
General InformationNaftogaz of Ukraine is a fully state-owned company engaged in oil and natural gas produc-tion, transportation, and supply. The company operates the domestic gas transportation system including 39,800 km of high-pressure pipelines and underground gas storage res-ervoirs with total capacity of 32 bcm. The gas transit system has nominal import capacity of 288 bcm and export capacity of 179 bcm, including 140 bcm to the EU. Naftogaz’s of Ukraine Ukrgazvydobuvannya subsidiary extracts 15 bcm of gas annually (75 % of Ukraine’s total production). The company is heavily regulated and sells its gas to households and heating utilities at below-market prices. Naftogaz of Ukraine also suffers from low customer pay-ment discipline and remains heavily reliant on government support.
Operating ResultsIn 2014, Naftogaz of Ukraine sold 29 bcm of gas to its domestic customers ( –6 % y-o-y) at an average price of UAH 1,843/tcm, with the average household tariff increasing 39 % to UAH 478/tcm and the average industrial tariff rising 20 % to UAH 4,564/tcm. As of the endof 2014, Naftogaz of Ukraine was owed UAH 27bn, including UAH 16bn from heating utilities. Gas volumes pumped to the EU and the CIS shrank by 28 % to 62 bcm as Gazprom cut transit to the EU via Ukraine in order to limit Naftogaz’s of Ukraine ability to import part of this gas at a cheaper price.
Financial ResultsNaftogaz’s of Ukraine financials per se are hardly suitable for meaningful analysis as the company in its current state relies on sizable government subsidies to continue as a going concern. It incurs heavy losses from selling gas at below-cost prices to heating utilities and, from time to time, even industrial consumers (the latter occurs when the state regulator fails to adjust gas prices in a timely manner to reflect hryvnia devaluation). In 9M14, Naf-togaz of Ukraine reported a whopping UAH 60bn of net losses (vs. a UAH 25bn loss the year before), suffering from hryvnia devaluation. The state covers Naftogaz’s of Ukraine losses via regular share capital increases, issuing domestic bonds which the company can sell and use the proceeds to buy gas.
Reform Targets
� Increasing all subsidized gas tariffs to an economically viable level (or at least cost recovery) is a top priority. Phasing out subsidies would allow to increase investments into drilling and production-stimulating technologies as well as eliminate opportuni-ties for illegal arbitrage schemes made possible by widely divergent prices for differ-ent customer groups.
� Modernization of the gas transit system and construction of new interconnectors should occur in order to allow for unrestricted gas flows to and from the EU, reduc-ing dependence on Gazprom.
� Naftogaz’s of Ukraine organizational structure needs to be overhauled in accor-dance with the European Third Energy Package by separating its gas production, transit, storage and supply units.
� The company should facilitate the creation of joint ventures with foreign investors to attract investment to modernize the gas transit system.
� Naftogaz of Ukraine should consider a potential IPO of gas producing assets after gas prices have been adjusted to the market level.
Þ www.naftogaz.com
CO M PA N Y P R O F I L E S › N A F T O G A Z O F U K R A I N E
P&L (UAH m) 2013 9M14
Net Sales 77,018 45,789
Cost of Goods Sold 73,350 44,459
Gross Profit /(Loss) 3,668 1,330
EBITDA 97 (38,389)
Depreciation 3,171 2,932
Operating Profit/(Loss) (3,074) (41,322)
Net Financial Income/(Loss) (6,705) (6,199)
Profit/(Loss) Before Taxes (12,496) (59,912)
Corporate Income Tax 2,194 287
Net Income/(Loss) (14,690) (60,199)
Balance Sheet (UAH m) 2013 9M14
Total Assets 166,734 231,294
Fixed Assets 74,845 59,294
PPE 51,268 40,519
Current Assets 91,889 172,001
Accounts Receivable 39,664 53,787
Cash & Cash Equivalents 2,201 64,715
Total Liabilities & Equity 166,734 231,294
Total Liabilities 115,047 163,642
Accounts Payable 71,202 87,302
Debt 40,173 49,580
Equity 50,009 67,653
Ratios 2013 9M14
Sales Growth (%, y-o-y) (24.6 %) (4.4 %)
EBITDA Margin (%) 0.1 % (83.8 %)
Net Income Margin (%) (19.1 %) (131.5 %)
Debt/Equity (%) 80.3 % 73.3 %
Net Debt/EBITDA (x) 392.4 nm
ROE (%) (29.9 %) (164.5 %)
ROA (%) (9.0 %) (40.3 %)
ROCE (%) (2.8 %) (47.0 %)
Operating Summary 2013 2014
Gas Sales (bcm) 30.7 28.8
Growth (y-o-y) (30.0 %) (6.2 %)
Average Tariff (UAH/tcm) 1,264 1,843
Growth (y-o-y) 12.1 % 45.9 %
Transit (bcm) 86.1 62.2
Growth (y-o-y) 2.2 % (27.8 %)
Company Snapshot 2013 9M14
Number of Employees* 175,000 175,000
Average Monthly Salary (UAH) na na
State Stake (%) 100.0 % 100.0 %
Note: *consolidated for all Naftogaz subsidiaries

167CO M PA N Y P R O F I L E S › O D E S A CO M M E R C I A L S E A P O R T
Odesa Commercial Sea Port
General InformationThe Odesa Commercial Sea Port is one of the largest ports on the Black Sea. The port has 1 passenger and 7 freight terminals (for handling of both bulk cargo and containers). The port’s technical capacity allows handling up to 21 Mt of dry and up to 25 Mt of liquid bulk cargo per year. Container terminals can handle up to 900,000 TEU annually. The passenger terminal can accommodate up to 5 passenger vessels at a time and is capable to serve up to 4 million tourists a year. Odesa port operates the largest grain terminal in the Black Sea basin with a total capacity of 300 kt. The port also owns open storage (total area of 425,000 m²) and warehouses (total area of 60,000 m²). Odesa port transport infrastructure includes railway, automobile, and river links. Navigable period is possible year-round with icebreaker assistance often necessary during severe winter ice conditions, which can last for about 30 days.
Operating and Financial ResultsIn 2014, the Odesa Sea Port cargo turnover constituted 24.6 Mt (17 % of the Ukrainian total cargo turnover) with an increase of 6 % from 2013 on a y-o-y basis. There was a 17 % decline of containers processed in 2014 on a y-o-y basis. It was expected that more than 150 passenger cruise liners would arrive to the Odesa port in 2014, but due to the political situation in Ukraine, only 32 passenger liners visited the port. In 2015 not more than 30 passenger liners are expected to arrive in the Odesa port. Sales declined by 51 % in 9M14 on y-o-y basis. EBITDA margin remained high (72.8 % in 9M14 vs. 39.1 % in 2013). ROE and ROA ratios also showed positive dynamics in 9M14 with an increase of 3.5ppt and 4.1ppt, respectively (vs. 2013).
Reform Targets
� Invest in new facilities and equipment to increase cargo handling capacity. � Attract more private capital (e.g. concession projects). � Streamline tariff policy. � Improve marketing and customer service.
Þ www.port.odessa.ua
P&L (UAH m) 2013 9M14
Net Sales 457 194
Cost of Goods Sold 229 99
Gross Profit /(Loss) 228 96
EBITDA 305 200
Depreciation 71 59
Operating Profit/(Loss) 234 142
Net Financial Income/(Loss) 11 3
Profit/(Loss) Before Taxes 230 142
Corporate Income Tax 51 –
Net Income/(Loss) 179 142
Dividends Paid for Period – –
Balance Sheet (UAH m) 2013 9M14
Total Assets 1,805 1,862
Fixed Assets 1,580 1,483
PPE 1,234 1,155
Current Assets 224 379
Accounts Receivable 98 102
Cash & Cash Equivalents 92 239
Total Liabilities & Equity 1,805 1,862
Total Liabilities 105 123
Accounts Payable 15 34
Debt – –
Equity 1,700 1,739
Ratios 2013 9M14
Sales Growth (%, y-o-y) (43.9 %) (51.4 %)
EBITDA Margin (%) 66.7 % 103.1 %
Net Income Margin (%) 39.1 % 72.8 %
Debt/Equity (%) 0.0 % 0.0 %
Net Debt/EBITDA (x) (0.3) (0.9)
ROE (%) 7.3 % 10.8 %
ROA (%) 6.2 % 10.3 %
Company Snapshot 2013 9M14
Number of Employees 1,666 1,023
Average Monthly Wage per
Employee (UAH)*
6,693 7,046
State Stake (%) 100.0 % 100.0 %
Note: *salary costs (excluding social payments)
divided by the average number of employees

168
Odesa Portside Plant
General InformationThe Odesa Portside Plant (Odesa, southern Ukraine) was established in 1974 and is 100% state-owned. The Odesa Portside Plant is focused on ammonium nitrate and urea produc-tion and transhipment. The plant accounts for 17 % of ammonium nitrate and 19 % of urea production capacity in Ukraine. Export sales constitute 90% of the company’s sales of own ammonia products. The plant is located at the end-point of the ammonia pipeline Tolyatti-Gorlovka-Odesa, and transships large amount of ammonia transported through the pipe-line. Other products of Odesa Portside Plant include liquid nitrogen, carbon dioxide, liquid oxygen and sodium sulphate. The Odesa Portside Plant’s financial performance is highly dependent on natural gas prices, with gas constituting 80 % of the production costs.
Operating and Financial ResultsIn 2013, the Odesa Portside Plant was buying gas from Ostchem Holding (controlled by Dmi-triy Firtash) enjoying a favourable gas price differential compared to Naftogaz’s of Ukraine prices. Starting from 2014, Naftogaz of Ukraine became the sole gas supplier, as Ostchem Holding ceased purchase of gas from Gazprom. Following the increase of gas tariffs for en-terprises in 2014, the Odesa Portside Plant started importing gas from Hungary through re-verse facilities. Volatility of gas prices in 2014 resulted in a decline of operations of the Odesa Portside Plant in 2Q14 and 3Q14, but the company managed to restore full operation capacity by the end of the year, following the rise in prices for nitrogen fertilizers and receiving a UAH 5bn loan from Oschadbank for gas purchases from Naftogaz of Ukraine. In 9M14, there was a significant improvement in sales performance, demonstrating an increase of 7.4 % in 9M14 y-o-y and compared to the sales decline of 8.7 % in 2013.
Reform Targets
� Diversification of natural gas supplies. � Modernization of production equipment to utilise alternative (to gas) resources in
the production process.
Þ www.opz.odessa.net
CO M PA N Y P R O F I L E S › O D E S A P O R T S I D E P L A N T
P&L (UAH m) 2013 9M14
Net Sales 4,904 4,179
Cost of Goods Sold 5,716 4,263
Gross Profit /(Loss) (811) (84)
EBITDA (1,034) (180)
Depreciation 87 69
Operating Profit/(Loss) (1,121) (249)
Net Financial Income/(Loss) (31) 5
Profit/(Loss) Before Taxes (1,152) (243)
Corporate Income Tax (9) –
Net Income/(Loss) (1,144) (243)
Dividends Paid for Period – –
Balance Sheet (UAH m) 2013 9M14
Total Assets 2,752 3,345
Fixed Assets 1,671 1,718
PPE 1,097 1,059
Current Assets 1,080 1,627
Accounts Receivable 464 1,203
Cash & Cash Equivalents 227 143
Total Liabilities & Equity 2,752 3,345
Total Liabilities 2,059 2,903
Accounts Payable – –
Debt 2,021 2,895
Equity 693 442
Ratios 2013 9M14
Sales Growth (%, y-o-y) (8.7 %) 7.4 %
EBITDA Margin (%) (21.1 %) (4.3 %)
Net Income Margin (%) (23.3 %) (5.8 %)
Debt/Equity (%) 291.9 % 654.5 %
Net Debt/EBITDA (x) nm nm
ROE (%) (90.2 %) (61.6 %)
ROA (%) (46.0 %) (10.6 %)
Company Snapshot 2013 9M14
Number of Employees 3,832 3,798
Average Monthly Wage per
Employee (UAH)*
7,438 6,416
State Stake (%) 99.6 % 99.6 %
Note: *salary costs (excluding social payments)
divided by the average number of employees
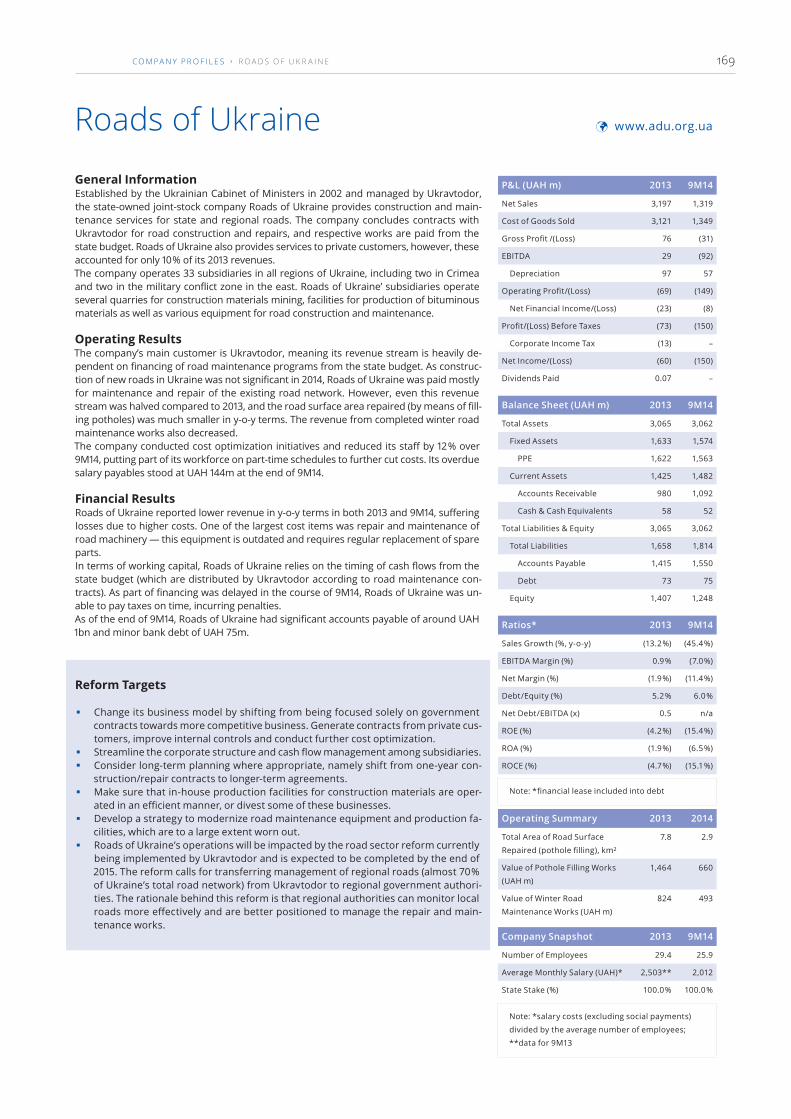
169CO M PA N Y P R O F I L E S › R O A D S O F U K R A I N E
Roads of Ukraine
General InformationEstablished by the Ukrainian Cabinet of Ministers in 2002 and managed by Ukravtodor, the state-owned joint-stock company Roads of Ukraine provides construction and main-tenance services for state and regional roads. The company concludes contracts with Ukravtodor for road construction and repairs, and respective works are paid from the state budget. Roads of Ukraine also provides services to private customers, however, these accounted for only 10 % of its 2013 revenues.The company operates 33 subsidiaries in all regions of Ukraine, including two in Crimea and two in the military conflict zone in the east. Roads of Ukraine’ subsidiaries operate several quarries for construction materials mining, facilities for production of bituminous materials as well as various equipment for road construction and maintenance.
Operating ResultsThe company’s main customer is Ukravtodor, meaning its revenue stream is heavily de-pendent on financing of road maintenance programs from the state budget. As construc-tion of new roads in Ukraine was not significant in 2014, Roads of Ukraine was paid mostly for maintenance and repair of the existing road network. However, even this revenue stream was halved compared to 2013, and the road surface area repaired (by means of fill-ing potholes) was much smaller in y-o-y terms. The revenue from completed winter road maintenance works also decreased.The company conducted cost optimization initiatives and reduced its staff by 12 % over 9M14, putting part of its workforce on part-time schedules to further cut costs. Its overdue salary payables stood at UAH 144m at the end of 9M14.
Financial ResultsRoads of Ukraine reported lower revenue in y-o-y terms in both 2013 and 9M14, suffering losses due to higher costs. One of the largest cost items was repair and maintenance of road machinery — this equipment is outdated and requires regular replacement of spare parts.In terms of working capital, Roads of Ukraine relies on the timing of cash flows from the state budget (which are distributed by Ukravtodor according to road maintenance con-tracts). As part of financing was delayed in the course of 9M14, Roads of Ukraine was un-able to pay taxes on time, incurring penalties.As of the end of 9M14, Roads of Ukraine had significant accounts payable of around UAH 1bn and minor bank debt of UAH 75m.
Reform Targets
� Change its business model by shifting from being focused solely on government contracts towards more competitive business. Generate contracts from private cus-tomers, improve internal controls and conduct further cost optimization.
� Streamline the corporate structure and cash flow management among subsidiaries. � Consider long-term planning where appropriate, namely shift from one-year con-
struction/repair contracts to longer-term agreements. � Make sure that in-house production facilities for construction materials are oper-
ated in an efficient manner, or divest some of these businesses. � Develop a strategy to modernize road maintenance equipment and production fa-
cilities, which are to a large extent worn out. � Roads of Ukraine’s operations will be impacted by the road sector reform currently
being implemented by Ukravtodor and is expected to be completed by the end of 2015. The reform calls for transferring management of regional roads (almost 70 % of Ukraine’s total road network) from Ukravtodor to regional government authori-ties. The rationale behind this reform is that regional authorities can monitor local roads more effectively and are better positioned to manage the repair and main-tenance works.
Þ www.adu.org.ua
P&L (UAH m) 2013 9M14
Net Sales 3,197 1,319
Cost of Goods Sold 3,121 1,349
Gross Profit /(Loss) 76 (31)
EBITDA 29 (92)
Depreciation 97 57
Operating Profit/(Loss) (69) (149)
Net Financial Income/(Loss) (23) (8)
Profit/(Loss) Before Taxes (73) (150)
Corporate Income Tax (13) –
Net Income/(Loss) (60) (150)
Dividends Paid 0.07 –
Balance Sheet (UAH m) 2013 9M14
Total Assets 3,065 3,062
Fixed Assets 1,633 1,574
PPE 1,622 1,563
Current Assets 1,425 1,482
Accounts Receivable 980 1,092
Cash & Cash Equivalents 58 52
Total Liabilities & Equity 3,065 3,062
Total Liabilities 1,658 1,814
Accounts Payable 1,415 1,550
Debt 73 75
Equity 1,407 1,248
Ratios* 2013 9M14
Sales Growth (%, y-o-y) (13.2 %) (45.4 %)
EBITDA Margin (%) 0.9 % (7.0 %)
Net Margin (%) (1.9 %) (11.4 %)
Debt/Equity (%) 5.2 % 6.0 %
Net Debt/EBITDA (x) 0.5 n/a
ROE (%) (4.2 %) (15.4 %)
ROA (%) (1.9 %) (6.5 %)
ROCE (%) (4.7 %) (15.1 %)
Note: *financial lease included into debt
Operating Summary 2013 2014
Total Area of Road Surface
Repaired (pothole filling), km²
7.8 2.9
Value of Pothole Filling Works
(UAH m)
1,464 660
Value of Winter Road
Maintenance Works (UAH m)
824 493
Company Snapshot 2013 9M14
Number of Employees 29.4 25.9
Average Monthly Salary (UAH)* 2,503** 2,012
State Stake (%) 100.0 % 100.0 %
Note: *salary costs (excluding social payments)
divided by the average number of employees;
**data for 9M13

170
State Food and Grain Corporation of Ukraine
General InformationThe State Food and Grain Corporation of Ukraine (SFGCU) was established in 2010 as a successor to the state company Khlib Ukrainy (Bread of Ukraine). The SFGCU is a vertically integrated grain market operator with a national network of grain silos (combined capacity: 3.8 Mt), two port terminals in Odesa and Mykolaiv (total transshipment capacity: 2.4 Mt), and grain processing facilities with total capacity of 531 kt of flour, 31 kt of cereals and 163 kt of feed p.a. The SFGCU purchases grain and oilseed crops for export from local farmers on both spot and forward terms. In 2012, it attracted a USD3.0bn 15-year loan from the Ex-port-Import Bank of China. The loan pays 6 % p.a. and has a 5-year grace period. Potential projects under this deal include purchases of Chinese crop protection products, seeds and agricultural equipment, and facilitation of Ukrainian grain exports to China. A USD1.5bn installment has since been disbursed to finance crop exports (mainly corn) to China.
Operating ResultsAccording to local industry experts, in 2013/14 MY the SFGCU was among the top-5 Ukrainian grain exporters, selling 2.9 Mt of crops (9 % of total exports), mostly corn (1.7 Mt). In the first half of 2014/15 MY (July –December 2014), the SFGCU was the second largest grain exporter in Ukraine, accounting for an est. 8.2 % of total grain exports over the period (total exports stood at 19.3 Mt). The company also reported that it fully met its obligations under the loan agreement with China last year. With Ukraine’s corn exports to China totaling 1.6 Mt last year, the SFGCU is estimated to have accounted for the lion’s share of this volume.
Financial ResultsThe SFGCU reported 9M14 sales of UAH 4.1bn, up 153 % y-o-y, benefiting from higher grain exports and UAH devaluation. EBITDA totaled UAH 1.0bn, almost triple y-o-y, for an EBITDA margin of 25 %. At the same time, the company reported a net loss of UAH 840m (vs. UAH 123m loss in 9M13) due to revaluation of foreign currency denominated debt. It booked a UAH 9.5bn revaluation loss on the aforementioned USD1.5bn Chinese loan, most of which was offset by a UAH 7.7bn gain on revaluation of foreign currency denominated deposits (as USD1.0bn of the loan was deposited with banks), resulting in a net F/X loss of UAH 1.8bn.
Reform Targets
� The SFGCU should complete the assets transfer from Khlib Ukrainy and decide on the desired level of vertical integration (pure grain trader with associated infrastruc-ture or grain-to-flour processing).
� The company should reviewthe terms of the loan agreement with China before dis-bursement of the second USD1.5bn installment.
� The company’s storage and transshipment facilities have an estimated wear rate of 80 %, underscoring its urgent investment needs. The second USD1.5bn installment of the Chinese loan can be used to finance investments into storage and tranship-ment facilities.
� The hryvnia devaluation poses a major obstacle in signing new forward contracts be-tween the SFGCU and local farmers (in fact, the SFGCU canceled forward purchases this year due to elevated F/X risk). Fixing crop prices in USD or developing F/X hedg-ing mechanisms should be considered going forward in order to mitigate F/X risk.
� Transparency of operations and oversight from a professional supervisory board are needed in order to improve the company’s corporate governance profile and prevent new fraud cases.
Þ www.pzcu.gov.ua
CO M PA N Y P R O F I L E S › S TAT E F O O D A N D G R A I N CO R P O R AT I O N O F U K R A I N E
P&L (UAH m) 2013 9M14
Net Sales 4,638 4,141
Cost of Goods Sold 4,368 3,537
Gross Profit/(Loss) 270 604
EBITDA 222 1,040
Depreciation 57 46
Operating Profit/(Loss) 165 993
Net Financial Income/(Loss) (129) (3)
Profit/(Loss) Before Taxes 29 (840)
Corporate Income Tax – –
Net Income/(Loss) 29 (840)
Dividends Paid for Period – –
Balance Sheet (UAH m) 2013 9M14
Total Assets 13,462 20,434
Fixed Assets 820 875
PPE 695 717
Current Assets 12,641 19,559
Accounts Receivable 1,759 3,661
Cash & Cash Equivalents 9,920 13,854
Total Liabilities & Equity 13,462 20,434
Total Liabilities 12,497 20,250
Accounts Payable 191 169
Debt 11,990 19,424
Equity 964 184
Ratios 2013 9M14
Sales Growth (%, y-o-y) 613.9 % 153.1 %
EBITDA Margin (%) 4.8 % 25.1 %
Net Margin (%) 0.6 % (20.3 %)
Debt/Equity 1,243.6 % 10,529.9 %
Net Debt/EBITDA 9.3 4.0
ROE (%) 3.1 % (257.9 %)
ROA (%) 0.2 % (6.6 %)
ROCE (%) 1.3 % 6.8 %
Company Snapshot 2013 9M14
Number of Employees 5,270 5,623
Average Monthly Salary (UAH)* 3,069 3,153
State Stake (%) 100.0 % 100.0 %
Note: *salary costs (excluding social payments)
divided by the average number of employees

171CO M PA N Y P R O F I L E S › S U M Y K H I M P R O M
Sumykhimprom
General InformationSumykhimprom is a large chemical producer in Ukraine, established more than 60 years ago. Sumykhimprom is a core entity in the chemical industry of Ukraine producing phos-phate mineral fertilizers (80 % of Ukraine’s total production capacity). The main products of the company are compound chemical fertilizers (53 % of sales) and titanium dioxide (40 % of sales). Domestic demand for fertilizers is seasonal. Export amounts to about 58 % of the company’s total sales (30 % of chemical fertilizers and 98 % of titanium dioxide are exported). Other products include large capacity inorganic chemical products such as aluminium sulphate, iron sulphate, sulphuric acids. Sumykhimprom is the second largest producer of titanium dioxide in Ukraine and has a 35 % share of the compound fertilizers market. Symykhimprom produces about 50 chemical products used in agriculture, con-struction, paints and varnishes, leather and rubber industries. Symykhimprom is located in the north-eastern part of Ukraine, occupying the area of 226 ha. With a headcount of c. 4.5 thousand employees, Sumykhimprom is one of the largest employers in the Sumy region. Sumykhimprom includes 11 main production units, 20 auxiliary production units and 7 social units (i.e. catering center, recreation resort, sport club etc.).
Operating and Financial ResultsIn 2011, bankruptcy proceedings were launched against Symykhimprom due to a large accumulated debt. Subsequently, in 2012, the state began the restructuring process of the enterprise and intended to privatize 92.75 %of its shares in 2013. However, the process has not been completed. Though the development of the restructuring plan is ongoing, Symykhimprom only marginally improved its financial and operational performance.In 9M14 Sumykhimprom increased fertilizers production by 16 % y-o-y to 208 kt after a sharp drop by 46 % y-o-y in 2013 due to the unfavourable situation on the world fertilizers market (i.e. low demand). Sales volume of titanium dioxide decreased in 2013 and 9M14 by 15 % and 16 % y-o-y. Sumykhimprom suffers from lack of main raw materials needed for compound fertilizer production in Ukraine.In 9M14, Sumykhimprom’s sales increased by 19 % y-o-y to UAH 1.4bn, with its gross profit margin improving by 2.7ppt y-o-y to 4.7 %, as revenue growth outpaced costs increase due to higher average selling prices of fertilizers and titan dioxide (increased by 13 % y-o-y and 24 % y-o-y, respectively). The company was loss-making in 2013 and 9M14 both at the EBITDA and net income level. The book value of assets increased by UAH 164m (12.6 %) to UAH 1,468m driven by a UAH 53m and a UAH 86m increase in finished goods and accounts receivable, respectively, which on the liabilities side were accompanied with UAH 60m and UAH 85m increases in advances received and accounts payable, respectively.
Reform Targets
� Finalize and implement the restructuring plan. � Optimize cost structure, through implementation of energy/gas saving technolo-
gies, and diversification of natural gas supplies. � Develop renovation and modernization programmes. Improve transparency of pro-
curement tenders.
Þ www.sumykhimprom.com.ua
P&L (UAH m) 2013 9M14
Net Sales 1,416 1,408
Cost of Goods Sold 1,401 1,342
Gross Profit /(Loss) 15 66
EBITDA (158) (19)
Depreciation 39 35
Operating Profit/(Loss) (197) (53)
Net Financial Income/(Loss) (5) (4)
Profit/(Loss) Before Taxes (201) (59)
Corporate Income Tax – –
Net Income/(Loss) (201) (59)
Dividends Paid for Period – –
Balance Sheet (UAH m) 2013 9M14
Total Assets 1,304 1,468
Fixed Assets 699 685
PPE 634 631
Current Assets 605 783
Accounts Receivable 207 293
Cash & Cash Equivalents 5 37
Total Liabilities & Equity 1,304 1,468
Total Liabilities 1,994 2,217
Accounts Payable 611 763
Debt – –
Equity (690) (749)
Ratios 2013 9M14
Sales Growth (%, y-o-y) (32.5 %) 18.8 %
EBITDA Margin (%) (11.2 %) (1.3 %)
Net Income Margin (%) (14.2 %) (4.2 %)
Debt/Equity (%) 0.0 % 0.0 %
Net Debt/EBITDA (x) nm mn
ROE (%) 34.0 % 10.8 %
ROA (%) (14.0 %) (5.7 %)
Operating Summary 2013 9М14
Fertilizers Production (kt) 206.5 208.4
Growth (%, y-o-y) (45.7 %) 15.9 %
Titanium Dioxide Production (kt) 32.6 25.0
Growth (%, y-o-y) (17.0 %) (10.1 %)
Fertilizers Sales Volume (kt) 214.2 216.7
Growth (%, y-o-y) (43.4 %) 17.2 %
Titanium Dioxide Sales Volume
(kt)
32.9 21.9
Growth (%, y-o-y) (15.4 %) (15.7 %)
Company Snapshot 2013 9M14
Number of Employees 4,787 4,525
Average Monthly Salary (UAH)* 2,902 3,394
State Stake (%) 100.0 % 100.0 %
Note: *salary costs (excluding social payments)
divided by the average number of employees

172
Turboatom
General InformationTurboatom produces turbine equipment for thermal, nuclear and hydroelectric power gen-erating plants, supplying over 10 % of the world’s nuclear power generating capacity, which makes it the world’s fourth-largest turbine producer. In Ukraine, the company’s turbines operate at 40 % of thermal power plants, 85 % of the nuclear power plants and 95 % of the hydro power plants. Turboatom’s current capacity allows for annual production of steam and hydro turbines with total generating capacity of 8 GW and 2 GW, respectively. The company has supplied its equipment to 45 countries globally. Since its founding in 1935, Turboatom has delivered over 165 turbines with total capacity of 65 GW to 110 nuclear plants; 400 turbines for thermal power plants (63 GW); and 530 turbines for 115 hydro power plants (39 GW). Its major competitors are Russian Power Machines, Siemens, Alstom, ABB, and Shanghai Electric.
Operating ResultsTurboatom is an export-oriented company, relying on foreign markets for around 70 % of its revenue. In 2013, steam turbines accounted for 61 % of its sales, followed by hydro tur-bines (25 %), spare parts (10 %), and other production (4 %). Turbines and other equipment for nuclear, hydro and thermal power plans were supplied to customers in Ukraine, Russia, Kazakhstan, Georgia, Tajikistan, Hungary, Bulgaria, India and Mexico. It is unlikely that the company will experience any major performance deterioration in the medium-term perspec-tive stemming from a possible disruption in cooperation with Russia/the Customs Union in view of the lengthy turbine manufacturing process (up to 3 or even 5 years), though longer-term risks are high. Turboatom had 5,853 employees as of end-9M14.
Financial ResultsTurboatom generated UAH 2.0bn in revenues in 2014, up by 14 % y-o-y (in USD terms, taking into account its export-oriented profile, sales declined by 23 %). Full-year net income stood at UAH 637m, up by 9 % y-o-y ( –26 % in USD terms). The target for 2015 is to increase sales by about 20 % y-o-y. The company had zero debt and UAH 793m of cash as of end-2014, being one of the very few cash-positive Ukrainian SOEs. End-2014 accounts payable and receivable (in UAH terms) declined by 18 % and by 27 % y-o-y, respectively, while inventories rose by 10 %. Full-year CAPEX totaled UAH 178m.
Reform Targets
� In view of the newly arisen risks to sustainable cooperation with customers in Rus-sia/the Customs Union, Turboatom needs to target further sales diversification glob-ally, for which more focused marketing efforts may be required. Also pertinent in this respect is the issue of diversifying away from Russian input supplies, including through greater production localization.
� Incentives should be developed for local power generating plants (particularly En-ergoatom, the state-owned nuclear power plant operator) to increase cooperation with Turboatom, thereby also helping to speed up import substitution.
� A long-term development program should be prepared to ensure Turboatom main-tains its competitive edge technologically on regional/global levels regardless of the relationship with Russia, potentially including harmonization of relevant technical standards with those of the EU in the framework of the Ukraine-EU Deep and Com-prehensive Free Trade Area.
Þ www.turboatom.com.ua
CO M PA N Y P R O F I L E S › T U R B O AT O M
P&L (UAH m) 2013 9M14
Net Sales 1,741 1,537
Cost of Goods Sold 963 994
Gross Profit /(Loss) 778 544
EBITDA 733 815
Depreciation 44 33
Operating Profit/(Loss) 690 782
Net Financial Income/(Loss) 25 23
Profit/(Loss) Before Taxes 711 912
Corporate Income Tax 128 89
Net Income/(Loss) 583 823
Dividends Paid na na
Balance Sheet (UAH m) 2013 9M14
Total Assets 3,721 4,003
Fixed Assets 600 645
PPE 354 369
Current Assets 3,121 3,357
Accounts Receivable 625 711
Cash & Cash Equivalents 789 793
Total Liabilities & Equity 3,721 4,003
Total Liabilities 1,560 1,237
Accounts Payable 1,529 1,201
Debt – –
Equity 2,161 2,765
Ratios 2013 9M14
Sales Growth (%, y-o-y) 34.3 % 20.1 %
EBITDA Margin (%) 42.1 % 53.0 %
Net Margin (%) 33.5 % 53.6 %
Debt/Equity (%) 0.0 % 0.0 %
Net Debt/EBITDA (x) (1.1) (0.7)
ROE (%) 30.6 % 42.2 %
ROA (%) 16.8 % 28.4 %
ROCE (%) 31.9 % 37.7 %
Company Snapshot 2013 9M14
Number of Employees 5,743 5,853
Average Monthly Salary (UAH)* 4,138 4,528
State Stake (%) 75.2 % 75.2 %
Note: *salary costs (excluding social payments)
divided by the average number of employees

173CO M PA N Y P R O F I L E S › U K R A I N I A N S E A P O R T S A D M I N I S T R AT I O N
Ukrainian Sea Ports Administration
General InformationThe Ukrainian Sea Ports Administration (USPA) is a state-owned enterprise supervising the operations of 13 sea ports in mainland Ukraine. Established in 2013, USPA owns strategic port infrastructure, namely the water zones, coast-protecting structures, berths and gen-eral-use infrastructure such as access roads and utility connections. USPA administers the ports, collects port fees, and provides general maintenance services. For example, USPA is the only state authority in charge of maintaining necessary water depths and conducting dredging works.There is an USPA subsidiary in each port, acting as the port’s administration and state-owned stevedoring company. Privately owned stevedoring companies can also operate at the ports, either by renting berths from USPA or by building their own berths. Private stevedoring companies currently operate in 10 Ukrainian ports.USPA’s is a management authority and is not engaged in stevedoring operations, meaning it does not compete with state-owned and privately owned stevedoring companies.
Operating and Financial ResultsUSPA revenues consist of harbor fees (tonnage dues, wharfage, anchor, and sanitary fees), ice passing dues, pilotage fees, and other charges. USPA collects revenues through its sub-sidiaries and distributes part of this money back to the subsidiaries to finance their ex-penses. About 80 % of USPA revenues are USD denominated, while expenses are primarily UAH denominated. The largest expense items are salaries and depreciation.CAPEX totaled UAH 830m in 9M14. Among other projects, USPA invested in the construc-tion of a container terminal in Odesa and an approach channel and water zone improve-ments in the Yuzhny port.In 9M14, USPA received UAH 2.7bn in revenues and reported net income of UAH 1.2bn, recording a 44 % net margin. The largest revenue contributors were Delta-Lotsman (harbor pilot services) and the Yuzhny and Odesa ports. The revenue breakdown by type of fee shows that port fees had a 66 % share of total revenue, with the remainder attributable to various services.
Reform Targets
� Streamline its tariff policy, increase transparency and efficiency of its customer service.
� Ensure a fair and supportive business climate for state-owned and private steve-doring companies, help ports gain more business and support private players in building new transshipment terminals.
� Create a transparent system for port maintenance works, such as dredging operations.
� Improve internal operational processes, streamline cash management among sub-sidiaries, introduce integrated financial reporting and IT systems that would com-prise operations of all ports reporting to USPA.
� Optimize costs. � Where possible, help state-owned stevedoring companies to attract private
capital, e.g. through privatization, management contracts and/or public-private partnerships.
Þ www.sumykhimprom.com.ua
P&L (UAH m) 2013 9M14
Net Sales 1,871 2,749
Cost of Goods Sold 827 1,004
Gross Profit/(Loss) 1,044 1,745
EBITDA 1,062 1,865
Depreciation 196 265
Operating Profit/(Loss) 866 1,600
Net Financial Income/(Loss) (0) 3
Profit/(Loss) Before Taxes 868 1,209
Corporate Income Tax 221 –
Net Income/(Loss) 647 1,209
Dividends Paid for Period – –
Balance Sheet (UAH m) 2013 9M14
Total Assets 16,656 17,522
Fixed Assets 15,562 16,106
PPE 11,790 13,276
Current Assets 1,095 1,416
Accounts Receivable 786 813
Cash & Cash Equivalents 140 425
Total Liabilities & Equity 16,656 17,522
Total Liabilities 1,348 1,473
Accounts Payable 488 318
Debt 639 958
Equity 15,308 16,049
Ratios 2013 9M14
Sales Growth (%, y-o-y) n/a 192.1 %
EBITDA Margin (%) 56.8 % 67.8 %
Net Income Margin (%) 34.6 % 44.0 %
Debt/Equity 4.2 % 6.0 %
Net Debt/EBITDA 0.5 0.2
ROE (%) 8.5 % 10.2 %
ROA (%) 7.8 % 9.4 %
ROCE (%) 5.4 % 12.5 %
Operating Summary 2013 2014
Port Freight Turnover (Mt)* 137.3 142.8
incl. State-Owned Stevedoring
Companies (Mt)
50.3 48.6
Note: *table shows total turnover of Ukrainian
ports, USPA receives port fees but is not engaged in
actual transshipment
Company Snapshot 2013 9M14
Number of Employees 10,490 8,287*
Average Monthly Wage per
Employee (UAH)**
5,658 7,041*
State Stake (%) 100.0 % 100.0 %
Notes: *data for 11M14; **including bonuses

174
Ukrainian State Air Traffic Enterprise
General InformationThe Ukrainian State Air Traffic Service Enterprise (UkSATSE) was established in 1992, and since then, has been the only air navigation service provider in Ukraine. UkSATSE compris-es the Ukrainian Airspace Management and Planning Centre (UKRAEROCENTER), Aeronau-tical Information Services (AIS), «UkSATSE» Airline, the Aviation Training and Certification Centre and seven regional branches. UkSATSE is the organisation responsible for providing air traffic service across Ukrainian airspace and in the airspace over the Black Sea where the responsibility for air traffic service is delegated to Ukraine by international agreements. As part of this service, UkSATSE also provides airspace management, air traffic flow man-agement, en-route meteorological services for air navigation and pre-flight information services. Among other services are flight calibration and rescue services (including flight tests of navigation and approach ground facilities), heliport, construction control services (approval of allocation and altitude of objects that can affect flight safety and operation of radio technical aids of civil aviation). In 2004, Ukraine became a member of EUROCON-TROL (the pan-European air traffic management organization) and UkSATSE, as a national air navigation service provider, is driving implementation of articles of the Agreement on European Common Aviation Area (ECAA).
Operating ResultsOne of the company’s main revenue drivers are fees paid by air carriers to use Ukraine’s airspace. The company’s aeronautical charges are set by EUROCONTROL to ensure that the company had sufficient revenue to cover its cost and provide high standards in air navigation services. Currently, the company’s en-route fee (EUR 45. 6 for 2015) is far below the aver-age European level (EUR 59) which makes the Ukrainian airspace attractive for international carriers from cost considerations. However, the number of flights in the Ukrainian airspace dropped significantly ( –35 % y-o-y in 2014) due to the military conflict in eastern Ukraine, Rus-sia’s annexation of Crimea, and the challenging economic situation in the country. Following the tragedy on July 17, 2014, in which a Malaysian Airlines plane with almost 300 people on board was shot down in the Donetsk region, some international airlines made the decision to avoid the Ukrainian airspace, which caused a 40 % decline in transit flights (216,000 flights in 2014 vs. 352,000 flights in 2013). The total passenger flow fell by 28 % in 2014 (11 million people in 2014 vs. 15 million in 2013). The number of passengers travelling with domestic airlines declined by 45 % y-o-y following the suspension of air connections with Crimea (Simferopol) and the eastern Ukrainian cities of Donetsk and Luhansk. Passenger traffic on international flights also decreased ( –25 % y-o-y in 2014).
Financial ResultsDespite a decline of the passenger flow and the number of flights, the company reported 9M14 revenues on par with prior periods (the company’s sales declined by only 0.5 % in 9M14 on a y-o-y basis). About 80 % of revenues earned by the company is in EUR or USD. Devalua-tion of the Ukrainian hryvnia against those currencies in 2014 eventually offset the negative volume effect from air traffic shrinkage and allowed to sustain the top line in UAH terms. The company’s operating costs are mostly UAH denominated with payroll expenses being the major element accounting for c. 65 % in the company’s cost of goods sold and adminis-trative expenses. The EBITDA margin and net income margin improved by 8ppt and 3.6ppt, respectively in 9M14 y-o-y with the main driver being the positive forex effect from the re-valuation of foreign currency denominated assets. The Company has no debt burden and is effectively hedged to possible future hryvnia devaluation which gives it high solvency and financial sustainability.
Reform Targets
� Extend international cooperation within the framework of the European Commis-sion initiative on Single European Sky (according to which the design, management and regulation of airspace will be coordinated throughout the EU, ensuring the safe and efficient utilisation of airspace and the air traffic management system within and beyond the EU).
� Implement navigation and communication equipment modernization. � Coordinate increases of air traffic on certain routes above the Black Sea with inter-
national organisations.
Þ www.uksatse.ua
CO M PA N Y P R O F I L E S › U K R A I N I A N S TAT E A I R T R A F F I C E N T E R P R I S E
P&L (UAH m) 2013 9M14
Net Sales 2,742 2,057
Cost of Goods Sold 1,929 1,360
Gross Profit /(Loss) 813 697
EBITDA 705 753
Depreciation 211 169
Operating Profit/(Loss) 494 584
Net Financial Income/(Loss) – –
Profit/(Loss) Before Taxes 498 557
Corporate Income Tax 119 129
Net Income/(Loss) 380 428
Dividends Paid for Period – –
Balance Sheet (UAH m) 2013 9M14
Total Assets 4,261 4,718
Fixed Assets 3,157 3,318
PPE 2,229 2,590
Current Assets 1,105 1,400
Accounts Receivable 781 599
Cash & Cash Equivalents 210 687
Total Liabilities & Equity 4,261 4,718
Total Liabilities 270 238
Accounts Payable 155 149
Debt 4 1
Equity 3,991 4,480
Ratios 2013 9M14
Sales Growth (%, y-o-y) 7.6 % (0.5 %)
EBITDA Margin (%) 25.7 % 36.6 %
Net Income Margin (%) 13.8 % 20.8 %
Debt/Equity (%) 0.1 % 0.0 %
Net Debt/EBITDA (x) (0.3) (0.7)
ROE (%) 10.1 % 13.3 %
ROA (%) 9.4 % 12.7 %
ROCE (%) 12.4 % 17.4 %
Company Snapshot 2013 9M14
Number of Employees 5,943 5,653
Average Monthly Wage per
Employee (UAH)*
15,305 14,987
State Stake (%) 100.0 % 100.0 %
Note: *salary costs (excluding social payments)
divided by the average number of employees

175CO M PA N Y P R O F I L E S › U K R E N E R G O
Ukrenergo
General InformationUkrenergo is a 100 % state-owned company responsible for operating the domestic high voltage transmission system and cross-border transmission lines and providing power dis-patching services. It controls real-time electricity output and monitors power generators’ operational generating units, fuel stocks and production efficiency, balancing electricity consumption with production. Due to its status as natural monopoly, tariffs for the compa-ny are set by the sector regulator, which uses a cost-plus approach to set tariffs based on its OPEX and CAPEX needs. Ukrenergo unites seven regional networks and operates 23,000 km of transmission lines operating at 220-750 kV voltage levels. The company regularly conducts cross-border capacity auctions and sells rights to export electricity from Ukraine to neighboring countries.
Operating ResultsIn 2014, Ukrenergo transmitted 130 TWh of electricity ( –2 % y-o-y), as consumption in Ukraine and exports fell over the period. Its average tariff declined by 5.3 % to UAH 23.7/MWh. Its CAPEX increased by 15 % to UAH 2.1bn. Energorynok, the sole buyer of Ukrenergo services, paid the company only 88 % of the total due last year. Historically, the company financed its CAPEX program with loans from the EBRD and the World Bank. In 2015, Ukren-ergo signed a USD378m loan agreement with the World Bank to finance modernization of its power transmission network and support implementation of the wholesale electricity market in Ukraine, which will not only finance physical modernization but also help to put in place elements needed for a more efficient market-based electricity pricing system.
Financial ResultsIn 9M14, sales fell by 1.9 % y-o-y on lower tariffs and transmission volumes, while EBITDA rose by 9 % to UAH 1.1bn on slightly lower other operating costs and higher other operating income. Ukrenergo reported a UAH 478m net loss due to a UAH 1.2bn loss on revaluation of USD loans. Net Debt/EBITDA increased from 1.2x at the end of 2014 to 2.4x in 9M14 due to revaluation of foreign currency denominated debt.
Reform Targets
� Approve economically viable tariffs for the company and adjust them in a timely manner in response to market movements.
� Ukrenergo has USD denominated loans from the EBRD and the World Bank, mean-ing the hryvnia devaluation puts pressure on its finances by inflating interest costs. The sector regulator has been slow to react to this new reality.
� Harmonization and, over time, synchronization with the EU electricity market would ensure more secure operation of the Ukrainian energy system and remove existing limitations on electricity exports and imports.
� The company should construct of additional transmission lines to the Zaporizhya, Rivne and Khmelnytskiy nuclear power plants in order to unlock up to 1.8 TW of capacity.
Þ www.ukrenergo.energy.gov.ua
P&L (UAH m) 2013 9M14
Net Sales 3,325 2,356
Cost of Goods Sold 1,955 1,453
Gross Profit /(Loss) 1,370 902
EBITDA 1,336 1,074
Depreciation 473 401
Operating Profit/(Loss) 863 673
Net Financial Income/(Loss) (9) (13)
Profit/(Loss) Before Taxes 859 (478)
Corporate Income Tax 71 –
Net Income/(Loss) 788 (478)
Balance Sheet (UAH m) 2013 9M14
Total Assets 11,309 13,058
Fixed Assets 9,364 10,558
PPE 6,427 6,266
Current Assets 1,945 2,500
Accounts Receivable 1,614 1,840
Cash & Cash Equivalents 165 479
Total Liabilities & Equity 11,309 13,058
Total Liabilities 3,843 6,078
Accounts Payable 924 958
Debt 1,730 3,976
Equity 7,467 6,980
Ratios 2013 9M14
Sales Growth (%, y-o-y) (2.6 %) (1.9 %)
EBITDA Margin (%) 40.2 % 45.6 %
Net Income Margin (%) 23.7 % (20.3 %)
Debt/Equity (%) 23.2 % 57.0 %
Net Debt/EBITDA (x) 1.2 2.4
ROE (%) 11.0 % (8.9 %)
ROA (%) 7.5 % (5.2 %)
ROCE (%) 9.4 % 8.2 %
Operating Summary 2013 2014
Electricity Transmission (TWh) 132.5 129.8
Change (%, y-o-y) (2.8 %) (2.0 %)
Transmission Tariff (UAH/MWh) 25.0 23.7
Change (%, y-o-y) 0.3 % (5.3 %)
Company Snapshot 2013 9M14
Number of Employees 13,670 15,686
Average Monthly Salary (UAH)* 6,755 5,769
State Stake (%) 100.0 % 100.0 %
Note: *salary costs (excluding social payments)
divided by the average number of employees

176
Ukrhydroenergo
General InformationUkrhydroenergo is Ukraine’s largest hydroelectric power generating company. It operates nine power plants on the Dnieper and Dniester rivers with 102 generating units and 5,401 MW of installed capacity (close to 9 % of Ukraine’s total installed power generating capacity). The company is the second cheapest electricity supplier in Ukraine (after nuclear power plants) and is virtually the sole provider of peak capacity in the country. In addition, Ukrhy-droenergo provides Ukraine’s energy system with frequency regulation services and is con-sidered a startup reserve in the case of a system-wide power failure. In 2014, the company launched its second power generating unit at its Dnistrovska pumped storage power plant and plans to launch a third one in 2015, bringing its total installed capacity to 972 MW.
Operating ResultsUkrhydroenergo slashed 2014 production by 39 % y-o-y to 8.5 TWh as the negative impact of lower precipitation (hence low river water levels) was compounded by a high comparison base (2013 production stood at 13.6 TWh, the highest since 1999). Its average tariff increased by 26 % y-o-y to UAH 302/MWh last year, inexpensive and in line with nuclear power plants. CAPEX shrank by 33 % y-o-y to UAH 1.0bn in 2014, and the sector regulator budgeted a 19 % decline to UAH 824m for 2015, which is intended to curb the company’s cash needs and thus restrain tariff growth.
Financial ResultsUkrhydroenergo’s 9M14 sales decreased by 6 % y-o-y to UAH 2bn as insufficient river water levels limited its power generating potential. However, higher tariffs partly offset the produc-tion loss. EBITDA declined by 15 % y-o-y to UAH 1.4bn and net income was halved to UAH 598m over the same period, with the bottom line also hit by an F/X loan revaluation charge (UAH 486m). EBITDA and net margins thus came in at 69 % ( –7ppt y-o-y) and 30 % ( –27ppt), respectively. Ukrhydroenergo’s high margins can be explained by low material costs, as the company does not use fossil fuels to generate electricity. The return on assets was very mod-est at 3.9 %, yet one should account for the fact that company’s assets have not yet been revalued, thus the real return on assets was much lower.
Reform Targets
� Similar to other domestic power companies, Ukrhydroenergo’s assets are worn out and require modernization. All of its power plants except for the Dnistrovska pumped storage facility have operated for at least 35 years.
� Ukrhydroenergo has foreign currency denominated loans from the EBRD and the World Bank. Due to the rapid hryvnia devaluation, the company’s interest expenses have more than doubled compared to budgeted levels and have yet to be compen-sated via a tariff increase.
� The Ukrainian energy system desperately needs additional peak capacity, which fur-ther expansion of the Dnistrovska pumped storage plant could provide.
� In 2014, Ukrhydroenergo purchased UAH 449m worth of electricity to pump water at the Dnistrovska plant. Due to the peculiarities of the Ukrainian energy market regu-lations, the company had to pay UAH 420/MWh for off-peak electricity while selling peak electricity at UAH 320/MWh, which obviously needs to be corrected.
Þ www.uge.gov.ua
CO M PA N Y P R O F I L E S › U K R H Y D R O E N E R G O
P&L (UAH m) 2013 9M14
Net Sales 2,722 2,016
Cost of Goods Sold 1,226 909
Gross Profit/(Loss) 1,496 1,108
EBITDA 1,828 1,386
Depreciation 458 344
Operating Profit/(Loss) 1,370 1,041
Net Financial Income/(Loss) 2 24
Profit/(Loss) Before Taxes 1,381 649
Corporate Income Tax 68 51
Net Income/(Loss) 1,313 598
Dividends Paid na na
Balance Sheet (UAH m) 2013 9M14
Total Assets 19,785 21,044
Fixed Assets 18,709 19,800
PPE 12,418 12,350
Current Assets 1,076 1,244
Accounts Receivable 810 737
Cash & Cash Equivalents 192 419
Total Liabilities & Equity 19,785 21,044
Total Liabilities 2,855 3,910
Accounts Payable 470 711
Debt 681 975
Equity 16,930 17,135
Ratios 2013 9M14
Sales Growth (%, y-o-y) 28.7 % (6.1 %)
EBITDA Margin (%) 67.2 % 68.7 %
Net Margin (%) 48.2 % 29.7 %
Debt/Equity (%) 8.9 % 13.2 %
Net Debt/EBITDA (x) 0.7 1.0
ROE (%) 9.3 % 4.7 %
ROA (%) 8.1 % 3.9 %
ROCE (%) 7.4 % 7.2 %
Operating Summary 2013 2014
Output (GWh) 13,587 8,546
Growth (y-o-y) 32.3 % (38.0 %)
Tariff (UAH/MWh) 240 302
Growth (y-o-y) 16.4 % 25.7 %
Company Snapshot 2013 9M14
Number of Employees 2,901 2,915
Average Monthly Salary (UAH)* 6,526 6,797
State Stake (%) 100.0 % 100.0 %
Note: *salary costs (excluding social payments)
divided by the average number of employees

177CO M PA N Y P R O F I L E S › U K R P O S H TA
Ukrposhta
General InformationUkrposhta is the national fully state-owned postal operator, established in 1994. It has 29 branches (including 25 regional directorates) and operates more than 11,800 post offices across the country, by far the largest network in the country. With over 87 thousand em-ployees, Ukrposhta processes and delivers to customers about 240 million postal items, 16 million parcels and insured items, 15 million orders, and more than 83 million pensions per annum. Overall, Ukrposhta offers individuals and corporate clients about 50 different services, including postal, subscription, courier, money transfer and pensions processing services, and other related services. Pensions processing and letters/parcels/periodicals delivery account for about 70 % of the company’s revenue. Ukrposhta’s market share was steadily declining in recent years (from 50 % in 2010 to 42 % in 2013) as a result of competi-tion from higher quality postal service offered by smaller private companies and banking system developments. Current legislation in the field of postal services mandates Ukrposh-ta to ensure a presence of post offices in all regions, incl. small towns and villages, thus, performing certain social functions. As Ukraine is a member of the Universal Postal Union since 1947, Ukrposhta, as a state-owned operator, is licensed to perform international ship-ments and is bound to comply with international guidelines of postal services.
Operating and Financial ResultsIn 9M14, the company’s sales fell by 6.7 % y-o-y to UAH 2.7bn as a result of lower volume of postal services. Ukrposhta lost 2 branches with 633 post offices due to the annexation of Crimea by Russia. EBITDA and net income shrank by 13 % and 54 % to UAH 115m and UAH 12m, respectively, driven by the decline in gross profit by 15 % to UAH 194m. The gross profit margin further deteriorated by 0.7ppt to 7.1 % in 9M14, partially due to the obligation to maintain the extended post office network (social load). Total liabilities of Ukrposhta decreased by 74 % to UAH 903m as pension liabilities dropped by 94 % to UAH 127m. Cash balances decreased by 87 %, mainly driven by the pensions’ withdrawal. In 9M14, Ukrposhta took a 5-year USD denominated loan, bearing 11.5 % p.a., under a renew-able credit line facility from PJSC Vseukrainski Bank Rozvytru (VBR). VBR is currently under temporary administration.
Reform Targets
� Introduce a quality control system to improve competitiveness of services rendered. � Optimize technical and logistical processes to improve customer services. � Introduce new front-office systems in the post offices; and ensure their integration
with a centralized database. � Improve transparency and accountability of the management, especially with re-
spect to CAPEX and procurement decisions. � Develop new high margin product lines.
Þ www.ukrposhta.ua
P&L (UAH m) 2013 9M14
Net Sales 3,971 2,719
Cost of Goods Sold 3,645 2,525
Gross Profit /(Loss) 326 194
EBITDA 191 115
Depreciation 138 100
Operating Profit/(Loss) 53 15
Net Financial Income/(Loss) – (5)
Profit/(Loss) Before Taxes 56 12
Corporate Income Tax 14 –
Net Income/(Loss) 42 12
Dividends Paid for Period – –
Balance Sheet (UAH m) 2013 9M14
Total Assets 5,666 3,151
Fixed Assets 2,432 2,344
PPE 2,173 2,159
Current Assets 3,234 807
Accounts Receivable 222 323
Cash & Cash Equivalents 2,837 357
Total Liabilities & Equity 5,666 3,151
Total Liabilities 3,429 903
Accounts Payable 415 280
Debt – 110
Equity 2,237 2,248
Ratios 2013 9M14
Sales Growth (%, y-o-y) 1.5 % (6.7 %)
EBITDA Margin (%) 4.8 % 4.2 %
Net Income Margin (%) 1.0 % 0.4 %
Debt/Equity (%) 0.0 % 4.9 %
Net Debt/EBITDA (x) (14.9) (1.6)
ROE (%) 1.9 % 0.7 %
ROA (%) 0.8 % 0.4 %
Company Snapshot 2013 9M14
Number of Employees 93,017 87,225
Average Monthly Salary (UAH) 1,884 1,852
State Stake (%) 100.0 % 100.0 %
Note: *salary costs (excluding social payments)
divided by the average number of employees

178
Ukrspyrt
General InformationUkrspyrt is a 100 % state-owned holding company operating 41 domestic distilleries with total annual capacity of 31.3 million decalitres, located in Lviv, Ternopil, Vinnytsia and other regions. Being a state monopoly in production and export of ethyl alcohol, Ukrspyrt is responsible for the implementation of government policy and effective management of state-owned companies in the alcoholic beverage industry. The company has approx. 5 thousand employees, being the main employer in villages and towns where its production facilities are located. Ukrspyrt was established in 2010 in the process of reorganization of Concern Ukrspyrt (included 81 state-owned enterprises). Ukrspyrt manufactures and markets ethyl alcohol (both food grade and industrial), distillated alcoholic beverages, bio-ethanol, and other organic chemical products. Over the last several years, Ukrspyrt was the subject of a number of anti-corruption investigations by journalists and official authorities. The Government of Ukraine is contemplating privatization of Ukrspyrt in the nearest future.
Operating ResultsLower demand from wine producers (due to the annexation of Crimea) and vodka producers (due to the contraction of export to Russia) were the main reasons for a decline in demand-driven sales of ethyl alcohol by 13.2 % y-o-y to 11.2 million decalitres in 2014. As of the end of 2014, 30 distilleries were operating (producing sufficient volumes to meet local demand), while 11 plants suspended production. In 2014, almost 95 % of ethyl alcohol was sold on the domestic market, mainly to vodka producers. In 2013 –2014, production of bioethanol and alcoholic beverages took place only at the Khorostkivsky and Lutsky distilleries, respectively.
Financial ResultsIn 9M14, the company’s sales decreased by 12 % y-o-y to UAH 1.2bn. EBITDA margin and net income margin grew by 9ppt and 7ppt y-o-y to 14 % and 8 %, respectively, as administrative expenses decreased by UAH 0.1bn (31 % y-o-y). The company’s debt as of 31 December 2013 included a 12-month loan in the amount of UAH 54m at 24 % p.a. from PJSC Delta-Bank (ma-turing at the end of 2014). As of 30 September 2014 the debt balance increased by 55 % due to a UAH 30m loan that the company received from PJSC Bank Ukrainian Capital at 26 % p.a. (maturing in February 2015). As of 30 September 2014, Ukrspyrt suffered low liquidity due to accumulation of receivables, which increased from UAH 641m to UAH 905m. Inventories increased from UAH 159m to UAH 356m in line with the growth in payables (increased from UAH 741m to UAH 941m) due to the purchase of corn for production purposes. Current assets included UAH 196m of prepaid expenses as of 30 September 2014.
Reform Targets
� Conduct privatization and eliminate the state monopoly. � Conduct production modernization, introduce energy saving technologies, perform
HR reorganization and optimization of production costs. � Increase export potential, enter new and expand existing markets. � Introduce an electronic monitoring system at all production phases of alcohol and
bioethanol , minimize illegal production and maximize tax revenues. � Attract investments in the production of bioethanol. � Optimize the management structure and address corporate governance risks.
Þ www.ukrspirt.com
CO M PA N Y P R O F I L E S › U K R S P Y R T
P&L (UAH m) 2013 9M14
Net Sales 2,034 1,213
Cost of Goods Sold 1,288 794
Gross Profit /(Loss) 746 419
EBITDA 86 164
Depreciation 46 27
Operating Profit/(Loss) 39 137
Net Financial Income/(Loss) – (5)
Profit/(Loss) Before Taxes 38 96
Corporate Income Tax 12 –
Net Income/(Loss) 26 96
Dividends Paid 3.7 8.2
Balance Sheet (UAH m) 2013 9M14
Total Assets 1,355 1,670
Fixed Assets 186 187
PPE 154 152
Current Assets 1,168 1,483
Accounts Receivable 641 905
Cash & Cash Equivalents 74 15
Total Liabilities & Equity 1,355 1,670
Total Liabilities 1,194 1,367
Accounts Payable 741 941
Debt 55 84
Equity 160 303
Ratios 2013 9M14
Sales Growth (%, y-o-y) (1.5 %) (11.5 %)
EBITDA Margin (%) 4.2 % 13.5 %
Net Income Margin (%) 1.3 % 7.9 %
Debt/Equity (%) 34.0 % 27.9 %
Net Debt/EBITDA (x) nm 0.3x
ROE (%) 18.4 % 51.7 %
ROA (%) 2.1 % 8.5 %
ROCE (%) 18.1 % 47.2 %
Operating Summary 2013 2014
Ethyl Alcohol Production (mdal) 15.7 11.9
Growth (%, y-o-y) na (24.5 %)
Ethyl Alcohol Sales Volume
(mdal)
12.9 11.2
Growth (%, y-o-y) na (13.3 %)
Bioethanol Production (mdal) 3.6 0.7
Growth (y-o-y) na (80.9 %)
Alcoholic Beverages Production
(thousand dal)
20.3 23.8
Growth (y-o-y) na 17.2 %
Company Snapshot 2013 9M14
Number of Employees 5,053 4,998
Average Monthly Salary (UAH) 3,081 3,278
State Stake (%) 100.0 % 100.0 %

179CO M PA N Y P R O F I L E S › U K R Z A L I Z N Y T S I A
Ukrzaliznytsia
General InformationState-owned rail monopoly Ukrzaliznytsia (UZ) operates 6 regional rail operators and close to 140 other subsidiaries. The domestic rail network is Ukraine’s stra-tegic asset and a key transport link between the EU and Russia and Central Asia (4 out of 10 pan-European transport corridors cross Ukraine). UZ operates 21,600 km of rail tracks (47 % electrified) and a fleet of c. 4,000 locomotives and 123,000 railcars. It accounts for c. 60 % of total freight transportation and 38 % of passenger transportation in Ukraine, rank-ing first in Europe (ex-Russia) on freight turnover. UZ is number 2 by passenger turnover in the CIS and nember 4 in Europe. Metal and mining goods accounted for 58 % of its 2014 freight transportation in volume terms, followed by construction materials (15 %) and grain (8 %). With over 300,000 employees, UZ is one of the largest employers in Ukraine. The Government plans to corporatize UZ this year but does not have any immediate plans for privatization.
Operating ResultsDomestic economic weakness and the military conflict in the east caused a decline in freight and passenger transportation in 2014 (Donetsk Railways, which was directly affected by fighting, had accounted for 15 % of UZ’s freight and 7 % of passenger turn-over in 2013). Total freight transportation thus dropped by 12 % y-o-y to 390 Mt, with domestic transportation (almost 50 % of total) down by 20 %, exports down 3 %, tran-sit services (mostly for Customs Union countries) down by 13 %, but imports up 3 % (on higher imports of coal, oil and oil products, and chemicals). With military hos-tilities in the east increasing transportation distances, freight turnover declined less ( –6 % y-o-y to 211 billion tonnes-km). Passenger transportation fell 9 % y-o-y to 440 million people (turnover down by 24 % to 37 billon passenger-km), affected by the security crisis (Crimea, Donbas). Military hostilities also inflicted significant damage on UZ’s infrastruc-ture in the eastern regions. As of end-2014, the conflict left 1,423 railway properties dam-aged, with underlying losses estimated at UAH 830m and about half of the properties reported repaired.
Financial ResultsUZ reported 1H14 consolidated net sales of UAH 23.4bn ( –2 % y-o-y), with freight revenue up 3 % (81 % of total sales, up 4ppt y-o-y) but passenger revenue down by 27 %. Due to further cost growth (personnel costs, which account for over 50 % of total operating ex-penses, rose by 12 % y-o-y in 1H14), EBITDA dropped 24 % y-o-y to UAH 4.1bn. The company reported a heavy net loss of UAH 8.2bn (vs. UAH 0.5bn net income in 1H13) after booking a non-cash loss of UAH 7.2bn stemming from revaluation of debt denominated in foreign currency. End-1H14 total debt (including financial lease) stood at UAH 29bn (up UAH 9bn YTD), with net debt at UAH 27.6bn (up UAH 8bn). Importantly, the Net Debt/EBITDA ratio at 2.94x approached the Eurobond covenant of 3.0x. As of end-1H14, foreign currency de-nominated debt (USD and EUR) accounted for 75 % of UZ’s total debt (excluding financial lease). For 2014, UZ reported provisional sales of UAH 50.1bn ( –2 % y-o-y despite a steeper drop in volume terms). The passenger transportation business incurred a UAH 7.9bn loss last year.
Reform Targets
� Relevant legislation needs to be amended to remove overlapping with the state- financed Agrarian Fund and transfer all its functions to PJSC Agrarian Fund.
� Complete incorporation, centralize and streamline the legal structure (especially re-gional subsidiaries) and consolidate cash flows; continue with management overhaul.
� Improve transparency of procurement tenders. � Develop a feasible program for financing renovation of rail infrastructure and rolling
stock in view of the latter’s wear rates of 80-90 % and the average service life of operat-ing electric locomotives of up to 40 years, whereas the replacement ratio so far has fallen far below 1.
� Optimize costs, including through divestment of noncore assets such as, for example, UZ’s more than 90 hospitals.
� Simplify the freight tariff system (e.g. using cost-plus method). � Foster competition with private freight operators. � Reform the passenger transportation business (especially the suburban segment) in
line with best global practices in order to phase out cross-subsidizing between the pas-senger and freight segments and have the losses on passenger transportation at least partially compensated by the state or local government budgets.
� Work on a debt management strategy, potentially including conversion of foreign cur-rency denominated debt into hryvnia; approach bondholders about revising covenants before they are breached as a result of UAH devaluation.
P&L (UAH m) 2013 1H14
Net Sales 51,050 23,439
Cost of Goods Sold 46,114 22,348
Gross Profit /(Loss) 4,935 1,091
EBITDA 12,210 4,081
Depreciation 7,248 2,868
Operating Profit/(Loss) 4,962 1,213
Net Financial Income/(Loss) (3,207) (1,735)
Profit/(Loss) Before Taxes 1,883 (7,766)
Corporate Income Tax 1,326 410
Net Income/(Loss) 558 (8,176)
Dividends Paid 120 94
Balance Sheet (UAH m) 2013 1H14
Total Assets 74,693 73,375
Fixed Assets 68,542 67,502
PPE 63,721 62,664
Current Assets 6,151 5,873
Accounts Receivable 1,093 1,514
Cash & Cash Equivalents 644 1,326
Total Liabilities & Equity 74,693 73,375
Total Liabilities 31,479 38,388
Accounts Payable 8,794 6,549
Debt 20,282 28,968
Equity 43,214 34,987
Ratios* 2013 1H14
Sales Growth (%, y-o-y) (3.2 %) (2.0 %)
EBITDA Margin (%) 23.9 % 17.4 %
Net Margin (%) 1.1 % (34.9 %)
Debt/Equity (%) 44 % 78 %
Net Debt/EBITDA (x) 1.6 2.9
ROE (%) 1.3 % (28.9 %)
ROA (%) 0.8 % (15.0 %)
ROCE 7.8 % 2.5 %
Note: *financial lease included into debt
Operating Summary 2013 2014
Cargo Transportation (billion-tonnes-km)
224 211
Growth (%, y-o-y) (5.9 %) (5.8 %)
Cargo Transportation (Mt) 444 390
Growth (%, y-o-y) (2.8 %) (12.2 %)
Passenger Transportation (billion passenger-km)
49 37
Growth (%, y-o-y) na (24.5 %)
Company Snapshot 2013 1H14
Number of Employees (‘000)* ~350 ~350
Average Monthly Salary (UAH)** 4,635 5,659
State Stake (%) 100.0 % 100.0 %
Note: *estimated and assumed flat in 2013 –2014;
**salary costs (excluding social payments) divided
by the average number of employees
Þ www.uz.gov.ua

CO M PA N Y P R O F I L E S › Y U Z H N Y S E A T R A D E P O R T180
Yuzhny Sea Trade Port
General InformationYuzhny is the largest (by cargo turnover) and deepest port in Ukraine. It is located in the Small Adzhalyk estuary in the north-western part of the Black Sea, 30 km to the east of the city of Odessa. There is an approach channel of 3.3 km in length leading from the sea to the port. The depth of the main piers is 14 meters, but there are two deep-water berths with a depth of 18.5 meters capable of accommodating Capesize vessels. The anchorage capacity of Yuzhny is 24 vessels at outer port water area. Open storage yards cover 185,500 m², sheltered warehouses — 2,000 m². The port specializes in handling of bulk, chemical, ore and general cargoes including coal, metal, cast iron, pellets, palm oil, carbamide, am-monia, methanol, crude oil and grain. The port has 2 cargo handling areas, three railway stations that are on Odessa Railway line, namely: Beregova, Khimichna, and Promyslova. These stations are connected to the outer railway system through Chornomorska station. The inner port roadways are connected to Odesa –Mykolaiv highway. Port berths are con-nected to the access railway lines and equipped with gantry cranes of rated lifting capacity up to 84 tonnes. The port is open to navigation all year around.
Operating Results and Financial ResultsIn 2014 Yuzhny handled 33 % (47 Mt) of Ukraine’s total cargo turnover. Transhipment of export cargoes increased by 14.6 % (vs. 2013) and constituted 36.9 Mt. Import cargoes turn-over constituted 4.9 Mt in 2014 ( +18.4 % vs. 2013). In 2014, the port optimised workflow by utilising electronic system of data interchange and implementing «free practice» (granting the permission for carrying out handling operations before border and customs control officers end work on-board a vessel). The above allowed optimising vessel downtime and simplifying cargo registration, hence, providing room for increase of cargo turnover.In 9M14, sales increased by 1.2 % y-o-y and amounted to UAH 879m; reported net income for the period constituted UAH 214m. EBITDA margin remained high (43.2 % in 9M14 vs. 38.2 % in 2013). Net income margin increased from 15.0 % in 2013 to 24.3 % in 9M14. Both ROE and ROA ratios had positive trends. ROE increased from 6.2 % in 2013 to 17.8 % in 9M14; ROA increased from 5.0 % to 12.8 % (9M14 vs. 2013). Yuzhny reported zero debt in 2013 and 9M14.
Reform Targets
� Utilize dredging in order to increase/maintain port depth, which is essential for han-dling large vessels and, hence, cargo flows.
� Invest in new facilities and equipment to increase cargo handling capacity. � Attract more private capital (e.g. concession projects). � Streamline tariff policy. � Improve marketing and customer service.
Þ www.port-yuzhny.com.ua
P&L (UAH m) 2013 9M14
Net Sales 1,098 879
Cost of Goods Sold 634 457
Gross Profit /(Loss) 464 422
EBITDA 419 380
Depreciation 154 115
Operating Profit/(Loss) 265 265
Net Financial Income/(Loss) 47 33
Profit/(Loss) Before Taxes 247 286
Corporate Income Tax 82 72
Net Income/(Loss) 164 214
Balance Sheet (UAH m) 2013 9M14
Total Assets 2,171 2,303
Fixed Assets 1,671 1,573
PPE 1,580 1,494
Current Assets 500 730
Accounts Receivable 175 300
Cash & Cash Equivalents 206 334
Total Liabilities & Equity 2,171 2,303
Total Liabilities 682 660
Accounts Payable 63 63
Debt – –
Equity 1,489 1,642
Ratios 2013 9M14
Sales Growth (%, y-o-y) (17.8 %) 1.2 %
EBITDA Margin (%) 38.2 % 43.2 %
Net Income Margin (%) 15.0 % 24.3 %
Debt/Equity (%) 0.0 % 0.0 %
Net Debt/EBITDA (x) (0.5) (0.7)
ROE (%) 6.2 % 17.8 %
ROA (%) 5.0 % 12.8 %
Company Snapshot 2013 9M14
Number of Employees 3,099 2,748
Average Monthly Salary (UAH)* 7,522 8,568
State Stake (%) 100.0 % 100.0 %
Note: *salary costs (excluding social payments)
divided by the average number of employees

181CO M PA N Y P R O F I L E S › Z A P O R I Z H YA O B L E N E R G O
Zaporizhyaoblenergo
General InformationZaporizhyaoblenergo is a top-10 electricity distributor in Ukraine, serving the heavily indus-trialized Zaporizhya region (area: 27,000 km²; population: 1.9 million). The oblenergo owns a 40,000 km-long low-voltage transmission grid with 9,749 MVA of transformer capacity. Its 783,364-strong customer base includes 22,670 commercial and large industrial enter-prises including steelmakers Zaporizhstal and Dniprospetsstal; Zaporizhya Ferroalloy; and a number of machine-building plants (e.g. Motor Sich). The state holds a 60.25 % stake in the company.
Operating ResultsZaporizhyaoblenergo increased electricity supplies by 3.5 % y-o-y to 6.2 TWh in 9M14, cutting grid losses by 1.1ppt to 7.4 %, or 0.6ppt below the permitted minimum set by the sector regu-lator. Yet the company continued to lose market share to independent electricity suppliers in its region, including part of its lucrative sales to large industrial customers. Third-party inter-mediaries accounted for 20% of the company’s 9M14 electricity distribution volume.
Financial ResultsZaporizhyaoblenergo cut 9M14 net sales by 23 % y-o-y to UAH 2.8bn as the share of elec-tricity supplied to third-party intermediaries rather than end customers increased, for which the company was paid only a transmission fee rather than the full electricity tariff. EBITDA fell 17 % to UAH 150m and net income shrank 26-fold to a mere UAH 4m, yielding EBITDA and net margins of 5.4 % (flat y-o-y) and 0.1 % ( –2.3ppt), respectively. The company had no bank debt but still owed UAH 755m in restructured arrears to the state wholesale market operator Energorynok for prior electricity supplies. Accounting for this debt, its Net Debt/EBITDA ratio stood at 3.2x. ROE and ROA were both very low in 9M14 at 1.4 % and 0.3 %, respectively, due to small earnings.
Reform Targets
� In terms of tariff setting, a gradual shift should be implemented from the currently employed «cost plus» method to performance-based tariffs dependent on the qual-ity of electricity supply and invested capital.
� Transmission tariffs for the company should also include a fair investment compo-nent in order to finance, in addition to current operations, modernization of outdat-ed substations, transformers and transmission lines (their wear rate averages 60 %).
� The company should unbundle of the electricity transmission and supply business segments in order to remove the potential conflict of interest between its distribu-tion company and its independent suppliers.
� Further investment into cutting grid losses should be made in order to bring them closer to the EU average of 7 %.
Þ www.zoe.com.ua
P&L (UAH m) 2013 9M14
Net Sales 4,747 2,762
Cost of Goods Sold 4,670 2,708
Gross Profit /(Loss) 77 54
EBITDA 159 150
Depreciation 96 88
Operating Profit/(Loss) 62 62
Net Financial Income/(Loss) (28) (55)
Profit/(Loss) Before Taxes 34 7
Corporate Income Tax 9 3
Net Income/(Loss) 25 4
Dividends Paid 9.1 na
Balance Sheet (UAH m) 2013 9M14
Total Assets 1,487 1,617
Fixed Assets 955 992
PPE 790 777
Current Assets 531 626
Accounts Receivable 443 475
Cash & Cash Equivalents 37 105
Total Liabilities & Equity 1,487 1,617
Total Liabilities 1,144 1,243
Accounts Payable 232 363
Debt 806 755
Equity 343 374
Ratios 2013 9M14
Sales Growth (%, y-o-y) (12.8 %) (22.9 %)
EBITDA Margin (%) 3.3 % 5.4 %
Net Income Margin (%) 0.5 % 0.1 %
Debt/Equity (%) 235.0 % 201.8 %
Net Debt/EBITDA (x) 4.8 3.2
ROE (%) 7.5 % 1.4 %
ROA (%) 1.7 % 0.3 %
ROCE (%) 5.4 % 7.3 %
Operating Summary 2013 9M14
Electricity Sales (GWh) 8,298 6,229
Growth (y-o-y) (0.4 %) 3.5 %
Grid Losses (%) 9.0 % 7.4 %
Change (0.53ppt) (1.11ppt)
Company Snapshot 2013 9M14
Number of Employees 5,780 5,769
Average Monthly Salary (UAH)* 4,078 4,317
State Stake (%) 60.3 % 60.3 %
Note: *salary costs (excluding social payments)
divided by the average number of employees

U K R A I N E ’ S T O P 1 0 0 S TAT E - O W N E D E N T E R P R I S E S A N D B A N K S › I N T E R I M R E P O R T: 2 0 1 3 — 9 M O N T H S 2 0 1 4182
Methodology Note
Information about SOEs collected by the MoEDT served as a basis for the analysis pre-sented in this report. Given the large number of SOEs and lack of consistent and quality information, it was not feasible to cover all 3,350 entities in a single report. At the same time, the largest SOEs accounted for over 80 % of the total assets and 80 % of the total sales of the entire sector, based on data for the nine months ended 30 September 2014. The analysis presented in this report covers the top 100 entities owned by the state, including the 94 largest SOEs (the «Portfolio») and 6 banks owned by the state.
SOEs included into the Portfolio were selected based on the following criteria: i) the book value of total assets reported as of 31 December 2013 and ii) the share of the state in the authorised capital being over 50 % (for public companies). Considering the current political situation and the anti-terrorist operation (ATO) in eastern Ukraine, SOEs of the defence sector as well as SOEs operating in the regions covered by the ATO were excluded from the analysis.
In addition, some entities were excluded from the analysis, given they did not have any commercial activity and represented special purpose entities. The list of such entities is presented at the end of this section. Included in this list also, Energorynok, the state-owned wholesale electricity market operator, performing the role of an intermediary buy-ing electricity from producers, averaging their prices and selling electricity to regional distributors and independent suppliers. Due to the nature of its operations, Energorynok has significant balances (receivables and payables) with other SOEs which operate in this segment. Inclusion of Energorynok into the Portfolio would significantly inflate the Port-folio’s results and balances.
The analysis presented in this report is based on the aggregated financial data, as no consolidated or combined financial statements of all SOEs is available (except for Ukrza-liznytsia, see below). No elimination of intercompany transactions and/or balances was performed as such information is not readily available.
Given the specific nature of the banking sector as well as the significant volume of transactions between the state-owned banks and the SOEs, the financial information of the state-owned banks was not aggregated within the Portfolio, but was presented separately.
The Portfolio financial information presented in this report is based primarily on the stat-utory 2013 annual and 9M14 quarterly financial statements of SOEs, with the only excep-tion being Ukrzaliznytsia, for which the combined audited and reviewed IFRS financial statements were available. Note: for Ukrzaliznytsia the most recent IFRS financial state-ments were available only for 1H14. Therefore, for the purposes of this report, the 9M13 and 9M14 aggregated financial data of the Portfolio include the 1H13 and 1H14 reported information of Ukrzaliznytsia (i.e. no annualization was performed).
Most of the SOEs are not audited, as currently there is no legal requirement for manda-tory audits of the financial statements of SOEs, unless such SOEs are public joint stock

183CO M PA N Y P R O F I L E S › M E T H O D O LO G Y N O T E
companies or their debt is publicly traded. Therefore, the data presented in this report in most cases are based on unaudited financial statements of SOEs.
As it was earlier noted, the MoEDT is currently preparing a consolidated up-to-date reg-ister of SOEs. There are outstanding information gaps which are yet to be addressed. For instance, out of 3,350 aforementioned SOEs, 1,102 enterprises were identified as non-operational and for 415 entities no financial information was available. Should these en-tities turn out to be material assets, once their respective information is obtained, the composition of the top 100 SOEs may change in subsequent reports.
The depth of the analysis presented in this report is significantly limited by the quality of the information currently available on SOEs at the MoEDT. With the progress of SOE’s reform, the quality of subsequent issues of this report shall improve, providing greater transparency of the sector, demonstrating how successful the Government is in imple-menting reform.
List of Special Purpose SOEs Excluded from the Analysis
№ Company or Organization ID Sector AccountabilityState
Interest, %
Sales revenue in 9M14
(UAH ‘000)
Assets as at 30 Sep 14
(UAH ‘000)
1Fіnansuvannya Infrastrukturnih
Proektіv SE37264503 Other Ukreuroinfraproject 100 – 13,347,901
2Chornobyl Nuclear Power Plant
State Specialized Enterprise14310862 Electricity
State Agency of Ukraine On
Exclusion Zone Management100 8,359 12,876,702
3Directorate of Krivoy Rog Mining
Plant Oxidized Ores SE04853709
Machine
Building
Ministry of Economic Development
and Trade of Ukraine100 2,653 1,552,550
4Direktsіya po Budіvnitstvu
Obiektіv SE00179737
Real
Estate
Ministry of Energy and Coal
Industry of Ukraine100 – 1,195,040
5Lvivska Oblasna Direktsіya z
Protipavodkovogo Zakhystu SE36670377 Other
State Agency of Water Resources
of Ukraine100 – 685,157
6 Ukrmedproektbud SE 37700171 Other Ukreuroinfraproject 100 1,293 540,401
7 Derzecoinvest SE 36939719 OtherState Environmental Investment
Agency of Ukraine100 1,930 527,169
8 State Investment Company SE 37176130 OtherState Agency for Investment and
National Projects of Ukraine100 8,739 345,534
9State Finance Institution for
Innovations00041467 Other
State Agency for Investment and
National Projects of Ukraine100 134 316,539
10 Energorynok SE 21515381 Electricity Cabinet of Ministers of Ukraine 100 63,733,659 23,553,642

U K R A I N E ’ S T O P 1 0 0 S TAT E - O W N E D E N T E R P R I S E S A N D B A N K S › I N T E R I M R E P O R T: 2 0 1 3 — 9 M O N T H S 2 0 1 4184
SOE Portfolio
№ Company or Organization ID Sector AccountabilityState
Interest, %
Sales revenue in 9M14
(UAH ‘000)
Assets as at 30 Sep 14
(UAH ‘000)
1National Nuclear Energy Generating
Company Energoatom SE24584661 Electricity
Ministry of Energy and Coal
Industry of Ukraine100 16,552,582 199,561,027
2 Ukrhidroenergo PJSC 20588716 ElectricityMinistry of Energy and Coal
Industry of Ukraine100 2,016,398 21,044,223
3 Regional Electric Network SE 32402870 ElectricityMinistry of Energy and Coal
Industry of Ukraine100 295,579 5,539,466
4 Kharkivoblenergo JSC 00131954 Electricity State Property Fund of Ukraine 65 2,746,935 2,749,076
5 Zaporizhyaoblenergo JSC 00130926 Electricity State Property Fund of Ukraine 60 2,761,700 1,617,209
6 Mykolaivoblenergo PJSC 23399393 Electricity State Property Fund of Ukraine 70 1,076,171 1,037,537
7 Khmelnitskoblenergo PJSC 22767506 Electricity State Property Fund of Ukraine 70 762,523 880,327
8 Kryvorizka Heating Plant SE 00130850 ElectricityMinistry of Energy and Coal
Industry of Ukraine100 174,142 848,976
9 Ternopiloblenergo JSC 00130725 Electricity State Property Fund of Ukraine 51 543,302 748,861
10National Power Company
Ukrenergo SE00100227 Electricity
Ministry of Energy and Coal
Industry of Ukraine100 2,355,670 13,057,918
11 Centrenergo PJSC 22927045 ElectricityMinistry of Energy and Coal
Industry of Ukraine78 5,554,689 5,024,986
12 Ukrinterenergo SFTC 19480600 ElectricityMinistry of Energy and Coal
Industry of Ukraine100 1,748,069 480,541
13Dniprodzerzhynsk
Heating Plant PJSC00130820 Electricity State Property Fund of Ukraine 100 86,594 422,526
14 Naftogaz of Ukraine NJSC 20077720 Oil & GasMinistry of Energy and Coal
Industry of Ukraine100 45,788,604 231,294,467
15 Nadra Ukrainy NJSC 31169745 Oil & GasState Geological and Mineral
Resources Survey100 99,565 1,696,146
16 Ukrgeofizika SGE 01432761 Oil & GasState Geological and Mineral
Resources Survey100 95,470 404,562
17
Ukrzaliznytsia, the State
Administration of Railway
Transport of Ukraine
TransportationMinistry of Infrastructure of
Ukraine100 23,438,616 73,374,960
18 Ukrainian Sea Ports Authority SE 38727770 TransportationMinistry of Infrastructure of
Ukraine100 2,749,332 17,522,051
19Kyiv Boryspil International
Airport SE20572069 Transportation
Ministry of Infrastructure of
Ukraine100 1,212,053 9,429,052
20 Ukrposhta SE 21560045 TransportationMinistry of Infrastructure of
Ukraine100 2,718,578 3,150,906
21 SJSC Roads of Ukraine PJSC 31899285 Transportation State Road Agency of Ukraine 100 1,318,568 3,062,163
22Ukrainian State Air Traffic
Services Enterprise19477064 Transportation
Ministry of Infrastructure of
Ukraine100 2,056,737 4,717,992
23 Mariupol Sea Commercial Port SE 01125755 TransportationMinistry of Infrastructure of
Ukraine100 728,096 2,584,500
24 Ukrkosmos SE 24381357 Transportation State Space Agency of Ukraine 100 6,645 2,838,438
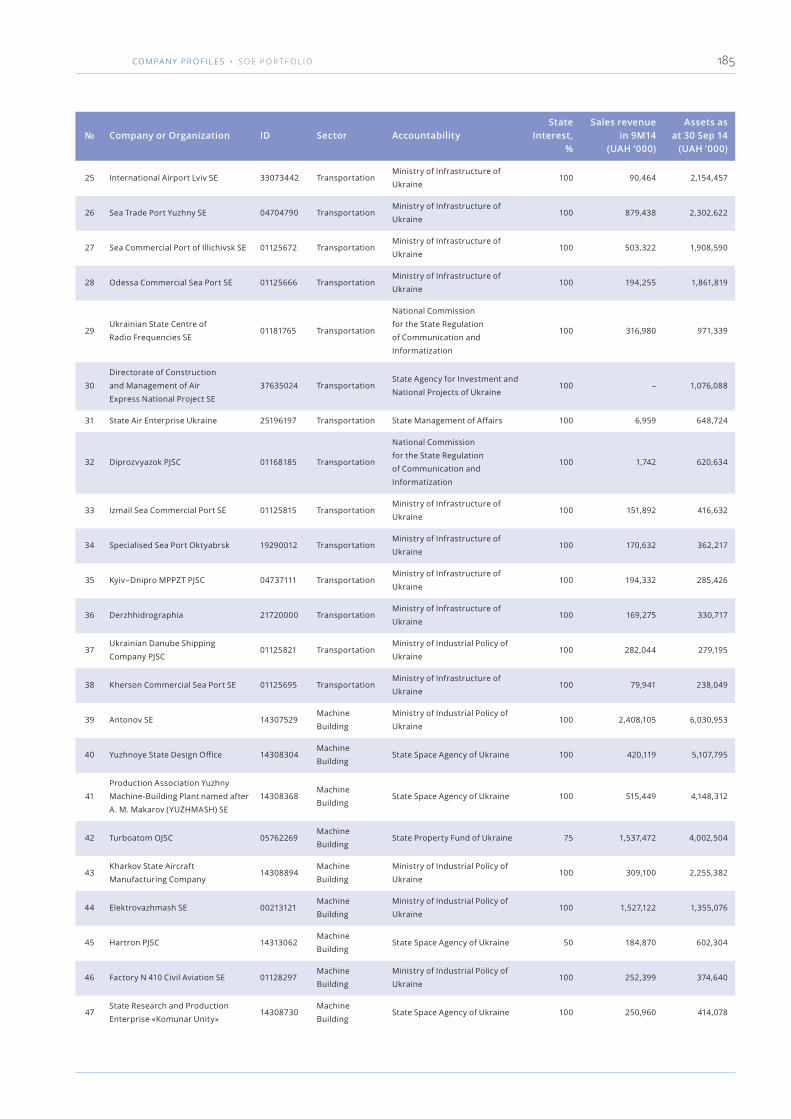
185CO M PA N Y P R O F I L E S › S O E P O R T F O L I O
№ Company or Organization ID Sector AccountabilityState
Interest, %
Sales revenue in 9M14
(UAH ‘000)
Assets as at 30 Sep 14
(UAH ‘000)
25 International Airport Lviv SE 33073442 TransportationMinistry of Infrastructure of
Ukraine100 90,464 2,154,457
26 Sea Trade Port Yuzhny SE 04704790 TransportationMinistry of Infrastructure of
Ukraine100 879,438 2,302,622
27 Sea Commercial Port of Illichivsk SE 01125672 TransportationMinistry of Infrastructure of
Ukraine100 503,322 1,908,590
28 Odessa Commercial Sea Port SE 01125666 TransportationMinistry of Infrastructure of
Ukraine100 194,255 1,861,819
29Ukrainian State Centre of
Radio Frequencies SE01181765 Transportation
National Commission
for the State Regulation
of Communication and
Informatization
100 316,980 971,339
30
Directorate of Construction
and Management of Air
Express National Project SE
37635024 TransportationState Agency for Investment and
National Projects of Ukraine100 – 1,076,088
31 State Air Enterprise Ukraine 25196197 Transportation State Management of Affairs 100 6,959 648,724
32 Diprozvyazok PJSC 01168185 Transportation
National Commission
for the State Regulation
of Communication and
Informatization
100 1,742 620,634
33 Izmail Sea Commercial Port SE 01125815 TransportationMinistry of Infrastructure of
Ukraine100 151,892 416,632
34 Specialised Sea Port Oktyabrsk 19290012 TransportationMinistry of Infrastructure of
Ukraine100 170,632 362,217
35 Kyiv –Dnipro MPPZT PJSC 04737111 TransportationMinistry of Infrastructure of
Ukraine100 194,332 285,426
36 Derzhhidrographia 21720000 TransportationMinistry of Infrastructure of
Ukraine100 169,275 330,717
37Ukrainian Danube Shipping
Company PJSC01125821 Transportation
Ministry of Industrial Policy of
Ukraine100 282,044 279,195
38 Kherson Commercial Sea Port SE 01125695 TransportationMinistry of Infrastructure of
Ukraine100 79,941 238,049
39 Antonov SE 14307529Machine
Building
Ministry of Industrial Policy of
Ukraine100 2,408,105 6,030,953
40 Yuzhnoye State Design Office 14308304Machine
BuildingState Space Agency of Ukraine 100 420,119 5,107,795
41
Production Association Yuzhny
Machine-Building Plant named after
A. M. Makarov (YUZHMASH) SE
14308368Machine
BuildingState Space Agency of Ukraine 100 515,449 4,148,312
42 Turboatom OJSC 05762269Machine
BuildingState Property Fund of Ukraine 75 1,537,472 4,002,504
43Kharkov State Aircraft
Manufacturing Company14308894
Machine
Building
Ministry of Industrial Policy of
Ukraine100 309,100 2,255,382
44 Elektrovazhmash SE 00213121Machine
Building
Ministry of Industrial Policy of
Ukraine100 1,527,122 1,355,076
45 Hartron PJSC 14313062Machine
BuildingState Space Agency of Ukraine 50 184,870 602,304
46 Factory N 410 Civil Aviation SE 01128297Machine
Building
Ministry of Industrial Policy of
Ukraine100 252,399 374,640
47State Research and Production
Enterprise «Komunar Unity»14308730
Machine
BuildingState Space Agency of Ukraine 100 250,960 414,078

U K R A I N E ’ S T O P 1 0 0 S TAT E - O W N E D E N T E R P R I S E S A N D B A N K S › I N T E R I M R E P O R T: 2 0 1 3 — 9 M O N T H S 2 0 1 4186
№ Company or Organization ID Sector AccountabilityState
Interest, %
Sales revenue in 9M14
(UAH ‘000)
Assets as at 30 Sep 14
(UAH ‘000)
48 SPC Elektrovozobuduvannya SE 32495626Machine
Building
Ministry of Economic
Development and Trade of
Ukraine
100 112,152 255,566
49 Khlib Ukrainy PJSC 37243279Food &
Agriculture
Ministry of Agrarian Policy and
Food of Ukraine100 4,141,232 20,434,258
50 Agrarian Fund PJSC 38926880Food &
Agriculture
Ministry of Agrarian Policy and
Food of Ukraine100 2,282,876 7,897,114
51 Ukrspyrt SE 37199618Food &
Agriculture
Ministry of Agrarian Policy and
Food of Ukraine100 1,213,324 1,669,620
52Doslidne Gospodarstvo
Proskurivka SE00846429
Food &
Agriculture
Ministry of Agrarian Policy and
Food of Ukraine100 49 1,330,454
53State Food and Grain
Corporation of Ukraine PJSC20047943
Food &
Agriculture
Ministry of Agrarian Policy and
Food of Ukraine100 12,523 1,289,042
54 Konyarstvo Ukrayiny SE 37404165Food &
Agriculture
Ministry of Agrarian Policy and
Food of Ukraine100 49,751 359,322
55 Artyomsol SE 00379790Food &
Agriculture
Ministry of Agrarian Policy and
Food of Ukraine100 678,642 995,505
56 Doslidne Gospodarstvo Sharivka SE 00729770Food &
Agriculture
Ministry of Agrarian Policy and
Food of Ukraine100 200 597,510
57
Centre of Certification and
Examination of Seeds and
Planting Material SE
37884028Food &
Agriculture
Ministry of Agrarian Policy and
Food of Ukraine100 34,138 308,036
58State Reserve Seed
Fund of Ukraine SE30518866
Food &
Agriculture
Ministry of Agrarian Policy and
Food of Ukraine100 33,670 278,491
59 Odessa Port Plant PSC 00206539 Chemicals State Property Fund of Ukraine 100 4,179,094 3,344,862
60 Sumykhimprom PJSC 05766356 Chemicals State Property Fund of Ukraine 100 1,408,258 1,468,094
61 Oriana OJSC 05743160 Chemicals State Property Fund of Ukraine 100 – 1,251,281
62Research-Industrial Complex
Pavlograd Chemical Plant SE14310112 Chemicals State Space Agency of Ukraine 100 195,409 999,923
63 Ukrkhimtransamiak SE 31517060 Chemicals
Ministry of Economic
Development and Trade of
Ukraine
100 792,238 1,011,365
64 Ukrmedpostach SE 04653147 Chemicals Ministry of Health of Ukraine 100 2,376 846,636
65 Coal of Ukraine SE 32709929 Coal MiningMinistry of Energy and Coal
Industry of Ukraine100 5,664,142 4,216,531
66 Selydivvuhillya SE 33426253 Coal MiningMinistry of Energy and Coal
Industry of Ukraine100 340,872 1,570,712
67 Lisichanskvuhillya PJSC 32359108 Coal MiningMinistry of Energy and Coal
Industry of Ukraine100 109,432 1,390,099
68 Krasnoarmiyskvuhillya SE 32087941 Coal MiningMinistry of Energy and Coal
Industry of Ukraine100 260,916 1,102,149
69Coal Mining Company
Krasnolymanska SE31599557 Coal Mining
Ministry of Energy and Coal
Industry of Ukraine100 339,656 1,118,859
70 Lvivvuhillya SE 32323256 Coal MiningMinistry of Energy and Coal
Industry of Ukraine100 637,758 853,382
71 Dzerzhinskvuhillya SE 33839013 Coal MiningMinistry of Energy and Coal
Industry of Ukraine100 129,267 626,695
72 Arena Lviv SE 38457291 Real EstateMinistry of Youth and Sports of
Ukraine100 2,126 1,099,237

187CO M PA N Y P R O F I L E S › S O E P O R T F O L I O
№ Company or Organization ID Sector AccountabilityState
Interest, %
Sales revenue in 9M14
(UAH ‘000)
Assets as at 30 Sep 14
(UAH ‘000)
73 Expocenter of Ukraine NC 21710384 Real Estate State Management of Affairs 100 7,967 804,046
74National Art and Culture Museum
Complex Mystetskyi Arsenal SE33403498 Real Estate State Management of Affairs 100 3,591 641,874
75National Sports Complex
Olimpiyskiy SE14297707 Real Estate
Ministry of Youth and Sports of
Ukraine100 23,971 6,767,681
76 Palats Sportu SE 37193349 Real EstateMinistry of Youth and Sports of
Ukraine100 6,083 442,887
77Dnipropetrovsk Subway
Construction Management SE35986512 Real Estate
Dnipropetrovsk Regional State
Administration100 364 413,341
78 Zhytloinbud SE 30860220 Real EstateAdministation of State Guard of
Ukraine100 39,186 267,215
79 Ukrzhytloservice SE 32207896 Real Estate State Management of Affairs 100 13,851 299,745
80 Construction Company Ukrbud SE 33298371 Real Estate Ukrbud 100 101,273 349,577
81 Ukrservice Ministry of Transport SE 30218246 Real EstateMinistry of Infrastructure of
Ukraine100 14,113 415,848
82 National Palace of Arts Ukraine SE 02221461 Real Estate State Management of Affairs 100 14,686 246,829
83 Information Centre SE 25287988 Other Ministry of Justice of Ukraine 100 129,071 375,970
84 Polygraph Combine Ukraina SE 16286441 Other National Bank of Ukraine 100 846,139 827,799
85Eastern Mining and
Processing Plant SE14309787 Other
Ministry of Energy and Coal
Industry of Ukraine100 973,746 2,090,712
86
Broadcasting,
Radiocommunications &
Television Concern
01190043 Other
National Commission
for the State Regulation
of Communication and
Informatization
100 375,062 381,659
87 Factory Aluminium Foil SE 33210902 OtherMinistry of Industrial Policy of
Ukraine100 – 374,355
88SJSC Ukrainian Vydavnycho-
Poligrafichne Obyednannya PJSC21661711 Other
Ministry of Industrial Policy of
Ukraine100 1,643 318,064
89Research and Production
Enterprise Bilshovyk PJSC14308569 Other State Property Fund of Ukraine 100 36,090 338,271
90 Presa SE 25593685 Other
State Service of Special
Communication and Information
Protection of Ukraine
100 36,221 58,745
91 Hall of Official Delegations SE 26191463 Other State Management of Affairs 100 28,583 458,722
92Directorate General for Rendering
Services to Diplomatic Missions SE04013583 Other State Management of Affairs 100 52,652 368,454
93 Ukragroleasing NJSC 30401456 Other Ukragroleasing 100 79,695 553,074
94 Kryvbaspromvodopostachannya SE 00191017 OtherDnipropetrovsk Regional State
Administration100 174,192 302,175
95Ukrainian Bank for Reconstruction
and Development JSC26520688 Banking Ministry of Finance 100 8,429 106,291
96 Ukrgasbank JSB 23697280 Banking Ministry of Finance 93 3,044,355 21,027,912
97 Oschadbank JSC 00032129 Banking Ministry of Finance 100 16,271,537 128,103,752
98 Rodovid Bank PJSC 14349442 Banking Ministry of Finance 100 108,643 8,531,382
99 Ukreximbank JSC 00032112 Banking Ministry of Finance 100 12,800,153 125,999,827
100Joint Stock Commercial
Bank Kyiv PJSC14371869 Banking Ministry of Finance 100 172,821 1,484,553

U K R A I N E ’ S T O P 1 0 0 S TAT E - O W N E D E N T E R P R I S E S A N D B A N K S › I N T E R I M R E P O R T: 2 0 1 3 — 9 M O N T H S 2 0 1 4188
Abbreviations and Definitions
9M14 Nine months ended 30 September 2014
¢ Cent
bbl Barrel
bcm Billion cubic meters
bn Billion
boe Barrel of oil equivalent
c. Circa
CAGR Compound annual growth rate
CAPEX Capital expenditures
CHP Combined heat and power plant
CNS Communication, Navigation, Surveillance
COGS Cost of goods sold
EBITDA Earnings before interest, taxes, depreciation and amortization. The indicator is derived by
adding depreciation and amortization costs to the operating profit or loss
est. Estimated
EV Enterprise value
EXW Ex works
F/X Foreign exchange
FOB Free on board
g/kWh Grams per kilowatt-hour
GTS Gas transportation system
GWh Gigawatt-hours
ha Hectare
h-o-h Half-year-on-half-year
JPY Japanese Yen
kg Kilogram
km Kilometer
km² Square kilometre
kt Thousand tonnes

189CO M PA N Y P R O F I L E S › A B B R E V I AT I O N S A N D D E F I N I T I O N S
kV Kilovolt
kWh Kilowatt-hours
m Million
mdal Million dekaliters
Mha Million hectares
MMbl Million barrels
Mt Million tonnes
MW Megawatt
MWh Megawatt-hours
MY Marketing year
NERC National Energy Regulating Commission
nm Not measurable
p.a. Per annum
pass-km Passenger kilometer
PPE Property, plant and equipment
ppt Percentage point
ROA Return on assets — a financial indicator showing the efficiency of use of corporate assets.
The indicator is calculated by dividing the net profit by the average value of total assets at the
beginning and at the end of the period
ROCE Return on capital employed — a financial indicator showing the efficiency of use of employed
capital. The indicator is calculated by dividing the EBIT by the sum of debt and equity
ROE Return on equity — a financial indicator showing the efficiency of use of capital invested by
shareholders. The indicator is calculated by dividing the net profit by the average value of
equity at the beginning and at the end of the period
RPK Revenue passenger kilometer
t Tonne
tcm Thousand cubic meters
TEU Twenty-foot equivalent unit
t-km Tonne kilometer
TW Terawatt
TWh Terawatt-hours
UAH Ukrainian hryvnia
y-o-y Year-over-year
YTD Year-to-date

U K R A I N E ’ S T O P 1 0 0 S TAT E - O W N E D E N T E R P R I S E S › I N T E R I M R E P O R T: 2 0 1 3 — 9 M O N T H S 2 0 1 4190

191

U K R A I N E ’ S T O P 1 0 0 S TAT E - O W N E D E N T E R P R I S E S › I N T E R I M R E P O R T: 2 0 1 3 — 9 M O N T H S 2 0 1 4192


Top Related