


Languages
Pages
Legal

The Effect of Processing Parameters on the Phytochemical Yield of Eurycoma Longifolia
Water Extract Yield
SAIFUL IRWAN ZUBAIRI PMIFT, Grad B.E.M. B. Eng. (Chemical-Bioprocess) (Hons.), UTMM. Eng. (Bioprocess), UTM
ROOM NO.: 2166, CHEMISTRY BUILDING,TEL. (OFF.): 03-89215828,FOOD SCIENCE PROGRAMME,CENTRE OF CHEMICAL SCIENCES AND FOOD TECHNOLOGY, UKM BANGI, SELANGOR

Outline
Introduction Tongkat Ali Background Tongkat Ali Extraction Experimental Design Results and Discussion Conclusion
Introduction
Global Market growing at 15-20% growth USD 70 Billion market for nutraceuticals USD 20 Billion market for phytomedicines
RM4.55 Billion Malaysian Market 80 % imported
Tongkat Ali, Eurycoma Longifolia Anti-Malarial, Aphrodisiac, Energy Boosting Malaysia-MIT Biotechnology Partnership Programme MAVCAP RM20 million invested

Standardisation
Fresh materials (roots, leaves, etc) (2)
Dried powder (10)
Non-standardized extract (25)
Standardized extract (100)
Phytomedicine
Freeze/spray dried extracts (40)
Valueadded
Fresh materials (roots, leaves, etc) (2)
Dried powder (10)
Non-standardized extract (25)
Standardized extract (100)
Phytomedicine
Freeze/spray dried extracts (40)
Valueadded
Source: Prof Dr. Zhari Ismail, USM
Engineering Questions
What are critical process parameters? How do we maximise yield? What are the economically optimal operating
conditions? How can we scale up the process? How do we ensure active ingredient is
present and in the correct amounts i.e. Standardisation

Processing Technology
Based on traditional method
Food Technology oriented
Need to overcome Limited concentration in raw material Solvent cost
More data needed for Optimisation Scale up

Objective and Scope
To develop a mathematical model for the mass transfer in Batch Solid Liquid Extraction of Tongkat Ali
Limited to Single stage water extracts Eurycomanone as marker Optimisation & Scale Up studies
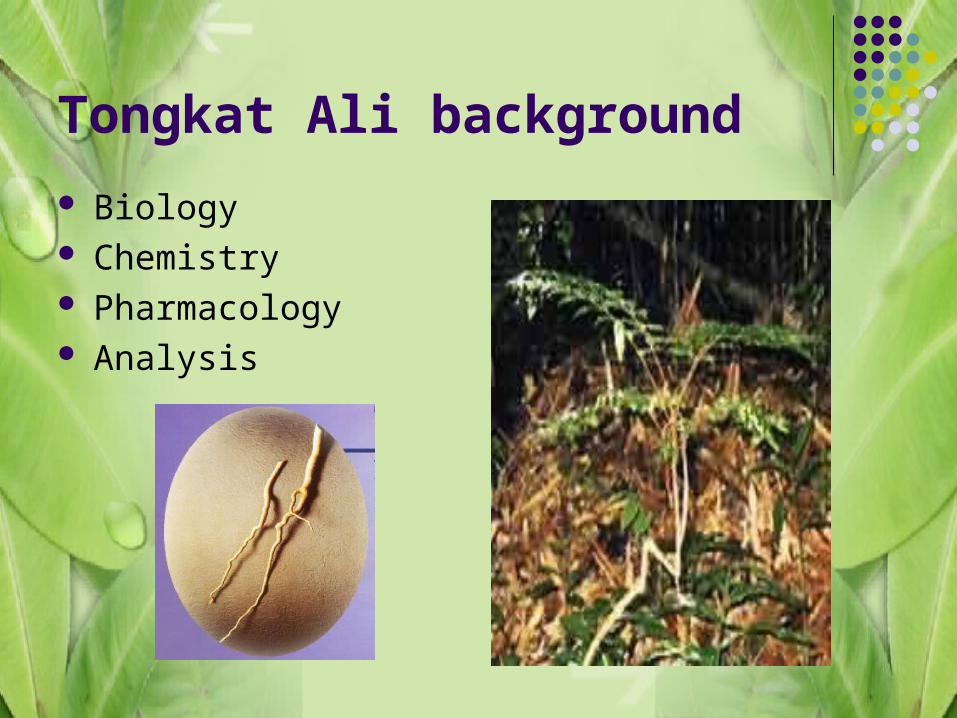
Tongkat Ali background
Biology Chemistry Pharmacology Analysis
Biology and Phytochemistry
Biology
Part of Simaroubaceae family Slow growing plant, 6-7 years to maturity
Phytochemistry
Quassinoids Major Component is Eurycomanone
Alkaloids Highest concentration is 9-Methoxycanthin-6-one

Alkaloids and Quassinoids
Me
Me
OH
CH 2
OH
O
O
OH
O
HOOH
O
H
HH
R
R R
R
R
R
S
R
S
S
MeO
O
N
N
9-Methoxycanthin-6-one Eurycomanone

PharmacologyTraditionally
Used for anti-diarrhoea, postpartum tonic, for treating wounds, boils, and syphilis, anti-pyretic, anti-malarial, anti-ulcer, energy boosting, and aphrodisiac applications.
Root boiled and decoction drunk
Scientifically
Definite anti-malarial properties (Kardono et al, 1991) Increases Testosterone production (Farzaturradiah, 1994) Possibly improves sperm quality (Farzaturradiah, 1994) Confirmed aphrodisiac effect as Viagra (Pihie, 2003) Anti tumour properties (Itokawa, 1992)

Analysis
Large number of compounds >20 Difficulty in identification and quantification
Methods used include: Thin Layer Chromatography UV-Vis Spectrophotometer High Performance Liquid Chromatography Liquid Chromatography/Mass Spectrometry

Compounds
Major quassinoids
eurycomanone longilactone eurycomalactone 15-acetyl-14-
hydroxyklaineanone 6-hydroxy-
eurycomalactone 14,15-
dihydroxyklaineanone 1,12,15-
triacetyleurycomanone
Major alkaloids
9,10-dimethoxycanthin-6-one
10-hydroxy-9-methoxycanthin-6-one
11-hydroxy-10-methoxycanthin-6-one
5,9-dimethoxycanthin-6-one
9-methoxy-3-methylcanthin-5,6-dione

Thin Layer Chromatography
Solvent mixture based on Zhari et al (1999) Only detects Alkaloids at 365nm Does not detect quassinoids
Rf=0.25Light Florescent Green
Rf=0.86Light Florescent Yellow- Green
Rf=0.69Light Florescent Blue
Rf=1.0Light Florescent Blue

UV Vis Spectrophotometer
Can be calibrated at 238 nm for extract concentration
y = 20.053x
R2 = 0.9943
0
5
10
15
20
25
30
35
0 0.2 0.4 0.6 0.8 1 1.2 1.4 1.6ABS
Con
cen
trat
ion
, C (
g/m
L)
x10-
5

High Performance Liquid Chromatography
Based on Chan et al (1998) First Peak is Eurycomanone, as confirmed by LC/MS

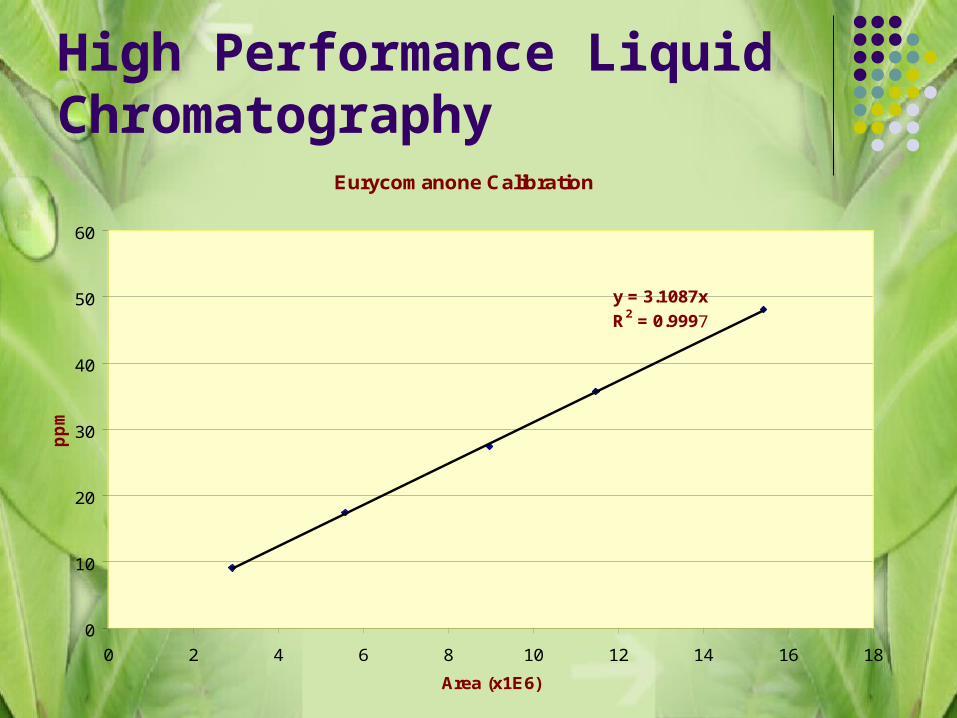
High Performance Liquid Chromatography
Eurycomanone Calibration
y = 3.1087x
R2 = 0.9997
0
10
20
30
40
50
60
0 2 4 6 8 10 12 14 16 18
Area (x1E6)
pp
m
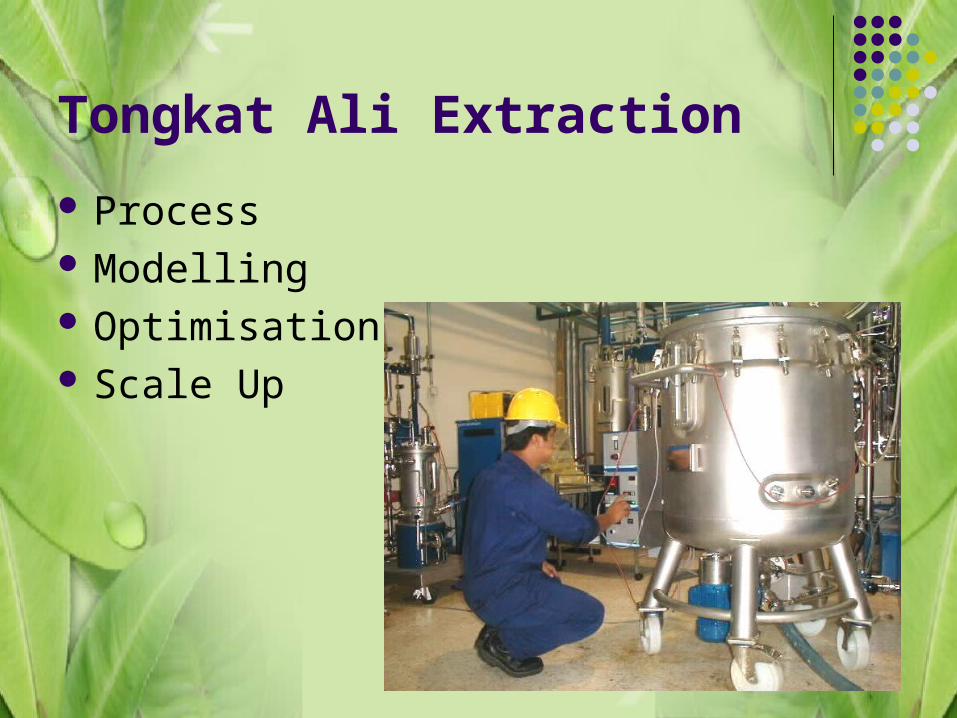
Tongkat Ali Extraction
Process Modelling Optimisation Scale Up

Process
Deionized Water
Extract+ fibre
Slurry
Water Extract
FILTER
EXTRACTOR
SPRAY DRYER
Hot Air
Dehydrated water extract(final product)
HOLDINGTANK
Tongkat Ali
Deionized Water
Extract+ fibre
Slurry
Water Extract
FILTER
EXTRACTOR
SPRAY DRYER
Hot Air
Dehydrated water extract(final product)
HOLDINGTANK
Tongkat Ali

ModellingIn solid liquid extraction 4 phenomena occur:
1. The solvent diffuses into the herb particle 2. The solute is dissolved by the solvent3. The solute diffuses to the surface of the herb particle 4. The solute is dissolved into the bulk solution
The extraction usually is dominated by 3 or 4
1
2
3
4
Cs C*
Cf

Factors affecting extraction
1. Solvent or solvent mixture utilised
2. Solvent to Raw Material Ratio
3. Raw Material Particle size
4. Temperature of Extraction
5. Duration of Extraction
6. Extraction vessel agitation speed
7. Extraction vessel volume

Mass Transfer Model
Yield/Concentration = f (Ratio, Particle Size, Temperature, Duration, Agitation, Volume)
Can be done through:-
Theoretical model Response Surface Methodology Artificial Neural Networks

Theoretical Model
Liquid Mass Transfer Coefficient, kL
Need to determine relationship between all factors
Mass Balance on vessel
Can be rewritten in a exponential form
Agitation increases Mass Transfer Coefficient, kL, to a maximum value
Diffusion of marker, DAB, in liquid is a critical factor as well
)( *fL
f CCAkdt
dCV
tV
kA
fof
ff eCC
CC

Theoretical Model
Solid Diffusion, Ds
If Solid Diffusion, Ds, is the controlling factor, the mass transfer coefficient, kL, is determined by it
Based on work by Schwartzberg and Chao (1982) and Spiro and Selwood (1984)
Estimates of Solid Diffusion for plant material is around 10-10-10-12 m2/s (Doulia et al, 2000)

Theoretical Model
Other factors
Based on Spiro and Selwood (1984) Partition Coefficient, K
Can estimate C*
Weight Fraction of marker/extract, x0
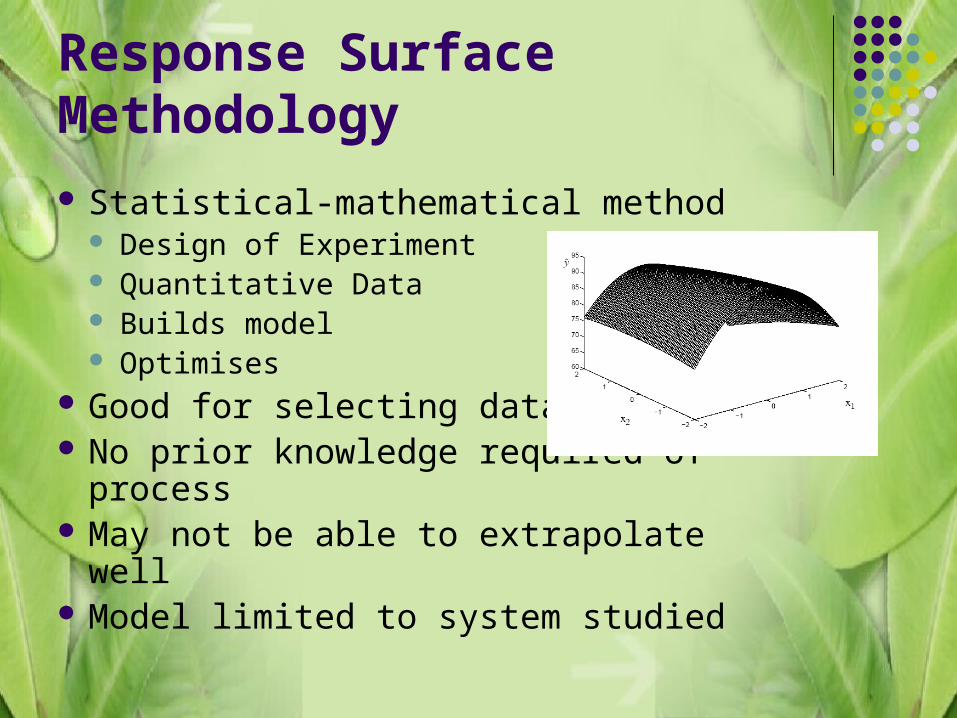
Response Surface Methodology
Statistical-mathematical method Design of Experiment Quantitative Data Builds model Optimises
Good for selecting data No prior knowledge required of process May not be able to extrapolate well Model limited to system studied

Artificial Neural Networks
Model data with unknown structure Good for complex models (de Villiers & Barnard,
1992) Can get good results with proper data selection and
treatment (Baratti et al, 1998) Limited in extrapolation

Optimisation
Method of choosing best operating point to maximise desired output i.e. yield or concentration or profit
Based on the function obtained from the Mass Transfer Modelling, it is likely that we will use One dimensional constrained optimisation, or Multivariable constrained optimisation

Scale Up
Produce an identical process result at a larger production rate i.e. larger extraction vessel
Need defined relationship i.e.
Two key methods
Basis Choose logical basis i.e. P/V Scale up based on chosen basis
Dimensional analysis (pi matrix/Buckingham method) Maintain geometrical similarity and identical relevant dimensionless
numbers i.e. Sherwood and Schmidt for Mass Transfer Reynolds for fluid flow
pilotplant DNDNV
P 2323

Dimensionless Numbers
Reynolds Number
Sherwood Number
Schmidt Number
AB
L
D
DkSh
NDDv aRe
ABDSc
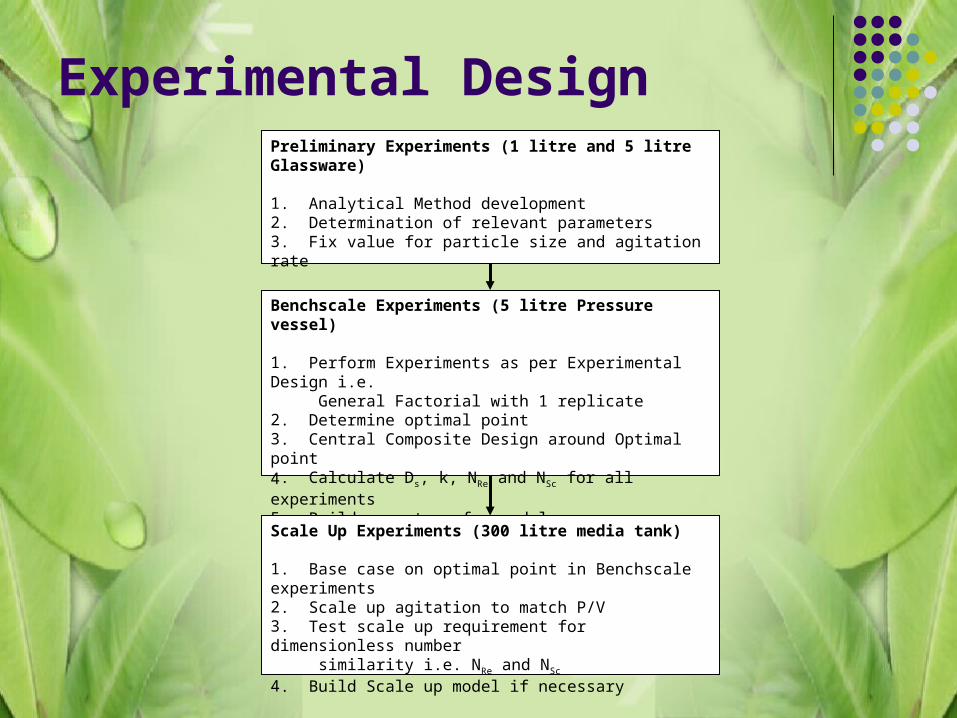
Experimental DesignPreliminary Experiments (1 litre and 5 litre Glassware)
1. Analytical Method development2. Determination of relevant parameters3. Fix value for particle size and agitation rate
Benchscale Experiments (5 litre Pressure vessel)
1. Perform Experiments as per Experimental Design i.e. General Factorial with 1 replicate 2. Determine optimal point3. Central Composite Design around Optimal point4. Calculate Ds, k, NRe and NSc for all experiments5. Build mass transfer model
Scale Up Experiments (300 litre media tank)
1. Base case on optimal point in Benchscale experiments2. Scale up agitation to match P/V3. Test scale up requirement for dimensionless number similarity i.e. NRe and NSc
4. Build Scale up model if necessary

Preliminary Experiments
Based on UV-Vis calibration to total extract weight
Ratio: 20:1, 30:1, 40:1, 50:1, 60:1 w/w
Duration: 30: 60: 90: 120: 150: 180: 210: 240: 270: 300 min
Particle size: Smooth (0.5 – 1.0 mm) and Rough (1 – 3.5 mm)
Volume: 1 dm3 (Small Scale) and 5 dm3(Large Scale)
Sample: 10g (Small Scale) and 50g (Large Scale)
Total of 10 experiments for each scale with multiple samplings

Preliminary Experiments
Hydrodistillation apparatus 5 litre small scale
Soxhlet extraction apparatus 1 litre small scale

Preliminary Experiments ResultsEffect of extraction duration on yield
Yield (%) versus time for same ratio (60:1g/g) at different scale and particle size
5
5.5
6
6.5
7
7.5
8
8.5
9
9.5
0 30 60 90 120 150 180 210 240 270 300
Time,t (min)
Yie
ld (
% g
/g)
Lab-Smooth Large-Smooth
Lab- Rough Large-Rough

Preliminary Experiments ResultsEffect of extraction duration on yield
Percent of extraction accomplished with time (large-scale sample with ratio of 20:1g/g for smooth particles)
0
10
20
30
40
50
60
70
80
90
100
0 30 60 90 120 150 180 210 240
Time, t (min)
Ex
tra
ctio
n A
cco
mp
lish
ed (
%)

Preliminary Experiments ResultsEffect of solvent ratio on yield
Yield versus ratio for 1hr sample at different scales and particle sizes
4
4.5
5
5.5
6
6.5
7
7.5
8
8.5
20 30 40 50 60
Ratio (g/g)
Yie
ld (
%)
1hr-Smooth (Lab) 1hr-Rough (Lab)1hr-Smooth (Large) 1hr-Rough (Large)
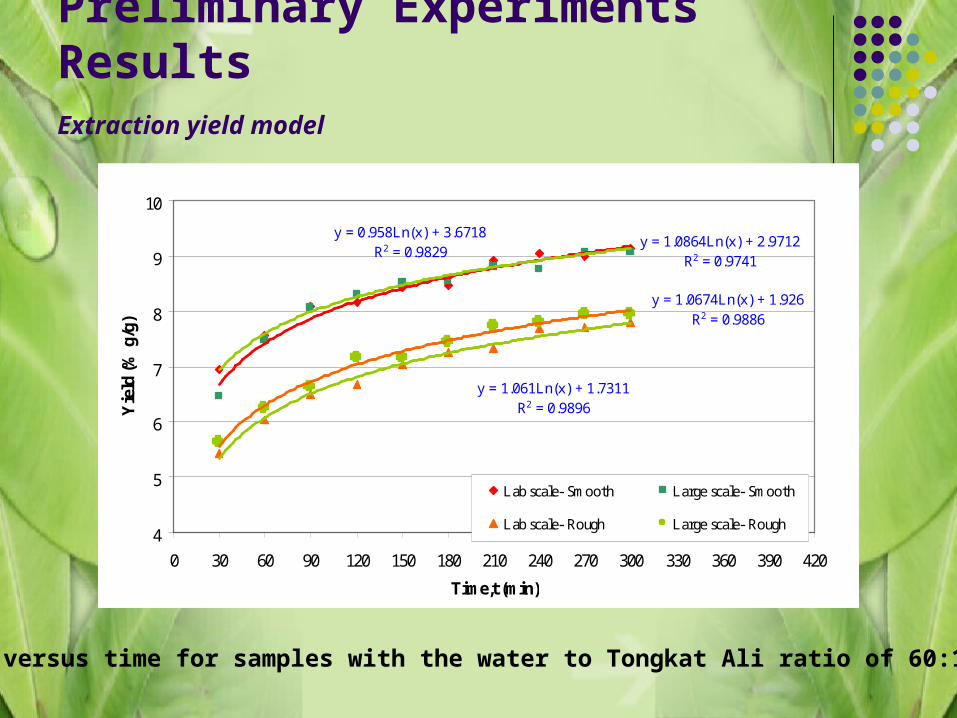
Preliminary Experiments ResultsExtraction yield model
Yield versus time for samples with the water to Tongkat Ali ratio of 60:1g/g
y = 1.0864Ln(x) + 2.9712R2 = 0.9741
y = 0.958Ln(x) + 3.6718R2 = 0.9829
y = 1.0674Ln(x) + 1.926R2 = 0.9886
y = 1.061Ln(x) + 1.7311R2 = 0.9896
4
5
6
7
8
9
10
0 30 60 90 120 150 180 210 240 270 300 330 360 390 420
Time,t (min)
Yie
ld (%
g/g
)
Lab scale- Smooth Large scale- Smooth
Lab scale- Rough Large scale- Rough

Preliminary Experiments Results Physical Parameters
Density of Tongkat Ali Root Dry: 0.2g/ml Wet: 0.6 g/ml
UV Absorbance Max: approximately 220-240 nm
Extract mass fraction of Tongkat Ali Root 8-10 % w/w
Fraction of Eurycomanone 0.5% of extract w/w
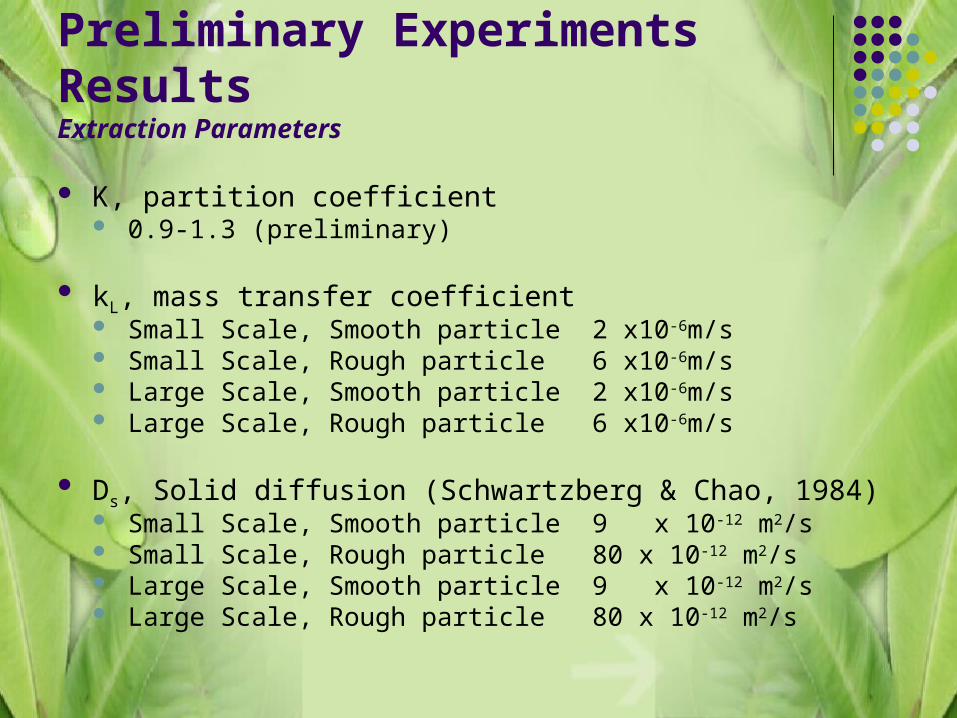
Preliminary Experiments Results Extraction Parameters
K, partition coefficient 0.9-1.3 (preliminary)
kL, mass transfer coefficient Small Scale, Smooth particle 2 x10⁻⁶m/s Small Scale, Rough particle 6 x10⁻⁶m/s Large Scale, Smooth particle 2 x10⁻⁶m/s Large Scale, Rough particle 6 x10⁻⁶m/s
Ds, Solid diffusion (Schwartzberg & Chao, 1984) Small Scale, Smooth particle 9 x 10-12 m2/s Small Scale, Rough particle 80 x 10-12 m2/s Large Scale, Smooth particle 9 x 10-12 m2/s Large Scale, Rough particle 80 x 10-12 m2/s

Preliminary Experiments Discussion
Longer duration leads to higher yield max at 4 to 5 hours 85 % extracted within 30 min and 90% in 1 hr
40:1 ratio best for Smooth and 50:1 ratio best for Rough particles Higher concentration gradient for mass transfer
Similar yield for Small Scale and Large Scale extractions
Higher yield for smaller particle More mass transfer area Lower solid diffusion factor
kL and DS, affected by particle size more than ratio Need to revise calculation on new data

Preliminary Experiments in Progress
Other preliminary work in progress
1. Fine tuning analysis method and apparatus2. Calibration of Standard3. Effect of agitation4. Effect of particle size5. Effect of Temperature6. Temperature effect of marker degradation
Optimal values of agitation and particle size will be used for benchscale experiments

Various particle sizes of Tongkat Ali raw material
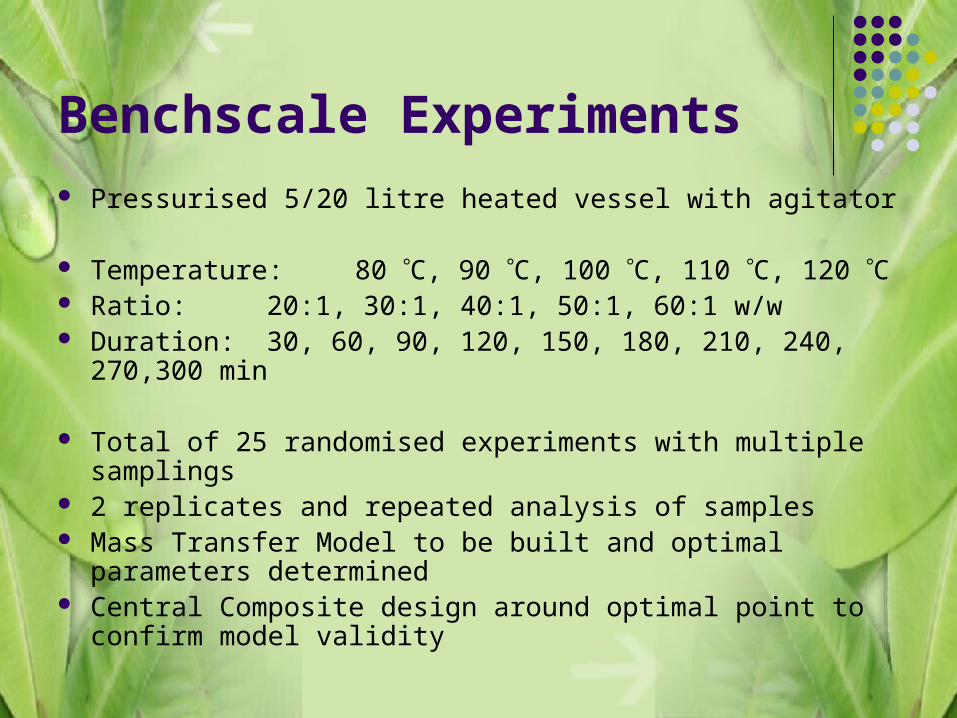
Benchscale Experiments Pressurised 5/20 litre heated vessel with agitator
Temperature: 80 C, 90 C, 100 C, 110 C, 120 C Ratio: 20:1, 30:1, 40:1, 50:1, 60:1 w/w Duration: 30, 60, 90, 120, 150, 180, 210, 240,
270,300 min
Total of 25 randomised experiments with multiple samplings 2 replicates and repeated analysis of samples Mass Transfer Model to be built and optimal parameters
determined Central Composite design around optimal point to confirm
model validity

Expected Benchscale Results
Mass Transfer Model Surface Response Model Optimal Operating Point
Properties Mass transfer coefficient, kL
Solid Diffusion, DS
Reynolds number, Re Sherwood number, Sh Schmidt number, Sc
Scale Up Experiments
500 litre Media Tank Based on Optimal Operating point in
Benchscale experiment Experiment repeated at larger scale with
central composite design around optimal point

500 litre Media Tank for Scale up studies

Expected Scale up Results
No significant difference in yield
Differences in duration due to heating process and mixing difference
Scale up relationship to be formed should there be a significance difference
ConclusionFuture Work
1. HPLC Calibration based on analysis from Universiti Sains Malaysia/FRIM
2. Determination of optimal particle size and agitation rate
3. Determination of the effects of temperature on extract degradation
4. The benchscale extraction studies
5. The scale up studies

ConclusionRecommendations
1. To acquire chemical standards or independent calibrations as soon as possible rather than to develop their own standards
2. To develop a theoretical or empirical model of the process as soon as possible as well as to take into account variations caused by organic material
3. To investigate the effects of multiple stage extraction processes to reduce utility usage
4. To perform economic optimisations to determine optimal economic process parameters
5. To simulate the process on a batch simulator such as SuperPro Designer to perform economic evaluation of various design options

Work PlanPhase\Month 2004 1 2 3 4 5 6 7 8 9 10 11 12
Preliminary X X X
Benchscale X X X X X X
Scale up X X X
Phase\Month 2005 1 2 3 4 5 6 7 8 9 10 11 12
Analysis of Data X X X
Experiments X X
Writing X X X X X X
Defence and Publications X X X

THANK YOU FOR YOUR KIND ATTENTION
QUESTION AND ANSWER SESSION
Contribution
Application of Engineering Methodology Physical and chemical parameters Optimal Extraction parameters General Optimization and Scale up method
for Malaysian Herbs
Top Related