


Languages
Pages
Legal


Bridgewater State UniversityVirtual Commons - Bridgewater State University
Watershed Access Lab Projects Watershed Access Lab
2005
The Ten Mile River Study
This item is available as part of Virtual Commons, the open-access institutional repository of Bridgewater State University, Bridgewater, Massachusetts.
Recommended CitationNorth Attleborough High School, North Attleborough, Massachusetts (2005). The Ten Mile River Study. In Watershed Access LabProjects. Project 25.Available at: http://vc.bridgew.edu/wal_projects/25

The Ten Mile River Study
North Attleboro High School
North Attleboro, MA

Nick Azzolina
Ray Coyle
Brandon Dalrymple
Brenton Dimock
Sean Duby
Amanda Flynn
Robyn Gimler
Completed By:
Robert Parkinson
Sam Plante
Katy Purdum**
Amanda Turcotte
Job White
Sarah Witkus
** PowerPoint Editor

Purpose of the Study
This study was done to test the Ten Mile
River. A series of chemical, physical, and
biological tests were performed at two
different sites along the river to see if the
Ten Mile River fits the Class B Warm Water
Standards as set forth by the State of
Massachusetts.

Ten Mile River
Watershed
Headwaters
Endpoint
Narragansett Bay

Sites of Cedar St. & Cottage St.
10/20/04 – 10/21/04
Cottage Street
Cedar Street

GIS Mapping of the Test Sites
High Density
Residential
Commercial
Forest
Route 95
Highway
Route 295
Highway

-0.70
-0.60
-0.50
-0.40
-0.30
-0.20
-0.10
0.00
1 2 3 4 5 6 7 8 9
Segment Length (ft)
De
pth
(ft
)
Average Depth: 0.53 feet
Width: 18 feetVolume of Water: 215.81 L/s
Cottage Street Stream Profile
10/20/04

Cedar Street Stream Profile
10/20/04
-1.20
-1.00
-0.80
-0.60
-0.40
-0.20
0.00
1 2 3 4 5 6 7 8 9
Length Across River in Feet
De
pth
of
Riv
er
in F
ee
t
Average Depth: 0.62 feet
Width: 19 feet
Volume of water: 147.63 L/s

10.5
11
11.5
12
12.5
13
2:00PM 5:00PM 8:00PM 11:00PM 2:00AM 5:00AM 8:00AM
Time (hours)
Tem
pe
ratu
re (
Ce
lsiu
s)
Cottage St.
Cedar St.
Comparison of Temperature
Cottage St. and Cedar St.
10/20/04-10/21/04
*MA Class B Standards state that the temperature shall not exceed
28.3°C

0
2
4
6
8
10
12
14
16
18
9:00AM 12:00AM 3:00PM 6:00PM 9:00PM 12:00AM 3:00AM 6:00AM 9:00AM
Time (hours)
Tem
pera
ture
(Cel
sius
))
Comparison of Temperature
Cedar St.
10/9/03-10/10/03 and 10/20/04-10/21/04
2003 2004
*MA Class B Standards state that the temperature shall not exceed
28.3°C

Comparison of Dissolved Oxygen
Cottage St. and Cedar St.
10/20/04 - 10/21/04
7.9
8
8.1
8.2
8.3
8.4
8.5
8.6
2:00
PM
4:00
PM
6:00
PM
8:00
PM
10:00
PM
12:00
AM
2:00
AM
4:00
AM
6:00
AM
8:00
AM
Time (hours)
Dis
so
lve
d O
xyg
en
(m
g/L
)
*MA Class B Standards require Dissolved Oxygen to be 5.0 mg/L or
higher
Cottage Street
Cedar Street

Comparison of Dissolved Oxygen
Cedar St.
10/9/03 - 10/10/03 and 10/20/04 - 10/21/04
7.8
7.9
8
8.1
8.2
8.3
8.4
8.5
8.6
8.7
9:00
AM
11:00
AM
1:00
PM
3:00
PM
5:00
PM
7:00
PM
9:00
PM
11:00
PM
1:00
AM
3:00
AM
5:00
AM
7:00
AM
9:00
AM
Time (hours)
Dis
so
lve
d O
xyg
en
(m
g/L
)
2003
2004
*MA Class B Standards require Dissolved Oxygen to be 5.0 mg/L or
higher

70
72
74
76
78
80
82
2:00PM 5:00PM 8:00PM 11:00PM 2:00AM 5:00AM 8:00AM
Time (hours)
Pe
rce
nta
ge
of D
isso
lve
d O
xyg
en
Cedar Street
Cottage Street
Comparison of the Percentage of Dissolved Oxygen
Cottage St. and Cedar St.
10/20/04 – 10/21/04
*MA Class B Standards state that the percentage of Dissolved
Oxygen should not be lower than 60%.

66
68
70
72
74
76
78
80
82
84
86
9:00AM 12:00P 3:00PM 6:00PM 9:00PM 12:00A 3:00AM 6:00AM 9:00AM
Time (hours)
Pe
rce
nta
ge
of
Dis
so
lve
d O
xyg
en
Comparison of the Percentage of Dissolved Oxygen
Cedar St.
10/9/03 – 10/10/03 and 10/20/04 – 10/21/04
2003
2004
*MA Class B Standards state that the percentage of Dissolved
Oxygen should not be lower than 60%.

Comparison of Temperature and Percentage of
Dissolved Oxygen at Cottage Street
10/20/04 – 10/21/04
73.0%
74.0%
75.0%
76.0%
77.0%
78.0%
79.0%
80.0%
81.0%
2:00
PM
4:00
PM
6:00
PM
8:00
PM
10:00
PM
12:00
AM
2:00
AM
4:00
AM
6:00
AM
8:00
AM
Time (hours)
Pe
rce
nta
ge
of
Dis
so
lve
d
Ox
yg
en
11.20
11.40
11.60
11.80
12.00
12.20
12.40
12.60
12.80
13.00
Te
mp
era
ture
(C
els
ius
)
Dissolved Oxygen
Temperature

Comparison of Temperature and Percentage of
Dissolved Oxygen at Cedar Street
10/20/04 – 10/21/04
70.0%
71.0%
72.0%
73.0%
74.0%
75.0%
76.0%
77.0%
78.0%
79.0%
2:00
PM
4:00
PM
6:00
PM
8:00
PM
10:00
PM
12:00
AM
2:00
AM
4:00
AM
6:00
AM
8:00
AM
Time (hours)
Pe
rce
nta
ge
of D
isso
lve
d O
xyg
en
10.80
11.00
11.20
11.40
11.60
11.80
12.00
12.20
12.40
12.60
12.80
Tem
pe
ratu
re (
Ce
lsiu
s)
Dissolved Oxygen
Temperature

6.72
6.74
6.76
6.78
6.80
6.82
6.84
6.86
6.88
6.90
6.92
2:00
PM
4:00
PM
6:00
PM
8:00
PM
10:00
PM
12:00
AM
2:00
AM
4:00
AM
6:00
AM
8:00
AM
Time
pH
Cottage St.
Cedar St.
Comparison of pH
Cedar St. and Cottage St
10/20/04 - 10/21/04
*MA Class B Standards require pH values to be between 6.5 and 8.3
6.6
6.65
6.7
6.75
6.8
6.85
6.9
9:00
AM
12:0
0 PM
3:00
PM
6:00
PM
9:00
PM
12:0
0 AM
3:00
AM
6:00
AM
9:00
AM
Time (Hours)
pH
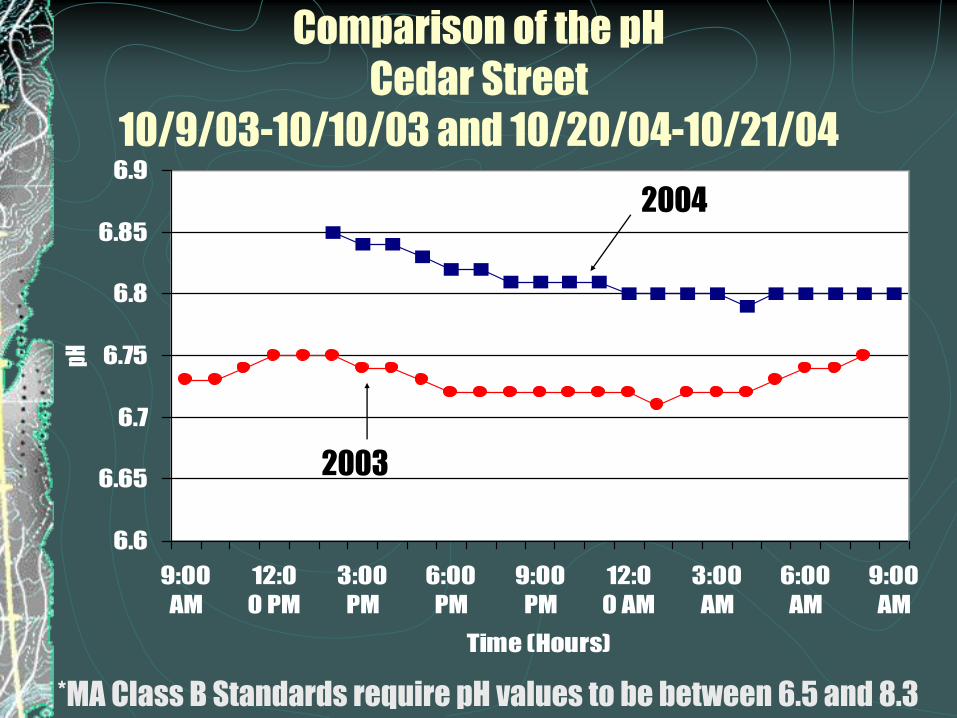
Comparison of the pH
Cedar Street
10/9/03-10/10/03 and 10/20/04-10/21/04
2003
2004
*MA Class B Standards require pH values to be between 6.5 and 8.3

Ten Mile River Temperature °C pH Dissolved Oxygen % Dissolved Oxygen
Range Average Range Average Range Average Range Average
Cottage Street 11.85-12.87 12.46 6.88-6.91 6.89 8.24-8.49 8.34 75.90-79.80 77.77
Cedar Street 11.52-12.71 12.16 6.79-6.85 6.81 7.98-8.36 8.07 73.40-78.30 74.70
Comparison of Temperature, pH, Dissolved Oxygen,
and the Percentage of Dissolved Oxygen
Cottage St. and Cedar St.
10/20/04 – 10/21/04

0.00
0.05
0.10
0.15
0.20
0.25
0.30
0.35
0.40
0.45
2:00PM 4:00PM 8:00PM 11:00PM 2:00AM 4:00AM 6:00AM 8:00AM
Time (hours)
N-N
O3
(m
g/
L)
Nitrogen-Nitrate Comparison
Cottage St. and Cedar St.
10/20/04 – 10/21/04
*MA Class B Values require N-NO3 values to be less than 1 mg/L
The detection limit is 0.01 mg/L
Cottage St Cedar St.

0
2
4
6
8
10
12
9:00
AM
1:00
PM
3:00
PM
6:00
PM
8:00
PM
10:00
PM
1:00
AM
3:00
AM
5:00
AM
7:00
AM
Time (Hours)
Nitr
ogen
-Nit
rate
(mg/
L)
Comparison of Nitrogen-Nitrate
Cedar Street
10/9/03-10/10/03 and 10/20/04 – 10/21/04
2004
2003
*MA Class B Values require N-NO3 values to be less than 1.0 mg/L
The detection limit is 0.1 mg/L

0
0.005
0.01
0.015
0.02
0.025
0.03
2
pm
2
pm
4
pm
6
pm
8
pm
10
pm
10
pm
12
am
2
am
2
am
4
am
4
am
6
am
8
am
8
am
Time (hours)
So
lub
le R
ea
cti
ve P
ho
sp
ho
rus
(m
g/L
)
Comparison of Soluble Reactive Phosphorus
Cottage St. and Cedar St
10/20/04 – 10/21/04
*MA Class B Standards require SRP levels to be under 0.1 mg/L
The detection limit is 0.008 mg/L
Cedar St.
Cottage St.

0
0.02
0.04
0.06
0.08
0.1
0.12
0.14
9:00
AM
11:00
AM
1:00
PM
3:00
PM
5:00
PM
7:00
PM
9:00
PM
11:00
PM
Time (hours)
Solu
ble
Reac
tive
Pho
spho
rus(
Mg/
L)
2003
2004
Comparison of Soluble Reactive Phosphorus
Cedar St.
10/09/03-10/10/03 and 10/20/04-10/21/04
*MA Class B Standards require SRP levels to be under 0.1 mg/L
The detection limit is 0.008 mg/L

Ten Mile N-NO3 SRP Load
River Range Average Range Average N Load g/day P Load g/day
Cottage St. 0.20/0.30 0.8 0.001/0.010 0.0055 4661.45 55.94
Cedar St. 0.40/0.40 0.4 0.010/0.030 0.0065 4719.54 242.35
Comparison of Soluble Reactive Phosphorus
and Nitrogen-Nitrate at Cottage St. and Cedar St.
10/20/04 – 10/21/04
280
285
290
295
300
305
310
315
320
325
330
335
2pm 4pm 6pm 8pm 10pm 12am 2am 4am 6am 8am
Time (hrs)
Sp.C
ond.
(uS/
cm) Cottage St.
Cedar St.
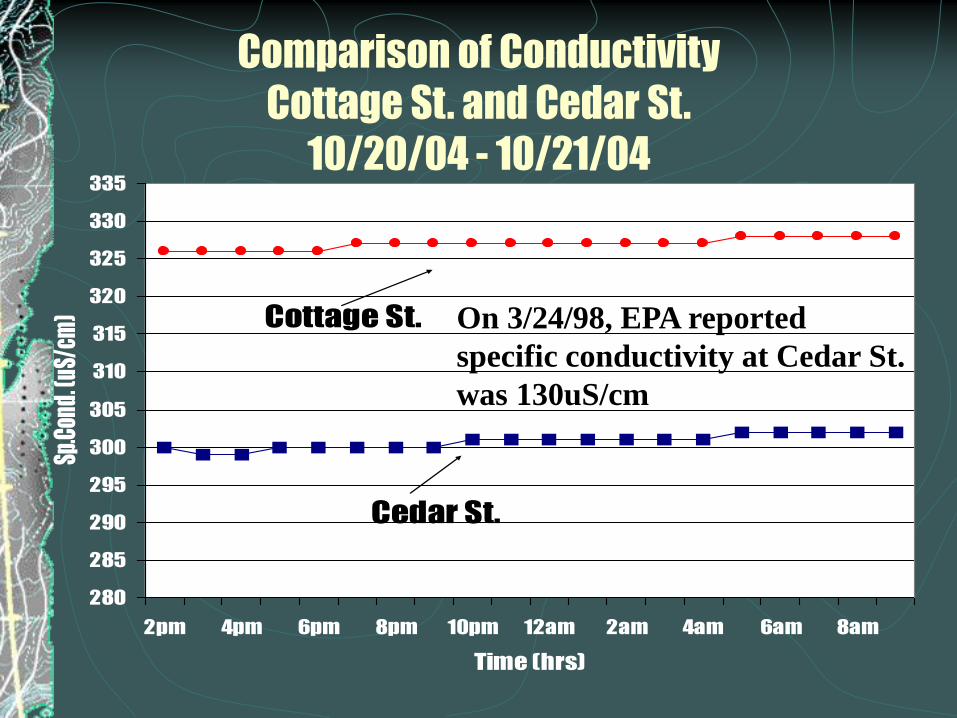
Comparison of Conductivity
Cottage St. and Cedar St.
10/20/04 - 10/21/04
On 3/24/98, EPA reported
specific conductivity at Cedar St.
was 130uS/cm

Site Name ml Filtered FC Filter Count FC colonies
per 100 ml
Cottage St. 100 ml 23 23
Class B 100 ml 23 23
Fecal levels 10 ml 2 20
should not 10 ml 0 0
exceed 1 ml 0 0
200 Colonies per 100 mL 1 ml 0 0
Cedar St. 100 ml 32 32
Class B 100 ml 28 28
Fecal levels 10 ml 3 30
should not 10 ml 3 30
exceed 1 ml 0 0
200 Colonies per 100 mL 1 ml 0 0
Fecal Coliform Chart
Cottage Street and Cedar St.
10/20/04 – 10/21/04
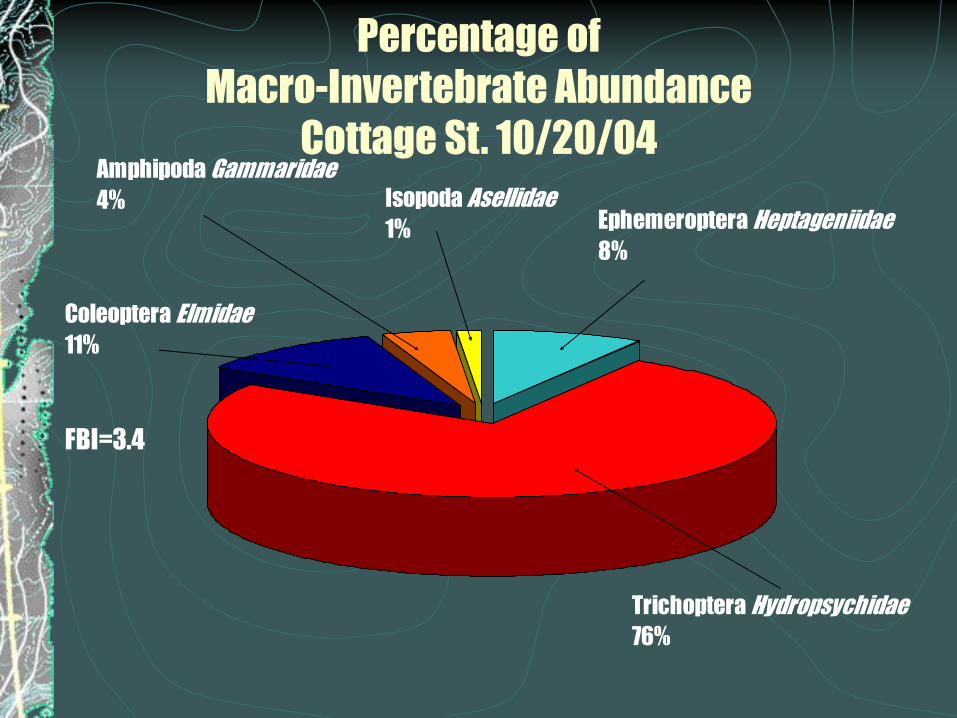
FBI=3.4
Ephemeroptera Heptageniidae
8%
Coleoptera Elmidae
11%
Trichoptera Hydropsychidae
76%
Amphipoda Gammaridae
4% Isopoda Asellidae
1%
Percentage of
Macro-Invertebrate Abundance
Cottage St. 10/20/04

Ephemeroptera Heptageniidae
2.89%
Megaloptera Corydalidae
1.2%
Trichoptera Philopotamidae
1.2%
Trichoptera Hydropsychidae
46.2%
Amphipoda Gammaridae
46.8%
Percentage of
Macro-Invertebrate Abundance
Cedar St. 10/20/04
FBI 3.2

Possible Reasons for the Results
There were 1.11 inches of rain in the days prior to our study.
There are bridges located near our two sites and runoff from
those bridges flows into the river.
The rivers banks are highly urbanized, meaning that there
are many houses and buildings surrounding the river.
Cottage St. site had trees on one side, grass on the other.
Cottage St. site was channelized with concrete that was
eroding.
Cottage St. site was missing a riparian zone to stop any
fertilizers from entering the river.
Geese populations are a large problem in North Attleboro at
Falls Pond, upstream from Cottage St.
Top Related