

Languages
Pages
Legal


FINAL REPORT
Supporting Report – 2Local Action Plan
JAPAN INTERNATIONAL COOPERATION AGENCY
YACHIYO ENGINEERING CO., LTD.
EX CORPORATION
MINISTRY OF HOUSING AND LOCAL GOVERNMENT
THE STUDY ONNATIONAL WASTE MINIMISATION
IN MALAYSIA
JULY 2006
MALAYSIA

EXCHANGE RATE
US$1.00 = RM 3.629 (May 2006) US$1.00 = Yen 114.58 (May 2006)

The Study on National Waste Minimisation in Malaysia Final Report Supporting Report - 2
The Study on National Waste Minimisation in Malaysia
Final Report
FINAL REPORT COMPOSITION
The Final Report is composed of the following:
1. Summary
2. Volume I – Main Report
3. Volume II – Guidelines
4. Volume III – Pilot Projects
5. Supporting Report – 1 Additional Information
6. Supporting Report – 2 Local Action Plan
This Report is “Supporting Report-2 Local Action Plan”.


The Study on National Waste Minimisation in Malaysia Final Report Supporting Report - 2
i
Table of Contents
Table of Contents Abbreviations
Part 1 Introduction Part 2 Issues and Measures for the preparation of Local Action Plan (LAP) Part 3 Local Action Plan in MB Miri Part 4 Local Action Plan in MP Pulau Pinang Part 5 Local Action Plan in MD Kinta Selatan Part 6 Local Action Plan in MP Subang Jaya

The Study on National Waste Minimisation in Malaysia Final Report Supporting Report - 2
ii
Abbreviations AFSB Alam Flora Sdn Bhd A/P Action Plan CBO Community Based Organisation C/P Counterpart DB Dewan Bandaraya (City Hall) DBKL Dewan Bandaraya Kuala Lumpur (Kuala Lumpur City Hall) DBKU Dewan Bandaraya Kuching Utara (Kuching North City Hall) DSWM Division of Solid Waste Management EPU Economic Planning Unit GOM Government of Malaysia G3RS Guidelines for Enhancement of 3Rs Activities in School IEC Information, Education and Communication IMS Information Management System JICA Japan International Cooperation Agency LA Local Authority LAP-WM Local Action Plan on Waste Minimisation LGD Local Government Department MB Majlis Bandaraya (City Council) MBJB Majlis Bandaraya Johor Bahru (Johor Bahru City Council) MBKS Majlis Bandaraya Kuching Selatan (Kuching South City Council) MBM Majlis Bandaraya Miri (Miri City Council) MBMB Majlis Bandaraya Melaka Bersejarah (Melaka City Council) MD Majlis Daerah (District Council) MDK Majlis Daerah Kerian MDKS Majlis Daerah Kinta Selatan (South Kinta District Council) MHLG Ministry of Housing and Local Government MIDA Malaysian Industrial Development Authority MITI Ministry of International Trade and Industry MOE Ministry of Education MONRE Ministry of Natural Resources and Environment MP Majlis Pernadaran (Municipal Council) M/P Master Plan MPK Majlis Perbandaran Kuantan (Kuantan Municipal Council) MPPP Majlis Perbandaran Pulau Pinang (Penang Island Municipal Council) MPPJ Majlis Perbandaran Petaling Jaya (Petaling Jaya Municipal Council) MPSJ Majlis Perbandaran Subang Jaya (Subang Jaya Municipal Council) MRF Material Recovery Facility MSW Municipal Solid Waste NCP3R National Children’s Programme on 3Rs NGO Non Governmental Organisation NRD National Recycling Day NREB National Resources and Environment Board NRP National Recycling Programme NSP National Strategic Plan on Solid Waste Management OECD Organisation for Economic Co-operation and Development OPP3 Third Outline Perspective Plan PDM Project Design Matrix PP Pilot Project PR Public Relations PWD Public Works Department RA Residents Association

The Study on National Waste Minimisation in Malaysia Final Report Supporting Report - 2
iii
R&D Research and Development RIC Recycling Information Centre RM-8 Eighth Malaysian Plan RM-9 Ninth Malaysian Plan RNU Recycling Networking Unit SND Stakeholders’ Networking Database SS Source Separation SW Solid Waste SWM Solid Waste Management SWM Act Solid Waste Management Act SWMD Solid Waste Management Department SWMSB Southern Waste Management Sdn Bhd TWG Technical Working Group WM Waste Minimisation WMU Waste Minimisation Unit WM-M/P Waste Minimisation Master Plan 3RAG 3Rs Action Guide


PART 1
INTRODUCTION

The Study on National Waste Minimisation in Malaysia Final Report Supporting Report - 2
1-1
Part 1 INTRODUCTION
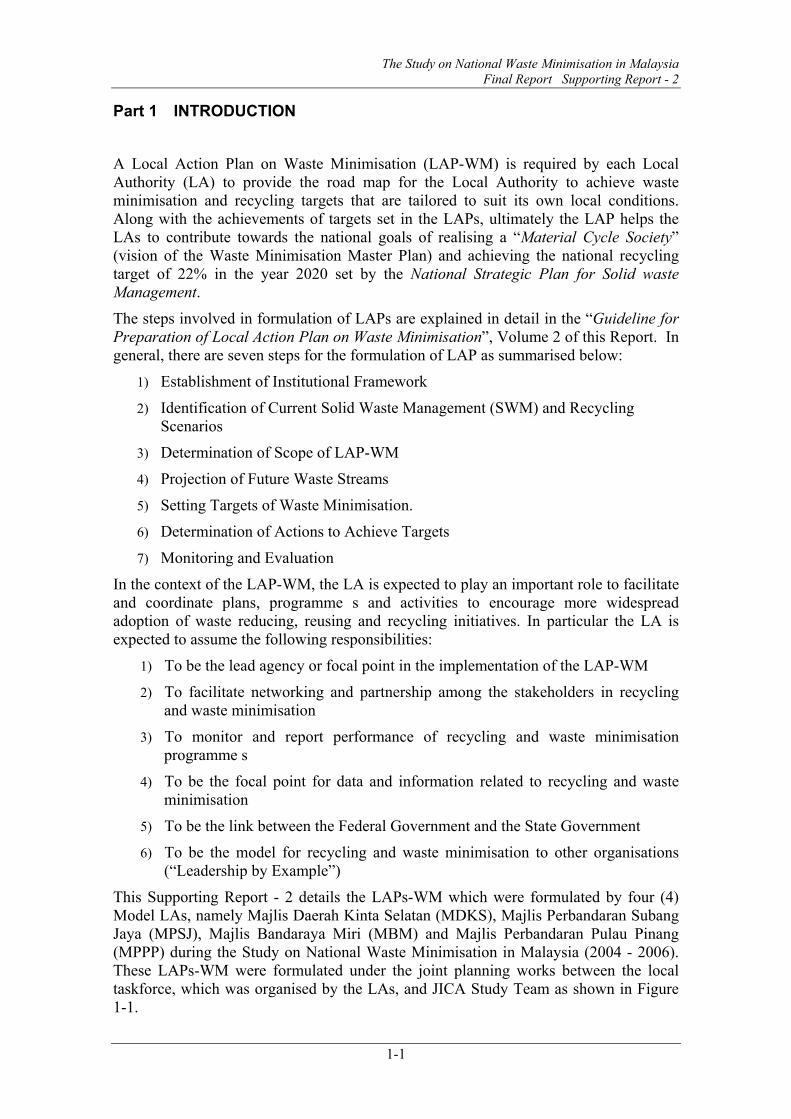
A Local Action Plan on Waste Minimisation (LAP-WM) is required by each Local Authority (LA) to provide the road map for the Local Authority to achieve waste minimisation and recycling targets that are tailored to suit its own local conditions. Along with the achievements of targets set in the LAPs, ultimately the LAP helps the LAs to contribute towards the national goals of realising a “Material Cycle Society” (vision of the Waste Minimisation Master Plan) and achieving the national recycling target of 22% in the year 2020 set by the National Strategic Plan for Solid waste Management.
The steps involved in formulation of LAPs are explained in detail in the “Guideline for Preparation of Local Action Plan on Waste Minimisation”, Volume 2 of this Report. In general, there are seven steps for the formulation of LAP as summarised below:
1) Establishment of Institutional Framework
2) Identification of Current Solid Waste Management (SWM) and Recycling Scenarios
3) Determination of Scope of LAP-WM
4) Projection of Future Waste Streams
5) Setting Targets of Waste Minimisation.
6) Determination of Actions to Achieve Targets
7) Monitoring and Evaluation
In the context of the LAP-WM, the LA is expected to play an important role to facilitate and coordinate plans, programme s and activities to encourage more widespread adoption of waste reducing, reusing and recycling initiatives. In particular the LA is expected to assume the following responsibilities:
1) To be the lead agency or focal point in the implementation of the LAP-WM
2) To facilitate networking and partnership among the stakeholders in recycling and waste minimisation
3) To monitor and report performance of recycling and waste minimisation programme s
4) To be the focal point for data and information related to recycling and waste minimisation
5) To be the link between the Federal Government and the State Government
6) To be the model for recycling and waste minimisation to other organisations (“Leadership by Example”)
This Supporting Report - 2 details the LAPs-WM which were formulated by four (4) Model LAs, namely Majlis Daerah Kinta Selatan (MDKS), Majlis Perbandaran Subang Jaya (MPSJ), Majlis Bandaraya Miri (MBM) and Majlis Perbandaran Pulau Pinang (MPPP) during the Study on National Waste Minimisation in Malaysia (2004 - 2006). These LAPs-WM were formulated under the joint planning works between the local taskforce, which was organised by the LAs, and JICA Study Team as shown in Figure 1-1.

The Study on National Waste Minimisation in Malaysia Final Report Supporting Report - 2
1-2
A/P Formulation
Figure 1-1 Organisation Framework for the A/P Formulations
Based on the experiences gained from preparing the LAPs-WM, a “Guideline for Preparation of Local Action Plan on Waste Minimisation” was prepared and is explained in detail in Part 3, Volume 2 of the Draft Final Report (2nd Edition). On the other hand, the complete documents of LAPs-WM formulated by the Model LAs are attached in Parts 2, 3, 4 and 5 of this Supporting Report-2. The contents of the LAPs-WM formulated were based on the following outline:
Chapter 1 (Introduction)
This chapter describes the background, objectives and scope of the action plans, including the organisation framework for the action plan formulation, as well as the role of all relevant stakeholders in the LA.
Chapter 2 (State of Waste Management and Recycling in the LAs)
This chapter describes the background information and available data on existing solid waste management and recycling system in the LA. The information on SMW includes the institutional frameworks, service areas, waste generation rate and compositions, waste storage, collection, treatment and disposal systems etc. On the other hand, information on recycling includes some history and background of recycling practices in the LA, types of recycling players involved, types and amount of recyclable materials collected, performance of recycling in the LA, issues and problems faced with some proposed countermeasures etc.
Local Authorities
Local Taskforce Members
JICA Study Team
Majlis Perbandaran Subang Jaya (MPSJ) Majlis Perbandaran Pulau
Pinang (MPPP) Majlis Daerah Kinta
Selatan (MDKS) Majlis Bandaraya Miri
(MBM)
Concessionaires Other relevant governmental
agencies (such as NREB) Recycling players (industries,
collectors, traders etc.) NGOs, CBOs etc. Some private entities
The Study on National Waste Minimisation in Malaysia Final Report Supporting Report - 2
1-3
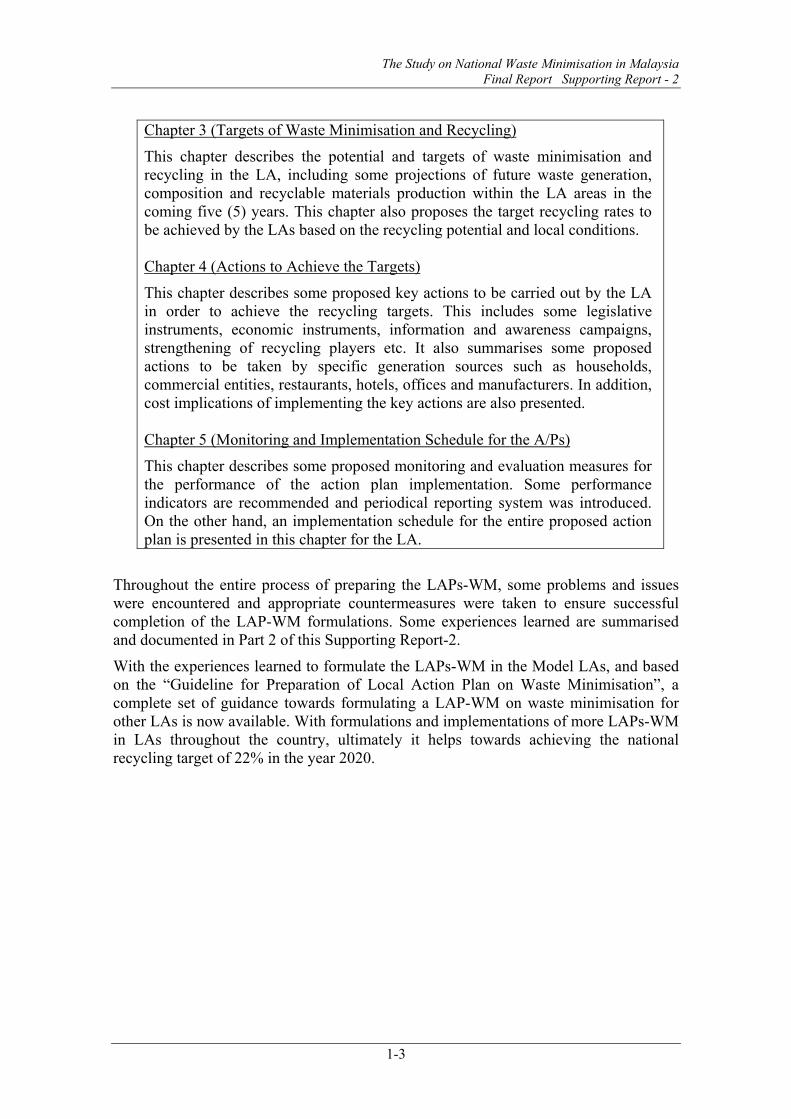
Chapter 3 (Targets of Waste Minimisation and Recycling)
This chapter describes the potential and targets of waste minimisation and recycling in the LA, including some projections of future waste generation, composition and recyclable materials production within the LA areas in the coming five (5) years. This chapter also proposes the target recycling rates to be achieved by the LAs based on the recycling potential and local conditions. Chapter 4 (Actions to Achieve the Targets)
This chapter describes some proposed key actions to be carried out by the LA in order to achieve the recycling targets. This includes some legislative instruments, economic instruments, information and awareness campaigns, strengthening of recycling players etc. It also summarises some proposed actions to be taken by specific generation sources such as households, commercial entities, restaurants, hotels, offices and manufacturers. In addition, cost implications of implementing the key actions are also presented. Chapter 5 (Monitoring and Implementation Schedule for the A/Ps)
This chapter describes some proposed monitoring and evaluation measures for the performance of the action plan implementation. Some performance indicators are recommended and periodical reporting system was introduced. On the other hand, an implementation schedule for the entire proposed action plan is presented in this chapter for the LA.
Throughout the entire process of preparing the LAPs-WM, some problems and issues were encountered and appropriate countermeasures were taken to ensure successful completion of the LAP-WM formulations. Some experiences learned are summarised and documented in Part 2 of this Supporting Report-2.
With the experiences learned to formulate the LAPs-WM in the Model LAs, and based on the “Guideline for Preparation of Local Action Plan on Waste Minimisation”, a complete set of guidance towards formulating a LAP-WM on waste minimisation for other LAs is now available. With formulations and implementations of more LAPs-WM in LAs throughout the country, ultimately it helps towards achieving the national recycling target of 22% in the year 2020.

PART 2
Issues and Measures for the Preparation of LAP


The Study on National Waste Minimisation in Malaysia Final Report Supporting Report - 2
2-1
Part 2 ISSUES AND MEASURES FOR THE PREPARATION OF LAP
Throughout the entire process of preparing the LAPs-WM in the Model Local Authorities (LAs), some issues have been identified and lessons have been learnt as described hereafter.
2.1 Consent from the Top Management It is crucial to have the consent of the top management of the LA (such as the Council’s President) to formulate and implement the LAP-WM. The top management’s recognition on the benefits and importance of implementing a LAP-WM is sometimes lacking, due to information gap and priority for implementing some other plans instead of the LAP-WM on waste minimisation.
In the case of this study, top managements’ consents from all the Model LAs were obtained without much problem due to the fact that these LAs were selected by MHLG based on certain criteria which included willingness to participate in this programme and the advantage that funding of some of the required expenses was shouldered by the study. However, based on several meetings and discussions with other LAs, it was recognised that in many cases, consent from the top management will be one of the biggest obstacle for implementing a LAP-WM in a LA. A few major factors have been identified as common concerns by the top management:
• Why is there a necessity for the LAs to have a LAP-WM?
• How much budget is required for the formulation and implementation of the LAP-WM?
• Is the LA having sufficient manpower for the formulation and implementation of the LAP-WM?
• Are the officers of the LA technically capable to carry out such LAP-WM?
• What are the consequences of implementing the LAP-WM to the public, industries, etc?
It is therefore necessary to present a comprehensive proposal to the top management of the LA clearly outlining the importance and benefits of implementing 3Rs and waste minimisation. Prior to this proposal, of course commitments from dedicated officers are crucial in the preparatory works for such a proposal.
In addition, it was recognised that the Model LAs should play a role to convey information about the importance and benefits of implementing a LAP-WM in the Model LA to the top management of other LAs. It is believed that this will be more effective to convince the top management because of the “peer pressure” that comes from another LA.
2.2 Lack of Manpower In many LAs, it was found that there are only a few officers that are taking responsibility on matters related to solid waste management. This is particularly evident in LAs where the concessionaire is providing the entire solid waste management services in the council.
In this matter, it was found that effective involvement of the limited human resources is very important. One of the effective measures to encourage the person

The Study on National Waste Minimisation in Malaysia Final Report Supporting Report - 2
2-2
in-charge is to establish the Waste Minimisation Unit (WMU) and appoint the personnel in WMU.
In addition, an inter-departmental committee could be set up for the formulation of LAP-WM, which would involve more people from the LA. Some departments that were involved in the formulation of LAPs-WM in the Model LAs were:
• Department of Public / Environmental Health
• Department of Urban Services
• Department of Licensing
• Department of Enforcement
• Department of Town Planning
• Department of Social and Community Development
Besides, some other stakeholders on waste minimisation and recycling who are active in the LA should be invited to participate in the formulation of LAPs-WM that more ideas from different players can be obtained.
2.3 Lack of Commitments One of the problems faced in some LAs is the commitment from the officers in charge of the formulation of LAP-WM. In many cases, the commitments were found only from one or two dedicated officers while the others in the team or committee showed very low commitment and lack of interest. The lack of commitment can cause unnecessary delay of works and subsequently affect the overall process of LAP-WM formulation and implementation.
One of the possible ways to increase the commitments is to attract the interest of the officers by creating more attractive activities, such as exchanging visits amongst the stakeholders, etc instead of only having internal roundtable discussions. In addition, the commitment and leadership of the “chief officer” is also crucial so that the overall performance of the team or committees is well managed.
2.4 Lack of Expertise It was also commonly found that the officers of the LAs are lacking in expertise and experience in issues related to waste minimisation and recycling. During the Study, for the Model LAs, the process of LAP-WM formulations were guided and assisted by the experts of the study team. In the future it is important that the other LAs, refer to the “Guideline for Formulation of Local Action Plan on Waste Minimisation” so that the responsible officers are guided towards the formulation of LAP-WM.
In the long run, more capacity building and training programmes could be carried out for the LA officers on waste minimisation and recycling issues by MHLG. A “Core Team” consisting of model LAs and MHLG officials who participated in the JICA Study, when formed will have a role to disseminate experiences of the Study; i.e. preparation of LAP-WM etc to other LA officials.
2.5 Lack of Budget Lacking of budget or financial constraint is another major problem faced in many LAs especially on matters related to solid waste management, waste minimisation and recycling.

The Study on National Waste Minimisation in Malaysia Final Report Supporting Report - 2
2-3
At the formulation stage, some budget for LAP-WM formulation is required especially in cases where the data on the existing conditions of the LA is not available or needs to be updated through surveys, such as waste generation data, composition data, etc. From the experience of formulating LAPs-WM in the Model LAs, it was found that the overall budget required can be minimised, except if some primary data collection needs to be done. In general, some required budget items (excluding the budget required for data collection) include:
• Budget for organisation of meetings, discussions and workshops etc with the stakeholders.
• Budget for travelling to surrounding areas within the LA to investigate the existing conditions.
• Budget for paper works and preparation of LAP-WM.
On the other hand if primary data collection is required, then the budget required can be significantly higher (waste amount & composition survey and/or waste flow survey should be carried out). In this matter, one possible solution is to make use of whatever available data as well as some “default” data from other sources, such as average waste composition data published and national per capita waste generation rate etc. Such data may also be available at scientific academies or universities, when collected in the course of researches.
Furthermore, it was found that most of the LAs are very concerned on the availability of budget in the future for the implementation of the 5-year LAPs-WM. This has created obstacles for the LAs to formulate the plan. Therefore, the activities and actions to be taken to achieve the targets set in the LAPs-WM should be comfortable and not create an excessive burden on the LAs. However a certain budget for the implementation of the 5-year LAPs-WM will be necessary. In case of constraints within the LA, budget allocations by the Federal government to LAs will be one of the options to be considered.
2.6 Lack of Cooperation from the Stakeholders
Involvement of other stakeholders in the formulation of LAP-WM is important so that a practical plan can be produced which is acceptable to every stakeholder. However, experiences in the Model LAs show that cooperation from the stakeholders was sometimes low. In many cases, the stakeholders were not very keen to participate in the activities or meetings arranged by the LAs, generally because they felt comfortable with the current conditions, and reluctant to have any new changes. In other words, the stakeholders especially from the private sectors such as the industries, recycling agents etc. were very concerned about the impacts or consequence of the LAP-WM on their business in the future.
In this matter, the LA plays a very important role to explain clearly to the stakeholders about the benefits and purpose of LAP-WM, and need for the involvement of all the stakeholders in the formulation and implementation of the LAP-WM. It is particularly important for the LA to appreciate and recognise the roles of the stakeholders in this matter so that they are more cooperative and contribute towards the LAP-WM formulation.
2.7 Reluctance to Accept Changes Alike some stakeholders, the LAs are themselves sometimes also reluctant to accept changes particularly for things that involve much red-tape, require many approvals

The Study on National Waste Minimisation in Malaysia Final Report Supporting Report - 2
2-4
and involve many other parties such as other departments or other agencies etc. One good example is the idea of compulsory registration or licensing of the recycling players; this will involve many levels of approval and many other departments will be involved such as Licensing Department, Law Department and Enforcement Department etc. Therefore this has created an obstacle and some LAs feel reluctant to adopt such an idea.
In this matter, ideas that might not be favoured by the LA could be modified as much as possible to reduce the red-tapes etc, so that it is acceptable and more easily to be adopted. In the case of registration of recycling players for example, instead of compulsory registration, it could be modified as voluntary registration system, which would not require many approvals and amendments of by-laws etc.
2.8 Lack of Confidence in Implementing the LAP-WM It was found from experiences of formulating the LAPs-WM in the Model LAs that some LAs have a lack of confidence in their capability to implement the 5-year LAP-WM. This may be because the LAP-WM formulations in the Model LAs were carried out with the assistance of the study team. Whereas the actual implementation of the actions stated in the LAP-WM would be carried out later by the LAs themselves without the assistance of the Study team.
In this matter, it is very important to ensure that the entire LAP-WM of a LA is formulated based on their particular needs and requirements. This is to ensure that they are more comfortable on what they need and what they can do, so that they are more confident when they come to the implementation of the LAP-WM. The part on “actions to be taken to achieve the targets” should be clearly understood and decided by the LA based on their own capability and local conditions.
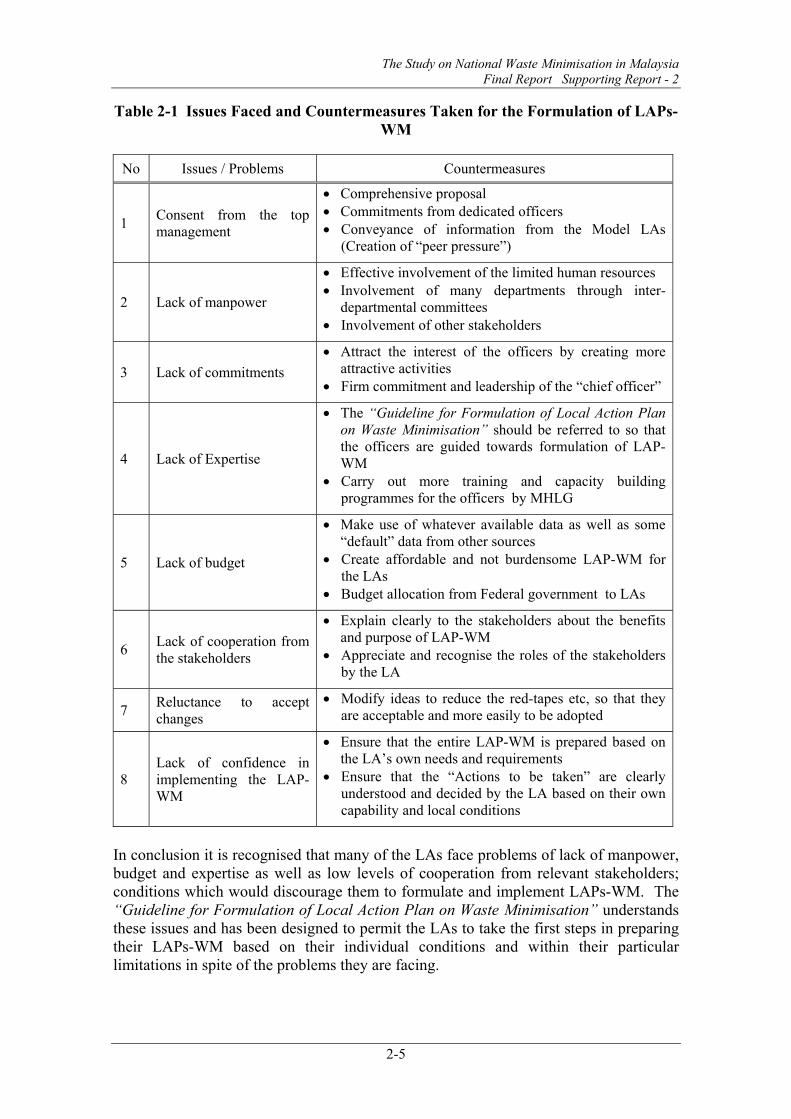
In summary, based on the experiences of formulating the LAPs-WM in the Model LAs, some issues or problems faced throughout the whole process of formulating the LAPs-WM are summarised in Table 2-1 below including some counter-measures taken to overcome these issues:
The Study on National Waste Minimisation in Malaysia Final Report Supporting Report - 2
2-5
Table 2-1 Issues Faced and Countermeasures Taken for the Formulation of LAPs-WM
No Issues / Problems Countermeasures
1 Consent from the top management
• Comprehensive proposal • Commitments from dedicated officers • Conveyance of information from the Model LAs
(Creation of “peer pressure”)
2 Lack of manpower
• Effective involvement of the limited human resources • Involvement of many departments through inter-
departmental committees • Involvement of other stakeholders
3 Lack of commitments • Attract the interest of the officers by creating more
attractive activities • Firm commitment and leadership of the “chief officer”
4 Lack of Expertise
• The “Guideline for Formulation of Local Action Plan on Waste Minimisation” should be referred to so that the officers are guided towards formulation of LAP-WM
• Carry out more training and capacity building programmes for the officers by MHLG
5 Lack of budget
• Make use of whatever available data as well as some “default” data from other sources
• Create affordable and not burdensome LAP-WM for the LAs
• Budget allocation from Federal government to LAs
6 Lack of cooperation from the stakeholders
• Explain clearly to the stakeholders about the benefits and purpose of LAP-WM
• Appreciate and recognise the roles of the stakeholders by the LA
7 Reluctance to accept changes
• Modify ideas to reduce the red-tapes etc, so that they are acceptable and more easily to be adopted
8 Lack of confidence in implementing the LAP-WM
• Ensure that the entire LAP-WM is prepared based on the LA’s own needs and requirements
• Ensure that the “Actions to be taken” are clearly understood and decided by the LA based on their own capability and local conditions
In conclusion it is recognised that many of the LAs face problems of lack of manpower, budget and expertise as well as low levels of cooperation from relevant stakeholders; conditions which would discourage them to formulate and implement LAPs-WM. The “Guideline for Formulation of Local Action Plan on Waste Minimisation” understands these issues and has been designed to permit the LAs to take the first steps in preparing their LAPs-WM based on their individual conditions and within their particular limitations in spite of the problems they are facing.


PART 3
LOCAL ACTION PLAN IN MB MIRI

LOCAL ACTION PLAN FOR WASTE MINIMISATION IN MIRI CITY COUNCIL
(MBM)
By: Majlis Bandaraya Miri (MBM) Supported by: Ministry of Housing and Local Government (MHLG) Japan International Cooperation Agency (JICA)
“ 3Rs for a B
etter Tomorrow
"


Local Action Plan in MB Miri
i
Table of Contents
Table of Contents Preface Miri Fact Sheet Abbreviations Key Definitions
Chapter 1 Introduction .......................................................................................................... 1 1.1 Background and Objectives .............................................................................................3-1 1.2 Scope of the Action Plan ..................................................................................................3-1
Chapter 2 State of Waste Managemenht and Rrcycling in MBM...................................3-2 2.1 Solid Waste Management in General ...............................................................................3-2
2.1.1 Institutional Framework for SWM...........................................................................3-2 2.1.2 The MSW Service Areas ..........................................................................................3-4 2.1.3 Waste Generation and Compositions .......................................................................3-5 2.1.4 Waste Storage and Collection...................................................................................3-8 2.1.5 Waste Treatment and Disposal .................................................................................3-8
2.2 Recycling of Municipal Solid Wastes in Miri ..................................................................3-9 2.2.1 Types and Amount of Recyclable Materials.............................................................3-9 2.2.2 Types of Recycling Players ....................................................................................3-10 2.2.3 Existing Recycling Systems / Practices.................................................................. 3-11 2.2.4 Current Recycling Performance .............................................................................3-13 2.2.5 Other issues on Recycling in Miri..........................................................................3-14
2.3 Improvement and Promotion of Waste Minimisation ....................................................3-15 2.3.1 Key Issues in Waste Minimisation .........................................................................3-15
Chapter 3 Targets of Waste Minimisation and Rrcycling..............................................3-17 3.1 Projection of Future Waste Generation ..........................................................................3-17 3.2 Setting of Recycling Targets ..........................................................................................3-18 3.3 Summary of Key Figures on SWM and Recycling in MBM .........................................3-19
Chapter 4 Actions to Achieve the Targets .......................................................................3-21 4.1 Main Approaches............................................................................................................3-21 4.2 Institutional Setup at Management and Operation Levels .............................................3-21
4.2.1 Waste Minimisation Committee .............................................................................3-21 4.2.2 Waste Minimisation Unit (WMU)..........................................................................3-22
4.3 Registration of Existing Recycling Players / Stakeholders ............................................3-24 4.3.1 Invitation to Stakeholder Workshop.......................................................................3-24 4.3.2 Voluntary and Pro-active Registration ...................................................................3-25 4.3.3 Mandatory Registration..........................................................................................3-25
4.4 Increase Awareness and Recycling Practices .................................................................3-25 4.4.1 Awareness and Publicity ........................................................................................3-25 4.4.2 Source Separation Programmes .............................................................................3-25
4.5 Capacity Building...........................................................................................................3-26 4.6 Cost Implication .............................................................................................................3-27
Chapter 5 Monitoring and Implementation Schedule for the Action Plan ..................3-33 5.1 Monitoring and Evaluating the Performance .................................................................3-33 5.2 Periodical Reporting.......................................................................................................3-33 5.3 Implementation Schedule of Action Plan.......................................................................3-34
Appendices References

Local Action Plan in MB Miri
ii
Preface
TThe problem of solid waste is now a global issue, where the discussion on the problem is becoming more distinctive than ever before. The amount of solid waste generated in the world is increasing, along with the increase in urban populations as well as the change in human lifestyles. In Malaysia, about 8 million tons of solid wastes are generated every year (2004) and this figure is expected to increase tremendously to about 15 million tons/year in 2020. It is therefore crucial to take some prevention measures against the waste problem, including promotion of a recycling oriented society that understands and participates effectively in recycling and waste minimisation practices.
The LA is directly playing an important role in promoting recycling and waste minimisation among the communities within the local boundary. The LA should lead, monitor and work together with various local stakeholders on recycling to ensure successful and sustainable recycling programmes.
This LAP-WM serves as a guideline for the LA to effectively implement waste minimisation and recycling programmes with focuses on respective waste generation sources, such as residential households, commercial enterprises, offices, hotels, restaurants and manufacturers. Some targets are set in this Action Plan and performance indicators are recommended for monitoring purpose. Some possible actions to be taken to achieve the targets are short-listed in this plan based on the local conditions of the local authority’s areas.
With this Action Plan, it is hoped that a “Material Cycle Society” can be promoted, which could subsequently be extended to some other LAs in the country.
Majlis Bandaraya Miri April 2006
Local Action Plan in MB Miri
iii
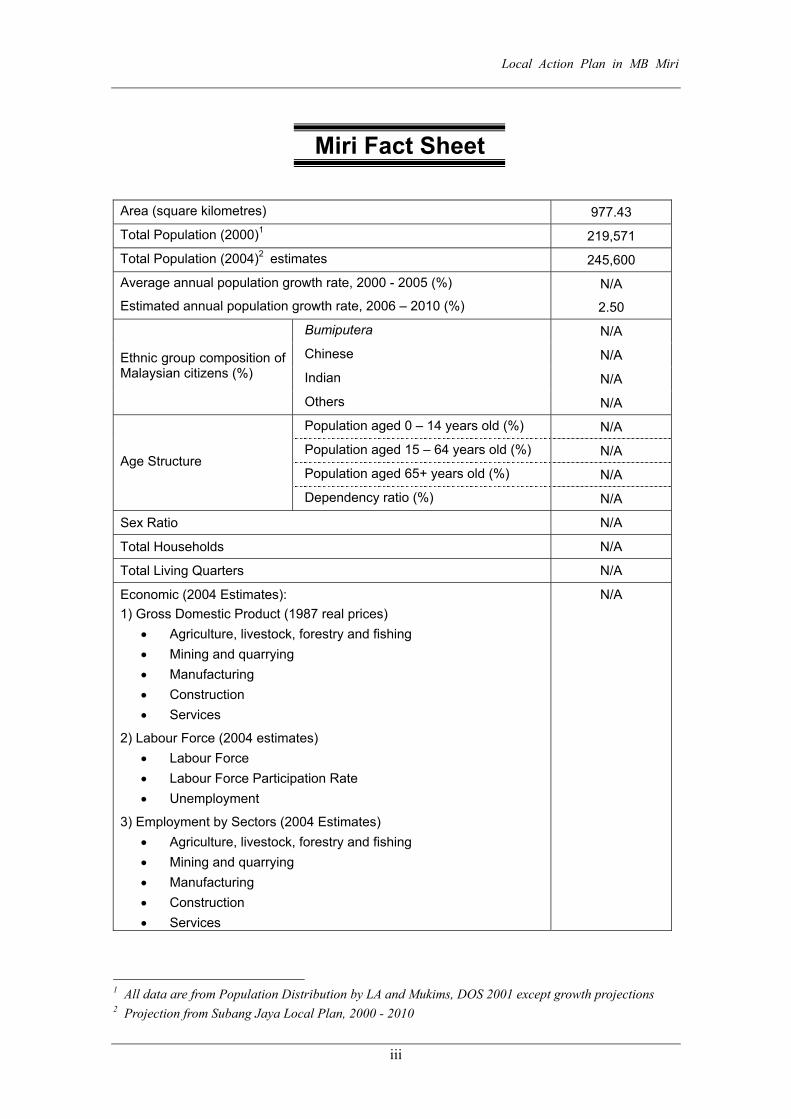
Miri Fact Sheet
Area (square kilometres) 977.43
Total Population (2000)1 219,571
Total Population (2004)2 estimates 245,600
Average annual population growth rate, 2000 - 2005 (%)
Estimated annual population growth rate, 2006 – 2010 (%) N/A
2.50
Bumiputera N/A
Chinese N/A
Indian N/A Ethnic group composition of Malaysian citizens (%)
Others N/A
Population aged 0 – 14 years old (%) N/A
Population aged 15 – 64 years old (%) N/A
Population aged 65+ years old (%) N/A Age Structure
Dependency ratio (%) N/A
Sex Ratio N/A
Total Households N/A
Total Living Quarters N/A
Economic (2004 Estimates): 1) Gross Domestic Product (1987 real prices)
• Agriculture, livestock, forestry and fishing • Mining and quarrying • Manufacturing • Construction • Services
2) Labour Force (2004 estimates) • Labour Force • Labour Force Participation Rate • Unemployment
3) Employment by Sectors (2004 Estimates) • Agriculture, livestock, forestry and fishing • Mining and quarrying • Manufacturing • Construction • Services
N/A
1 All data are from Population Distribution by LA and Mukims, DOS 2001 except growth projections 2 Projection from Subang Jaya Local Plan, 2000 - 2010
Local Action Plan in MB Miri
iv
Abbreviations
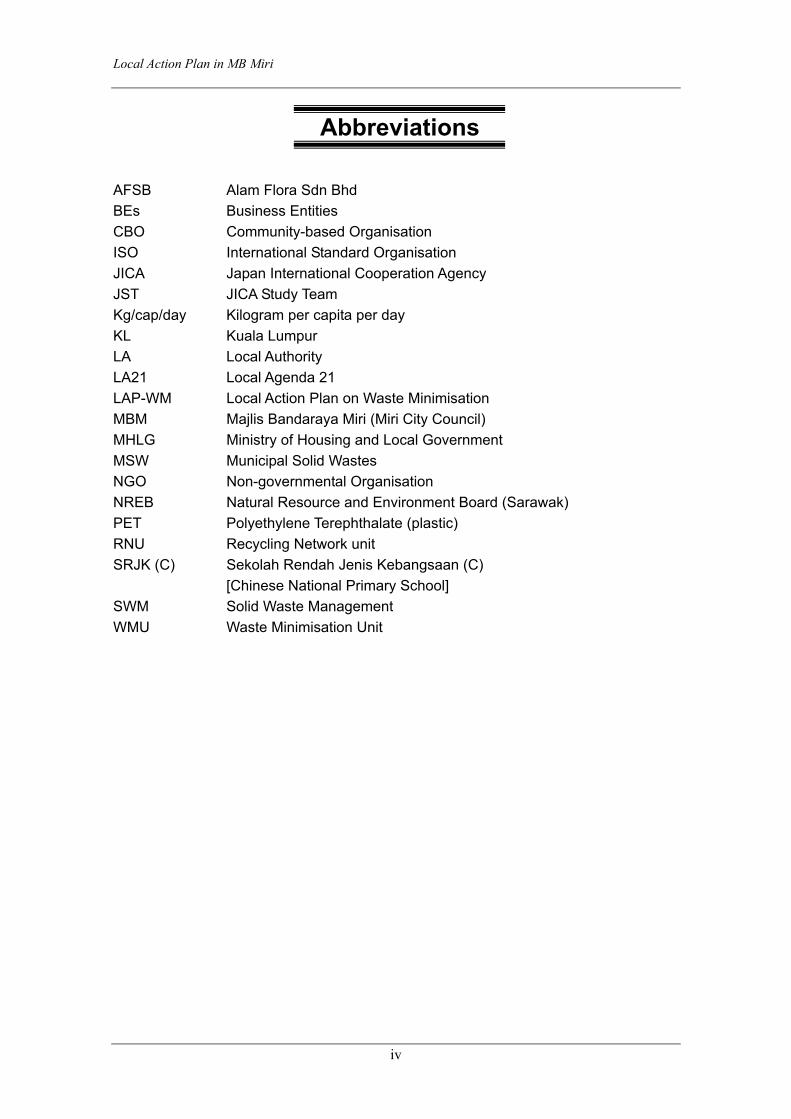
AFSB Alam Flora Sdn Bhd BEs Business Entities CBO Community-based Organisation ISO International Standard Organisation JICA Japan International Cooperation Agency JST JICA Study Team Kg/cap/day Kilogram per capita per day KL Kuala Lumpur LA Local Authority LA21 Local Agenda 21 LAP-WM Local Action Plan on Waste Minimisation MBM Majlis Bandaraya Miri (Miri City Council) MHLG Ministry of Housing and Local Government MSW Municipal Solid Wastes NGO Non-governmental Organisation NREB Natural Resource and Environment Board (Sarawak) PET Polyethylene Terephthalate (plastic) RNU Recycling Network unit SRJK (C) Sekolah Rendah Jenis Kebangsaan (C)
[Chinese National Primary School] SWM Solid Waste Management WMU Waste Minimisation Unit

Local Action Plan in MB Miri
v
Key Definitions
Some key definitions that are used within the scope of this A/P are:
A) Solid Wastes
Solid wastes refer to all the wastes from human activities that are in solid form and are discarded as useless or unwanted. Municipal solid wastes refer to solid wastes that are discharged regularly from households, commercial or business premises, institutions and industries (excluding the processed industrial wastes, sludge, household hazardous wastes, and construction and demolition wastes).
This includes: food and garden wastes from households, waste papers from offices, aluminium cans from restaurants, cardboards from supermarkets, PET bottles from factory canteen, hotels etc.
This excludes: Used tyres from workshops, scrap metals and packaging wastes from
industries, bulky and e-wastes from households, clinical wastes from hospitals etc.
B) The 3Rs Reduction at source, which is defined as to reduce the amount of waste that will
enter into the waste stream through the changes of lifestyle and/or manner of consumption, improvement of manufacturing processes, green purchasing and so on,
Reuse, which is defined as the multiple use of a product in its original form, for its
original purpose or for an alternative, with or without re-conditioning, and Material Recycling, which is defined as to utilise a waste for other purposes by
processing (including segregation, washing, melting, transforming, etc.) but most of the fractions of the waste shall be utilised for other purposes.
C) Recycling Rate
Recycling rate (%) = Total Recyclables Collected (TRC) x 100 %
Waste Amount Generated (WAG) where, WAG = TRC + Total Waste Disposed (TWD) + Others or = Unit Generation Rate (kg/capita/day) x population
“Others” include open burnt, illegal dump, waste treated or other waste losses.

Local Action Plan in MB Miri
3-1
CHAPTER 1 INTRODUCTION
1.1 Background and Objectives
With the stable growth of the economy and active commercial and industrial activities, management of solid waste becomes one of the central concerns in Malaysia. Due to limited availability of the land, minimising the amount of solid waste disposal at landfills is the acute issue to be addressed through partnership of all relevant stakeholders including federal/local governments, recyclers, concessionaires, business entities, NGOs, and general public.
Responding to the urgent needs of reducing the amount of solid waste disposal, the Ministry of Housing and Local Government (MHLG) and Japan International Cooperation Agency (JICA) have jointly conducted the Study for formulation of the Master Plan on National Waste Minimisation in Malaysia (WM-MP) since June 2004. The Study includes identification of the status and issues of waste minimisation in Malaysia. To realise the Master Plan at local level, the Study, working together with the 4 selected authorities (model LAs), also formulated the Local Action Plan on Waste Minimisation (LAP-WM). The LAP-WM is formulated for providing all the relevant 3Rs players clear targets to achieve and actions to be taken.
1.2 Scope of the Action Plan
LAP-WM basically targets minimisation of municipal solid wastes while non-municipal waste such as industrial wastes, construction/demolition wastes, medical wastes and scheduled wastes are not subject to LAP-WM. The minimisation is defined as minimizing the amount of municipal solid waste to be disposed at landfill. The efforts of waste minimisation are represented by 3Rs (Reduce, Reuse, Recycle) activities. LAP-WM mainly consists of the following planning components:
1) Current Status and Issues of SWM and Recycling
2) Projection of Future SW Generation
3) Waste Minimisation Targets and Compliance Schedule
4) Actions to Achieve the Targets
5) Monitoring and Evaluation of LAP-WM
Local Action Plan in MB Miri
3-2
CHAPTER 2 STATE OF WASTE MANAGEMENHT AND RRCYCLING IN MBM
2.1 Solid Waste Management in General
Municipal Solid Waste (MSW) is essentially household waste and also includes organic wastes from commercial and institutional sectors (Agamuthu et. al. 2003). Different studies record varying averages for waste generation in Malaysia.
In 1997, the total solid waste generated throughout Malaysia was 5.6 million tons or 15,000 tons/day. Out of this, 80% was domestic wastes and the other 20% was commercial wastes. Increase of population is the main contributor to the increase of waste generation. Other factors include changes in lifestyle, consumption patterns, and rising of income levels. In 1998, the MSW generated has increased to about 6.0 million tons, with an average of 0.5 to 0.8 kg/capita/day [Agamuthu et. al 2003]. The per capita waste generation rate has again reported to be increased in Malaysia from 0.7 kg/cap/day in 1990 to 1.2 kg/cap/day in 2000.
Other studies note that the average waste generation, depending on the economic status of the area, varies from 0.45 to 1.44 kg/cap/day [Hassan, 2001]. However, in the latest studies carried out by JICA Study Team in selected areas in 2005, the per capita generation rate was found to be 0.897 kg/cap/day in average (0.628 kg/cap/day from households and 0.269 kg/cap/day from business entities).
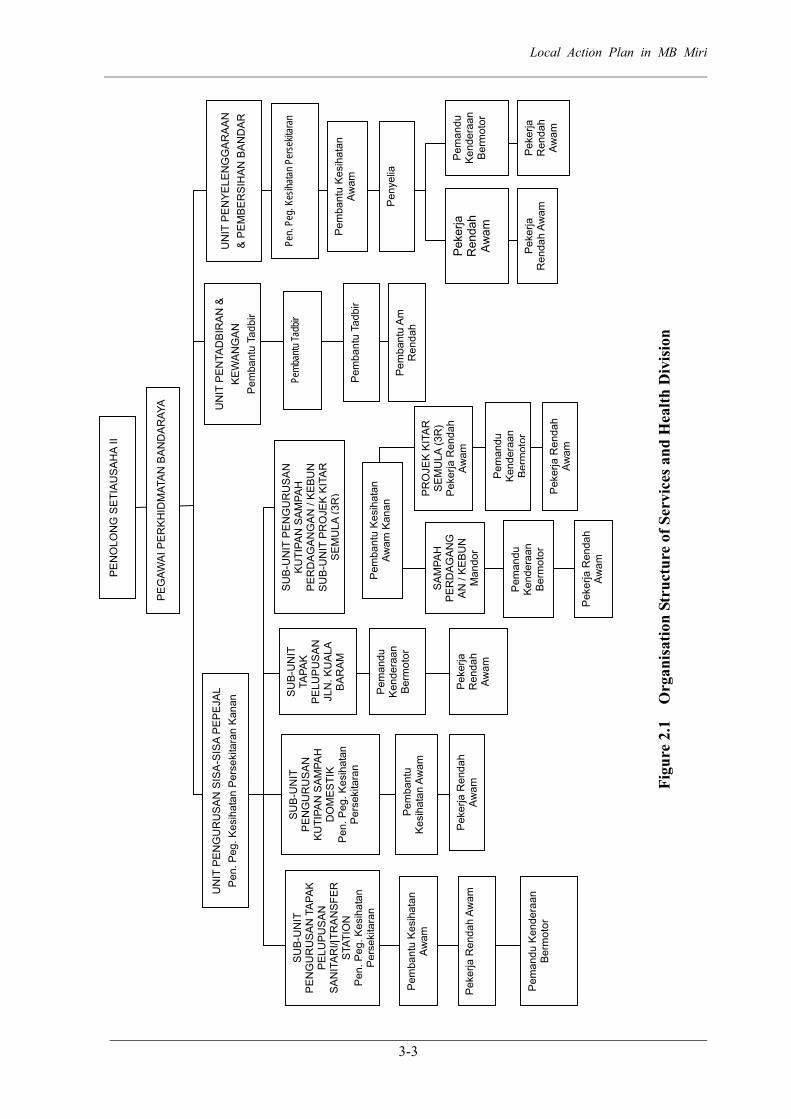
2.1.1 Institutional Framework for SWM SWM is under the administration of Public Cleansing and Maintenance Section of MBM, which comes under the Services and Health Division. Their main responsibilities that are relevant to SWM are public cleansing and solid waste collection and disposal.
The general organisational framework for SWM in MBM under the Services and Health Division is shown in Figure 2.1.
3-3
Local Action Plan in MB Miri
Figu
re 2
.1
Org
anis
atio
n St
ruct
ure
of S
ervi
ces a
nd H
ealth
Div
isio
n
PE
NO
LON
G S
ETI
AU
SA
HA
II
PE
GAW
AI P
ER
KH
IDM
ATA
N B
AN
DA
RAY
A UN
IT P
EN
TAD
BIR
AN
&
KE
WA
NG
AN
P
emba
ntu
Tadb
ir
UN
IT P
EN
YELE
NG
GA
RA
AN
&
PE
MB
ER
SIH
AN
BA
ND
AR
UN
IT P
EN
GU
RU
SA
N S
ISA
-SIS
A P
EP
EJA
LP
en. P
eg. K
esih
atan
Per
seki
tara
n K
anan
SU
B-U
NIT
P
EN
GU
RU
SA
N T
APA
K
PE
LUP
US
AN
S
AN
ITA
RI/
TRA
NS
FER
S
TATI
ON
P
en. P
eg. K
esih
atan
P
erse
kita
ran
SU
B-U
NIT
P
EN
GU
RU
SA
N
KU
TIPA
N S
AM
PAH
D
OM
ES
TIK
P
en. P
eg. K
esih
atan
Per
seki
tara
n
SA
MPA
H
PE
RD
AG
AN
GA
N /
KE
BU
N
Man
dor
Pem
bant
u K
esih
atan
Aw
am
Pem
bant
u A
m
Ren
dah
Pen
yelia
Pem
bant
u K
esih
atan
Aw
am
Pek
erja
Ren
dah
Awam
Pem
andu
Ken
dera
an
Ber
mot
or
Pek
erja
R
enda
h Aw
am
Pek
erja
Ren
dah
Awam
Pem
andu
K
ende
raan
B
erm
otor
P
eker
ja
Ren
dah
Awam
Pem
bant
u Ta
dbir
Pem
andu
K
ende
raan
B
erm
otor
Pek
erja
R
enda
h Aw
am
PR
OJE
K K
ITA
R
SE
MU
LA (3
R)
Pek
erja
Ren
dah
Awam
Pem
andu
K
ende
raan
B
erm
otor
Pek
erja
Ren
dah
Awam
Pek
erja
Ren
dah
Awam
SU
B-U
NIT
TA
PAK
P
ELU
PU
SA
N
JLN
. KU
ALA
B
AR
AM
Pemb
antu
Tadb
ir
Pen.
Peg.
Kesih
atan P
erse
kitar
an
Pem
bant
u K
esih
atan
Aw
am
Peke
rja
Ren
dah
Aw
am
Pem
andu
K
ende
raan
B
erm
otor
SU
B-U
NIT
PE
NG
UR
US
AN
K
UTI
PAN
SA
MPA
H
PE
RD
AG
AN
GA
N /
KE
BU
N
SU
B-U
NIT
PR
OJE
K K
ITA
R
SE
MU
LA (3
R)
Pem
bant
u K
esih
atan
Aw
am K
anan

Local Action Plan in MB Miri
3-4
Waste Minimisation Unit In relation to 3Rs, the section has a Waste Minimisation Unit with two officers, four workers and one driver. One truck is utilised for public awareness programmes and collection of recyclables upon request. Information is collected not only in relation to MBM’s activities but the unit also receives reports of recyclables collection from schools and recycling agents on a monthly basis.
Local Agenda 21 In 1999, Majlis Perbandaran Miri (at that time) was selected as one of the fours sites for implementing the pilot project in Malaysia. The implementation of Local Agenda 21 programme in Miri is continuously supported by MHLG and is based on 5 elements which are partnership, community based issues analysis, action plan, implementation and monitoring as well as evaluation and feedback. Three (3) main issues have been identified and one is solid waste management. Therefore, 3 working groups were formed together with the action plans to facilitate in solving the issues namely:
(i) Pollution control of rivers in Miri Implementation Working Group. (ii) Miri Drainage Network Implementation Working Group. (iii) Solid Waste Reduction Implementation Working Group.
There are 4 sub-groups under solid waste Implementation Working Group to implement action plan which are:
1) Glass & Plastic Sub-group. 2) Organic waste composting sub-group. 3) Flea market sub-group. 4) 3Rs award sub-group for schools
Other projects include the publication of a 3Rs information booklet called “Ecopack” and the setting up of two (2) collection centres manned by NGO: one in the Council Multi-storey carpark building and the other one in the Regional market at Lorong 10 market.
2.1.2 The MSW Service Areas
The total area under the administration of MBM is about 977.43 km2 and is divided into two functional areas:
The operational or service area is 195.58 km2 (20%) The non-operational area is 781.9 km2 (80%)
The population of Miri in 2000 was 219,571 with an annual growth rate of 3.42% from 1991 to 2000. For the period of year 2000 to 2010, population projections are made based on 4.24% annual growth rate per annum. As such the population is estimated to be around 270,238 in year 2005 and grows to about 281,069 in year 2010.
In terms of population in year 2005, MBM estimates that about 216,191 persons (80% of the total) are served or covered by the waste collection services. In addition, the services also estimated to cover about 100% of the total business entities in Miri.

Local Action Plan in MB Miri
3-5
2.1.3 Waste Generation and Compositions
a) Waste Generation MBM reports that there are about 40,000 properties within their jurisdiction in the year 2004; this comprises of residential, commercial, industrial and institutional premises. The main sources of municipal solid waste generation in Miri are from households. Apart from households, other sources of MSW include:
• Commercial (including service industries) • Institutional (government agencies, schools, hospitals excluding clinical
wastes) • Community (parks, beaches, public drainage and road cleansing) • Industrial (excluding hazardous / scheduled wastes)
Based on 2004 data (landfill data), MBM estimates that about 120 tons of solid waste are disposed in Miri daily. While in year 2005, the total waste disposed to landfill is found to be increased to 150 tons/day.
Based on this data, the per capita disposal rate was calculated as follows:
Table 2.1 Waste Disposal Rates in Miri (Landfill Data)
No Generation Sources Waste as Disposed (tons/day) Percentage
1 Household 112.5 75.0% 2 Business entities 37.5 25.0%
Total 150.0 100.0% Per capital waste disposal rate
(kg/cap/day) 0.69kg/cap/day Source: MBM (2005)
It should be noted that the data estimated were based mainly on landfill data where the wastes are disposed from various sources including households, business entities and industries etc. However, for the case of Miri, almost 75% of the wastes recorded are municipal wastes from households (about 34,000 households) and 25% are from business and industrial entities (about 4,600 business entities). By using the figures obtained from the JICA study for the waste recycling rate at source, therefore the total waste generation rate for MBM in 2005 was estimated and summarised in Table 2.2 as follows:
Table 2.2 Total Waste Generation Rate in MBM (2005)
Per Capita Rate (kg/cap/day)
No Sources Waste as Disposed
(kg/cap/day)
Waste as Recovered at Source*
(kg/cap/day)
Total Waste Generation rate
(kg/cap/day) 1 Household 0.52 0.092 0.61 2 Business entities 0.17 0.090 0.26
Total 0.69 0.183 0.87 Note: * Estimations from JICA Study (2005)

Local Action Plan in MB Miri
3-6
The actual amount of wastes generated in MBM areas are higher than the 0.69 kg/cap/day as recorded at the disposal site, because there are some portions of recyclable materials that are retained1 at source to be recycled or sold to recycling agents directly.
Therefore, based on the population of 270,238 in MBM (2005), the estimated amounts of actual wastes generated, retained and disposed are calculated as follows:
a) Waste generation = 270,238 x 0.87 kg/cap/day = 235.1 tons/day
b) Waste retained = 270,238 x 0.18kg/cap/day
= 49.5 tons/day c) Waste disposed = 270,238 x 0.69 kg/cap/day
= 186.5 tons/day (Where 150 tons/day are collected by
MSW service that dispose of to landfill)
Based on these rough estimations, the percentage of wastes retained for MBM is calculated as:
49.5 tons/day 235.1 tons/day b) Waste Composition There is no known published report on waste compositions and characteristics at source for Miri. Various studies carried out by government and universities give some indication of waste composition. An estimation of typical waste composition in Miri is presented in the “EcoPack” as shown in Table 2.3 below:
Table 2.3 Waste Composition in Miri (EcoPack, 2003)
Waste Compositions % by Weight Food Wastes 50.0 Paper 21.0 Plastics/rubber 8.0 Metal 6.0 Wood 5.0 Glass 4.0 Textiles 3.0 Miscellaneous 3.0
Source: Miri’s EcoPack, Jan. 2003
As comparison, the results of the detailed waste composition study done by JICA Study on households are referred, as shown in Table 2.4 below:
1Waste retained includes all un-accounted for waste generated but not included in the official disposal amounts; such as recyclables separated at source and directly transferred to recyclers by the generators or waste illegally dumped or open dumped.
X 100% = 21.0%

Local Action Plan in MB Miri
3-7
Table 2.4 Waste Compositions in Different Income Levels High
Income Medium income
Low Income Average
No Categories Unit in %
Organic 1 Food waste 40.47 48.62 55.02 48.04 2 Bones 1.69 0.52 1.57 1.26 3 waste papers 16.34 20.09 14.84 17.09 4 Plastics (F) 4.46 5.33 6.25 5.35 5 Plastics (R) 3.53 4.18 3.47 3.73 6 Polystyrene 0.41 0.85 0.47 0.58 7 Textile 0.92 0.92 3.70 1.85 8 Rubber & Leather 4.75 0.25 0.47 1.82 9 Wood 0.09 0.34 0.23 0.22
10 Yard waste 14.20 5.40 0.15 6.58 11 Diapers 6.36 2.06 6.75 5.06
Sub-total for organic 93.19 88.53 92.90 91.57 Inorganic 12 Glass 3.40 4.33 3.41 3.71 13 Ferrous 1.25 1.81 1.76 1.61 14 Non-ferrous 0.01 0.05 0.00 0.02 15 Aluminium 0.52 0.47 0.13 0.37 16 Batteries 0.00 0.04 0.06 0.03 17 Electrical & Electronics 0.08 0.02 0.43 0.18 18 Others 1.57 4.75 1.32 2.50
Sub-total for inorganic 6.81 11.47 7.11 8.42 TOTAL 100 100 100 100
Source: JICA Study 2005
However, it should be noted that the abovementioned figures are compositions of the wastes discharged from the generation sources, it is technically different from the composition of actual wastes generated due to the reason that some wastes are retained at source for recycling or other purposes. After some adjustments done by JST on the waste compositions, the summarised waste compositions as generated from both households and business entities are shown in Table 2.5 as follows:
Table 2.5 Waste Compositions for Households and Business Entities
EcoPack (2003) Households Business
Entities Overall Composition All units in %
Food waste 50.0 39.7 18.1 37.0 Papers 21.0 31.2 32.4 31.4 Plastics 8.0 8.1 8.8 8.2 Glass 4.0 3.5 7.7 4.0 Ferrous Metals 1.6 2.9 1.8 Aluminium 6.0 0.6 0.9 0.6 Others 11.0 15.3 29.2 17.0
Note: Ratio of Households to Business Entities in MBM is 3 to 1

Local Action Plan in MB Miri
3-8
2.1.4 Waste Storage and Collection
a) Waste Storage Various types of waste storage bins are used in MBM areas. However, some standardised common types of bins are provided by MBM, i.e. 120 liter bins for households, 660 litter bins for commercial premises and 10m3 Roll bins for markets and industries and 15 m³ RORO bins for industrial/market and squatters.
b) Collection Municipal solid wastes generated in Miri are collected by MBM appointed contractors including wastes from households, business entities and industries (non-scheduled wastes) but exclude wood waste, construction debris and agriculture waste. Collections of such waste from all types of bins are carried out by the Council’s contractors, whereas Council’s own open trucks collect bulky waste from households on an ad hoc basis.
The collection frequency in Miri is generally 3 times/week for residential premises and daily collection for commercial premises. The average cost of collection is about RM5.80/month for each household bin to RM85/month for each commercial bin. Solid waste management is funded from the rates collected (23.5% of Annual Ratable Value of property), and about 17% the rate collected is for solid waste management fund, which is amounting to about 5 million annually.
2.1.5 Waste Treatment and Disposal
a) Transfer Station, Transportation and Landfill Disposal The method of MSW disposal employed by MBM is landfilling. In mid 2003, the sanitary landfill at Sibuti, Bekenu, Subis District commenced operations. This new landfill cell is lined and equipped with a leachate treatment and pond system for further treatment. Solid waste collected is transported to a temporary Transfer Station (Lambir Mile 8), 14 km from Miri town centre for transfer to larger secondary transfer trucks. At the station, the waste is further compacted by stationary compactors, then loaded onto 30-foot containers to be hauled to the sanitary landfill for disposal. Construction & demolition waste is usually used for landfilling works and not allowed to be disposed at MBM’s landfill. Scavengers are not allowed to operate at landfill and transfer station. In the future, this sanitary landfill may include composting of green waste, recycling of building waste, sludge treatment and an incinerator for the recycling of energy from construction wood waste. Before this, MBM disposed of the MSW by controlled tipping, with occasional covering, at a disposal site at km-17, Lutong, Kuala Baram Road.
Table 2.6 below shows records kept on the quantities of waste disposed at Sibuti landfill in 2004. The total quantity disposed in 2004 is estimated to be around 43,434 tons. This means that the average quantity disposed in 2003 was about 3,620 tons per month, peaking at approximately 4,000 tons in the months of January and December.

Local Action Plan in MB Miri
3-9
Table 2.6 Quantity of Solid Waste Disposed at MBM’s Landfill, 2004 Landfill Month Tonnage
January 3,968.47 February 3,296.90 March 3,414.65 April 3,275.77 May 3,483.32 June 3,607.42 July 3,760.63 August 3,828.80 September 3,479.59 October 3,645.85 November 3,656.24
Sibuti, Bekenu
December 4,016.31 Total (Tons / Year) 43,433.95
Average (Tons / Month) 3,619.50 Average (Tons / Day) 120.65
Source: MBM (2004) b) Illegal Dumping Illegal dumping of MSW is not a major problem in Miri. Illegal dumps have been found at roadsides of some housing and industries estates, dead-end roads or open spaces where there are no surrounding buildings. Dumping on private land is not a problem. Types of waste dumped include household, garden, industrial as well as construction and demolition wastes. MBM has no records on the quantity of illegally dumped wastes.
2.2 Recycling of Municipal Solid Wastes in Miri
MBM initiated their recycling programmes in 2000 as part of MHLG’s nationwide project for all municipal/ city councils to implement pilot recycling programmes. Under this programme, MHLG has provided technical support by supplying recycling bins, recycling collection centres, leaflets, posters and training/ seminars for MBM personnel and relevant stakeholders. MBM has since then adopted the 3Rs concepts (Reduce, Reuse, and Recycle) with cooperation from all stakeholders; the recovery of recyclables from waste stream has been on-going. Monthly data of recyclables collected by private business and NGO has been forwarded to both the state and Federal Ministries.
2.2.1 Types and Amount of Recyclable Materials Based on the data on waste compositions, the amount of recyclable materials expected from the wastes stream in MBM is calculated in Table 2.7:

Local Action Plan in MB Miri
3-10
Table 2.7 Amount of Recyclable Materials in MBM Households Business Entities
No Composition % Amount
(tons/year) % Amount (tons/year)
Total Amount
(tons/year) 1 Papers 31.2 18,772.57 32.4 8,309.17 27,081.74 2 Plastic 8.1 4,873.65 8.8 2,256.81 7,130.46 3 Glass 3.5 2,105.90 7.7 1,974.71 4,080.61 4 Ferrous metals 1.6 962.70 2.9 743.72 1,706.42 5 Aluminium 0.6 361.01 0.9 230.81 591.82
6 Others (Non recyclables) 55.0 33,092.67 47.3 12,130.36 45,223.03
Total 100.0 60,168.50 100.0 25,645.58 85,814.08 Total amount of recyclable materials available (tons/year) = 40,591.05 Total amount of recyclable materials available (%) = 47.3%
Note: 1) other non recyclables include major portion of food wastes 2) Assuming that the waste composition as discarded from sources are same as the composition as disposed to landfill
As shown in Table 2.7 about 47.3% of the wastes disposed of from the generation sources are recyclable materials (40,591.1 tons/year). Out of this figure, the main recyclable materials found is paper (27,081.7 tons/year), followed by plastics (7,130.5 tons/year).
2.2.2 Types of Recycling Players The key players in recycling in Miri can be categorised into three main groups, namely the recycling collecting agents, the participating groups and MBM as shown in Figure 2.2 below.
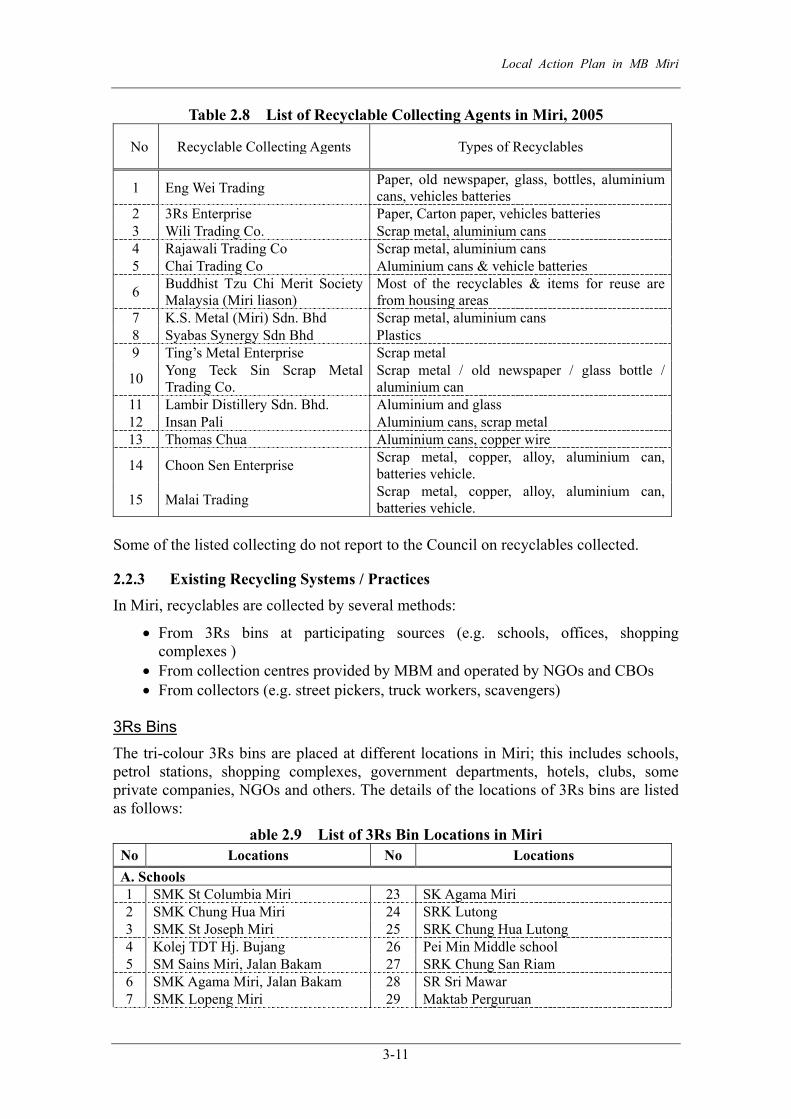
Among all the players, the private recycling agents or vendors are playing the most significant role in collecting the recyclables in Miri. However, many of these players are not registered under MBM and therefore only 15 recyclable collecting agents are captured by MBM within its area of jurisdiction. All these players collect the main recyclable materials, i.e. papers, metals and aluminium cans etc. Only one company was found collecting plastics. Details of these players and types of recyclables collected are summarised in Table 2.8 below:
Figure 2.2 Key Players on Recycling in Miri
Majlis Perbandaran Miri (MBM) (Public Cleansing and Maintenance)
Coordinate, Technical support, logistics, advisory, reporting
Participants Schools, shopping complex, petrol
stations, offices, NGOs, CBOs, LA21 SWR Group
Recycling Collecting Agents Collect, buy, pack & transport to
Peninsular Malaysia
Local Action Plan in MB Miri
3-11
Table 2.8 List of Recyclable Collecting Agents in Miri, 2005
No Recyclable Collecting Agents Types of Recyclables
1 Eng Wei Trading Paper, old newspaper, glass, bottles, aluminium cans, vehicles batteries
2 3Rs Enterprise Paper, Carton paper, vehicles batteries 3 Wili Trading Co. Scrap metal, aluminium cans 4 Rajawali Trading Co Scrap metal, aluminium cans 5 Chai Trading Co Aluminium cans & vehicle batteries
6 Buddhist Tzu Chi Merit Society Malaysia (Miri liason)
Most of the recyclables & items for reuse are from housing areas
7 K.S. Metal (Miri) Sdn. Bhd Scrap metal, aluminium cans 8 Syabas Synergy Sdn Bhd Plastics 9 Ting’s Metal Enterprise Scrap metal
10 Yong Teck Sin Scrap Metal Trading Co.
Scrap metal / old newspaper / glass bottle / aluminium can
11 Lambir Distillery Sdn. Bhd. Aluminium and glass 12 Insan Pali Aluminium cans, scrap metal 13 Thomas Chua Aluminium cans, copper wire
14 Choon Sen Enterprise Scrap metal, copper, alloy, aluminium can, batteries vehicle.
15 Malai Trading Scrap metal, copper, alloy, aluminium can, batteries vehicle.
Some of the listed collecting do not report to the Council on recyclables collected.
2.2.3 Existing Recycling Systems / Practices In Miri, recyclables are collected by several methods:
• From 3Rs bins at participating sources (e.g. schools, offices, shopping complexes )
• From collection centres provided by MBM and operated by NGOs and CBOs • From collectors (e.g. street pickers, truck workers, scavengers)
3Rs Bins The tri-colour 3Rs bins are placed at different locations in Miri; this includes schools, petrol stations, shopping complexes, government departments, hotels, clubs, some private companies, NGOs and others. The details of the locations of 3Rs bins are listed as follows:
able 2.9 List of 3Rs Bin Locations in Miri No Locations No Locations A. Schools 1 SMK St Columbia Miri 23 SK Agama Miri 2 SMK Chung Hua Miri 24 SRK Lutong 3 SMK St Joseph Miri 25 SRK Chung Hua Lutong 4 Kolej TDT Hj. Bujang 26 Pei Min Middle school 5 SM Sains Miri, Jalan Bakam 27 SRK Chung San Riam 6 SMK Agama Miri, Jalan Bakam 28 SR Sri Mawar 7 SMK Lopeng Miri 29 Maktab Perguruan

Local Action Plan in MB Miri
3-12
No Locations No Locations 8 SMK Dato Permaisuri 30 SK Pendidikan Khas 9 SMK Lutong 31 SK Anchi
10 SMK Riam, Taman Tuanku 32 SK Jalan Bintang 11 SK St. Joseph Miri 33 SK Kg. Luak 12 SRK North 34 SK Lambir Village 13 SK St Columbia Miri 35 SK Pujut Corner 14 SK Pujut Corner 36 SMK Luak 15 SK Pulau Melayu 37 SMK Merbau 16 SK Riam Batu Dua 38 SJK Chung Hua, Bakam 17 SK sayed Othman 39 SJK Kpg. Bakam, 98000 Miri 18 SK South, Brighton Rd 40 SJK(C) Tukau 19 SK. Tem. Datuk Muip 41 Tadika Seri Indah 20 SK Tudan 42 Tadika Chung Hua Krokop 21 SMK Baru Miri 43 Curtin University 22 Riam Middle School B. Hotels 1 Marriot Hotel Miri 3 Dynasty Hotel 2 Park City Miri
C. Shopping Complex 1 Bintang Plaza 3 Imperial Mall Shopping Complex 2 Boulevard Shopping Complex
D. PLACE OF WORSHIP 1 Mei Ann Methodhist Church
E. NGOs 1 Malaysia Red Crescent Society 2 Miri Bahai Society
F. Governmental Departments 1 Jabatan Kastam Miri 2 Pustaka Miri
G. Private Company 1 Pusat Bahasa Titian Jaya S/B 2 Nippon Oil Exploration (M) LTD, Miri
Collection Centres MBM has set up 8 collection centres at strategic locations. Some of the centres were funded by MHLG while some were established under the Miri LA21 programme:
a) Funded by MHLG:
Piasau Jaya 2 ( residential area) Pujut 1B (residential area) Taman Tunku (residential area) Desa Senadin (residential area) Krokop Lorong 5 (residential area) Bulatan Park (recreational park) Permyjaya (residential area) Lutong (commercial area)
b) Under Miri LA21 Programme:
Lorong 10 Krokop (market) MMC multi-storey carpark building

Local Action Plan in MB Miri
3-13
2.2.4 Current Recycling Performance Recycling activities in Miri focus mainly on old newspapers, carton boxes, other categories of papers, ferrous metals and aluminium cans. Recently, there is also collection of plastics for recycling when one plastic recycling company started its operation in Miri since late 2004 and began collection of plastic material from 2005. On the other hand, some glass bottles are collected to be reused instead of recycling. Broken glass from glass bottles is not collected due to less incentive.
Data obtained on recycling activities in MBM was mainly derived from the recycling activities that are known to MBM as well as some data from landfill scavenger activities. Very limited information is available on the recycling activities carried out by the recycle players particularly in the private sectors. Based on latest data given by MBM for recyclables collected in years 2003 and 2004, the total amount of recyclable materials collected as recorded by MBM is shown in Table 2.10.
The figures show that majority of the recyclables collected were papers. Some other categories of recyclables collected were glass, aluminium cans and car batteries. Plastics were not a common recyclable item in Miri in 2003 and 2004 but it was started to be collected in 2005. However, it should be noted that the data obtained is capturing only very limited portions of the total recycling activities in Miri, as many of the activities carried out by private recyclers are not well known by MBM. This is particularly true in the case of scrap metals and aluminium cans where data obtained by MBM from the private companies, are not actually reflecting the real situation as some private companies refused to give information on actual data.
Table 2.10 Types of Recyclables Collected in Miri, 2003-2004 Quantity (tons) N
o Recyclable 2001 2002 2003 2004
1 Old newspapers, carton boxes, mixed papers etc 295.09 2,160.88 3,037.77 3,282.60
2 Plastic - - - - 3 Glass - - - - 4 Aluminium cans 361.36 628.54 116.28 204.20 5 Metal - - - - 6 Old clothing - - 2.58 3.05 7 Batteries 1.78 19.61 114.49 178.46 8 Glass Bottle 0.15 22.38 122.12 231.10 9 Bottle Plastic 0.10 0.36 0.73 0.39
TOTAL 658.48 2,831.77 3,393.97 3,899.80 Source: MBM (2004)
In other words, the data obtained by MBM is covering very limited information of recycling activities in the areas. By using the equation of calculating recycling rate for year 2004, i.e.
Recycling rate (%) = Total Recyclables Collected (TRC) x 100%
TRC + Total Waste Disposed + Others
Recycling rate (%) = 3,899.8 t/year x 100% 3,899.8 t/year + (150.0 t/day) x 365
= 6.65% Note: It should be noted that the recycling rate calculated is showing only part of the recycling activities in MBM.

Local Action Plan in MB Miri
3-14
From this calculation, it is clearly shown that the recycling rate calculated is much lower as compared to the figure calculated for un-accounted waste, which is about 21.0% (Page 14). This is because many of the un-accounted wastes are being retained and recycled and are not known by MBM, and therefore the data on recyclables collected is not captured and reported.
Organic Recycling In addition, other recyclable materials such as electronic wastes, scrap computers etc. are not commonly being recycled at the moment. Some food wastes were used as animal feed especially by pig farmers, but the collected amount is very low. MBM’s owns two (2) units of High Speed Fermentation Machine called “Biomate”, to convert organic waste to fertilizer located in the Town Fish Market and Regional Market at Krokop Lorong 10 respectively. The former has yet to be commissioned. Some data from the one at Krokop Lorong 10 are as shown on Table 2.11 below:
Table 2.11 Data on Organic Recycling by Using Biomate Machine
Bacteria (kg)
Organic waste (kg)
Sawdust (kg)
Produced Compost / Fertilizer
February 2 315 40 107 March 1 1,240 62 417 April 1 1,072 90 360 May 1 967 75 333 June 1 1,110 62 360 July 1 797 118 378 August 1 887 25 155 September 1 824 23 174
Total 7,212 495 2,284
2.2.5 Other issues on Recycling in Miri Based on previous experience, some issues or problems learnt from recycling and waste minimisation activities in Miri are:
Recyclable collection is better for marketable items e.g. newspapers and cardboard cartons, collection of plastics and glass is still low.
Some recyclers are not known or not registered under MBM. No proper networking between the recyclers, industries, MBM and other
recycling players. Lack of human resources capacity, funds and technology. There is no formal collection of recyclables at source (households). No source separation, recyclable materials are normally mixed and dirty, which
require further sorting and cleaning. Low awareness / Lack of information and education on recycling. Many of the recycling centres / 3-colour bins located at various locations are not
being properly used.
Some possible countermeasures for these issues are summarised in Table 2.12 as follows:

Local Action Plan in MB Miri
3-15
Table 2.12 Issues on Recycling in MBM and the Countermeasures No Issues Possible Countermeasures
1 Recycling focuses only on certain materials
Find possible markets for recyclables from outside MBM
2 Many recyclers are not known
Create a registration system for recycling players within MBM areas
3 No proper networking between the recycling players
Proper database management and registration system to create networking between the recycling players
4 No formal collection of recyclables at source
Cooperation and incentives to collectors to collect recyclables from source; formally register the collectors that already collecting the recyclables from source.
5 No source separation Awareness campaigns to educate the public on source separation
6 Low awareness / Lack of information on recycling
Awareness campaigns to educate the public, setting up recycling plaza or recycling information centre for public (if necessary)
7 Many of the 3-colour bins are not properly used
Remove the unused recycling bins and relocate the bins at more strategic locations
8 Lack of human resource capacity, funds and technology
Provide training on recycling and waste minimisation to MBM officers (particularly the officers of Waste Minimisation Unit); getting sponsorship from various possible sponsors as well as federal government.
2.3 Improvement and Promotion of Waste Minimisation
There is no source separation and waste minimisation being carried out at households and business entities in MBM (except some materials are sorted out to be sold to collectors especially old newspapers and aluminium cans etc). Concepts of waste minimisation and source separation for recycling purpose are not introduced. Recycling activities carried out are mainly market driven due to the values of the recyclable materials.
There is no by-law, act and guideline on waste minimisation and source separation. There are generally three key issues that should be focused in the improvement of overall waste minimisation and recycling efforts in Miri, i.e. improvement of public awareness and attitudes, improvement of necessary infrastructure and improvement of regulations and enforcements.
2.3.1 Key Issues in Waste Minimisation
There are several core problems identified as key obstacles for waste minimisation efforts in Miri:
Low awareness / Lack of information and education on waste minimisation and source separation.
Mind-set of the public, not easy to accept new concepts and follow instructions. No allocation of proper bins and other required facilities. No proper recyclable collectors appointed for collection of separated wastes. Volumes of recyclable materials separated at source are too low and not feasible
to be collected. Lack of regulations, enforcements and financial constraints

Local Action Plan in MB Miri
3-16
Some possible countermeasures for these issues are summarised in Table 2.13 as follows:
Table 2.13 Issues on Waste Minimisation and Source Separation in MBM and the Possible Countermeasures
No Issues Possible Countermeasures
1
Low awareness / Lack of information and education on waste minimisation and source separation
Awareness campaigns to educate the public on concepts of waste minimisation and source separation
2 Mind-set of the public
Awareness campaigns to educate the public on concepts of waste minimisation and source separation; Education at school level with direct involvements of parents, teachers and school children
3 No allocation of proper bins and other required facilities
Provide appropriate recycling bins at curbside or community recycling bins; provide recycling plastic bags etc.
4 No proper recyclable collectors Cooperation with private contractors to collect recyclables; provision of incentives for private collectors, etc.
5 Volumes of recyclable materials separated at source are too low
Educate the public to properly handle and store the recyclables at source; Encourage active participation in community recycling bins / centre by incentives, etc; Provision of incentives for private collectors to collect recyclables at lower quantity from sources
6 Lack of regulations, enforcement and financial constraints
Establish by-law on recycling and waste minimisation (long term basis); strict enforcement on the registration of recycling players; monitor the prices of recyclable materials; raise funds by getting sponsorships from various possible sponsors as well as federal government.

Local Action Plan in MB Miri
3-17
CHAPTER 3 TARGETS OF WASTE MINIMISATION AND RRCYCLING
3.1 Projection of Future Waste Generation
The projection of future waste generation in MBM from households for years 2006 to 2010 was done and is summarised as follows, (assuming that there is no significant change in the waste composition):
Table 3.1 Projection of Waste Generation from Household (2006-2010) 2005 2006 2007 2008 2009 2010 Categories
(tons/year) 1 Food wastes 23,886.89 25,397.69 27,004.04 28,711.99 30,527.97 32,458.802 Waste papers 18,772.57 19,959.90 21,222.32 22,564.59 23,991.75 25,509.193 Plastics 4,873.65 5,181.90 5,509.64 5,858.11 6,228.63 6,622.584 Glass 2,105.90 2,239.09 2,380.71 2,531.28 2,691.38 2,861.615 Ferrous Metals 962.70 1,023.58 1,088.32 1,157.16 1,230.35 1,308.166 Aluminium 361.01 383.84 408.12 433.93 461.38 490.567 Others 9,205.78 9,788.03 10,407.10 11,065.33 11,765.19 12,509.31
TOTAL 60,168.49 63,974.03 68,020.26 72,322.40 76,896.65 81,760.21
Note: 1) Annual waste growth rate for household used = 2% 2) Population growth rate = 4.24% per year
3) Waste composition assumed to be unchanged
On the other hand, projection was also done for future waste generation in MBM for business entities from years 2006 to 2010 as shown in Table 3.2. It was again assumed that there was no significant change in the waste composition, as well as the total number of business entities.
Table 3.2 Projection of Wastes Generation from BE (2006-2010) 2005 2006 2007 2008 2009 2010 Categories
(tons/year) 1 Food wastes 4,641.85 5,032.21 5,455.40 5,914.18 6,411.54 6,950.722 Waste papers 8,309.17 9,007.94 9,765.47 10,586.71 11,477.01 12,442.183 Plastics 2,256.81 2,446.60 2,652.35 2,875.40 3,117.21 3,379.364 Glass 1,974.71 2,140.78 2,320.81 2,515.98 2,727.56 2,956.945 Ferrous Metals 743.72 806.27 874.07 947.58 1,027.26 1,113.656 Aluminium 230.81 250.22 271.26 294.08 318.81 345.627 Others 7,488.51 8,118.27 8,800.98 9,541.11 10,343.47 11,213.32
TOTAL 25,645.59 27,802.28 30,140.34 32,675.02 35,422.86 38,401.78
Note: 1) Annual waste growth rate for business entities used = 4% 2) Population growth rate = 4.24% per year
3) Waste composition assumed to be constant for the coming years
In summary, the total waste generation from both households and business entities are shown in Table 3.3 below:

Local Action Plan in MB Miri
3-18
Table 3.3 Projection of Total Wastes Generation in Miri (2006-2010) 2005 2006 2007 2008 2009 2010
Categories (tons/year)
1 Households 60,168.49 63,974.03 68,020.26 72,322.40 76,896.65 81,760.21
2 Business Entities 25,645.59 27,802.28 30,140.34 32,675.02 35,422.86 38,401.78
TOTAL 85,814.08 91,776.30 98,160.59 104,997.42 112,319.51 120,161.99
In terms of recyclable materials, the projection of the total main targeted recyclable materials generated in MBM from both households and business entities for year 2006 to 2010 is estimated as shown in Table 3.4 follows:
Table 3.4 Projection of Total Recyclables (2006-2010) 2005 2006 2007 2008 2009 2010 No Materials
(Tons/year) 1 Papers 27,081.74 28,967.83 30,987.79 33,151.30 35,468.76 37,951.362 Plastics 7,130.46 7,628.50 8,161.99 8,733.52 9,345.84 10,001.933 Glass 4,080.61 4,379.87 4,701.51 5,047.26 5,418.94 5,818.544 Ferrous Metals 1,706.42 1,829.85 1,962.39 2,104.73 2,257.61 2,421.815 Aluminium 591.82 634.06 679.38 728.01 780.19 836.18
Total 40,591.04 43,440.11 46,493.07 49,764.82 53,271.34 57,029.83
Note: 1) Annual waste growth rate for household used = 2%, business entities = 4% 2) Population growth rate = 4.24% per year 3) Papers include old newspapers, magazines, white papers and other paper categories
4) Ferrous Metals include scrap iron, steel cans etc.
3.2 Setting of Recycling Targets
As shown earlier, the recycling rate for year 2005 in MBM can be calculated as:
Recycling rate (%) = 3,899.8 t/year x 100% 3,899.8 t/year + (150.0 t/day) x 365
= 6.7%
Note: It should be noted that the recycling rate calculated is showing only part of the recycling activities in MBM.
This recycling rate is not total because many recyclables collected and recycled are not known by MBM especially the private collectors.
In general, the existing recycling activities in MBM can be categorised into 2 categories as shown in Figure 3.1 below. Only very limited information about the private recyclers are captured by MBM (overlapping areas):

Local Action Plan in MB Miri
3-19
Figure 3.1 The Overall Recycling Activities Based on the abovementioned, therefore the target for achieving a higher Recycling Rate should be established by capturing or registering more recycling players.
The target Recycling Rates for MBM from year 2006 to 2010 are shown in Table 3.5Table 3.5 below:
Table 3.5 Target Recycling Rate for MBM (2006 – 2010) Target Recycling Rate (%)
2005 2006 2007 2008 2009 2010
6.7% 8.0% 10.0% 12.0% 14.0% 16.0%
3.3 Summary of Key Figures on SWM and Recycling in MBM
In summary, the key figures obtained on SWM and recycling in MBM are summarised in Table 3.6:
Overall Recycling Activities
A) Reported / Captured Recycling Activities
B) Non-captured Private Recycling Activities
Recycling Centres operated by:
a) Concessionaires b) NGOs c) CBOs d) Charity organisations e) MHLG f) Local authorities g) Schools
Recycling activities carried out by:
a) Scavengers, truck workers, waste pickers
b) Scrap dealers, agents, middlemen, traders
c) Recycling industries

Local Action Plan in MB Miri
3-20
Table 3.6 Summary of Key Figures for MBM (Year 2005) No Parameters Figures
1 Total waste generated (tons/day): Per capita waste generation rate (kg/cap/day):
235.1 0.87
2 Total un-accounted waste (incl. retained) (tons/day): Per capita un-accounted waste rate (kg/cap/day):
49.5 0.18
3 Total waste discharged (tons/day): Per capita waste discharged rate (kg/cap/day):
186.5 0.69
4
Waste Compositions (%):
a) Food wastes b) Papers c) Plastics d) Glass e) Ferrous Metals f) Aluminium g) Others
37.0 31.4 8.2 4.0 1.8 0.6
17.0
5
Generation of major recyclable materials (tons/year)
a) Papers b) Metals c) Aluminium d) Plastics e) Glass
27,081.7 1,706.4 591.8
7,130.5 4,080.6
6
Current Recycling Rate
Targets: a) 2006 b) 2007 c) 2008 d) 2009 e) 2010
6.65%
8.0%
10.0% 12.0% 14.0% 16.0%
7
Other remarks:
Besides creating awareness to increase participation in recycling and waste minimisation, one of the main targets is to register and capture more recycling players (especially private recyclers), which will subsequently increase the Recycling Rate with more captured data on recyclable collected.

Local Action Plan in MB Miri
3-21
CHAPTER 4 ACTIONS TO ACHIEVE THE TARGETS
4.1 Main Approaches
In order to achieve the targets set in this LAP-WM, MBM has identified three (3) main approaches on the actions to be taken as shown below:
Approach 1: Institutional Setup at Management & Operation Levels
Approach 2: Registration of Existing Recycling Players
Approach 3: Increase Awareness and Recycling Practices
Specific activities or actions to be taken as proposed by MBM based on the local conditions and requirements for years 2006 to 2010 are described in the following sections.
4.2 Institutional Setup at Management and Operation Levels
4.2.1 Waste Minimisation Committee MBM recognises the importance of institutional setup at two levels, namely the top management level and operation level.
The senior management of MBM will be involved in overseeing the entire implementation of this LAP-WM. At top management level, a Waste Minimisation Committee will be set up as a forum for consolidating the reporting of progress and issues at the council meeting of MBM.
Under the LAP implementation period, the following activities will be carried out:
Setting up and endorsement of “Waste Minimisation Committee” Organise quarterly meetings to monitor and discuss the progress of the LAP
implementation; Prepare utilisation of yearly budget and undertake budget preparation for
2006 to 2010. The expected tasks or responsibilities of the members in the Waste Minimisation Committee are summarised in Table 4.1 below.

Local Action Plan in MB Miri
3-22
Table 4.1 Description of tasks and responsibilities at Management Level Position Task and responsibilities
Chairman of MBM • Provide advice to the overall direction of waste minimisation
City Secretary of MBM
• Report and seek advice from chairman • Provide advice to the Waste Minimisation
Committee • Endorsement of budget proposal
Waste Minimisation Committee (Senior Assistant Secretary)
• Chair Waste Minimisation Committee meeting every month
• Liaison with other existing committees • Report and seek advice from Mayor/ City Secretary • Report to MBM full council meeting on major
decision making related to waste minimisation
Assistant Secretary
• Report to chairman of Waste Minimisation Committee
• Report to section heads meeting on waste minimisation related issues
• Endorse budget proposed within section
City Services Officer
• Report to Assistant Secretary • Oversee and supervise the implementation of waste
minimisation plan • Preparation of yearly budget with Head of Solid
Waste Management and WMU
4.2.2 Waste Minimisation Unit (WMU)
On the operational side, the overall implementation of the LAP will be overseen by the Head of Solid Waste Management, supported by the Waste Minimisation Unit (WMU) which was established during the JICA Pilot Project in Miri. At initial stage in 2006, the WMU will be operated by 3 full time officers and few other supporting staff to take the lead in any programmes related to waste minimisation and recycling. Additional man-power will be secured to the unit from time to time including some contract staff.
The WMU will be spearheading the LAP implementation plan for MBM. A description of the tasks and responsibilities at operation level is outlined as follows:
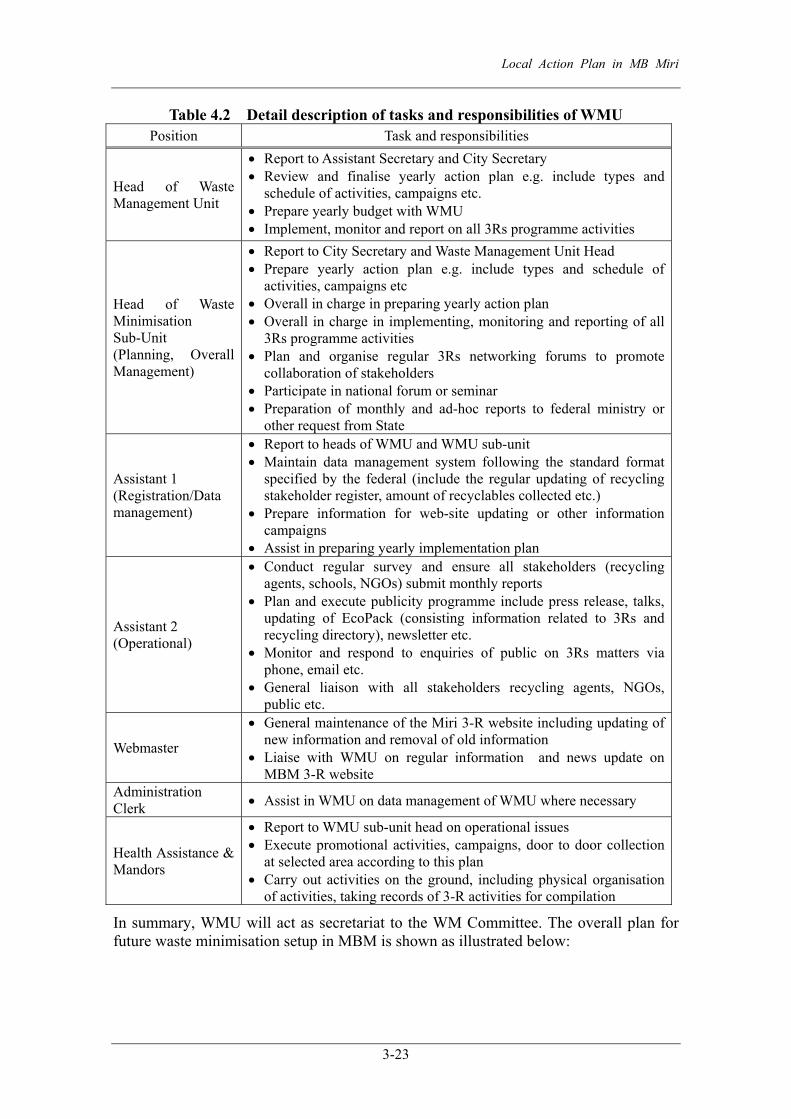
Local Action Plan in MB Miri
3-23
Table 4.2 Detail description of tasks and responsibilities of WMU Position Task and responsibilities
Head of Waste Management Unit
• Report to Assistant Secretary and City Secretary • Review and finalise yearly action plan e.g. include types and
schedule of activities, campaigns etc. • Prepare yearly budget with WMU • Implement, monitor and report on all 3Rs programme activities
Head of Waste Minimisation Sub-Unit (Planning, Overall Management)
• Report to City Secretary and Waste Management Unit Head • Prepare yearly action plan e.g. include types and schedule of
activities, campaigns etc • Overall in charge in preparing yearly action plan • Overall in charge in implementing, monitoring and reporting of all
3Rs programme activities • Plan and organise regular 3Rs networking forums to promote
collaboration of stakeholders • Participate in national forum or seminar • Preparation of monthly and ad-hoc reports to federal ministry or
other request from State
Assistant 1 (Registration/Data management)
• Report to heads of WMU and WMU sub-unit • Maintain data management system following the standard format
specified by the federal (include the regular updating of recycling stakeholder register, amount of recyclables collected etc.)
• Prepare information for web-site updating or other information campaigns
• Assist in preparing yearly implementation plan
Assistant 2 (Operational)
• Conduct regular survey and ensure all stakeholders (recycling agents, schools, NGOs) submit monthly reports
• Plan and execute publicity programme include press release, talks, updating of EcoPack (consisting information related to 3Rs and recycling directory), newsletter etc.
• Monitor and respond to enquiries of public on 3Rs matters via phone, email etc.
• General liaison with all stakeholders recycling agents, NGOs, public etc.
Webmaster
• General maintenance of the Miri 3-R website including updating of new information and removal of old information
• Liaise with WMU on regular information and news update on MBM 3-R website
Administration Clerk • Assist in WMU on data management of WMU where necessary
Health Assistance & Mandors
• Report to WMU sub-unit head on operational issues • Execute promotional activities, campaigns, door to door collection
at selected area according to this plan • Carry out activities on the ground, including physical organisation
of activities, taking records of 3-R activities for compilation
In summary, WMU will act as secretariat to the WM Committee. The overall plan for future waste minimisation setup in MBM is shown as illustrated below:

Local Action Plan in MB Miri
3-24
Figure 4.1 Future Waste Minimisation Organisation in MBM
4.3 Registration of Existing Recycling Players / Stakeholders
MBM recognises the importance of creating networking or partnership with the existing recycling players or stakeholders. Meetings at several levels of MBM will be organised to plan for possible effective strategies to register the existing recycling players within MBM areas.
At the top management level, WMU will assist the Waste Minimisation Committee to organise quarterly meetings and one of the important agendas to be discussed will be the strategies to carry out the registration.
4.3.1 Invitation to Stakeholder Workshop The first stakeholder workshop will be proposed in 2006, targeting the involvement of various stakeholders related to 3Rs such as recycling agents, NGOs, schools, private sectors, resident associations etc. The importance of the roles of the stakeholders in such workshop will be emphasised so that the stakeholders appreciate the recognition by MBM and subsequently provide cooperation to register with the council. Information about formal registration of 3Rs stakeholders in Miri will be announced in the workshop and opinions from the stakeholders will be well taken.
Assistant Secretary
City Services Officer
Waste Minimisation Committee Chaired by Senior Assistant Secretary (MBM)
Waste Minimisation Sub-Unit Planning, Overall Management
Assistant 1 Registration / Data
Management (Monitoring / Reporting)
Assistant 2 Operational
(Collection, Liaison & Publicity)
Health Assistance & Mandors
Administration Clerk Assist in administration & data
handling
Solid Waste Management Unit Head
Management Level
Operational Level

Local Action Plan in MB Miri
3-25
4.3.2 Voluntary and Pro-active Registration Upon approval by the top management with consideration of the opinions from stakeholders, a formal registration process of 3Rs stakeholders, particularly the 3rd level recycling players such as the recycling industries, middlemen or agents will be initiated by 2007. Under this registration system, the stakeholders are expected to register on voluntary basis. However, WMU will take initiative to also carry out pro-active registration of the stakeholders within the operational areas of MBM.
4.3.3 Mandatory Registration As long term solution, amendment on the Local Authority (Cleanliness) By-laws 1999 will be necessary so that to empower the local authorities to register and license recycling stakeholders on mandatory basis, particularly the recycling businesses. MBM will take initiative to bring the issues to be discussed in the Waste Minimisation Committee at top management level, so that the request to amend the by-law is forwarded to the State Cabinet through the City Secretary to the ministry. In addition to the amendment of by-law, discussion on other legal and economic instruments will be discussed at top management level of the Waste Minimisation Committee.
4.4 Increase Awareness and Recycling Practices
4.4.1 Awareness and Publicity
a) Eco-Pack, Information Leaflets and Press Release 3Rs leaflets and newly printed Eco-Pack will be distributed by WMU to public and other relevant stakeholders throughout the year, especially at 3Rs campaigns or other suitable events.
Regular press release, seminar talks, updating of 3Rs brochures will be prepared and conducted. On the other hand, National Waste Minimisation Master Plan and Guidelines will be adopted where appropriate.
b) 3Rs Magnet Calendar with 3Rs Activities Schedules A magnetic calendar with 3Rs activities schedules (e.g. 3Rs campaigns, door to door collection days etc.) will be prepared and distributed to the public as the publicity for the activities of each year.
c) 3Rs One-Stop Centre The WMU will act as a one stop 3Rs centre open for public. Queries, comments and requests via MBM website will be well taken for immediate further action.
4.4.2 Source Separation Programmes
a) 3Rs Campaigns with Incentives The WMU will plan and carry out 3Rs Campaigns quarterly (proposed in the end of January, April, July and October) based on the successful Pilot Project experiences in 2005. “Guideline for Source Separation” and “3Rs Action Guide” developed by JICA will be referred. Types of incentives will be decided at the WMU internal meeting and alternative incentives at different campaigns and locations will be recommended. Other than residential areas, alternative campaign locations such as shopping malls (Boulevard) or schools will be organised based on further discussion with these entities.

Local Action Plan in MB Miri
3-26
In conjunction with these campaigns, other awareness events will be jointly organised such as flea market, education talks by invited speakers on specific subject (source separation, composting etc.), launching of new source separation programme or facilities, lucky draw or quiz and so forth.
b) Door to Door Source Sorting Collection MBM will continue the door to door source sorting at Krokop area (the Pilot Project area). The frequency of collection will be scheduled to once a month and the collection day will be coordinated to avoid coinciding with any other 3Rs campaigns in Miri.
Planning and expansion of door to door system to other areas such as Bumiko area will be reviewed and considered. The WMU will prepare source sorting equipment (recycling bags and carton boxes) to be distributed to target groups. The source sorting information and guides will be printed on these bags and boxes to reduce the need of separate leaflet distribution.
c) Source Sorting Programmes for Hotels and Shopping Malls The 3Rs programme at Dynasty Hotel under the JICA Pilot Project will be followed up. Possible expansion of hotel programmes within the same and other hotels in Miri will be discussed and considered.
On the other hand, WMU will take pro-active approach to follow up on the cooperation with shopping malls such as Boulevard in Miri. The possible cooperation includes:
Promotional events to be held in shopping malls Introduction of waste minimisation within the shopping premises, including the
reduction of plastic bags usage, office 3Rs programme etc. Setting up permanent 3Rs exchange counters in shopping malls with
involvement of incentives managed by the shopping management Setting up 3Rs collection centres within the premises of shopping malls Organise flea markets and shops selling 2nd hand items
The programmes itemised above will be planned and implemented in throughout the 5-year duration of the LAP from 2006 to 2010.
d) 3Rs Awards 2006 and Other School Programmes WMU will collaborate with the Miri Local Agenda 21 Solid Waste Reduction Group to carry out the yearly 3Rs Awards in Miri. The WMU will support the implementation of the 3Rs award and provide necessary support to participating schools. These include the distribution of the 3Rs Resource Kit (produced under the JICA Waste Minimisation Study Pilot Project) or other relevant information material. The WMU will also support setting up 3Rs facilities in collaboration with the NREB PALS programme. The “Guideline for 3Rs in Schools” developed by JICA will be used as the main reference source for implementation of programmes in schools.
e) Other Actions to be taken The WMU will collaborate with the LA 21 Solid Waste Reduction Group to carry out initiatives related to plastic reduction as well as composting.
4.5 Capacity Building
Capacity building programme for WMU will be intensified. The area of training will be identified and include the following possible areas:

Local Action Plan in MB Miri
3-27
Organisation skills such as management of programmes, monitoring and reporting skills Promotional skills such as public relations and participation skills, public
speaking. Technical training such as recycling technologies, systems.
The WMU will participate at national forums and workshops to ensure the 3Rs implementation in MBM is in line with national policies. Exchange of information with stakeholders or other LAs will be achieved through these events.
4.6 Cost Implication
The cost implication of the Action Plan depends on the implementation approach. No significant capital costs are involved in the implementation of Action Plan except some allocation of recycling bins, printing and distribution of pamphlets or flyers depending on the extent of implementation. Operating costs are more significant in terms of manpower involvements. Some relevant cost items and options in implementation of this Action Plan are listed in Table 4.3 below:
Table 4.3 Cost Items for the Implementation of Local Action Plan No Approaches Cost Items
1 Institutional Setup at Management and Operational Level
Establish new unit / Expand existing unit (established under the JICA Pilot Project) with new premise, facility, and manpower. Set up exhibition, information centre and drop off centre. Publicity on the WMU established
Optional: Restructure or mobilise existing manpower internally,
utilizing available premise and facilities.
2 Registration of Recycling Players
Set up new facility and system for registration. Design and creation of registration forms, printing and
distribution. Publicise information on the website to call for registration. Mobilise manpower to pro-actively register the players
Optional: Publicise on existing MBM website.
Pro-active registration using existing MBM team

Local Action Plan in MB Miri
3-28
No Approaches Cost Items
3 Increase Awareness and Recycling Practices
Organizing stakeholder workshops Publishing eco-pack, leaflets and publicity Implement awareness campaigns etc (such as road-shows,
demonstration and awareness talk in schools etc.) Continue previous Pilot Project on source separation at
shopping malls, schools, hotels and residential areas Establish more recycling centres Provision of incentives (parking coupons etc) Capacity Building of WMU Other expenses (such as printing and distribution of
pamphlets, flyers, booklets, magnetic calendar etc.
Optional: Acquire supports or sponsorships from other sources for
implementation of awareness and recycling campaigns.
Note: 1) Operational expenses include all expenses of implementing the registration system, data management, awareness campaigns, monitoring and evaluation etc.
2) Other possible costs not counted are such as incentives on tax reduction, subsidies on purchase of recycling related machinery and equipment etc.
Rough lump sump estimation on the budget required for each item of the implementation of A/P on 5 years basis is summarised as follows:
Table 4.4 Rough Budget Estimation for Implementation of Action Plan No Descriptions Budget (RM)
1 Expansion of “Waste Minimisation Unit (WMU)” under Pilot Project - Computers with accessories, furniture and other consumables etc. (Capital costs)
50,000
2 Setting up of facilities for drop off and recycling information – Computers, furniture, exhibition boards, materials for distribution, recycling bins and other consumables etc. (Capital costs)
100,000
3 Establish additional recycling centres as necessary – estimation of 10 recycling centres with simple structure and set up (Capital Costs).
200,000
4 Operational Expenses – Publicity, manpower, utility costs, transportation, maintenance and other miscellaneous operational expenses (RM500,000/year x 5 years)
2,500,000
5 Implement awareness campaigns etc (assuming 4 campaigns per year at RM200,000/each x 5 years)
4,000,000
6 Organisation of workshops, meetings and capacity building programmes - Assuming RM100,000/year x 5 years
500,000
7 Other expenses (such as printing and distribution of flyers, pamphlets, magnetic calendar, booklets to schools, manufacturers, business entities etc.) – Assuming RM300,000/year x 5 years
1,500,000
TOTAL 8,850,000
AVERAGE PER YEAR 1,770,000Note: 1) Actual budget required could be varied depending on many technical and financial factors 2) Capital costs shown are excluding building cost and rental etc. In conclusion, the actions to be taken by MBM in this LAP can be summarised in Table 4.5 below, while Figure 4.2 shows the overall frameworks for the actions to be taken in LAP-WM of MBM:

Local Action Plan in MB Miri
3-29
Tabl
e 4.
5 S
umm
ary
of A
ctio
ns to
be
take
n fo
r Was
te M
inim
isat
ion
in M
BM
A
ctiv
ities
Im
plem
enta
tion
Perio
d Ta
sks A
lloca
tion
and
Rem
arks
Org
anis
atio
n / C
oord
inat
ion
Mee
tings
Was
te
Min
imis
atio
n C
omm
ittee
Mee
ting
Qua
rterly
for
eac
h ye
ar f
rom
200
6 to
20
10, p
ropo
sed
to se
t aro
und
# M
arch
, Jun
e, S
epte
mbe
r
and
Dec
embe
r
• To
be
chai
red
by S
enio
r Ass
ista
nt S
ecre
tary
•
Ass
ista
nt S
ecre
tary
to le
ad th
e pr
epar
atio
n an
d or
gani
satio
n of
the
mee
ting
toge
ther
with
C
ity S
ervi
ces O
ffice
r, an
d he
ad o
f WM
U
WM
U In
tern
al M
eetin
g M
onth
ly (l
ast w
eek
of th
e m
onth
) •
To b
e ch
aire
d by
City
Ser
vice
s Offi
cer,
atte
nded
by
SWM
uni
t hea
d an
d W
MU
•
WM
U to
pre
pare
and
pre
sent
in th
e m
eetin
gs
• In
vita
tion
of o
ther
s to
join
bas
ed o
n ne
eds
Stak
ehol
der
Net
wor
king
W
orks
hop
Plan
ned
for
each
ye
ar,
first
to
be
or
gani
sed
in 2
006
• W
MU
to o
rgan
ise
and
prep
are
info
rmat
ion
for d
isse
min
atio
n •
Seni
or m
anag
emen
t to
be in
vite
d to
offi
ciat
e an
d at
tend
the
mee
ting
• W
MU
will
follo
w u
p on
upd
atin
g of
recy
clin
g st
akeh
olde
r and
dat
a fo
llow
up
• To
dis
cuss
form
al re
gist
ratio
n of
recy
clin
g st
akeh
olde
rs
Ad-h
oc m
eetin
gs
Dep
endi
ng o
n ne
eds a
nd e
vent
s •
Ass
ista
nt S
ecre
tary
to c
onsu
lt w
ith C
ity S
ervi
ces O
ffice
r to
dete
rmin
e w
ho sh
ould
atte
nd
• To
pre
sent
exp
erie
nces
of M
BM
and
exc
hang
e ex
perie
nces
Reg
istra
tion
and
Lice
nsin
g of
Rec
yclin
g St
akeh
olde
rs
Targ
et t
o be
Ini
tiate
d in
200
7 af
ter
the
Stak
ehol
der
wor
ksho
p;
man
dato
ry
regi
stra
tion
by 2
008
• A
ssis
tant
Sec
reta
ry a
nd W
MU
to
prep
are
deta
ils o
f re
gist
ratio
n, l
icen
sing
and
leg
al
amen
dmen
ts re
quire
d •
To in
itiat
e le
gisl
ativ
e am
endm
ents
Econ
omic
Inst
rum
ents
D
epen
ding
on
need
s and
eve
nts
• To
bra
inst
orm
and
sho
rtlis
t eco
nom
ic in
stru
men
ts fo
r enc
oura
ging
the
was
te m
inim
isat
ion
impl
emen
tatio
n Aw
aren
ess
and
Pub
licity
Eco-
Pack
, Le
afle
ts,
3Rs
mag
netic
ca
lend
ar
and
Pres
s Rel
ease
Dis
tribu
ted
thro
ugho
ut th
e w
hole
dur
atio
n of
200
6-20
10
• W
MU
to d
esig
n, p
repa
re a
nd d
istri
bute
•
Pres
s re
leas
e to
be
draf
ted
by W
MU
, ve
tted
by A
ssis
tant
Sec
reta
ry,
appr
oved
by
City
Se
cret
ary
befo
re h
ande
d to
MB
M
• C
ham
pion
Cr B
erni
ce to
be
invi
ted
to a
ssis
t in
the
prom
otio
n •
WM
U to
revi
ew a
nd a
dopt
oth
er n
atio
nal a
nd st
ate
leve
l mas
ter p
lans
and
gui
delin
es
3Rs W
ebsi
te
Thro
ugho
ut
the
who
le
dura
tion
of
2006
-201
0
• H
ostin
g of
3R
s web
site
und
er M
BM
web
site
by
web
mas
ter T
hom
as
• B
udge
t pre
para
tion
for r
edire
ctio
n of
ww
w.m
iri3r
.net
•
Upd
ate
the
web
site
eve
ry m
onth
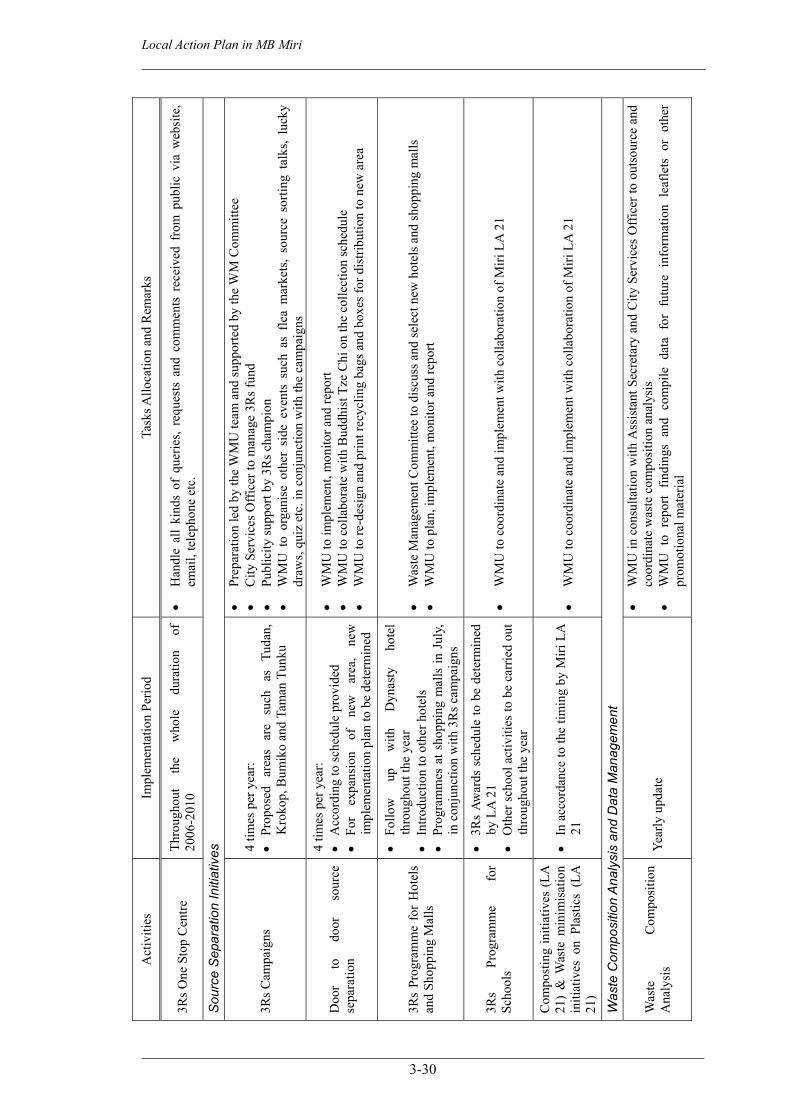
Local Action Plan in MB Miri
3-30
Act
iviti
es
Impl
emen
tatio
n Pe
riod
Task
s Allo
catio
n an
d R
emar
ks
3Rs O
ne S
top
Cen
tre
Thro
ugho
ut
the
who
le
dura
tion
of
2006
-201
0 •
Han
dle
all
kind
s of
que
ries,
requ
ests
and
com
men
ts r
ecei
ved
from
pub
lic v
ia w
ebsi
te,
emai
l, te
leph
one
etc.
Sou
rce
Sep
arat
ion
Initi
ativ
es
3Rs C
ampa
igns
4
times
per
yea
r: •
Prop
osed
ar
eas
are
such
as
Tu
dan,
K
roko
p, B
umik
o an
d Ta
man
Tun
ku
• Pr
epar
atio
n le
d by
the
WM
U te
am a
nd su
ppor
ted
by th
e W
M C
omm
ittee
•
City
Ser
vice
s Offi
cer t
o m
anag
e 3R
s fun
d •
Publ
icity
supp
ort b
y 3R
s cha
mpi
on
• W
MU
to
orga
nise
oth
er s
ide
even
ts s
uch
as f
lea
mar
kets
, so
urce
sor
ting
talk
s, lu
cky
draw
s, qu
iz e
tc. i
n co
njun
ctio
n w
ith th
e ca
mpa
igns
Doo
r to
do
or
sour
ce
sepa
ratio
n
4 tim
es p
er y
ear:
• A
ccor
ding
to sc
hedu
le p
rovi
ded
• Fo
r ex
pans
ion
of
new
ar
ea,
new
im
plem
enta
tion
plan
to b
e de
term
ined
• W
MU
to im
plem
ent,
mon
itor a
nd re
port
• W
MU
to c
olla
bora
te w
ith B
uddh
ist T
ze C
hi o
n th
e co
llect
ion
sche
dule
•
WM
U to
re-d
esig
n an
d pr
int r
ecyc
ling
bags
and
box
es fo
r dis
tribu
tion
to n
ew a
rea
3Rs
Prog
ram
me
for
Hot
els
and
Shop
ping
Mal
ls
• Fo
llow
up
w
ith
Dyn
asty
ho
tel
thro
ugho
ut th
e ye
ar
• In
trodu
ctio
n to
oth
er h
otel
s •
Prog
ram
mes
at s
hopp
ing
mal
ls in
Jul
y,
in c
onju
nctio
n w
ith 3
Rs c
ampa
igns
• W
aste
Man
agem
ent C
omm
ittee
to d
iscu
ss a
nd se
lect
new
hot
els a
nd sh
oppi
ng m
alls
•
WM
U to
pla
n, im
plem
ent,
mon
itor a
nd re
port
3Rs
Prog
ram
me
for
Scho
ols
• 3R
s Aw
ards
sch
edul
e to
be
dete
rmin
ed
by L
A 2
1 •
Oth
er s
choo
l act
iviti
es to
be
carr
ied
out
thro
ugho
ut th
e ye
ar
• W
MU
to c
oord
inat
e an
d im
plem
ent w
ith c
olla
bora
tion
of M
iri L
A 2
1
Com
post
ing
initi
ativ
es (L
A
21)
& W
aste
min
imis
atio
n in
itiat
ives
on
Plas
tics
(LA
21
)
• In
acc
orda
nce
to th
e tim
ing
by M
iri L
A
21
• W
MU
to c
oord
inat
e an
d im
plem
ent w
ith c
olla
bora
tion
of M
iri L
A 2
1
Was
te C
ompo
sitio
n A
naly
sis
and
Dat
a M
anag
emen
t
Was
te
Com
posi
tion
Ana
lysi
s Ye
arly
upd
ate
• W
MU
in c
onsu
ltatio
n w
ith A
ssis
tant
Sec
reta
ry a
nd C
ity S
ervi
ces
Offi
cer t
o ou
tsou
rce
and
coor
dina
te w
aste
com
posi
tion
anal
ysis
•
WM
U t
o re
port
findi
ngs
and
com
pile
dat
a fo
r fu
ture
inf
orm
atio
n le
afle
ts o
r ot
her
prom
otio
nal m
ater
ial

Local Action Plan in MB Miri
3-31
Act
iviti
es
Impl
emen
tatio
n Pe
riod
Task
s Allo
catio
n an
d R
emar
ks
Dat
a M
anag
emen
t
Thro
ugho
ut
the
who
le
dura
tion
of
2006
-201
0
• W
MU
to c
olle
ct a
nd p
opul
ate
data
acc
ordi
ng to
MH
LG fo
rmat
•
WM
U to
repo
rt to
MB
M m
anag
emen
t and
MH
LG m
onth
ly
• W
MU
to p
repa
re a
nd re
spon
se to
ad-
hoc
data
/ in
form
atio
n re
ques
t
Cap
acity
Bui
ldin
g A
ctiv
ities
Nat
iona
l fo
rum
, se
min
ar
and
othe
r tra
inin
gs
Dep
endi
ng o
n sc
hedu
le o
f N
atio
nal
leve
l W
aste
Min
imis
atio
n an
d ot
her
sem
inar
s th
roug
hout
the
who
le d
urat
ion
of 2
006
- 20
10
• A
ssis
tant
Sec
reta
ry to
del
egat
e of
ficer
s to
atte
nd a
nd p
rese
nt e
xper
ienc
e w
here
app
ropr
iate
•
WM
U t
o at
tend
app
ropr
iate
tra
inin
g co
urse
s re
late
d to
org
anis
atio
n, p
rom
otio
nal
and
tech
nica
l ski
lls
Wor
k A
ttach
men
t D
epen
ding
on
need
s •
Ass
ista
nt S
ecre
tary
to c
onta
ct o
ther
LA
s for
the
1 w
eek
wor
k at
tach
men
t •
WM
U to
atte
nd th
e w
ork
atta
chm
ent a
nd re
port
Stud
y V
isit
Oct
ober
• Pr
ogra
mm
es a
nd p
repa
ratio
n by
WM
U
• To
be
appr
oved
by
Was
te M
inim
isat
ion
Com
mitt
ee
• A
ttend
ance
to b
e de
cide
d by
Was
te M
inim
isat
ion
Com
mitt
ee
• W
MU
to a
ct a
s sec
reta
riat a
nd re
port
from
trip
s

Local Action Plan in MB Miri
3-32
Figu
re 4
.2
Ove
rall
Fram
ewor
ks fo
r th
e Act
ions
to b
e ta
ken
in th
e L
ocal
Act
ion
Plan
Was
te M
inim
isat
ion
Uni
t
MB
M
Impl
emen
t
Enf
orce
Mon
itor
1: In
stitu
tiona
l Set
up
2: R
egis
tratio
n of
Rec
yclin
g P
laye
rs
3. A
war
enes
s an
d R
ecyc
ling
Pra
ctic
es
Coo
rdin
ate
Rec
yclin
g P
laye
rs
Reg
iste
rR
epor
ting
Net
wor
king
Inpu
t fro
m re
leva
nt
Stak
ehol
ders
(suc
h as
St
ate
Gov
ernm
ent)
Inpu
t fro
m re
leva
nt
Stak
ehol
ders
(suc
h as
M
HLG
)
Ince
ntiv
es
Pol
icy
Sup
ports
By-
law
s

Local Action Plan in MB Miri
3-33
CHAPTER 5 MONITORING AND IMPLEMENTATION SCHEDULE FOR THE ACTION PLAN
5.1 Monitoring and Evaluating the Performance
In order to monitor and evaluate the progress and performance of the recycling activities in MBM as targeted in this A/P, some indicators and measures shall be established, as shown in Table 5.1 below:
Table 5.1 Examples of Performance Indicators and Measures Performance
No Indicator Measures
1 Quantity of wastes generated from sources (households, business entities, industries etc.)
Carry out questionnaire surveys, or primary data collection.
2 Quantity of disposed wastes to landfill site
Carry out data collection from the landfill site (weighbridge data).
3 Quality of waste retained at sources (households, business entities, industries etc.)
Observation on the waste separation efforts, as well as the waste handling methods
4 Number of recycling players registered
Establish a recycling unit or taskforce to carry out registration of the recycling players.
5 Quantity of recyclables collected by the registered recycling players
Establish a recycling unit or taskforce to collect reports and analyse the data reported by the recycling players.
6 Quantity of recyclables collected by using the public recycling bins / centres
Carry out inspection and recording on the quantity of recyclable materials collected in the public recycling bins / centres.
7 Quantity of specific recyclable materials collected (such as papers, glass, plastics etc.)
Carry out analysis on the data collected on each particular recyclable material.
5.2 Periodical Reporting
In order to obtain reliable performance measures, accurate, reliable and regular data collection is crucial. Some periodical reporting that is required to monitor and evaluate the progress and performance of the recycling activities in MBM is listed as follows:

Local Action Plan in MB Miri
3-34
Table 5.2 Reporting of Data Required for Monitoring of Performance
No Regular Data Collection Recommended Frequency
1 Reports from registered recycling players, and/or compilation of recycling information system Monthly
2 Reports from public recycling bins / centres on the quantity of recyclable materials collected Monthly
3 Questionnaires to the registered recycling players to determine the issues, problems faced and comments from the players to improve the entire recycling practices
Quarterly
4
Questionnaires to the selected numbers of waste generation sources (households, BEs and industries etc.) to find out the practice of waste retained, waste handling and subsequently to determine the issues, problems faced and comments from the waste generators to improve the entire recycling system
Yearly
5 Annual reports on the development and implementation of the overall waste minimisation and recycling programmed Yearly
6 Annual workshop with the registered recycling players Yearly All the reports in relation to waste minimisation and recycling in MBM should be directly under the responsibility of the “Recycling Unit” or “Recycling Taskforce”. The collected data should be compiled, analysed and reported to related authorities such as the Ministry of Housing and Local Government (MHLG) and State Government etc. The suggested framework for entire reporting system is shown as follows:
Figure 5.1 Suggested Framework for Entire Reporting System
5.3 Implementation Schedule of Action Plan
The entire A/P is made for the duration of 5 years from 2006 to 2010. The summary of the proposed schedule of the implementation of this A/P is:
“Waste Minimisation Unit”
Higher Authority of MBM
Ministry of Housing and
Local Government
State Government
Others
Data from Recycling Players
Data from Field Surveys
Other relevant Data
Data Collection Data CollectionData Collection
Data Analysis and Compilation
Report submission

Local Action Plan in MB Miri
3-35
Table 5.3 Proposed Schedule for Implementation of Action Plan No Action Plan 2006 2007 2008 2009 2010
1 Institutional set-up at management and operational levels
2 Expansion of the existing “Waste Minimisation Unit (WMU)” within MBM
3
Organise yearly stakeholder workshop, establish and announcement of formal registration system for recycling players in 2006
4 Voluntary and pro-active registration of stakeholders
5 Mandatory registration of stakeholders
6 Establish a 3Rs one-stop centre
7 Awareness and publicity through update of eco-pack, leaflets, magnetic calendar and press release
8 Implement source separation programmes as continuation of Pilot Project as well as new programmes
9 Education programmes in schools, 3Rs award programmes
10 Provision of incentives (such as parking coupons, shopping vouchers etc.)
11 Capacity building to WMU officers
12 Monitoring and periodical reporting

Local Action Plan in MB Miri
3-36
Appendices

Local Action Plan in MB Miri
3-37
APPENDIX A
REGISTRATION FORM FOR RECYCLING PLAYERS
Registration ID: _________ Name (Company / Individual)
Category of Business Sendirian Berhad Enterprise Individual
Year of Incorporation
Number of Employees Type of
Business
Door to Door Agent / Middlemen / Trader Recycling Centre Recycling Industry Others ( _________________) Annual Sales
(Turnover)
Phone
Fax
Address
Aluminium Glass Others ___________
Cardboard Scrap Metal (Iron) Others ___________
Plastics E-wastes Others ___________
Types of Recyclables Collected
Papers Batteries Others ___________
1) Mon Tue Wed Thu Fri Sat Sun
2) Mon Tue Wed Thu Fri Sat Sun
3) Mon Tue Wed Thu Fri Sat Sun
4) Mon Tue Wed Thu Fri Sat Sun
5) Mon Tue Wed Thu Fri Sat Sun
Areas of Collection within MBM
6) Mon Tue Wed Thu Fri Sat Sun
1) Mon Tue Wed Thu Fri Sat Sun
2) Mon Tue Wed Thu Fri Sat Sun
3) Mon Tue Wed Thu Fri Sat Sun
4) Mon Tue Wed Thu Fri Sat Sun
5) Mon Tue Wed Thu Fri Sat Sun
Areas of Collection Outside MBM
6) Mon Tue Wed Thu Fri Sat Sun

Local Action Plan in MB Miri
3-38
APPENDIX B DATA RECORDING FORM FOR RECYCLING PLAYERS
Reporting Month: __________________ Name (Company / Individual)
Registration ID
Amount of Recyclable Materials Collected:
Types Amount / month Unit Source (from) Buyers (To)
Aluminium
Cardboard
Plastics
Papers
Glass
Scrap Metal (Iron)
E-wastes
Batteries
Others ___________
Others ___________
Others ___________
Within MBM Areas
Others ___________
Types Amount / month Unit Source (from) Buyers (To)
Aluminium
Cardboard
Plastics
Papers
Glass
Scrap Metal (Iron)
E-wastes
Batteries
Others ___________
Others ___________
Others ___________
Outside MBM Areas
Others ___________

Local Action Plan in MB Miri
3-39
References

Local Action Plan in MB Miri
3-40
References Agamuthu, P. (2003) Solid Waste: Principles and Management. Universiti Malaya Press. Hassan M. N., L. C. Theng, M. M. Rahman and M. Awang (2001). Recycling Model in
Developing Countries – An Illustration for Malaysia. R’02 – Integrated Resources Management. The 6th World Congress with Company Displays. Switzerland.
Hassan M. N., L. C. Theng, M. M. Rahman, M. N. Salleh and M. Awang (2001). Solid
Waste Management – What’s the Malaysian Position? In: Jahi, J. M., K. Sopian, M. J. M. Nor and A. H. H. Shah [Eds.] Environmental Management 2000 – Proceedings National Seminar on Environmental Issues and Challenges in Malaysia. UKM.
Japan International Cooperation Agency (2002). Project Formulation Study for
Promotion of Solid Waste Recycling in Malaysia (Final Report). JICA Study Team on National Waste Minimisation in Malaysia (2005). Survey on Waste
Generation and Recycling by Business Entities and Households (Final Report). JICA Study Team on National Waste Minimisation in Malaysia (2005). Survey on Waste
Generation / Composition and Questionnaires on Selected Households in Kuala Lumpur (Final Report).
JICA Study Team on National Waste Minimisation in Malaysia (2005). Survey on
Material Flows of Recyclables in Malaysia (Final Report). Local Government Department (2002). National Strategic Plan for Solid Waste
Management (Draft Final Report). Majlis Bandaraya Miri (2003). Miri’s EcoPack – 3Rs: Turning your Waste into
Resources.
By:Majlis Bandaraya Miri (MCC)
Supported by:Ministry of Housing and Local Government (MHLG)
Japan International Cooperation Agency (JICA)
“3R
s for a Better Tom
orrow "
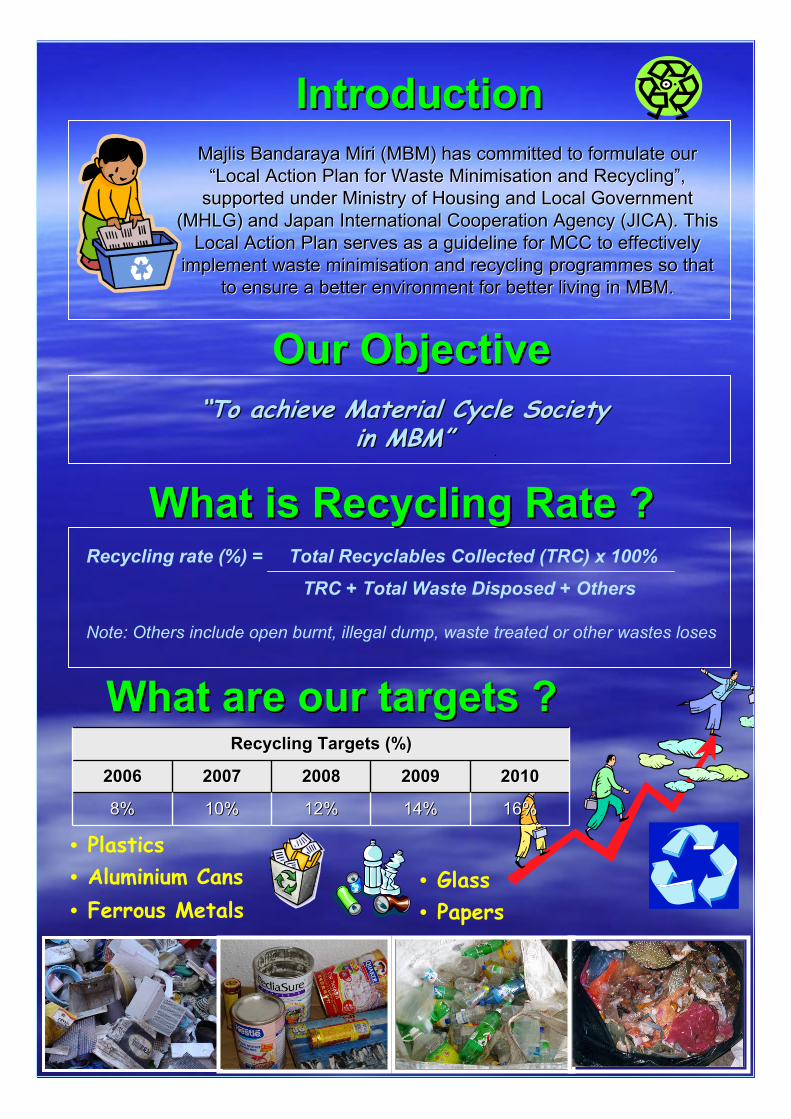
Recycling rate (%) = Total Recyclables Collected (TRC) x 100%
TRC + Total Waste Disposed + Others
Note: Others include open burnt, illegal dump, waste treated or other wastes loses
““To achieve Material Cycle Society To achieve Material Cycle Society in MBMin MBM””
Recycling Targets (%)Recycling Targets (%)
16%16%14%14%12%12%10%10%8%8%
2010201020092009200820082007200720062006
• Papers
• Plastics• Aluminium Cans• Ferrous Metals
• Glass
IntroductionIntroductionMajlis Bandaraya Miri (MMajlis Bandaraya Miri (MBMBM) has committed to formulate our ) has committed to formulate our
“Local Action Plan for Waste Minimisation and Recycling”, “Local Action Plan for Waste Minimisation and Recycling”, supported under Ministry of Housing and Local Government supported under Ministry of Housing and Local Government
(MHLG) and Japan International Cooperation Agency (JICA). This (MHLG) and Japan International Cooperation Agency (JICA). This Local Action Plan serves as a guideline for MCC to effectively Local Action Plan serves as a guideline for MCC to effectively
implement waste minimisation and recycling programmes so that implement waste minimisation and recycling programmes so that to ensure a better environment for better living in Mto ensure a better environment for better living in MBMBM..
What are our targets ?What are our targets ?
What is Recycling Rate ? What is Recycling Rate ?
Our ObjectiveOur Objective

What are your responsibilities ?What are your responsibilities ?• No matter you are an individual, office, hotel,
business entity, school, factory etc… take ACTIONS !!
• Avoid using disposables, use durable products• Share magazines, newspapers with others• Use shopping bags / own food container• Use less packaging products• Use more electronic copies than printed copies• Use refillable cartridges /inks• Educate children/employees/staff on waste
minimisation• Reduce unnecessary wastage (food etc.)
• Reuse empty bottles / containers• Reuse old newspapers / waste papers for wrapping etc. • Use both sides of papers• Feed food residues to animals• Educate children/employees/staff on reuse of wastes
• Separate recyclable materials from wastes for collection
• Bring / sell recyclables to collectors / centres• Carry out composting of organic wastes (such as food
residues, garden wastes etc.) • Educate children/employees/staff on recycling • Participate in recycling campaigns / activities
Individual
Office
Hotel
Business entity
Factory
School
• If you are a recycling player (collector / middleman / agent / industry etc.)
Please register with MBM !!Please register with MBM !!
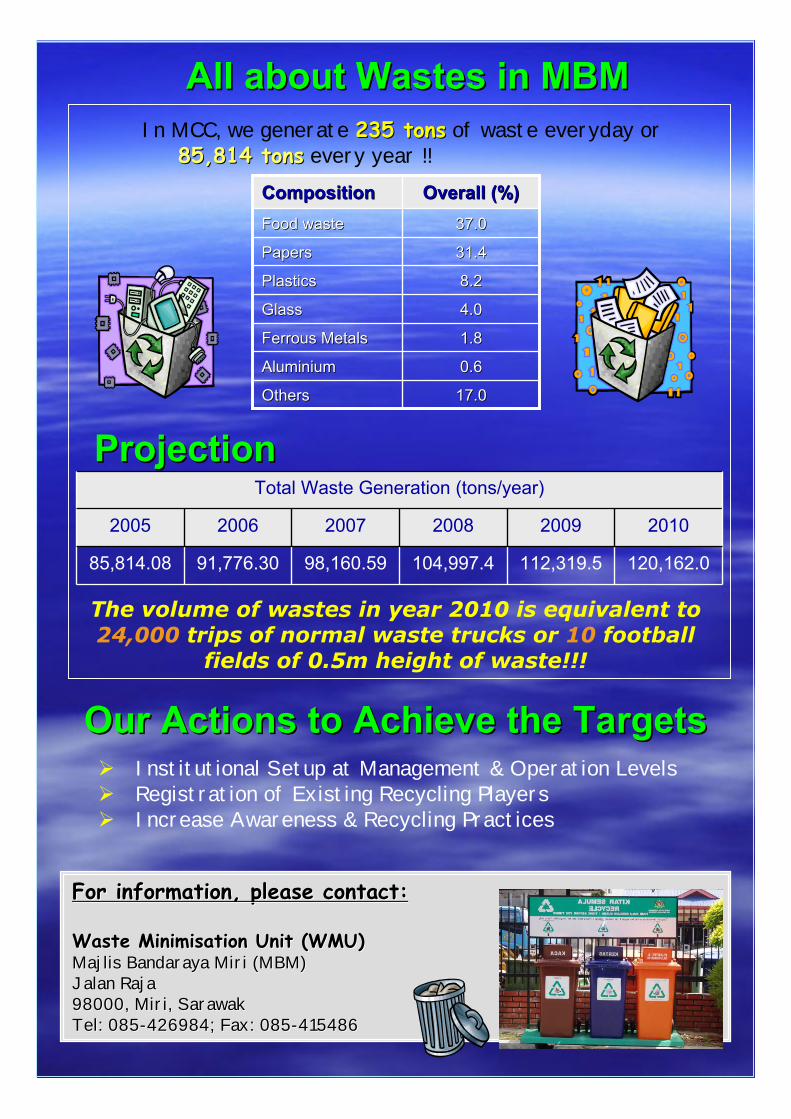
For information, please contact: For information, please contact:
Waste Waste MinimisationMinimisation Unit (WMU)Unit (WMU)Majlis Bandaraya Miri (MBM)Majlis Bandaraya Miri (MBM)JalanJalan RajaRaja98000, Miri, Sarawak98000, Miri, SarawakTel: 085Tel: 085--426984; Fax: 085426984; Fax: 085--415486415486
All about Wastes in MBMAll about Wastes in MBMIn MCC, we generate 235 tons235 tons of waste everyday or
85,814 tons85,814 tons every year !!Overall (%)Overall (%)CompositionComposition
37.037.0Food wasteFood waste
31.431.4PapersPapers
8.28.2PlasticsPlastics
4.04.0GlassGlass
1.81.8Ferrous MetalsFerrous Metals
0.60.6AluminiumAluminium
17.017.0OthersOthers
Total Waste Generation (tons/year)
120,162.0112,319.5104,997.498,160.5991,776.3085,814.08
201020092008200720062005
ProjectionProjection
The volume of wastes in year 2010 is equivalent to 24,000 trips of normal waste trucks or 10 football
fields of 0.5m height of waste!!!
Our Actions to Achieve the TargetsOur Actions to Achieve the TargetsInstitutional Setup at Management & Operation LevelsRegistration of Existing Recycling PlayersIncrease Awareness & Recycling Practices
PART 4
LOCAL ACTION PLAN IN MP Pulau Pinang


“KURANGKAN SISA PEPEJAL,
TINGKATKAN KUALITI HIDUP”
(Reduce Solid Waste, Enhance Quality of Life) WASTE MINIMISATION
MPPP LOCAL ACTION PLAN (2006- 2010)

Local Action Plan in MP Pulau Pinang
i
Table of Contents
Table of Contents Preface Pulau Pinang Fact Sheet Abbreviations Key Definitions
Chapter 1 Introduction ....................................................................................................... 4-1 1.1 Service Area .....................................................................................................................4-1
1.1.1 Location...............................................................................................................4-1 1.1.2 MPPP Service Area .............................................................................................4-1 1.1.3 Population............................................................................................................4-2
1.2 Solid Waste Management Institutional Framework in Penang ........................................4-3 1.2.1 Penang State Government ...................................................................................4-3 1.2.2 MPPP...................................................................................................................4-3
1.3 Waste Minimisation Initiatives in Penang........................................................................4-8 1.4 Waste Minimisation Approaches ...................................................................................4-11
Chapter 2 State of Waste Mangement and Recycling on Majlis perbandaran pulau pinang (MPPP) ................................................................................................ 4-13
2.1 Solid Waste Management in Penang Island ...................................................................4-13 2.1.1 Introduction .......................................................................................................4-13 2.1.2 Generators of Solid Waste.................................................................................4-13 2.1.3 Solid Waste Generation.....................................................................................4-15 2.1.4 Waste Composition ...........................................................................................4-15 2.1.5 Collection of MSW ...........................................................................................4-17 2.1.6 Disposal of Solid Wastes...................................................................................4-18
2.2 Recycling of MSW and Other Wastes ...........................................................................4-18 2.2.1 Introduction .......................................................................................................4-18 2.2.2 Partners in Recycling.........................................................................................4-19 2.2.3 Methods of Recyclables Collection in MPPP ...................................................4-20 2.2.4 Quantities of Recyclables Collected in Penang Island ......................................4-20 2.2.5 Recycling Rates in Penang Island .....................................................................4-21 2.2.6 Type of Recyclables Collected in Penang Island ..............................................4-22 2.2.7 Recyclers Performance......................................................................................4-24 2.2.8 Re-Processing Activities in Penang Island........................................................4-24 2.2.9 Voluntary Activities ..........................................................................................4-25 2.2.10 Price of Recyclables ..........................................................................................4-25 2.2.11 Awareness on Waste Minimisation ...................................................................4-25
2.3 Issues of Waste Minimisation ........................................................................................4-26 2.3.1 Identification of Issues ......................................................................................4-26 2.3.2 Solutions for Issues ...........................................................................................4-28
Chapter 3 Targets of Waste Minimisation ...................................................................... 4-29 3.1 Scope of Targets.............................................................................................................4-29 3.2 Target Recyclables .........................................................................................................4-29
3.2.1 Main Items.........................................................................................................4-29 3.2.2 Additional Items ................................................................................................4-29
3.3 Target Sources................................................................................................................4-29 3.4 Recycling Rate Targets ..................................................................................................4-29 3.5 Summary of Action Plan ................................................................................................4-30
Chapter 4 Actions to Achieve Targets ............................................................................. 4-31 4.1 Strategy ..........................................................................................................................4-31

Local Action Plan in MP Pulau Pinang
ii
4.2 Approaches to Achieve Targets .....................................................................................4-31 4.3 Pre-Conditions to Achieve Targets ................................................................................4-31 4.4 Selected Recyclable Sub-Categories ..............................................................................4-32 4.5 Local Authority (MPPP) ................................................................................................4-32 4.6 Action Plan for Waste Minimisation Partners, 2006-2010 ............................................4-38
Chapter 5 Monitoring and Improvement........................................................................ 4-43 5.1 Monitoring and Evaluating the Performance of LAP-WM............................................4-43
5.1.1 Continual Improvement.....................................................................................4-43 5.1.2 Key Performance Indicators ..............................................................................4-43 5.1.3 What is to be monitored?...................................................................................4-43 5.1.4 Evaluation of Monitoring Results & Improvement...........................................4-44
5.2 Reporting........................................................................................................................4-44 Appendices
Local Action Plan in MP Pulau Pinang
iii
Preface
TThhiiss “Local Action Plan for Waste Minimisation (LAP-WM) in Penang Island Municipal Council” or Majlis Perbandaran Pulau Pinang (MPPP) is a tool for guiding MPPP and its 3Rs Partners in planning, implementing and improving its Waste Minimisation plans. It is prepared in conjunction with the “Study on National Waste Minimisation”, which was carried out for the Malaysian Government with the cooperation of the Japan International Cooperation Agency (JICA). Implementation of the LAP-WM will contribute towards efforts to create a “Material Cycle Society” by 2020. This LAP-WM is in line with the “National Strategic Plan for Solid Waste Management” approved by the Government of Malaysia in July 2005.
The guidelines complement the “Action Plan for Waste Minimisation” for the Federal Government, for the Ministry of Housing and Local Government (MHLG), which is the lead implementing agency for waste minimisation.
This LAP-WM contains information about the existing conditions regarding solid waste management and initiatives connected with the 3Rs. Based on consultation between the JICA Study group and the MPPP Task Force on waste management, this Action Plan recommends Targets for Waste Management for the period 2005 until 2010. These targets refer to the types of recyclables, generator groups, actions (including measurement & monitoring) and implementation schedules for achieving the recovery targets set for Penang Island. The LAP-WM also defines the responsibilities of MPPP and other key recycling partners and provides an indicative budget for infrastructure. The plan also includes a monitoring, and a review and reporting system.
Majlis Perbandaran Pulau Pinang
April 2006

Local Action Plan in MP Pulau Pinang
iv
Pulau Pinang Fact Sheet
Area (square kilometres) 161.8 Total Population (2000) 437,121 Total Population (2004) estimates 484,925 Average annual population growth rate, 2000 - 2005 (%) Average annual population growth rate, 2006 - 2010 (%)
2.4% 2.1%
Bumiputera 38.9% Chinese 47.0% Indian 13.1%
Ethnic group composition of Malaysian citizens (%)
Others 1.0% Population aged 0 – 14 years old (%) 28.1% Population aged 15 – 64 years old (%) 70% Population aged 65+ years old (%) 1.9% Age Structure
Dependency ratio (%) 43% Sex Ratio N /A Total Households 100,867 Total Living Quarters 107,471 Economic (2004 Estimates): 1) Gross Domestic Product (1987 real prices)
• Agriculture, livestock, forestry and fishing • Mining and quarrying • Manufacturing • Construction • Services
2) Labour Force (2004 estimates)
• Labour Force • Labour Force Participation Rate • Unemployment
3) Employment by Sectors (2004 Estimates)
• Agriculture, livestock, forestry and fishing • Mining and quarrying • Manufacturing • Construction • Services
N / A

Local Action Plan in MP Pulau Pinang
v
Abbreviations
AFSB Alam Flora Sdn Bhd BEs Business Entities CBO Community-based Organisation ISO International Standard Organisation JICA Japan International Cooperation Agency JST JICA Study Team Kg/cap/day Kilogram per capita per day KL Kuala Lumpur LA Local Authority LAP-WM Local Action Plan on Waste Minimisation MHLG Ministry of Housing and Local Government MPPP Majlis Perbandaran Pulau Pinang (Penang Municipal Council) MSW Municipal Solid Wastes NGO Non-governmental Organisation PET Polyethylene Terephthalate (plastic) SRJK (C) Sekolah Rendah Jenis Kebangsaan (C)
[Chinese National Primary School] SWM Solid Waste Management WMU Waste Minimisation Unit
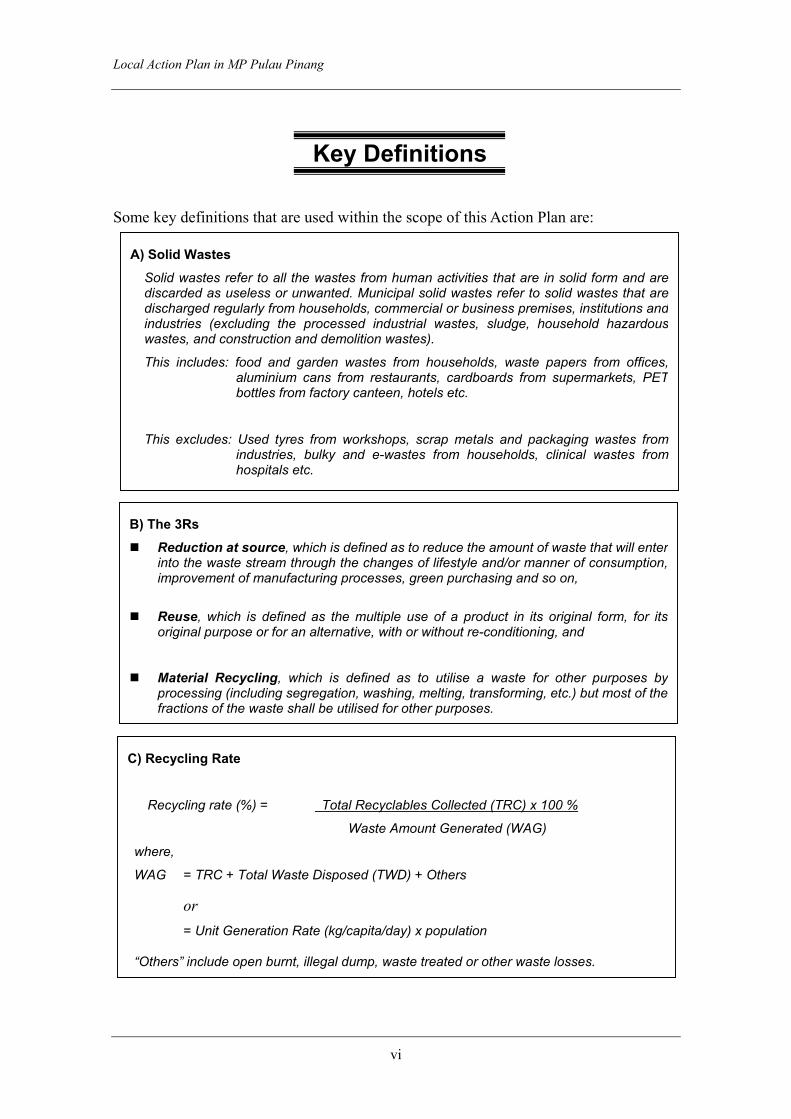
Local Action Plan in MP Pulau Pinang
vi
Key Definitions
Some key definitions that are used within the scope of this Action Plan are:
A) Solid Wastes
Solid wastes refer to all the wastes from human activities that are in solid form and arediscarded as useless or unwanted. Municipal solid wastes refer to solid wastes that aredischarged regularly from households, commercial or business premises, institutions andindustries (excluding the processed industrial wastes, sludge, household hazardouswastes, and construction and demolition wastes).
This includes: food and garden wastes from households, waste papers from offices,aluminium cans from restaurants, cardboards from supermarkets, PETbottles from factory canteen, hotels etc.
This excludes: Used tyres from workshops, scrap metals and packaging wastes fromindustries, bulky and e-wastes from households, clinical wastes fromhospitals etc.
B) The 3Rs
Reduction at source, which is defined as to reduce the amount of waste that will enterinto the waste stream through the changes of lifestyle and/or manner of consumption,improvement of manufacturing processes, green purchasing and so on,
Reuse, which is defined as the multiple use of a product in its original form, for itsoriginal purpose or for an alternative, with or without re-conditioning, and
Material Recycling, which is defined as to utilise a waste for other purposes by
processing (including segregation, washing, melting, transforming, etc.) but most of thefractions of the waste shall be utilised for other purposes.
C) Recycling Rate
Recycling rate (%) = Total Recyclables Collected (TRC) x 100 %
Waste Amount Generated (WAG)
where,
WAG = TRC + Total Waste Disposed (TWD) + Others
or = Unit Generation Rate (kg/capita/day) x population
“Others” include open burnt, illegal dump, waste treated or other waste losses.

Local Action Plan in MP Pulau Pinang
4-1
CHAPTER 1 INTRODUCTION
1.1 Service Area
1.1.1 Location The island of Penang lies off the north western coast of Peninsular Malaysia and covers an area of about 299.65 km2. The island is separated from mainland Seberang Perai by a channel. Penang Island is linked to Seberang Perai by the Penang Bridge and a ferry service (for passengers and vehicles). There is no train service on the island and Keretapi Tanah Melayu Bhd (KTMB) operates only from Butterworth in Seberang Perai. A funicular railway operates from the base station to Penang Hill on the island.
The local authority for Penang Island is commonly referred to as MPPP, which stands for Majlis Perbandaran Pulau Pinang. MPPP currently has a total staff of 3,874 headed by a President who is assisted by 24 Councilors, a Secretary, and 10 departments headed by a Department Head.
“LEADING WE SERVE” (Berkhidmat Sambil Memimpin)
MPPP’s Motto
1.1.2 MPPP Service Area MPPP’s administrative area covers about 299.65 km2 (29,965 hectares).
MPPP’s administrative area also covers a band of 1 nautical mile around the island. There are two administrative districts within MPPP, the larger being the less- urbanised southwest district (Table 1.1).
Table 1.1 Population & Area of Two Districts in MPPP Population (‘000) Area No. District (2000) (2004)* (hectares)
1 North East 416.4 476.2 13,146 2 South West 159.1 191.3 16,819
Total 575.5 667.5 29,965Source: Census, 2000 Note: *Projected
MPPP operates its services within seven (7) functional zones. Figure 1.1 shows these zones and it is noted that a large portion in the southwest is less developed compared to the north east.
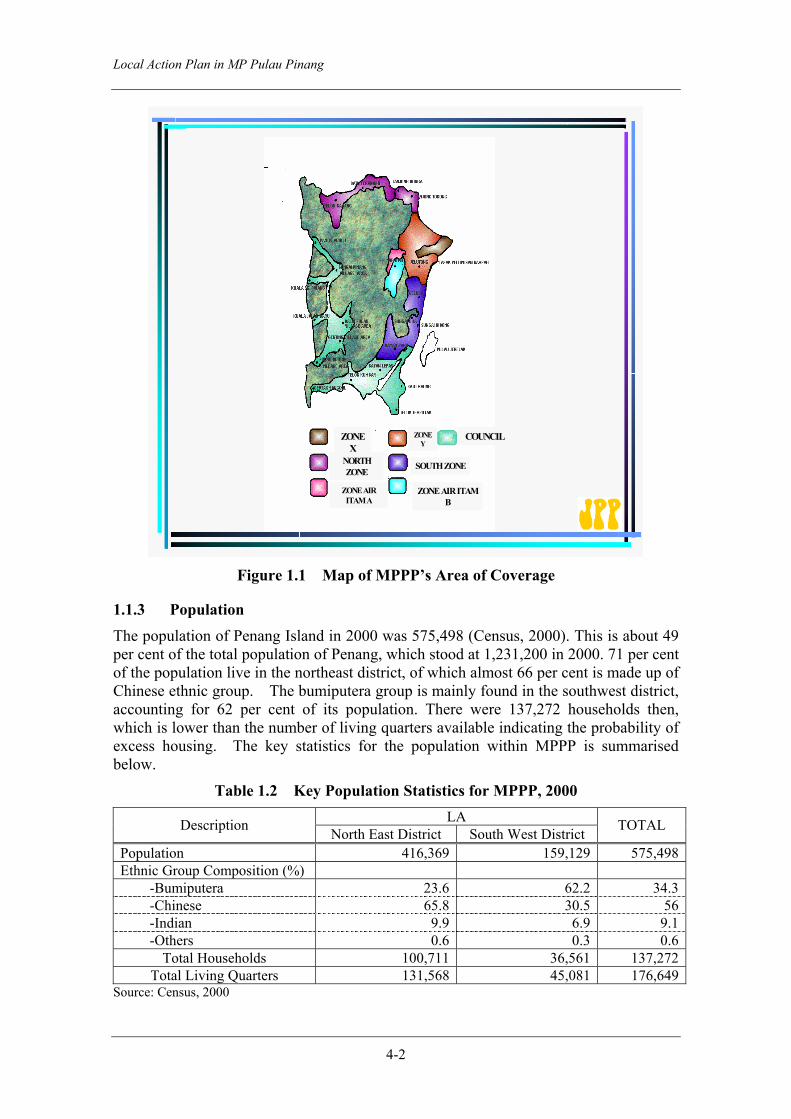
Local Action Plan in MP Pulau Pinang
4-2
ZONE X
NORTH ZONE
ZONE AIR ITAM A
ZONE Y
SOUTH ZONE
ZONE AIR ITAM B
COUNCIL
Figure 1.1 Map of MPPP’s Area of Coverage
1.1.3 Population The population of Penang Island in 2000 was 575,498 (Census, 2000). This is about 49 per cent of the total population of Penang, which stood at 1,231,200 in 2000. 71 per cent of the population live in the northeast district, of which almost 66 per cent is made up of Chinese ethnic group. The bumiputera group is mainly found in the southwest district, accounting for 62 per cent of its population. There were 137,272 households then, which is lower than the number of living quarters available indicating the probability of excess housing. The key statistics for the population within MPPP is summarised below.
Table 1.2 Key Population Statistics for MPPP, 2000 LA Description North East District South West District TOTAL
Population 416,369 159,129 575,498Ethnic Group Composition (%) -Bumiputera 23.6 62.2 34.3 -Chinese 65.8 30.5 56 -Indian 9.9 6.9 9.1 -Others 0.6 0.3 0.6
Total Households 100,711 36,561 137,272Total Living Quarters 131,568 45,081 176,649
Source: Census, 2000

Local Action Plan in MP Pulau Pinang
4-3
For the period 2000-2010, population projections are made based on straight line increase at 2.5 per cent increase per annum. As such the population is estimated to grow from 651,123 in 2005 to 736,686 in 2010.
The population served by MPPP is estimated at about 90 per cent representing about 150,200 households (2004). MPPP provides services to more than 60 per cent of their area (including squatter areas) but the coverage for recovery of recyclables is difficult to estimate.
1.2 Solid Waste Management Institutional Framework in Penang
1.2.1 Penang State Government In Penang, the State Government established the Penang Environment Working Group (PEWOG), to serve as a consultative forum for local government. PEWOG was established under the Penang Local Government Consultative Forum (PLGCF) and its members include Majlis Perbandaran Pulau Pinang (MPPP), Majlis Perbandaran Seberang Perai (MPSP), the Department of Environment (DOE), Environmental Activists, NGOs e.g. the Consumers Association of Penang (CAP), the Malaysian Nature Society (MNS), the National Poison Centre, recycling companies, and individuals. Through PEWOG, the state government is committed to:
“…to adopt recycling as a long term strategy for solid waste management” and “to transform the ‘throw-away’ culture to that of a conserving one”.
They published a Recycling Guidebook to increase knowledge about recycling and to encourage the public to be involved in recycling activities. The items that are promoted for recycling are paper, plastic, metals, glass and old clothes. The guidebook also describes what items are not collected and these include waxed paper, foil, carbon paper, envelopes with plastic windows, Styrofoam and plastic bags and windowpanes. It is noted that the public is encouraged to donate items to charities (Penang Recycling Guide Book, first and second editions).
On 19 February 2005, PEWOG launched “The Recycling Wheel of Penang”, a directory of recycling stakeholders in Penang. It is an attempt to list as many recycling communities, agents and buyers. Waste generators represent everyone who generates waste, and removes recyclables at the place of generation. The “Collectors” are groups of enthusiastic people in communities, businesses and institutions who run recycling collection activities on a regular basis. This group includes RT, JKKK, RAs, schools, hospitals, factories and government departments. Recycling agents take recyclables from collectors and sell or donate them. “Buyers” refer to those who buy recyclables from recycling agents (wholesale or specialists), sort and then sell or export them. “Processors” are plants that dismantle, crush, shred and bale recyclables but do not manufacture products from recyclables. “Converters” are factories that turn recyclables into new products, which are then bought by consumers (waste generators).
1.2.2 MPPP MPPP’s objectives that are relevant to waste minimisation are as follows:
Maintenance and preservation of the environment and ecology Provision of good public health facilities Promotion and preparation of facilities for community development, and
recreational and leisure activities

Local Action Plan in MP Pulau Pinang
4-4
Cooperating with other government agencies in achieving the objectives and aspiration of the government.
The Urban Services Department (USD) of MPPP administers waste management in Penang Island. The USD is located at a historical building at Padang Kota Lama (Esplanade)-Plate 1. The Department is headed by a Director who reports to MPPP’s Secretary (Figure 1.2). The USD provides solid waste collection and disposal services as well as cleansing services similar to other LAs. In MPPP, cleansing services include sea and river cleansing; beach cleansing and cleansing of industrial zones. In 1990, the Special Tasks Unit was set up primarily for coordinating “gotong royong” and providing backup services for solid waste management e.g. supply of trucks for special events and emergency cases. In 2000, following MPPP’s participation in the National Recycling programme (NRP), the STU’s responsibilities included recycling activities, and these tasks are separate from the normal operational tasks of solid waste collection and disposal, which continue to be managed by the other technical unit.
Figure 1.2 Organisation Chart of the Urban Services Department, MPPP
Special Tasks Unit, Urban Services Department Activities related to waste minimisation in particular recycling initiatives are planned and organised by the Special Tasks Unit (STU). The team responsible for the 3Rs activities consists of only two personnel; an Assistant Environmental Health Officer (Grade U 32) and a Public Health Assistant (PHA). The post of the head of STU was upgraded to Grade U 36 in July 2005. The PHA retired in June 2005 and at the time of writing, the post is vacant. Based on a total staffing of 106 (excluding the IMG group, which consists of the labourers), the STU staff makes up less than 2 per cent of the staff of the Urban Services Department. The responsibilities of the STU personnel are described in Table 1.3.
Despite the constraint in manpower, the STU, which is the de facto ‘Waste Minimisation unit’ has organised and implemented a host of activities and programmes both on a continuous or ad hoc basis. This has been possible partly because such activities have been carried in close cooperation with PEWOG and stakeholders now known as the “Recycling Wheel”. The success of the programmes is testimony of the importance of participation and partnership in planning and implementation of recycling activities.
DIRECTOR, Urban Services
ADMINISTRATION TECHNICAL
SPECIAL TASK UNIT NORTH & SOUTH ZONES

Local Action Plan in MP Pulau Pinang
4-5
The STU has also been monitoring recycling activities on the island. Information is collected not only in relation to MPPP’s activities but the unit also receives reports of recyclables collection from contractors and recyclers on a monthly basis. The data on recovery of recyclables is elaborated in Chapter 3.
Table 1.3 Staff Functions of Special Tasks Unit (Waste Minimisation), 2005 Staff/Code Functions & Responsibilities
Head (U32/U36)
1. Coordinator of the STU 2. Planning & implementation of Recycling Activities. 3. Coordination of “Gotong Royong”. 4. Coordination of Environmental Cadets Programme 5. Organisation of Public/ Mobile Toilets 6. Organisation of Flying Squad 7. Data Collection & analysis 8. Monitoring of Activities 9. Reporting to relevant Authorities 10. Member of PEWOG.
Public Health Assistant (U14)
1. Assists Head, STU. 2. Assists in implementation of activities in North & South areas.
• Recycling Programmes • Public Awareness & Education Programmes • Publicity & Promotion
3. Liaises with Partners in the north & south areas. Source: MPPP, 2005
In July 2005, a Waste Minimisation Unit (WMU) was set up at the STU under the auspices of the “Study on National Waste Minimisation” (Plate 2). The WMU is the one-stop centre for information and coordination of waste minimisation activities for Penang Island. During the period July-November 2005, two personnel from the Socioeconomic and Environmental Research Institute (SERI), the consultant appointed to undertake the project, supported the WMU. WMU has carried out a Waste Flow Survey in MPPP’s service area and carried out 3Rs awareness promotion activities. These awareness activities are an extension of the programmes carried out by the STU and are directed to a diverse range of waste generators i.e. households, manufacturing industry, service industry (e.g. hospital, hotels), commercial sources (e.g. supermarkets) and schools. Brochures on the 3Rs (In English, Malays & Chinese) were produced and circulated at awareness events held during that period.
Plate 1: The MPPP Building at Padang Kota Lama, Penang
Plate 2: The WMU at the Urban Services Department, MPPP, Padang Kota Lama

Local Action Plan in MP Pulau Pinang
4-6
A website was developed for the promotion of the 3Rs. The URL is www.rnumppp.net
This website contains information on waste minimisation including data on recovery of recyclables. The web is linked to other relevant international and local sites. An interesting feature is that the website contains an interactive component whereby users may engage in a discussion forum and also participate in polling on the 3Rs. In connection with the development of an e-based Data collection & Reporting System to be linked with the system being designed for the MHLG (under the same study), a system has been established at the WMU, which comprises:
Database of Stakeholders Database for Recyclable Recovery Database for Reporting
Following an exercise to update existing data, a “Penang Island Recycling Directory” was produced in September 2005. This directory contains names, addresses and contact numbers of recycling agents and recyclable buyers as well as communities that recycle on Penang Island. This directory, which will be updated periodically, is posted on the WMU website. Users may also download information materials e.g. the 3Rs brochures and recycling manuals.
The site map of www.rnumppp is shown below.

Local Action Plan in MP Pulau Pinang
4-7
Press Release The Star Submit Article Popular Rated
Collection Schedule Event Calender
3Rs @Home Photo Gallery Recycling Table
Recycling Data News RNU News What is new? Submit News Archive
Forum Public Discussion Forum
Recycling Network 3R Source Separation Others
Web Links International Local Submit Popular Top Rated
Downloads Brochure Form Submit Popular Top Rated
Polls Which is the right sequence
for 3Rs? Results
Guestbook Contact Us
Budget In 2003, the Urban Services Department had an operational budget of RM80.31 million (Table 1.4). With regard to waste minimisation activities specifically for recycling, the STU was given RM 200,000 in 2004 and RM150, 000 in 2005. These funds have been used for:
Tri-colour bins Campaign souvenir items e.g. bag, pens, caps, note books

Local Action Plan in MP Pulau Pinang
4-8
Table 1.4 Budget for Urban Services Department, 2003 A. EMOLUMENTS Persons RM (Millions)
Salaries and contributions:- 31.03 Group A 3 Group B 8 Group C 20 Group D 75 IMG etc. 1,775 Total 1,881
B. MANAGEMENT 47.99 Management cost include payment of contract services for waste
collection and disposal, cleansing and office expenses
C. MATERIALS 0.54 Purchase of office equipment and materials
D. MAINTENANCE 0.67
Maintenance cost equipment/machines/vehicles
E. SPECIAL EXPENDITURE 0.03
F. CONTRIBUTION (Development Expenditure) 0.05 Total 80.31
Note: 1USD = RM3.80
The activities of the STU are currently carried out under provisions of the Local Government Act, 1976. There is currently, no law that makes waste minimisation a mandatory activity, and for the control of collection and sale of recyclables.
1.3 Waste Minimisation Initiatives in Penang In Penang, recycling activities on a formal basis began in 1993 (Briefing to JICA Study Team on 13 August 2004). The programme was launched by the Chief Minister of Penang as a pilot project involving two housing estates. Three main parties participated in the pilot; the residents in the housing estates, a recycling vendor, and the MPPP. The pilot project started well but soon encountered difficulties.
In 1993, the task of coordinating solid waste recycling programmes was given to the STU, MPPP. However at that time, work focused on delivery of sets of 4-waste bins for recyclables to all the schools in Penang Island. The 4-bins were also provided to hotels and one apartment complex (Lavinia Apartment, Taman Sri Nibong). Eventually the bins became normal waste bins and the programme was discontinued. One major factor for the failure of the programme was the absence of an awareness and educational programme to go with the handing over of the bins for recyclables to the communities and schools.
In 2000 MPPP joined the National Recycling Programme (NRP), re-launched by MHLG. The State Government re-launched the State’s recycling programme in March 2001, and this time twenty (20) communities were initially involved in a Pilot Project for a Community Recycling Programme (Phase 1 of the Community Recycling

Local Action Plan in MP Pulau Pinang
4-9
Programme or CRP).
After starting the pilot project, it was found that very little was known about recycling. So a Learning Programme was developed to learn more about recycling through several activities and events held in 2002 and 2003 (Phase 2 of the CRP). The Working Group is now better informed after several seminars, workshops and visits to recycling facilities (re: “Program Kitar Semula Komuniti, Negeri Pulau Pinang 2001-2005).
In March 2005, nine (9) communities are still actively recycling, showing that sustainability can be achieved.
Under the NRP, 3 colour bins were distributed to various groups; CBOs, NGOs, hospitals, hotels, private firms and government agencies. This time around, MPPP appointed a private organisation to handle an awareness programme. The approach was to disseminate information about the importance of recycling to local communities.
MPPP also initiated a Recycling Programme for Government Departments.
On 30 December 2003, the State’s Community Recycling Taskforce was launched by the State Executive Councillor in charge of Local Government, Y.B. Dato Dr Teng Hock Nan at the State Recycling Convention. He also presented Appreciation Certificates to recycling activists and recycling agents in the State. The Convention was sponsored by MPPP as their activity to commemorate National Recycling Day (11 November). The 2nd Edition of the “Penang Recycling Guidebook” and the Hazardous Waste Bin Programme for wet markets in Penang Island were also launched at the event.
In 2004, MPPP began placing special collection receptacles (designed by college students) in wet markets for collection of fluorescent tubes. These bins are located at Balik Pulau, Bayan Baru, Jalan Anson, Pulau Tikus and Tanjung Bunga markets. For the time being, these wastes are stored at the MPPP depot at Kampung Jawa as there is currently no buyer.
In 2004, they began collecting computers together with Majlis Perbandaran Seberang Perai (MPSP). In cooperation with Dell, computers are collected and those found to be workable are donated while those beyond repair are cannibalised and useable materials salvaged for recycling. Prior to this, MPPP had launched the “Hazardous Waste Collection Programme” at supermarkets on 7 June 2003 at Sunshine Farlim Supermarket. This programme, which involves three supermarkets i.e. Makro, Gama Department Store and Sunshine Farlim and the Loh Guan Lye Specialist Centre is on-going and collection of wastes is carried out by MPPP.
Also in mid-2004, MPPP took possession of two 5-tonne trucks from MHLG. These are two of a total of 51 trucks acquired by MHLG and distributed to selected LAs. As at September 2005, both trucks remain in the possession of the Engineering Department, MPPP and have yet to be commissioned for use by STU for waste minimisation purposes.
In connection with initiatives to manage hazardous municipal solid waste, the State Government commissioned a study on the “Recycling and Safe Disposal of e-Waste”, which was sponsored by MPPP. The report was completed at the end of 2004 and submitted to the Penang State Government in early 2005. The key findings showed high awareness of recycling and the need to carefully and safely recycle and dispose of e-waste among the industrial, commercial and institutional and the community sectors. There are many types of electronic and electrical equipment and replacement frequency

Local Action Plan in MP Pulau Pinang
4-10
varies between 1-5 years.
Some of the problems raised by different generators include:
the high cost of disposal (by Kualiti Alam Sdn. Bhd.), the lack of information on the recycling agents who collect e-waste and the lack of a proper place to dispose of e-waste, the tedious process of writing off obsolete equipment in the government sector.
Proposals for government intervention and help include:
(1) Increasing public awareness on the benefits of safe recycling and disposal of e-waste;
(2) Setting up an e-waste disposal system and e-waste collection depots; (3) Increasing the number of approved recycling agents and waste disposal
vendors; (4) Reducing the cost of safe disposal of e-waste; and (5) Introducing legislation and regulations to support recycling.
Overall, the study shows that there is an existing infrastructure for the safe recycling of e-waste in the state of Penang. However, it needs to be supported, publicised and made more accessible. Recyclable materials such as plastic, metal and precious metals are sent to local companies (Converters or re-processors) to be made into new materials and products. End-point companies for safe recycling and disposal of e-waste do exist in Penang, but most are located in Seberang Perai and not on the island e.g.:
(1) HMR Resources (Malaysia) Sdn. Bhd., Seberang Jaya - principal companies in Australia and Philippines to safely deal with e-waste residues (non-recyclables), and
(2) Asset and Material Management Sdn. Bhd., Perai - has the means to deal safely with e-waste residues.
Subsequently, the study recommends that:
(1) A viable price structure has to be established in the recycling industry between collectors, agents, buyers, processors and converters.
(2) More collection centres need to be established and publicised to collect e-waste.
(3) More recycling agents need to be involved in e-waste recycling to take away the e-waste collected.
(4) The manufacturing sector has to be encouraged and/ or instructed to practise “extended producer responsibility” and “take-back programmes” to take charge of the waste that they create, in their manufacturing process, in the packaging they use and in the “end of life” of their products.
(5) Legislation, compliance and enforcement have to be studied seriously so that environmental protection is not left as a voluntary process.
Under these projects, MPPP has succeeded in planning and implementing all the programmes specified under the terms of reference.
In early 2005, MPPP was selected as one of four Model LAs to participate in two projects under the “Study on National Waste Minimisation”. The first is the preparation of a “Local Action Plan for Waste Minimisation (LAP-WM) 2005-2010”, and the other is a “Pilot Project on Local Recycling Network and Source Separation of MSW in

Local Action Plan in MP Pulau Pinang
4-11
MPPP (PP II)”. Both these projects were carried out under Phase 2 of the study, June–December 2005. PP II is helmed by STU and is carried out in collaboration with Socio-economic and Research Institute (SERI), the JICA-appointed consultant.
The establishment of a Waste Minimisation Unit at STU, MPPP Publication & dissemination of 3Rs brochures (in Malay, English &
Chinese) Waste Flow Survey Publication of the “Penang Island Recycling Directory” Drafting of the “Penang Experience” Website on waste minimisation 3Rs Awareness and education programmes Improvement of Data Collection System on Waste Minimisation (&
recycling)
For its efforts in raising awareness on recycling, MPPP was awarded special awards for two consecutive years; “Anugerah Penghargaan Di atas Sokongan Kepada Program Kitarsemula Kebangsaan” from MHLG in 2004 and Anugerah Bandar LESTARI: Anugerah Kategori Khas (Environmental Education & Awareness Initiatives) by the DOE in 2005.
1.4 Waste Minimisation Approaches Based on experience since 1993, it was decided that a strategy involving the forging of a partnership among four key parties would address most of the problems faced earlier in sustaining recycling programmes. The key partners are Non-governmental organisations (NGOs), PEWOG, the private sector, and MPPP. This strategy comprises three approaches:
1. Direct Approach 2. Vendors Approach 3. Networking Approach
1. Direct Approach: (A package: Talks + Recycle Bin Supply) MPPP conducts its own campaigns directly with the target groups through talks, briefings and exhibitions. Target groups are normally schools, higher learning institutions, kindergarten, factories, private firms, hospitals, government agencies, associations, NGOs etc. Target groups are taught the ‘Dos and Don’ts” of recycling, and what material can be recycled and what cannot be recycled. The approach employs the principles of KAP (Knowledge, Attitude, Practice), 3 Ps (Passion, Patience, & Don’t be A Patient), and the 3Rs (Reduce, Reuse, Recycle). Audio-visual aids (AVA) are widely used in this approach. Samples and displays are very essential tools used.
2. Vendors Approach: The Vendor System was introduced to the community to ensure a sustainable and more systematic collection of recyclables. By harnessing the experience and interests of the vendors, MPPP is free to focus on planning and implementation of other environmental programmes. Currently, 24 companies are listed as recycling vendors. Vendors list is given to public / community normally after the talks. The public is given the freedom to choose whichever company (vendor) they feel comfortable to work with.

Local Action Plan in MP Pulau Pinang
4-12
3. Networking Approach: a) Vendors Networking – Vendors Networking concept was introduced to all the
listed vendors through workshops or meetings. Vendors are required to collect all kind of recyclables with no exceptions. Vendors are introduced to each other during workshops or meetings. Vendors are required to state their preferences and specialty. Vendors are then able to either exchange their recyclables or trade with each other.
b) Public - Private Networking - Public-Private sector networking is implemented using a structure introduced by United Nations Development Programme (UNDP), which is known as PPPUE (Public Private Partnership for Urban Environment).
c) PEWOG Networking - Strategies are planned and implemented through this networking taking into consideration the comments and demands by the public
Programmes implemented through PEWOG include:
Household Hazardous Waste Collection Voluntary Computer Recycling Community Composting Publishing of Recycling Guide Book 1st and 2nd editions Publishing of Composting Guide Book Training of Trainer Workshop (TOT) Recycling Workshop Waste Workshop Stakeholders Workshop and other useful workshops
The household hazardous waste collection and the computer recycling initiatives are on-going and have been described in the fore-going. The community composting programme (household waste) at Kampung Seronok is reported to be on-going.
Role of MPPP’s Partners
MPPP’s partners for the 3Rs have been defined as follows:
MPPP - Provide human resources and speakers to educate the public in recycling, waste minimisation, separation of waste at source and composting
- Provide vehicles, machineries, recycle bins and other logistics PRIVATE - Aid in providing sponsorship in producing pamphlets, flyers,
advertisement, posters, sites or building COMMUNITY - Apply and practise recycling, waste minimisation, separation of
waste at source and composting with help from the above partners

Local Action Plan in MP Pulau Pinang
4-13
CHAPTER 2 STATE OF WASTE MANGEMENT AND RECYCLING ON MAJLIS PERBANDARAN PULAU PINANG (MPPP)
2.1 Solid Waste Management in Penang Island
2.1.1 Introduction Waste generation for a particular area is usually estimated based on the population and the estimated per capita generation rate and this quantity is referred to as household waste. The total waste generation usually also includes waste generated from industrial, commercial, institutional, Construction & demolition and community sources. For purposes of this study,
Total Waste Generation Refers To The Quantity Of Waste Discarded Plus The Quantity Of Recyclables Retained Within The Premises
2.1.2 Generators of Solid Waste At the time of writing, there are no known published reports of actual generation at source in Penang. Past studies indicate that waste from households account for high proportion of total waste generated. It is noted that household waste includes hazardous household waste e.g. batteries, fluorescent tubes, paints, & varnishes. They also include bulky waste e.g. old refrigerators, TV sets and furniture.
A paper (UKM, 2001) presented by MPPP in 2001, estimated that 99 percent of total waste generated in Penang is accounted for by household and commercial waste, and the remaining 1 percent by green waste. In contrast, a study in Kuala Lumpur for the same period revealed that households there account for 65 per cent followed by commercial (25 percent), institutional (3 percent), and green waste 7 percent.
Apart from households, the sources of MSW in MPPP include the following:
Industrial (including non-process industrial waste (NPIW) and process industrial waste (PIW), and excluding scheduled wastes (EQA, 1989) Commercial (including service industry) Institutional (government centres, schools, hospitals excluding clinical
waste) Community public places (e.g. parks, beaches, drain cleansing) Other sources (including construction & demolition waste)
It is noted that construction & demolition waste (CDW) is excluded from this study (JICA). CDW may be considered for inclusion at a later date i.e. when more information is available and in line with decisions at the Federal level.
At the Task Force meeting on 10th March 2005, the matter of percentage composition by source of total waste generated in Penang was debated and the statistics of waste generation and collection were examined. The meeting noted the following key matters:
MSW collection in Penang is carried out by MPPP and its contractors; MPPP & its contractors collect from households, and commercial,
community and institutional sources; MSW and non-scheduled process wastes from industrial sources are
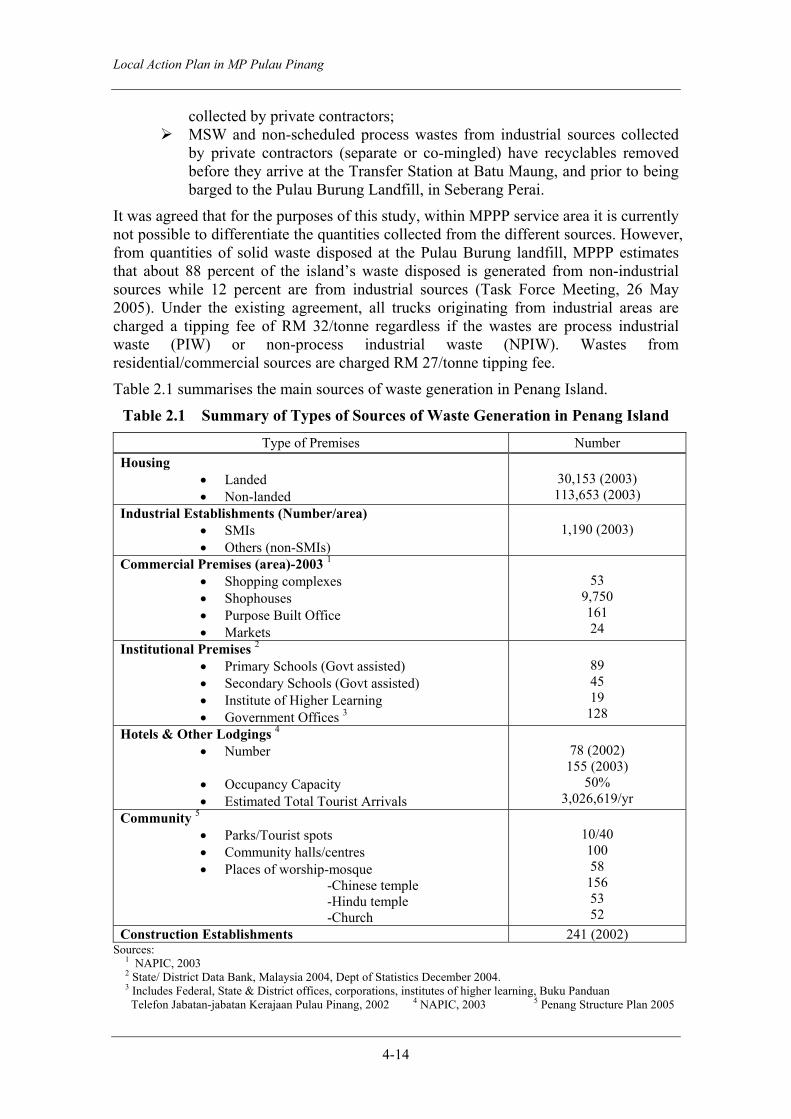
Local Action Plan in MP Pulau Pinang
4-14
collected by private contractors; MSW and non-scheduled process wastes from industrial sources collected
by private contractors (separate or co-mingled) have recyclables removed before they arrive at the Transfer Station at Batu Maung, and prior to being barged to the Pulau Burung Landfill, in Seberang Perai.
It was agreed that for the purposes of this study, within MPPP service area it is currently not possible to differentiate the quantities collected from the different sources. However, from quantities of solid waste disposed at the Pulau Burung landfill, MPPP estimates that about 88 percent of the island’s waste disposed is generated from non-industrial sources while 12 percent are from industrial sources (Task Force Meeting, 26 May 2005). Under the existing agreement, all trucks originating from industrial areas are charged a tipping fee of RM 32/tonne regardless if the wastes are process industrial waste (PIW) or non-process industrial waste (NPIW). Wastes from residential/commercial sources are charged RM 27/tonne tipping fee.
Table 2.1 summarises the main sources of waste generation in Penang Island.
Table 2.1 Summary of Types of Sources of Waste Generation in Penang Island
Type of Premises Number Housing
• Landed • Non-landed
30,153 (2003)
113,653 (2003) Industrial Establishments (Number/area)
• SMIs • Others (non-SMIs)
1,190 (2003)
Commercial Premises (area)-2003 1 • Shopping complexes • Shophouses • Purpose Built Office • Markets
53
9,750 161 24
Institutional Premises 2 • Primary Schools (Govt assisted) • Secondary Schools (Govt assisted) • Institute of Higher Learning • Government Offices 3
89 45 19
128 Hotels & Other Lodgings 4
• Number
• Occupancy Capacity • Estimated Total Tourist Arrivals
78 (2002)
155 (2003) 50%
3,026,619/yr Community 5
• Parks/Tourist spots • Community halls/centres • Places of worship-mosque -Chinese temple -Hindu temple -Church
10/40 100 58
156 53 52
Construction Establishments 241 (2002) Sources:
1 NAPIC, 2003 2 State/ District Data Bank, Malaysia 2004, Dept of Statistics December 2004. 3 Includes Federal, State & District offices, corporations, institutes of higher learning, Buku Panduan Telefon Jabatan-jabatan Kerajaan Pulau Pinang, 2002 4 NAPIC, 2003 5 Penang Structure Plan 2005
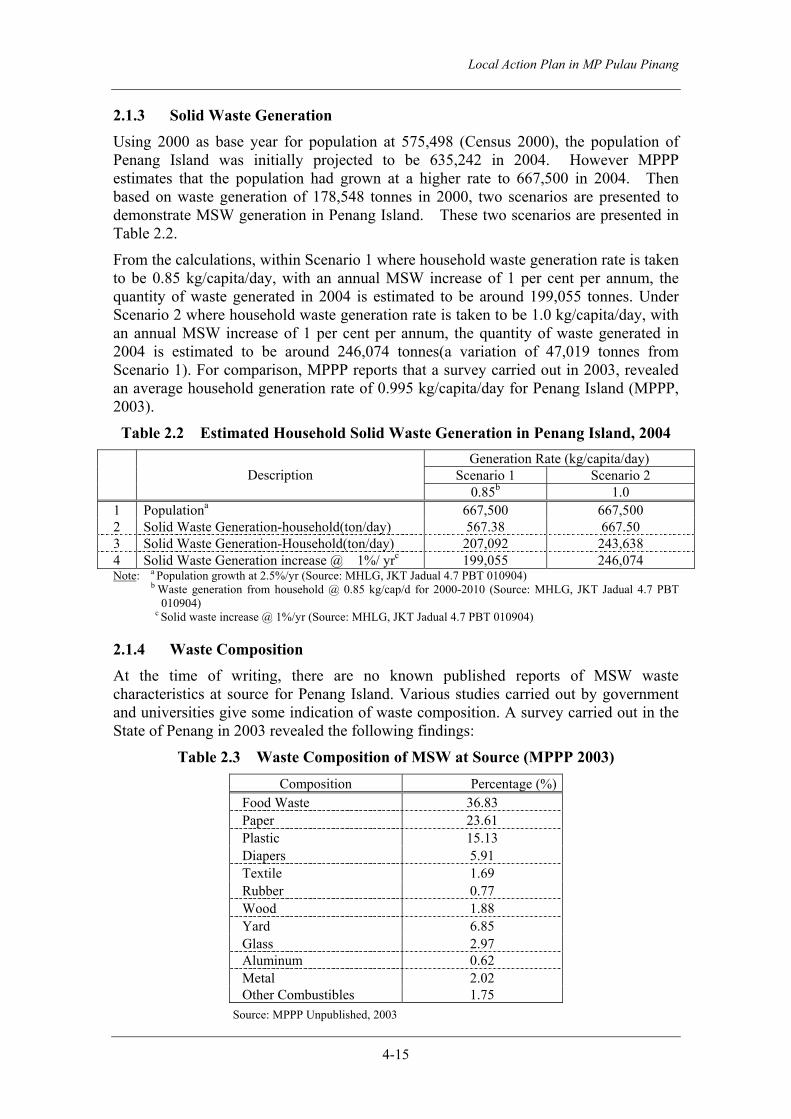
Local Action Plan in MP Pulau Pinang
4-15
2.1.3 Solid Waste Generation Using 2000 as base year for population at 575,498 (Census 2000), the population of Penang Island was initially projected to be 635,242 in 2004. However MPPP estimates that the population had grown at a higher rate to 667,500 in 2004. Then based on waste generation of 178,548 tonnes in 2000, two scenarios are presented to demonstrate MSW generation in Penang Island. These two scenarios are presented in Table 2.2.
From the calculations, within Scenario 1 where household waste generation rate is taken to be 0.85 kg/capita/day, with an annual MSW increase of 1 per cent per annum, the quantity of waste generated in 2004 is estimated to be around 199,055 tonnes. Under Scenario 2 where household waste generation rate is taken to be 1.0 kg/capita/day, with an annual MSW increase of 1 per cent per annum, the quantity of waste generated in 2004 is estimated to be around 246,074 tonnes(a variation of 47,019 tonnes from Scenario 1). For comparison, MPPP reports that a survey carried out in 2003, revealed an average household generation rate of 0.995 kg/capita/day for Penang Island (MPPP, 2003).
Table 2.2 Estimated Household Solid Waste Generation in Penang Island, 2004 Generation Rate (kg/capita/day)
Scenario 1 Scenario 2
Description 0.85b 1.0
1 Populationa 667,500 667,500 2 Solid Waste Generation-household(ton/day) 567.38 667.50 3 Solid Waste Generation-Household(ton/day) 207,092 243,638 4 Solid Waste Generation increase @ 1%/ yrc 199,055 246,074 Note: a Population growth at 2.5%/yr (Source: MHLG, JKT Jadual 4.7 PBT 010904)
b Waste generation from household @ 0.85 kg/cap/d for 2000-2010 (Source: MHLG, JKT Jadual 4.7 PBT 010904)
c Solid waste increase @ 1%/yr (Source: MHLG, JKT Jadual 4.7 PBT 010904)
2.1.4 Waste Composition At the time of writing, there are no known published reports of MSW waste characteristics at source for Penang Island. Various studies carried out by government and universities give some indication of waste composition. A survey carried out in the State of Penang in 2003 revealed the following findings:
Table 2.3 Waste Composition of MSW at Source (MPPP 2003)
Source: MPPP Unpublished, 2003
Composition Percentage (%) Food Waste 36.83 Paper 23.61 Plastic 15.13 Diapers 5.91 Textile 1.69 Rubber 0.77 Wood 1.88 Yard 6.85 Glass 2.97 Aluminum 0.62 Metal 2.02 Other Combustibles 1.75

Local Action Plan in MP Pulau Pinang
4-16
From the above, it is observed that the organic content of MSW in Penang Island is about 37 per cent, while mixed paper accounts for more than 23 per cent and plastics about 15 per cent of waste composition.
In contrast, the composition of waste at the Pulau Burung landfill is a little different as wastes from Penang Island are co-mingled with wastes from Seberang Perai. Table 2.4 shows the composition at the landfill.
Table 2.4 Waste Composition of MSW at Pulau Burung Landfill (MPPP 2003) Composition Percentage (%)
Food Waste 42.94 Paper 18.40 Plastic 15.85 Diapers 5.80 Textile 2.43 Rubber 1.38 Wood 1.03 Yard 4.49 Glass 2.95 Aluminium 0.39 Metal 1.63 Other Combustibles 2.65
Source: MPPP Unpublished, 2003
Food content is higher at the landfill. With regard to the main recyclables, the composition of plastic and glass is similar while there is lower paper content (5 percent) at the landfill compared to its composition at source.
Waste composition at three LAs; MPPP, Majlis Bandaraya Miri (MBM), and Majlis Perbandaran Petaling Jaya (MPSJ) are compared with the findings of the survey carried out by the JICA Study team at the end of 2004 for samples taken from different locations throughout the country. Table 2.5 summarises the findings and the results are interesting:
the food content in MPPP is the lowest, the paper content is higher than in MBM and MPSJ, the plastic content is double that of MBM but lower than in MPSJ the Al content is about the same as in MPSJ and the national average. the glass content is lower than in MBM and MPSJ.
Table 2.5 Comparison of Waste Composition of MSW at Different LAs Percentage Composition (%) Major Waste
Components/Recyclables MPPP 1 MBM 2 MPSJ 3 JICA STUDY 4
Food Wastes 36.8 50 42.0 39.6 Paper 23.6 21 18.2 31.2 Plastics 15.1 8 18.7 8.1 Polystyrene - - 1.1 Metals 2.0 6 - -Ferrous - - 3.4 1.7 -Non-ferrous (Al) 0.6 - 0.5 0.7 Wood 1.9 5 - Glass 2.9 4 4.3 3.5 Textiles 7.8(+diapers) 3 - - Miscellaneous 12.2 3 11.8 15.2
Sources:
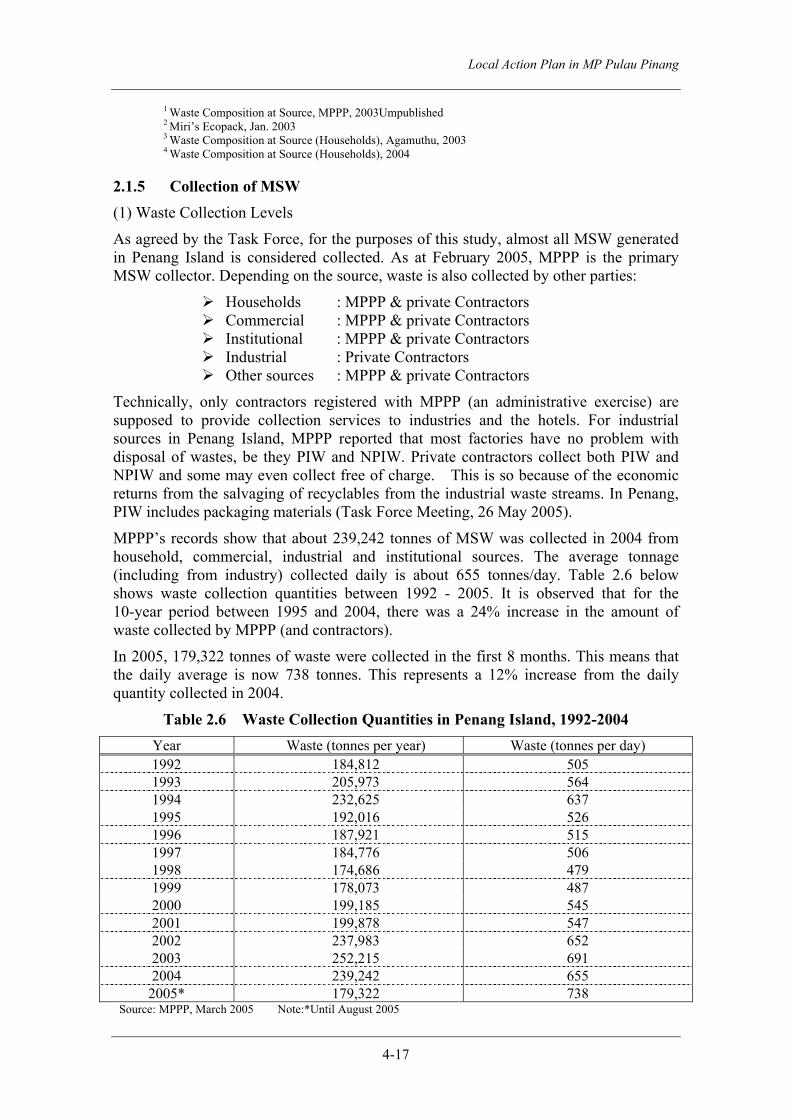
Local Action Plan in MP Pulau Pinang
4-17
1 Waste Composition at Source, MPPP, 2003Umpublished 2 Miri’s Ecopack, Jan. 2003 3 Waste Composition at Source (Households), Agamuthu, 2003 4 Waste Composition at Source (Households), 2004
2.1.5 Collection of MSW (1) Waste Collection Levels
As agreed by the Task Force, for the purposes of this study, almost all MSW generated in Penang Island is considered collected. As at February 2005, MPPP is the primary MSW collector. Depending on the source, waste is also collected by other parties:
Households : MPPP & private Contractors Commercial : MPPP & private Contractors Institutional : MPPP & private Contractors Industrial : Private Contractors Other sources : MPPP & private Contractors
Technically, only contractors registered with MPPP (an administrative exercise) are supposed to provide collection services to industries and the hotels. For industrial sources in Penang Island, MPPP reported that most factories have no problem with disposal of wastes, be they PIW and NPIW. Private contractors collect both PIW and NPIW and some may even collect free of charge. This is so because of the economic returns from the salvaging of recyclables from the industrial waste streams. In Penang, PIW includes packaging materials (Task Force Meeting, 26 May 2005).
MPPP’s records show that about 239,242 tonnes of MSW was collected in 2004 from household, commercial, industrial and institutional sources. The average tonnage (including from industry) collected daily is about 655 tonnes/day. Table 2.6 below shows waste collection quantities between 1992 - 2005. It is observed that for the 10-year period between 1995 and 2004, there was a 24% increase in the amount of waste collected by MPPP (and contractors).
In 2005, 179,322 tonnes of waste were collected in the first 8 months. This means that the daily average is now 738 tonnes. This represents a 12% increase from the daily quantity collected in 2004.
Table 2.6 Waste Collection Quantities in Penang Island, 1992-2004 Year Waste (tonnes per year) Waste (tonnes per day) 1992 184,812 505 1993 205,973 564 1994 232,625 637 1995 192,016 526 1996 187,921 515 1997 184,776 506 1998 174,686 479 1999 178,073 487 2000 199,185 545 2001 199,878 547 2002 237,983 652 2003 252,215 691 2004 239,242 655
2005* 179,322 738 Source: MPPP, March 2005 Note:*Until August 2005

Local Action Plan in MP Pulau Pinang
4-18
(2) Waste Storage
Within MPPP service areas, wastes are required to be stored in a variety of storage receptacles.
2.1.6 Disposal of Solid Wastes (1) Landfill
MPPP currently does not operate any landfill for MSW on Penang Island. Its MSW is transported to a Transfer Station at Batu Maung, and then taken by barge across the channel to the Pulau Burung Landfill in Seberang Perai. Its former dumping ground at Jelutong ceased receiving MSW in 2001 and now only accepts inert waste (green waste and construction & demolition wastes). The Jelutong landill is reported to receive a total of about 400 tonnes (MPPP, September 2005) of waste per day comprising construction & demolition waste (CDW) and green waste from parks, households and bulky waste (furniture, refrigerators and washing machines).
MPPP estimates that industrial wastes account for 11.8 percent of the total waste from Penang Island disposed at the Pulau Burung landfill (Task Force Meeting, 26 May 2005). It is noted that this percentage refers to both PIW and NPIW.
Under the “Study for Safe Closure and Rehabilitation of Landfill Sites in Malaysia” carried out by JICA on behalf of the Japanese Government for the Ministry of Housing and Local Government (2003-2004), the site has been classified as having an environmental risk of 0.53 on a scale of 0 - 1, where risk rate 0 indicates low environmental risk and rate 1 indicates potentially high risk. The site has been assigned a closure level C3, which is the second highest closure level requiring leachate collection and recirculation, the construction of dykes, controlled slope and gas ventilation system. The study also identified the site as having medium post-closure land use potential i.e. for high density development purposes.
(2) Illegal Dumping
It is known that incidents of illegal dumping of MSW still occurs in Penang Island, mainly at road reserves, remote hill areas and on vacant private land. Types of waste dumped include household, industrial and C&D waste. There are no records of quantities of illegally dumped waste.
However, MPPP provides services to clean-up illegal dumps and lorries and a crew are despatched to affected areas in particular the ‘protocol roads’. Two lorries operate everyday, except Sundays and the quantity of wastes collected is estimated to be about 104 tonnes/month.
2.2 Recycling of MSW and Other Wastes
2.2.1 Introduction In examining the status of recycling in Penang Island, a number of assumptions are used:
MPPP & Contractors provide services to almost 99 per cent of Penang Island (including squatters and excluding remote hill stations). MPPP’s MSW collection data (at weighbridge at Batu Maung Transfer
Station) is taken as representative of waste after recyclables have been removed.

Local Action Plan in MP Pulau Pinang
4-19
MPPP’s MSW collection data refers to wastes from households, commercial, institutional and industrial sources. Contractors’ reports of recyclables collection refer to only 4 Main items
(paper, plastics, metals & glass). Non-scheduled process industrial wastes (PIW) are excluded (well managed
by recyclers for reprocessing or export). Note: Scheduled wastes are controlled under the Environmental Quality (Scheduled Wastes) Regulations 1989.
2.2.2 Partners in Recycling The list of recycling communities, agents and buyers is summarised below (Table 2.7).
The full list of recycling communities, agents and buyers can be obtained from the “Penang Island Recycling Directory” (Penang Island Recycling Directory, September 2005).
Table 2.7 Recycling Communities, Agents and Buyers in Penang Island, 2005
Recycling Communities Number Schools 29 Factories 27 Government Offices 18 Churches 11 NGOs 10 Rukun Tetangga 9 Hotels 9 Hospitals 7 Supermarkets 4 Residents Associations 3 JKKK 1
Sub-Total 70 Recyclable Agents & Buyers General 38 Scrap/Metals 23 E-waste 19 Paper 8 Plastics 8 Gunny sacks 2 Rubber 1 Wood 1
Sub-Total 100 GRAND TOTAL 170
Source: MPPP, September 2005
By September 2005, 70 groups are participating in recycling programmes of which 41% are schools. The number of participating schools represents 13% of the total number of schools in Penang Island (216). So far 27 factories have been recorded as implementing waste recycling programmes. 100 recyclable agents and buyers have registered with WMU MPPP as those engaged in the collection buying and selling of recyclables and/or reusable items. 38% handle all types of recyclables while the others handle only specific types. 23% handle metal items and this may indicate the growth in demand for metal

Local Action Plan in MP Pulau Pinang
4-20
recyclables.
2.2.3 Methods of Recyclables Collection in MPPP In Penang Island, recyclables are collected via a number of methods:
From sources (households, ICI, Service industry) From collection crews From drop-off centres run by Government, concessionaires and NGOs
The normal mode for collecting recyclables from households is via kerbside collection by house-to-house collectors and middlemen buyers. Recyclables from industrial or commercial sources are normally collected directly by recycling agents for transfer to recycling plants/ re-processors.
MPPP has set up drop-off centres at strategic locations around the island:
Kawasan Rukun Tetangga (KRT) Kulit Lembu KRT Taman Guan Joo Seng KRT Mt. Erskine
2.2.4 Quantities of Recyclables Collected in Penang Island MPPP has collected data on the quantities of recyclables collected since 1993. Since 2001, the Waste Minimisation Unit has ensured that as much information is captured by getting the recycling agents or vendors’ cooperation to report monthly to them. The waste and recyclables collection data for the period 1993-2004 have been tabulated (Table 2.8). It is obvious that there was a dramatic increase in recyclable collection in 2003 (four-fold increase from 2002) and in 2004 (doubled from 2003). In 2004, 44,093.1 tonnes of recyclables were collected based on information MPPP collected from its recycling vendors and collection centres. According to MPPP, the actual figure is likely to be higher because of two main reasons:
There are recyclers who do not report to MPPP There are recycling players who are not registered as ‘recyclers’ and
engage in backyard recycling business activities
From the above data, the total waste generation rate and recycling rate can be calculated.
For the year 2004, waste generation in Penang Island is calculated to be 283,335 tonnes.
From the above generation, the Waste Generation Rate for Penang Island is calculated as follows:
Waste Generation Rate (kg/capita) = (Quantity of Waste Generated) Population
This works out to about 1.16 kg/capita/day total waste generation rate in the island.

Local Action Plan in MP Pulau Pinang
4-21
Table 2.8 Summary of Recyclables Collection & Recycling Rates in Penang Island, 1993-2004
Quantity (tonnes)
Year Waste Collected Per Year
(a)
Waste CollectedPer Day
(b)
Recycling Weights
Per Year (c)
Total Waste Generated Per
Year (d)
Recycling Rates(%) ( c/d)
1993 205,973 564 40.83 206,013.83 0.021994 232,625 637 91.89 232,716.89 0.041995 192,016 526 126.74 192,142.74 0.071996 187,921 515 300.41 188,221.41 0.161997 184,776 506 85.25 184,861.25 0.051998 174,686 479 74.60 174,760.60 0.041999 178,073 488 75.20 178,148.20 0.042000 199,185 546 57.54 199,242.54 0.032001 199,878 548 319.63 200,197.63 0.162002 237,983 652 3,844.74 241,827.74 1.592003 252,215 691 22,669.29 274,884.29 8.252004 239,242 655 44,093.17 283,335.17 15.56
2005* 179,322 738 18,232.54 197,554.54 9.2Source: MPPP Statistic, 2005 Note: *Until August 2005, MPPP considers its recyclables collection data to be under-reported as not all
recyclers are registered with and report to MPPP.
Based on the waste generation and collection data, the level of efficiency of waste collection can be calculated. In 2004, the level of collection service is calculated to be about 84.4 percent.
At the time of writing it is not possible to assign the percentage contribution to the total waste generation by the different sources mentioned above. However based on estimates (Table 2.1 & Table 2.6), the percentage contributed by household waste is likely to be within the range of 70 – 87% of total waste generated.
2.2.5 Recycling Rates in Penang Island (1) MPPP Recycling Rates 1993-2004
Recycling rates have been calculated based on various formulae; and most of the time it is calculated based on collection or recovery at landfills. Currently, there is a lack of information about recovery and retention at source (waste separation at source). In Table 2.8, the recycling rates (based on collection of recyclables) in Penang from 1993 until 2004 have been presented. The following formula was used:
Recycling Rate (%) = (Quantity of Recyclables Collected) x 100% (Waste Amount Generated)
From a rate of 0.02 per cent in 1993, the rate has grown to be 1.59% in 2002, increasing to 8.25% in 2003 (including data received from contractors). In 2004 the recycling or recovery rate topped at 15.56%. MPPP is of the opinion that the rate may be higher if activities by all other contractors & agents could be captured.
For the first 8 months of 2005, based on reports that the STU have received, the recycling rate recorded is only 9.2%. This situation is due to the fact that private recyclable agents and buyers do not send reports regularly to the STU. As this is an administrative exercise, the information is forwarded to the STU on a voluntary basis

Local Action Plan in MP Pulau Pinang
4-22
and many companies are fearful about revealing information about their business in particular when it has financial implications.
In 2004, 44,093.1 tonnes of recyclables were collected based on information MPPP collected from its recycling vendors and collection centres. This works out to 3,674 tonnes/month or 121 tonnes/day. This implies that for a population of 667,500, the recovery rate is about 181 g/ capita/day.
In comparison, a pilot project (Paper by MPPP, UKM 2001) carried out in 1998 involving 233 houses in Hillside, Tanjung Bunga, a total of 46.3 tonnes of recyclables (paper, glass bottles, Al cans & plastic) were collected which translates to about 3.8 tonnes/month or 0.5 kg/household/day, which works out to 100g /capita/day (@5 pax/household).
(2) MPPP Recycling Rates 2005
Based on additional feedback from recyclable agents, the latest figures from MPPP indicate that by the end of October 2005, the total quantity of recyclables collected has risen to about 26, 788 tonnes (Table 2.9). The recycling rate is calculated to be about 10.6%, which is lower than that for 2004.
Table 2.9 Total Quantity of Recyclables Collected in Penang Island, 2005
No Month Quantity (kg) 1 January 2,708,525.80 2 February 2,430,652.15 3 March 2,481,292.70 4 April 2,460,769.81 5 May 2,345,511.33 6 June 2,585,285.50 7 July 2,728,359.00 8 August 2,568,781.19 9 September 2,469,239.35
10 October 4,009,452.50 TOTAL 26, 787,866.33
This situation is due to the fact that private recyclable agents and buyers do not send reports regularly to the STU. As this is an administrative exercise, the information is forwarded to the STU on a voluntary basis and many companies are fearful about revealing information about their business in particular when it has financial implications. To address this matter, in November 2005, the STU invited the recyclable agents to a meeting to explain the need to report their monthly collections, and to publicise the new reporting formats issued by MHLG. At the time of writing, the STU is in the process of collecting more data from the agents and the final recycling rate is expected to be higher.
2.2.6 Type of Recyclables Collected in Penang Island (1) Conventional Recyclables
MPPP has monitored the types of recyclables collected within its area. Table 2.10 shows the types of recyclables and quantities collected for three years (2002-2004). The main recyclable items collected are paper/box/cardboard, plastic, glass and metals. Since 2003, MPPP has been monitoring the quantities of old clothing/textiles collected.
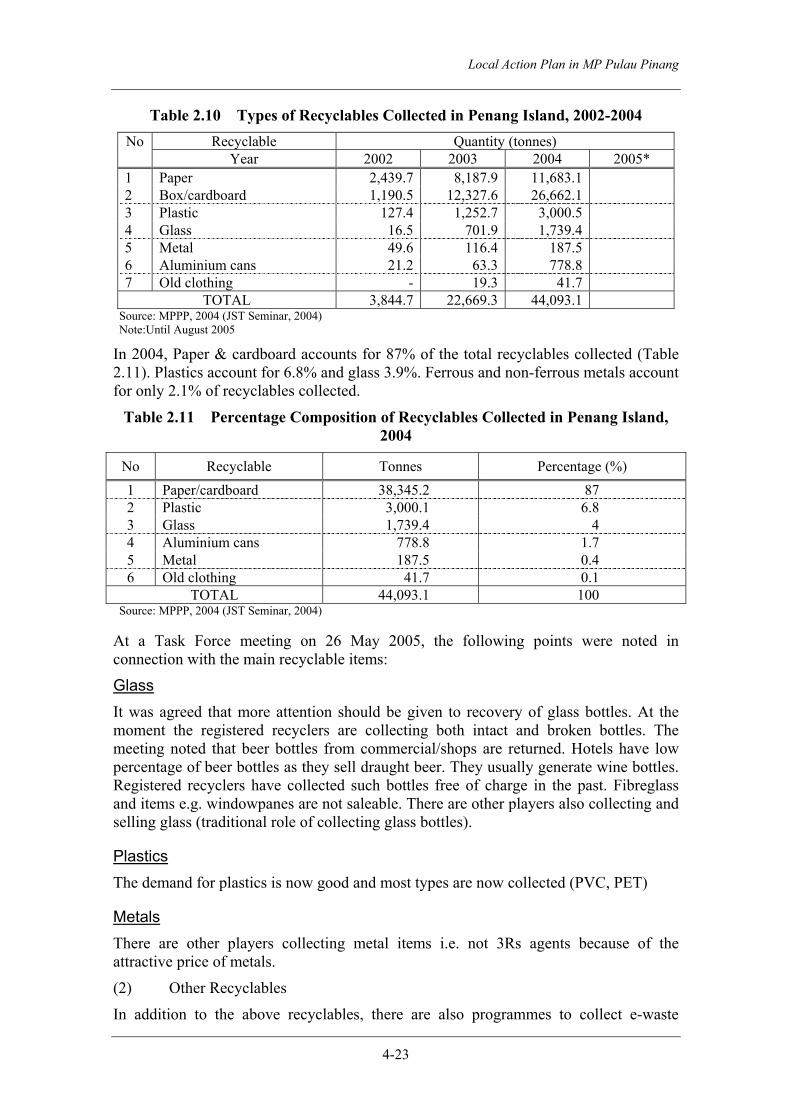
Local Action Plan in MP Pulau Pinang
4-23
Table 2.10 Types of Recyclables Collected in Penang Island, 2002-2004 Recyclable Quantity (tonnes) No
Year 2002 2003 2004 2005* 1 Paper 2,439.7 8,187.9 11,683.1 2 Box/cardboard 1,190.5 12,327.6 26,662.1 3 Plastic 127.4 1,252.7 3,000.5 4 Glass 16.5 701.9 1,739.4 5 Metal 49.6 116.4 187.5 6 Aluminium cans 21.2 63.3 778.8 7 Old clothing - 19.3 41.7
TOTAL 3,844.7 22,669.3 44,093.1 Source: MPPP, 2004 (JST Seminar, 2004) Note:Until August 2005
In 2004, Paper & cardboard accounts for 87% of the total recyclables collected (Table 2.11). Plastics account for 6.8% and glass 3.9%. Ferrous and non-ferrous metals account for only 2.1% of recyclables collected.
Table 2.11 Percentage Composition of Recyclables Collected in Penang Island, 2004
No Recyclable Tonnes Percentage (%) 1 Paper/cardboard 38,345.2 87 2 Plastic 3,000.1 6.8 3 Glass 1,739.4 4 4 Aluminium cans 778.8 1.7 5 Metal 187.5 0.4 6 Old clothing 41.7 0.1
TOTAL 44,093.1 100 Source: MPPP, 2004 (JST Seminar, 2004) At a Task Force meeting on 26 May 2005, the following points were noted in connection with the main recyclable items:
Glass It was agreed that more attention should be given to recovery of glass bottles. At the moment the registered recyclers are collecting both intact and broken bottles. The meeting noted that beer bottles from commercial/shops are returned. Hotels have low percentage of beer bottles as they sell draught beer. They usually generate wine bottles. Registered recyclers have collected such bottles free of charge in the past. Fibreglass and items e.g. windowpanes are not saleable. There are other players also collecting and selling glass (traditional role of collecting glass bottles).
Plastics The demand for plastics is now good and most types are now collected (PVC, PET)
Metals There are other players collecting metal items i.e. not 3Rs agents because of the attractive price of metals.
(2) Other Recyclables
In addition to the above recyclables, there are also programmes to collect e-waste

Local Action Plan in MP Pulau Pinang
4-24
(electronic & electrical waste) such as computer & peripherals, household appliances, communication equipment and office equipment. The list of e-waste collected is as follows:
Buy-back Items 1. Computers: Computer CPU and Computer monitor (whole set)
Items that are collected free-of –charge at community recycling centres. 1. Big floor & wall-based items: Refrigerators, washing machines, air conditioners etc. 2. Small table-top household items: Fans, stoves, grinders, blenders etc. 3. Entertainment equipment: Radios, TVs, CD & DVD players, etc. 4. Office Items: Telephones, fax machines, computer parts, electronic cash registers.
E-waste Collection Centres (Collects for Free) a) Penang Island
Dell (Phase 4), Bayan lepas and MPPP Store at Kampong Jawa Lama Toll Free Number: 1-800-88-0640
b) Seberang Perai
Dell (Bukit Tengah) and MPSP Stores in Jawi and Mak Mandin In addition to the e-waste collection programme, household hazardous waste such as fluorescent lamps and batteries are also collected (since 24th February 2004) at some supermarkets and 5 wet markets on the Island (Table 2.12).
Table 2.12 Amount of e-waste and Household Hazardous Waste Collected in 2004
Type Amount e-waste 94,734 kg Fluorescent lamps 7,746 pcs Batteries 676 kg
Source: MPPP, 2005-06-27
At the Task Force meeting on 26 May 2005, the players in Penang Island noted that the demand for e-waste is so good that any waste left outside premises would be removed within the hour. MPPP is working out a plan with FREPENCA (association of factories) for removal of fluorescent tubes and batteries from their waste stream before removal by contractor for disposal at landfill. MPPP reported that hospitals and hotels are currently contributing to disposal of Fluorescent tubes and batteries at landfill.
2.2.7 Recyclers Performance Initially, MPPP’s newly-introduced ‘Vendor System’ attracted only six (6) vendors; four (4) from Penang and two others from Kuala Lumpur. By the end of 2004, 24 companies had registered with MPPP. Those from outside Penang include MNI, SPM and KL Glass.
2.2.8 Re-Processing Activities in Penang Island MPPP’s records indicate that most of the re-processing activities are done on the mainland. However, there are a few processors of recyclables that perform some kind of

Local Action Plan in MP Pulau Pinang
4-25
material segregation on the island such as sorting of plastics, aluminium cans, paper etc. One particular company in Batu Maung recycles/ reprocesses used cardboard cartons into new ones for packaging purposes.
2.2.9 Voluntary Activities Voluntary initiatives in recycling in Penang are comparatively very active. Such organisations include NGOs and CBOs, schools, manufacturing industries government agencies and private enterprise. This is especially so since 2002.
According to the latest reports, there are 70 voluntary recycling communities on Penang Island (Table 2.7).
2.2.10 Price of Recyclables Price of recyclables varies according to market demand. In Penang Island, the contractors and recycling agents set the price of recyclable items and the relatively good demand and pricing have stimulated the growth of this sector. MPPP’s observations indicate that most of the valuable recyclables would have been recovered by the time the wastes (from different sources) are weighed at the transfer station. A sample of prices set by a recyclable collector in Penang is shown below:
Table 2.13 Typical Price List of Recyclables in Penang Island, March 2005 No Recyclable Price (RM/kg) 1 Paper 0.22 2 Box/cardboard 0.22 3 White paper 0.18 4 Plastic/PET 0.30-0.40 5 Glass bottles (per bottle) 0.06 6 Steel Cans 3.80 7 Aluminium cans 3.00 Source: Recyclable Collector, March 2005
2.2.11 Awareness on Waste Minimisation
As part of the 3Rs awareness campaign during the Pilot Project on Recycling Network & Source Separation in MPPP, a brochure was designed and published in English, Malay and Chinese, as shown above. 4000 copies were printed for distribution at events during the project period.

Local Action Plan in MP Pulau Pinang
4-26
Other awareness programmes were also held for communities/ residents/ business entities etc. The Campaigns were carried out at the Hillside target area, and other strategic locations. MPPP also participated in a host of events and co-organised activities with other organisations.
In connection with the Pilot Project on Source Separation, YAB Chief Minister of Penang launched the Pilot Project on 3 September 2005.
Plates 3 & 4: Launch of Separation at Source Pilot Project for Residents of Hillside, Tanjung Bunga
2.3 Issues of Waste Minimisation
2.3.1 Identification of Issues Based on a Project Cycle Management Roundtable held at MPPP on 22 February 2005, the Task Force on Action Plan for MPPP identified nine (9) core problems as follows (not in any order of importance):
1. Poor Attitude/ Behaviour 2. MPPP’s Low Capacity 3. Lack of Infrastructure/ Networking 4. Political Interference 5. Lack of Laws & Enforcement 6. Low Willingness to Pay 7. Lack of Knowledge 8. Landfill Land Issues 9. Unpredictable Market Forces
The task force agreed that core problems 1, 2 and 3 are the main problems faced in Penang Island. The roundtable discussion then identified the cause & effects of each of the three main problems. The problems trees of the three main problems are presented in ATTACHMENTS 1, 2 3 and 4.
Based on the three main problems, the task force turned the problems into positive expressions referred to as their ‘Objectives’. These are:
1. Improved Attitude/Behaviour
2. MPPP Has Adequate Capacity
3. Improved Infrastructure & Networking
Local Action Plan in MP Pulau Pinang
4-27
The objectives trees of the three main problems are presented in ATTACHMENTS 5, 6 and 7.
The PCM roundtable also took note that there are risks associated with the formulation of the Action Plan. These are mainly connected with the Federal Government’s decision regarding federalisation of solid waste management, and subsequent privatisation of services and passing of the Solid Waste Management Bill by Parliament.
The following matters were also raised by the task force as requiring consideration by MHLG and other relevant agencies: -
a) Human Resources
Adequate human resources are required for purposes of waste minimisation. In the past, MPPP had difficulty applying to the Public Services Department (PSD) for new posts, and when posts are approved PSD/Public Services Commission (PSC)’s recruitment process took a relatively long time. It was suggested that PSD officers be made more aware about the needs of waste management in line with government policies and expectations, and time required for recruitment exercise be improved. This may be enhanced by improving communication with MHLG.
b) Organisational Framework for Waste Management at MHLG
The task force noted that the organisational level responsible for waste management at MHLG is not commensurate with current needs and demands. While matters such as town & country planning, sewerage have their own department with a Director General, waste management is only attended to by a Division, and this division is manned by personnel seconded from the Ministry of Health. It was suggested that the Federal Government review the organisational framework to ensure that waste management can progress as envisaged.
c) Communication
In the past, breakdown in communication was observed on a number of occasions. This happened at different levels e.g. between MHLG and MPPP, and intra- departmental communications within MPPP. Such incidents have resulted in information not reaching intended recipients in a timely manner, or not at all. It was suggested that communication be improved in order to avoid unnecessary delays and inefficiencies.
d) Collection Centres
Design of selection centres as currently specified by MHLG consists of permanent concrete structures to be built in selected residential or commercial areas. MPPP’s experience shows that such structures are neither suitable nor effective. This is because of the scarcity of land and its high land prices. In addition, the NIMBY syndrome has contributed to such structures not being fully utilised e.g. Island Park centre. For LAs like MPPP, mobile collection facilities may be the answer that addresses both the land and attitude issues.
e) Market-based Approach
The task force pointed out that recyclable price fluctuation have both positive and negative impacts in recyclable market. When prices decline, there is a problem in accepting recyclables from consumers unless there is adequate storage capacity. Subsidies have been proposed as one of the ways to address this matter but it was
Local Action Plan in MP Pulau Pinang
4-28
generally agreed that market-based or economic instruments are required in order for this to work.
2.3.2 Solutions for Issues The proposed actions for addressing and resolving the waste management issues identified are described in the next chapter.

Local Action Plan in MP Pulau Pinang
4-29
CHAPTER 3 TARGETS OF WASTE MINIMISATION
3.1 Scope of Targets At a meeting held at MPPP on 10 March 2005, the Task Force on Action Plan for MPPP set the following targets for Penang Island.
The scope of the Action Plan for Waste Minimisation in terms of area coverage and time frame is as follows:
3.2 Target Recyclables
3.2.1 Main Items For Penang Island, the main items targeted for recycling are:
3.2.2 Additional Items The additional items targeted for recycling are e-wastes comprising the following:
3.3 Target Sources
The sources of waste that would be included in the Action Plan are:
3.4 Recycling Rate Targets Based on the waste generation rates and quantities, and recyclable collection statistics, the MPPP Task Force formulated a provisional set of recycling rate targets for all wastes.
TARGET AREA: PENANG ISLAND TARGET YEAR: 2010
Paper & Cardboard Plastics (Including PET)
Metals (Ferrous & Non-Ferrous) Glass
Bateries Fluorescent Tubes
Computers & Peripherals Electrical Home Appliances
Households Institutional Sources Commercial Sources
Industrial Sources

Local Action Plan in MP Pulau Pinang
4-30
Table 3.1 Proposed Recycling Rate Targets for MPPP, 2005-2010
Year 2005 (%)
2006 (%)
2007 (%)
2008 (%)
2009 (%)
2010 (%)
Without Food Composting (including e-waste)
20
22
24
26
28
30
Without Food Composting (excluding e-waste)
20
21
22
23
24
25
With Food Composting (+RRC)
*****
****
*****
*****
*****
40
Note: 1. RRC: Recyclable Recovery Centre 2. Assumption: That all 3 Key Problems identified at PCM Roundtable are addressed.
At a meeting of the Task Force on 26 May 2005, the above targets were reviewed and it was agreed that MPPP should focus on the following recycling rate targets:
Table 3.2 Recommended Recycling Rate Targets for MPPP, 2005-2010
Year 2005 (%)
2006 (%)
2007 (%)
2008 (%)
2009 (%)
2010 (%)
Without Food Composting (including e-waste)
20
21
22
23
24
25
Note:1. Assumption: That all 3 Key Problems identified at PCM Roundtable are addressed.
3.5 Summary of Action Plan A summary of MPPP’s Local Action Plan for Waste Minimisation (LAP-WM) 2006-2010 has been produced in the form of leaflet and this is attached as ATTACHMENT 8. This leaflet is to be reproduced and circulated to all government agencies and departments to ensure that the set targets are acknowledged and that their plans and programmes include activities to participate in the waste minimisation efforts for the island. It is also beneficial if the leaflet is circulated to the recycling agents and recyclable processing businesses, other major sources in the retail and service industries, as well as CBOs and NGOs.
Local Action Plan in MP Pulau Pinang
4-31
CHAPTER 4 ACTIONS TO ACHIEVE TARGETS
4.1 Strategy MPPP’s strategy for achieving the set targets within the period 2006-2010 will consist of:
Continual public awareness and education programmes Improving Networking & Partnership among Waste Minimisation Partners. Employing a Balance of Incentives and Disincentives (dependent upon new
SWM Act).
This is in line with the strategies adopted in the “Action Plan for Waste Minimisation” prepared for the Federal Government.
4.2 Approaches to Achieve Targets In using the above strategic elements, MPPP plans to employ the following approaches:
1) Collection of Recyclables from Households will be increased via the use of BBCs and Drop-off Centres.
2) Kerbside collection at Pilot Project II Target Area Hillside, Tanjung Bungah will be expanded to include about 400 additional households in the area.
3) Champions who are able to assist in Awareness & Educational Outreach Events for communities will be identified and trained.
4) Raising of awareness of communities will be aided by community leaders who are trained by qualified organisations (Training of Trainers).
5) The WMU will be a one-stop agency for all Waste Minimisation matters. 6) The website www.rnumppp.net will be a major vehicle for disseminating
information on waste minimisation. 7) Economic incentives shall be in place for low value recyclables (Federal). 8) MPPP will continue promoting collection of e-waste (electronic & electrical
wastes) for channelling to buyers/recyclers until MHLG issues directives/laws on their disposal.
9) MPPP will continue expanding collection of HHW and storing them until MHLG issues directives/laws on their disposal.
10) For household organic waste, composting of kitchen and garden waste will be encouraged.
11) Garden waste should be diverted to MPPP’s Parks & Garden Dept, Youth Park to be treated for production of soil conditioner.
12) Certain tasks of the WMU may be outsourced to qualified private contractors e.g. management of website on waste minimisation and data processing and analysis.
4.3 Pre-Conditions to Achieve Targets In order for MPPP to succeed in its plans and programmes, the three key elements mentioned below must be in place.
The SWM Act is passed by Parliament and regulations /byelaws are formulated for local level. The WMU is established at MPPP and adequate resources: human,
financial & equipment are allocated.

Local Action Plan in MP Pulau Pinang
4-32
The necessary infrastructure and mechanisms for waste minimisation are in place e.g. recyclable collection centres, award schemes, and incentives.
4.4 Selected Recyclable Sub-Categories As mentioned previously, the key recyclables comprise four categories:
• PAPER • PLASTICS • METALS • GLASS
For the first five years, MPPP will focus on the following sub-categories of recyclables under each of the above categories:
a. PAPER
a.1 Old Newspapers a.2 Cardboard a.3 Others
b. PLASTIC
b.1 Drink Bottles - Clear - Colour
b.2 Food Containers b.3 Other Containers
b.4 Mixed plastic (excluding shopping bags)
c. METALS
c.1 Aluminium cans c.2 Other metal containers c.3 Mixed metal items
d. GLASS
d.1 Clear glass bottles d.2 Coloured glass bottles
4.5 Local Authority (MPPP) In Chapter 4, Volume II the PCM Roundtable identified the following as the Key Objectives for MPPP:
a. Improved Attitude/ Behaviour b. MPPP Has Adequate Capacity c. Improved Infrastructure & Networking
Based on the targets set in Chapter 3, the Task Force proposes the following actions for MPPP to achieve the three key objectives. They are summarised in Table 4.1.

Local Action Plan in MP Pulau Pinang
4-33
Table 4.1 Summary of Key Actions to Achieve Objectives (for MPPP) Key Objectives Actions
IMPROVED ATTITUDE/BEHAVIOUR
1. Public Awareness & Public Education Programmes are carried out on a Continual Basis.
2. Legislative tools are in place and power vested in MPPP to enforce laws on waste minimisation.
3. MPPP is allowed to Inform & Report on the benefits of waste minimisation (using various modes including the website).
MPPP HAS ADEQUATE CAPACITY
4. MPPP shall set up a Waste Minimisation Unit. 5. MPPP shall have adequate and suitably qualified personnel
to implement the waste minimisation programmes and plans.6. MPPP shall be allocated adequate Budget for operational
and development purposes 7. MPPP shall acquire the relevant tools for implementing the
waste minimisation programmes and plans. 8. MPPP personnel for waste minimisation shall be provided
with relevant training on a periodic basis.
MPPP IMPROVES INFRASTRUCTURE & NETWORKING
9. The Directory of Stakeholders for Waste Minimisation shall be publicised and regularly updated.
10. Adequate resources shall be provided for expansion of the source separation in households and other generator groups.
a) Improved Attitude/Behaviour
In connection with improving the awareness and behaviour of Penang Island’s residents with regard to waste minimisation, awareness programmes have to be carried out regularly. For this the actions described for achieving the second objective have to be addressed. It was agreed that MPPP needs to demonstrate the benefits of waste minimisation. This is critical in creating and enhancing confidence in MPPP’s waste minimisation programmes. Success stories of waste minimisation programmes for different generator groups (household, manufacturing industry, hotels. hospitals, schools, office and shops/supermarkets) should be showcased. Benefits in terms of monetary returns not necessarily direct to participants but benefits for charitable causes have in the past encouraged participation in programmes e.g. at Hospital Lam Wah Ee when revenue from recyclables collection had been channeled to employee welfare fund and to donations for disaster funds e.g. for the Tsunami Fund. Benefits to improving environmental quality and to healthy living conditions also need to be publicised. For this, MPPP would need to select relevant Performance Indicators, carry out monitoring of specific parameters, work closely with its partners e.g. the Department of Environment, Health Services Department and of course it’s recycling partners. MPPP needs to engage such partners and keep channels open for dialogue and feedback. To balance the “carrot & the stick” approach, the new Federal law on solid waste management and related regulations at Federal and State levels e.g. for the 3Rs need to be in place as soon as possible.
b) MPPP Has Adequate Capacity
The issue of human resources is critical. With only two personnel currently allocated for the 3Rs, MPPP is unable to plan and implement programmes necessary to achieve the targets set. Under the ‘Study on National Waste Minimisation’ a Waste Minimisation

Local Action Plan in MP Pulau Pinang
4-34
Unit (WMU) was set up in June 2005. This WMU acts as a one-stop centre for information on waste minimisation and is the custodian of the website www.rnumppp.net has been designed and posted on the INTERNET. A dedicated e-mail address has also been designated for the WMU [email protected]. Adequate resources must be allocated to the WMU so that there are personnel to manage it and to update and maintain the website. It is proposed that MHLG provides a link to MPPP’s website once its website is upgraded and becomes operational again.
c) Waste Minimisation Unit (WMU)
It is recommended that the STU, Urban Services Unit at MPPP be upgraded to a Waste Minimisation Unit (WMU). The organisational structure recommended is shown in Figure 3. Such organisation is recommended for gradual implementation during the Ninth Malaysia Plan period (2006-2010). It is proposed that the WMU that was established during the JICA Pilot Project II be incorporated into the new WMU.
The proposed staffing of the proposed Waste Minimisation Unit (WMU), to be located at the Urban Services Department is summarised below. It is recommended that the new WMU be allocated 13 staff (increased from existing 2) to enable MPPP to achieve its objectives.
Table 4.2 Summary of Proposed Staffing of New Waste minimisation Unit, MPPP
Existing Staff/Code Existing Proposed Number of New staff
Head (U32) 1 1 0 Deputy.Head (U29) 0 1 1 Area Supervisor (U14) 0 1 1 PKA (U11) 1 4 3 PRA (R 1) 0 4 4 Driver (R3) 0 2 2
TOTAL 2 13 11
The functions of the WMU staff are described below.
Table 4.3 Summary of Responsibilities of Staff of the New Waste Minimisation Unit, MPPP
Staff/Grade Functions & Responsibilities
Head (U36)
1. Coordinator of the WMU. 2. Planning & implementation of WMU Activities:
• 3Rs Programmes (Including expansion of Waste Separation communities)
• Public Awareness & Education Programmes • Publicity & Promotion
3. Reviewing Reports of Performance of Waste Minimisation Activities.
4. Taking corrective actions or making recommendations to Director USD & to Task Force on Waste Minimisation.
5. Reporting to relevant Authorities. 6. Management of SW Information System. 7. Maintenance of the Recycling Network in Penang Island. 8. Perform Secretariat duties of the MPPP Task Force on Waste
Minimisation.
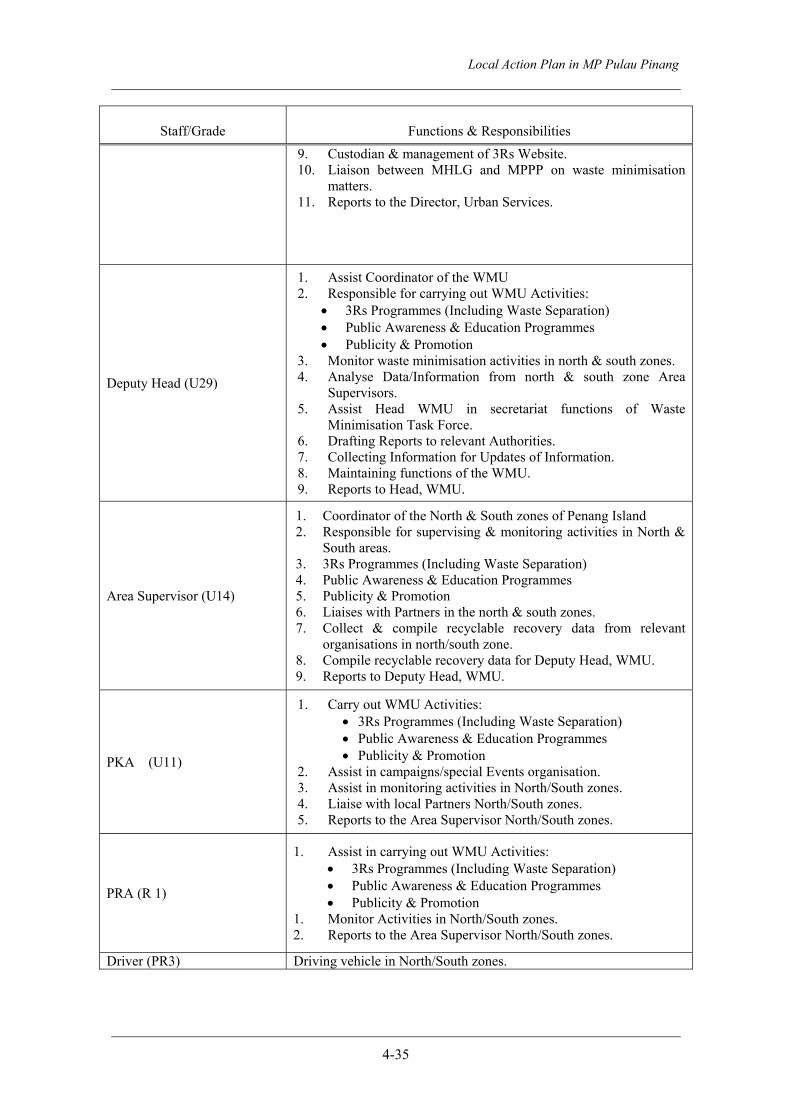
Local Action Plan in MP Pulau Pinang
4-35
Staff/Grade Functions & Responsibilities 9. Custodian & management of 3Rs Website. 10. Liaison between MHLG and MPPP on waste minimisation
matters. 11. Reports to the Director, Urban Services.
Deputy Head (U29)
1. Assist Coordinator of the WMU 2. Responsible for carrying out WMU Activities:
• 3Rs Programmes (Including Waste Separation) • Public Awareness & Education Programmes • Publicity & Promotion
3. Monitor waste minimisation activities in north & south zones. 4. Analyse Data/Information from north & south zone Area
Supervisors. 5. Assist Head WMU in secretariat functions of Waste
Minimisation Task Force. 6. Drafting Reports to relevant Authorities. 7. Collecting Information for Updates of Information. 8. Maintaining functions of the WMU. 9. Reports to Head, WMU.
Area Supervisor (U14)
1. Coordinator of the North & South zones of Penang Island 2. Responsible for supervising & monitoring activities in North &
South areas. 3. 3Rs Programmes (Including Waste Separation) 4. Public Awareness & Education Programmes 5. Publicity & Promotion 6. Liaises with Partners in the north & south zones. 7. Collect & compile recyclable recovery data from relevant
organisations in north/south zone. 8. Compile recyclable recovery data for Deputy Head, WMU. 9. Reports to Deputy Head, WMU.
PKA (U11)
1. Carry out WMU Activities: • 3Rs Programmes (Including Waste Separation) • Public Awareness & Education Programmes • Publicity & Promotion
2. Assist in campaigns/special Events organisation. 3. Assist in monitoring activities in North/South zones. 4. Liaise with local Partners North/South zones. 5. Reports to the Area Supervisor North/South zones.
PRA (R 1)
1. Assist in carrying out WMU Activities: • 3Rs Programmes (Including Waste Separation) • Public Awareness & Education Programmes • Publicity & Promotion
1. Monitor Activities in North/South zones. 2. Reports to the Area Supervisor North/South zones.
Driver (PR3) Driving vehicle in North/South zones.

Local Action Plan in MP Pulau Pinang
4-36
d) Task Force on Waste Minimisation Unit
It is recommended that the Action Plan Task Force established in early 2005 for the purpose of formulating an “Action Plan for Waste Minimisation for MPPP” be maintained and continues to function in an advisory capacity. MPPP may review the membership of this Task Force and appoint advisors as deemed necessary. It is recommended that the Director of Urban Services, MPPP continues to chair this Task Force. The functions of the Task Force are summarised below.
Table 4.4 Summary of Functions of Task Force on Waste Minimisation, MPPP No. Designation Functions
1 Chairperson (Director Urban Services, MPPP)
• Chair Task Force • Liaison with MHLG (Performance & Review of
Action Plan) • Coordinate review & Update of Action Plan on Waste
Minimisation.
2 Secretariat (Head WMU)
• Perform secretariat functions to Task Force • Organise meetings/events for Task Force. • Report on Performance of Waste Minimisation
Programmes & Progress of Source Separation to Task Force.
• Organise review & Update of Action Plan on Waste Minimisation by Task Force and for consideration by President, MPPP.
3 Members
• Attend Task Force Meetings & events. • Contribute to review of performance of waste
minimisation programmes. • Provide inputs and recommendations for Review &
update of Action Plan on Waste Minimisation.
e) Equipment & Cost
Based on the organisational structure proposed, the WMU Team needs adequate tools to implement its programmes and they are listed in Table 4.5 below. The total capital or development cost is estimated to be RM1.840,000. The largest expenditure involves the construction of the depot for household hazardous wastes (RM 1.5 million), which is scheduled for construction in 2007. This depot is important in order to divert potentially hazardous substances from further contaminating the soil, and groundwater and surface water resources.
Table 4.5 Equipment for Implementation of 3Rs Plan in Penang Island No. Items Number Estimated Capital Cost (RM)
1 Vehicles (4 x 4): North & South Areas @ RM 100,000/vehicle
Two (2) 200,000
2
Audio-visual Equipment • Notebook Computer • Screen • LCD Projector
Two (2) Two (2) One (1)
14,0001,0005,000
3 Buy-back Centres for Recyclables @RM 20,000/centre
Eight (8) 160,000
4 Hazardous Household Wastes Depot One (1) 1,500,000
Total 1,840,000

Local Action Plan in MP Pulau Pinang
4-37
f) Capacity Building
Capacity building of the staff of WMU is important to improve their knowledge and skills. For this JICA’s assistance is sought for organising training in Japan or in Malaysia. Such training may involve short courses or longer term (1-3 months) in the following subject areas:
Public Awareness & Education Waste Reduction Waste Recycling
Management of Hazardous Household Wastes
g) Buy-back Centres (BBCs)
To complement the kerbside services provided for collecting recyclables from households, it is recommended that buy back centres be established. The BBCs are proposed to be incorporated into the existing MPPP Roll-call centres. Such centres are proposed to be simple structures for receiving and storing recyclables before collection by recyclables agents. These BBCs may be operated by MPPP or ‘adopted’ by NGOs or residents associations, or recycling agents.
h) Hazardous Household Wastes Depot
As mentioned in the foregoing, MPPP has been collecting and storing Hazardous Household Wastes at its depot in Kampung Jawa. It is anticipated that the volume of such waste e.g. fluorescent bulbs, batteries and e-wastes will increase in the future. Some e-wastes are bulky e.g. refrigerators and washing machines. A proper storage area with the necessary safety and security features needs to be established while a suitable programme on the best environmentally and economically sound method to handle them is planned and implemented.
i) Improved Infrastructure & Networking
Under Pilot Project II undertaken by MPPP for the establishment of Recycling Network and Source Separation, a Directory of Stakeholders for Waste Minimisation has been prepared. This directory contains information on all recycling partners registered with MPPP. A booklet on Penang Island’s Experience in establishing its waste minimisation programme and creating its recycling network has also been prepared. Adequate resources should be provided so that these documents can be publicised and updated as MPPP receives more registered recyclable collectors and agents and more recycling communities are established. Adequate resources shall be provided for expansion of the Source Separation in households and other generator groups.

Local Action Plan in MP Pulau Pinang
4-38
Figure 4.1 Proposed Organisation Structure of the Waste Minimisation Unit (WMU), Urban Services Department, MPPP
4.6 Action Plan for Waste Minimisation Partners, 2006-2010 Further to the actions described for addressing the key problems/issues in MPPP in the previous section, MPPP will work closely with its key partners. It is noted that MPPP’s plans and programmes will be geared towards encouraging the 3Rs: Reduce, Reuse and Recycle and MPPP will facilitate actions by various stakeholders and partners to increase awareness and implement waste management programmes that suit the relevant groups. Activities to raise awareness on waste minimisation will be carried out on a continual basis, while networking will be improved. Strengthening of the Recycling Network will involve encouraging more recycling players to register and to encourage more dialogue and interaction among them.
The Action Plan for MPPP and the key partners are tabulated below (Table 4.6 & 4.7).
Deputy Head, WMU (U 29)
Head, WMU (U 36)
Area Supervisor, WMU(U 14)
PKA PKA PKA PKA
Driver Driver
North South
PRA PRA PRA PRA

Local Action Plan in MP Pulau Pinang
4-39
Table4.6 Summary of Actions by Key Players for Each Type of Recyclable
MSW Generators
Recyclables Households Institutional Commercial Industrial
Recyclable Collectors/
Agents a. Paper a.1 Old Newspaper a.2 Cardboard a.3 Others
⇐⇐⇐⇐⇐
Public & Awareness Education
⇒⇒⇒⇒
⇒⇒⇒⇒⇒
b. Plastics b.1 Drink bottles - Color - Clear b.2 Food container b.3 Other container b.4 Mixed plastics (excluding shopping bags)
⇐⇐⇐⇐⇐
Public & Awareness Education
⇒⇒⇒⇒
⇒⇒⇒⇒⇒
c. Metals c.1 Aluminium cans c.2 Other metal container c.3 mixed metal items
⇐⇐⇐⇐
Public & Awareness Education
⇒⇒⇒⇒
⇒⇒⇒⇒⇒
d. Glass d.1 Clear bottles d.2 Color bottles
⇐⇐⇐⇐
Public & Awareness Education
⇒⇒⇒⇒
⇒⇒⇒⇒⇒

4-40
Local Action Plan in MP Pulau Pinang
Tab
le4.
7 A
ctio
n Pl
an fo
r W
aste
Min
imis
atio
n, 2
006-
2010
Partn
er
2006
20
07
2008
20
09
2010
Se
t up
WM
U.
Acq
uire
H
uman
re
sour
ces
and
equi
pmen
t for
WM
U.
Con
tinue
staf
fing
of W
MU
. A
cqui
re e
quip
men
t. C
ontin
ue st
affin
g of
WM
U.
Acq
uire
equ
ipm
ent.
Com
plet
e st
affin
g of
WM
U.
Acq
uire
equ
ipm
ent.
Rev
iew
st
affin
g &
eq
uipm
ent n
eeds
of W
MU
.
Cap
acity
bui
ldin
g of
WM
U
staf
f. C
apac
ity b
uild
ing
of W
MU
st
aff.
Cap
acity
bui
ldin
g of
WM
U
staf
f. C
apac
ity b
uild
ing
of W
MU
st
aff.
Cap
acity
bui
ldin
g of
WM
U
staf
f. O
utso
urce
m
anag
emen
t of
W
MU
web
site
&
Dat
a pr
oces
sing
for
web
site
up
date
.
Out
sour
ce
man
agem
ent
of
WM
U w
ebsi
te &
D
ata
proc
essi
ng f
or w
ebsi
te
upda
te.
Out
sour
ce
man
agem
ent
of
WM
U w
ebsi
te &
D
ata
proc
essi
ng f
or w
ebsi
te
upda
te.
Out
sour
ce
man
agem
ent
of
WM
U w
ebsi
te &
D
ata
proc
essi
ng f
or w
ebsi
te
upda
te.
Out
sour
ce
man
agem
ent
of
WM
U w
ebsi
te &
D
ata
proc
essi
ng f
or w
ebsi
te
upda
te.
Ensu
re r
elea
se o
f 2
5-to
nne
MH
LG
truck
s &
m
ake
nece
ssar
y m
odifi
catio
ns.
Use
the
2 M
HLG
truc
ks.
Mai
ntai
n tru
cks
and
optim
ise
thei
r use
. M
aint
ain
truck
s and
opt
imis
e th
eir u
se.
Mai
ntai
n tru
cks a
nd o
ptim
ise
thei
r use
.
Set u
p 4
BB
Cs.
Set u
p 4
mor
e B
BC
s.
Mai
ntai
n 8
BB
Cs.
Mai
ntai
n 8
BB
Cs.
Mai
ntai
n 8
BB
Cs.
Set
up
Driv
e th
roug
h D
rop-
off
Cen
tre a
t Sun
shin
e Fa
rlim
.
Mai
ntai
n D
rop-
off C
entre
. M
aint
ain
Dro
p-of
f Cen
tre.
Mai
ntai
n D
rop-
off C
entre
. M
aint
ain
Dro
p-of
f Cen
tre.
Exte
nd K
erbs
ide
Rec
ycla
ble
co
llect
ion
to B
anda
r B
ayan
B
aru.
Ex
tend
R
ecyc
labl
e
colle
ctio
n to
hi
gh-r
ise
resi
dent
ial
build
ings
up
on
dem
and.
Mai
ntai
n ke
rbsi
de c
olle
ctio
n &
exp
and
whe
re a
ppro
pria
te.
Mai
ntai
n ke
rbsi
de c
olle
ctio
n &
exp
and
whe
re a
ppro
pria
te.
Mai
ntai
n ke
rbsi
de c
olle
ctio
n &
exp
and
whe
re a
ppro
pria
te.
Mai
ntai
n ke
rbsi
de c
olle
ctio
n &
exp
and
whe
re a
ppro
pria
te.
App
ly f
or B
udge
t fo
r H
HW
D
epot
. Se
t up
HH
W D
epot
M
aint
ain
HH
W D
epot
. M
aint
ain
HH
W D
epot
. M
aint
ain
HH
W D
epot
.
MPP
P
Impl
emen
t N
ew
Rec
ycla
ble
Rec
over
y R
epor
ting
form
at (M
HLG
).
Impl
emen
t N
ew
Rec
ycla
ble
Rec
over
y R
epor
ting
form
at (M
HLG
).
Impl
emen
t N
ew
Rec
ycla
ble
Rec
over
y R
epor
ting
form
at (M
HLG
).
Impl
emen
t N
ew
Rec
ycla
ble
Rec
over
y R
epor
ting
form
at (M
HLG
).
Impl
emen
t N
ew
Rec
ycla
ble
Rec
over
y R
epor
ting
form
at (M
HLG
).

4-41
Local Action Plan in MP Pulau Pinang
Partn
er
2006
20
07
2008
20
09
2010
Im
plem
ent
new
M
PPP
on-li
ne
Rep
ortin
g Sy
stem
fo
r R
ecyc
labl
e A
gent
s/bu
yers
.
Impr
ove
M
PPP
on-li
ne
Rep
ortin
g Sy
stem
fo
r R
ecyc
labl
e A
gent
s/bu
yers
.
Impr
ove
M
PPP
on-li
ne
Rep
ortin
g Sy
stem
fo
r R
ecyc
labl
e A
gent
s/bu
yers
.
Impr
ove
M
PPP
on-li
ne
Rep
ortin
g Sy
stem
fo
r R
ecyc
labl
e A
gent
s/bu
yers
.
Impr
ove
M
PPP
on-li
ne
Rep
ortin
g Sy
stem
fo
r R
ecyc
labl
e A
gent
s/bu
yers
.
Upd
ate
Rec
yclin
g D
irect
ory
Upd
ate
web
site
. Pu
blis
h ne
w
info
rmat
ion
mat
eria
ls.
Upd
ate
Rec
yclin
g D
irect
ory
Upd
ate
web
site
. Pu
blis
h ne
w
info
rmat
ion
mat
eria
ls.
Upd
ate
Rec
yclin
g D
irect
ory
Upd
ate
web
site
. Pu
blis
h ne
w
info
rmat
ion
mat
eria
ls.
Upd
ate
Rec
yclin
g D
irect
ory
Upd
ate
web
site
. Pu
blis
h ne
w
info
rmat
ion
mat
eria
ls.
Upd
ate
Rec
yclin
g D
irect
ory
Upd
ate
web
site
. Pu
blis
h ne
w
info
rmat
ion
mat
eria
ls.
Exte
nd
Scho
ols
3Rs
Prog
ram
me
to
10
mor
e sc
hool
s. Ex
tend
Fa
ctor
ies
3Rs
Prog
ram
me
to
5 m
ore
fact
orie
s. Tr
aini
ng o
f Tra
iner
s
(com
mun
ity)-
#2/y
ear.
Exte
nd
Scho
ols
3Rs
Prog
ram
me
to
10
mor
e sc
hool
s. Ex
tend
Fa
ctor
ies
3Rs
Prog
ram
me
to
5 m
ore
fact
orie
s. Tr
aini
ng o
f Tra
iner
s
(com
mun
ity)-
#2/y
ear.
Exte
nd
Scho
ols
3Rs
Prog
ram
me
to
10
mor
e sc
hool
s. Ex
tend
Fa
ctor
ies
3Rs
Prog
ram
me
to
5 m
ore
fact
orie
s. Tr
aini
ng o
f Tra
iner
s
(com
mun
ity)-
#2/y
ear.
Exte
nd
Scho
ols
3Rs
Prog
ram
me
to
10
mor
e sc
hool
s. Ex
tend
Fa
ctor
ies
3Rs
Prog
ram
me
to
5 m
ore
fact
orie
s. Tr
aini
ng o
f Tra
iner
s
(com
mun
ity)-
#2/y
ear.
Exte
nd
Scho
ols
3Rs
Prog
ram
me
to
10
mor
e sc
hool
s. Ex
tend
Fa
ctor
ies
3Rs
Prog
ram
me
to
5 m
ore
fact
orie
s. Tr
aini
ng o
f Tra
iner
s
(com
mun
ity)-
#2/y
ear.
D
raft
Bye
-law
s on
3Rs.
Gaz
ette
Bye
-law
s. B
egin
En
forc
ing
Bye
-law
s on
3R
s. En
forc
e B
ye-la
ws o
n 3R
s. En
forc
e B
ye-la
ws o
n 3R
s.
Scho
ols
Reg
iste
r w
ith
WM
U
for
parti
cipa
tion
in
3Rs
prog
ram
me.
U
se
“Gui
delin
es
for
Enha
ncem
ent
of
3Rs
in
Scho
ols”
(P
repa
red
unde
r JS
T, 2
005)
.
Reg
iste
r w
ith
WM
U
for
parti
cipa
tion
in
3Rs
prog
ram
me.
U
se
“Gui
delin
es
for
Enha
ncem
ent
of
3Rs
in
Scho
ols”
.
Reg
iste
r w
ith
WM
U
for
parti
cipa
tion
in
3Rs
prog
ram
me.
U
se
“Gui
delin
es
for
Enha
ncem
ent
of
3Rs
in
Scho
ols”
.
Reg
iste
r w
ith
WM
U
for
parti
cipa
tion
in
3Rs
prog
ram
me.
U
se
“Gui
delin
es
for
Enha
ncem
ent
of
3Rs
in
Scho
ols”
.
Reg
iste
r w
ith
WM
U
for
parti
cipa
tion
in
3Rs
prog
ram
me.
U
se
“Gui
delin
es
for
Enha
ncem
ent
of
3Rs
in
Scho
ols”
.
Fact
orie
s
Reg
iste
r w
ith
WM
U
for
parti
cipa
tion
in
3Rs
prog
ram
me.
Pr
actis
e go
od
cons
umpt
ion
&
man
ufac
turin
g pr
actic
es
and
redu
ce w
aste
.
Reg
iste
r w
ith
WM
U
for
parti
cipa
tion
in
3Rs
prog
ram
me.
Pr
actis
e go
od
cons
umpt
ion
&
man
ufac
turin
g pr
actic
es
and
redu
ce w
aste
.
Reg
iste
r w
ith
WM
U
for
parti
cipa
tion
in
3Rs
prog
ram
me.
Pr
actis
e go
od
cons
umpt
ion
&
man
ufac
turin
g pr
actic
es
and
redu
ce w
aste
.
Reg
iste
r w
ith
WM
U
for
parti
cipa
tion
in
3Rs
prog
ram
me.
Pr
actis
e go
od
cons
umpt
ion
&
man
ufac
turin
g pr
actic
es
and
redu
ce w
aste
.
Reg
iste
r w
ith
WM
U
for
parti
cipa
tion
in
3Rs
prog
ram
me.
Pr
actis
e go
od
cons
umpt
ion
&
man
ufac
turin
g pr
actic
es
and
redu
ce w
aste
.
Rec
yclin
g A
gent
s/
Buy
ers
Reg
iste
r with
WM
U.
Wor
ksho
p on
W
aste
M
inim
isat
ion
for
Rec
yclin
g A
gent
s/B
uyer
s.
Reg
iste
r with
WM
U.
Wor
ksho
p on
W
aste
M
inim
isat
ion
for
Rec
yclin
g A
gent
s/B
uyer
s.
Reg
iste
r with
WM
U.
Wor
ksho
p on
W
aste
M
inim
isat
ion
for
Rec
yclin
g A
gent
s/B
uyer
s.
Reg
iste
r with
WM
U.
Wor
ksho
p on
W
aste
M
inim
isat
ion
for
Rec
yclin
g A
gent
s/B
uyer
s.
Reg
iste
r with
WM
U.
Wor
ksho
p on
W
aste
M
inim
isat
ion
for
Rec
yclin
g A
gent
s/B
uyer
s.
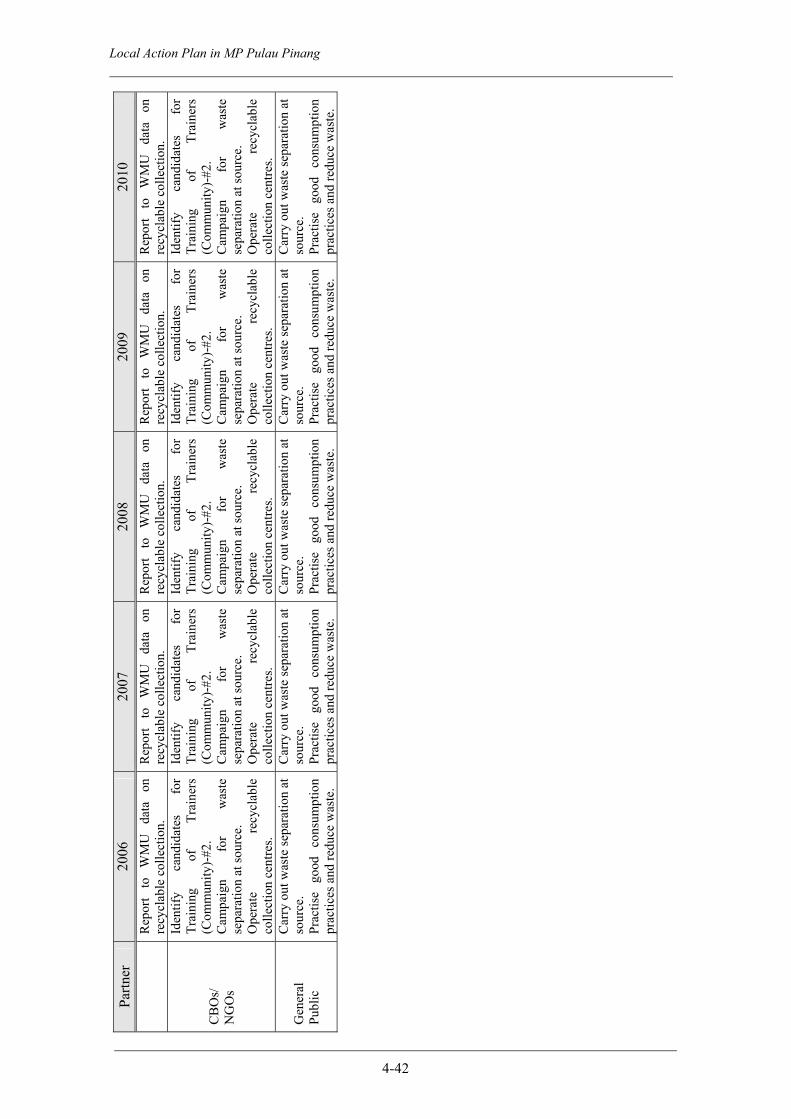
4-42
Local Action Plan in MP Pulau Pinang
Partn
er
2006
20
07
2008
20
09
2010
R
epor
t to
W
MU
da
ta
on
recy
clab
le c
olle
ctio
n.
Rep
ort
to
WM
U
data
on
re
cycl
able
col
lect
ion.
R
epor
t to
W
MU
da
ta
on
recy
clab
le c
olle
ctio
n.
Rep
ort
to
WM
U
data
on
re
cycl
able
col
lect
ion.
R
epor
t to
W
MU
da
ta
on
recy
clab
le c
olle
ctio
n.
CB
Os/
N
GO
s
Iden
tify
cand
idat
es
for
Trai
ning
of
Tr
aine
rs
(Com
mun
ity)-
#2.
Cam
paig
n fo
r w
aste
se
para
tion
at so
urce
. O
pera
te
recy
clab
le
colle
ctio
n ce
ntre
s.
Iden
tify
cand
idat
es
for
Trai
ning
of
Tr
aine
rs
(Com
mun
ity)-
#2.
Cam
paig
n fo
r w
aste
se
para
tion
at so
urce
. O
pera
te
recy
clab
le
colle
ctio
n ce
ntre
s.
Iden
tify
cand
idat
es
for
Trai
ning
of
Tr
aine
rs
(Com
mun
ity)-
#2.
Cam
paig
n fo
r w
aste
se
para
tion
at so
urce
. O
pera
te
recy
clab
le
colle
ctio
n ce
ntre
s.
Iden
tify
cand
idat
es
for
Trai
ning
of
Tr
aine
rs
(Com
mun
ity)-
#2.
Cam
paig
n fo
r w
aste
se
para
tion
at so
urce
. O
pera
te
recy
clab
le
colle
ctio
n ce
ntre
s.
Iden
tify
cand
idat
es
for
Trai
ning
of
Tr
aine
rs
(Com
mun
ity)-
#2.
Cam
paig
n fo
r w
aste
se
para
tion
at so
urce
. O
pera
te
recy
clab
le
colle
ctio
n ce
ntre
s.
Gen
eral
Pu
blic
Car
ry o
ut w
aste
sepa
ratio
n at
so
urce
. Pr
actis
e go
od
cons
umpt
ion
prac
tices
and
redu
ce w
aste
.
Car
ry o
ut w
aste
sepa
ratio
n at
so
urce
. Pr
actis
e go
od
cons
umpt
ion
prac
tices
and
redu
ce w
aste
.
Car
ry o
ut w
aste
sepa
ratio
n at
so
urce
. Pr
actis
e go
od
cons
umpt
ion
prac
tices
and
redu
ce w
aste
.
Car
ry o
ut w
aste
sepa
ratio
n at
so
urce
. Pr
actis
e go
od
cons
umpt
ion
prac
tices
and
redu
ce w
aste
.
Car
ry o
ut w
aste
sepa
ratio
n at
so
urce
. Pr
actis
e go
od
cons
umpt
ion
prac
tices
and
redu
ce w
aste
.

Local Action Plan in MP Pulau Pinang
4-43
CHAPTER 5 MONITORING AND IMPROVEMENT
5.1 Monitoring and Evaluating the Performance of LAP-WM
5.1.1 Continual Improvement MPPP’s Local Action Plan for Waste Minimisation (LAP-WM) 2006-2010 may be modelled on the PDCA Cycle.
1. PLAN-Establish Objectives & Targets, and Prepare LAP-WM 2. DO-Implement LAP-WM 3. CHECK-Monitor the implementation of LAP-WM & Measure Results 4. ACT-Improve LAP-WM and results.
The PDCA Cycle is based on the concept of Continual Improvement. MPPP proposes to undertake the programmes and activities phase-by-phase, and incorporate monitoring of performance. The Waste Minimisation Unit (WMU) is responsible for monitoring performance, evaluating, taking corrective measures, and eventually reporting. The Waste Minimisation Task Force will provide guidance and advice to the WMU throughout the cycle.
5.1.2 Key Performance Indicators Key performance indicators (KPIs) are useful in measuring the performance of WM programmes and activities. The KPIs will provide an indication of their applicability and effectiveness. They will also serve to indicate the benefits of WM. KPIs that are proposed for the initial stage are:
Operational Indicators
• Waste Generation per capita • Overall Recycling Rates • Recycling Rates of Specific Recyclable • Percentage of Recyclables on Landfill • Savings in Waste Disposal Costs/year • Level of Public Awareness on Waste Minimisation
Other KPIs that will be considered as MPPP’s capacity improves include:
Environmental Indicators
• Frequency & magnitude of illegal dumping • Rate of use of landfill space
5.1.3 What is to be monitored? Based on the selected KPIs, the WMU and Task Force will consider the following factors in deciding what to monitor and measure:
• What are the significant waste minimisation issues? • What are their characteristics? • How can they be measured? • How is data & information collected?

Local Action Plan in MP Pulau Pinang
4-44
• How is data recorded? • Can MPPP collect data on its own or need assistance?
The parameters to be measured are shown in Table 5.1.
Table 5.1 Parameters to be Measured No. KPI Monitoring Parameters
1 Waste Generation per capita
1. Population growth 2. Quantity of Waste Generated or Quantity
of Waste Collected 3. Quantity of recyclables collected
2 Annual Recycling Rates/ Rate of Recovery of Recyclables
4. Quantity of Waste Generated or Quantity of Waste Collected
5. Quantity of recyclables collected (per day/month/year)
3 Savings in Waste Disposal Costs/year1. Quantity of Waste Disposed on Landfill 2. Cost of Disposal at Landfill (tipping fees)
(per day/month/year)
MPPP will also monitor specific parameters for reporting to the MHLG. The parameters for these monthly reports include:
• Quantities of SW collected within LA • Quantities of Recyclables collected within the LA (including by contractors) • Quantity of SW disposed at landfills/ transported from Batu Maung Transfer
Station
MPPP will use standard formats for recyclable collectors/agents to report on their recycling activities.
5.1.4 Evaluation of Monitoring Results & Improvement Findings from monitoring will be analysed and reports prepared. The findings will indicate whether the targets have been achieved. If the targets have not been achieved, then actions will be taken to correct or remedy the situation. Corrective actions may include making changes to the targets, programmes and activities. They may also involve organisational, technical, financial and strategic matters.
If the targets have been met, the Task Force will recommend to MPPP top management on the need to make changes to improve waste minimisation. Improvement measures may involve changes to:
• LAP-WM Objectives & Targets • Key Performance Indicators • Any other component of the LAP-WM e.g. expand source separation
programme, mode of recyclable collection etc.
5.2 Reporting It is noted that MPPP needs to prepare and send periodic reports to:
• MPPP Top Management (after endorsement by the Task Force) • The MHLG
Pro-forma Reports will be used (e.g. those issued by MHLG) and where facilities are

Local Action Plan in MP Pulau Pinang
4-45
available, reports will be made and transmitted in Electronic form (it saves paper).
Reports or progress of WM efforts may be disseminated to the public (subject to MPPP top management approval), and to its waste minimisation partners. The modes for publicizing include the website, meetings, seminars and the printed media including Penang State Government’s bulletin. The frequency for reporting is shown in Table 5.2.
Table 5.2 Reporting of Data Required for Monitoring of Performance
No Regular Data Collection & Reporting Recommended Frequency
1 Reports from registered recycling players, and/ or compilation of recycling information system Monthly
2 Reports from public recycling bins/ centres on the quantity of recyclable materials collected Monthly
3 Questionnaires to the registered recycling players to determine the issues, problems faced and comments from the players to improve the entire recycling practices
Quarterly/ Twice/year
4
Questionnaires to selected numbers of waste generation sources (households, businesses and industries etc.) to find out the practice of waste retained, waste handling and subsequently to determine the issues, problems faced and comments from the waste generators to improve the entire recycling system
Yearly
5 MPPP Annual reports on the development and implementation of the overall Waste Minimisation and Recycling Programme Yearly
6 MPPP Annual workshop with recycling players/ network Yearly

Local Action Plan in MP Pulau Pinang
4-46
ATTACHMENTS

Local Action Plan in MP Pulau Pinang
4-47
ATT
AC
HM
ENT
1
Pol
itica
l Int
erfe
renc
eLa
ck o
f Leg
isla
tion
& E
nfor
cem
ent
Knee
Jer
k R
eact
ion
of L
e gis
latio
n
Poo
r or L
ack
of
Enf
orce
men
t (Fi
nes)
Pol
itica
l Will
to
Impl
emen
t
Insu
ffici
ent
Net
wor
king
No
Kerb
side
C
olle
ctio
n
Mec
hani
sm /
form
atio
n fo
r
Willi
ngne
ss to
Pay
for
Was
te D
ispo
sal
Not
Use
d to
“Pol
lute
r Pa
y” C
once
pt
Par
ticip
atio
n
Poo
r Atti
tude
&
Pra
ctic
es o
f Con
sum
er
(Com
mun
ity)
Atti
tude
Sel
fishn
ess
of
Com
mun
it y
Diff
icul
t to
Cha
nge
Bad
/ O
ld H
abits
Illeg
al D
umpi
ng
Pla
stic
Bag
s (E
xces
sive
Use
)
Know
ledg
e
Info
rmat
ion
Abo
ut 3
R
Land
fill N
early
Fu
ll
Fina
ncia
l Con
stra
ints
(K
PK
T / M
PP
P)
Info
rmat
ion
Dis
sem
inat
ion
to
Publ
ic
Lim
ited
Land
for
Land
fill
No
Fullt
ime
Team
(M
PP
P)
Mar
ket F
orce
s
CO
RE
PRO
BLE
MS
3. L
AC
K O
F IN
FRA
STR
UC
TUR
E &
N
ETW
OR
KIN
G
1. P
OO
R A
TTIT
UD
E / B
EHA
VIO
UR
2. M
PPP’
S LO
W C
APA
CIT
Y

Local Action Plan in MP Pulau Pinang
4-48
ATT
AC
HM
ENT
2
PRO
BLE
M T
REE
OF
POO
R A
TTIT
UD
E &
BEH
AVI
OU
R
<EFF
ECTS
>
<C
AU
SES>
Dirt
y P
enan
g
Tour
ism
Indu
stry
Qua
lity
Imag
e of
Pen
ang
Dow
n PR
OB
LEM
1: P
OO
R A
TTIT
UD
E&
BEH
AVI
OU
R
Mor
e Ex
pens
es
Stu
bbor
nnes
s
Too
Pam
pere
d
Lack
of K
now
ledg
e
“NIM
BY
” Syn
drom
e
Not
Aw
are
of
Ser
ious
Impa
ct o
f E
nviro
nmen
t
“Gov
ernm
ent
Res
pons
ible
for A
ll”
Men
talit
y
Lack
of E
nfor
cem
ent
Lack
of C
ivic
M
inde
dnes
s
Inef
ficie
nt P
ublic
ity

Local Action Plan in MP Pulau Pinang
4-49
ATT
AC
HM
ENT
3 PR
OB
LEM
TR
EE O
F M
PPP’
s LO
W C
APA
CIT
Y <E
FFEC
TS >
<C
AU
SES>
Lack
of F
inan
cial
Allo
wan
ce
from
MH
LG
Diff
icul
ty in
Obt
aini
ng
Cou
ncil’s
App
rova
l
Ineq
uita
ble
Allo
catio
n w
ithin
M
PP
P
Res
pons
ibilit
y In
crea
se a
nd R
even
ue
Gen
erat
ion
of L
A N
ot C
omm
ensu
rate
JPA
Offi
cers
Do
Not
U
nder
stan
d LA
’s N
eeds
Dis
posa
l Cos
t Hig
h
Mor
e P
ublic
Com
plai
nts
Inef
ficie
nt S
ervi
ce
Inef
fect
iven
ess
of W
aste
M
ana g
emen
t Pro
gram
me
PRO
BLE
M 2
: MPP
P’s
LOW
C
APA
CIT
Y

Local Action Plan in MP Pulau Pinang
4-50
ATT
AC
HM
ENT
4 PR
OB
LEM
TR
EE O
F LA
CK
OF
INFR
AST
RU
CTU
RE
& N
ETW
OR
KIN
G
<
EFFE
CTS
>
<
CA
USE
S>
Low
volu
me/
Rec
ycla
bles
Not
Cap
ture
d
Hig
h G
ener
atio
n of
Was
te P
er c
apita
Mis
mat
ch b
etw
een
Supp
ly &
Dem
and
Not
So
Cle
an
Pena
ng
PRO
BLE
M 3
: LA
CK
OF
INFR
AST
RU
CTU
RE
&
NET
WO
RK
ING
Rig
idity
of M
HLG
Pol
icie
s &
Sui
tabl
e G
over
nmen
t Lan
d fo
r
Col
lect
ion
Cen
tres
But
Obj
ectio
n fro
m
Res
iden
ts in
the
Are
a
Lack
of G
over
nmen
t Lan
d fo
r
Per
man
ent C
olle
ctio
n C
entre
No
Pro
per R
egis
tratio
n / L
icen
sing
of
Rec
yclin
g A
gent
s / C
olle
ctor
s
Pric
e Fl
uctu
atio
ns o
f Rec
ycla
bles
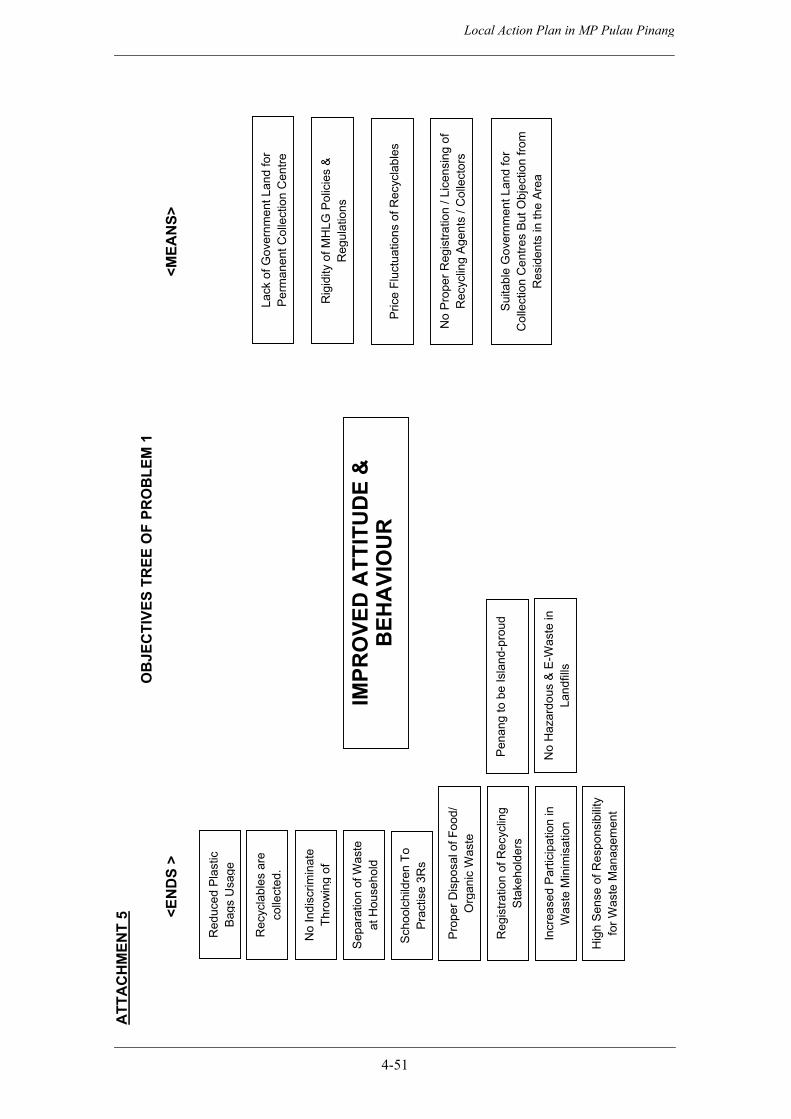
Local Action Plan in MP Pulau Pinang
4-51
ATT
AC
HM
ENT
5 O
BJE
CTI
VES
TREE
OF
PRO
BLE
M 1
<
END
S >
<M
EAN
S>
Red
uced
Pla
stic
B
a gs
Usa
ge
Sep
arat
ion
of W
aste
at H
ouse
hold
Rec
ycla
bles
are
co
llect
ed.
No
Indi
scrim
inat
e Th
row
ing
of
IMPR
OVE
D A
TTIT
UD
E &
B
EHA
VIO
UR
Rig
idity
of M
HLG
Pol
icie
s &
R
e gul
atio
ns
Sui
tabl
e G
over
nmen
t Lan
d fo
r C
olle
ctio
n C
entre
s B
ut O
bjec
tion
from
R
esid
ents
in th
e A
rea
Lack
of G
over
nmen
t Lan
d fo
r P
erm
anen
t Col
lect
ion
Cen
tre
No
Pro
per R
egis
tratio
n / L
icen
sing
of
Rec
yclin
g A
gent
s / C
olle
ctor
s
Pric
e Fl
uctu
atio
ns o
f Rec
ycla
bles
Sc
hool
child
ren
To
Pra
ctis
e 3R
s
Reg
istra
tion
of R
ecyc
ling
Sta
keho
lder
s
Pro
per D
ispo
sal o
f Foo
d/
Or g
anic
Was
te
Incr
ease
d Pa
rtici
patio
n in
W
aste
Min
imis
atio
n N
o H
azar
dous
& E
-Was
te in
La
ndfil
ls
Pena
ng to
be
Isla
nd-p
roud
Hig
h Se
nse
of R
espo
nsib
ility
for W
aste
Man
a gem
ent

Local Action Plan in MP Pulau Pinang
4-52
ATT
AC
HM
ENT
6 O
BJE
CTI
VES
TREE
OF
PRO
BLE
M 2
<EN
DS
>
<M
EAN
S>
Ded
icat
ed O
ffice
rs
Know
ledg
eabl
e Te
am fo
r Tr
aini
ng &
Con
duct
ing
Pro
gram
mes
Enou
gh H
R fo
r the
Uni
t
Effi
cien
t & S
usta
inab
le
Min
imis
atio
n P
rogr
amm
es
Envi
ronm
enta
lly C
onsc
ious
C
itize
ns
Cle
aner
& B
ette
r E
nviro
nmen
t for
“Ana
k C
ucu
Kita
”
Mod
el L
A in
Mal
aysi
a
Shin
ning
& P
olis
hed
“Pea
rl”
Adeq
uate
Tra
inin
g fo
r Tra
iner
s
Incr
ease
Fin
anci
al A
lloca
tion
Goo
d Li
nkag
e w
ith N
GO
’s &
CB
O’s
to
Car
r y O
ut P
rogr
amm
es
Enou
gh A
udio
Vis
ual A
id U
nits
&
Logi
stic
s
Incr
ease
Fed
eral
Gra
nts
Eno
ugh
RM
for t
he U
nit
Fullt
ime
Uni
t
MPP
P H
AS
AD
EQU
ATE
C
APA
CIT
Y

Local Action Plan in MP Pulau Pinang
4-53
ATT
AC
HM
ENT
7 O
BJE
CTI
VES
TREE
OF
PRO
BLE
M 3
<E
ND
S >
<M
EAN
S>
IMPR
OVE
D
INFR
AST
RU
CTU
RE
&
NET
WO
RK
ING
Incr
ease
d V
olum
e of
Rec
ycla
bles
(C
olle
cted
)
Expa
nsio
n of
Rec
yclin
g to
Cov
er
Haz
ardo
us W
aste
/ E
-Was
te
Wel
l Inf
orm
ed &
Con
nect
ed
Rec
yclin
g N
etw
ork
Effi
cien
t & V
iabl
e R
ecyc
labl
es
Mar
ket
Tow
ards
“Zer
o W
aste
” to
Land
fill
Stro
nger
(Mor
e V
iabl
e) R
ecyc
ling
Indu
strie
s
No
or M
inim
al T
herm
al tr
eatm
ent i
n Pe
nan g
Intro
duce
Dro
p-O
ff / R
epai
r Cen
tre
for E
lect
rical
Goo
ds, F
urni
ture
etc
.
Reg
istra
tion
of R
ecyc
ling
Stak
ehol
ders
Ince
ntiv
es fo
r Rec
yclin
g &
to
Com
mun
it y
Free
Net
wor
k B
ook
for E
very
H
ouse
hold
MP
PP
for P
ublic
ity (W
aste
Bul
letin
)
Stop
Spo
on F
eedi
ng (B
uck
Up)
Set
Up
Info
rmat
ion
or R
esou
rce
Cen
tres
Sign
boar
d at
Pub
lic A
rea
Incr
ease
Fre
quen
cy o
f Rec
ycle
C
olle
ctio
nPr
ovid
e M
obile
Col
lect
ion
Cen
tres
Net
wor
k / L
inka
ge W
ith In
dust
ryV
ario
us F
orm
s of
Sub
sidi
es o
n N
on-P
rofit
able
Item
s (e
.g. G
lass
, Cer
tain
P
last
ics)
(Fed
Gov
t)
Set
Up
Dat
abas
e to
Reg
iste
r / M
onito
r


“KURANGKAN SISA PEPEJAL,TINGKATKAN KUALITI HIDUP”
(Reduce Solid Waste, Enhance Quality of Life)
WASTE MINIMISATION
MPPP LOCAL ACTION PLAN(2006- 2010)

• Continual Enhancement of Public Awareness• Networking & Partnership Among All Waste
Minimisation Players
“KURANGKAN SISA PEPEJAL, TINGKATKAN KUALITI HIDUP”(Reduce Solid Waste, Enhance Quality of Life)
Introduction:Introduction:The “Action Plan for Waste Minimisation in PenangIsland Municipal Council or Majlis Perbandaran Pulau Pinang (MPPP) is a tool for guiding MPPP and its 3Rs Partners (private sector, NGOs/CBOs, and educational institutions) for planning, implementing and improving its Waste Minimisation plans.
This leaflet contains information about the Targets for Waste Management for the period 2006 until 2010. These targets can only be achieved if the people of Penang are aware of their responsibilities and cooperate with MPPP in the implementation of programmes and activities to achieve the targets set for Penang Island.
Our Slogan is:
Approach:Approach:
REDUCE STOP Waste Before It HappensREUSE Use Things More Than OnceRECYCLE Separate Waste Materials So
That They Can Be made into Other Products
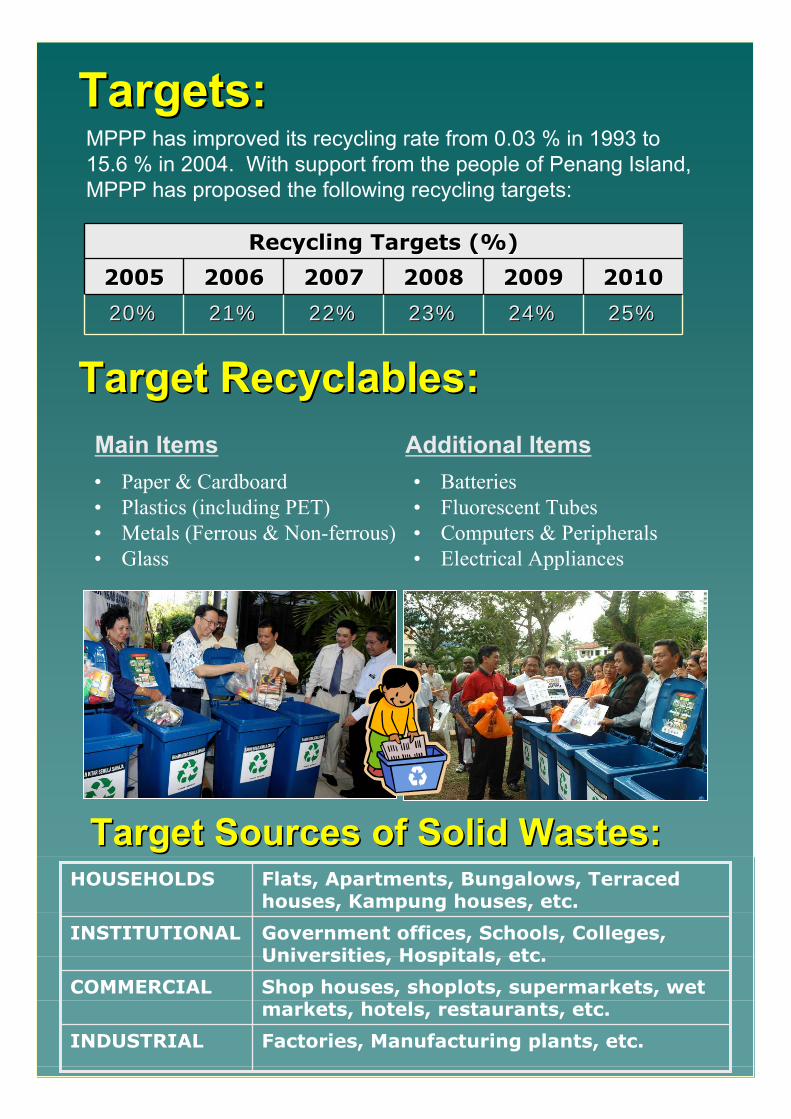
Targets:Targets:MPPP has improved its recycling rate from 0.03 % in 1993 to 15.6 % in 2004. With support from the people of Penang Island, MPPP has proposed the following recycling targets:
25%25%24%24%23%23%22%22%21%21%20%20%
Recycling Targets (%)Recycling Targets (%)
20052005 20072007 20102010200920092008200820062006
Target Recyclables:Target Recyclables:
• Paper & Cardboard• Plastics (including PET)• Metals (Ferrous & Non-ferrous)• Glass
• Batteries• Fluorescent Tubes• Computers & Peripherals• Electrical Appliances
Main Items Additional Items
Target Sources of Solid Wastes:Target Sources of Solid Wastes:
Factories, Manufacturing plants, etc.INDUSTRIAL
Shop houses, shoplots, supermarkets, wet markets, hotels, restaurants, etc.
COMMERCIAL
Government offices, Schools, Colleges, Universities, Hospitals, etc.
INSTITUTIONAL
Flats, Apartments, Bungalows, Terraced houses, Kampung houses, etc.
HOUSEHOLDS

MPPP Roles:MPPP Roles:• Provide Infrastructure e.g. recyclables collection centre & bins• Coordinate action among partners• Provide Information & Guidance• Enforce laws & guidelines• Monitor waste minimisation performance• Liaise & coordinate with Ministry of Housing & Local
Government in planning and implementing waste minimisation programmes
• Buy wisely and reduce waste• Reduce energy and water consumption• Separate Waste at Source• Reuse• Recycle • Compost kitchen & Garden Waste• Separate household hazardous waste for safe disposal• Participate in Community Waste Minimisation Programmes
Private SectorPrivate Sector’’s Roles:s Roles:• Reduce unnecessary packaging• Design and manufacture eco-friendly products• Substitute/reduce use of toxic/hazardous materials in
manufacturing• Increase recyclable content in products• Provide facilities for take-back/buy-back of recyclables• Participate in Community Waste Minimisation Programmes
For Enquiries Contact:Waste Minimisation Unit (WMU)Urban Services DepartmentPenang Island Municipal CouncilJalan Padang Kota Lama10200 Pulau PinangTel: 04-263 3000 Fax: 04-263 3036Email: [email protected]
Website: www.rnumppp.net
Contact Persons:Haji Zulkifli bin ZakariaSyed Alwi Syed Omar
KITAR SEMULAFIKIR DULU SEBELUM BUANG
Public/CommunityPublic/Community’’s Roles:s Roles:
Top Related