


Languages
Pages
Legal


THE STATE OF FOOD INSECURITY IN WINDHOEK, NAMIBIA
Wade Pendleton, Ndeyapo Nickanor and Akiser Pomuti
Pendleton, W., Nickanor, N., & Pomuti, A. (2012). The State of Food Insecurity in Windhoek, Namibia. AFSUN Food Security Series, (14).

THE STATE OF FOOD INSECURITY
IN WINDHOEK, NAMIBIA
AFRICAN FOOD SECURITY URBAN NETWORK (AFSUN) AFRICAN FOOD SECURITY URBAN NETWORK (AFSUN)
URBAN FOOD SECURITY SERIES NO. 14

THE STATE OF FOOD INSECURITY IN WINDHOEK, NAMIBIA
WADE PENDLETON, NDEYAPO NICKANOR AND AKISER POMUTI
SERIES EDITOR: PROF. JONATHAN CRUSH
URBAN FOOD SECURITY SERIES NO. 14
AFRICAN FOOD SECURITY URBAN NETWORK (AFSUN)
Cover Photograph: Aaron Price, http://namibiaafricawwf.blogspot.com
Published by African Food Security Urban Network (AFSUN)
© AFSUN 2012
ISBN 978-1-920597-01-6
First published 2012
Production by Bronwen Müller, Cape Town
All rights reserved. No part of this publication may be reproduced or trans-mitted, in any form or by any means, without prior permission from the publisher.
ACKNOWLEDGEMENT
The financial support of the Canadian International Development Agency for AFSUN and this publication is acknowledged.

Authors
Wade Pendleton is a Research Associate of the African Food Security Urban Network.
Ndeyapo Nickanor is a Lecturer at the University of Namibia.
Akiser Pomuti is Director of the University Central Consultancy Bureau at the University of Namibia.

Previous Publications in the AFSUN Series
No 1 The Invisible Crisis: Urban Food Security in Southern Africa
No 2 The State of Urban Food Insecurity in Southern Africa
No 3 Pathways to Insecurity: Food Supply and Access in Southern African Cities
No 4 Urban Food Production and Household Food Security in Southern African Cities
No 5 The HIV and Urban Food Security Nexus
No 6 Urban Food Insecurity and the Advent of Food Banking in Southern Africa
No 7 Rapid Urbanization and the Nutrition Transition in Southern Africa
No 8 Climate Change and Food Security in Southern African Cities
No 9 Migration, Development and Urban Food Security
No 10 Gender and Urban Food Insecurity
No 11 The State of Urban Food Insecurity in Cape Town
No 12 The State of Food Insecurity in Johannesburg
No 13 The State of Food Insecurity in Harare, Zimbabwe
© African Food Security Urban Network, 2012

1. Introduction 1
2. Methodology 3
3. Moving to Windhoek 5
4. Windhoek’s Poor 10 4.1 Measures of Poverty 10 4.2 Poverty and Sources of Income 13 4.3 Poverty and Household Structure 14
5. Levels of Food Insecurity 156. Determinants of Household Food Insecurity 19 6.1 Household Structure and Food Insecurity 20 6.2 Household Income, Employment and Food Insecurity 21
7. Sources of Food 23
8. Informal Food Transfers 26
9. Conclusion 27
Endnotes 29
T!"#$%Table 1: Population of Windhoek, 2011 4
Table 2: Household Sample 4
Table 3: Place of Birth of Windhoek Residents, 2001 6
Table 4: Residence of Migrants in Windhoek by Area of Origin, 2001 9
Table 5: LPI Categories 12
Table 6: Sources of Household Income 13
Table 7: Windhoek HFIAS Scores Compared to Other Cities 16
Table 8: Windhoek HFIAP Scores Compared to Other Cities 17
Table 9: Household Dietary Diversity Score 17
Table 10: Expenditure Shares by Quintiles 18
Table 11: Proportion of Income Spent on Food 19
Table 12: Food Security Status by Household Type 20
CONTENTS

Table 13: Food Security by Household Income and Housing Type 21
Table 14: Food Security by Work Status and Housing Type 22
Table 15: Food Security by Education and Income Level 23
Table 16: Informal Food Transfers 27
F&'()$%Figure 1: Population Growth of Windhoek 2
Figure 2: Location of Study Areas 3
Figure 3: Migration Streams to Windhoek 8
Figure 4: Distribution of NHIES Expenditure and the Poverty 11 Lines, 2003–2004
Figure 5: Mean LPI Scores for Southern African Cities 12
Figure 6: Household Structure in Windhoek and Region 14
Figure 7: Food Sources by Level of Household Food Security 24
Figure 8: Food Sources by Housing Area 24

urban food security series no. 14 1
1. INTRODUCTION
Namibia is urbanizing at a rapid rate. The 2011 Census indicates that over 800,000 people (or 42% of the national population) now live in urban areas (up from 33% in 2001).1 The capital city of Windhoek is the major focus of urbanization, although all of the country’s urban cen-tres are increasing in size. Windhoek’s urban and peri-urban population increased from 235,500 in 2001 to 318,700 in 2011 (an annual growth rate of 5%). The city has 16.2% of the national population (up from 13.7% in 2001) and 36% of the total urban population. The next four towns in the urban hierarchy are considerably smaller in size: Oshakati (46,900), Swakopmund (44,700), Walvis Bay (35,500) and Rundu (20,700). In fact, Windhoek is about the same size as the cumulative population of the next 10 largest urban centres in the country and continues to increase in primacy. The population of Windhoek will reach half a million people by 2020 if the current growth rate is maintained.2
Large-scale rural-urban migration, especially from northern Namibia, is driving contemporary urbanization.3 Prior to the 1990s, there were considerable obstacles to internal migration. During the decades of South African rule before 1990, stringent controls were placed on the urbaniza-tion of the black population. In 1968, the total population of Windhoek was only 57,000 and whites out-numbered blacks. Apartheid controls were eased in the 1980s and rural-urban migration began to increase (Figure 1). In 1981, Windhoek had a population of 96,000 which had increased to 147,000 by the time of independence.4 A 1991 survey estimated the popu-lation of the poorer north and north-west areas of Windhoek to be about 91,000.5 By 1996, the number had grown to about 110,000. In 2011, the population in these areas had reached nearly 250,000.6
Windhoek is the dominant economic and political centre of Namibia, accounting for more than 50% of the country’s manufacturing activity, over 80% of its finance and business services, and two-thirds of its com-munity and social services. The city has a distinctive dual spatial structure which reflects its colonial and apartheid history.8 There is a modern and thriving central business district (CBD) with light industrial areas to the north and south. In the centre of the CBD are government offices, courts, banks, the main post office, business centres, hotels, and new modern shopping malls and supermarkets; a blend of high and low-rise modern buildings. To the east, south and west of the CBD are various suburbs housing people from primarily middle and upper socio-economic house-holds. But there is another side to this bustling city. In the northern and
2 African Food Security Urban Network (Afsun)
THE STATE OF FOOD INSECURITY IN WINDHOEK, NAMIBIA
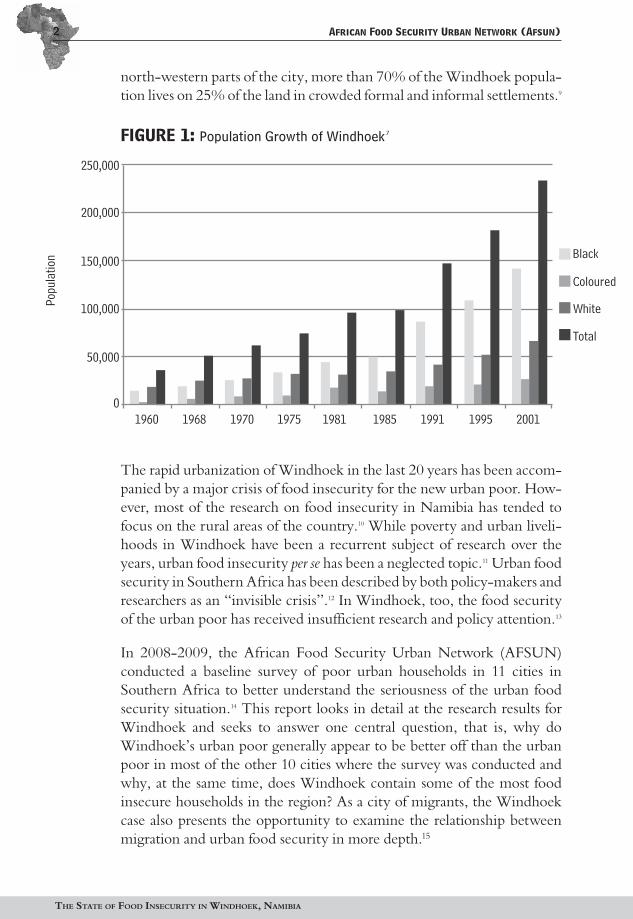
north-western parts of the city, more than 70% of the Windhoek popula-tion lives on 25% of the land in crowded formal and informal settlements.9
FIGURE 1: Population Growth of Windhoek 7
The rapid urbanization of Windhoek in the last 20 years has been accom-panied by a major crisis of food insecurity for the new urban poor. How-ever, most of the research on food insecurity in Namibia has tended to focus on the rural areas of the country.10 While poverty and urban liveli-hoods in Windhoek have been a recurrent subject of research over the years, urban food insecurity per se has been a neglected topic.11 Urban food security in Southern Africa has been described by both policy-makers and researchers as an “invisible crisis”.12 In Windhoek, too, the food security of the urban poor has received insufficient research and policy attention.13
In 2008-2009, the African Food Security Urban Network (AFSUN) conducted a baseline survey of poor urban households in 11 cities in Southern Africa to better understand the seriousness of the urban food security situation.14 This report looks in detail at the research results for Windhoek and seeks to answer one central question, that is, why do Windhoek’s urban poor generally appear to be better off than the urban poor in most of the other 10 cities where the survey was conducted and why, at the same time, does Windhoek contain some of the most food insecure households in the region? As a city of migrants, the Windhoek case also presents the opportunity to examine the relationship between migration and urban food security in more depth.15
0
50,000
100,000
150,000
200,000
250,000
Black
Coloured
White
Total
1960 1968 1970 1975 1981 1985 1991 1995 2001
Popu
latio
n

urban food security series no. 14 3
2. METHODOLOGY
The AFSUN Urban Food Security Survey was conducted in Windhoek in late 2008. The fieldwork was implemented by the Central Consul-tancy Bureau (UCCB) of the University of Namibia. Households in four of the poorer areas of the city were surveyed: Tobias Hainyeko (with a total population of 45,800), Moses //Garoëb (45,500), Samora Machel (49,700) and Khomasdal North (43,400) (Table 1, Figure 1). Within these four constituencies, 14 enumeration areas (PSUs) were selected and 32 households identified using a systematic random sampling technique. The selected households were located on maps, which were used by the fieldworkers to locate their target households. A total of 448 household heads or their representatives were interviewed and information on 1,848 people was collected (Table 2).
FIGURE 2: Location of Study Areas
Scale 1/100 000Source: Windhoek Municipality
Black
Coloured
White
Total
University of Namibia
MOSES / GAROËB
WINDHOEK EASTWINDHOEK WEST
KHOMASDAL NORTH
TOBIAS HAINYEKOHavana
Hakaha
Goreangab
Rocky Crest
Dorado Park
Windhoek
Hochlands Park
Pionierspark
Academia
Olympia
Klein Windhoek
Aquasblick
Eros Park
Cimbebasia
KleineklippeProsperita
Khomasdal
Scale 1/100 000
Source: Windhoek Municipality
Otjomuise
Okuryangava
Lafrenz
Wanaheda
Katutura
SAMORA MACHELCENTRAL KATUTURA

4 African Food Security Urban Network (Afsun)
THE STATE OF FOOD INSECURITY IN WINDHOEK, NAMIBIA
TABLE 1: Population of Windhoek, 2011Area Females Males TotalWindhoek East 11,300 11,300 22,600Windhoek West 27,600 25,800 53,400Tobias Hainyeko 21,100 24,700 45,800Katutura Central 13,500 11,100 24,600Katutura East 10,100 8,500 18,600Soweto 8,200 6,900 15,100Samora Machel 25,300 24,400 49,700Moses //Garoëb 20,700 24,800 45,500Komasdal North 23,200 20,200 43,400Windhoek Rural 10,100 12,100 22,200Total 171,100 169,800 340,900Source: Namibia 2011: Population and Housing Census Preliminary Results
TABLE 2: Household Sample
Constituency PSUNo.
Households Surveyed
Type of Housing of RespondentsFormal % Informal %
Tobias Hainyeko 6011501072 32 0 100Tobias Hainyeko 6011501073 32 3 97Katutura Central 6021001001 32 97 3Katutura Central 6021001007 32 91 9Katutura Central 6031001011 32 100 0Khomasdal North 6041101025 32 100 0Khomasdal North 6041101026 32 100 0Moses //Garoëb 61001123 32 56 44Samora Machel 6060601008 32 25 75Khomasdal North 6041701039 32 100 0Samora Machel 6060601025 32 6 94Moses //Garoëb 6100801156 32 0 100Moses //Garoëb 6100801163 32 0 100Moses //Garoëb 6100801172 32 0 100
N=448 N=214 N=228
Rather than comparing different constituencies within the city, this paper contrasts households resident in formal and informal shelter. “For-mal shelter” refers here to more substantial houses built primarily from concrete bricks with metal roofs. “Informal shelter” refers to self-built housing usually consisting of a wood frame, metal sheeting for walls and

urban food security series no. 14 5
a metal roof (sometimes called “shanties” or “shacks”). Many of the areas surveyed are exclusively or predominately one type, e.g. the PSU in Hakahana is 100% informal and the PSUs in Khomasdal North are 100% formal (Table 2). A few of the areas have both formal and informal housing. A basic question addressed here is whether households living in informal areas (generally where recent migrants to the city reside) are more or less food insecure than those in more established formal housing areas, and by how much?
3. MOVING TO WINDHOEK
Micro-survey and case study data collected over the years by the 1996 Katutura Survey, the 1998 Namibian Migration Project and the 2006 SAMP Migration and Poverty Survey show national patterns of migra-tion from migrant history data.16 In 2001, about 60% of the population of Windhoek were migrants (i.e. they were not born in the city).17 Several major streams of migration to Windhoek can be identified (Figure 3). The main stream is internal migration (primarily rural-urban migration from northern Namibia). This stream made up 33% of the total population of Windhoek in 2001 and 54% of the total migrant population (Table 3). The migrants came from three main areas: Owamboland (88%), Kavango (7%) and the Caprivi (5%). Other significant internal migration streams are from central Namibia (18% of migrants) and southern Namibia (14% of migrants) (primarily urban-urban migration). International migrants accounted for about 14% of Windhoek’s migrant population and 8% of its total population. The male and female population of Windhoek was very similar (50.5% male, 49.5% female). By 2011, there were margin-ally more females than males in the city as a whole (Table 1). Of the 152,000 migrant residents of the city in 2001, 53% were male and 47% female. There are more obvious gender differences in the migrant streams from different parts of the country. Fifty eight percent of migrants from northern Namibia were male and 42% female, reflecting the historical pattern of male labour migration from northern Namibia (although the percentage of males was much greater in the past). All of the other source regions send more female than male migrants to Windhoek. For example, 57% of migrants from the south were female and only 43% were male.18

6 African Food Security Urban Network (Afsun)
THE STATE OF FOOD INSECURITY IN WINDHOEK, NAMIBIA
TABLE 3: Place of Birth of Windhoek Residents, 2001
RegionTotal Female Male
No. % No. % No. %Windhoek 98,048 39 51,327 52 46,720 48Northern Namibia 81,381 33 34,402 42 46,979 58Central Namibia 26,882 11 14,530 54 12,352 46Southern Namibia 20,643 8 11,785 57 8,858 43Outside Namibia 20,930 8 10,499 50 10,431 50Not Stated 2,378 1 1,070 45 1,308 55Total 250,262 100 123,613 126,648Source: Namibia, Central Bureau of Statistics 2005
Why are people migrating to Windhoek in such numbers? It is not dif-ficult to understand why those with skills or professional qualifications might migrate for employment, live in fully serviced housing in neigh-bourhoods with a high quality of living, and enjoy the many amenities that Windhoek offers to people who can afford to pay for them. Hous-ing in Windhoek’s more affluent areas is luxurious to the point of being ostentatious. However, large numbers of people are also migrating to the areas where unemployment rates are the highest, poverty is widespread and the quality of life is the worst. The answer is best framed by looking both at the big picture and what the migrants themselves say.19
The macro factors of poverty, environment and political history define the context within which people make decisions about migration. Namibia’s political history of colonial occupation and economic exploita-tion by both Germany and South Africa established radical inequalities in regional development. The white commercial farming areas in the centre and south of the country were developed and supported by cheap government-sponsored loans and access to markets and towns.20 The rural communal areas remained undeveloped sources of cheap migrant labour.21 These regional inequalities persist to the present despite efforts at rural development since independence. The rural communal areas lack income-producing activities, and cropping and livestock production methods are basic and small-scale.
The Namibian population has an estimated doubling time of about 20 years and is unevenly distributed as a result of regional inequalities in both environmental conditions and political history. Due to poor rainfall and low carrying capacity, the rural central land is widely recognized as marginal. The location of the rural central communal areas on the west, east and south of the commercial farming area reflects a history of land

urban food security series no. 14 7
disenfranchisement; white settler farmers (primarily Afrikaners and Germans) were given or allowed to purchase land traditionally occupied by the Herero, Damara, Nama, and Bushmen. The Namibian constitu-tion does not allow for ancestral land claims although such claims are a frequent agenda item at land conferences due to population pressure on existing communal land areas. Drought is endemic to Namibia and one of the environmental factors that impacts on migration. The migration of household members to urban areas and the sending of children to other relatives in rural and urban areas are common coping responses to drought at the household level.22
The rural-urban migration experience is reflected in various terms and concepts found in Namibian languages and cultures. Among the Owam-bo, someone who has moved from a rural area and stays in town and does not visit the rural area, is referred to as Ombwiti. People who do not visit have broken their ties and are Ombwiti; they have lost their roots. People who are born in town and stay there are called Ondakwatwa. Someone who goes to town for the first time is called Kashuku. There is a saying (in Oshiwambo) that reflects the importance of maintaining rural ties when you move to town: owu na okukala wu na omutala kegumbo (translated as you should have a “room for sleeping” at home in rural areas).23
Coming to Windhoek or other towns in central Namibia to look for work is called Uushimba (in Oshiwambo). However, the term does not apply to Ondangwa, Oshakati, Rundu or Katima Mulilo, the towns in the north of the country. These places are not seen as “foreign” towns; they are considered local towns and are different sorts of places. This may be to a large extent because the ethnic and socio-cultural make-up of such places is both relatively familiar and homogeneous. Similar terms about the urban migration experience exist for people in the Kavango and Caprivi. However, the Herero, Damara, and Nama do not have terms like Ombwiti, which reflects their long experience with town life in Windhoek and central/southern Namibia.
The major reasons migrants give for coming to Windhoek include jobs and money, rural poverty, family issues (such as a change of residence due to marriage or a death in the family or simply to move in with rela-tives) and education.24 Many migrants list multiple reasons for migration, reflecting the complex nature of their decision to migrate. Men and women migrate for the same reasons, but their relative importance is dif-ferent; economics is more important to men and family/living conditions are more important to women. Of the adult female migrants in the north-ern and north-west areas of Windhoek, almost half have come in recent years, indicating a substantial increase in urban migration by women for

8 African Food Security Urban Network (Afsun)
THE STATE OF FOOD INSECURITY IN WINDHOEK, NAMIBIA
economic reasons. To some extent, the increased migration of women, especially women migrating alone from rural areas, reflects their desire for an alternative lifestyle free of the male domination typical of rural life.25
FIGURE 3: Migration Streams to Windhoek
Source: Namibia, Central Bureau of Statistics 2005
Where do the people from the various migration streams settle in Wind-hoek? The northern (Moses //Garoëb and Tobias Hainyeko) and north-western (Samora Machel) areas of Windhoek are important destinations

urban food security series no. 14 9
for Owambo, Herero, Damara, and Nama migrants. The majority of people from the northern regions settle in the north-western areas of the city (68%) with over 90% of these from the former Owamboland (Table 4). People from the central regions divide among the northern areas (31%), the north-west areas (23%) and Windhoek West (20%). People from the southern regions head for Windhoek West (31%), Khomasdal North (21%) as well as the northern (17%) and north-west (15%) areas. The established communities of people from each region has a cumulative effect as new migrants often stay with kin or friends prior to establish-ing their own independent households. This helps to explain why there are fewer people from the Caprivi and the Kavango in Windhoek even though the Kavango is about the same distance from Windhoek as the former Owamboland. However, this could soon change with more tarred roads, more combi-taxis regularly traveling to Windhoek from these areas and people from these areas establishing communities in Windhoek. TABLE 4: Residence of Migrants in Windhoek by Area of Origin, 2001
Area of Windhoek
Khomas Region
Northern Regions
Central Regions
Southern Regions
Other Countries Total
No. % No. % No. % No. % No. % No. %Northern* 30,021 31 8,871 11 8,398 31 3,559 17 1,579 7 52,428 21
North West** 22,844 23 54,953 68 6,228 23 3,065 15 1,565 7 88,655 36
Khomasdal North 12,995 13 4,978 6 3,451 13 4,248 21 2,037 10 27,709 11
Windhoek West 14,835 15 6,867 8 5,308 20 6,393 31 8,203 39 41,606 17
Windhoek East 11,377 12 3,084 4 1,618 6 1,987 9 1,928 9 19,994 8
Windhoek Rural 5,976 6 2,628 3 1,879 7 1,391 7 5,618 28 17,492 7
Total 98,048 100 81,381 100 26,882 100 20,643 100 20,930 100 247,884 100
Source: Namibia, Central Bureau of Statistics 2005* Moses //Garoëb and Tobias Hainyeko** Samora Machel
The importance of migration to Windhoek is confirmed in the migration history of respondents in the AFSUN survey discussed in the following sections. Only 30% of the total survey population were born in Wind-hoek. Almost half were rural to urban migrants, primarily from Owambo. About 10% had moved to Windhoek from other urban areas. Fifty-seven percent of people living in informal housing were rural to urban migrants, compared to 38% of those in formal housing.
There is considerable evidence that urbanization in Africa does not involve a one-time move from rural to urban areas.26 Many urban households maintain strong links with rural households in “home” communities.27 Studies of remittance behaviour in Southern Africa, including Namibia,

10 African Food Security Urban Network (Afsun)
THE STATE OF FOOD INSECURITY IN WINDHOEK, NAMIBIA
show that urban households often send money to rural households, and periodically send goods (including foodstuffs) remittances to the rural households they maintain links with.28 Several studies have shown exten-sive links between urban and rural households in Windhoek and the north of the country.29 In 2000, one study interviewed 305 households in Katutura and found that 85% of respondents were migrants to Windhoek. Only 2% had no rural relatives. Just over 40% visited their rural “home” several times a year and another 40% once a year. Less than 10% never visited. Only 37% of migrants had sent money home in the previous year, a figure that had not increased in a decade.
4. WINDHOEK’S POOR
4.1 Measures of Poverty
Namibia has a relatively high GDP per capita (estimated at US$5,200 in 2007) for a developing country, but wealth is very unequally distributed.30 The poorest households (in terms of income) are in the rural communal areas with female-headed households the poorest. One common measure of poverty/inequality is the Gini coefficient, which is related to household consumption: the closer to ‘0’ the greater the equality and the closer to ‘1’ the greater the inequality. The overall value for Namibia was 0.63 in 2003-4 making it “one of the most unequal and polarised” societies in the world and certainly the most unequal society in Southern Africa.31 About 40% of households (about half the Namibian population) account for 8% of total household expenditures, while about 10% of the wealthi-est households (about 6% of the Namibian population) account for about 50% of total household expenditure.32
Most quantitative measures of poverty are income rather than consump-tion based. The 2003-4 Namibian Household Income and Expenditure Survey used a different Cost of Basic Needs (CBN) approach to measur-ing household poverty. The CBN calculated three income poverty lines. The first was the food poverty line, which was based on the cost of a food basket enabling households to meet a minimum nutritional requirement (of 2,100 Kcal); a value of N$127 per capita per month. The other two added in an allowance for the consumption of basic non-food items to define a “severely poor” poverty line of N$185 and a poor poverty line of N$262 (Figure 4). The actual numbers (which reflected incomes and expenditures in 2003-4) are not as important as the results yielded by this method. These showed that 28% of Namibian households were poor and

urban food security series no. 14 11
that half of these were very poor. The survey results also showed that 12% of urban households were poor (including 6% very poor). In the Khomas Region (in which Windhoek is located), the figures were 6% poor and 2% very poor. This would seem to imply either that poverty is almost non-existent in Windhoek or that the methodology for calculating the poverty lines might have been overly generous.33
FIGURE 4: Distribution of NHIES Expenditure and the Poverty Lines, 2003–2004
Source: National Planning Commission, “A Review of Poverty and Inequality in Namibia” p. 5
The AFSUN survey used two different measures of poverty: household income and the Lived Poverty Index. Based on household income for the previous month, 33% of households have monthly incomes of less than N$1,900 (about US$8/day). With an average household size of four, that approximates to about US$2/person/day indicating a serious poverty situ-ation well above the 12% reported for Khomas Region above. Another third of the households had a total monthly income of N$1,900 (US$8) to N$4,999 (US$20) and the final third made over N$5,000 (US$20). Even a household making N$5,000 per month (N$60,000 per annum) is hardly wealthy but the data does illustrate that even in Windhoek’s poorer areas, there is considerable income inequality.
The Lived Poverty Index (LPI) tries to capture the subjective experience of poverty.34 The LPI is based on answers to questions about how often a household has gone without certain basic household items in the previous year, including food, medical attention, cooking fuel and a cash income. Respondents answer on a five point scale: never; just once or twice; sev-eral times; many times; always. A mean LPI score is then computed for
0 50 100 150 200 250 300 350 400 450 500 550 600 650 700 750 800 850 900 1,000Per adult equivalent monthly expenditure, N$
0
10,000
20,000
30,000
40,000
No. o
f Hou
seho
lds
Lower bound poverty line, N$ 185.56
Upper bound poverty line, N$ 262.45

12 African Food Security Urban Network (Afsun)
THE STATE OF FOOD INSECURITY IN WINDHOEK, NAMIBIA
each item: a mean score closer to ‘0’ indicates fewer households ‘going without’ and a score closer to ‘4’ indicates more households ‘going with-out.’ There is a marked difference in LPI scores within the Windhoek sample between households in informal and formal areas (with 18% of informal households scoring over 2.0 compared with only 9% of formal households) (Table 5).
The mean score for all the Windhoek households is 1.1 (median 1.0), which is equivalent to cities such as Gaborone and Maputo (Figure 5). Four cities have worse (higher) lived poverty than Windhoek (Maseru, Manzini, Lusaka and Harare) and four have better (the three South Afri-can cities plus Blantyre). These results do not show particularly high levels of absolute deprivation, especially when compared to cities such as Harare. In Harare, for example, 56% of surveyed households scored above 2.0 compared to only 14% in Windhoek.
TABLE 5: LPI CategoriesLived Poverty
Index Formal Informal Total
No. % No. % No. %0.00–1.00 136 66.3 97 44.1 233 54.81.01–2.00 51 24.9 83 37.7 134 31.52.01–3.00 17 8.3 34 15.5 51 12.03.01–4.00 1 0.5 6 2.7 7 1.6Total 205 100.0 220 100.0 425 100.0
FIGURE 5: Mean LPI Scores for Southern African Cities
Win
dhoe
k
Gabo
rone
Mas
eru
Man
zini
Map
uto
Blan
tyre
Lusa
ka
Hara
re
Cape
Tow
n
Msu
nduz
i
Joha
nnes
burg
Tota
l
0.5
1.5
1.0
2.0
2.5
0.0
1.1 1.1
1.4 1.5
1.10.9
1.5
2.2
1.00.8
0.6
1.2
LPI S
core
urban food security series no. 14 13
4.2 Poverty and Sources of Income
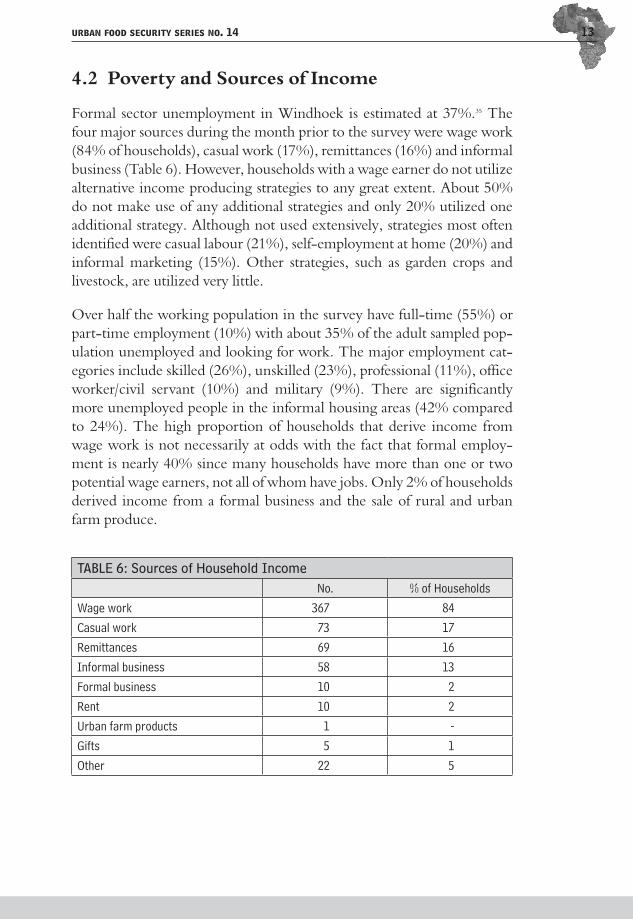
Formal sector unemployment in Windhoek is estimated at 37%.35 The four major sources during the month prior to the survey were wage work (84% of households), casual work (17%), remittances (16%) and informal business (Table 6). However, households with a wage earner do not utilize alternative income producing strategies to any great extent. About 50% do not make use of any additional strategies and only 20% utilized one additional strategy. Although not used extensively, strategies most often identified were casual labour (21%), self-employment at home (20%) and informal marketing (15%). Other strategies, such as garden crops and livestock, are utilized very little.
Over half the working population in the survey have full-time (55%) or part-time employment (10%) with about 35% of the adult sampled pop-ulation unemployed and looking for work. The major employment cat-egories include skilled (26%), unskilled (23%), professional (11%), office worker/civil servant (10%) and military (9%). There are significantly more unemployed people in the informal housing areas (42% compared to 24%). The high proportion of households that derive income from wage work is not necessarily at odds with the fact that formal employ-ment is nearly 40% since many households have more than one or two potential wage earners, not all of whom have jobs. Only 2% of households derived income from a formal business and the sale of rural and urban farm produce.
TABLE 6: Sources of Household IncomeNo. % of Households
Wage work 367 84Casual work 73 17Remittances 69 16Informal business 58 13Formal business 10 2Rent 10 2Urban farm products 1 -Gifts 5 1Other 22 5
14 African Food Security Urban Network (Afsun)
THE STATE OF FOOD INSECURITY IN WINDHOEK, NAMIBIA
4.3 Poverty and Household Structure
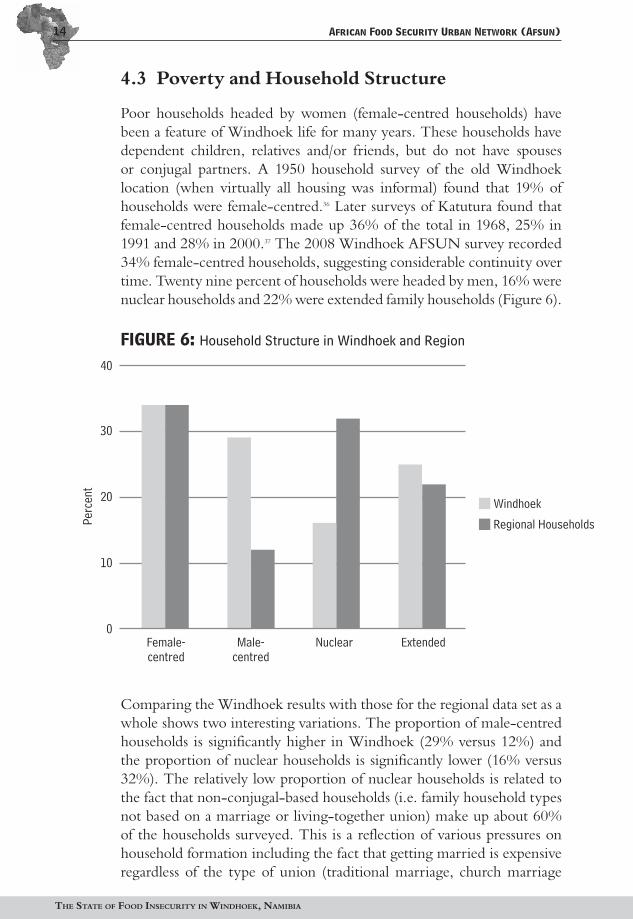
Poor households headed by women (female-centred households) have been a feature of Windhoek life for many years. These households have dependent children, relatives and/or friends, but do not have spouses or conjugal partners. A 1950 household survey of the old Windhoek location (when virtually all housing was informal) found that 19% of households were female-centred.36 Later surveys of Katutura found that female-centred households made up 36% of the total in 1968, 25% in 1991 and 28% in 2000.37 The 2008 Windhoek AFSUN survey recorded 34% female-centred households, suggesting considerable continuity over time. Twenty nine percent of households were headed by men, 16% were nuclear households and 22% were extended family households (Figure 6).
FIGURE 6: Household Structure in Windhoek and Region
Comparing the Windhoek results with those for the regional data set as a whole shows two interesting variations. The proportion of male-centred households is significantly higher in Windhoek (29% versus 12%) and the proportion of nuclear households is significantly lower (16% versus 32%). The relatively low proportion of nuclear households is related to the fact that non-conjugal-based households (i.e. family household types not based on a marriage or living-together union) make up about 60% of the households surveyed. This is a reflection of various pressures on household formation including the fact that getting married is expensive regardless of the type of union (traditional marriage, church marriage
Female- centred
Male- centred
Nuclear Extended
Windhoek
Regional HouseholdsPerc
ent
10
20
30
40
0

urban food security series no. 14 15
or a civil ceremony). The relatively high proportion of male-centred households is a reflection of the tendency for recent male migrants to live together in male-centred households in areas with people who share the same language and culture.
5. LEVELS OF FOOD INSECURITY
Household food insecurity was measured by using various international cross-cultural scales developed by the Food and Nutrition Technical Assistance Project (FANTA): Household Food Insecurity Access Scale (HFIAS): The HFIAS mea-
sures the degree of food insecurity during the month prior to the survey.38 An HFIAS score is calculated for each household based on answers to nine ‘frequency-of-occurrence’ questions. The minimum score is 0 and the maximum is 27. The higher the score, the more food insecurity the household experienced. The lower the score, the less food insecurity a household experienced.
Household Food Insecurity Access Prevalence Indicator (HFIAP): The HFIAP indicator categorizes households into four levels of household food insecurity: food secure, and mild, moderately and severely food insecure.39 Households are categorized as increasingly food insecure as they respond affirmatively to more severe conditions and/or experience those conditions more frequently.
Household Dietary Diversity Scale (HDDS): Dietary diversity refers to how many food groups are consumed within the household over a given period.40 The maximum number, based on the FAO classifica-tion of food groups for Africa, is 12. An increase in the average num-ber of different food groups consumed provides a quantifiable measure of improved household food access. In general, any increase in house-hold dietary diversity reflects an improvement in the household’s diet.
The HFIAS average score for the surveyed population is 9.3, which is slightly lower than the regional average score for all 11 cities (10.3). How-ever, only two of the cities (Johannesburg and Blantyre) have lower mean and median scores on the HFIAS. In other words, according to this scale, the urban poor in Windhoek appear to be less food insecure than those in many other cities of the region. However, when the Windhoek HFIAS scores are compared by housing area a very different picture emerges. The HFIAS score in formal housing areas drops to only 5.9, almost five points below the regional average. The score for the informal housing areas, however, is 12.4, more than double the formal area score (a statistically

16 African Food Security Urban Network (Afsun)
THE STATE OF FOOD INSECURITY IN WINDHOEK, NAMIBIA
significant difference). In addition, Windhoek’s informal area scores are worse than every other city except Harare, Manzini and Maseru. This suggests that there is widespread food insecurity in the informal areas of Windhoek (Table 7).
TABLE 7: Windhoek HFIAS Scores Compared to Other CitiesMean Median No.
Manzini, Swaziland 14.9 14.7 489Harare, Zimbabwe 14.7 16.0 454Maseru, Lesotho 12.8 13.0 795Lusaka, Zambia 11.5 11.0 386Msunduzi, South Africa 11.3 11.0 548Gaborone, Botswana 10.8 11.0 391Cape Town, South Africa 10.7 11.0 1,026Maputo, Mozambique 10.4 10.0 389Windhoek, Namibia 9.3 9.0 436 Formal Areas 5.9 5.0 213 Informal Areas 12.4 11.0 223Blantyre, Malawi 5.3 3.7 431Johannesburg, South Africa 4.7 1.5 976
The HFIAP categorizes households by different levels of food insecurity. The regional average for severely food insecure households is 57%, slightly lower than Windhoek’s 63% of households (Table 8). Once again, there are many more cities with a higher proportion of severely food insecure households (only Blantyre and Johannesburg have fewer households than Windhoek in such dire straits). However, if the Windhoek sample is broken down into formal and informal housing areas, a different picture again emerges. The proportion of severely food insecure households is 50% in the formal areas and the proportion of food secure households is 29% (compared to 18% overall). When half of the households in an area are severely food insecure, this is still a source of major concern. This challenge still pales in comparison with that in the informal areas of Windhoek where 76% of households are severely food insecure (and 89% are severely or moderately food insecure). Only 8% of households in informal areas are food secure. In other words, the informal areas of Windhoek are the most food insecure in the entire region. Food stor-age, safety and lack of services are also issues affecting informal more than formal housing.

urban food security series no. 14 17
TABLE 8: Windhoek HFIAP Scores Compared to Other CitiesFood Secure
%Mildly Food
Insecure %
Moderately Food
Insecure %
Severely Food
Insecure %Harare, Zimbabwe 2 3 24 72Lusaka, Zambia 4 3 24 69Maseru, Lesotho 5 6 25 65Maputo, Mozambique 5 9 32 54Manzini, Swaziland 6 3 13 79Msunduzi, South Africa 7 6 27 60Gaborone, Botswana 12 6 19 63Cape Town, South Africa 15 5 12 68Windhoek, Namibia 18 5 14 63 Formal Areas 29 7 14 50 Informal Areas 8 4 13 76Blantyre, Malawi 34 15 30 21Johannesburg, South Africa 44 14 15 27
The marked difference between formal and informal settlements in Wind-hoek also emerged in the Household Dietary Diversity Scale (HDDS), which measures the food quality and diversity dimensions of food secu-rity. The overall HDDS score for Windhoek is 5.95 (out of 12). In the formal areas, the score was over 7 and in the informal areas less than 5. These figures indicate that overall household diets are not very diverse but that they are significantly less diverse in informal areas. Further insights can be gained by combining the HFIAP and HDDS (Table 9).
TABLE 9: Household Dietary Diversity ScoreMean No.
Food secureFormal Housing 8.12 75Informal Housing 6.39 23Total 7.71 98
Food insecureFormal Housing 6.63 132Informal Housing 4.59 192Total 5.42 324
TotalFormal Housing 7.17 207Informal Housing 4.78 215Total 5.95 422
For ease of analysis, the four categories of the HFIAP are combined into two categories: food secure and food insecure. These categories are then cross-tabulated with type of housing. This analysis shows that
18 African Food Security Urban Network (Afsun)
THE STATE OF FOOD INSECURITY IN WINDHOEK, NAMIBIA
even amongst food secure households, the diets of households in formal areas are more diverse than those in informal areas (8.12 versus 6.39). A difference is also seen amongst food insecure households (where those in formal areas score 6.63 versus 4.59 in informal areas). The difference between food secure and insecure households is statistically significant.
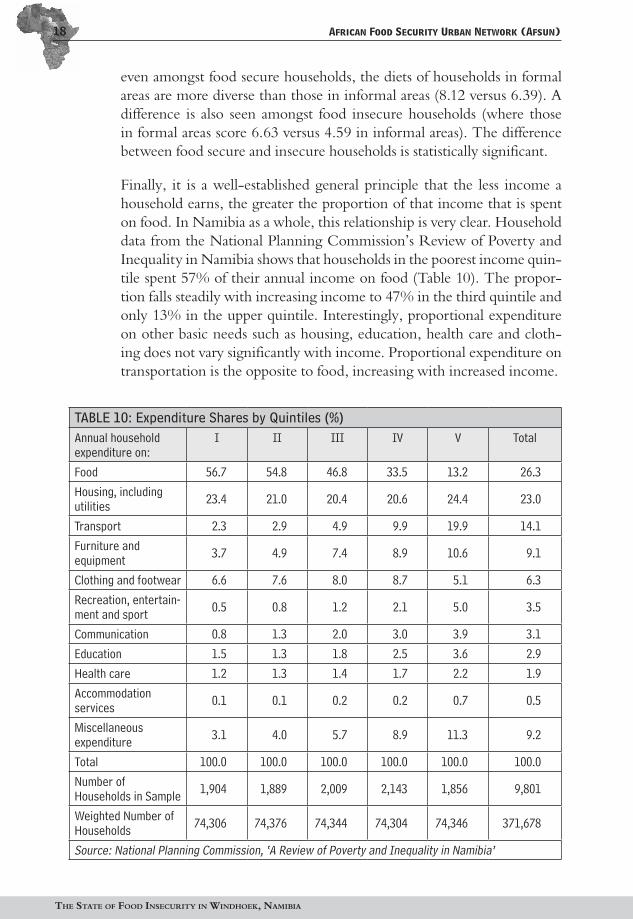
Finally, it is a well-established general principle that the less income a household earns, the greater the proportion of that income that is spent on food. In Namibia as a whole, this relationship is very clear. Household data from the National Planning Commission’s Review of Poverty and Inequality in Namibia shows that households in the poorest income quin-tile spent 57% of their annual income on food (Table 10). The propor-tion falls steadily with increasing income to 47% in the third quintile and only 13% in the upper quintile. Interestingly, proportional expenditure on other basic needs such as housing, education, health care and cloth-ing does not vary significantly with income. Proportional expenditure on transportation is the opposite to food, increasing with increased income.
TABLE 10: Expenditure Shares by Quintiles (%)Annual household expenditure on:
I II III IV V Total
Food 56.7 54.8 46.8 33.5 13.2 26.3Housing, including utilities 23.4 21.0 20.4 20.6 24.4 23.0
Transport 2.3 2.9 4.9 9.9 19.9 14.1Furniture and equipment 3.7 4.9 7.4 8.9 10.6 9.1
Clothing and footwear 6.6 7.6 8.0 8.7 5.1 6.3Recreation, entertain-ment and sport 0.5 0.8 1.2 2.1 5.0 3.5
Communication 0.8 1.3 2.0 3.0 3.9 3.1Education 1.5 1.3 1.8 2.5 3.6 2.9Health care 1.2 1.3 1.4 1.7 2.2 1.9Accommodation services 0.1 0.1 0.2 0.2 0.7 0.5
Miscellaneous expenditure 3.1 4.0 5.7 8.9 11.3 9.2
Total 100.0 100.0 100.0 100.0 100.0 100.0Number of Households in Sample 1,904 1,889 2,009 2,143 1,856 9,801
Weighted Number of Households 74,306 74,376 74,344 74,304 74,346 371,678
Source: National Planning Commission, ‘A Review of Poverty and Inequality in Namibia’

urban food security series no. 14 19
The AFSUN survey was conducted in late 2008 after a year of significant global and regional food price increases that had impacted on both the urban and rural poor in Namibia.41 Within Windhoek, the proportion of total household expenditures still varied significantly between formal (27%) and informal (44%) areas of the city (Table 11). Windhoek house-holds spent less on food than those in any other city in the region (at 36%). The most plausible explanation for this is that Windhoek house-holds are able to access food outside market channels either through urban agriculture or rural-urban food transfers. As we argue below, the second explanation makes a great deal more sense than the first.
TABLE 11: Proportion of Income Spent on FoodN % of Income Spent on Food
Harare, Zimbabwe 417 62Cape Town, South Africa 985 55Lusaka, Zambia 357 54Maputo, Mozambique 314 53Msunduzi, South Africa 456 52Johannesburg, South Africa 886 49Blantyre, Malawi 424 46Maseru, Lesotho 628 46Gaborone, Botswana 374 46Manzini, Swaziland 345 42Windhoek, Namibia 430 36 Formal Areas 204 27 Informal Areas 220 44Total 5,616 50
6. DETERMINANTS OF HOUSEHOLD FOOD INSECURITY
Clearly, whether a household is living in an informal or formal housing area has a major influence on its chances of being food insecure as well as the depth of that insecurity. However, not all households in formal areas are food secure and not all households in informal areas are food insecure. To probe in greater depth why there is such a range within the poor areas of Windhoek, this section uses the HFIAP measure of food insecurity to investigate the relationship between food security and a number of poten-tially important demographic variables. These include household type
20 African Food Security Urban Network (Afsun)
THE STATE OF FOOD INSECURITY IN WINDHOEK, NAMIBIA
and size, household income, employment, poverty and education and sources of food. Statistical tests were run on the analysis tables presented in this section of the paper. Both chi square and contingency coefficients (cc) were run to assess the extent of food insecurity for nominal/nominal and nominal/ordinal tables; a means test and eta coefficient were run for interval/nominal or ordinal tables. Valid cc and eta scores are given to assess the strength of the association.
6.1 Household Structure and Food Insecurity
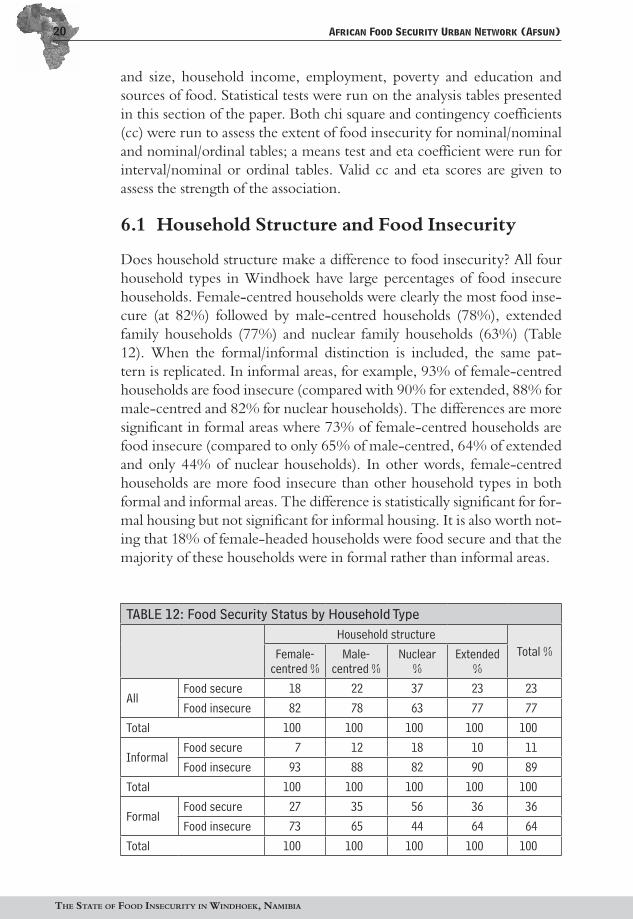
Does household structure make a difference to food insecurity? All four household types in Windhoek have large percentages of food insecure households. Female-centred households were clearly the most food inse-cure (at 82%) followed by male-centred households (78%), extended family households (77%) and nuclear family households (63%) (Table 12). When the formal/informal distinction is included, the same pat-tern is replicated. In informal areas, for example, 93% of female-centred households are food insecure (compared with 90% for extended, 88% for male-centred and 82% for nuclear households). The differences are more significant in formal areas where 73% of female-centred households are food insecure (compared to only 65% of male-centred, 64% of extended and only 44% of nuclear households). In other words, female-centred households are more food insecure than other household types in both formal and informal areas. The difference is statistically significant for for-mal housing but not significant for informal housing. It is also worth not-ing that 18% of female-headed households were food secure and that the majority of these households were in formal rather than informal areas.
TABLE 12: Food Security Status by Household TypeHousehold structure
Total %Female-centred %
Male-centred %
Nuclear %
Extended %
AllFood secure 18 22 37 23 23Food insecure 82 78 63 77 77
Total 100 100 100 100 100
InformalFood secure 7 12 18 10 11Food insecure 93 88 82 90 89
Total 100 100 100 100 100
FormalFood secure 27 35 56 36 36Food insecure 73 65 44 64 64
Total 100 100 100 100 100

urban food security series no. 14 21
6.2 Household Income, Employment and Food Insecurity
Since urban households purchase so much of their food, and food is the major expenditure item in household budgets, it is likely that the level of household income has a major impact on food security. For ease of analy-sis, household income is divided into three levels. There is very little dif-ference in levels of insecurity amongst households in the poor (<N$1,900 per month) and less poor (N$1,901 to N$4,999 per month) categories (87% and 86% food insecure respectively) (Table 13). However, only 54% of the least poor (>N$5,000) households are food insecure. In other words, there appears to be a threshold income above which more house-holds are able to achieve food security and below which the vast majority are not.
TABLE 13: Food Security by Household Income and Housing TypeTerciles of Household Income
Total %Poorest (< N1,900)
%
Less Poor (N1,900– 4,999) %
Least Poor (! N5,000)
%
AllFood secure 13 14 46 24Food insecure 87 86 54 76
Total 100 100 100 100
Informal Food secure 12 8 38 12Food insecure 88 92 62 88
Total 100 100 100 100
Formal Food secure 17 22 47 36Food insecure 83 78 53 64
Total 100 100 100 100
The general relationship between income and food security holds in both informal and formal areas of the city. But there are absolute differences between the two. For example, the proportion of food secure households in the least poor income group is 47% in the formal areas and only 38% in the informal areas. Even amongst the poorest income group there is a difference, with 17% of households in the formal areas and only 12% in the informal areas being food secure. The differences between food secure and insecure households are all statistically significant. What this means, in effect, is that households in informal areas are likely to be more food insecure than those in formal areas even when their incomes are roughly the same.

22 African Food Security Urban Network (Afsun)
THE STATE OF FOOD INSECURITY IN WINDHOEK, NAMIBIA
Having full-time employment is closely related to household income and to food security. Food secure households have 18% more full-time employment; food insecure households have more part-time employment (about 5% more) and more unemployed people (12% more) (Table 14). People living in formal housing have more full-time employment (23% more) and those in informal housing have more part-time employment (8%) and unemployment (15%) (Table 14).
TABLE 14: Food Security by Work Status and Housing TypeWork Status
Working full-time %
Working part-time/casual %
Unemployed %
Food secure 68 6 26Food insecure 50 11 38Formal 66 6 28Informal 43 14 43
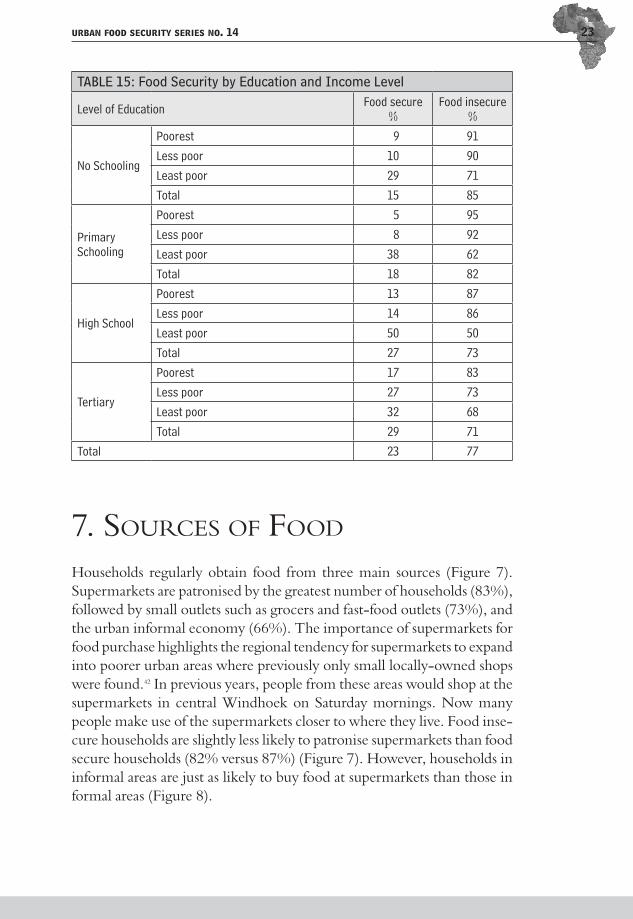
The education level of household members is also related to household income and food security. The proportion of food secure households increases with the level of educational attainment of the household mem-bers (from 15% of those with members with no schooling, to 18% of those with primary education, 27% with high school and 29% with ter-tiary education) (Table 15).
In general, the same pattern can be observed when income is factored into the calculation although there are some unexpected anomalies. For example, poor and less poor households tend to be more food secure if no-one has any schooling as opposed to a primary education. This may reflect the fact that the uneducated could be more likely to accept the most menial employment shunned by those with some education. Or again, in the least poor category, households with a member with second-ary education tend to be more food secure than those with a member with tertiary education (50% versus 32%). This could be because it is more difficult for those with a university degree or diploma to find employment commensurate with their training and skills.
urban food security series no. 14 23
TABLE 15: Food Security by Education and Income Level
Level of Education Food secure %
Food insecure %
No Schooling
Poorest 9 91Less poor 10 90Least poor 29 71Total 15 85
Primary Schooling
Poorest 5 95Less poor 8 92Least poor 38 62Total 18 82
High School
Poorest 13 87Less poor 14 86Least poor 50 50Total 27 73
Tertiary
Poorest 17 83Less poor 27 73Least poor 32 68Total 29 71
Total 23 77
7. SOURCES OF FOOD
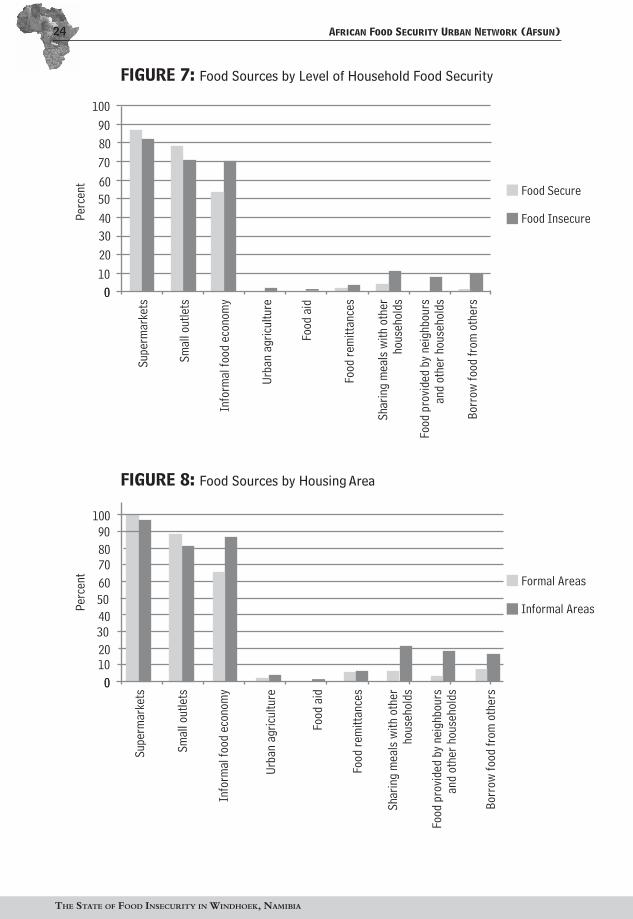
Households regularly obtain food from three main sources (Figure 7). Supermarkets are patronised by the greatest number of households (83%), followed by small outlets such as grocers and fast-food outlets (73%), and the urban informal economy (66%). The importance of supermarkets for food purchase highlights the regional tendency for supermarkets to expand into poorer urban areas where previously only small locally-owned shops were found.42 In previous years, people from these areas would shop at the supermarkets in central Windhoek on Saturday mornings. Now many people make use of the supermarkets closer to where they live. Food inse-cure households are slightly less likely to patronise supermarkets than food secure households (82% versus 87%) (Figure 7). However, households in informal areas are just as likely to buy food at supermarkets than those in formal areas (Figure 8).
24 African Food Security Urban Network (Afsun)
THE STATE OF FOOD INSECURITY IN WINDHOEK, NAMIBIA
FIGURE 7: Food Sources by Level of Household Food Security
FIGURE 8: Food Sources by Housing Area
Perc
ent
00102030405060708090
100
Food Secure
Food Insecure
Supe
rmar
kets
Smal
l out
lets
Urba
n ag
ricul
ture
Info
rmal
food
eco
nom
y
Food
aid
Food
rem
ittan
ces
Shar
ing
mea
ls w
ith o
ther
ho
useh
olds
Food
pro
vided
by n
eigh
bour
s an
d ot
her h
ouse
hold
s
Borr
ow fo
od fr
om o
ther
s
Perc
ent
00102030405060708090
100
Formal Areas
Informal Areas
Supe
rmar
kets
Smal
l out
lets
Urba
n ag
ricul
ture
Info
rmal
food
eco
nom
y
Food
aid
Food
rem
ittan
ces
Shar
ing
mea
ls w
ith o
ther
ho
useh
olds
Food
pro
vided
by n
eigh
bour
s an
d ot
her h
ouse
hold
s
Borr
ow fo
od fr
om o
ther
s

urban food security series no. 14 25
The proportion of households sourcing food from the informal economy (66%) is high but lower than in most of the other cities in the AFSUN survey. This, in turn, is a function of the fact that the urban informal economy is smaller than in many of the other cities.43 The impact of the penetration of supermarkets on the informal food economy may be one of the reasons for this but more research on this point is necessary. What is clear is that food insecure households are far more likely to patronise informal suppliers than food secure households (70% versus 53%) (Fig-ure 7). Similarly, households in informal housing areas rely more on the informal food economy than those in formal housing areas. The latter are slightly less likely to patronise supermarkets (82% versus 87%) and small outlets (71% versus 78%) and more likely to source food from the informal economy (86% versus 66%).
For much of the year, the dry climate and limited water availability in Windhoek makes growing crops a difficult proposition. That said, two studies from early in the last decade paint very different pictures of the prevalence and significance of urban agriculture in Windhoek. A report for the FAO in 2002 implausibly claimed that urban and peri-urban agri-culture was practised by 79% of households and over half of households in the informal settlements of the city.44 According to the report, there was “evidence of intensive farming activities both commercial and micro scale in backyards, open spaces and along river courses.”45 Exactly what this “evidence” consisted of is unclear. These claims are sharply at odds with findings from a larger survey of households conducted around the same time: Urban agriculture does occur in Windhoek, despite the climatic
constraints. Five percent of the sample was involved in some form of urban agriculture, and a further 4% know of someone else in the city that grows some food themselves (total of 9%). General observation in the area supports this finding, and although evident, the incidence and scale of urban agriculture is limited.46
Less than 1% of respondents reported keeping urban livestock (within a 10km radius of the city). Around 3% said they knew of friends or neigh-bours who kept livestock within the city. Frayne concluded that “the quantity of food being produced in the city suggests that urban agricul-ture does not play an important role in ameliorating urban food insecu-rity at the household level as yet in Windhoek.”47 The AFSUN survey confirms the bleak picture (for urban agriculture advocates) painted by Frayne. While he held out the possibility that urban agriculture might increase in importance in the poorer areas of the city, the AFSUN survey suggests that it has actually declined over the last decade. In 2000, Frayne found that 6% of households were engaged in urban agriculture (crop-
26 African Food Security Urban Network (Afsun)
THE STATE OF FOOD INSECURITY IN WINDHOEK, NAMIBIA
ping and livestock), a figure that appears to have dropped to only 1.4% of households in 2008. This was the lowest figure amongst all the 11 cities surveyed by AFSUN. In other cities, food insecure households are more likely to be involved in urban agriculture than food secure households. In Windhoek, urban agriculture is clearly not a procurement strategy for the food insecure.
More important to the most food insecure households are a variety of informal social protection mechanisms, such as sharing meals with neigh-bours (11% of households), borrowing food (9%) and obtaining food from neighbours or others (8%). Here again, there is a clear distinction between food secure and insecure households and between households in formal and informal areas (Figures 7, 8). Few of the food secure households rely on any of these social protection strategies. Households in informal areas are far more likely than households in formal areas to obtain food in this manner. For example, 21% of households in informal areas share meals with neighbours and others (compared with only 6% of households in formal areas). Or again, 17% of informal households borrow food from other households, compared with only 6% of formal households.
8. INFORMAL FOOD TRANSFERS
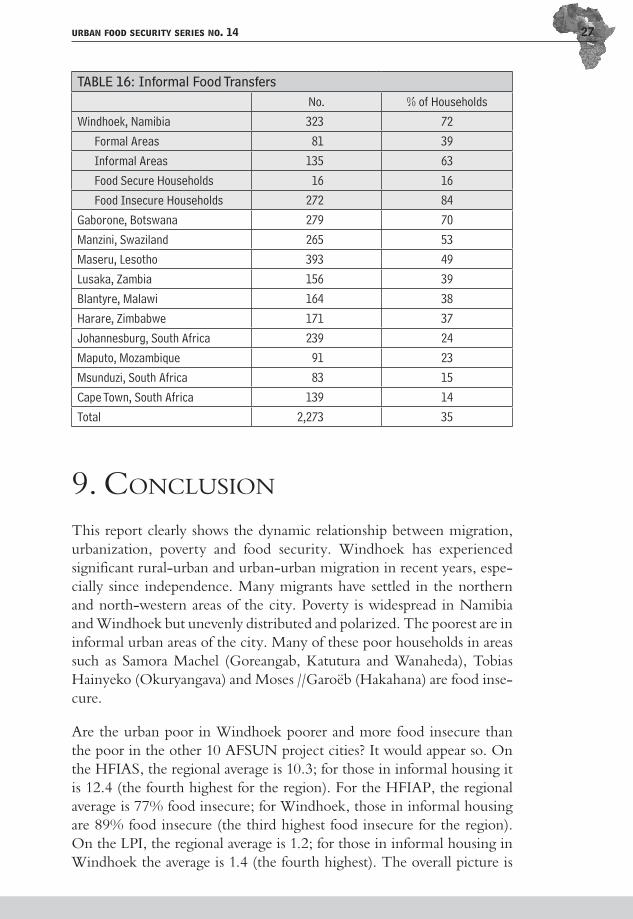
In 2000, Frayne found that as many as 62% of poor households in Wind-hoek received food from relatives in the rural areas.48 These transfers were critical to the livelihoods of urban households. The AFSUN survey pro-vided the opportunity to see if these transfers had increased or declined in importance in the intervening years.49 It found that 72% of households received food transfers from relatives and friends in rural and other urban areas. The main produce included millet, meat, milk products, fish and spinach. The significance of informal food transfers varies across the region, but they are clearly more important in Windhoek than in any other city surveyed by AFSUN (Table 16). The relative importance of food transfers to Windhoek households varies with two factors: whether the household is in a formal or informal area and whether the household is food secure or insecure. Households in informal areas receive more food transfers than those living in formal areas (63% versus 39%). And more food insecure households receive food transfers than food secure house-holds (84% versus 16%). This suggests that food transfers do not make households food secure but rather that they are a common response to food insecurity.
urban food security series no. 14 27
TABLE 16: Informal Food TransfersNo. % of Households
Windhoek, Namibia 323 72 Formal Areas 81 39 Informal Areas 135 63 Food Secure Households 16 16 Food Insecure Households 272 84Gaborone, Botswana 279 70Manzini, Swaziland 265 53Maseru, Lesotho 393 49Lusaka, Zambia 156 39Blantyre, Malawi 164 38Harare, Zimbabwe 171 37Johannesburg, South Africa 239 24Maputo, Mozambique 91 23Msunduzi, South Africa 83 15Cape Town, South Africa 139 14Total 2,273 35
9. CONCLUSION
This report clearly shows the dynamic relationship between migration, urbanization, poverty and food security. Windhoek has experienced significant rural-urban and urban-urban migration in recent years, espe-cially since independence. Many migrants have settled in the northern and north-western areas of the city. Poverty is widespread in Namibia and Windhoek but unevenly distributed and polarized. The poorest are in informal urban areas of the city. Many of these poor households in areas such as Samora Machel (Goreangab, Katutura and Wanaheda), Tobias Hainyeko (Okuryangava) and Moses //Garoëb (Hakahana) are food inse-cure.
Are the urban poor in Windhoek poorer and more food insecure than the poor in the other 10 AFSUN project cities? It would appear so. On the HFIAS, the regional average is 10.3; for those in informal housing it is 12.4 (the fourth highest for the region). For the HFIAP, the regional average is 77% food insecure; for Windhoek, those in informal housing are 89% food insecure (the third highest food insecure for the region). On the LPI, the regional average is 1.2; for those in informal housing in Windhoek the average is 1.4 (the fourth highest). The overall picture is

28 African Food Security Urban Network (Afsun)
THE STATE OF FOOD INSECURITY IN WINDHOEK, NAMIBIA
that those who are better off and more food secure are living in formal houses and those who are poorer and more food insecure are only able to live in informal housing. In an effort to mitigate their insecure food situ-ation, food insecure households make use of various strategies including receiving food transfers, obtaining food from informal markets, and other informal methods such as borrowing food with neighbours.
Why are Windhoek’s urban poor in informal housing poorer and more food insecure than those in formal housing, and among the poorest of the 11 cities surveyed? Looking at the housing situation in the other 10 cities surveyed, most urban poor live in houses with the exception of Khayelit-sha and Philippi (Cape Town 40%), Msunduzi (Durban 19%) and Man-zini (Swaziland 19%). The poorest households in these cities (Windhoek, Cape Town, Durban and Swaziland) are unable to afford or access formal housing. In the case of Windhoek, the relatively recent history of urban migration and the inability of the municipality to provide formal housing for poor people is a partial explanation; the same is probably true for the other cities mentioned above. For the other cities in the survey, urban migration has been going on for a longer period of time and people have had a chance to improve or adapt to their urban accommodation.
Windhoek represents a typical policy challenge facing any city undergoing particularly rapid growth through in-migration. In that respect, Wind-hoek is a prototype for many other cities in SADC and beyond. However, while myriad challenges facing such cities (e.g. employment, housing, service provision and transport infrastructure) are well-recognised, food insecurity is not. The international, continental and national food secu-rity agenda (including in Namibia) has a decidedly rural bias with little attention given to the specific challenges of feeding the residents of Afri-can cities.50 Food availability is not an issue in a city like Windhoek and is likely to become even less so over time as more supermarkets open and the city becomes more firmly integrated into modern global and regional food supply chains. What is more important is the whole issue of food access and that, in turn, depends on incomes and food pricing. Unlike in other cities, it also depends on whether rural-urban food transfers are sustainable and can be made more organised and efficient. What is cer-tainly required is a systematic national and city strategy for reducing the high levels of food insecurity amongst the urban poor in general and in informal settlements in particular.
urban food security series no. 14 29
ENDNOTES1 Government of Namibia, Namibia 2011: Population and Housing Census Preliminary
Results, National Planning Commission, Windhoek, 2012.
2 Windhoek Municipality, “Constituency Map of the Khomas Region and Population Figures for Windhoek’s Urban Localities/Suburbs from the 2006 Population Census” Central Bureau of Statistics, Windhoek, 2010.
3 W. Pendleton and B. Frayne, “Report of the Results from the Namibian Migration Project” SSD Research Report No. 35, Multi-Disciplinary Research Centre, University of Namibia, Windhoek, 1998.
4 D. Simon, “Recent Trends in Namibian Urbanization” Tijdschrift voor Economische en Sociale Geografie 73 (1982): 237-49; B. Frayne, Urbanisation in Post-Independence Windhoek: With Special Emphasis on Katutura (Windhoek: NISER, 1992).
5 H. Melber, “Urbanization and Internal Migration: Regional Dimensions in Post-Colonial Namibia” In G. Bächler and K. Spillman, eds., Environmental Degradation as a Cause of War (Zurich: Ruegger, 1996); W. Pendleton, “Katutura in the 1990s” SSD Research Report 28, Multi-Disciplinary Research Centre (MRC), University of Namibia, Windhoek, 1997; A. Pomuti and I. Tvedten, “Namibia: Urbanization in the 1990s” Publication No. 6, Namibian Economic Policy Research Unit, Windhoek, 1998.
6 Government of Namibia, Namibia 2011: Population and Housing Census Preliminary Results, p. 52.
7 Beginning in 1981 ‘racial’ group designations were not used for Municipal areas and people were free to live anywhere in the city; however, because of the relatively homogeneous character of the areas (e.g. Khomasdal was primarily occupied by ‘coloured’ people) it is possible to designate areas as primarily occupied by particular ‘racial’ groups. After independence some areas previously occupied by whites have become more integrated. Figure 1 should thus be viewed as suggestive rather than definitive.
8 Simon, “Windhoek” Cities 12 (1995): 139–47.
9 W. Pendleton, Katutura: A Place Where We Stay (Athens: Ohio University Press, 1996).
10 See, for example, S. O’Keefe, J. Rund, N. Marot, K. Symmonds and G. Berger, “Nutritional Status, Dietary Intake and Disease Patterns in Rural Hereros, Kavangos and Bushmen in South West Africa/Namibia” South African Medical Journal 73 (1988): 643-50; S. Devereux, “Drought and Survival in Rural Namibia” Journal of Southern African Studies 22 (1996): 421-40; C. Matanyaire, “Farmers’ Production Practices and Perceptions of Problems as a Guide for Research on Rainfed Food Crops in Northern Namibia” Development Southern Africa 13 (1996): 681-91; L. Vähätato, V. Mikkilä and L. Räsänen, “Schoolchildren’s Food Consumption and Dietary Intake During the Dry Season in North-West Namibia” International Journal of Food Sciences and Nutrition 56 (2005): 367-75; B. Fuller and D. Van Zyl, “Silently Starving: A New Form of Famine among Small Scale Farming Households Affected by the HIV Epidemic?” Working Paper No. 107, Namibia Economic Policy Research Unit (NEPRU), Windhoek, 2006.
11 D. Simon, “Responding to Third World Urban Poverty: Women and Men in the ‘Informal’ Sector in Windhoek, Namibia” In J. Momsen and J. Townsend (eds), Women’s Roles in Changing the Face of the Developing World (London: IBG, 1983),
30 African Food Security Urban Network (Afsun)
THE STATE OF FOOD INSECURITY IN WINDHOEK, NAMIBIA
pp. 95-103; W. Pendleton and B. du Bois, “Health and Daily Living Survey of Windhoek, Namibia” Research Report, NISER, Windhoek, 1988-9; C. Frohlich and B. Frayne, “Hawking: An Informal Sector Activity in Katutura” Discussion Paper No. 7, Namibian Institute for Social and Economic Research, University of Namibia, Windhoek, 1991; D. Simon, “Urban Poverty, Informal Sector Activity and Inter-Sectoral Linkages: Evidence from Windhoek, Namibia” Development and Change 15 (1994): 551–76; B. Frayne, “Migration and Urban Survival Strategies in Windhoek, Namibia” Geoforum 35 (2004): 489–505; B. Seibes-Bock, “A Study of Social Constraints and Economic Survival Strategies of Female Heads of Households Operating in the Informal Sector of Katutura, Windhoek, Namibia” M.A. Thesis, University of Western Cape, Cape Town, 2004; I. Tvedten, “‘A Town Is Just A Town’: Poverty and Social Relations of Migration in Namibia” Canadian Journal of African Studies 38 (2004): 393-423.
12 J. Crush and B. Frayne, The Invisible Crisis: Urban Food Security in Southern Africa AFSUN Urban Food Security Series No. 1, Cape Town and Kingston, 2010, pp.19-35.
13 S. Dima, A. Ogunmokun and T. Nantanga, “The Status of Urban and Peri-Urban Agriculture in Windhoek and Oshakati, Namibia” Report for the FAO Integrated Support to Sustainable Development and Food Security Programme, University of Namibia, 2002; B. Frayne, “Rural Productivity and Urban Survival in Namibia: Eating Away from Home” Journal of Contemporary African Studies 23 (2005): 51-76; B. Frayne, “Migration and the Changing Social Economy of Windhoek, Namibia” Development Southern Africa 24 (2007): 91-108; B. Frayne, “Survival of the Poorest: Migration and Food Security in Namibia” In L. Mougeot, ed., Agropolis: The Social, Political, and Environmental Dimensions of Urban Agriculture (Ottawa: IDRC, 2005), pp. 31-50; H. Nangombe and L. Ackermann, “Subsistence and Protection Needs of the Elderly Living in Katutura, Windhoek (Namibia)” Research on Aging 34 (2012): 1-19.
14 J. Crush, B. Frayne and W. Pendleton, “The State of Urban Food Security in Southern Africa” Journal of Hunger and Environmental Nutrition (forthcoming).
15 Frayne, “Migration and Urban Survival Strategies in Windhoek”; J. Crush, Migration, Development and Urban Food Security, AFSUN Food Security Series No. 9, Cape Town and Kingston, 2012.
16 Pendleton, “Katutura in the 1990s”; Pendleton and Frayne, “Report of the Results from the Namibian Migration Project”; W. Pendleton and B. Frayne, “Namibia; Regional Migration and Poverty Report (MAPS)” Report for SAMP, Cape Town, 2007.
17 Migration figures for the 2011 Census were not available at the time of writing.
18 Central Bureau of Statistics, 2005. 2001 Population and Housing Census, Khomas Region, Windhoek; Pendleton and Frayne, “Report of the Results from the Namibian Migration Project”; W. Pendleton, “Migration and Urban Governance in Southern Africa: The Case of Windhoek” In C. Limprecht and M. Biesele, eds, Heritage and Culture in Modern Namibia: In-Depth Views of the Country (Windhoek and Gottingen: Klaus Hess Publishers, 2005), p. 8.
19 B. Frayne and W. Pendleton, “Migration in Namibia: Combining Macro and Micro Approaches to Research Design and Analysis” International Migration Review 35 (2001): 1054-85.
20 W. Schmokel, “The Myth of the White Farmer: Commercial Agriculture in

urban food security series no. 14 31
Namibia, 1900-1983” International Journal of African Historical Studies 18 (1985): 93-108; W. Elkan, P. Amutenya, J. Andima, R. Sherbourne and E. van der Linden, “Namibian Agriculture: Policies and Prospects” Working Paper No 73, OECD Development Centre, Paris, 1992.
21 D. Pankhurst, “Similar but Different? Assessing the Reserve Economy Legacy of Namibia” Journal of Southern African Studies 22(1996): 405-20.
22 T. Næraa, S. Devereux, B. Frayne and P. Harnett, Coping With Drought in Namibia (Cape Town: Clyson Printers, 1993).
23 A. Nikondo, “Migrants to Cities and Towns in Namibia: The Dynamics of Investing in Urban Versus Rural Areas” Unpublished Report, Polytechnic of Namibia, Windhoek, 2011.
24 Pendleton and Frayne, “Report of the Results from the Namibian Migration Project”; Pendleton and Frayne, “Namibia; Regional Migration and Poverty Report (MAPS).”
25 D. LeBeau, “The Changing Status of Women in Namibia and its Impact on Violence against Women” In I. Diener and O. Graefe, eds, Contemporary Namibia: The First Landmarks of a Post-Apartheid Society (Windhoek: Gamsberg Macmillian, 2001); D. LeBeau , D. Hubbard, E. Iipinge, G. Spence, E. Zimba, M. Conteh and G. Reimers, Women’s Property and Inheritance Rights in Namibia (Windhoek: Pollination Publishers, 2005).
26 D. Potts, Circular Migration in Zimbabwe and Contemporary Sub-Saharan Africa (Oxford: James Currey, 2010).
27 Crush, Migration, Development and Urban Food Security; C. Greiner, “Can Households be Multilocal? Migration and the Domestic Unit in Namibia” Die Erde 3 (2012).
28 J. Crush and W. Pendleton, “Remitting for Survival: Rethinking the Development Potential of Remittances in Southern Africa” Global Development Studies 5 (2009): 1-28.
29 B. Frayne, “Survival of the Poorest: Food Security and Migration in Namibia” PhD Thesis, Queen’s University, 2002; C. Greiner, “Patterns of Translocality: Migration, Livelihoods and Identity in northwest Namibia” Sociologus 60 (2010): 131-61; C. Greiner, “Migration, Translocal Networks and Socio-Economic Stratification in Namibia” Africa 81 (2011): 606-27.
30 H. Jauch, L. Edwards and B. Cupido, “Inequality in Namibia” In H. Jauch and D. Muchena, eds., Tearing Us Apart: Inequalities in Southern Africa (Johannesburg: OSISA, 2011), pp. 181-255.
31 National Planning Commission, “A Review of Poverty and Inequality in Namibia” Central Bureau of Statistics, Windhoek, 2008, p. 33.
32 Ibid., pp. 34-7.
33 Ibid., p. 38.
34 Afrobarometer, “Lived Poverty in Africa: Desperation, Hope and Patience” Briefing Paper No. 11, Cape Town, 2004.
35 African Development Bank, “Namibia Country Strategy Paper, 2009-2013” Tunis, 2009, p. vii.
36 G. Wagner, “Ethnographic Survey of South West Africa. Part I, District of Windhoek” Unpublished report, 1951, p. 148.

32 African Food Security Urban Network (Afsun)
THE STATE OF FOOD INSECURITY IN WINDHOEK, NAMIBIA
37 Pendleton, “Katutura in the 1990s”; Frayne, “Survival of the Poorest.”
38 J. Coates, A. Swindale and P. Bilinsky, “Household Food Insecurity Access Scale (HFIAS) for Measurement of Food Access: Indicator Guide (Version 3)” Food and Nutrition Technical Assistance Project, Academy for Educational Development, Washington, D.C., 2007.
39 Ibid.
40 A. Swindale and P. Bilinsky, “Household Dietary Diversity Score (HDDS) for Measurement of Household Food Access: Indicator Guide (Version 2)” Food and Nutrition Technical Assistance Project, Academy for Educational Development, Washington, D.C., 2006.
41 S. Levine, “The 2007/2008 Food Price Acceleration in Namibia: An Overview of Impacts and Policy Responses” Food Security 4 (2012): 59-71.
42 R. Emongor and J. Kirsten, “The Impact of South African Supermarkets on Agricultural Development in the SADC: A Case Study in Zambia, Namibia and Botswana” Agrekon 48 (2009): 60-85; C. Abrahams, “Transforming the Region: Supermarkets and the Local Food Economy” African Affairs 109 (2010): 115-34; J. Crush and B. Frayne, “Supermarket Expansion and the Informal Food Economy in Southern African Cities: Implications for Urban Food Security” Journal of Southern African Studies 37 (2011): 781-807;
43 Frayne, “Migration and Urban Survival Strategies in Windhoek, Namibia.”
44 S. Dima, A. Ogunmokun and T. Nantanga, “The Status of Urban and Peri-Urban Agriculture: Windhoek and Oshakati, Namibia” Report for the Integrated Support to Sustainable Development and Food Security Programme of FAO, Windhoek, 2002, p. 15, 17.
45 Ibid., p. 7.
46 Frayne, “Migration and Urban Survival Strategies in Windhoek, Namibia” p. 499.
47 Ibid.
48 Ibid.; Frayne, “Rural Productivity and Urban Survival in Namibia”; Frayne, “Migration and the Changing Social Economy of Windhoek, Namibia.”
49 B. Frayne, “Pathways of Food: Mobility and Food Transfers in Southern African Cities” International Development Planning Review 32(2010): 83-104.
50 J. Crush and B. Frayne, “Urban Food Security and the New International Food Security Agenda” Development Southern Africa 28 (2011): 527-44.

URBAN FOOD SECURITY SERIES NO. 14 33
RefeRences1. Abrahams, C. (2010), “Transforming the Region: Supermarkets and
the Local Food Economy” African Affairs 109: 115-34.
2. African Development Bank (2009), “Namibia Country Strategy Paper, 2009-2013” Tunis.
3. Afrobarometer (2004), “Lived Poverty in Africa: Desperation, Hope and Patience” Briefing Paper No. 11, Cape Town.
4. Central Bureau of Statistics, (2005). 2001 Population and Housing Census, Khomas Region, Windhoek.
5. Coates, J., Swindale, A. and Bilinsky, P. (2007), “Household Food Insecurity Access Scale (HFIAS) for Measurement of Food Access: Indicator Guide (Version 3)” Food and Nutrition Technical Assis-tance Project, Academy for Educational Development, Washington, D.C.
6. Crush, J. and Frayne, B. (2011), “Urban Food Security and the New International Food Security Agenda” Development Southern Africa 28: 527-44.
7. Crush, J. and Frayne, B. (2011), “Supermarket Expansion and the Informal Food Economy in Southern African Cities: Implications for Urban Food Security” Journal of Southern African Studies 37: 781-807.
8. Crush, J. and Frayne, B. (2010), The Invisible Crisis: Urban Food Security in Southern Africa AFSUN Urban Food Security Series No. 1, Cape Town and Kingston, pp.19-35.
9. Crush, J. and Pendleton, W. (2009), “Remitting for Survival: Rethinking the Development Potential of Remittances in Southern Africa” Global Development Studies 5: 1-28.
10. Crush, J., Frayne, B. and Pendleton, W., “The State of Urban Food Security in Southern Africa” Journal of Hunger and Environmental Nutrition (forthcoming).
11. Crush, J. (2012), Migration, Development and Urban Food Security, AFSUN Food Security Series No. 9, Cape Town and Kingston.
12. Devereux, S. (1996), “Drought and Survival in Rural Namibia” Jour-nal of Southern African Studies 22: 421-40.
13. Dima, S., Ogunmokun, A. and Nantanga, T. (2002), “The Status of Urban and Peri-Urban Agriculture in Windhoek and Oshakati, Namibia” Report for the FAO Integrated Support to Sustainable Development and Food Security Programme, University of Namibia.
14. Elkan, W., Amutenya, P., Andima, J., Sherbourne, R. and van der

34 AFRICAN FOOD SECURITY URBAN NETWORK (AFSUN)
The STaTe of food InSecurITy In WIndhoek, namIbIa
Linden, E. (1992), “Namibian Agriculture: Policies and Prospects” Working Paper no 73, OECD Development Centre, Paris.
15. Emongor, R. and Kirsten, J. (2009), “The Impact of South African Supermarkets on Agricultural Development in the SADC: A Case Study in Zambia, Namibia and Botswana” Agrekon 48: 60-85.
16. Frayne, B. and Pendleton, W. (2001), “Migration in Namibia: Com-bining Macro and Micro Approaches to Research Design and Analy-sis” International Migration Review 35: 1054-85.
17. Frayne, B. (2010), “Pathways of Food: Mobility and Food Transfers in Southern African Cities” International Development Planning Review 32: 83-104.
18. Frayne, B. (2007), “Migration and the Changing Social Economy of Windhoek, Namibia” Development Southern Africa 24: 91-108.
19. Frayne, B. (2004), “Migration and Urban Survival Strategies in Windhoek, Namibia” Geoforum 35: 489–505.
20. Frayne, B. (2005), “Rural Productivity and Urban Survival in Namibia: Eating Away from Home” Journal of Contemporary Afri-can Studies 23: 51-76.
21. Frayne, B. (2002), “Survival of the Poorest: Food Security and Migra-tion in Namibia” PhD Thesis, Queen’s University.
22. Frayne, B. (2005), “Survival of the Poorest: Migration and Food Secu-rity in Namibia” In L. Mougeot, ed., Agropolis: The Social, Politi-cal, and Environmental Dimensions of Urban Agriculture (Ottawa: IDRC), pp. 31-50.
23. Frohlich, C. and Frayne, B. (1991), “Hawking: An Informal Sector Activity in Katutura” Discussion Paper No. 7, Namibian Institute for Social and Economic Research, University of Namibia, Windhoek.
24. Fuller, B. and Van Zyl, D. (2006), “Silently Starving: A New Form of Famine among Small Scale Farming Households Affected by the HIV Epidemic?” Working Paper No. 107, Namibia Economic Policy Research Unit (NEPRU), Windhoek.
25. Government of Namibia (2012), Namibia 2011: Population and Housing Census Preliminary Results, National Planning Commis-sion, Windhoek.
26. Greiner, C. (2012), “Can Households be Multilocal? Migration and the Domestic Unit in Namibia” Die Erde 3.
27. Greiner, C. (2011), “Migration, Translocal Networks and Socio-Eco-nomic Stratification in Namibia” Africa 81: 606-27.
28. Greiner, C. (2010), “Patterns of Translocality: Migration, Livelihoods and Identity in northwest Namibia” Sociologus 60: 131-61.
29. Jauch, H., Edwards, L. and Cupido, B. (2011), “Inequality in Namib-

URBAN FOOD SECURITY SERIES NO. 14 35
ia” In Jauch, H. and Muchena, D., eds., Tearing Us Apart: Inequali-ties in Southern Africa (Johannesburg: OSISA), pp. 181-255.
30. LeBeau, D., Hubbard, D., Iipinge, E., Spence, G., Zimba, E., Con-teh, M. and Reimers, G. (2005), Women’s Property and Inheritance Rights in Namibia (Windhoek: Pollination Publishers).
31. LeBeau, D. (2001), “The Changing Status of Women in Namibia and its Impact on Violence against Women” In Diener, I. and Graefe, O., eds, Contemporary Namibia: The First Landmarks of a Post-Apart-heid Society (Windhoek: Gamsberg Macmillian).
32. Levine, S. (2012), “The 2007/2008 Food Price Acceleration in Namibia: An Overview of Impacts and Policy Responses” Food Security 4: 59-71.
33. Matanyaire, C. (1996), “Farmers’ Production Practices and Percep-tions of Problems as a Guide for Research on Rainfed Food Crops in Northern Namibia” Development Southern Africa 13: 681-91.
34. Melber, H. (1996), “Urbanization and Internal Migration: Regional Dimensions in Post-Colonial Namibia” In Bächler, G. and Spillman, K., eds., Environmental Degradation as a Cause of War (Zurich: Ruegger).
35. Næraa, T., Devereux, S., Frayne, B. and Harnett, P. (1993), Coping With Drought in Namibia (Cape Town: Clyson Printers).
36. Nangombe, H. and Ackermann, L. (2012), “Subsistence and Protec-tion Needs of the Elderly Living in Katutura, Windhoek (Namibia)” Research on Aging 34: 1-19.
37. National Planning Commission (2008), “A Review of Poverty and Inequality in Namibia” Central Bureau of Statistics, Windhoek, p. 33.
38. Nikondo, A. (2011), “Migrants to Cities and Towns in Namibia: The Dynamics of Investing in Urban Versus Rural Areas” Unpublished Report, Polytechnic of Namibia, Windhoek.
39. O’Keefe, S., Rund, J., Marot, N., Symmonds, K. and Berger, G. (1988), “Nutritional Status, Dietary Intake and Disease Patterns in Rural Hereros, Kavangos and Bushmen in South West Africa/Namibia” South African Medical Journal 73: 643-50.
40. Pankhurst, D. (1996), “Similar but Different? Assessing the Reserve Economy Legacy of Namibia” Journal of Southern African Studies 22: 405-20.
41. Pendleton, W. and du Bois, B. (1988), “Health and Daily Living Sur-vey of Windhoek, Namibia” Research Report, NISER, Windhoek.
42. Pendleton, W. and Frayne, B. (2007), “Namibia; Regional Migration and Poverty Report (MAPS)” Report for SAMP, Cape Town.

36 AFRICAN FOOD SECURITY URBAN NETWORK (AFSUN)
The STaTe of food InSecurITy In WIndhoek, namIbIa
43. Pendleton, W. and Frayne, B. (2007), “Namibia; Regional Migration and Poverty Report (MAPS)” Report for SAMP, Cape Town.
44. Pendleton, W. and Frayne, B. (1998) (, “Report of the Results from the Namibian Migration Project” SSD Research Report No. 35, Multi-Disciplinary Research Centre, University of Namibia, Wind-hoek.
45. Pendleton, W. (1997), “Katutura in the 1990s” SSD Research Report 28, Multi-Disciplinary Research Centre (MRC), University of Namibia, Windhoek.
46. Pendleton, W. (2005), “Migration and Urban Governance in South-ern Africa: The Case of Windhoek” In C. Limprecht and M. Biesele, eds, Heritage and Culture in Modern Namibia: In-Depth Views of the Country (Windhoek and Gottingen: Klaus Hess Publishers).
47. Pendleton, W. (1996), Katutura: A Place Where We Stay (Athens: Ohio University Press).
48. Pomuti, A. and Tvedten, I. (1998), “Namibia: Urbanization in the 1990s” Publication No. 6, Namibian Economic Policy Research Unit, Windhoek.
49. Potts, D. (2010), Circular Migration in Zimbabwe and Contempo-rary Sub-Saharan Africa (Oxford: James Currey).
50. Schmokel, W. (1985), “The Myth of the White Farmer: Commercial Agriculture in Namibia, 1900-1983” International Journal of African Historical Studies 18: 93-108.
51. Seibes-Bock, B. (2004), “A Study of Social Constraints and Econom-ic Survival Strategies of Female Heads of Households Operating in the Informal Sector of Katutura, Windhoek, Namibia” M.A. Thesis, University of Western Cape, Cape Town.
52. Simon, D. (1982), “Recent Trends in Namibian Urbanization” Tijd-schrift voor Economische en Sociale Geografie 73: 237-49.
53. Frayne, B. (1992), Urbanisation in Post-Independence Windhoek: With Special Emphasis on Katutura (Windhoek: NISER).
54. Simon, D. (1983), “Responding to Third World Urban Poverty: Women and Men in the ‘Informal’ Sector in Windhoek, Namibia” In J. Momsen and J. Townsend (eds), Women’s Roles in Changing the Face of the Developing World (London: IBG).
54. Simon, D. (1994), “Urban Poverty, Informal Sector Activity and Inter-Sectoral Linkages: Evidence from Windhoek, Namibia” Devel-opment and Change 15: 551–76.
55. Simon, D. (1995). Windhoek. Cities, 12(3), 139-147.
56. Swindale, A. and Bilinsky, P. (2006), “Household Dietary Diversity

URBAN FOOD SECURITY SERIES NO. 14 37
Score (HDDS) for Measurement of Household Food Access: Indi-cator Guide (Version 2)” Food and Nutrition Technical Assistance Project, Academy for Educational Development, Washington, D.C.
57. Tvedten, I. (2004), “‘A Town Is Just A Town’: Poverty and Social Relations of Migration in Namibia” Canadian Journal of African Studies 38: 393-423.
58. Vähätato L., V. Mikkilä and L. Räsänen (2005), “Schoolchildren’s Food Consumption and Dietary Intake During the Dry Season in North-West Namibia” International Journal of Food Sciences and Nutrition 56: 367-75.
59. Wagner, G. (1951), “Ethnographic Survey of South West Africa. Part I, District of Windhoek” Unpublished report.
60. Windhoek Municipality (2010), “Constituency Map of the Khomas Region and Population Figures for Windhoek’s Urban Localities/Suburbs from the 2006 Population Census” Central Bureau of Statis-tics, Windhoek.

AFRICAN FOOD SECURITY URBAN NETWORK (AFSUN) AFRICAN FOOD SECURITY URBAN NETWORK (AFSUN)
THE STATE OF FOOD INSECURITY IN WINDHOEK, NAMIBIA
www.afsun.org
AFSUN recently conducted a survey of poor urban households in eleven major cities in Southern Africa to better understand the seriousness of the urban food insecurity situation. This report looks in detail at the results for Windhoek and seeks to answer one central question, that is, why do the urban poor in Namibia’s capital generally appear to be better off than the urban poor in most of the other ten cities where the survey was conducted and why, at the same time, does Wind-hoek contain some of the most food insecure households in the region? As a city of migrants, Windhoek’s case also presents the opportunity to examine the rela-tionship between migration and urban food security in more depth. Among the key findings is that access to food, which depends on incomes and food pricing, is critical in Windhoek, where food availability is not an issue. What is required is a systematic national and city strategy for reducing the high levels of food insecu-rity amongst the urban poor in general and in informal settlements in particular.
Top Related